chloride movement in undisturbed soil columns1
TRANSCRIPT

Chloride Movement in Undisturbed Soil Columns1
D. D. TYLER AND G. W. THOMASZ
ABSTRACTChloride movement was studied in soil columns taken from
three Kentucky alluvial soils—Karnak, Huntington, and Bruno.The soils ranged from silty clay loam to sandy loam in tex-ture and from well structured to unstructured. Columns weretaken by driving a 15-cm diameter heating duct into the soilto a depth of 30 cm and then digging out around the columnto remove it. These columns were mounted on blocks of candlewax and leached under 1.5 cm of Hg tension. A 25-ml "slug"of KC1 was applied to each column and followed by deionizedwater at a rate just slow enough to prevent ponding on thesoil surface. The maximum effluent concentration of Cl ap-peared far ahead of 1 pore volume in both Huntington andKarnak soils, which have well-defined structure, and at 1 porevolume in the Bruno si which is not structured. The resultsemphasize the channeling of water in soils with well-definedstructure.
Additional Index Words: hydrodynamic dispersion, salt flow,water displacement.
Tyler, D. D., and G. W. Thomas. 1981. Chloride movement inundisturbed soil columns. Soil Sci. Soc. Am. J. 45:459-461.
THE REMOVAL of soluble salts from soils is closelyrelated to the pattern of water flow through soils.
If added water displaces the soil water already present,it can then be predicted that salts added to the surfaceof the soil will be moved to the same depth that theadded water moves (Thomas et al., 1978). Smalldifferences in velocity among pores, even under nearlyideal conditions, tend to spread the salt band so thatthe salts are distributed vertically in the soil like anormal probability density with the concentrationmaximum at the depth of the added water penetration.This "spreading" of the salt band has been calledhydrodynamic dispersion (Day and Forsythe, 1957).Most packed laboratory columns with small aggregatesshow this type of salt behavior (Biggar and Nielsen,1962). A gaussian-shaped curve of salt concentrationvs. effluent volume is also observed when the salt isleached from the soil column with the maximum saltconcentration occurring at a point corresponding to1 pore volume of water. The above results are strictlycorrect only when there is practically no change insoil water content and when adsorption or exclusionof ions does not occur (McMahon and Thomas, 1974).
It has become evident, during the past several years,that salt movement in soil profiles does not always be-have in the manner outlined above. For example, thework of Blake et al. (1973), Van Genuchten andWierenga (1976), Quisenberry and Phillips (1976),Tyler and Thomas (1977), Bouma and Wosten (1979),and Addiscott et al. (1978) indicates that displace-ment of initial soil water by added water is not a veryefficient process in soils with structure left intact.
1 Contribution from the Univ. of Kentucky, Lexington, KY40546. Published with the approval of the director of the Ken-tucky Agric. Exp. Stn. as Journal Article 79-125. Received 8Nov. 1979. Approved 26 Jan. 1981.
"Assistant Professor, Dep. of Plant and Soil Science, Univ. ofTennessee, Jackson, and Professor, Univ. of Kentucky.
The apparent reason for the immobility of the soilwater is the existence of large pores between soil peds.The presence of these pores offers paths of least re-sistance to added water which flows quickly downthem and has little interaction with the bulk of thesoil (Thomas and Phillips, 1979). Indeed, the poresare large enough that bacteria mixed in added waterhave been reported to move 15 m in 1 hour througha well-structured subsoil (Rahe et al., 1978). Nitrateand chloride movement in field soil profiles indicatedsimilar behavior (Thomas et al., 1973; Tyler andThomas, 1977).
The work reported in this paper was undertakenwith a view of determining when rapid flow throughthe larger pores is likely to be important. To avoidthe destruction of soil structure, which often occurs inlaboratory columns, only undisturbed soil columnswere used.
MATERIALS AND METHODSThree river bottom soils were used to study leaching: Hunt-
ington silt loam, Karnak silty clay loam, and Bruno sandy loam.Huntington silt loam soil. (Fluventic Hapludolls, fine-silty,mixed, mesic) was taken from Hancock County, Kentucky, adja-cent to the Ohio River. It is in a flood-plain position derivedfrom alluvium formed in shales, sandstone, and limestone. Thesoil is a silt loam in the upper 15-cm and a silty clay loamfrom 15- to 137-cm depth.
Karnak silty clay loam soil (Vertic Haplaquepts, fine, mont-morillonitic, nonacid, mesic) was taken from Daviess County,Ky, adjacent to the Green River. It is in a slackwater positionderived from clayey deposits of the glacial period. The soiltexture changes abruptly from a silty clay loam to a silty clayat 15-cm below the surface and remains the latter texture to137 cm.
Bruno sandy loam (Typic Udifluvents, sandy, mixed, thermic)is located on the Ohio River in Daviess County, Ky. The soilis a sandy loam in the upper 91 cm.
Undisturbed soil columns were taken in the field during1976. Either a 24- or 30-gauge 15-cm diam galvanized heatingduct was cut to the desired length and driven into the soil inthe field using a plywood driver and sledge hammer. Thecolumn was then dug out of the ground and closed on bothends with plastic bags. Two or three columns were taken ateach site. Soil column lengths were 24 cm with an upper borderof 7 cm of pipe above the soil surface. The columns werebrought to the laboratory and mounted on 3.8-cm thick byapproximately 25 cm by 25 cm blocks of candle wax. A circular,narrow groove about 1 cm deep was dug in the wax, and a partof the soil in the bottom of the column was removed so thatthe column could be seated into the groove in the wax. A5-cm length of 0.6-cm glass tubing was placed in the middleof the wax, flush with the upper surface and in contact withthe bottom of the soil. General Electric silicone rubber bath-tub caulking was used to seal both bottom and top contactsof the glass tubing in the wax. A piece of 15-cm diam no. 42Whatman filter paper was then placed on the wax that would bein contact with the column to prevent the loss of fine soil par-ticles from the column during subsequent leaching experiments.The soil column was placed on the wax, and the galvanizedpipe edge was pressed into the groove in the wax. The externalarea of the groove was filled with melted wax and allowed toharden. The entire groove area and the junction formed onassembling the galvanized duct pipe were then covered withthe bathtub caulk.
The procedure by which chloride movement in the abovecolumns was measured is as follows: The columns were wettedrepeatedly with deionized water until no weight change wasnoted. Immediately thereafter, 1.5 cm of Hg tension was puton each column until no further drainage occurred. The chlor-ide was applied uniformly to the soil surface in a very small
459
460 SOIL SCI. SOC. AM. J., VOL. 45, 1981
SoilColumn—-
Stopcock A~~~~
ToVacuum
Flask 1 |Flask2
Stopcock BToHg
Manometer ToAspirator
Fig. 1—Diagram of collection apparatus used in column leachingexperiments.
slug of 25 ml at a concentration of 62,120 /ig Cl/ml as KC1.The 25-ml volume represented 1-2% of the water-filled porevolume in the soil columns studied. Deionized water was thenapplied to the soil surface from a separatory funnel at a ratejust below that which would produce ponding on the soil,different for each soil. The apparatus used is shown in Fig. 1.Columns were mounted on a wooden rack, and the glass tubein the bottom of each column was inserted through an openingin the rack; and tube was connected to a 250-ml suction flask.Stopcocks were inserted between the column and suction sourceand between the two suction flasks used for effluent collection.Collection of each sample (about 50 ml) was accomplished byshutting of the tension on the column using stopcock A, open-ing stopcock B, and turning the aspirator system on to transferthe samples from flask 1 to flask 2. The aspirator was thenturned off, and tension on flask 2 was released. Stopcock B wasthen closed, stopcock A opened, and the 1.5 cm of Hg tensionwas re-established on the soil column. This transfer proceduretook about 1 min, and during this time the column was notunder tension. Samples were stored in 50-ml beakers and weigh-ed for volume determination. Samples from all columns wereanalyzed for Cl content using a Buchler-Cotlove chloride analy-zer. Water-filled pore volumes were estimated by determiningwater contents found in columns at the end of the experiment.Values for fl at 1.5 cm of Hg tension were 0.495 for the Hunt-ington, 0.455 for the Karnak, and 0.290 for the Bruno columns.
Two columns of each of the three soils were studied. At theend of the experiment, a 25-ml slug containing 1,000 /ig/mlfluorescein dye was applied to the surface, followed by 442 mlof deionized water; the resulting effluent was collected in 50-ml samples. On disassembly, the edges of the soil column wereviewed under ultraviolet light as a check for any large amount
O.O2-
C/Co
O.O1
Huntington sil
0 0.5 1.0 1J5 2.0Pore Volumes
Fig. 2 — Chloride concentration in the effluent from a columnof Huntington soil. A 25-ml slug of KC1 was applied to thesoil surface and leached with water.
of peripheral flow due to gaps between the soil and columnwall.
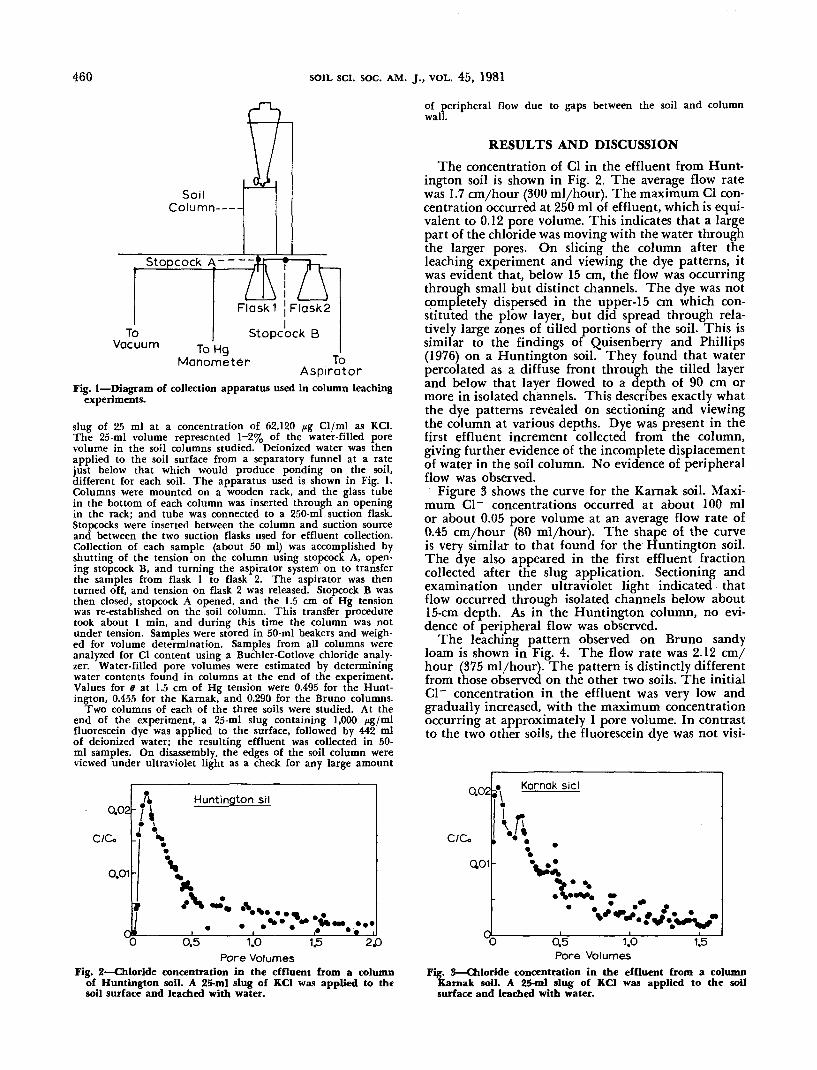
RESULTS AND DISCUSSIONThe concentration of Cl in the effluent from Hunt-
ington soil is shown in Fig. 2. The average flow ratewas 1.7 cm/hour (300 ml/hour). The maximum Cl con-centration occurred at 250 ml of effluent, which is equi-valent to 0.12 pore volume. This indicates that a largepart of the chloride was moving with the water throughthe larger pores. On slicing the column after theleaching experiment and viewing the dye patterns, itwas evident that, below 15 cm, the flow was occurringthrough small but distinct channels. The dye was notcompletely dispersed in the upper-15 cm which con-stituted the plow layer, but did spread through rela-tively large zones of tilled portions of the soil. This issimilar to the findings of Quisenberry and Phillips(1976) on a Huntington soil. They found that waterpercolated as a diffuse front through the tilled layerand below that layer flowed to a depth of 90 cm ormore in isolated channels. This describes exactly whatthe dye patterns revealed on sectioning and viewingthe column at various depths. Dye was present in thefirst effluent increment collected from the column,giving further evidence of the incomplete displacementof water in the soil column. No evidence of peripheralflow was observed.
Figure 3 shows the curve for the Karnak soil. Maxi-mum Cl~ concentrations occurred at about 100 mlor about 0.05 pore volume at an average flow rate of0.45 cm/hour (80 ml/hour). The shape of the curveis very similar to that found for the Huntington soil.The dye also appeared in the first effluent fractioncollected after the slug application. Sectioning andexamination under ultraviolet light indicated thatflow occurred through isolated channels below about15-cm depth. As in the Huntington column, no evi-dence of peripheral flow was observed.
The leaching pattern observed on Bruno sandyloam is shown in Fig. 4. The flow rate was 2.12 cm/hour (375 ml/hour). The pattern is distinctly differentfrom those observed on the other two soils. The initialCl~ concentration in the effluent was very low andgradually increased, with the maximum concentrationoccurring at approximately 1 pore volume. In contrastto the two other soils, the fluorescein dye was not visi-
0.02 g«
C/Co
QO1
Karnak sicl
• V«Mb •»
o 0.5 1.0Pore Volumes
1.5
Fig. 3—Chloride concentration in the effluent from a columnKarnak soil. A 25-ml slug of KC1 was applied to the soilsurface and leached with water.

TYLER & THOMAS: CHLORIDE MOVEMENT IN UNDISTURBED SOIL COLUMNS 461
O.O15-
O010
C/Co
OOO5-
Bruno si
••->•% .•
Table 1—Percent of added Cl leached at different pore volumes.
0 OS 1.0 1.5 2OPore Volumes
Fig. 4—Chloride concentration in the effluent from a columnof Bruno soil. A 25-ml slug of KC1 was applied to the soilsurface and leached with water.
ble to the eye in the initial effluent from the sandyloam columns after application of the slug. It did notbecome visible in the effluent until approximately 600ml had been collected. The intensity of the dye grad-ually increased and was visible most intensely near 1pore volume. This result further corroborated thetype of salt movement found for the sandy soil.
The Cl concentration patterns in the effluents andthe observations with fluorescein dye suggest that,in the Huntingdon and Karnak soils, which have dis-tinct structures, most of the soil water is not displacedby either the added salt or the water added to displacethe salt. On the other hand, in the virtually structure-less sandy loam, the Cl showed maximum concentra-tion at 1 pore volume, indicating almost completedisplacement of soil water. It should be said, how-ever, that hydrodynamic dispersion was very large inthe sandy loam as shown by the diffuse salt break-through curve.
In soils which exhibit strong structure, water andsalt flow down the larger pores, channels, cracks, rootholes, worm holes, and ped faces can be significant.Soils without these structural features, such as uni-form fine sandy loam and carefully packed laboratorycolumns, exhibit more uniform displacement. Thus,laboratory studies carried out with no appreciable soilstructure may not be applicable to soils with distinctstructure.
The experiments reported here were performed withconstant water contents near saturation. It might beargued that such conditions do not persist in the fieldfor very long periods of time. The authors agree thatthe conditions used here may occur for only a fewhours of a few days each year. Yet, it should be statedthat if these few hours occur soon after fertilizer ap-plication, they are the hours when most of the loss willoccur. In addition, it must not be imagined that in-complete displacement of soil water by added wateroccurs only under conditions reported here. It willoccur each time that the volume of water flow in thesmaller pores is less than the volume of water flowin the larger pores. To some extent, therefore, itoccurs every time rain intensity exceeds the soil hy-draulic conductivity of the soil matrix (Edwards etal., 1979.)
One final aspect of this study should be mentioned.While it is true that, as shown in Table 1, the removal
% Cl recoveredPore volumes Huntington Karnak Bruno
0.51.01.5
567582
506676
54473
of Cl occurred much earlier from Huntington andKarnak soils than from the Bruno si (50 vs. 5% lossat 0.5 pore volume), it also is true that, between 1.0and 1.5 pore volume, the further removal of salts bywater was slower in the structured soils than in thesandy loam soil. Thus, confining most of the waterflow to larger pores hastens the movement of someof the added salt but delays the movement of theremainder. As the salt moves down the larger pores,it continually is moving into the soil mass. Later, asthe salt concentration in the larger pores decreases,the salts diffuse back into the large pores. In eithercase, very little water movement occurs in the soil massaway from the large pores. The net effect is that apart of the salt in well-structured soils can be lostvery rapidly during intense rains while the rest ofit remains behind in the relatively immobile waterof the soil mass.