chironomids as environmental indicators:heavy metals and deformities chaleen shephard may 6, 1999
TRANSCRIPT

Chironomids as Environmental Indicators:Heavy Metals
and Deformities
Chaleen Shephard
May 6, 1999

Pollutants• Often manmade materials
• Excesses occur naturally

Bioaccumulation• Build-up of toxic materials in
tissues
• Magnify in food chain

Heavy Metals
• Chromium
• Copper
• Manganese
• Nickel

Chironomids• Non-biting Midges
• Aquatic Insect Larvae
• 1/2 Inch
• Two Small Prolegs
• Found In Sediment
• Detritivores

a
bcd
e
f
g
Chironomids

Indicator Species
• Large distribution area
• Variety of habitats
• Primary food source for many organisms

Morphological Testing
• Deformities in mouthparts, antennae, mandibles
• Effect of chemical contaminants

• Flow Line Division, New Castle, Pennsylvania
• Five sites, Five Subsamples at Each Site
• Sediment Sample: AA, ICP spectrometry
• Chironomid Samples• Sampled on 10/28/98 and 1/30/99
Sampling


Microwave Digester
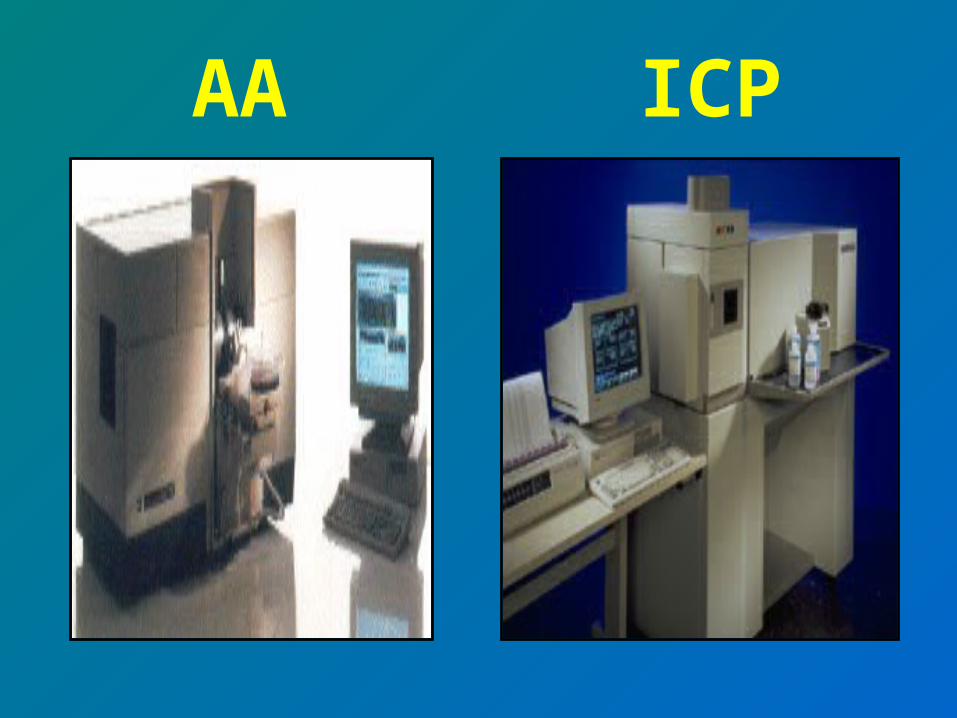
AA ICP

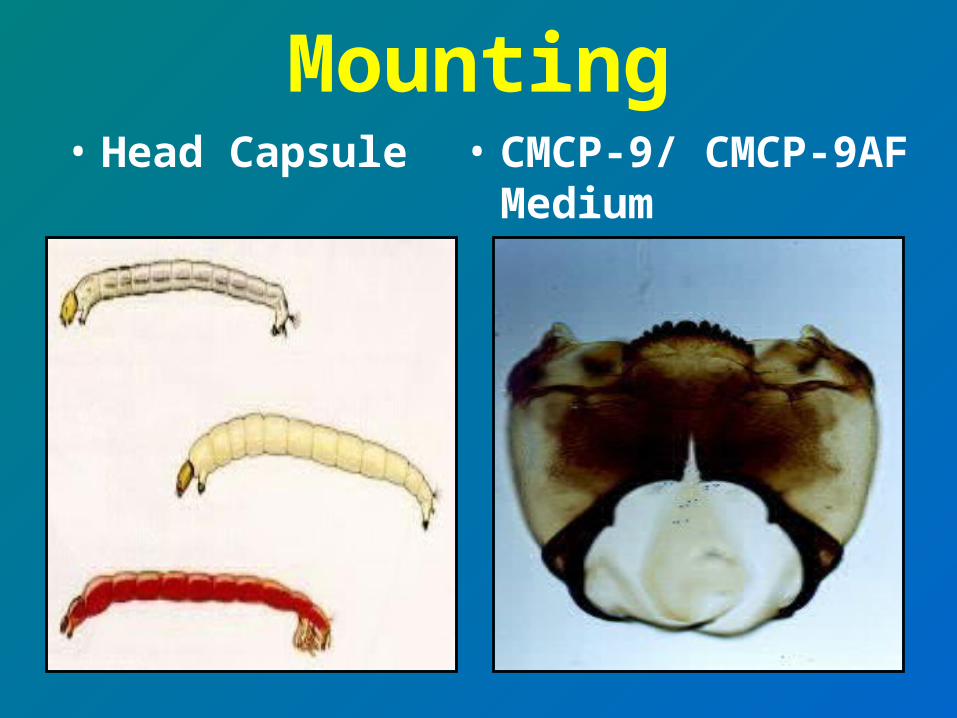
Mounting• Head Capsule • CMCP-9/ CMCP-9AF
Medium

ClassificationNormal

ClassificationClass I

ClassificationClass II

ClassificationClass III

Statistical Analysis• At each site the five subsamples
were combined to produce a sufficient sample size

Percent Deformity
= chironomids at each site with deformed mouthparts divided by the total number of chironomids at that site

Toxic Score
[No. Class I+2(No. Class II)+3(No. Class III)] X 100
Total Number Of Larvae

Concentration of Metals
• Kruskal-Wallis test (nonparametric alternative to Analysis of Variance)
• Followed by a distribution-free Multiple Comparisons Test

ResultsChromium
0500
1000150020002500300035004000
1 Abovepipe
2 3 4 5
Site
Av
era
ge
Co
nce
ntr
atio
n
(pp
m)
p= 0.010

ResultsCopper
0
500
1000
1500
2000
2500
1 Above pipe 2 3 4 5
Site
Ave
rage
Con
cent
rati
on
(ppm
)
p= 0.012

ResultsManganese
0
500
1000
1500
2000
2500
1 Abovepipe
2 3 4 5
Site
Ave
rag
e
Co
nce
ntr
ati
on
(p
pm
)p= 0.013

ResultsNickel
0500
100015002000250030003500
1 Abovepipe
2 3 4 5
Site
Ave
rage
Con
cent
rati
on
(ppm
)p= 0.008

Results
P-Value P-ValueMetal Conc. & % Deformity Conc. & Toxic Score
Cr 0.107 0.331Cu 0.181 0.431Mn 0.164 0.418Ni 0.179 0.43
Correlation

Conclusions• High concentrations of metals,
especially at the outflow pipe
• No correlation between deformities and concentrations of heavy metals
• Low numbers of chironomids
• Lethal concentrations of heavy metals
Future Studies• Tissue Analysis
• Laboratory tests
• Identification of species
• More samples, more chironomids, quantitative sampling
• Similar locations
