chinese foreign trade - fudan universityhomepage.fudan.edu.cn/dzcheng/files/2012/09/pdf-1...2018/9/2...
TRANSCRIPT

2018/9/2
1
1 Introduction: History and Methodology
Chinese Foreign Trade
EMAE630002 Fall 2018
Prof. Dazhong CHENG
Department of World Economy, Fudan University
http://homepage.fudan.edu.cn/dzcheng/
An old Chinese saying goes: “A workman must first sharpen his tools if he is to do his work well.”
―“工欲善其事,必先利其器”
In China, we have an ancient saying: “Take copper as a mirror, you can tidy up your clothes; take people as a mirror, you will know what you do is right or not; take history as a mirror, you are aware how the dynasties rise and fall.”
―“以铜为鉴,可以正衣冠;以人为鉴,可以明得失;以史为鉴,可以知兴替。”

2018/9/2
2
Outline
1. Brief history of Chinese foreign trade
2. Analytical tools for analyzing Chinese foreign trade
3. Summary
4. Questions
1. Brief history of Chinese foreign trade
1.1 China has a long history of five thousand years
1.2 Ancient China: a large country but with very low income level
1.3 Foreign trade before the Great Geographical Discovery
1.4 Forced opening-up of China by Western powers
1.5 China’s centrally-planned economy: 1949-1978
1.6 China’s opening-up (foreign trade regime reform) since 1978
1.7 Chinese foreign trade performance since 1978

2018/9/2
3
1.1 China has a long history of five thousand years.
197819491911184015th
century
Geographical
Discovery
China perspective
Global perspective
Opium
war
End of Qing
Dynasty
Founding of
new China
Reform and
opening-up
21st-2nd century BC (Xia, Shang, Zhou); 221-206 BC (Qin); 206BC-220AD (Han); 220-589 (Empire disintegrated); 589-617 (Sui); 618-906 (Tang); 906-960 (Empire disintegrated); 960-1127 (Song); 1127-1279 (Southern Song); 1279-1368 (Yuan); 1368-1644 (Ming); 1644-1911 (Qing); 1911-1949 (Kuomintang ruling); 1949- (New China)
WWII1776
USA
5th
century
Middle Ages
2001
Entry into
WTO
1991Dissolution
of the Soviet
Union
Industrial RevolutionIMF, GATT,
World Bank
Global
financial
crisis
2008
Years 0 1000 1500 1600 1700 1820 1870 1913 1950 1973 1998
GDP shares of the world total (%)
China 26.2 22.7 25.0 29.2 22.3 32.9 17.2 8.9 4.5 4.6 11.5
India 32.9 28.9 24.5 22.6 24.4 16.0 12.2 7.6 4.2 3.1 5.0
Japan 1.2 2.7 3.1 2.9 4.1 3.0 2.3 2.6 3.0 7.7 7.7
UK 1.1 1.8 2.9 5.2 9.1 8.3 6.5 4.2 3.3
France 4.4 4.7 5.7 5.5 6.5 5.3 4.1 4.3 3.4
Germany 3.3 3.8 3.6 3.8 6.5 8.8 5.0 5.9 4.3
Italy 4.7 4.4 3.9 3.2 3.8 3.5 3.1 3.6 3.0
Spain 1.9 2.1 2.2 1.9 2.0 1.7 1.3 1.9 1.7
US 0.3 0.2 0.1 1.8 8.9 19.1 27.3 22.0 21.9
Russia/USSR
1.5 2.4 3.4 3.5 4.4 5.4 7.6 8.6 9.6 9.4 3.4
1.2 Ancient China: a large country but with very low income level
Per
capita
GDP
(internati
onal
dollar in
1990)
China 450 450 600 600 600 600 530 552 439 839 3117
India 450 450 550 550 550 533 533 673 619 853 1746
Japan 400 425 500 520 570 669 737 1387 1926 11439 20413
UK 714 974 1250 1707 3191 4921 6907 12022 18714
France 727 841 986 1230 1876 3485 5270 13123 19558
Germany 676 777 894 1058 1821 3648 3881 11966 17799
Italy 1100 1100 1100 1117 1499 2564 3502 10643 17759
Spain 698 900 900 1063 1376 2255 2397 8739 14227
US 400 400 527 1257 2445 5301 9561 16689 27331
Russia/USSR
400 400 500 553 611 689 943 1488 2834 6058 3893
World 444 435 565 593 615 667 867 1510 2114 4104 5709

2018/9/2
4
Period 0-
1000
1000-
1500
1500-
1820
1820-
1870
1870-
1913
1913-
1950
1950-
1973
1973-
1998
Annual
compound
growth
rates of per
capita GDP
(%)
China 0.06 0.00 -0.25 0.10 -0.62 2.86 5.39
India 0.04 -0.01 0.00 0.54 -0.22 1.40 2.91
Japan 0.01 0.03 0.09 0.19 1.48 0.89 8.05 2.34
UK 0.27 1.26 1.01 0.92 2.44 1.79
France 0.16 0.85 1.45 1.12 4.05 1.61
Germany 0.14 1.09 1.63 0.17 5.02 1.60
Italy 0.00 0.59 1.26 0.85 4.95 2.07
Spain 0.13 0.52 1.15 0.17 5.79 1.97
US 0.36 1.34 1.82 1.61 2.45 1.99
Russia
/USSR0.00 0.04 0.10 0.63 1.06 1.76 3.36 -1.75
World 0.00 0.05 0.05 0.53 1.30 0.91 2.93 1.33
Table continued
Madison, A., Chinese Economic Performance in the Long-Run, Published by the OECD Development
Centre, Paris, 1998, Table 2.2 a, b.
Zhang Qian in Early Han Dynasty
(206 BC-8 AD)
Zheng He in Ming Dynasty
Christopher Columbus (Italian) found the American New World in 1492.
Vasco da Gama was a Portuguese explorer and the first European to reach
India by sea. His initial voyage to India (1497–1499) was the first to link
Europe and Asia by an ocean route, connecting the Atlantic and the Indian
oceans and, in this way, the West and the Orient.
Ferdinand Magellan was a Portuguese explorer who organized the Castilian
(Spanish) expedition to the East Indies from 1519 to 1522, resulting in the
first circumnavigation of the Earth by Juan Sebastián Elcano.
1.3 Foreign trade before the Great Geographical Discovery
(the 15th-16th century)
2018/9/2
5
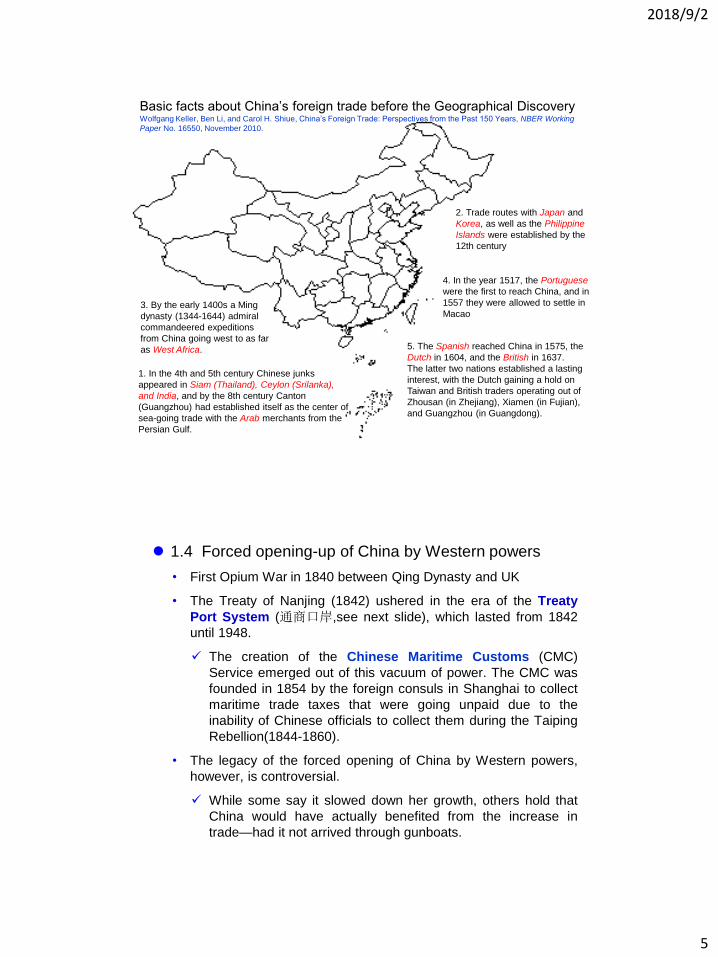
1. In the 4th and 5th century Chinese junks
appeared in Siam (Thailand), Ceylon (Srilanka),
and India, and by the 8th century Canton
(Guangzhou) had established itself as the center of
sea-going trade with the Arab merchants from the
Persian Gulf.
2. Trade routes with Japan and
Korea, as well as the Philippine
Islands were established by the
12th century
3. By the early 1400s a Ming
dynasty (1344-1644) admiral
commandeered expeditions
from China going west to as far
as West Africa.
4. In the year 1517, the Portuguese
were the first to reach China, and in
1557 they were allowed to settle in
Macao
5. The Spanish reached China in 1575, the
Dutch in 1604, and the British in 1637.
The latter two nations established a lasting
interest, with the Dutch gaining a hold on
Taiwan and British traders operating out of
Zhousan (in Zhejiang), Xiamen (in Fujian),
and Guangzhou (in Guangdong).
Basic facts about China’s foreign trade before the Geographical DiscoveryWolfgang Keller, Ben Li, and Carol H. Shiue, China’s Foreign Trade: Perspectives from the Past 150 Years, NBER Working
Paper No. 16550, November 2010.
1.4 Forced opening-up of China by Western powers
• First Opium War in 1840 between Qing Dynasty and UK
• The Treaty of Nanjing (1842) ushered in the era of the Treaty
Port System (通商口岸,see next slide), which lasted from 1842
until 1948.
The creation of the Chinese Maritime Customs (CMC)
Service emerged out of this vacuum of power. The CMC was
founded in 1854 by the foreign consuls in Shanghai to collect
maritime trade taxes that were going unpaid due to the
inability of Chinese officials to collect them during the Taiping
Rebellion(1844-1860).
• The legacy of the forced opening of China by Western powers,
however, is controversial.
While some say it slowed down her growth, others hold that
China would have actually benefited from the increase in
trade—had it not arrived through gunboats.
2018/9/2
6
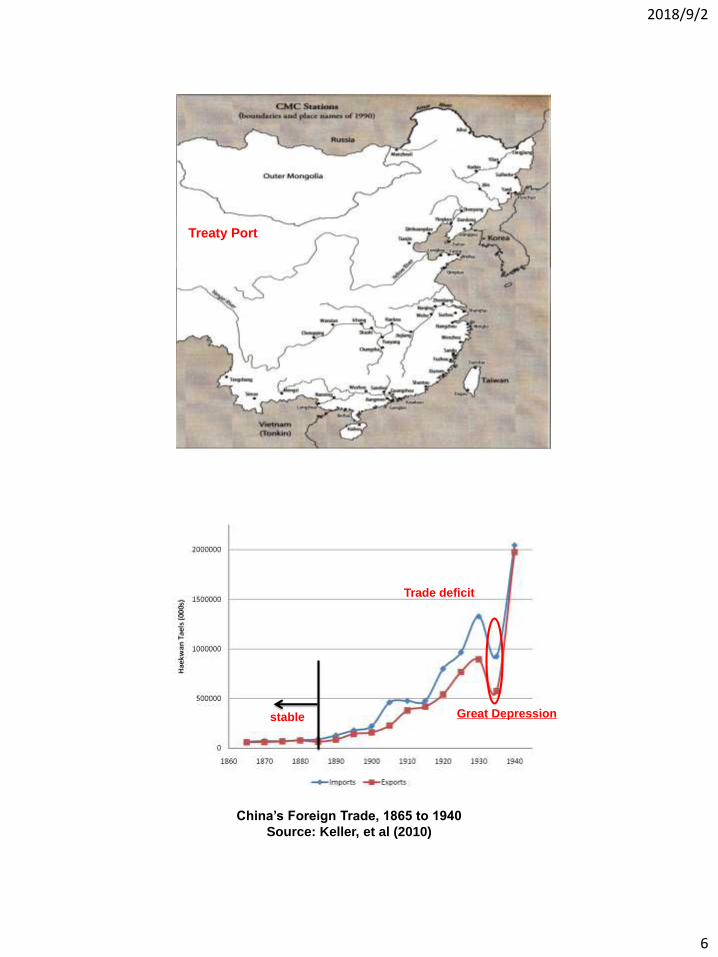
Treaty Port
China’s Foreign Trade, 1865 to 1940
Source: Keller, et al (2010)
Trade deficit
stable Great Depression

2018/9/2
7
1870 1913 1929 1950 1973 1998
China 0.7 1.7 1.8 2.6 1.5 4.9
India 2.6 4.6 3.7 2.9 2.0 2.4
Japan 0.2 2.4 3.5 2.2 7.7 13.4
The US 2.5 3.7 3.6 3.0 4.9 10.1
France 4.9 7.8 8.6 7.6 15.2 28.7
Germany 9.5 16.1 12.8 6.2 23.8 38.9
Netherlands 17.4 17.3 17.2 12.2 40.7 61.2
The UK 12.2 17.5 13.3 11.3 14.0 25.0
Portugal 3.8 8.1 5.0 3.0 5.0 23.5
Mexico 3.9 9.1 12.5 3.0 1.9 10.7
Brazil 12.2 9.8 6.9 3.9 2.5 5.4
World 4.6 7.9 9.0 5.5 10.5 17.2
Table The ratio of export value to GDP
from 1870 to 1998 (%): 1990-price
Source: Madison (2001).
Q: Why did the Industrial Revolution happen in Europe
and the West but not in China?
• In ancient times, China scored brilliant achievements in science
and technology; its four great inventions [paper, printing, the
compass and gunpowder] played a major role in advancing world
civilization.
• Needham, Joseph (1900-1995) (a British scientist, historian and
sinologist known for his scientific research and writing on the
history of Chinese science): “The Needham Question”: why had
China and India been overtaken by the West in science and
technology, despite their earlier successes?
Landes, David S., Why Europe and the West? Why Not China? The Journal of
Economic Perspectives, Vol. 20, No. 2 (Spring, 2006), pp. 3-22.

2018/9/2
8
1.5 China’s centrally-planned economy: 1949-1978
1949 1966 1976
1958 1960
Great Leap Forward
1978
Cultural
Revolution
A planned economy
Reform and opening to the
outside world:
A socialist market economy
time
20021989
Deng XiaopingJiang Zemin
Hu Jintao
Mao Zedong
2013
Xi Jinping
Political and economic isolation, hostile
relations with both the U.S. and the Soviet
Union, and wars with Korea and India.
General feature of old economic system
Agriculture: collective system—people’s
communes, brigades and production teams;
very limited private plots and free markets or
rural trade fares.
Industry: socialized, Soviet-style system, state-
run (at national and provincial levels) material
allocation system, enterprises with no autonomy.
Almost no role of the market; isolated from the
outside world.
Old economic
system-- Soviet-style
system of centralized
bureaucratic control
over the economy

2018/9/2
9
Commodity
composition of
foreign trade
Old foreign
trade
system
Economic
consequences
Foreign trade took place within the context of aplanned economy and therefore nearly all trade wassubject to very exacting quantitative guidelines.
The State Planning Commission’s import plan coveredmore than 90% of all imports. The export plan wassimilarly comprehensive, specifying the physicalquantities of more than 3,000 individual commodities.
Prior to 1978, a handful of foreign trade corporations(FTC) owned and controlled by the Ministry of ForeignTrade were responsible for carrying out the import andexport plans.
Organization of
foreign trade
Pricing of
traded goods
Separation of domestic and world prices. Overvalued RMB and lower prices of imported
machinery, equipment and industrial raw materials.
Role of the
exchange rate &
exchange control
Neither exports nor imports were sensitive to exchange rates or relative prices.
But the exchange rate played a major role in subsidizing certain categories of imported goods.
Multiple exchange rate systems
The composition of Chinese trade had little
connection to Chinese comparative advantage, with
capital-intensive goods, including refined petroleum
products, playing a large role in Chinese exports
well into the early 1980s.
Role of the exchange rate and exchange control
Fixed and overvalued
Exchange rate
Implicitly subsidizing
the imports
Harming the producers
of export goods
Intra-firm cross-subsidies and
inter-firm financial transfers (FTCs)
Excess demand for foreign
exchange vis-a-vis supply
Rigid exchange control
system was endogenous
Import
substitution
strategy

2018/9/2
10
Economic consequences of old system
The volume of Chinese trade, relative to world trade, declined
sharply from 1.5% in 1953 to 0.6% in 1977, and became one of the
world’s most isolated economies prior to 1978.
The incremental capital output ratio (ICOR) (indicating investment
efficiency) rose from 1/4 in the 1950s to 1/3 in the 1970s. The rise of
ICOR was due to the shift of domestic production into ever more
capital-intensive sectors (self-sufficiency and the third front strategy).
Output growth rate fell significantly from 8% in the 1950s to 6% in
the 1970s.
Improvements in real living standards were quite modest: policy and
terms of trade biased against agriculture.
Severe restrictions on rural to urban migration, to prevent urban
unemployment.
Persistent shortage of foreign exchange.
1.6 China’s opening-up (foreign trade regime reform)
since 1978
20
The primary stage of socialism
The three stages of the economic development of China (see the next slide)
The reform of the command economy
Opening to the West
The enhancement of science & technology and the treatment of intellectuals
Material incentives, the promotion of achievement, and let some get rich
Necessary conditions for economic modernization: order and stability, party
dictatorship, ideological solidarity, socialist democracy, and rejection of
western democracy
Marxism-Leninism Soviet economic model
Mao’s Thought and
economic strategy
Deng Xiaoping Thought DXP Theory:
transforming Marxism-Leninism into a developmental nationalist ideology
Deng: the chief engineer of the reform and modernization of Chinese socialism

2018/9/2
11
21
Since 1978, economic policy reform has been incremental and
ultra-pragmatic – “crossing the river by feeling the stones,” in
Deng Xiaoping’s imagery.
Rural reform began in 1979:
household responsibility system
Urban-industrial reform began in 1984:
management responsibility system
Old economic system
Foreign trade
system
Target:Well-functioning market system or
full-fledged market socialism
Four essential features:
• Inputs and outputs must be available for purchase and sale on the market.
• Enterprise or farm decision makers must behave in accordance with the
rules of well-functioning markets -that is, they must approximate some form
of profit-maximizing behavior.
• The markets faced by enterprise managers must be competitive.
• Prices on a well-functioning market must reflect long-run relative scarcities.
• Gradual shift of resource-allocation mechanisms from central planning to market forces
• Gradual shift of development strategies from an inward to an outward orientation

2018/9/2
12
A focus on foreign trade system reform:
1979 (1) 1984 (2) 1987 (3) 1994 (4) 1998 (5) 2001 (6)
time
Post-WTO
period
After the
Eastern Asian
financial crisis
Foreign exchange
regime reform (Part 8)
Improving the
operational
efficiencies of
FTCs---CRS
Separating government
functions from FTC
management
• Decentralization of foreign
trade administration
• Devaluation of domestic
currencies
• Establishment of SEZs to
encourage foreign
investment (Section II)
New trade mode: processing trade
Tariff and NTBs reduction
Impact of trade reform
State monopoly of foreign trade has been abolished and replaced by
competition among a large number of decentralized FTCs and
enterprises.
Direct control through the central plan on exports and imports has
been replaced by a number of administrative and indirect regulatory
measures, including licensing, taxation and tariffs.
Domestic prices of tradable commodities have increasingly been
determined by market forces and gradually linked to the world
market. World market signals have begun to impact upon the
domestic producers and consumers.
The foreign exchange regime has completed its transition from rigid
centralization to the partial convertibility of the RMB on the current
account.
2018/9/2
13
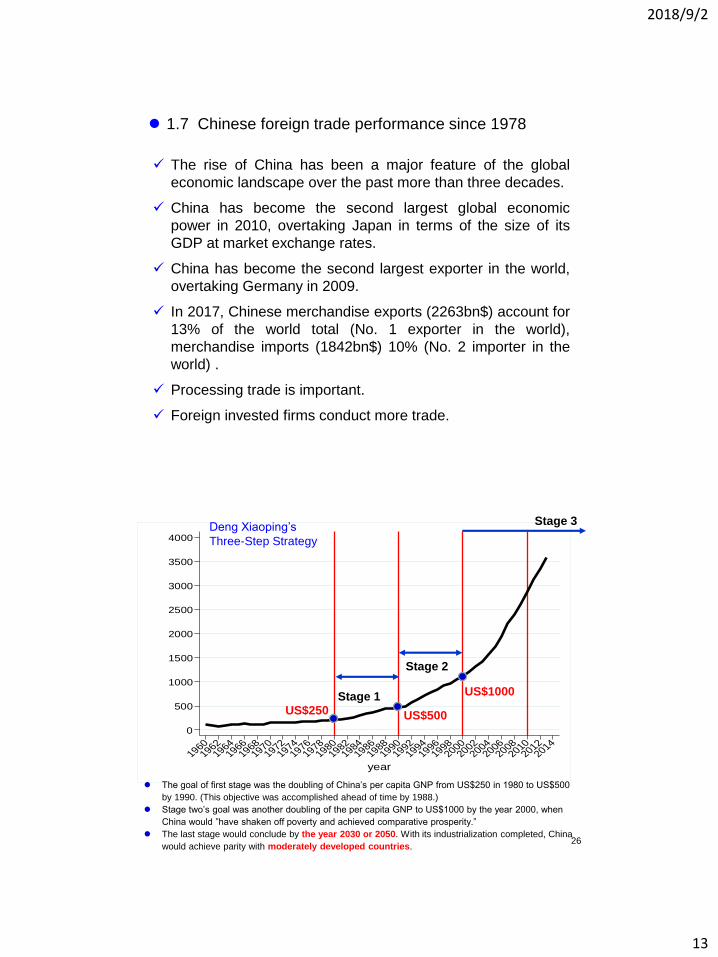
1.7 Chinese foreign trade performance since 1978
The rise of China has been a major feature of the global
economic landscape over the past more than three decades.
China has become the second largest global economic
power in 2010, overtaking Japan in terms of the size of its
GDP at market exchange rates.
China has become the second largest exporter in the world,
overtaking Germany in 2009.
In 2017, Chinese merchandise exports (2263bn$) account for
13% of the world total (No. 1 exporter in the world),
merchandise imports (1842bn$) 10% (No. 2 importer in the
world) .
Processing trade is important.
Foreign invested firms conduct more trade.
0
500
1000
1500
2000
2500
3000
3500
4000
Ch
ina
Pe
r ca
pita
GD
P_
2005
US
D
19601962
19641966
19681970
19721974
19761978
19801982
19841986
19881990
19921994
19961998
20002002
20042006
20082010
20122014
year
26
Stage 1
Stage 2
Stage 3
US$250 US$500
US$1000
The goal of first stage was the doubling of China’s per capita GNP from US$250 in 1980 to US$500
by 1990. (This objective was accomplished ahead of time by 1988.)
Stage two’s goal was another doubling of the per capita GNP to US$1000 by the year 2000, when
China would ”have shaken off poverty and achieved comparative prosperity.”
The last stage would conclude by the year 2030 or 2050. With its industrialization completed, China
would achieve parity with moderately developed countries.
Deng Xiaoping’s
Three-Step Strategy

2018/9/2
14
China’s trade growth and trade level (bn USD)
Deng’s Southern Tour
Accession to WTO
2008: Global
financial crisis
Leading world exporters and importers of merchandise,
2016-2017 (US$ billion)
2018/9/2
15
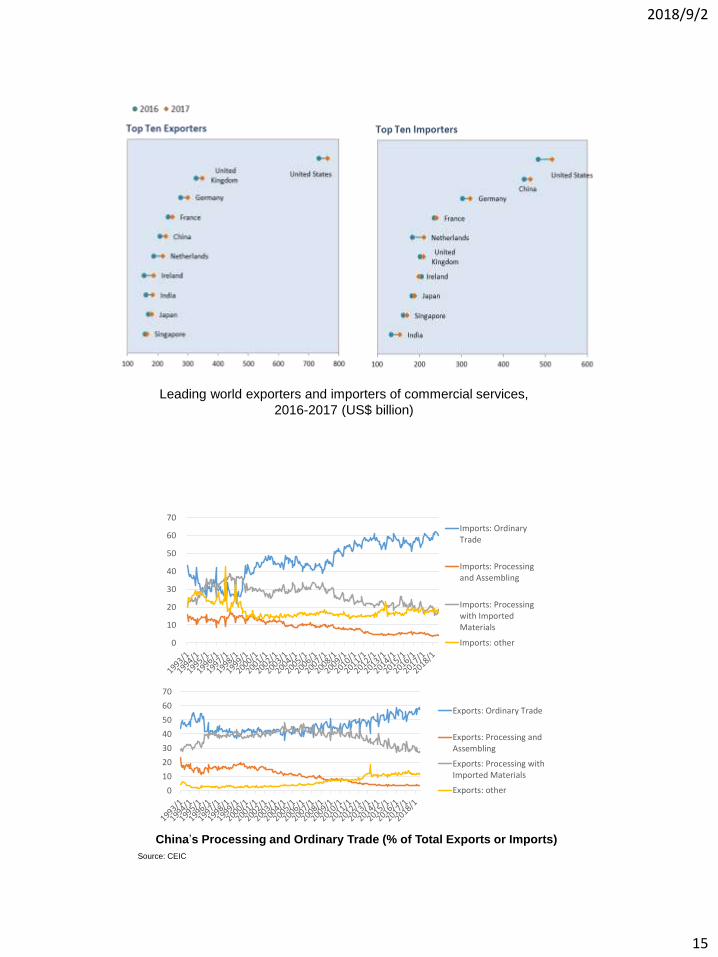
Leading world exporters and importers of commercial services,
2016-2017 (US$ billion)
China’s Processing and Ordinary Trade (% of Total Exports or Imports)
Source: CEIC
0
10
20
30
40
50
60
70Imports: OrdinaryTrade
Imports: Processingand Assembling
Imports: Processingwith ImportedMaterials
Imports: other
0
10
20
30
40
50
60
70
Exports: Ordinary Trade
Exports: Processing andAssembling
Exports: Processing withImported Materials
Exports: other

2018/9/2
16
China’s Trade Balance by Mode (US$bn)
Source: CEIC
-40
-30
-20
-10
0
10
20
30
40
Balance: OrdinaryTrade
Balance: Processingand Assembling
Balance: Processingwith ImportedMaterials
0
10
20
30
40
50
60
70
80
90
100
Imports: SOEs Imports: FFEs Imports: POEs and others
0
10
20
30
40
50
60
70
80
90
100
Exports: SOEs Exports: FFEs Exports: POEs and others
0
10
20
30
40
50
60
70
80
90
100
Exports: FFEs-Contractual JV Exports: FFEs-Equity JV Exports: FFEs-FOE
%: Import / total import
Notes: FFEs includes Sino-foreign contractual JV, Equity JV and FOEs
Trade Structure by Ownership
%: Export / total export

2018/9/2
17
Source: calculation based on CEIC database.
Decompose China’s trade balance by ownership (USD bn)
WTO accession
2. Analytical tools for analyzing Chinese foreign trade
The traditional approach
“New” trade theory
Heterogeneous firm trade models
Trade theories
and approachesChinese foreign trade?

2018/9/2
18
2.1 The traditional approach: gains from specialization
Adam Smith (“An Inquiry into the Nature and Causes of the Wealth of Nations”, 1776): specialization and division of labor; law of absolute advantage (free trade on the basis of absolute advantage )
David Ricardo (“Principles of Political Economy and Taxation”, 1817): law of comparative advantage
Heckscher-Ohlin model (1910s-1930s. “Interregional and International Trade” by B. Ohlin, 1933): points out that international trade is driven by differences between countries’ relative factor endowments.
If specialization efficiency outweighs transaction costs
Deepening of specialization and division of labor
Economic development and growth
Expansion of market (domestic and international)
Adam Smith’s Law
The role of institution?
Compare China and other countries?
Evolution: domestic trade → international trade

2018/9/2
19
The Ricardian model and its extensions point to technological differences as the source of comparative advantage.
• The Ricardian model assumes that labor is the only factor of production. Under this assumption, the only possible source of comparative advantage is differences between countries in labor productivity.
Ricardian Theory:
A country exports the good which it has comparative advantage in production. At least one country completely specializes in its comparative advantage good.
Heckscher-Ohlin model (or factor-proportions theory):
• Points out that international trade is driven by differences between countries’ relative factor endowments
• Shows that comparative advantage is influenced by:
Relative factor abundance (refers to countries)
Relative factor intensity (refers to goods)
• Because it takes into account more than one factor, it also has implications for the internal distribution of income.
Heckscher-Ohlin-Samuelson Theorem: Each country will export the good that uses its abundant factor intensively.

2018/9/2
20
The HOS theorem postulates a triple relationship between following variables:
Relative abundance of internationally
homogeneous factor
Factor-intensity determined by internationally identical
technology
Direction of trade (exports and
imports)
2.2 “New” trade theory: gains from economies of scale, product variety and increased competition
The “new” trade theory is motivated to a large extent by the observed importance of intra-industry trade and of trade between similar countries (in terms of technology or resources) that traditional models had difficulties in explaining.
How to measure the intra-industry trade: Grubel-Lloyd Index (GL=1-
[|X-M|/(X+M)]) and others

2018/9/2
21
How to explain intra-industry trade?
Economies of Scale and
Imperfect Competition
Product differentiation and
Demand specification
Economies of Scale, Imperfect Competition, and Trade
Models of trade based on comparative advantage (e.g. Ricardianmodel) used the assumptions of constant returns to scale and perfect competition:
– Increasing the amount of all inputs used in the production of any commodity will increase output of that commodity in the same proportion.
In practice, many industries are characterized by economies of scale or increasing returns to scale:
– Output grows proportionately more than the increase in all inputs.
– Average costs (costs per unit) decline with the size of the market.

2018/9/2
22
Market structure:
• Monopoly (Microsoft?)
• Perfect competition (agriculture goods)
• Oligopoly (automobiles, aircrafts)
• Monopolistic competition (many others: brand name clothing?)
Imperfect competition
– Firms are aware that they can influence the price of their product.
• They know that they can sell more only by reducing their price.
– Each firm views itself as a price setter, choosing the price of its product, rather than a price taker.
– The simplest imperfectly competitive market structure is that of a pure monopoly, a market in which a firm faces no competition.
The monopolistic competition model can show how trade leads to:
– A lower average price due to scale economies
– Availability of a greater variety of goods due to product differentiation
– Imports and exports within each industry (intra-industry trade)
Horizontal differentiation
Vertical differentiation
Hotelling-Lancaster
Dixit-Stiglitz
Falvey-Kierzkowski
Product differentiation and demand specification

2018/9/2
23
• Krugman model (1979, 1980): 2008 Nobel Laureate
• Lancaster model (1980)
• …….
LaborN goods
IRS
M. competition
identical
endogenous
4 points different from
the traditional models
P. Krugman
JIE, 1979
AER, 1980
2.3 Recent developments: productivity gains
Recent firm-level empirical evidence shows that:
• most firms, even in traded-goods sectors, do not export at all;
• of those firms that export, only a few export a large fraction of their production;
• firms that export are different from non-exporters in a number of ways (they are bigger, more productive, pay higher wages and are more capital and skilled labor intensive than non-exporters);
• trade liberalization raises industry productivity.

2018/9/2
24
China U.S.A.
Textiles
Computers
Who
Airplane
Computers
Who
Export, FDI, Outsourcing
Intra-industry trade
Inter-industry trade
2.4 A summary of trade theories and approaches
3. Summary
Review the history of Chinese foreign trade
Comparing China and the rest of the world
Ancient China
Planned economy
Opening-up policy
Review analytical tools for analyzing Chinese foreign trade
Different theories and approaches for analyzing international trade and Chinese foreign trade
2018/9/2
25
4. Questions
Why is foreign trade (hence open-door policy) important for
an economy?
How did China realize the transition from import substitution
regime to export promotion regime? Why?
What are the driving forces behind China’s foreign trade
development?
What about the bilateral trade between China and YOUR
country?