china/uk scientific cooperation project - … · china/uk scientific cooperation project ......
TRANSCRIPT

China/UK scientific cooperation project
Scenario Analysis Technology for River Basin Flood Risk Management in the Taihu Basin
Summary report
July 2010


Acknowledgements The project was carried out under the auspices of the China-UK Joint Commission for Science and Technology. Funding for the project was provided by the following: The Government Office for Science, the Foreign and Commonwealth Office Global Opportunities Fund, the Natural Environmental Research Council and the Department for Environment and Rural Affairs in the UK. The Ministry of Science and Technology and the Taihu Basin Authority of the Ministry of Water Resources in the People’s Republic of China. United Nations Department of Social and Economic Affairs. The project was coordinated in the UK by the University of Nottingham and in China by the Institute for Water and Hydropower Research, Beijing, and the Taihu Basin Authority. This summary report was written by EP Evans and XT Cheng, based on the work carried out by the joint UK-Chinese team listed at the end of the report. The report should be referenced as: Evans, E.P. and Cheng, X.T. (2010) China/UK scientific cooperation project. Scenario Analysis Technology for River Basin Flood Risk Management in the Taihu Basin, Summary Report. Government Office for Science, London.

List of contents 1 Introduction ............................................................................................ 1
1.1 Background................................................................................................ 1 1.2 Need and opportunity for a China Foresight project ................................... 1 1.3 Launch and aims of the Taihu project ........................................................ 1
2 Project plan ............................................................................................ 2 2.1 Phasing ...................................................................................................... 2 2.2 Characteristics of the Taihu Basin .............................................................. 2 2.3 Functional requirements of the risk assessment system ............................ 3
3 The scientific approach ........................................................................... 6 3.1 Background - the 2004 Foresight Future Flooding project .......................... 6 3.2 Work Package 1: Qualitative assessment of flood risk drivers and
responses. .............................................................................................. 9 3.3 Work Package 2: Climate change scenarios ............................................ 23 3.4 Work Package 3: Hydrology ..................................................................... 26 3.5 Work Package 4: Socio-economic scenarios ........................................... 28 3.6 Work Package 5: Analysis of flood damage ............................................. 32 3.7 Work Package 6: The broad-scale hydraulic model ................................. 34 3.8 Work package 7: Reliability analysis of dyke system ................................ 38 3.9 Work Package 8: Quantified risk analysis - the Taihu Basin Risk
Assessment System (TBRAS) .............................................................. 43 4 Initial results and their implications for flood risk management ............. 49
4.1 Structure of the results ............................................................................. 49 4.2 Summary of runs carried out and results .................................................. 51 4.3 Discussion of the baseline results ............................................................ 52 4.4 Climate change scenario results .............................................................. 53 4.5 Socio-economic scenario results .............................................................. 54 4.6 Overall credibility of the results, including comparison with UK Foresight. 56 4.7 Establishing and explaining differences between qualitative and
quantitative analysis ............................................................................. 58 4.8 Possible responses: an adaptive approach to FRM planning ................... 58 4.9 Summary of implications of the baseline driver results ............................. 60
5 Conclusions and recommendations ...................................................... 62 5.1 Increasing understanding of the significance of the Foresight Future
Flooding. .............................................................................................. 62 5.2 Exploring a viable and realistic approach to research on foresight future
flooding according to the situation in China. ......................................... 62 5.3 Main outcomes and progress ................................................................... 63 5.4 Issues yet to be solved and recommendations ......................................... 64
References .............................................................................................................. 66 List of those who contributed to the project.............................................................. 69

1
1 Introduction
1.1 Background The Taihu project has its origins in the Foresight Future Flooding project (Evans et al 2004), commissioned by the Chief Scientific Advisor to the British government. The aim of the project was to use the best available science to provide a challenging vision for flood and coastal defence in the UK between 2030 and 2100 and so inform long-term flood risk management policy. This summary report is based on detailed Chinese and English language technical reports produced in China by the joint UK-Chinese team of experts, and its purpose is to provide an accessible English language scientific summary of the project.
1.2 Need and opportunity for a China Foresight project The potential impact of climate change has been recognised worldwide (IPCC, 2007). The variability of precipitation and runoff is particularly high for sensitive climates, e.g., a higher percent change in runoff resulting from a small change in precipitation, especially in highly urbanized areas due to rapid development of the economy and society. It is very important for water authorities to foresee and prepare to deal with the effects of climate change and human activities on the hydrological cycle and streamflow regimes. Better understanding of the relationships between climate change, human activities and flood occurrence will allow water authorities to make more rational decisions on flood control and management. The big floods which occurred in the Taihu basin in 1991 and 1999 received significant attention from both local and central government in China. Will the flooding risk continue to increase and how large the risk will be in the future 10 years, 20 years, and 50 years? Will this increased risk affect the sustainable development of economics and society, and how will the flood regime change due to the effect of human activities under climate change? If this long-term trend continues, what kind of new flood prevention policies should be adopted? It is, therefore, important to investigate the changes in flood regime due to the rapid development of economics and urbanization and the impact of climate change, and understand the causes of major floods and on the basis of this investigation to formulate a new vision for future flood control in the Taihu basin.
1.3 Launch and aims of the Taihu project Following discussions between the UK and Chinese governments a planning mission visited China in 2005 and drew up a joint proposal for a Chinese Foresight flooding project. Funding was provided by the UK and Chinese governments and UNDESA and the project was launched under the auspices of the China-UK Joint Commission for Science and Technology in 2006. The study area selected by the Government of China was the Taihu Basin, one of the most important regions of China, containing Shanghai and a number of other major cities. The project was declared as a flagship project for China, and work commenced on the project in 2007. The project aimed to consider:
• How might the risks of flooding change in Taihu Basin over the next 50 years? • What are the best options for Government and other stakeholders for
responding to the future challenges?

2
2 Project plan
2.1 Phasing In the Taihu project, in contrast to the UK Foresight flooding project, a “foundation” stage was necessary, to assemble data and set up the necessary models. The overall phasing of the project, with the headline scope of each phase, is shown below:
The project was carried out over a three-year period 2007-09.
2.2 Characteristics of the Taihu Basin The Taihu Basin is located in delta region of the Yangtze River in East China with total area of 36,895 km2 involving the southern part of Jiangsu province, the northern part of Zhejiang province and the continental part of Shanghai Municipality (Figure 2.1). The Taihu Basin is an important region for the social and economic development of China. Although its area is only 0.4 % of the national territory, the population reached 36.8 million and the GDP 1890 billion Yuan by the end of 2003, representing about 3% and 13% of the nation’s totals respectively. It is one of the regions with the highest speed of social and economic development in China today. The Basin lies in the sub-tropical zone and has a monsoon climate with an average annual precipitation of 1177mm, concentrated in summer. There are low hills along the Western side but low-lying areas cover about 80% of the basin with elevations between 3-4 m above mean sea level, 2-3 m lower than the highest water level at the river mouth of the Yangtze, and 5-6 m lower than the highest tide in Hangzhou Bay. Since it is so flat with slow flow velocities and a drainage system blocked by high tide, the area is very prone to fluvial flooding, storm surges and internal floods caused by local heavy rainfall.
Phase 1 – Project Foundations • Draw up detailed work plan and task specifications • Assemble data, digitise and /enter • Set up models • Generate climate and socio-economic scenarios • Qualitative analysis of drivers and responses and sustainability framework
Phase 2 – Driver and Responses analysis • Quantitative analysis of drivers and responses • Sustainability analysis
Phase 3 – Final synthesis • Update qualitative analysis in light of
quantitative results • Policy options • Final reporting

3
Figure 2.1. The Taihu Basin During the 1991 flood the water level of the Tai Lake (the Tai Hu) reached a maximum level of 4.79m above MSL, 0.14 m higher than the previous historical record in the 1954 flood. Heavy damages were caused to life and property. Following this flood eleven key projects for flood control were constructed, establishing a framework for flood control which would retard and store floodwater in the Tai Lake, and drain it northward to the Yangtze, southward to the Hangzhou Bay and eastward to the East Sea through the Huangpu River. The new flood control system in the Taihu basin experienced a severe test in the1999 flood. The monsoon-rain season in the Basin started on 7 June and lasted for 43 days. Total average rainfall was 670mm, which was 3 times higher than in normal years and was estimated to have a return period of 1 in 200 years. Comparing with the flooding in 1954 and 1991, the rainfalls of 7-day, 15-day, 30-day, 45-day, 60-day and 90-day durations exceeded the previous historical values. The highest water level in the Tai Lake set a new record of 5.08m, 0.29m higher than in the 1991 flood. Even though the flood control system played an important role in mitigating flood damage and saving life, the 1999 flood brought a loss of 131 × 108 RMB to the basin economy. It is timely and important, therefore, to re-examine the regulation of the water system, as well as the relation between flood storage and discharge, flood control in overall basin and flood discharge in each district.
2.3 Functional requirements of the risk assessment system The present GDP per capita in the Taihu Basin is $5,000 and the trend of rapid development will continue in the coming decades. The issues of how to meet the increasing demands for flood mitigation, water supply and environmental protection to support sustainable development the Taihu Basin in the future are daunting. Along with the rapid socio-economic development in the Taihu Basin, new issues in flood management have appeared.

4
These are summarised below, highlighting the essential functional requirements that the risk assessment system must fulfil, and discussed in more detail under the section on qualitative analysis. What are the impacts of rapid urbanization and economic development on the features of future flooding and flood damage in the Taihu Basin?
• Changes of land use. Since 1985, the total area of farmland in the Taihu basin has decreased by about 20%. Since more land in the basin is protected by dykes and pumping stations, and more rivers and canals blocked by floodgates, the inherent storage and drainage capacity has decreased.
• Extension of urbanised area. Rapid urbanisation and economic development involves not only the impact of urbanisation as a receptor, but also impacts on flood pathways as a result of flood control actions described below which accompany development. The conventional increase in paved area in urbanized area also affect the rainfall-runoff relationship in the basin.
• Changes in properties. Along with rapid urbanization and economic development, not only the type and density of properties increase in the basin, but also the vulnerability should be considered in future flood risk assessment.
• Increasing water supply through reservation of more dam storage for water supply reduces the capacity available for flood attenuation.
• The worsening trend in water pollution. The adverse impacts of this may affect in the coming decades not only the quality of life but also the ability to manage floods.
• Over-pumping of ground water. Due to the pollution of surface water, ground water has become an increasingly important source of water supply in the Taihu Basin, leading to significant land subsidence. For example, a depressed zone of ground water in the Suzhou-Wuxi-Changzhou region has expanded to more than 7,000 km2 and land subsidence in the centre exceeded 1m.
What are the impacts of the development of the flood control system on the features of flooding and ecosystems? The flood control system operates at three level - the Taihu Basin Authority; the two provinces and approximately 30 cities at prefecture and county levels. Urbanisation acts on the flood pathways in several ways, through the development of the city-level flood control systems:
• Reduction of conveyance owing to infilling or blocking of channels. • Reduction in flood storage owing to local flood protection dykes which are
commonly built to accompany urban development. These ‘polders’ are “city-level” flood defences and may be built at several standards of protection depending on the defended assets. They may defend anything from parts or the whole of an urban area, to an individual factory or a horticultural area. They are commonly equipped with pumps which evacuate pluvial floodwater into the basin channel system. It would require minutely detailed data and a hydraulic model with an extremely large number of nodes to represent this explicitly. However, it proved possible to obtain from city authorities estimates of the percentage of the city area covered by such local defences, and to represent the local defences through broad-scale modelling.
• Effects on the ecosystem. For instance, the reed zone around the Tai Lake plays an important role in reducing wind-generated waves in the lake during high stage of flood. It has shrunk significantly in some areas since the construction of the dyke around the lake.
• Changes of the distribution of flood risk. The development of flood control system in the Taihu Basin, managed by three level of local government, has changed the distribution of flood risk. Some regions have achieved a high
5
standard of flood protection, and meanwhile, in some other regions, the flood situation has become even worse.
• Adjustment of the function of dams in the hillier Western areas of the basin. As noted above, increasing population and pressures for more and better water supply are already resulting in changes in the operating rules of existing dams, reducing the volume available for flood storage.
• Regional conflicts in flood control planning What are the impacts of climate change on the future flood control situation in the Taihu Basin?
• Rising sea level. Many outlets of the drainage system are controlled by gravity floodgates without pumping stations. Rising sea levels thus not only reduce the standard of protection afforded by sea walls and river dykes but also reduce the drainage capacity of the outlets.
• Changes of the intensity and distribution of rainfall especially in the large urbanized area owing to the phenomena of “heat island” and “dust island”.
• Increases in the intensity of typhoon due to rising surface temperatures in adjacent typhoon–generating oceanic areas may increase flood risk in the Basin.

6
3 The scientific approach
3.1 Background - the 2004 Foresight Future Flooding project It will help understanding of the Taihu project to dwell for a moment on the 2004 UK Foresight Future Flooding project. The mechanisms and impacts of flooding involve many aspects of the physical environment as well as economic and social systems. A broad definition of the flooding system was therefore used – ‘the flooding system encompasses those physical and organisational systems that influence or are influenced by flooding’ (Hall et al. 2003). To assist in its analysis the 2004 project employed two key principles – the use of logical models or frameworks within which to address a wide-ranging set of issues, and the use of scenarios to address complexity and uncertainty.
3.1.1 Logical Frameworks The analysis used as a framework two complementary models of the flooding system, firstly the Pressure State Impact Response (PSIR) (Turner et al. 1998; Rapport and Friend 1979). In this:
• Environmental Pressures lead to changes in system State. • Environmental and socioeconomic Impacts result from changes in system
state. • Impacts lead to policy Responses following gains/losses by stakeholders.
While the PSIR framework deals with the changes in the flooding system, it does not allow the flooding system to be evaluated in terms of risk. Here the Source-Pathway-Receptor (SPR) model (DETR et al. 2000), a well-established framework for environmental risk assessment was used. In the case of flooding:
• Sources are weather events, or sequences of events that may result in flooding (e.g. heavy or sustained rainfall and marine storms).
• Pathways are the mechanisms that convey floodwaters that originate as weather events to places where they may impact on receptors. Pathways therefore include fluvial flows in or out of river channels, overland urban flows, coastal processes and failure of fluvial- and sea-defence structures.
• Receptors are the people, industries and built and natural environments that flooding affects.
Besides the PSIR and SPR models, the analysis also made use of the concepts of ‘drivers’ of and ‘responses’ to flood risk: A driver was defined as ‘any phenomenon that may change the state of the flooding system’. However, some drivers will be under the control of flood risk managers, for example, through flood defences or through flood warning systems – these drivers are regarded as potential responses to flood risk. The combination of the concepts of drivers and responses in the SPR model is illustrated below (Figure 3.1).

7
Figure 3.1. The relationship between drivers, the flooding system and flood risk (from Evans et al, 2004).
3.1.2 Scenarios Scenarios are a recognised technique for investigating long-term futures where there are many complex and interacting variables, and where the future is very uncertain. By constructing a number of alternative future scenarios and assessing the size and nature of flood risk that could result for each it is possible to gain a broad appreciation of the scale of future risks that may need to be addressed and the policy options and level of investment needed for future flood management. Two different types of scenario were combined:
• Climate-change projections based on emissions scenarios – climate change is a key driver relating to the flooding ‘source’ variables in the SPR model.
• Socioeconomic scenarios – these relate to the ‘receptors and provide the context for future flood-management policy and practice.
Four different such combinations of climate and socioeconomic scenario were used to assess the future flood risk under the initial baseline assumption that flood-management policies continue unchanged into the future (Figure 3.2). Figure 3.2 Scenarios: socio-economic (OST, 2002) and climate change (Hulme et al., 2002) Using these principles the project used a combination of qualitative, evidence-based expert knowledge elicitation and GIS-based broad scale quantitative modelling. The results were striking, with flood risk in the 2080s increasing under all scenarios by factors up to 20 times (Table 3.3). The case was not however hopeless, as analyses

8
of the potential responses suggested that flood risk could be held to close to current levels by a combination of engineering and non-structural measures, also shown in the figure.
Table 3.3 Future flood risk increases for UK under different scenarios. Baseline case and with responses (from OST, 2004) The finding of the 2004 project were highly influential in the production of the new strategy for flood risk management in the UK, Making Space for Water (Defra, 2005), and in the UK government’s decision to roughly double the annual investment in it.
3.1.3 Conceptual model of the Taihu A good conceptual model is important in understanding the functional requirements of the project modelling system. The Taihu project concerns a specific region and was carried out at a more detailed but still broad-scale level compared with the UK Foresight project. A conceptual model was therefore needed to capture the most important mechanisms of the Taihu flooding system and represent the functional requirements described earlier. Rather than repeat this, the reader is directed to the subsequent section on qualitative analysis, under which it is described.
3.1.4 Structure of the Work Packages In order to achieve the aims noted in the Introduction the analysis system was structured into eight work packages as follows:
• WP1 deals with the qualitative analysis of drivers and responses. • The remainder of the work packages together formed a set of ‘end-to-end’
modelling tools for approximate quantified flood risk analysis under present-day and future conditions of change.
There is a strong interaction between WP1 and the remainder of the project. As well as providing the conceptual model, structured understanding and insights WP1 provides essential information for the quantified analysis. WPs 2 to 8 in turn provide information to support the qualitative analysis. In addition, the climate change scenarios in WP2 and the socio-economic scenarios in WP4 feed back to provide the context for the qualitative analysis in WP1. Figure 3.4 shows the logical relationships and main information flows between work packages, rather than being a chronological diagram. The linkages, feedback loops and well-structured connectivity between the work packages proved invaluable to the success of the project.

9
Figure 3.4: The work packages and their linkages We now go through the work packages, summarising the objectives, methods, results and conclusions for each of them. Further details of each of them can be found in the technical annexes.
3.2 Work Package 1: Qualitative assessment of flood risk drivers and responses.
3.2.1 Objectives The objective of Work Package 1 was to identify, describe and approximately rank the relative importance of drivers of flood risk and responses to changes in flood risk that are in future likely to affect the flooding system in the Taihu Basin. WP1 also played a vital role in steering the setting up of the tools for quantitative analysis. The process of driver and response identification is necessarily based on expert judgment and was undertaken by a group of specialists in a workshop setting. In the Taihu study, drivers and responses were identified and ranked through a series of workshops held between 2005 and 2008. Key stakeholders involved in the process included:
• Taihu Basin Authority (TBA), • Flood Control Headquarters of Shanghai City, • Water Resources Bureau of Suzhou City, • Water Resources Bureau of Jiaxing City, • Shanghai Financial and Economic University, • Shanghai Design Institute of the Ministry of Water Resources • Nanjing Institute of Geography and Limnology (Chinese Academy of
Sciences).
WP1:Qualitative analysis
WP2:Climate scenarios
WP3:Set up hydrological models
WP4:Socio - economic scenarios
WP5:Set up flood damage data and models
WP7:Set up dyke reliability analysis
WP8:Set up quantitative risk model
WP6:Set up hydraulic model

10
3.2.2 Conceptual model of the flooding system A conceptual model of the flooding system was built up based on the analysis of the characteristics of the Taihu Basin. The flooding system in Chinese thinking consists of Source, Prevention, Hazard and Receptor as shown in Figure 3.5. Figure 3.5. Source, Prevention, Hazard and Receptor model of the flooding system.
3.2.3 Identification of drivers and responses Drivers are understood as those effects which can cause a change in the state of the flooding system. In Chinese thinking, responses are divided into the passive reaction by the system and the active (management) reaction to system changes. The former are defined as State Responses and the latter as Measure Responses. State Responses may be the result of one or more drivers (which may subsequently combine into other drivers). One or more Measure Responses lead to changes in state. There is also a feedback loop whereby State Responses and Measure Responses can act as drivers. This is an acute issue in the Taihu Basin, where as noted earlier flood defence works (Measure Responses) in one area can act as drivers of increased flood risk for other areas. Figure 3.6 gives a conceptual representation of the relation between drivers and responses. In practical terms, any force changing the state of flooding system may be looked on as a driver and any practice implemented to reduce flood risk can be looked on as a response (Measure Response in the previous paragraph). Figure 3.6 Relationship between drivers and responses
Source
Prevention e.g. structure and non - structure practices
Receptor e.g. People and property
Hazard e.g. storm intensity and inundated depth
Source e.g. river or sea

11
The lists of flood risk drivers and responses are given in Tables 3.1 and 3.2 below. Functional Group
Drivers Significance
Climate Change
Temperature change Medium/Low Long duration and large scale rainfall (plum rain) High Storm High Sea level rise High Marine Storm Surges Medium/High Wave action Medium/Low
Socio-economic development
Economic development High Urbanization High Land subsidence Medium/High Land use Medium Stakeholders Medium/High
Flood control system
Construction of dykes Construction of local river dykes Medium
Construction of gates Construction of local river gates Medium
Construction of polders
Construction of ring dykes High Construction of pumping station in polder High
Table 3.1. Drivers of flood risk in the Taihu Basin Functional Group
Responses Significance
Storage and drainage capacity
Strengthening/raising of Taihu ring dyke High Construction/improvement of reservoirs and associated dams Medium/High
Construction of drainage outlets High Management of main river channels (including dredging) Medium/High
River estuary management High Development of intra-urban drainage and storage system. Medium
Strengthening/ raising of dykes
Strengthening/raising of river dykes High Strengthening/raising of coastal levees High Strengthening/raising of local river dykes Medium
Construction of gates
(Re)-construction of main river gates/control works High (Re)-construction of local river gates/control works Medium
Construction of polder
Local ring dyke construction High Construction of pumping stations in polder High
Flood management
Management of flood control and water resources High Flood risk region Medium Flood insurance Medium/Low Flood-proofing measures for buildings Medium Emergency management High
Construction of urban area ring dykes Medium Control of land use (including control of run-off) Medium/High Table 3.2. Responses to flood risk in the Taihu Basin All the identified drivers and responses were grouped into three functional groups: climate change, socio-economic development, and flood control system. To emphasise the point made above regarding the double action of some flood defence Measure Responses, the flood control system is explicitly included as a driver of flood risk to other parts of the basin and its population.

12
A deep driver description was prepared describing the character and operation of drivers and responses for each driver and response group based on scientifically-derived evidence, expert knowledge and, where available, quantitative data from previous modelling efforts. Establishment of the nature and operation of drivers and responses then provided the basis for a conceptual model of the flooding system as a whole, described in the next section.
3.2.4 Conceptual model of the Taihu flooding system The conceptual model was built up based on the analysis of the characteristics of the Taihu Basin using the source, prevention, hazard and receptor framework discussed previously. The application of this to the hydraulic system of the Taihu Basin is shown in Figure 3.7. Figure 3.7. Conceptual model of the Taihu Basin flood system A second pair of diagrams (Figure 3.8) shows the important interactions between urbanisation and the flood control system, and some of the adverse interactions outlined earlier which have happened in the last two decades of very rapid development. The diagram also shows the three-level drainage system of the Basin in which:
• The top level, for which the TBA is responsible, intercepts runoff from the Western hills and conveys it into the Tai lake and from there to the Yangtze estuary or the sea.
• The intermediate prefecture and county-level system of flood plain river networks, which receives floodwater from direct precipitation on the floodplain, and conveys it to the peripheral outlets and major high-level carriers via pumping stations or tidal outlet gates.
• The city-level system of defended areas and associated pumping stations which discharge floodwater into the floodplain channel network.
Qiantang River Hangzhou Bay
Yangzte River
Eastern Sea
Region
Hilly
Western
Reservoir
Shang Hai
Su zhou
WuXi
Chang Zhou
Hang
Zhou
Hu zhou
Jia xing
Tai Lake
Fluvial gate and pump t ti
Coastal gate and pump
drainage works
River b k
Coastal
Ring dik
Gate
Urban ring dyke
Wangyu
Taifu
drainage
flood control works o f Tiaoxi

13
Figure 3.8. Conceptual model of urbanisation and dyke construction
3.2.5 Scenarios for the Taihu Basin
Climate change Average temperatures in the Taihu Basin are predicted to increase. NDRC (2007) suggest that compared to the average temperature in 2000, there will be an increase of between 2.3 and 3.3 oC by 2050. Whilst these changes in temperature are significant, they are mainly expected to impact flood risk via other separately quantified key drivers including: precipitation; marine storm surges; relative sea-level rise, and waves. In assessing the importance of the precipitation driver, the results of climate modelling (Work Package 2) using the PRECIS regional climate modelling system developed by the UK Meteorological Office Hadley Centre were fed back into the qualitative analysis. As noted, the Taihu Basin is characterised by a monsoonal climate A large proportion of annual precipitation is associated with long duration, broad scale rainfall events in the summer months, known as ‘plum rains’, with attendant pluvial flood risks exacerbated by the very low lying topography (Lin, 2002). The Shanghai area is also at risk of flooding from typhoon-induced storm surges which can coincide with high spring tides and are exacerbated by high river discharges resulting from conveyance of the heavy rainfall that accompanies the typhoon (Zong and Chen, 1999). Storm surges are expected to increase in intensity with climate change and the effects are likely to impact areas further inland than at present (Liu, 1997). However quantification of the magnitude of these changes is difficult.
Conveyance channels
Urban areas
Ring dykes
Ring dyke
(b) Dyke construction (plan
Stage 1: Construction of ring dykes around urban areas Stage 2: Blocking of conveyance channels and extension of ring dykes
Blocked channels
Tai Lake
Urbanisation
(2) Dyke building around city 1
Pumping of urban runoff into floodplain channels
Floodplain channel network
Drainage of Taihu water to Yangtze estuary and sea
Run-off from hilly region enters Tai Lake
(a) Urbanisation as a driver of increased flood risk in the Taihu
Dyke building around city 2
Reduced storage/ raised water levels in floodplain channels

14
Localised high intensity storm events are also associated with both local (individual cities) and regional urban heat island effects, which can lead to an intensification of precipitation (Djen, 1992; Chen et al., 2006). The increases in intensity and duration of storm associated with typhoons and urban heat-islands may increase storm volume by 10%~42% by the 2050s. However, this effect is very difficult to analyse separately from the plum rains and for this study the estimated changes in plum rains were taken to include this effect. The Yangtze margins and eastern lowlands of the Taihu Basin are the areas most exposed to the effects of sea level rise resulting from climate change. As a source of flooding, rising sea level will result in a reduction in the level of protection provided by current dyke and sea wall infrastructure around Shanghai, Hangzhou Bay and the northern coastal plain of Jiangsu province. However, rising sea levels will also have other impacts, for instance through a reduction in the flood capacity of the Taihu Basin drainage network as a result of increased groundwater levels and prolonged waterlogged conditions (Chen and Zong, 1999). Furthermore, many outlets of the drainage system are controlled by floodgates that rely on gravity drainage and are subject to tide-locking, further reducing the capacity of the drainage network. Sea level rise effects will be further exacerbated by storm surge and land subsidence. Sea level rise data were also considered in Work Package 2.
Socio-economic development This functional driver group includes interconnected anthropogenically-driven aspects of the flooding system that will also affect relationships with the social and economic consequences of future flooding. Within this group, economic development, urbanisation, land subsidence, land use and fluvial and coastal construction were identified as important drivers. Identification and ranking of these drivers was informed primarily by qualitative analysis of socio-economic data collected in Work Package 4 and reference to the flood depth-damage data developed in Work Package 5. As noted, land use change and urbanisation has reduced the capacity of the Taihu Basin drainage system to store or convey floodwaters, reflecting a common pattern within highly urbanised regions in China (Shi et al., 2005). As a result of these very rapid rates of development, this driver has a very high impact on future flood risk. The level of uncertainty associated with this driver was assessed as being relatively low because, while there are uncertainties associated with the detail of development processes, there can be no doubt that extensive urban expansion will occur within the Taihu Basin over the course of the study period. Other types of land use change in the basin will also reduce drainage capacity. For instance, since 1985 the total area of farmland in the Taihu basin has decreased by about 20% and there has been a shift from rice paddy to the intensive cultivation of vegetable crops. Shifts to vegetable cultivation in China have also been associated with water quality problems, with the potential to exacerbate resource pressures in the basin. In addition, deforestation in the hilly areas has led to sedimentation in various parts of the drainage network, reducing the conveyance capacity of drainage channels. Land use drivers are, therefore, considered to be of high importance in increasing flood risk in the basin though uncertainty is relatively low since their effects are well documented.

15
Consumption of water resources in such a rapidly expanding economy as the Taihu basin far outstrips the availability of natural surface water resources, particularly since surface waters in the basin have become heavily polluted as a result of industrial, urban and agricultural activities (Xue et al., 2007). As a result, groundwater reserves are abstracted to relieve water supply pressures, leading to serious subsidence problems, particularly since controls on groundwater pumping are not strictly enforced in rural areas. Over-pumping of groundwater is the principal anthropogenic cause of land subsidence in the coastal urban areas of China and occurs on such a large scale that regional ‘depression cones’ or ‘funnel areas’ have developed (Shi et al., 2005; Xu et al., 2008). Subsidence rates as high as 50 mm/year have been reported for the low-lying plain connecting the cities of Hangzhou, Jiaxin and Huzhou, and most parts of the coastal plain have experienced rates of around 20 mm/year. In Suzhou City, southern Jiangsu province, ground elevation levels were lowered by 1 m (i.e. 1/4 of the total elevation range in the basin) over the period 1980-1997 and in some places maximum recorded elevation reductions have reached 3 m (Zhang et al., 2006). In relatively developed Shanghai a further subsidence of 10 to 37cm is predicted by 2050 and similar or greater trends in land subsidence in other areas over the next 50 years seem inevitable. Such significant changes reduce the capacity of existing hydraulic engineering works and pumping systems to alleviate flood risk. They also increase the frequency at which flood events can cause significant flooding. Subsidence as a result of human activity is, therefore, a highly important driver of future flood risk in the Taihu basin. Land use change and the exploitation of natural resources in the Taihu basin has also caused serious pollution problems resulting from heavy metal and industrial contamination, and eutrophication as a consequence of urban and agricultural effluent disposal (Xue et al., 2007). This represents a significant challenge for flood risk management as well as environmental conservation, since the pollution of surface waters has resulted in exploitation of alternative resources, principally groundwater, resulting in subsidence (see above), and diversion of water from the river network to alleviate water supply pressures. Future policy shifts towards conservation and ecological improvement, for instance as seen in Europe (The European Parliament and the Council of the European Union, 2000) could have the potential to increase flood risk in some areas (Nienhuis and Leuven, 2001). Socio-economic factors (demographic, economic, financial and political) also act on the receptors in driving flood risk. The Taihu basin represents an important and rapidly developing economic centre, whose the population is highly vulnerable to flood risk through damage and losses associated with flooding of both residential and non-residential properties (Junfeng et al., 2003). Socio-economic impacts include the social impacts of floods on people (such as disruption, stress, damage to personal property and health), the impacts on different sectors of the economy through damage to buildings and their contents, and the impacts on urban land uses and infrastructure development (Green and Penning-Rowsell, 2007). The huge potential losses from flooding in the basin and high rate of growth mean that economic development is of ‘very high’ importance in driving future flood risk.
3.2.6 Design of Future Flood Risk Scenario Analysis Schema Based on the above discussion and the qualitative analysis of drivers and responses, we can design a set of future flood risk scenario cases as a basis for the quantitative analysis. The relationship of qualitative analysis and scenario design is shown in Figure 3.9 below:
16
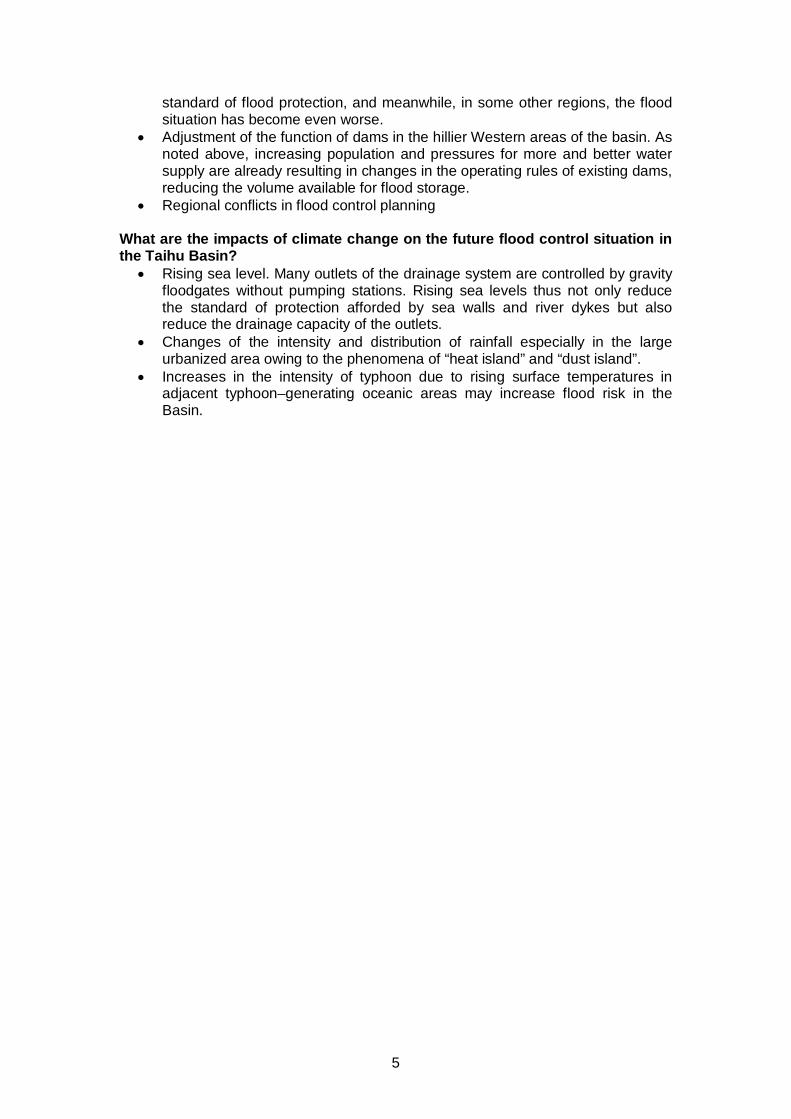
Figure 3.9. Relationship of quantitative analysis to scenario design The three functional groups of drivers and responses (climate change, socio-economic development, and flood control system measures) can be used to build up a 3-D picture ‘scenario coordinate’ picture of future basin flood risk. This can potentially lead to very large numbers of combinations, but the 3-D scenario picture can be simplified because the climate scenarios are linked to the socio-economic scenarios. Two specific scenarios were selected for analysis:
• A combination of the SRES A2 climate change and socio-economic scenarios. • A combination of the SRES B2 climate change scenario and the Chinese
National Plan (NP) socio-economic change scenario. The first is characterised by low government regulation, open market and high competition, the other by harmony and sustainability. These are illustrated in Figures 3.10 and 3.11 below:
Figure 3.10. 3-D scenario coordinates of future flood risk

17
Figure 3.11. 2D representation of flood risk change under two scenarios The approach adopted in practice was to first evaluate the impact of climate change and socio-economic change on basin flood risk separately, followed by evaluating the impact when these changes act in combination. Having established these baseline changes, the final step is to evaluate the impact (improvement) on basin flood risk of implementing various structural and non-structural flood control measures.

18
3.2.7 Drivers and their impacts on flood risk Based on the analysis of future trends and uncertainty, all the drivers impacting flood risk were evaluated, then ranked under different scenarios, as shown in Table 3.3. Table 3.3. Drivers Ranked by Flood Risk increase under Future Scenarios
A2/A2 B2/NP A2/A2 B2/NP 2020S 2020S 2050S 2050S
1 Economic development Plum rain Plum rain Plum rain
2 Urbanization Storm Sea level rise Sea level rise
3 Plum rain Economic development
Economic development Storm
4 Sea level rise Urbanization Storm Marine storm surges
5 Storm Sea level rise Marine storm surges Waves
6 Stakeholders Marine storm surges Stakeholders Economic development
7 Construction of ring dykes Land use Construction of ring
dykes Temperature change
8 Construction of pumping stations in polder
Land subsidence Construction of pumping stations in polder
Land subsidence
9 Land use Waves Land use Construction of local river gates
10 Marine storm surges Temperature change Urbanization Construction of
local river dykes
11 Land subsidence Construction of local river gates Waves Land use
12 Construction of local river gates
Construction of local river dykes
Construction of local river gates Urbanization
13 Construction of local river dykes
Construction of ring dykes
Construction of local river dykes
Construction of ring dykes
14 Waves Construction of pumping stations in polder
Land subsidence Construction of pumping stations in polder
15 Temperature change Stakeholders Temperature change Stakeholders
Impact Category Range of Impact Range Colour Code
Increase in Flood Risk High ×8 Medium/High ×4 Medium/Low ×2
Low impact ×1
Decrease in Flood Risk
Medium/Low ×2 Medium/High ×4 High ×8
It can be seen that climate change and socio-economic drivers both feature as strong positive drivers of flood risk, while better land use and engineering works give substantial decreases in risk. It should be noted, however, that a driver such as Construction of Ring Dykes is both a positive and a negative driver as discussed earlier - a valuable insight into the complexities and conflicts which exist in managing flood risk in the Taihu Basin.
19
The drivers were also graded according to their uncertainty, which was high across many drivers.
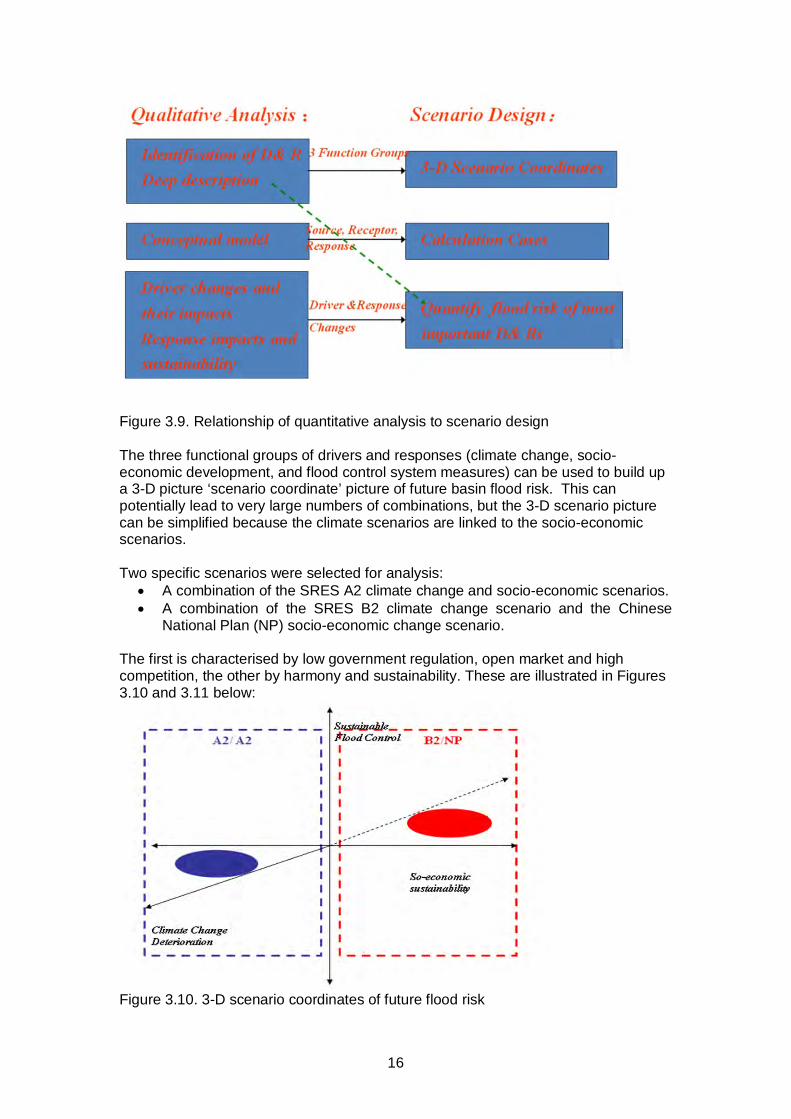
3.2.8 Responses: identification and impacts Four categories of response to changes in flood risk were initially identified for the Taihu Basin through expert and stakeholder workshops: primary engineering responses (city-level protection); local engineering responses (local dykes and polders); flood control engineering responses in the western hill area; and non-engineering responses (e.g. flood proofing of buildings, emergency management). These are shown, ranked, in Table 3.4. Tab1e 3.4 Responses Ranked by Flood Risk Reduction under Future Scenarios
A2/A2 B2/NP A2/A2 B2/NP 2020S 2020S 2050S 2050S
1 Strengthening/ raising of Taihu ring dyke
Management of flood control and water resources
Strengthening/ raising of Taihu ring dyke
Flood risk region
2 Strengthening/ raising of outward dyke
Emergency management
Strengthening/ raising of outward dyke
Management of flood control and water resources
3 Strengthening/ raising of coastal levee
Strengthening/ raising of Taihu ring dyke
Strengthening/ raising of coastal levee
Emergency management
4 Construction / improvement of drainage outlets
Strengthening/ raising of outward dyke
Construction / improvement of drainage outlets
Flood insurance
5 (Re)-construction of main river gates / control works
Strengthening/ raising of coastal levee
(Re)-construction of main river gates / control works
Land use
6 Management of outward River
Construction / improvement of drainage outlets
Management of outward River
Construction of urban area ring dykes
7 Management of outward River estuary
(Re)-construction of main river gates / control works
Management of outward River estuary
Development of intra-urban drainage and storage system
8 Construction / improvement of reservoirs
Management of main River
Development of intra-urban drainage and storage system
Local ring dyke construction
9
Development of intra-urban drainage and storage system
River estuary management
Management of flood control and water resources
Construction of pumping station in polder
10 Management of flood control and water resources
Flood insurance Emergency management
Strengthening/ raising of Taihu ring dyke
11 Emergency management Flood risk region
Construction / improvement of reservoirs
Strengthening/ raising of outward dyke
12 Flood-proofing measures for buildings
Control of land use (including control of run-off)
Flood-proofing measures for buildings
Strengthening/ raising of coastal levee
13 Flood insurance Construction of urban area ring dykes
Flood insurance Construction of drainage outlets
14 Flood risk region Local ring dyke construction Flood risk region (Re)-construction
of main river gates

20
/control works
15 Strengthening/ raising of local river dyke
Construction of pumping station in polder
Strengthening/ raising of inward river dyke
Management of main river channels (including dredging)
16 (Re)-construction of local river gates / control works
Construction / improvement of reservoirs
(Re)-construction of local river gates / control works
River estuary management
17 Construction of pumping station in polder
Development of intra-urban drainage and storage system
Construction of pump station in polder
Construction of reservoirs
18 Local ring dyke construction
Flood-proofing measures for buildings
Local ring dyke construction
Flood-proofing measures for buildings
19 Land use Strengthening/ raising of inward river dyke
Land use Strengthening/ raising of inward river dyke
20 Construction of urban area ring dykes
(Re)-construction of local river gates / control works
Construction of urban area ring dykes
(Re)-construction of local river gates / control works
Impact Category Range of Impact Range Colour Code High ×4 Medium ×2 Low ×1 Liable to increase in flood risk —— It can be seen that both structural and non-structural measures feature among the strongest responses, while conflicts and ambiguities again result in some of them having a heavy negative impact on other communities or regions of the basin.
3.2.9 Sustainability of responses Each set of responses was ranked according to the five sustainability criteria appropriate to Chinese conditions and culture (decrease in flood risk, district harmony, economics, environmental impacts, and use of resources). Table 3.5 presents the sustainability scores for the five types of response identified through stakeholder workshops.

21
Response Metrics
Inte
grat
ed
grad
e
Dec
reas
e in
risk
Dis
trict
ha
rmon
y
Eco
nom
ic
bene
fit
Env
iron-
men
tal
impa
ct
Res
ourc
e ut
ilizat
ion
Sto
rage
and
dra
inag
e ca
paci
ty
Strengthening of Tai Hu dyke
++ + + 0 ++ 6+
Increase Tai Hu dyke height ++ - - - - ++ 0 Maintenance and reinforcement of reservoir dams
+ 0 + 0 + 3+
Reservoir construction + 0 + - - + + Local river gate construction ++ - + - 0 + Management of main rivers +++ - - + - - ++ 2+ Dredging of local rivers ++ - ++ - + 3+ River estuary management + 0 0 0 0 + Development of intra-urban drainage + storage system
+++ + - - + + 4+
Dyk
es
Strengthening of river dykes + + + 0 0 3+ Increase height of river dykes
+ 0 + 0 0 2+
Strengthening of coastal levee
++ 0 + 0 0 3+
Increase coastal levee height
+ 0 0 0 0 +
Strengthening of local river dykes
+ 0 + 0 0 2+
Increase height of local river dykes
+ - + 0 0 +
Gates (Re)-construction of main river gates and control works
++ ++ + 0 + 5+
Pol
ders
Local ring dyke construction for polders
++ - - ++ - 0 +
Construction of drainage pumping stations in polders
+ + + 0 + 4+
Construction of urban area ring dykes
++ - ++ - 0 2+
Non
-stru
ctur
al
mea
sure
s
Control of land use (including control of run-off)
+ - - + ++ + 3+
Management of flood control and water resources
++ - ++ 0 ++ 5+
Flood risk region ++ - - ++ 0 0 2+ Flood insurance + 0 + 0 0 2+ Flood-proofing measures for buildings
++ 0 ++ 0 0 4+
Emergency management ++ - ++ 0 0 3+ Table 3.5. Sustainability scores of responses.

22
Discussion of structural measures The highest sustainability scores for structural measures are associated with the strengthening of the Tai Lake dyke, reconstruction of control works and construction of pumping stations - which attract no negative scores for any of the five sustainability criteria. Development of the intra-urban drainage system is, along with river management, the most costly primary engineering response measure, but it is also associated with a large reduction in flood risk, and positive effects on district harmony, environmental impact and resource utilization, resulting in an overall positive sustainability score. River management, urban area dyke construction and increasing the height of the Tai Lake dyke are all perceived to have negative environmental impacts, for instance through disconnecting hydrological, geomorphological and ecological processes operating in the rivers and the lake from the surrounding floodplains. Dredging is associated with the highest overall sustainability score as a result of significant reductions in risk and relatively high cost-effectiveness, but it does have negative impacts on district harmony and the environment, for instance through reductions in biodiversity (Darby and Thorne, 1995). Increasing the height of local river dykes, and the construction of local polders and river gates are all associated with negative impacts on district harmony as they can transfer flood risk from one geographic area to another and are associated with negative environmental impacts. Reservoir and dam structures can have serious environmental consequences through loss of longitudinal connectivity in the fluvial system, alterations to the hydrological regime, changes to channel morphology that destroy habitats and ecological responses that reduce biodiversity (Petts, 1980). The maintenance and strengthening of existing structures, however, scores relatively highly in terms of overall sustainability, as this measure represents little additional environmental impact to the fluvial system.
Non-structural responses Operational rules relate to flood defence infrastructure such as pumping stations and flood gates at the basin scale, and drainage operations at the local (city) level, both of which have direct implications for flood risk and require consistent, efficient and co-ordinated water resource management within the basin in order to reduce risk. The identification of flood risk ‘zones’, representing different types and levels of flood risk, will assist flood risk management in the basin, for instance through awareness raising (Evans et al., 2004) and helping decision makers to prioritise and allocate investment in structural and non-structural measures. Implementation of commercial flood insurance can help to alleviate the financial consequences of flood events by reimbursing both tangible and intangible losses, while various types of flood proofing measures implemented on new and existing buildings can reduce exposure to loss (Arnell and Chatterton, 2007). Emergency flood event management, prior to and during the flood event, includes ‘non-structural’ measures such as flood forecasting and warning dissemination and temporary flood proofing measures. The overall organisation of the management of water resources scores highest in terms of overall sustainability as a result of its capability to deliver large reductions in flood risk and effectiveness that also score highly with respect to cost effectiveness and resource utilization, together with the absence of significant negative environmental impacts. However, this response measure scores negatively on

23
district harmony due to its potential for transferring flood risk from one part of the basin to another. Similarly, emergency management is associated with a negative impact on district harmony as a result of the potential for regional differences to develop in the provision of emergency protection and rescue services.
3.2.10 Conclusions of WP1 • The UK Foresight Future Flooding qualitative assessment methodology has
been successfully adapted to a Chinese context in the Taihu Basin, taking account of different spatial scales and a different social, political, economic and environmental context. The work demonstrates the transferability of the Foresight methodology as a framework for the holistic assessment of future flood risk associated with climatic and socio-economic change.
• The drivers and responses affecting the basin flood risk have been identified and assessed using expert judgment at workshops. They have been classified into three functional groups: climate change, social-economic change and flood control system.
• The characteristics of each driver and response have been described and the changes of the drivers and responses over the past few decades are summarized. Inter-driver functional relationships have been described along with the way in which each driver and response impacts the flood risk.
• The importance, and associated uncertainty, of the impact of drivers and responses on flood risk have been assessed and ranked and the sustainability of the various responses in reducing flood risk has been evaluated against five sustainability metrics.
• Extreme and exceptional events which might impact on the future flood risk in the Taihu Basin have been separately defined and their impact described.
• Future scenarios for evaluation under the TBRAS quantitative analysis system have been identified, using various combinations of the A2/A2 and B2/NP climate change and socio-economic scenarios.
3.3 Work Package 2: Climate change scenarios
3.3.1 Objectives and scope The objectives and scope of this work package were:
• To develop scenarios of boundary conditions for the flood risk analysis system in the Taihu Basin using global and regional climate model data.
• To obtain and analyse observed precipitation data for the Taihu Basin and derive an assessment of long return-period (50,100,200,500,1000-year) precipitation extremes for various durations (10,30,60,90-day) resulting from natural climate variability.
• To analyse and validate precipitation and other weather data over the Taihu basin from CAAS PRECIS (Jones et al., 2004) simulations for the baseline (1961-1990) and the 2030s (2021-2050a).
• To analyse the simulations for baseline and 2030s to define long return period extreme rainfall events and any changes in these and give a set of tables of long return period extreme rainfall of various durations representative of natural climate variability and projected future climate change over the basin.
• To derive mean sea level rise scenarios for Chinese coastal waters. In order to achieve these, observed weather data for the Taihu basin were gathered and checked. Observed precipitation data for the period 1961-1990 from 9 meteorology stations over the Taihu basin (Figure 3.12) were analysed. Precipitation and the other weather data over the Taihu basin were simulated by CAAS PRECIS

24
for 1961-1990 and 2030s. The capacity of PRECIS to simulate climate over the Taihu basin was validated.
Fig.3.12 Location of stations providing observed precipitation data.
Extreme statistics of observed precipitation Observed precipitation data for the period 1961-1990 from 9 meteorology stations over Taihu basin were analysed to derive extreme value statistics of 10-90 day precipitation totals. Using the Pearson-III distribution curve, extreme rainfall corresponding to the 2, 10, 20, 50, 100, 200 500 and 1000 year return period events were estimated for 10, 30, 60, 90 day duration and for each station respectively. Precipitation and temperature data over the Taihu basin from PRECIS simulations was validated using station data from 1961-1990.
Rainfall extremes in the naturally varying climate and projected future changes According to the Pearson-III distribution curve, extreme rainfall of 2-1000 year return period was estimated for 10, 30, 60, 90 day duration and for each station spot respectively, based on the precipitation of 1961-1990 of PRECIS simulations. The distribution of extremes rainfall volume estimated from PRECIS of 1961-1990 is close to that of observations, but the volumes estimated from PRECIS are larger than those observed for most stations, and also most durations and return periods. The assessment of future extreme rainfall is achieved by subtracting the volume estimated from simulations for 1961-1990 from that for the future (2030s in this project) and adding the result to that of observation, so that the relative value (change) that is used. For the purposes of this summary report we show below the average percentage increases for each duration and return period. They are similar to the UKCIP02

25
values used in the UK Foresight study, though higher for the short durations and more extreme return periods.
duration return period (years) 1000 500 200 100 50 20 10 2
10d 35.95 34.73 32.93 31.34 29.38 26.40 23.92 14.25 30d 34.67 33.49 31.75 30.29 28.48 24.70 22.51 12.68 60d 44.64 41.79 37.69 34.19 30.55 25.12 20.16 6.11 90d 33.89 31.63 28.39 25.66 22.78 19.31 15.26 4.63
Table 3.6. Average percentage increase in extreme rainfall for all stations for each return period and duration (baseline- 2030s with SRES A2).
duration return period (years) 1000 500 200 100 50 20 10 2
10d 58.50 55.32 50.75 46.84 42.52 37.26 30.78 11.23 30d 38.53 37.37 35.71 34.24 32.50 30.96 28.36 15.51 60d 32.66 30.97 28.52 26.41 24.14 22.77 19.56 8.74 90d 28.30 27.12 25.36 23.87 22.16 22.01 19.26 9.43
Table 3.7. Average percentage increase in extreme rainfall for all stations for each return period and duration (baseline- 2030s with SRES B2).
3.3.2 Mean sea level rise scenarios for Chinese coastal waters Given the uncertainty in the patterns and magnitudes of regional sea level rises from different global climate models, data from 11 models assessed in the IPCC AR4 was analysed to provide guidance on future sea-level rise relevant to the Taihu Basin. Average regional sea level rises for 3 IPCC SRES emissions scenarios are presented in Table 3.8. The minimum, mean and maximum across the range of models are presented and the rise is calculated from the difference of the model simulated regional average sea levels for the years 2095 and 1990. Two cases are shown, the first being the local density driven change due to global thermal expansion with no land movement and the second where maximum local land movement as calculated by the DIVA coastal impacts simulator is included. Local rise excluding vertical land movement A1F1 A1B B1 Mean 0.47 0.38 0.31 min 0.25 0.20 0.17 max 0.70 0.56 0.45 Combined local mean and vertical land movement A1F1 A1B B1 Mean 0.66 0.57 0.50 min 0.44 0.39 0.36 max 0.89 0.75 0.64 Table.3.8 China region mean sea level rise ranges under different forcing scenarios: top, contribution from changes in ocean density only; bottom, ocean density changes plus maximum local vertical land movements.
3.3.3 Conclusions of WP2 • The PRECIS RCM system is capable of simulating the frequency distribution
of precipitation over the Taihu basin. Baseline and future simulations of

26
precipitation can be supplied as input into hydrology and hydraulic models, and also can be analysed for long return period rainfalls. The simulation of temperature is also good.
• For both SRES A2 and B2 scenarios, rainfall extremes volume will increase in future for most of station in the Taihu basin. Statistics show that the increase of future rainfall extremes is likely to take the form of increasing intensity and decreasing frequency of future extreme rainfall; large changes in short duration rainfall are likely while those of long duration are less so. Thus, changes in short duration intense rainfall should be given attention in flood risk analysis in Taihu basin.
3.4 Work Package 3: Hydrology
3.4.1 Objectives and models used The main objective of the hydrology work package was to develop models which could transform rainfall time series into flow time series in the uplands and net rainfall in the floodplain areas, for input into the WP6 broad scale hydraulic model. The Variable Infiltration Capacity (VIC) model (Wood, et al., 1992; Liang, et al., 1994) was selected as the rainfall-runoff model for the upland areas. VIC is based on the Xinanjiang model which has been widely used in China and uses a ‘variable bucket’ concept. For the floodplain areas a SCS (Soil Conservation Service) CN (Curve Number) method was used to generate net rainfall. The models can be driven by observed rainfall or from future climate change scenario rainfall. The schematisation of the VIC models resulted in 9 upland catchment sub-models with outputs split into the 19 boundary points of the ISIS Broad Scale Model (BSM). The SCS model of the floodplain generated net rainfall for 16 areas of the BSM.
Figure 3.13 Distribution of VIC sub-catchments and SCS flood plain zones
3.4.2 Generation of present and future rainfall series Examination of the 1999 rainfall records, Tai Lake water levels and damage distribution showed that there was a strong interaction between a rich spatial and temporal pattern of rainfall and tidal boundary levels, and the equally complex

27
hydraulic system of the Basin. This is illustrated in Figure 3.14, showing rainfall and Tai Lake levels in the 1999 event.
2.5
3
3.5
4
4.5
5
5.5
6
6.5
7
7.5
1 8 15 22 29 36 43 50 57 64 71 78 85 92Days from 1 June 1999
Lake
leve
l (m
)0
20
40
60
80
100
120
140
160
180
200
Rai
nfal
l (m
m/d
ay)
Rainfall (mm/day)Taihu water level (m)
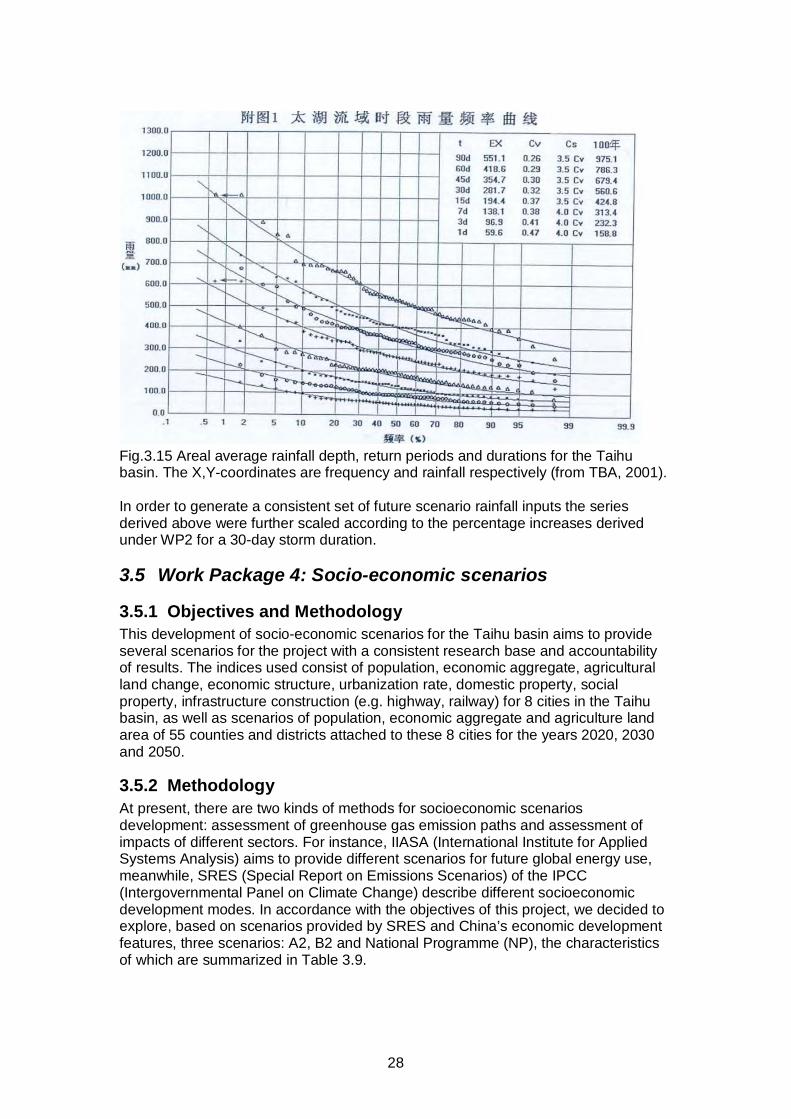
Figure 3.14. Rainfall (top) and Tai Lake levels (lower) as recorded in the 1999 flood event It is apparent that the rainfall is concentrated in short bursts of a few days within an overall 90 day period. The system response time on the other hand, varies from the 30-day rise time of the Tai Lake to the one or two-day response times of the pumped drainage systems in the smaller floodplain cells and polders. It was obvious therefore that there was no simple solution to the problem of producing boundary conditions to feed into the broad-scale hydraulic model, such as rectangular or triangular hydrographs. These would not preserve the spatial and temporal distribution of the rainfall and its relationship to system periodicities, and would not therefore lead to realistic simulations of flood risk. There was no provision in the project for a major exercise in synthetic rainfall series generation. Instead, the rainfall inputs were based on the spatial and temporal pattern of the 1999 event, scaling the 1999 observed rainfall profiles to produce rainfall inputs for different return periods using TBA relationships between depths for different return periods and durations (Figure 3.15). In doing this the critical duration for the 1999 event was taken as 30 days and its return period was taken as 1 in 200 years (TBA, 2001). This resulted in the generation of a set of scaling factors for rainfall of 30 day duration and return periods of 2, 10, 20, 50, 100, 200, 500 and 1000 years. These factors were applied to the whole 1999 daily rainfall series uniformly for each day.
28
Fig.3.15 Areal average rainfall depth, return periods and durations for the Taihu basin. The X,Y-coordinates are frequency and rainfall respectively (from TBA, 2001). In order to generate a consistent set of future scenario rainfall inputs the series derived above were further scaled according to the percentage increases derived under WP2 for a 30-day storm duration.
3.5 Work Package 4: Socio-economic scenarios
3.5.1 Objectives and Methodology This development of socio-economic scenarios for the Taihu basin aims to provide several scenarios for the project with a consistent research base and accountability of results. The indices used consist of population, economic aggregate, agricultural land change, economic structure, urbanization rate, domestic property, social property, infrastructure construction (e.g. highway, railway) for 8 cities in the Taihu basin, as well as scenarios of population, economic aggregate and agriculture land area of 55 counties and districts attached to these 8 cities for the years 2020, 2030 and 2050.
3.5.2 Methodology At present, there are two kinds of methods for socioeconomic scenarios development: assessment of greenhouse gas emission paths and assessment of impacts of different sectors. For instance, IIASA (International Institute for Applied Systems Analysis) aims to provide different scenarios for future global energy use, meanwhile, SRES (Special Report on Emissions Scenarios) of the IPCC (Intergovernmental Panel on Climate Change) describe different socioeconomic development modes. In accordance with the objectives of this project, we decided to explore, based on scenarios provided by SRES and China’s economic development features, three scenarios: A2, B2 and National Programme (NP), the characteristics of which are summarized in Table 3.9.

29
Summary Economic
growth Population growth Agricultural
land change A2 Imbalance of world
development, , pursuing only economic growth, technology progress slowly as a result of could not make full use of human intelligence, could not use recoverable resource in large scale, trade tariffs exist.
Middle Birth rates in different region converge rather slowly, leading to global population grow continuously
Similar to the agricultural land use mode in the present decade years, decrease quickly
B2 Regionalization tendency emerging, technology changes slowly and variedly; emphasizing priority of environment, solving economic and social problems in local region, imbalance of regional development
Middle The global population grow continuously, but the rate is slow than scenario A2, population peak exists
Keep constant with that of year 2005
NP According to China’s mid-long term programme, aiming at constructing harmonious society, steady economic growth; priority of environment and technology innovation
Middle Increase at a middle rate, population peaks
Keeps constant as at year 2005 before 2020, and then decreases slowly
Table 3.9 Description of scenario characteristics
Economy and Population Scenarios Quantification of the key socio-economic elements in scenario A2 and B2 should be consistent with global and regional scenarios. At present, a widely used scenario development method due to Gaffin et al. (2004), linearly downscales global population and GDP scenario forecasts to a national level. By analogy, we could use the same method and downscale the population and GDP in national level to provincial level or local level, i.e. the proportion of regional population or GDP to the whole country value in the base year is constant during the research period. It is also necessary to consider the economic volatility and population mobility for different regions. In the case of China, current population and GDP growth rates are generally between that of scenarios A2 and B2. We took 2005 as the base year (GDP is computed at year 2000 prices), and computed again using the latest data from the National Bureau of Statistics of China. For the NP scenario, we referred to the results of another Sino-UK cooperative project and used the same method to downscale to the Taihu Lake basin. We also used a similar method and evaluated the result of population and local GDP scenarios of 55 counties and districts attached to these 8 cities for the convenience of other working groups.
Agricultural land use change We analyzed the logarithmic correlation between the arable area change and gross regional product (at 2000 prices) of 8 cities for the last decade, and found that every city showed a strong linear relationship (most of the adjusted correlation coefficients

30
were >0.9). Based on this and the scenario features described above, we assume land use in scenario A2 maintains the current pattern, which is an extreme situation: the arable area decreases sharply. Scenario B2 emphasizes environmental protection, and assumes that the future arable area of every city stays constant at 2005 levels, which is a more desirable situation as reserve arable land in Taihu Lake basin is negligible. For Scenario NP, according to the Chinese government programme that ensures a red line of 1.8 billion population before 2020, we assume the arable area before 2020 is the same as 2005, and after that, decreases at half the rate of scenario A2.
3.5.3 Economic and Population Scenarios The population and GDP scenarios for year 2020 and 2050 are shown in Table 3.10, which is based on 2005 base data (all at 2000 prices). For our population forecast in scenario NP, we also referred to the national population development strategy research report published by the National Family Planning Commission. 2000 2005 2020 2050
A2 B2 NP A2 B2 NP GDP 10768 20216 38946 62121 63265 108131 187818 191622 Population 4471 4714 5407 5075 5104 6846 5312 5268 GDP per capita
2909 5180 8700 14787 14972 19079 42706 43940
Population density
826 870 999 937 943 1264 981 973
Growth rate 2000~2050 A2 B2 NP GDP growth rate(%) 4.72 5.88 5.93 Population growth rate (‰) 8.6 3.5 3.3 Table 3.10 Projection of population and GDP of Taihu under three scenarios In order to permit easy comparisons we present the development trends between 1980~2005 and the projection of future scenarios in Figures 3.16 and 3.17.
3000
3500
4000
4500
5000
5500
6000
6500
7000
1980
1985
1990
1995
2000
2005
2010
2015
2020
2025
2030
2035
2040
2045
2050
base
A2
NP
B2
Fig. 3.16 Current and projection of total population of 8 cities in Taihu (10000 person)

31
0
20000
40000
60000
80000
100000
120000
140000
160000
180000
200000
1980
1985
1990
1995
2000
2005
2010
2015
2020
2025
2030
2035
2040
2045
2050
base
A2
NP
B2
Fig. 3.17 Current and projection of GDP of 8 cities in Taihu (100 M). In line with the above, key indices for the 8 cities of Taihu Basin change as follows by 2050:
• Aggregate population - grows from 47.14 million in 2005 to 68.46 million (A2), 53.12 million (B2) and 52.68 million (NP) in 2050.
• GDP per capita - grows from $5,180 (at the year 2000 Yuan- Dollar exchange rate) in 2005 to $19,100 (A2), $42,700 (B2) and $43,950 (NP) in 2050.
• Overall agricultural land use area - decreases from 1.503 million hectares in 2005 to 1.195 million hectare (A2), 1.503 million hectare (B2) and 1.380 million hectare (NP) in 2050.
• Domestic property values - increase from 4.38 trillion Yuan in 2005 to 6.18 trillion Yuan (A2), 4.92 trillion Yuan (B2) and 4.835 trillion Yuan (NP) in 2050.
3.5.4 Conclusions of WP4 • Socio-economic scenarios provide descriptions of possible futures, which
provides a basis in combination with climate change impacts for exploring favourable adaptive strategies. Significant changes in key variables have been identified.
• A downscaling method introduced by IPCC was used to downscale socio-economic scenarios at state level to regional level, and the original data were revised and augmented, particularly population and GDP. In addition to scenarios A2 and B2 which are consistent with climate change, we developed a third scenario, the National Programmes scenario (NP), which is based on the Chinese government programme up to 2020 and expert forecasts for 2050.
• According to the different government policy interventions in different scenarios, using the relationship between the latest observed agricultural land use area changes in state level and city level and the level of economic development, we estimated the future agricultural land use area in different scenarios.
• The present domestic property (urban and rural area) of the Taihu Basin and commercial property was evaluated. We then evaluated the future domestic property and commercial property in the different scenarios according to the future trends of different indices involved in property evaluation.
• Evaluation of commercial property includes primary industry, secondary industry, and tertiary industry, as well as transportation infrastructure.

32
3.6 Work Package 5: Analysis of flood damage
3.6.1 Objectives and scope The object of WP5 was to assess potential flood impacts on economic assets, economic activity and the people of Taihu Basin under different scenarios. The resulting flood damages assessment model, created in conjunction with WP4, is implemented as a sub-system of the Taihu Basin Risk Assessment System (TBRAS). The main tasks of WP5 were as follows:
• Analysis of the flood characteristics of Taihu Basin and setting up of a flood damage assessment model.
• Collection of socio-economic data for year 2005 for the 55 counties/districts in the study area, carried out with experts from WP4
• Design of the flood damage assessment sub-system of the TBRAS.
3.6.2 Establishment of the socio-economic database As in WP4, the year 2005 is taken as the baseline year for flood damage assessment. There are two sources of statistical data for the Taihu damage assessment model: the 2006 statistical yearbook and the Fifth National Socio-economic Survey data of 8 cities in the basin. To match the scale of the broad scale flood simulation model and to meet the requirement of flood risk analysis of the basin, the county level was chosen as the analysis unit, downscaling city level data by reference to the county population ratio or county GDP ratio to that of the whole city.
3.6.3 Flood depth-loss rate in the Taihu Basin In contrast to the UK, the percentage of flood damage to the pre-flood property value at varying flood depth (the ‘flood loss rate’) is adopted as the flood depth-damage parameter in China. We used existing flood damage data from the Shanghai urban flood model , mostly collected from past floods in Shanghai city (before 2000), as the basic data to establish flood loss rate relationships for the Taihu Basin.
3.6.4 Flood damage assessment subsystem The data flow of the TBRAS flood damage sub-system is shown in Figure 3.18, where: A is Agriculture output; R is Residential property; I is Industry assets; B, Business assets;
iD is flood damage in category i;
ijβ is Loss rate in category i under depth j, ijV are assets in category i under depth j.

33
Fig 3.18. Flow diagram for the TBRAS flood damage assessment sub-system
3.6.5 Integration of the flood damage assessment model in the flood risk analysis system
In the Taihu project, the flood damage assessment model is integrated with the flood risk analysis system. To run the flood damage assessment model, the required input data are as follows:
• Socio-economic data for 2005 by county. • Flood depth-loss rate relationships. • Land use grid map layer, including built-up area, non-residential area and
water area. • The calculation result of the flood simulation model of Taihu Basin (WP6),
including flood area, flood depth, flood duration and so on. The output data of the flood damage assessment module include:
• Affected population of related flood simulation scheme. • Inundated area, affected GDP, inundated cropland area, affected non-
residential properties and affected transportation road length. • Flood damage of residential, non-residential, agriculture, transportation
sectors. • Thematic map of the results based on GIS map layer.
A
1
2 3 R, I, B
R1, I1, B1
R2, I2, B2
R3, I3, B3
A1
A2
A3
+
+
Spatial distribution of Properties Spatial distribution of flood depth
Spatial overlap analysis
Spatial overlap result Flood depth damage data
Flood Damage (D)
ij
n
i
m
jij
n
ii VDD ∑∑∑
= ==
==1 11
β
(Crop land) (Built-up area)
D1
Flood Depth Category 1 2 3
A 1,1β 2,1β
3,1β R 1,2β
2,2β 3,2β
I 1,3β 2,3β
3,3β B 1,4β
2,4β 3,,4β
D2 D3 Dn

34
3.6.6 Conclusions of WP5 • The UK flood damage assessment method and technique provide useful
references for flood damage assessment in the Taihu Basin. However, the flood damage analysis of the Taihu Basin has its own special features.
• By making use of existing related studies, a flood damage assessment model of has been established based on the analysis of the flood situation of the Taihu Basin, the availability of basic data, the practicability and the requirements of large scale damage assessment.
• The main flood damage categories, including residential damage, non-residential damage, agriculture output loss, transportation damage and so on, are considered.
• The county level is chosen as the analysis unit and remote sensing images are used for land use data. The flood loss rate relationships are derived from historical flood damage records of the Taihu Basin and from related studies. These are established without considering any regional variations that might exist within the basin.
• The flood damage assessment model has been verified using the flood damage survey from the 1999 flood. The result is a good fit at macro-level, which meets the requirement of broad-scale, long-term flood risk analysis of the Taihu basin.
3.7 Work Package 6: The broad-scale hydraulic model The objective of this work package was to develop a broad scale hydraulic model of the Taihu Basin and to use it to assist in the scenario analysis. By this we mean not a fully detailed, relatively localised model such as would be used for design purposes, but a wide-area, sparse-data model which while being fast enough to permit the running of many cases needed for scenario analysis, reproduces at a sufficient level of accuracy the broad features of flooding and approximate flood levels and extents. The model was developed using the ISIS software (Evans et al., 2007) with data provided by the TBA. The model uses inputs of direct net rainfall, upland inflows, Yangtze and coastal tide levels, Taihu initial water levels, sluice gates control rules and polder pumping rules. Simulations take about 30 minutes to run a 90-day period (based on June to August rainfall profiles as described earlier). Outputs include channel water levels and flood volumes in the floodplain cells; these data are passed to the TBRAS for use in the calculation of risk estimates including the calculation of expected flood volumes from breaching.
3.7.1 Development of the Model Following an assessment of modelling options, it was decided to build the hydraulic model of the Taihu Basin using the ISIS software. The main reasons for this decision were that the ISIS software enabled a channel and flood-cell model to be constructed, (as opposed to a solely in-bank model that was possible using TBA’s existing HOHY2 model) and allowed flexible control rules for sluices and pumps to be input easily via data statements. The schematisation of the system was based on that previously used in the HOHY2 model but extended onto the floodplain and updated for recent flood control projects (Figure 3.19).

35
Figure 3.19. Broad-scale hydraulic model; overview of schematisation Not all channels were explicitly included in the model as the HOHY2 model uses a process in which smaller channels are concatenated into equivalent channels. The concatenated channels have the same capacity as their component channels and thus the overall conveyance capacity is preserved. The floodplain was represented by ISIS flood cell units, each covering an area of about 100 km2 , connected to the channel system by overbank spill units (weir equations representing flow over the flood banks). The approximate level-volume relationship in the flood cell units were derived from STRM-90 DEM data (projected to GCS_WGS_1984). In the ISIS model the flows into and out of the flood cells consist of (Figure 3.20):
• Net direct rainfall • Flows spilling over the flood banks surrounding the flood cells • Pumped and/or gravity flows from the flood cells into the channel system
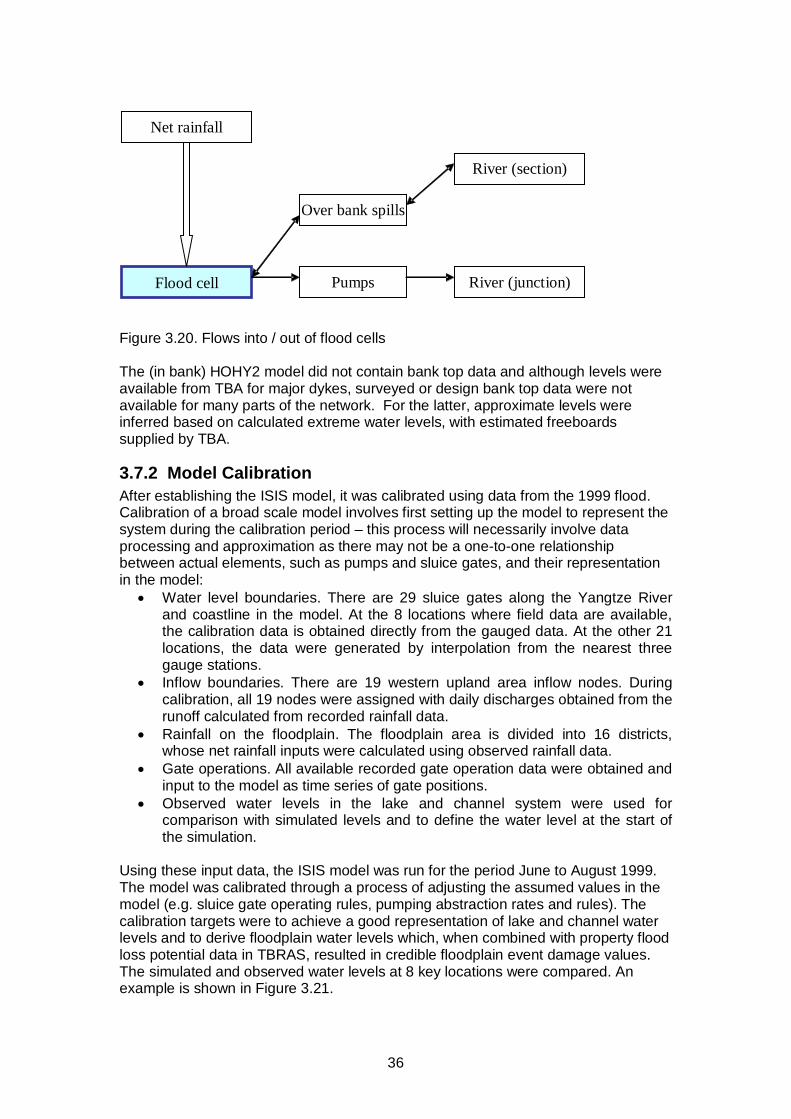
36
Figure 3.20. Flows into / out of flood cells The (in bank) HOHY2 model did not contain bank top data and although levels were available from TBA for major dykes, surveyed or design bank top data were not available for many parts of the network. For the latter, approximate levels were inferred based on calculated extreme water levels, with estimated freeboards supplied by TBA.
3.7.2 Model Calibration After establishing the ISIS model, it was calibrated using data from the 1999 flood. Calibration of a broad scale model involves first setting up the model to represent the system during the calibration period – this process will necessarily involve data processing and approximation as there may not be a one-to-one relationship between actual elements, such as pumps and sluice gates, and their representation in the model:
• Water level boundaries. There are 29 sluice gates along the Yangtze River and coastline in the model. At the 8 locations where field data are available, the calibration data is obtained directly from the gauged data. At the other 21 locations, the data were generated by interpolation from the nearest three gauge stations.
• Inflow boundaries. There are 19 western upland area inflow nodes. During calibration, all 19 nodes were assigned with daily discharges obtained from the runoff calculated from recorded rainfall data.
• Rainfall on the floodplain. The floodplain area is divided into 16 districts, whose net rainfall inputs were calculated using observed rainfall data.
• Gate operations. All available recorded gate operation data were obtained and input to the model as time series of gate positions.
• Observed water levels in the lake and channel system were used for comparison with simulated levels and to define the water level at the start of the simulation.
Using these input data, the ISIS model was run for the period June to August 1999. The model was calibrated through a process of adjusting the assumed values in the model (e.g. sluice gate operating rules, pumping abstraction rates and rules). The calibration targets were to achieve a good representation of lake and channel water levels and to derive floodplain water levels which, when combined with property flood loss potential data in TBRAS, resulted in credible floodplain event damage values. The simulated and observed water levels at 8 key locations were compared. An example is shown in Figure 3.21.
Net r ainf all
Flood cell
River (section)
River (junction)
Over bank spills
Pumps

37
Taihu
2.50
3.00
3.50
4.00
4.50
5.00
5.50
6-1 6-11 6-21 7-1 7-11 7-21 7-31 8-10 8-20 8-30
Field
Calculated
Figure 3.21. Taihu water levels (blue-observed; yellow-calculated) The evidence from the comparison of water levels, and from the assessment results derived from the TBRAS risk assessment model, suggests that the ISIS broad scale model is able to generate results of sufficient accuracy for the scenario analysis, bearing in mind that:
• The model is intentionally broad scale in nature and local processes may not be well represented.
• The control rules defined to represent the pumping processes are simplifications of the true processes, which are not well known.
• The evacuation outlets also include gravity drainage which may be tidally influenced. For this reason the ISIS Abstraction unit was used to mimic the effective performance of the system, rather than using Pump and Sluice units which mimic physically all the rating curves and control rules of a pumping station with gravity sluices.
• Pumping outflows are directed into representative channel junctions in the model, whereas in reality the pump outflows will be distributed into the channels surrounding the flood cells. This is not believed to generate significant overall errors and is in line with keeping the model broad-scale; simulating the actual, physical set-up would require much more data and many more nodes and result in a markedly slower model
• Many data items have had to be assumed and there is therefore uncertainty surrounding these values.
• The accuracy of the observed values used in calibration is unknown.
3.7.3 Scenario simulation The hydraulic model can be used to simulate a range of driver and response scenarios, including:
• Changes in rainfall (duration, profile and quantity) – by adjusting the rainfall time series for direct rainfall and the upland inflow hydrographs.
• Sea level rise – by adjusting the tidal boundary along the coast • Yangtze levels – by adjusting the Yangtze water level boundary • Impact of storm surges – by adjusting the tidal time series along the coast

38
• Ground subsidence – by adjusting the water level-area function of flood cells in model and the flood bank crest levels and sluice levels
• Change in operational flood management through revised operation of pumps and gates – by adjusting the rules in flood control projects
• Newly-built gates and pumps – by adding in corresponding flood control project components
• Dyke raising – by adjusting the spill unit levels and river cross section data • Changes in the flood protection areas – by adjusting the flood cell data
Some of these scenarios have been simulated as part of the initial application of the system and the results are presented in subsequent chapters
3.7.4 Conclusions of WP6 • A broad scale hydraulic model has been developed which is appropriate for
use in scenario analysis. It can predict overall changes in the flooding behaviour in the Taihu Basin although it may not be able to represent local detail
• The floodplain areas in the Basin are relatively flat and the channel flow is not significantly influenced by changes in channel bed elevation, but is influenced by boundary conditions, rainfall, pump and sluice operating rules and the initial water level in the Tai Lake.
• The ISIS flood cell units are able to represent the broad behaviour of the polders but have not been developed to represent the detail of what happens within the polders.
• The abstraction unit in ISIS has been used to represent the performance but not the detail of pumped and gravity evacuation of floodwater. This is appropriate for a broad scale model in a data poor area.
• The channel network in the model is highly abstracted (minor channel cross sectional areas are concatenated), and thus discharge rates in specific minor channels do not represent reality. The simulated water levels however show reasonable agreement with recorded values.
As more data become available, it is recommended that the model is improved and further calibration and validation is undertaken. More detail could be added to polder areas which contain significant receptors (cities). One approach would be to dynamically link the ISIS 1D model with the IWHR 2D unstructured mesh model – this would provide a flexible approach to enabling detail to be added to the polder areas as necessary.
3.8 Work package 7: Reliability analysis of dyke system
3.8.1 Objectives and scope The probability of flooding in the Taihu Basin is greatly influenced by flood defences and their operation. Defences such as dykes, sluices and pumping stations, are very important in protecting the region from flooding. This work package, therefore, deals with the reliability of the dyke system within the context of future climate and socio-economic change. The reliability analysis of the dyke system in the Taihu Basin covers the following topics:
• Reliability appraisal of the Taihu Basin dyke system. • The influence of climate change and structural degeneration on the reliability
of the dyke system

39
• The influence of management options such as enforcement and heightening on the reliability of the dyke system
The reliability analysis is based on the current condition and management of the dyke system. This work is conducted in collaboration with broad-scale hydraulic modelling (WP6) and quantitative risk analysis (WP8).
3.8.2 Reliability analysis method of the Taihu dyke system History tells us that the reliability of dykes, and the damages that occur if they are breached, cannot be omitted from a realistic assessment of flood risk. The method used here for the reliability analysis of the dyke system in the Taihu Basin was developed with HR Wallingford, and was implemented as a sub-system within the TBRAS. The analysis process is shown in Figure 3.22. Fig. 3.22 Framework for reliability analysis of dyke system
Definition of flood areas Within WP6 the Taihu Basin has been sub-divided into flood cells. Each of these flood cells is considered as a self contained area for the purposes of the reliability
For every impact zone
For each flood event in a range of events of varying severity
Identify potential flood extent and system of defence that influences each impact zone
For every combination of defence failures
Calculate the probability of the given combination of defence failures
Calculate the depth of flooding in each impact zone
Present results in GIS or tabular format (probability of failure, breach width of outflow volume)
Collect defence information (SOP, condition grade, length, coordinates), classify defences and assign each defence fragility curve for overtopping and breaching
Identify system to be assessed: for rivers, this will usually be a catchment. This encompasses the floodplain and the defence protecting it

40
analysis. Each flood area is bounded by a lake, watercourse, high ground, or coastline.
Individual defence classification Different defence structures perform differently under hydraulic load. A systematic classification system is therefore required to support the reliability analysis. The defences in the Taihu Basin are classified into seven major types as shown in Figure 3.23. Each major defence type is subdivided into several sub-types according to the structure types, crest width, revetments, materials, etc. Fig. 3.23 Flood and coastal defences classification in the Taihu Basin.
Defence group classification Each flood cell will have a number of distinct segments along its boundaries, defined by adjacent nodes within the hydraulic model. Each segment is then assigned a generalised Defence Group classification. A high level typology has been developed that represents this broad defence group classification within the Taihu Basin. Within each category the defences can be considered to have broadly similar characteristics. An extract from the table of defence groups is shown below (Figure 3.11).
Flood and coastal defences
Fluvial / Tidal
Coastal
Type 1: Vertical wall
Type 2: Embankment slope
Type 3: High ground
Type 5: Vertical seawall
Type 6: Sloping embankment
Type 4: Sluice
Type 7: Beach

41
River_type River_name Owner Standard of Protection Condition Grade Class
no
Design free board (m)
Lake defences
Taihu Lake_west basin 50 1(80%),2(20%) 3.14
Tidal river defences
Huangpu_urban flood wall province 1000 1(90%),2(10%) 0.5~1.
Coastal defences
Along Hangzhou bay(Zhejiang) province 50(30%)100(55%)
500(15%) 1(70%)2(25%)3(5%) 2~4
Fluvial Secondary defences
Suzhou River city 50 1(90%),2(10%) 0.4
Table 3.11. Example of defence group classification.
Fragility curve construction of each individual defence classification Fragility curves provide a consistent method for characterising defence performance (HR Wallingford, 2004), and are simply plots of the conditional probability of failure of a defence over a range of loading conditions. Thus, if hydraulic loads acting on each side of the flood cell are known, the probability of failure can be determined from the fragility curve. Fragility curves have been developed for the Taihu for each of the high level defence types, based on a modification of HR Wallingford, 2005. Typical fragility curves are as Figure 3.24. HLM+ Fragility curve
RASP defence class number 1(narrow fluvial vertical wall, gabion, front face protection)
-
0.1
0.2
0.3
0.4
0.5
0.6
0.7
0.8
0.9
1.0
-1.5 -1.0 -0.5 0.0 0.5 1.0 1.5
Freeboard (m)
P (b
reac
hing
¦feeb
oard
)
CG1CG1CG1CG2CG2CG2CG3CG3CG3CG4CG4CG4CG5CG5CG5
Figure 3.24. Typical fragility curves.

42
Reliability evaluation of each boundary defence The probability of one or more defences failing is calculated along each boundary of the flood cell. For a given water level from WP 6, the breach probability of segment i can be interpolated from the fragility curve appropriate to its type. Once this is established, the probability of failure for each section along a given defence boundary can be combined to provide an overall probability of one or more breaches occurring along the defence boundary. This will be calculated based on the assumption of independence between individual defence sections as follows:
( ) ( ) ( )1 21 1 1 1B B B BnP P P P= − − ⋅ − ⋅ ⋅ −
Where, BP is probability of one or more defence failures under given load. 1BP is
probability of defence “one” failure under given load. 2BP is probability of defence
“two” failure under given load. BnP is probability of defence “n” failure under given load.
Breach width evaluation Dyke breach geometry is critical for discharge calculation. The invert level of the breach is usually assumed to be equal to the ground level. There are currently three ways for evaluating the breach width:
1. To assume a breach width according to expert judgment and experience. 2. To develop a simple relationship between the breach width and loading
condition (HR Wallingford, 2004). 3. Physical-based breaching model (e.g. HR Breach).
Of the above three methods, method (1) has been adopted for the Taihu Basin. The process was repeated for each boundary of the flood cell and made available to the WP8 TBRAS as a spreadsheet.
3.8.3 Conclusions of WP7 From the work in this primary phase, the utility of the dyke reliability analysis method has been well recognised by the Chinese team. With the help of UK experts, initial individual defence classification and fragility curves development have been done, and Chinese experts have spent a large amount of time on the investigation of the flood and coastal defences information and dyke breach cases. Further data analysis for the dyke system reliability analysis is in progress. Although many tasks have been finished, there are still many aspects for further investigation. These are listed below.
• The number of defences in the Taihu Basin is very large. Little information has been collected for secondary and local government defences. This caused great difficult to the dyke system reliability analysis. Also the confidence in data quality is relatively low.
• In the hydraulic modelling work package (WP6), a lot of simplification and generalisation of the river network have been undertaken. This may have implications for WP7 as follows:
• For the simplified river system, how do we simulate the function of defences along the river?
• Since many river channels have been simplified, a lot of important local information about the defences cannot be represented in the analysis, or it may be difficult to define the location.

43
• Due to generalisation in the hydraulic modelling, practical methods need to be developed to assess whether the dyke will break or not, and where and how it will break.
3.9 Work Package 8: Quantified risk analysis - the Taihu Basin Risk Assessment System (TBRAS)
3.9.1 Objectives and scope The goal of WP8 was to build a GIS-based flood-risk analysis tool, the TBRAS, which integrated the various components of quantified risk analysis established in the preceding work packages, and performed risk calculations for scenario analysis. The functional requirements of the TBRAS include:
• Building connections among WPs 1-8 • Developing a quantitative model that can be used to combine flood
probabilities, flood depths and damages (consequences) to calculate flood risks
• Analyzing and displaying the space-time changes of flood risks in different scenarios
Together, these models formed an ‘end-to-end’ modelling system for flood risk scenario analysis.
3.9.2 Data collection and preparation Datasets for the Taihu Basin were assembled, including the river network, DEM, land use, administrative data (by county and province), dyke data etc. To calculate the flood risk, these data were converted into GIS raster format, with 500m x 500m grid cells.
3.9.3 Building the risk calculation models The flood risk is defined as follows:
dwwDwPRisk )()(0∫∞
=
where, P is probability, D is damage, and w is flood water with a given duration. Methods for assessing the damage (D) for each grid cell were implemented in the TBRAS, and considered the corresponding probabilities of such damage. This requires calculation of the flood depth, flood duration, economic class, economic value, damage rates, and probabilities that includes the inputs from multiple WPs. In order to perform risk calculation and scenario analysis, the TBRAS integrates all the preceding work and models and builds connections. A data flow model is shown in Figure 3.25 and the key technologies for flood depth, damage assessment and probability are described in the following paragraphs.

44
Figure 3.25. Data flows Flood depth and duration Functions have been established to determine the flood depth for each pixel according to floodwater volume for each flood cell by considering elevation and polders. Figure 3.26 shows an example of the calculation procedure of the flood depths in a given event in the flood cells by using artificial floodwater data.
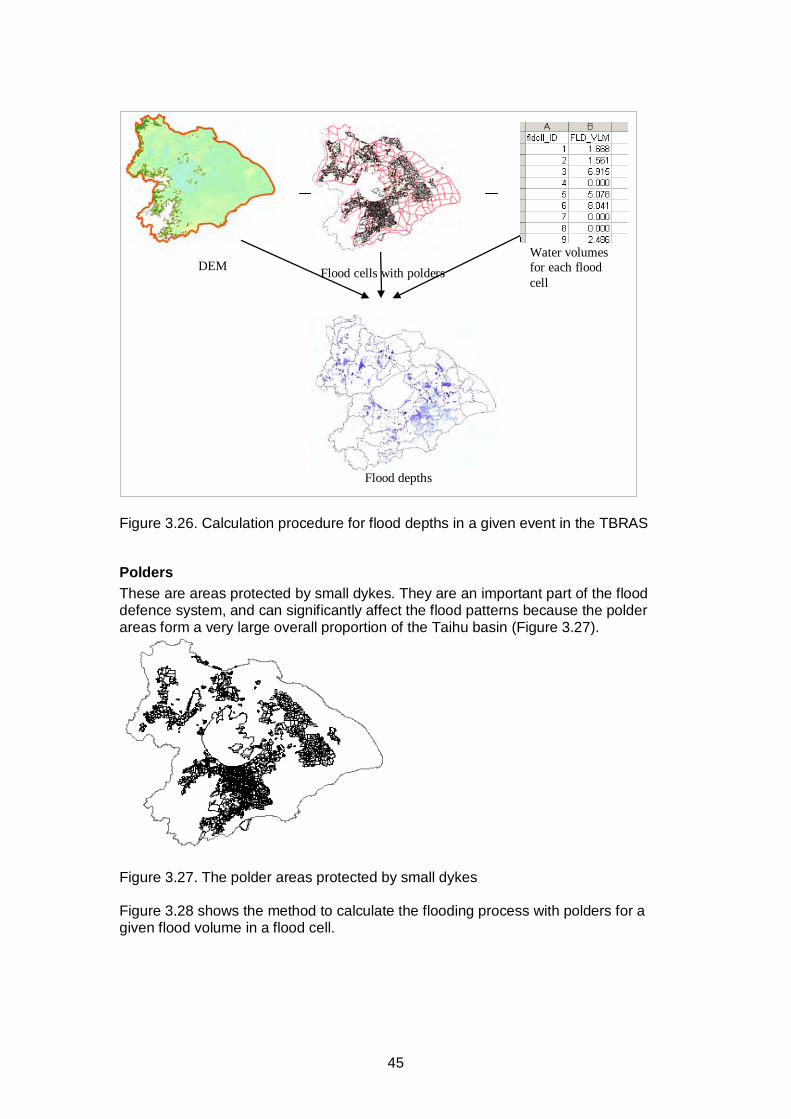
45
Figure 3.26. Calculation procedure for flood depths in a given event in the TBRAS
Polders These are areas protected by small dykes. They are an important part of the flood defence system, and can significantly affect the flood patterns because the polder areas form a very large overall proportion of the Taihu basin (Figure 3.27).
Figure 3.27. The polder areas protected by small dykes Figure 3.28 shows the method to calculate the flooding process with polders for a given flood volume in a flood cell.
Flood cells with polders DEM Water volumes for each flood cell
Flood depths

46
Figure 3.28. a: the area outside the polders; b: the polder areas protected by small dykes; c: the flood cell within which the polders lie, showing floodwater filling area (a) first, and then filling the area (b) when the water level reaches the crest of the small dykes.
Flood risk assessment The flood damage assessment subsystem is based on WP5, as previously described. An event-based approach is used for risk analysis. An annual exceedance probability is associated with each event which is used as the boundary condition to the model that is used to calculate flood depths. The risk is then the integral of the loss-probability curve, which is sampled at 7 different return periods (Figure 3.29).
Figure 3.29. The total average risk is approximately considered as the shaded area
Major dyke alone rivers
Small dyke around towns
Small dyke around towns
Pumping
a a b
c
River channel
Pumping
Overtopping / Breaching

47
3.9.4 User interface Figure 3.30 shows a part of the TBRAS graphical user interface (GUI). It allows automated calculation and visualization of flooded area, damages, and flood risks for both grid cells and administrative units (e.g. county, city, or province). The scenario-analysis functions of urbanization, socioeconomic development, climate changes, land subsidence, defence systems, and damages rates have been implemented in TBRAS.
Figure 3.30 TBRAS user interface: flood risks for counties, cities, and provinces
3.9.5 Results In this chapter the results for validation against the 1999 and 2005 floods are reported, along with the baseline risk calculation with eight typical return periods. The results of scenario analysis are reported in the following chapter.
The 1999 flood event The 1999 flood event was about a 200-year flood. This flood has been used to calibrate the flood depths and damage assessment in the project because the major defence systems had been finished in 1999 and are comparable to the current defence system. In addition to the major defence systems, all levels of governments and communities have continued constructing local small defence systems, including polders that can significantly affect the redistribution of the floodwater (Figure 3.31).

48
Figure 3.31. (a) recorded flooding area in 1999, (b) modelled redistribution of the 1999 floodwater based on current polders and defence systems. It was reported that the 1999 flood caused 14.1 billion Yuan (RMB) of damage over the entire Taihu Lake Basin. TBRAS calculated the damage of the 1999 flood pattern at 12.1 billion Yuan, which is close to the reported damage. The same flood pattern (with 1999 polders) in 2005 will increase damages to 17.6 billion Yuan because of economic development in the intervening years. We also used the polder algorithm to assess the impact of the current polders on flood patterns to calculate the redistribution of the 1999 flood water volumes in each flood cell. The results are summarized in Table 3.12. Case Damages
(Billion Yuan, RMB)
Recorded damage in the 1999 flood 14.1 Calculated damages by TBRAS
The 1999flood pattern, 1999 economic data (1999 polders)
12.1
The 1999flood pattern, 2005 economic data (1999 polders)
17.6
The modelled 1999 flood pattern, 1999 economic data, current polders
10.7
The modelled 1999 flood pattern, 2005 economic data, current polders
15.8
Table 3.12 Damages in the 1999 flood for different economic and flood defence cases
3.9.6 Conclusions of WP8 WP 8 has accomplished the following tasks:
• GIS data collection and processing • GIS database construction • System development of TBRAS • Development of the algorithms for evaluating polders’ impacts on floods
patterns • Spatial visualization of flood depth, economic values, risks, etc. • Calibrating the system with the 1999 flood event • Calculating the baseline flood risks

49
4 Initial results and their implications for flood risk management
In this section we summarise the results of the initial (drivers) runs of the modelling system, discuss their features and what we can deduce from them; set out some initial thoughts on FRM options, make some suggestions for ongoing work and finally summarise the key messages for the Taihu Basin and for the development and application of scenario methods in China.
4.1 Structure of the results
4.1.1 Introduction Any risk assessment of flood damage has several dimensions that need to be understood before the results can be interpreted correctly and key policy decisions can be made. Thus we need to differentiate between assessments of the event damage that characterize particular floods and averages of risk across different floods and temporal periods, the most important of which is the annual average damage, often termed Expected Annual Damages (EAD) at a particular site or area (in the case of the Taihu Basin, the counties). We need to understand these differences because they have different policy implications:
• Understanding potential events and their losses leads to an understanding of the preparedness actions that are needed and the emergency response arrangements that may be required. Other non-structural measures may also be informed by potential event losses, such as forecasting and warning systems, and insurance arrangements.
• Understanding EAD values gives insight into the investment that may be needed over 20, 50 or even 100 years, based on an assessment of these annual losses over that time. Thus this parameter tends to be important when considering structural measures.
Moreover, the calculation of EAD involves assessing the contribution of each of the floods of different return period to the shape of the loss probability curve, which neatly summarizes the hazard from flooding in any one location.
4.1.2 Event loss results In this and other assessments event loss results are derived by calculating the flood extent of particular rainfall events of known return period. This is done by modelling the extent and depths of the flooding in the different 500m x 500m flood cells, and assessing the damage from depth-damage data for the properties and agricultural land within each of those cells. The results for each cell are then accumulated across all such cells in each county and across the whole Basin to give the result for that flood of each return period (Table 4.1). Return period (years) Event losses (Yuan millions) 10 0.5 20 2.2 100 5.2 1000 22 Table 4.1. Example of event losses for floods of different return periods:

50
These are themselves important results, particularly for non-structural measures. In many cases the GIS systems that are used in modern assessments can map the results of flood damage for particular floods, as a way of assessing the nature and scale of the necessary policy and emergency response. In a more comprehensive assessment the indirect effects of floods (traffic disruption; industrial and agricultural losses, etc) would also be included, but in the Taihu Basin work this refinement has not yet been added. Clearly these event losses are a function of the hydraulic characteristics of the channel and defence system, the terrain levels and the type of land use and hence damage potential.
4.1.3 Average flood damage (EAD) assessments These assessments are more complex and can be difficult to interpret, not least because the averages can conceal important differences between flood loss results that have the same EAD because this average is arrived at by very different distributions of event losses. The annual average flood loss summarizes the contribution of each flood of different return periods to the total flood risk at that location (Table 4.2). This contribution is proportionate to the probability of that (event) flood, such that the more frequent floods (return period 10 years) contribute ten times more to that average than do the rarer floods (in this case the 100-year event). Return period (years)
Event losses (Yuan millions)
probability Risk contribution to EAD (Yuan millions)
10 0.5 0.1 0.05 20 2.2 0.05 0.11 100 5.2 0.01 0.052 1000 22 0.001 0.022 Table 4.2. Contribution of each flood of different return periods to the total flood risk. What can be seen from the above table is that the contribution of the rare floods to the EAD is small in relation to the more frequent floods, even though those more frequent floods have lesser event loss figures. This is normal, but often misunderstood. Graphing event losses against probability gives the loss-probability curve. These curves have a characteristic upwards concave shape, and departures from this shape should elicit queries as to data, methodology or programming errors. Several issues are important in interpreting these different results:
• Floods of higher return period should always give event losses greater than those floods of higher probability and hence lesser return period.
• Loss probability curves should always be constructed from the results of several flood events (>5) as otherwise EAD values will be badly distorted.
• The “centre of gravity” for EAD values is normally in the 30-50 year return period range, rather than at higher return periods.
• Accurate assessments of the return period at which damage begins and the loss values for the lower return period events is therefore vital if EAD values are to be valid. This is often misunderstood and too much emphasis given to the results for the 100 and 1000 year events, which in fact generally contribute small amounts to EAD values.

51
4.2 Summary of runs carried out and results The runs reported in this summary report are all ‘driver’ runs. The runs and the key results are summarised below in Figure 4.1. In this figure ‘CC’ indicates the climate change scenario, SE the socio-economic scenario and SL the sea-level rise scenario used. The first two runs compare losses under the baseline present-day conditions in 1999 and 2005. The second group of four runs were carried out with 2030 and 2050 socio-economic drivers alone and the next group of 3 runs with 2050 climate change drivers alone. These allow us to understand the relative importance of socio-economics and climate change as drivers of future flood risk. The reality, however, is that they will not act alone, and in the next 4 runs they are combined. In the final 2 runs sea-level change has been further added into the set of future drivers of flood risk. These are “driver” runs, with the flood defence system assumed to be in its baseline condition in all cases. This does not imply that no future action will be taken by TBA and MWR, but is adopted merely as a convenient baseline against which to compare the impact of future flood risk management interventions or responses.
Figure 4.1. Summary of runs and results. To facilitate discussion the results are also shown (Figure 4.2) as ratios of the 2005 baseline EAD:
0
5
10
15
20
25
30
35
40
45
50
A2 (S-E) B2 (S-E) A2 (S-E) B2 (S-E) A2 (C-C) B2 (C-C) +5% rainfall
A2 (CC)/ A2 (SE)
B2 (CC)/ A2(SE)
B2 (CC) / NP(SE)
+5% rainfall /
NP A2 (CC)/ A2 (SE)
A2 (CC)/ NP(SE)
Baseline 1999
Baseline 2005
2030 changes socio-economic
only 2050 changes
socio-economic only
2050 changes climate change (rainfall) only
2050 changes combined 2050 changes combined plus SL
rise
EAD (billion Yuan)
No breach Breach
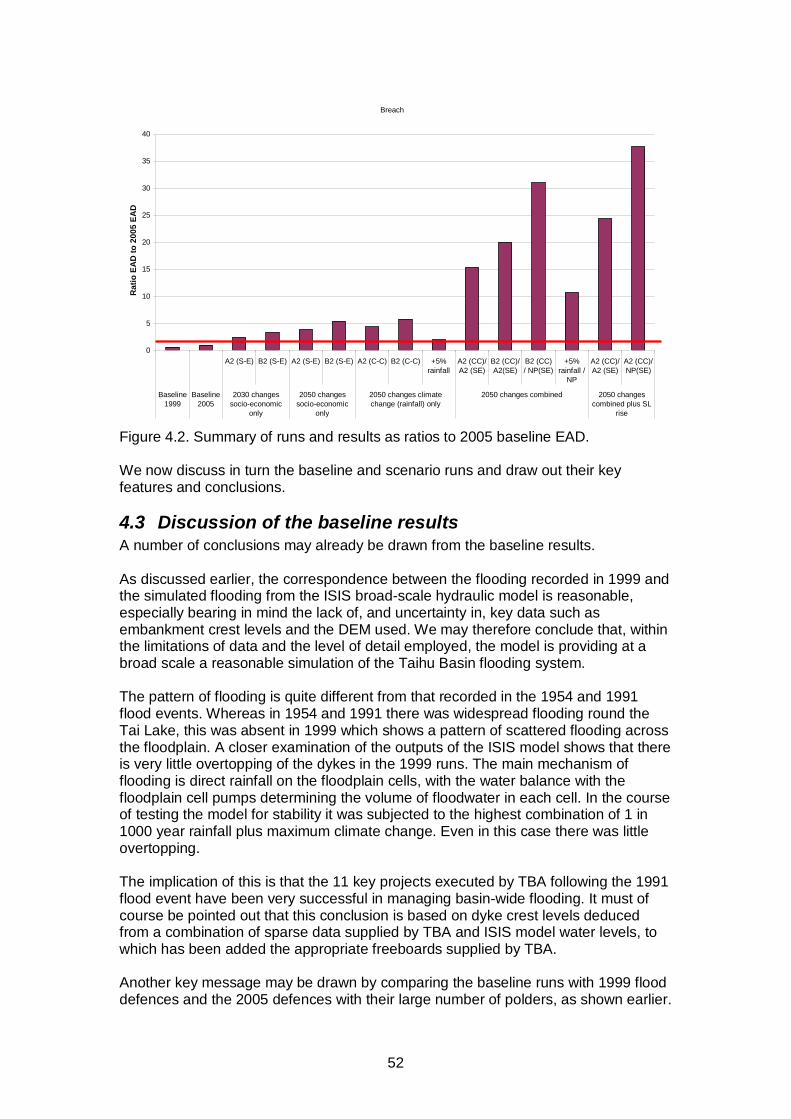
52
Breach
0
5
10
15
20
25
30
35
40
A2 (S-E) B2 (S-E) A2 (S-E) B2 (S-E) A2 (C-C) B2 (C-C) +5%rainfall
A2 (CC)/A2 (SE)
B2 (CC)/A2(SE)
B2 (CC)/ NP(SE)
+5%rainfall /
NP
A2 (CC)/A2 (SE)
A2 (CC)/NP(SE)
Baseline1999
Baseline2005
2030 changessocio-economic
only
2050 changessocio-economic
only
2050 changes climatechange (rainfall) only
2050 changes combined 2050 changescombined plus SL
rise
Rat
io E
AD
to 2
005
EAD
Figure 4.2. Summary of runs and results as ratios to 2005 baseline EAD. We now discuss in turn the baseline and scenario runs and draw out their key features and conclusions.
4.3 Discussion of the baseline results A number of conclusions may already be drawn from the baseline results. As discussed earlier, the correspondence between the flooding recorded in 1999 and the simulated flooding from the ISIS broad-scale hydraulic model is reasonable, especially bearing in mind the lack of, and uncertainty in, key data such as embankment crest levels and the DEM used. We may therefore conclude that, within the limitations of data and the level of detail employed, the model is providing at a broad scale a reasonable simulation of the Taihu Basin flooding system. The pattern of flooding is quite different from that recorded in the 1954 and 1991 flood events. Whereas in 1954 and 1991 there was widespread flooding round the Tai Lake, this was absent in 1999 which shows a pattern of scattered flooding across the floodplain. A closer examination of the outputs of the ISIS model shows that there is very little overtopping of the dykes in the 1999 runs. The main mechanism of flooding is direct rainfall on the floodplain cells, with the water balance with the floodplain cell pumps determining the volume of floodwater in each cell. In the course of testing the model for stability it was subjected to the highest combination of 1 in 1000 year rainfall plus maximum climate change. Even in this case there was little overtopping. The implication of this is that the 11 key projects executed by TBA following the 1991 flood event have been very successful in managing basin-wide flooding. It must of course be pointed out that this conclusion is based on dyke crest levels deduced from a combination of sparse data supplied by TBA and ISIS model water levels, to which has been added the appropriate freeboards supplied by TBA. Another key message may be drawn by comparing the baseline runs with 1999 flood defences and the 2005 defences with their large number of polders, as shown earlier.

53
As noted earlier, the message in this case is that the polders, while protecting the enclosed areas, have transferred flood risk to the unprotected areas. Finally we compare in Figure 4.3 the average annual flood damage with the TBRAS set with either the no-breach or with-breach options. Figure 4.3. Comparison of Baseline EAD, No-Breach and Breach cases. The key message from this is that breaching, particularly of the lower-standard dykes, is potentially a large source of flood risk. The data is uncertain, but the conclusion does not disagree with the TBA report on the 1999 flooding, which records a number of defence breaches. In investigating the circumstances surrounding this issue we also noted that concerns about dyke security could inhibit sluice operations and result in the flood cell pumps being run at reduced capacity. This is therefore an issue which on several grounds deserves priority investigation. We now go on to examine the climate change and socio-economic driver results and to discuss the overall credibility of the results.
4.4 Climate change scenario results Figure 4.2 shows increases in flood risk owing to climate change (precipitation) of approximately 4 or 5 times. This might seem surprising given that the increases in precipitation are of the order of 20%, and for this reason an extra run was carried out with a 5% increase in precipitation, in line with that suggested by some results from the Australian CSIRO climate model. The explanation lies in the large shift in frequency of a flood of a given magnitude which results from a small change in its magnitude. This is illustrated by the example reproduced below from a catchment in England (Figure 4.4).
0
0.2
0.4
0.6
0.8
1
1.2
1.4
Baseline 1999 Baseline 2005
EAD
(bill
ion
Yuan
)
No breachBreach

54
Figure 4.4. Shift in flood frequency owing to climate change in a catchment in England; the current flood frequency is shown in black, with the future condition in red. It can be seen that a small increase in magnitude of precipitation increases the frequency of a given flood event by a factor of 2 or 3. Because flood risk is defined as frequency x consequences, this increase is reflected directly in the flood risk results. In the Taihu even a 5% increase in rainfall increases flood risk from this driver alone by a factor of 1.98.
4.5 Socio-economic scenario results In this section the A2 and NP (National Plan) socio-economic scenarios are considered in order to compare the flood risk changes caused, in relation to the baseline situations, by the projected socio-economic change to 2030 or 2050 when holding other parameters such as climate and its rainfall volumes constant. The modelled flood risk for different socio-economic scenarios is shown in the two charts which follow. Both show the changes in risk in different ways. The first (Figure 4.5) shows change in Expected Annual Damages (these are the first six pairs of results from Figure 10.1, re-presented here for convenience), whilst the second (Figure 4.6) gives the results as multiples of the 2005 EAD and in relation to comparable Gross Domestic Product (GDP) values for the study region.
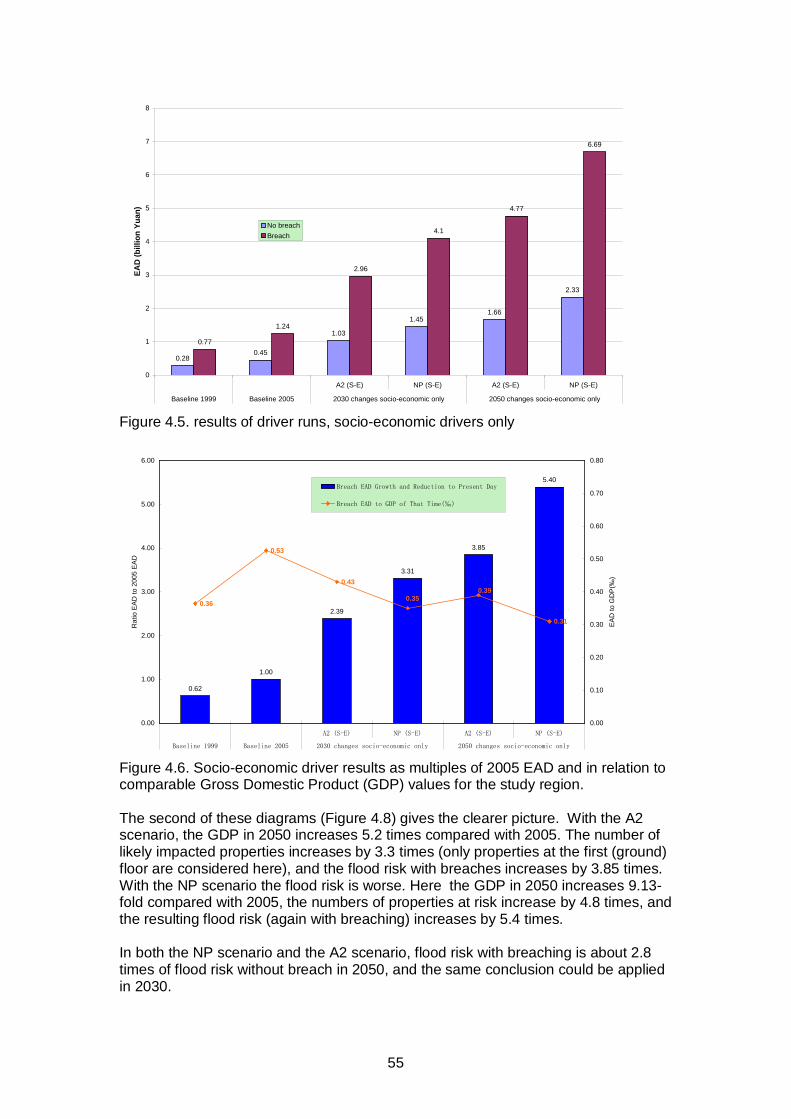
55
0.280.45
1.03
1.451.66
2.33
0.77
1.24
4.1
4.77
6.69
2.96
0
1
2
3
4
5
6
7
8
A2 (S-E) NP (S-E) A2 (S-E) NP (S-E)
Baseline 1999 Baseline 2005 2030 changes socio-economic only 2050 changes socio-economic only
EAD
(bill
ion
Yuan
)
No breachBreach
Figure 4.5. results of driver runs, socio-economic drivers only
0.62
1.00
2.39
3.31
3.85
5.40
0.36
0.53
0.43
0.31
0.350.39
0.00
1.00
2.00
3.00
4.00
5.00
6.00
A2 (S-E) NP (S-E) A2 (S-E) NP (S-E)
Baseline 1999 Baseline 2005 2030 changes socio-economic only 2050 changes socio-economic only
Rat
io E
AD to
200
5 EA
D
0.00
0.10
0.20
0.30
0.40
0.50
0.60
0.70
0.80
EAD
to G
DP(
‰)
Breach EAD Growth and Reduction to Present Day
Breach EAD to GDP of That Time(‰)
Figure 4.6. Socio-economic driver results as multiples of 2005 EAD and in relation to comparable Gross Domestic Product (GDP) values for the study region. The second of these diagrams (Figure 4.8) gives the clearer picture. With the A2 scenario, the GDP in 2050 increases 5.2 times compared with 2005. The number of likely impacted properties increases by 3.3 times (only properties at the first (ground) floor are considered here), and the flood risk with breaches increases by 3.85 times. With the NP scenario the flood risk is worse. Here the GDP in 2050 increases 9.13-fold compared with 2005, the numbers of properties at risk increase by 4.8 times, and the resulting flood risk (again with breaching) increases by 5.4 times. In both the NP scenario and the A2 scenario, flood risk with breaching is about 2.8 times of flood risk without breach in 2050, and the same conclusion could be applied in 2030.

56
The flood risk in the NP scenario is greater than flood risk under the A2 Scenario because the economy of the study area develops more quickly under the NP scenario. However, as Figure 4.6 shows, the flood risk in relation to the regional GDP (i.e. as a percentage of that total) under the NP scenario is lower than that under A2 scenario. Indeed under both scenarios, the rate of rise of flood risk is greater than the increase in the number of properties at risk, but not as great as the increase in GDP. This may be owing to the new properties being concentrated within the polders or on the slightly higher ground, with somewhat lower flood probabilities. The exact reasons for this should be analysed further in order to provide information for future land development and flood risk management. To summarise the key points here, we see rates of risk increase in the future by between 3.8 times (the A2 socio-economic scenario) and 5.4 times (the National Plan socio-economic scenario) when modelling just the effects of socio-economic changes (i.e. keeping climate constant) Clearly these are high rates of growth in flood risk, illustrating the dynamic nature of the economy of the Taihu basin and the effect that this otherwise welcome characteristic is likely to have on flood risk.
4.6 Overall credibility of the results, including comparison with UK Foresight
We have discussed in previous sections the baseline, socio-economic and climate driver runs but in this section we consider the build-up of the combined risk growth factors and compare the Taihu results with the well-validated results, based on good level and other data, from the UK Foresight project and follow-up analyses carried out by the UK Environment Agency. The first issue is whether the modelled impact of breaching is realistic. While the fragility curves which go into the calculation are based on wide EU research in the FLOODsite project (www.floodsite.net), the data on the Taihu dykes is very sparse. The calculation is however backed up by the reference in the TBA analysis of the 1999 event to a considerable number of breaches. We believe, therefore, that the results are sufficiently realistic and worrying to justify a major effort in data-gathering and analysis, and subsequent consideration in future FRM planning for the Basin. The second issue concerns the interaction of the socio-economic and climate change drivers in arriving at the combined future risk. As we have seen above, socio-economic growth by 2050 will result in risk increase factors of 3.8-5.4 times. The increases in risk due to climate change alone are of the same order as this. It is incorrect to consider rises in flood risk from individual drivers in isolation, as in reality they will happen together. When the socio-economic and climate change factors are combined their effect is geometric, as risk is a product of probability and consequence, so the factors of increase on probability (climate change) and consequence (socio-economic change) simply multiply. Thus for combined precipitation and socio-economic change the increase in risk is of the order of 15-30 times. While logically justified these values might be seen as surprisingly high. One way of assessing whether they are realistic is to compare them with the figures which emerged from the 2004 Foresight project in the UK. Here, with earlier technology, we were not able to analyse the socio-economic and climate change drivers separately, but calculated the combined increases in risk shown below (Figure 4.7).

57
Figure 4.7. Growth in flood risk from UK Foresight project (2004) for four scenarios. Of the four scenarios used in the UK, World Markets is perhaps closest to the Taihu Basin scenarios, and was calculated to give a growth in risk by the 2080s of 21 times for river and coastal flooding. This used the IPCC A1F1 climate change scenario, which had an average change in precipitation over the UK of 15%, going up to 30% in some areas. These increases are comparable with those in the A2 climate change scenario used on the Taihu. The socio-economic scenario for the UK was a high-growth one, but the rate for the UK was only 3.5% per year, much lower than in the case of China. It is not therefore surprising, and is indeed entirely consistent, to have flood risk growth multipliers in the case of the Taihu for combined socio-economic and climate change drivers of 15 to 30 times. With sea-level change added the combined multipliers rise to 25 to 35 times. The Taihu results for combined socio-economic and climate change are therefore consistent with results from the UK which are supported by much better data. As a sensitivity check on this we also carried out a single run combining the NP socio-economic scenario with a 5% increase in precipitation. This still gave a combined risk multiplier of 10. It might be asked “which of these should we believe?” This would however be missing the point of scenario analysis, and its essential difference from older approaches using forecasts. In the former no probabilities are attached to particular scenarios nor are any preferences expressed - we have neither the socio-economic or climate change tools to forecast 30 or 50 years into the future in this way. Instead, the idea is to construct a number of possible alternative future scenarios and to assess the size and nature of flood risk that could result for each. In so doing, it is possible to gain a broad appreciation of the scale of future risks that may occur and the degree of policies of investment and adaptability that are needed in future flood risk management. In the spirit of this the 5% climate change scenario should be regarded as merely another scenario which might happen, not an alternative or preferred forecast. A further point to note is that these baseline scenario runs assume that the Chinese government will continue simply to maintain the flood defences at their present heights, locations and conditions. This is obviously not true, but is taken purely as a

58
simple reference case against which to compare the impacts of different drivers and responses of future flood risk.
4.7 Establishing and explaining differences between qualitative and quantitative analysis
It was envisaged that during the closing stages of the project the final task of Work Package 1 would be to facilitate reconciliation between the qualitative and quantitative analyses to ensure that the results of the two approaches are consistent and compatible (Harvey et al, 2009). At the present stage of analysis under the quantitative part of the project it is not possible to provide a comprehensive comparison of the effect of drivers and responses. However, some initial comments can be made. Of greatest significance is the magnitude of the increases in flood risk which have been assessed with the ISIS and TBRAS models. The modelling showed that both plum rain changes and economic development/urbanisation would each on their own have impacts of about 5 times. This is generally consistent with the experts estimates of the impact of these effects being High (about 8 times present day), but with a high uncertainties (climate change and socio-economic from 6 times to 10 times) It is important to appreciate that these increases in flood risk are a significant change from what some writers in China had previously expected. For example, Zhu (1994) had estimated that the effect of a sea level rise of 40cm would only be to increase flood risk by 10%, whereas model runs suggest that the increase is more like 50%. As noted earlier the key factor is the way in which a relatively small increase in a parameter like mean sea levels can increase much more sharply the frequency of a given event. As noted earlier the resulting effect on the average annual economic damages (flood risk) of this change is multiplicative and significant. A further emerging consideration was the way in which the Chinese experts took the view that there were strong dependencies within the climate change and socio-economic driver groups, but do not identify any dependencies between the groups. As a result it became clear that the impact of the two driver groups, each taken as a whole, were evaluated largely independently from one another. Hence it was unsurprising that, when evaluated together in the quantitative analysis, increases in flood risk due to socio-economic and climate change effects were multiplicative (25-35 times increases in flood risk) when compared with the increases arising when these driver groups were acting on their own (~5 times increases) Further analysis, based on the relationships between the drivers in a driver group, will be required to establish how co-dependent are the impacts on flood risk from individual drivers within a driver group.
4.8 Possible responses: an adaptive approach to FRM planning
A number of response options may be discerned already from the initial set of driver runs carried out to date. These are set out below.
• Option 1. This option would correspond to the baseline case, in which TBA would continue to merely maintain the defence assets at their present heights, locations and conditions. The result would be the high increases in flood risk, under all socio-economic and climate change scenarios, noted above. This option is listed merely as a reference point.

59
• Option 2. We have noted above the big differences in risk between the breach and no-breach defence cases. While based on generic EU data we believe that there is some foundation in this, backed up by the recorded breaching experienced in 1999 in the Taihu. If this were investigated and implemented a considerable decrease in risk might result, bringing it perhaps down to near the no-breach risk levels. In addition increased confidence in the security of the dykes would permit the Taihu outlet sluices to be operated with more freedom and the flood cell pumps to be run at full capacity. This might necessitate some selective dyke raising, and the full option would therefore consist of regulating the dyke heights, increasing dyke strength and implementing revised pump and sluice operating rules. This would result in a further reduction in all current and future risks, which could be assessed using the current TBRAS modelling system. It should be noted that this might require an increase in the remit of the TBA to give it supervisory powers over all flood defences, whether owned by itself or others. This option might be selected for implementation alongside the current TBA plans for strengthening of the defence system in their current phase of improvement planning.
• Option 3. A further option would be to increase dyke levels and associated structure capacities to keep pace with climate change precipitation
• Option 4. A higher option following on from PR2 would be to increase the capacity of the defence system in order to hold risk at present day levels. This would necessitate further increases in defences in order to counteract increases in risk driven by socio-economic drivers.
• Option 5 might be the implementation of non-structural responses, including improved forecasting and emergency response. This would also include introducing a system of land use development control, whereby certain areas are zoned for development and other areas are reserved for flood absorption, with no flood-sensitive development permitted.
Similar sets of options could be constructed for the management of typhoon-rain risk and storm surge risk. The modelling system is capable of investigating such scenarios, though this would necessitate the preparation of suitable boundary condition sets for the hydraulic model. These options should not be seen as mutually exclusive. Instead an adaptive approach might be taken. In this the socio-economic and climate drivers are monitored and options are implemented in advance of rises in risk. Thus, FRM planning anticipates risk increases in advance rather than reacting to flood events, but adapts the option selection and speed of implementation to the rate of change and characteristics of risk. This is supported by regular monitoring and periodic re-runs of the scenario analysis system to support the decision-making process. This is illustrated graphically in Figure 4.8.

60
Figure 4.8. Adaptive approach to future flood risk management (from Defra 2006)
4.9 Summary of implications of the baseline driver results Here we summarise the key messages discussed above:
• The project has demonstrated concepts of risk-based decision-making so that decisions are made on the basis of future probabilities and consequences rather than past events;
• It has demonstrated the use of scenario analysis, so the implications of possible future changes such as climate change and socio-economic change, can be analysed and communicated to decision-makers;
• It has demonstrated that a broad-scale approach to hydrological and hydraulic modelling can combine the necessary speed of computation with an accuracy which is sufficient for large-scale long-term planning. Within the limitations of data, the hydrological/hydraulic modelling system is providing at a broad scale a reasonable simulation of the Taihu Basin flooding system.
• It has shown how understanding potential event losses leads to an understanding of the preparedness actions that are needed, the emergency response arranges that may be required, and other non-structural measures; similarly, understanding annual average flood loss values gives insight into the investment that may be needed over 20, 50 or even 100 years.
• The 11 key projects executed following the 1999 flood event have been very successful in managing basin-wide flooding. The present main mechanism of flooding is direct rainfall on the floodplain cells, with the water balance with the floodplain cell pumps and gravity sluices determining the volume of floodwater in each cell.
• The city polders, while protecting the enclosed areas, have transferred flood risk to the unprotected areas.
• Breaching, particularly of the lower-standard dykes, is potentially a large source of flood risk. Concerns about dyke security also affect sluice operations and result in the flood cell pumps being run at only half capacity. This is therefore an issue which on several grounds deserves priority investigation.
• The Taihu results for combined socio-economic and climate change, while showing very large growth under the baseline FRM scenario, are consistent with results from the UK which are supported by much better data and more accurate models.

61
• The overall potential increase in flood risk, by 25-35 times by the 2050s, similar to the values accepted by UK government as a basis for future flood risk management expenditure, presents, as in the UK, a serious threat to prosperity and life.
• An adaptive approach to FRM planning is suggested. In this the socio-economic and climate drivers are monitored and options are implemented in advance of rises in risk.
• In particular basin-wide dyke assessment and reinforcement should be considered for implementation alongside current TBA planning for strengthening the flood defence system.
• Future UK –China collaboration is suggested both on short-medium term implementation of the existing set of models and in longer-term scientific cooperation.

62
5 Conclusions and recommendations The multi-disciplinary China-UK scientific co-operation project, Scenario Analysis Technology for Flood Risk Management in the Taihu Basin, has made significant progress in the past three years. Learning and assimilating experience from the UK’s Foresight Future Flooding project, joint efforts have been directed at the analysis of flood risk drivers, and the importance and sustainability of potential management responses to changing flood risk in the basin. Potential changes in climate, socio-economic development and rapid urbanization, and structural flood defence systems have been considered comprehensively, and their impacts on the hydrological and hydraulic features of flooding and flood damages in the basin examined. A prototype broad scale, long term ‘end-to-end’ modelling system for GIS-based flood scenario has been developed. Furthermore, the project has trained professionals, accumulated technical experience and established a sound foundation for the project in the next phases.
5.1 Increasing understanding of the significance of the Foresight Future Flooding.
When the experts from UK introduced the outcomes of their Foresight Future Flooding project in 2005, we did not capture the essential meaning of the word “foresight”. In fact, “technology foresight” is not about predicting what will happen in the future, but instead aims to identify uncertainties in drivers and responses under different possible future contexts of social, economic, environmental and technical development over the coming decades. This approach allows potential future socio-economic demands to be transformed into drivers for new technical research and development. In 2002, the UK took the initiative to apply the philosophy of technology foresight to the field of future flooding research, which offered quantitative outcomes of scenario analysis for future changes in flood risk and played an important role in promoting the adjustment of current strategies of flood management in the UK for sustainable development. China is currently experiencing rapid socio-economic development and is faced with flood risks arising from a large number of drivers. In order to cope with the severe challenges arising from this and to ensure the adjustment of current strategies in river basin flood management that may meet the needs of sustainable development in the future, there is an urgent need to carry out foresight studies of future flooding as a fundamental and strategic research programme.
5.2 Exploring a viable and realistic approach to research on foresight future flooding according to the situation in China.
The UK’s experience from the Foresight Future Flooding project is very valuable, and the application of the framework within the Taihu Basin provides an assessment of the transferability of the original UK methodology within a different socio-political, economic and environmental context.

63
For instance, the Source-Pathway-Receptor (SPR) model provides a well-established framework for flood risk assessment in the UK, in which Pathways are the mechanisms that convey floodwaters that originate as weather events to places where they may impact on receptors. Pathways therefore include fluvial flows in or out of river channels, overland urban flows, coastal processes and failure of fluvial- and sea-defence structures or urban drainage systems. However, in the Taihu Basin, along with the rapid socio-economic developments, the large scale construction of the structural system of flood defence is still an urgent demand. In line with current approaches in China, a Source-Hazards-Capacities-Receptor (SHCR) model is, therefore, used instead of SPR. In the SHCR model, Hazards are factors of flooding, such as inundated area, duration and distribution of water depth, and the Capacities relate to capacities in flood management including flood control capacity, emergency response capacity and so on. Other examples include the methodologies for the flood damage and reliability assessments. In the UK, the overall availability of reasonable data can meet the needs of advanced models. However, in developing countries, there are still issues associated with collecting the necessary data, meaning that significant work is involved in ensuring that models are reliable.
5.3 Main outcomes and progress A number of detailed conclusions have been noted in Section 3 under each Work Package. Here we summarise the key outcomes:
• A framework of flood risk drivers and responses has been established, including the identification of the similarities and differences in the perception of the Flooding System between China and the UK. A Source-Hazards-Capacities-Receptor (SHCR) model has been used instead of Source-Pathway-Receptor model according to the situation and custom in China. Flood risk drivers have been ranked in terms of importance in driving flood risk and uncertainty of impact, and management responses have been ranked in terms of their ability to mitigate flood risk and their sustainability.
• The capacity of the regional climate model PRECIS to simulate climate change in the Taihu Basin has been verified.
• A VIC hydrological model has been developed that is able to generate the runoff from mountain area as boundary conditions for the hydraulic model. A simple scaling procedure has been used to generate continuous seasonal rainfall inputs for the broad-scale model of the floodplain, based on the 1999 spatial and temporal pattern of precipitation. Further scaling has been applied to obtain corresponding inputs uplifted for the two climate change scenarios
• Socio-economic scenarios (2020-2050) have been derived for the future flood risk analysis in Taihu Basin corresponding to the climate change scenarios (A2, B2) and the National Programmes scenario (NP).
• A flood damage assessment model has been developed that offers a technical tool for future flood risk analysis, based on existing research in China and the UK, which is appropriate to the nature of flooding in Taihu Basin, available data, and the requirement for a broad-scale and long-term assessment of flood risk in the basin.
• A broad scale hydraulic model is developed on the basis of the TBA HOHY2 model and the ISIS system to meet the needs of flood risk analysis in the Taihu Basin.
• The value of the reliability analysis of the dyke system has been well recognized, and efforts have been made to collect data on structural flood and

64
coastal defences and past cases of dyke breaches that may assist the reliability analysis of the dyke system. With the help of UK experts, classification for individual defences and initial transferable fragility curves have been developed.
• A GIS-based flood risk analysis system has been developed to calculate the risk of flooding based on the information provided by models developed in other work packages.
5.4 Issues yet to be solved and recommendations Significant progress has been made, but as a result of the complexities of the project, there are still some issues to be resolved:
• The Drivers/Responses analysis should be carried out for distinct periods of
time. Due to the rapid process of socio-economic development in the basin, the drivers that change the flooding system in the basin will vary with different time horizons. Some of them may be reduced, while others may be amplified. Furthermore, new drivers may emerge in the future and some drivers of flood risk may be the result of other factors. We must accurately identify the real sources of the drivers in order to implement effective responses. Thus, the Drivers/Responses analysis for future flood risk in the basin should be extended further to provide more evidence for the scenario analysis. Based on the present work, it is suggested that drivers and responses analysis should be carried out for some discrete periods of time, such as 1991, 1999, 2010, 2020, 2030 and 2050.
• The dependability of the outcomes of PRECIS should be improved. The impacts of climate changes on flood risk in the basin are very significant. The present PRECIS has been verified by data from 1961-1990 due to data availability limitations. However, two large floods occurred in 1991 and 1999 in the basin. The 1990s is also the decade of strong evidence of the rise of global air temperature rise. More recently, the base period for climate models has been extended to 2000 globally. If possible, the base period for PRECIS should therefore be extended from 1990 to 2000 to improve the reliability of climate change prediction.
• The VIC hydrological model should be improved further. In scenario analysis of future flooding, the hydrological model plays an important role in transferring the impacts of climate change into runoff characteristics, to provide realistic boundary conditions for running the broad scale hydraulic model. At present, 7 parameters in the model have been calibrated on the basis of climate zone and the spatial distribution of soil types. It is necessary to identify their physical meanings in more detail, using remote sensing data to delineate the spatial distribution of the parameters in the basin hydrological model. The validity of the model should be verified using more observed data to distinguish the impacts of dam operation and water abstraction. In addition, a more comprehensive routing scheme should be developed that considers the impacts of human activities on runoff in river network regions.
• The scaling procedure for generating rainfall profiles for different return periods and climate change scenarios while useful is crude. However, as we have noted earlier the notion of driving the simulation by “real” precipitation events rather than statistical abstractions is attractive; event results provide another layer of useful information over and above that provided by, for instance, statistically expected values of flood impacts. There is therefore much attraction in placing the idea in a proper statistical framework.
• Some key variables associated with future socio-economic scenarios need to be downscaled to county (district) level to assess the flood damages. At
65
present, there are only statistics data at city level for all the indicators involved in property evaluation. In order to improve the precision of the final evaluation of flood damages, it is necessary to survey 2-3 representative towns in the basin to get sample statistics of some key indexes at county level.
• The flood damage assessment model of the Taihu Basin should be refined further. The flood damage assessment is a key step for future flood risk analysis. In order to improve the availability and reliability of the model, it is necessary to carry out a pilot survey in typical counties and to substantiate the flood damage assessment database to obtain better evidence for the flood stage-loss relationships in light of the type of flooding and the type of property.
• The broad scale hydraulic model should be developed further to meet the needs of future flood risk analysis. Simulation of flooding in the future scenarios is a sticking point in the project. ISIS offers an important technical tool for a broad scale hydraulic analysis, but it is hard to simulate the phenomena of overflow and intra-urban flooding and scenarios required by drivers and responses analysis. ISIS can be linked to 2-d models using the OpenMI interface, and such a link with the IWHR unstructured grid 2-d model offers considerable promise.
• A practical methodology for reliability analysis of dyke system should be explored further. The reliability analysis may help to judge the potential location of dyke breaks for the flood risk analysis but demands good datasets. More data are required, especially for the secondary and minor defences. Methods to combine the analysis with the broad scale hydraulic model and to determine the geometric nature of dyke breaches still need to be investigated.
• The GIS-based Taihu Basin Flood Risk Analysis System has proved very useful. Future scenario-based flood risk analysis for the Taihu basin involves a series of factors in climate change, social and economic development, and construction of structural flood defences, which involve manipulation of very large data sets. Automation of this using functions based on GIS should be developed further to speed this up and reduce the effort required.
• In order to implement the results of the project, it is necessary to enhance the cooperation with TBA and relevant units around the scenario analysis work and to increase financial support, which may ensure successful outcomes of the project valuable to the promotion of flood management in the basin.
Altogether, a large number of difficulties, expected and unexpected, have been overcome in carrying out the project. The advanced philosophy and practical experience have been transferred successfully from the UK Foresight Future Flooding project to the Taihu project. An initial framework of flood risk scenario analysis technology has been formulated that provides a sound foundation for further work including Responses analysis. The China-UK Scientific Co-operation project has so far proved a highly effective means of communicating UK developments in flood risk assessment, adapting methods and concepts, and addressing the different sets of flood risk drivers and responses which are relevant to the Taihu Basin. This has been achieved primarily through the establishment of networks of research partners and the bringing together of stakeholders from national and local government, academic institutions and research institutes. With further effort the practicability of the Taihu Basin Flood Risk System can be enhanced in further phases of the work, taking into full account the complexity of the flooding system in the basin.

66
References
Arnell, N. W. and Chatterton, J. (2007) Reducing flood losses. In Thorne, C.R., Evans, E. P. and Penning-Rowsell, E. (Eds.), Future Flooding and Coastal Erosion Risks. London: Thomas Telford. Carter T R, Parry M L, Harasawa H, and Nishioka S. 1994. IPCC Technical Guidelines for Assessing Climate Change Impacts and Adaptations. Geneva: Intergovernmental Panel on Climate Change. Chen, L. X., Li, W. L., Zhu, W. Q., Zhou, X. J., Zhou, Z. J. and Liu, H. L. (2006) Seasonal trends of climate change in the Yangtze Delta and its adjacent regions and their formation mechanisms. Meteorology and Atmospheric Physics 92 (1-2): 11-23. Djen, C. S. (1992) The urban climate of shanghai. Atmospheric Environment 26B (1): 9-15 Chen, X. and Zong, Y. (1999) Major impacts of sea-level rise on agriculture in the Yangtze delta area around Shanghai. Applied Geography 19 (1): 69-84. Department of the Environment, Transport and Regions, Environment Agency, Institute for Environment and Health (2000) Guidelines for environmental risk assessment and management, The Stationery Office, London. Defra, 2005. Making space for water Taking forward a new Government strategy for flood and coastal erosion risk management in England. Defra, London Defra (2006). Flood and Coastal Defence Appraisal Guidance. FCDPAG3 Economic Appraisal. Supplementary Note to Operating Authorities – Climate Change Impacts Evans, .EP., Ashley, R., Hall, J., Penning-Rowsell, E., Sayers, P., Thorne, C. and Watkinson, A. (2004) Foresight Future Flooding, Volume I and Volume II. Office of Science and Technology, London. Evans, E.P., Wicks, J.M., Whitlow, C.D., and Ramsbottom, D.M., 2007 The evolution of a river modelling system. Proc ICE, Water Management 160, March 2007 Issue WM1, pp 3–13. Evans, E.P., Simm, J.D., Thorne, C.R., Arnell, N.W., Ashley, R.M., Hess, T.M., Lane, S.N., Morris, J., Nicholls, R.J., Penning-Rowsell, E.C., Reynard, N.S., Saul, A.J., Tapsell, S.M., Watkinson, A.R., Wheater, H.S. (2008) An update of the Foresight Future Flooding 2004 qualitative risk analysis. Cabinet Office, London. Gaffin, S. R., R. C. Rosenzweig, X. Xing, G. Yetman, 2004. Downscaling and geo-spatial grid of socioeconomic projections from the IPCC Special Report on Emissions Scenarios (SRES), Global Environmental Change, 105-1233. Green, C. H. and Penning-Rowsell, E. C. (2007) Socio-economic drivers, cities and science. In Future Flooding and Coastal Erosion Risks, Thorne, C.R., Evans, E. P. and Penning-Rowsell, E. (Eds.). Thomas Telford: London. Hall, J.W., Dawson, R.J., Sayers, P.B., Rosu, C., Chatterton, J.B. and Deakin, R. (2003) A methodology for national-scale flood risk assessment. Water and Maritime

67
Engineering, 156(3), 235–247. Harvey, G., Thorne, C.. Cheng, X., Evans, E., Han, S., Simm, J. and Wang, Y. (2009) Qualitative analysis of future flood risk in the Taihu Basin, China. J Flood Risk Management, 2, 85-100. Hulme, M., Jenkins, G.J., Lu, X., Turnpenny, J.R., Mitchell, T.D., Jones, R.G., Lowe, J., Murphy, J.M., Hassell, D., Boorman, P., McDonald, R. and Hill, S. (2002) Climate Change Scenarios of the United Kingdom: The UKCIP02 Scientific Report. Tyndall Centre for Climate Change Research, School of Environmental Sciences, University of East Anglia, Norwich, UK. 120pp. IPCC, 2007: Climate Change 2007: Synthesis Report. Contribution of Working Groups I, II and III to the Fourth Assessment Report of the Intergovernmental Panel on Climate Change [Core Writing Team, Pachauri, R.K and Reisinger, A. (eds.)]. IPCC, Geneva, Switzerland, 104 pp. Jones, R.G., Noguer, M., Hassell, D.C., Hudson, D., Wilson, S.S., Jenkins, G.J. and Mitchell, J.F.B. (2004) Generating high resolution climate change scenarios using PRECIS, Met Office Hadley Centre, Exeter, UK Junfeng, G., Lorenx, K., Tong, J. and Wang, R. (2003) Flood risk analysis and flood potential losses assessment. Chinese Journal of Oceanology and Limnology 21 (1): 1-9. Liang, X., D. P. Lettenmaier, E. F. Wood and S. J. Burges. A simple hydrologically based model of land surface water and energy fluxes for general circulation models. Journal of Geophysical Research, 99(D7):14415-14428, 1994. Lin, Z. X. (2002) Construction of flood control engineering and Disaster Reduction Policy in Taihu Basin, Science of Lakes 14 (1): 12-18 National Development and Reform Commission (2007) China’s National Climate Change Programme. People’s Republic of China Nienhuis, P. H. and Leuven, R. S. E. W. (2001) River restoration and flood protection: controversy or synergism? Hydrobiologia 444: 85-99. Office of Science and Technology (2002) Foresight Futures 2020: Revised Scenarios and Guidance. Office of Science and Technology, London. Office of Science and Technology (2004) Foresight Future Flooding. Executive Summary. OST, London. Petts, G. E. (1980) Implications of the fluvial process-channel morphology interaction below British reservoirs for stream habitats. Science of the Total Environment 16: 149-163. Rapport, D. and Friend, A. (1979) Towards a comprehensive framework for environmental statistics: a stress-response approach. Statistics Canada Catalogue 11-510. Ottawa: Minister of Supply and Services Canada. Shi, P., Ge. Y., Yuan, Y. and Guo, W. (2005) Integrated Risk Management of Flood Disasters in Metropolitan Areas of China. Water Resources Development 21 (4): 613–627,

68
Taihu Basin Authority, 2001, The 1999 flood in the Taihu Basin (in Chinese). Turner, R.K., Lorenzoni, I., Beaumont, N., Bateman, I.J., Langford, I.H. and McDonald, A.L. (1998) Coastal management for sustainable development: analysing environmental and socioeconomic changes on the UK coast. Geographical Journal,164, 269-281. Wood, E. F., D. P. Lettenmaier and V. G. Zartarian. A land surface hydrology parameterization with subgrid variability for general circulation models. Journal of Geophysical Research, 97(D3):2717-2728, 1992. Xu, Y.-S., Shen, S.-L., Cai, Z.-Y. and Zhou, G.-Y. (2008) The state of land subsidence and prediction approaches due to groundwater withdrawal in China. Natural Hazards 45: 123-135. Xue, B., Yao, S. and Xia, W. (2007) Environmental changes in Lake Taihu during the past century as recorded in sediment cores, Hydrobiologia, 581:117–123. Zhang, Y., Xue, Y.-Q., Wu, J.-C., Ye, S.-J., Wei, Z.-X., Li, Q.-F. and Yu, J. (2007) Characteristics of aquifer system deformation in the Southern Yangtze Delta, China. Engineering Geology 90: 160-173. Zong, Y. Q. and Chen, X. Q. (1999) Typhoon hazards in the Shanghai area. Disasters 23 (1): 66-80.

69
List of those who contributed to the project Name Affiliation Project leadership Prof Edward Evans (joint project director)
University of Nottingham
Prof Xiaotao Cheng (joint project director)
China Institute of Water Resources and Hydropower Research (IWHR), Beijing
Dr Haoyun Wu Taihu Basin Authority of the Ministry of Water Resources (TBA)
Qing Mei TBA Experts and researchers Prof Jim Hall University of Newcastle-upon-Tyne Dr Richard Jones Meteorological Office, Hadley Centre Prof Edmund Penning-Rowsell
Flood Hazard Research Centre, Middlesex University
Dr Nick Reynard Centre for Ecology and Hydrology, Wallingford Paul Sayers HR Wallingford Dr Jonathan Simm HR Wallingford Prof Colin Thorne University of Nottingham Prof Andrew Watkinson University of East Anglia Dr Jon Wicks Halcrow Group Ltd Matthew Scott Halcrow Group Ltd Dr Gemma Harvey University of Nottingham Prof Yicheng Wang IWHR, Beijing Prof Liyun Xiang IWHR, Beijing Dr Song Han IWHR, Beijing Dr Zhixiong Ding IWHR, Beijing Prof Yinlong Xu Chinese Academy of Agricultural Sciences Dr Jie Pan Chinese Academy of Agricultural Sciences Prof Zongxue Xu Beijing Normal University Dr Junxiong Huang Beijing Normal University Liu Liu Beijing Normal University Dr Jinhe Jiang Chinese Academy of Social Sciences Jiancui Liu Chinese Academy of Social Sciences Dr Yanyan Wang IWHR, Beijing Changwei Hu IWHR, Beijing Yuanhua Cheng TBA Chen Li TBA Prof Dongya Sun IWHR, Beijing Dr Jiabi Xie IWHR, Beijing Hanghui Zhang TBA Dr Chaoqing Yu IWHR, Beijing Haitao Sun TBA Dr Jing Wang IWHR, Beijing Dr Minglei Ren IWHR, Beijing Jianyue Wang IWHR, Beijing