Similarities between the design of the China Pavilion of the 2010 World Expo and the age structure of its host city, Shanghai. Since 1993, due to its extremely low fertility, Shanghai has been experiencing a net loss in natural population growth (growth of local resident population not counting migrants).
Congruence of Two Booms(population age distribution, China)
During the closing decades of the 20th century and the turning of the 21st, China produced one of the most miraculous economic booms in recent human history. The boom benefitted over a fifth of humanity who live in China, and profoundly affected those both within and outside of China. Among others, China’s economic boom benefited from a favorable population age structure. At the start of the reforms and economic take off in the early 1980s, a large share of China’s population was in the teen ages, reflecting the large birth cohorts of the late 1960s and early 1970s, a condition itself called for more drastic population control.
As China’s reforms accelerated and its economic growth took off in the 1980s to 2000, the large birth cohorts of the 1960s and 1970s also moved into the most productive years, as shown by their concentration in the ages of late 20s and early 30s in 2000. These young and hard-working laborers provided the key source for China’s economic growth, but they are a one-time, non-repeatable historical event, an outcome of the demographic transition.
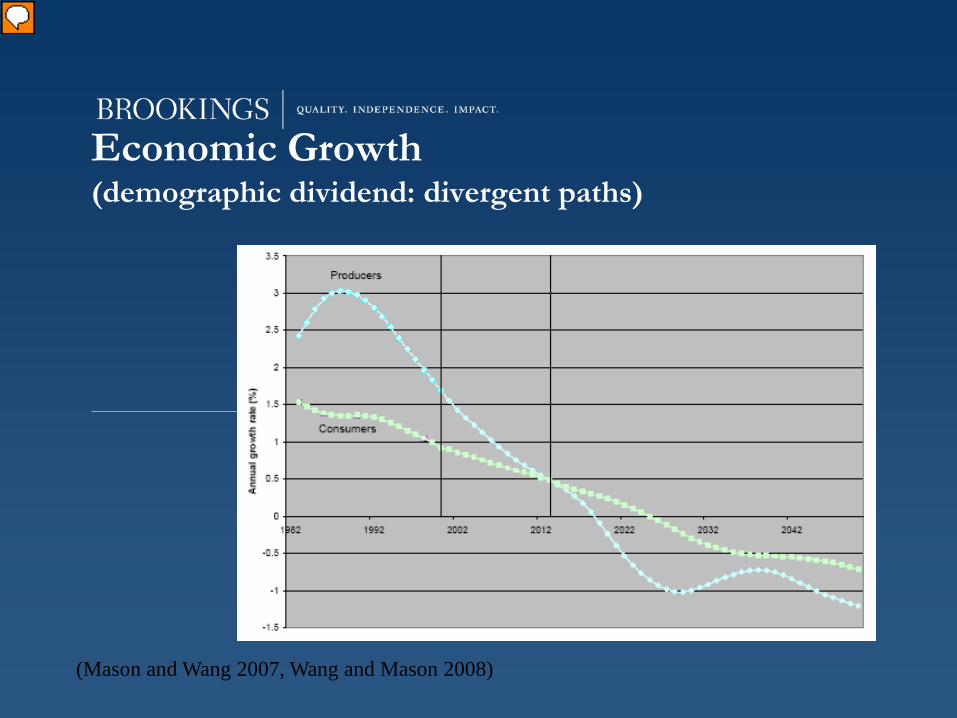
The last two decades of the 20th century, the annual growth rate of net producers far exceeded that of net consumers, generating what is known as the demographic dividend. In the last decade, such a dividend is quickly coming to an end. Two years from now, the growth rate of net consumers will exceed that of net producers, producing a negative demographic dividend.
China’s Demographic Fortune(annual growth rate of effective support ratio, 1982–2000)
(Wang and Mason 2008)
Presenter
Presentation Notes
During the last two decades of the 20th century China had clearly a very favorable population age structure. The 1.28% annual rate on average for this period could account for at least 15% of the growth in per capita income during this period.
Reversal of Fortune(annual growth rate of effective support ratio, 2013–2050)
(Wang and Mason 2008)
Presenter
Presentation Notes
What awaits China is a substantial demographic toll as its population ages in the coming decades. China will be in the ranks of Japan and Taiwan, faring far worse than countries such as the US and France. Assuming an economic growth rate of 5 percent annually, a -.45 support ratio takes away about 10% of per capita income growth.
New Demographic Era
Annual birth number dropped by nearly 10 million from the peak in the late 1980s
Growth rate only a third of the level in the late 1980s
Driving Force: Low Fertility
Presenter
Presentation Notes
China’s one-child policy followed rather than preceded the most significant fertility decline in China. By the time when the policy was formally announced in 1980, fertility measured by TFR was already more than halved, to a level that this not much above the replacement level. During the first decade of its implementation, fertility level hardly declined further. A new phase of decline began in the early 1990s, when fertility level nationally fell below the replacement level.
Prospect of Rapid Population Aging
Number of elderly (65+) will double in the next 20 years, from 117 to 238 million
Share of elderly population will go up from 8.7 to 16.8% in 20 years, and to over ¼ by 2042
Japan: 9.1% in 1980, 22.6 in 2010, and 35% by 2040
Divergent growth rates
Declining Support Ratio(Number of working persons per 60+, China and other BRIC economies)
Declining Support Ratio(Number of working persons per 65+, China and other large economies)
Changing Labor Supply
Total size(20-59) reaches a plateau, moderate increase in the next 10 years
Young labor (20-24) reached peak and will decline by nearly 20% in the next one and 1/3 in the next two decades
115.57
76.53
0
20
40
60
80
100
120
140
640660680700720740760780800820840860
2000 2005 2010 2015 2020 2025 2030
Youn
g La
bor
(20-
24, m
illio
n))
Tota
l Lab
or (2
0-59
, mill
ion)
Year
20-59 20-24
Presenter
Presentation Notes
The last two decades of the 20th century, the annual growth rate of net producers far exceeded that of net consumers, generating what is known as the demographic dividend. In the last decade, such a dividend is quickly coming to an end. Two years from now, the growth rate of net consumers will exceed that of net producers, producing a negative demographic dividend.
Smaller but more productive?
Available college age youths actually smaller due to educational expansion – shortage of unskilled young labor
A more productive labor force in the long run
Fragile Families(share of women aged 35-49 with one or no child, 2005)
38.6% of all women of this age group
Fragile Families(share of women aged 35-49 with one or no child, urban China, 2005)
67.2% of all women of this age group
Growth in the last thirty years has been based on a heavily physical capital and labor intensive model
Internal constraints (costs): resources, environment, and inequality
External constraints: export market, resources A new model requires growth of domestic
consumption and market and a cleaner economy that is based on human capital deepening
Aging population: labor, consumption, savings and government spending