chinas extraordinary population expansion and its
TRANSCRIPT

China’s Extraordinary Population Expansion and Its Determinants during the Qing
Period, 1644-1911
Kent Deng
London School of Economics, UK
Sun Shengmin
Shandong University, China
I. Introduction, motivations and data
It is commonly agreed that pre-modern China’s population experienced two growth
spurts: one in the tenth to eleventh centuries (Northern Song: 960-1127), and other during
c. 1700-1830 (Qing: 1644-1911).1 During the first growth spurt, China’s population
jumped from about 50 to 120 million before declining; during the second population rose
dramatically from about 56 to 400 million before again declining.2 Taken together, these
two growth spurts accounted for only about 10 percent of the total lifespan of the Chinese
empire (2,132 years, 221 BC-1911). Thus, they were exceptions rather than the rule in
China’s long-term historiography.
During the Song spurt, the annual population growth rate was 1.07 percent; under the
Qing, it was substantially higher, at 1.50 percent. Not only was the Qing population
growth rate 40 percent greater than that of the Song, but the growth also proved to be
1 Many scholars have backdated the second spurt c. 1500; e.g. Ping-ti Ho, Studies on the Population of China, 1368-
1953 (Cambridge [Mass.]: Harvard University Press, 1959); D. H. Perkins, Agricultural Development in China, 1368-
1968 (Edinburgh: Edinburgh University Press, 1969), Appendix A; Mark Elvin, The Pattern of the Chinese Past
(Stanford: Stanford University Press, 1973), pp. 129, 310; Colin McEvedy and Richard Jones (eds), Atlas of World
Population History (Harmondsworth: Penguin Books, 1978), pp. 166-74. However, this assertion lacks support by any
historical record or evidence. Although doubts on China’s official statistics have been raised, (see G. W. Skinner,
‘Sichuan’s Population in the Nineteenth Century’, Late Imperial China, 8/1 (1987), pp. 1-79), there appears to be no
technical nor institutional reason for the government not to count people correctly.
2 See Kent Deng, ‘Unveiling China’s True Population Statistics for the Pre-Modern Era with Official Census Data’,
Population Review 43/2 (2004), Appendix 3. Note that it has been agreed that between the 1860s and 1920s China’s
annual population growth rate was still 1.4 percent; see J. K. Fairbank and Kwang-ching Liu (eds), Cambridge History
of China, Late Ch’ing, 1800-1911, Part II (Cambridge: Cambridge University Press, 1980), pp. 3-4.
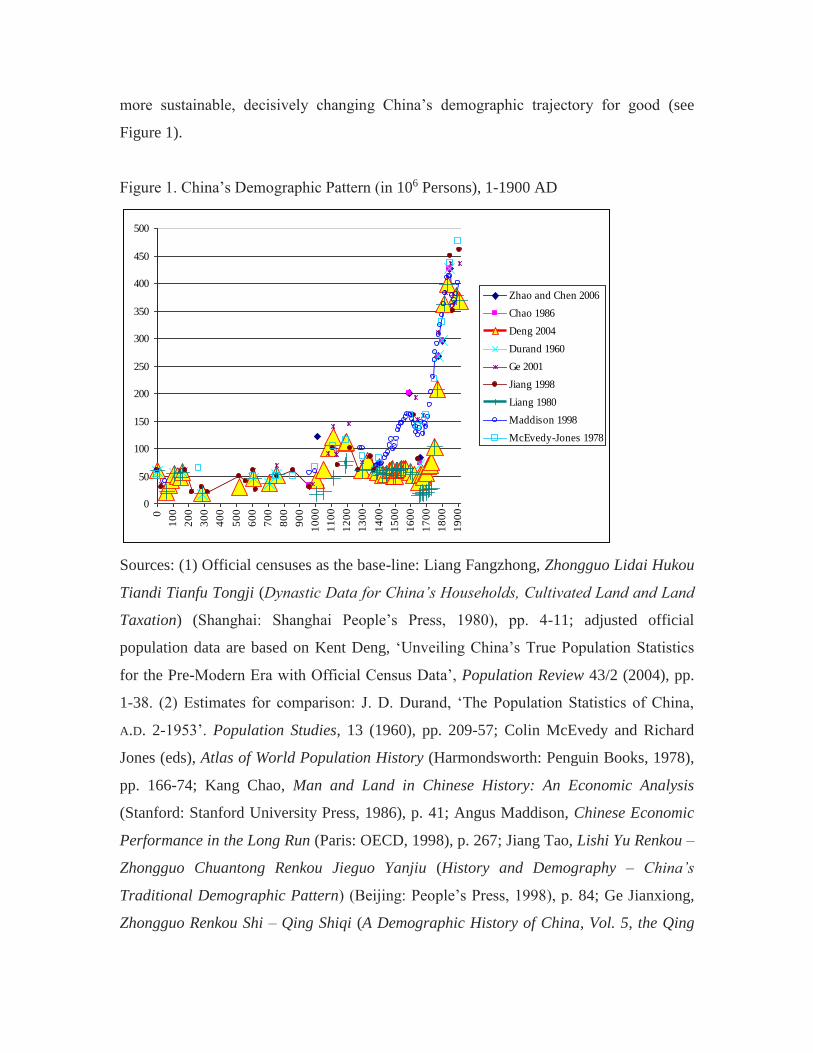
more sustainable, decisively changing China’s demographic trajectory for good (see
Figure 1).
Figure 1. China’s Demographic Pattern (in 106 Persons), 1-1900 AD
0
50
100
150
200
250
300
350
400
450
500
0
10
0
20
0
30
0
40
0
50
0
60
0
70
0
80
0
90
0
10
00
11
00
12
00
13
00
14
00
15
00
16
00
17
00
18
00
19
00
Zhao and Chen 2006
Chao 1986
Deng 2004
Durand 1960
Ge 2001
Jiang 1998
Liang 1980
Maddison 1998
McEvedy-Jones 1978
Sources: (1) Official censuses as the base-line: Liang Fangzhong, Zhongguo Lidai Hukou
Tiandi Tianfu Tongji (Dynastic Data for China’s Households, Cultivated Land and Land
Taxation) (Shanghai: Shanghai People’s Press, 1980), pp. 4-11; adjusted official
population data are based on Kent Deng, ‘Unveiling China’s True Population Statistics
for the Pre-Modern Era with Official Census Data’, Population Review 43/2 (2004), pp.
1-38. (2) Estimates for comparison: J. D. Durand, ‘The Population Statistics of China,
A.D. 2-1953’. Population Studies, 13 (1960), pp. 209-57; Colin McEvedy and Richard
Jones (eds), Atlas of World Population History (Harmondsworth: Penguin Books, 1978),
pp. 166-74; Kang Chao, Man and Land in Chinese History: An Economic Analysis
(Stanford: Stanford University Press, 1986), p. 41; Angus Maddison, Chinese Economic
Performance in the Long Run (Paris: OECD, 1998), p. 267; Jiang Tao, Lishi Yu Renkou –
Zhongguo Chuantong Renkou Jieguo Yanjiu (History and Demography – China’s
Traditional Demographic Pattern) (Beijing: People’s Press, 1998), p. 84; Ge Jianxiong,
Zhongguo Renkou Shi – Qing Shiqi (A Demographic History of China, Vol. 5, the Qing

Period) (Shanghai: Fudan University Press, 2000), pp. 831-2; Zhao Gang and Chen
Zhongyi, Zhongguo Tudi Zhidu Shi (A History of Land Ownership in China) (Beijing:
New Star Press, 2006), p. 110.
Needless to say, the size and growth momentum of the Qing population has been
subject to debate. The majority of researchers tend to agree that the official population
figures for the late Qing (i.e. after 1800) were quite accurate but they challenge earlier
official population figures for the late Ming and early Qing on three grounds (1) the basic
unit of China’s population censuses during Ming and Qing times was ‘taxable persons’
(ding) instead of ‘natural persons’ (kou) so many historians see the legitimacy to ‘re-
construct’ China’s population of this period; (2) China’s bureaucrats were unable to
conduct accurate population surveys; (3) there is a ceiling for human reproduction
rate/speed. Therefore, it was humanly impossible for China’s population to multiply
many times within two centuries during the Qing Period. The solution: to push the late
Ming and early Qing official population figures higher.
It is easy to disagree on all the above three points. Firstly, one does not need to re-
construct China’s population figures from ‘taxable persons’ to ‘natural persons’ in order
to understand the general growth trajectory of China’s population so long as a consistent
census method was applied, be it ‘taxable persons’ or ‘natural persons’. The common
approach of using a fixed and constant multiplier on ‘taxable persons’ is unavoidably
arbitrary due to the lack of national surveys of family sizes in different regions, at
different times, and across different social classes.3 So, conceptually, the Ming-Qing data
for taxable population are as good as one gets. In this context, although ‘low’ population
figures were reported very consistently during entire Ming Period, 66.6 million being the
highest (for 1403) and 50.3 million being the lowest (for 1490),4 it is not justifiable to
‘correct’ these two numbers to, for example, 72 million (with a multiplier of 1.08) and 98
3 Noted here Ping-ti Ho pioneered population re-construction for the Ming population, see his Studies on the
Population of China, 1368-1953 (Cambridge [Mass.]: Harvard University Press, 1959).
4 Liang Fangzhong, Zhongguo Lidai Hukou Tiandi Tianfu Tongji (Dynastic Data for China’s Households, Cultivated
Land and Land Taxation) (Shanghai: Shanghai People’s Press, 1980), p. 8.

million (with a multiplier of 1.97), respectively.5 Similarly, the Ming official population
figure of 56.2 million for 1600-1602 has been changed to 150 million (with a multiplier
of 2.67).6 Such alteration not only changes the volume with a huge margin (close to 50
percent for 1490 and 167 percent for 1600-1602) but also switches the direction in which
demographic change moved (the Ming population declined from 1403 to 1490). The real
question here is whether a demographic growth should ever be so linear in reality in
China’s past.7
In addition, one has to ask why and how there is a ‘post-1800 bias’: the Qing
population data after 1800 are commonly accepted more or less as they are.8 Logically, if
the post-1800 data are trustworthy, so are the data produced by the same bureaucracy
before 1800. Alternatively, one should consistently apply multipliers, say, 1.97 and 2.67
to the 1833 official census (i.e. 398.9 million) to make the late Qing population 785.8 or
1,065.1 million, utterly absurd as China’s population reached such a level only a century
later. So far, no one has either questioned or justified such ridiculous inconsistency.
Secondly, individual officials might indeed neglect their duties and falsified some local
censuses. But the Qing meritocracy created a sufficient pressure on officials as a whole to
perform competently. This was particularly true when there was an oversupply of
imperial degree-holders after the mid-Qing who were keen on replacing under-
performing bureaucrats anywhere and at any time.
Thirdly, one has to face the harsh reality of huge population losses during the Ming-
Qing transition from circa 1628 to 1661, many scholars simply ignore huge population
5 See Angus Maddison, Chinese Economic Performance in the Long Run (Paris: OECD, 1998), p. 267.
6 Cao Shuji’s Zhongguo Renkou Shi Ming Shiqi (A Demographic History of China, the Ming Period) (Shanghai: Fudan
University Press, 2000), p. 3.
7 A linear growth was taken as the only pattern by Ping-ti Ho, see his Studies on the Population of China, 1368-1953
(Cambridge [Mass.]: Harvard University Press, 1959); also Zhao Wenlin and Xie Shujun, Zhongguo Renkou Shi (A
Demographic History of China) (Beijing: People’s Press, 1988).
8 After 1800, the Qing official population figures vary between 361 million to 398 million. So far, no one, August
Maddison included, has seen these figures as ‘taxable persons’ so that a multiplier can be used to enlarge them. The ‘re-
adjustments’ made to post-1800 official data are all lower than 10 percent, see J. D. Durand, ‘The Population Statistics
of China, A.D. 2-1953’, Population Studies, 13 (1960), pp. 209-57; Colin McEvedy and Richard Jones, Atlas of World
Population History (Harmondsworth: Penguin Books, 1978), pp. 166-74; Kang Chao, Man and Land in Chinese
History: An Economic Analysis (Stanford: Stanford University Press, 1986), ch. 1.

losses due to the Ming famine-civil war and the Manchu military conquest. The Ming
famine-civil war alone cost about 40 million lives.9 This was followed by the widespread
Manchu massacres of the Chinese across most provinces which set China’s population
size further back by about 7.5 million.10 It is worth noting that reliable information on
such massacres comes from European sources. Martino Martini (1614-61), the Italian
Jesuit to China, witnessed the Manchu systematic massacres in Fujian, Guangdong and
Guangxi in his 1654 book De Bello Tartarica Historia.11 John Nieuhof (1618-72), the
VOC officer who visited China at the time of the Manchu invasion and conquest also
documented the Manchu massacres in his The Voyages and Travels to the East Indies
1653-1670.12
In addition, there were subtle genocide policies to drive the ethnic Han Chinese out of
their land until circa 1700. In the north, this was carried out through ‘land enclosure’
(quandi). The total amount of land lost by Chinese farmers was 22.9 million mu in the
Yellow River region alone.13 In the south, it was implemented via ‘no-man zones’ of 30
li wide along China’s east coast. This policy evacuated farmers from 57.6 million mu of
land by force.14 The total loss of farmland from ‘land enclosure’ and ‘no-man zones’ was
80.5 million mu. If 10 mu was the minimal size for a self-sufficient farming family,15 the
homeless population were likely to be 8 million households, or 40 million individuals,
although one does not know how many died in the process. The aggregate victims during
the Ming-Qing transition is likely to have been 87.5 million, not at all trivial. Therefore,
9 See Cao Shuji’s Zhongguo Renkou Shi Ming Shiqi (A Demographic History of China, the Ming Period) (Shanghai:
Fudan University Press, 2000), pp. 431-52.
10 Ibid., pp. 17-41.
11 Martino Martini, De Bello Tartarica Historia (Antwerp, 1654), vide: en.wikipedia.org, available on 20 February
2018.
12 John Nieuhof, Voyages & Travels to the East Indies 1653-1670 (Reprint, Oxford: Oxford University Press, 1988).
13 Ge Jianxion, Minzu Da Qianxi (Ethnic Exodus) (Hong Kong: Zhonghua Books, 2014), p. 282.
14 See Cao Shuji’s Zhongguo Renkou Shi Qing Shiqi (A Demographic History of China, the Qing Period) (Shanghai:
Fudan University Press, 2000), pp. 37-41.
15 See Li Bozhong, ‘Rengen Shimu Yu Mingqing Jiangnan Nongminde Jingying Guimo’ (The Practice of ‘Ten Mu per
Farmer’ and the Scale of the Traditional Peasant Economy), Zhongguo Nongshi (Agricultural History of China), 1
(1996), pp. 1-14.

the low baseline for the early Qing population can well be justified. The low baseline also
explains the adoption of a benevolent population policy by Emperor Kang Xi in 1712
known as ‘no more tax burden to let population thrive’.16
Now, for the sake of argument, a net annual growth rate of mere 0.7 percent (gross birth
rate – infant mortality rate – death rate) will quadruple a population in 200 years; and a
net annual growth rate of one percent will at least sextuple a population. As far as one can
tell, 0.7-1.0 percent net population growth was highly achievable during the Qing.17
For all these reasons, the current study uses China’s official census only with the belief
that the Qing official data deserves the benefit of the doubt.
Regarding the quality of studies of the Qing population, many scholars – mainly
historical demographers and archivists – have adopted a strictly descriptive mode when
dealing with such significant fluctuations of the Qing population, as if there were no
particular need for an explanation.18 Similarly, some have taken the Qing population size
for granted in so far as to use it as a proxy for the size and health of the economy.19 Yet,
such an approach leads to circular argumentation: a large population was fed by a large
economy, and a large economy supported a large population. So what?
Some recent works have tried to turn the problem on its head by looking for evidence
that would indicate there was a much smaller population increase than previously
suggested. A study, for example, has argued that the change in the Qing family size was
16 Zhao Erxun, Qingshi Gao (Draft of the History of the Qing Dynasty) (1927), vol. 9 ‘Shizong Benji’ (Biography of
Emperor Shizong), in Twenty-Five Official Histories, vol. 11, p. 8853.
17 See James Lee, Cameron Campbell, and Guofu Tan, ‘Infanticide and Family Planning in Late Imperial China’, in
Thomas Rawski and Lillian Li, eds., Chinese History in Economic Perspective (Berkeley: University of California
Press, 1992), pp. 145-76; James Lee and Cameron Campbell, Fate and Fortune in Rural China (Cambridge:
Cambridge University Press, 1997), pp. 55-7, 70.
18 J. D. Durand, ‘The Population Statistics of China, A.D. 2-1953’. Population Studies, 13 (1960), pp. 209-57;
McEvedy and Jones, Atlas of World Population History, pp. 166-74; Liang Fangzhong, Zhongguo Lidai Hukou Tiandi
Tianfu Tongji (Dynastic Data for China’s Households, Cultivated Land and Land Taxation) (Shanghai: Shanghai
People’s Press, 1980), pp. 4-11; Jiang Tao, Lishi Yu Renkou – Zhongguo Chuantong Renkou Jieguo Yanjiu (History
and Demography – China’s Traditional Demographic Pattern) (Beijing: People’s Press, 1998), p. 84; Ge Jianxiong,
Zhongguo Renkou Shi – Qing Shiqi (A Demographic History of China, Vol. 5, the Qing Period) (Shanghai: Fudan
University Press, 2000), pp. 831-2.
19 E.g. Maddison, Chinese Economic Performance, p. 267; Zhao Gang and Chen Zhongyi, Zhongguo Tudi Zhidu Shi
(A History of Land Ownership in China) (Beijing: New Star Press, 2006), p. 110.

marginal.20 Moreover, it has been proposed that preventive checks, both ex ante (herbal
contraception) and ex post (infanticide), were extensively practiced at the household
level, meaning that the Qing population may have been consciously controlled.21 On its
own, however, the preventative argument is incompatible with the weight of evidence
indicating that China’s population quadrupled over the period. Such preventative checks,
therefore, would had to either occurred very late in the period, and/or on very small scale,
such that their effect was not significant enough to impact the overall population growth
dynamics.
Meanwhile, why and how the remarkable Qing population growth occurred has
remained open to debate. Implicitly or explicitly, a Malthusian paradigm is often used
when the doubling of China’s territory under the Qing is considered. 22 Intuitively,
territorial expansion could lead to more resource endowments and then to more
population growth. However, China’s territorial increases did not automatically warrant a
larger population. By the Tang Period (618-907), China’s population had remained below
60 million, regardless of two major increases in the empire’s territory during the Western
Han (206 BC - 25 AD) and the Tang. During the Northern Song (960-1127), China
shrank back to the size under the Qin (221 BC - 207 BC), but its population exceeded 100
million, the largest hitherto in China’s history. Under the Mongol colonisation, China’s
territory expanded to its historical pinnacle, but China’s population stagnated at the 50-60
million level. Under the Qing, China’s territory bounced back to a size between that of
the Tang (618-907 AD) and Yuan (1271-1368) (see Figure 2). So, more territory can be
viewed at best as a necessary but not sufficient condition for China’s population increase.
20 Lee and Wang, One Quarter of Humanity, pp. 34-5, 38.
21 Feng Wang, James Lee and Cameron Campbell, ‘Marital Fertility Control among the Qing Nobility’, Population
Studies 49/3 (1995), pp. 383-400; Li Bozhong, ‘Qingdai Qianzhongqi Jiangnan Renkoude Disu Zengzhang Jiqi
Yuanyin’ (‘The Low Population Growth in the Yangtze Delta and its Reason during Early and Mid-Qing Times’),
Qingshi Yanjiu (Study of Qing History), 2 (1996), pp. 10-19; Li Bozhong, Duoshijiao Kan Jiangnan Jingjishi, 1250-
1850 (Multiple Dimensional View on Economic History of the Jiangnan Region, 1250-1850) (Beijing: Sanlian Books,
2003), pp. 137-212.
22 E.g. J. K. Fairbank and Merle Goldman, China: A New History (Harvard University Press, 2005), pp. 143-62; J. D.
Spence, The Search for Modern China, third edition (New York: Norton, 2012), chs 2, 4 and 5; G. D. Rawnsley and M.
T. Rawnsley (eds.), Political Communications in Greater China (London: RoutledgeCurzon, 2003), pp. 10-38.

Figure 2. Fluctuations in China’s Territory,* 221 BC - 1911 AD
Source: Based on Tan Qixiang, Jianming Zhongguo Lishi Dituji (Concise Maps of
Chinese History) (Beijing: China’s Map Press, 1991), pp. 15-18, 39-40, 57-8, 67-8.
Note: * Here, the Qing (1644-1911) boundaries are used as a template. A = the Qin
territory (c. 207 BC) and roughly the Northern Song territory (960-1127); A + B = the
Western Han territory (c. 24 AD); A + B + C = the Tang territory (c. 907); A + B + C +
D = the Qing territory (c. 1911) and roughly the Yuan territory (1279-1368).
A fuller understanding is obtained by recognising that institutions played a vital part in
determining the space for population growth under resource constraints. For instance,
under the Mongol colonisation of China, genocide against the Han Chinese took place
under a mindset described as, ‘the Chinese are useless to our cause, and should be killed
off so that their land can be converted to grazing land’.23 Among those Han Chinese who
survived, millions were enslaved (quding); horses belonging to the Chinese were
confiscated; vast agrarian areas were enclosed as grazing land; a second crop after the
23 Song Lian, Yuan Shi (History of the Yuan Dynasty) (1371), vol. 153: no. 146 ‘Yeluchucai Zhuan’ (‘Biography of
Yeluchucai’), in Er-shi-wu Shi (Twenty-Five Official Histories) (Shanghai: Shanghai Classics Press, 1986), vol. 9, p.
7635; see also A. F. Wright and Denis Twitchett (eds), Confucian Personalities (Stanford: Stanford University Press,
1962), pp. 19-20, 189-216.

summer harvest was forbidden in order to make space for Mongol horses; taxation
burden multiplied.24 All such policies effectively counteracted any possible resource
windfall that would allow for more population growth.
In sharp contrast to the Mongol policies, the Qing territorial expansion was coupled
with the government physiocratic commitment. Private land ownership was granted to the
Han Chinese. Government schemes deliberately proliferated owner-tiller farms into new
frontiers including Manchuria and South Mongolia. Efforts were also made to open up
the north-western region of Gansu and Xinjiang and the south-western region of Sichuan,
Guizhou and Yunnan, all for farming.25 These schemes left only Tibet and neighbouring
Qinghai untouched.
The supply of farmland under the Qing became without doubt more elastic. The
additional farmland supply in Manchuria and South Mongolia alone was equivalent to
about one-sixth of China’s total. China’s farmland more than doubled in the first 100
years of the Qing rule (see Figure 3). Thus, we consider the first factor in relation to the
Qing population growth to be supply of farmland. The current research examines the
impact of such a supply on the Qing population.26
Figure 3. Supply of Farmland versus Population Growth, 1650-1900
24 Wang Qi, Xu Wenxian Tongkao (Imperially Commissioned Continuation of the Comprehensive Study of Literature)
(publisher unknown, 1586), vol. 1; Perkins, Agricultural Development in China, pp. 23-4, 197-9; Zheng Xuemeng,
Jiang Zhaocheng and Zhang Wenqi, Jianming Zhongguo Jingji Tongshi (A Brief Panorama of Chinese Economic
History) (Harbin: Heilongjiang People’s Press, 1984), pp. 242-4, 254-5.
25 By the 1820s, the new farmland in the Balikun and Yili regions of Xinjiang (also known as ‘Chinese Turkistan’)
alone totalled 908,500 mu or 121,735 hectares; see Chen Hua, Qingdai Quyu Shehui Jingji Yanjiu (Regional Socio-
Economic Conditions during the Qing Period) (Beijing: People’s University Press, 1996), p. 265; J. K. Leonard and J.
R. Watt (eds.), To Achieve Security and Wealth (Ithaca: Cornell University East Asia Program, 1992), pp. 21-46.
26 The elastic supply of farmland contradicts the well-circulated notion — known as the ‘man-land ratio argument’ —
that arable land under the Qing was fixed and thus its workforce had to farm more intensively to keep up with an
increasing population; see Kang Chao, Man and Land in Chinese History: An Economic Analysis (Stanford: Stanford
University Press, 1986).

0
100,000,000
200,000,000
300,000,000
400,000,000
500,000,000
600,000,000
700,000,000
800,000,000
900,000,000
1,000,000,000
16
50
16
70
16
90
17
10
17
30
17
50
17
70
17
90
18
10
18
30
18
50
18
70
18
90
Farmland (mu)
Population
Sources: Farmland is based on Liang, Dynastic Data, pp. 10, 380, 384, 396, 400, 401.
Population is based on Deng, ‘Unveiling China’s True Population Statistics’.
Note: Farmland in mu. One Qing mu = 614.4 m2. Population in persons.
Concomitant with the impact of farmland supply providing support for the Qing
population growth was labour mobility. During the Qing, the scale of internal migration
was greater than that of the previous Ming Period (see Figure 4). The impetus for such
increased migration level was the Qing policy of ‘farming by invitation’ (quannong),
which actively encouraged farmers to occupy newly available farmland, including old
core farming regions such as Shanxi, Zhejiang, Hunan, Fujian and Guangdong.
Figure 4. Internal Migration Index (1369 = 100), 1369-1900
0
500
1000
1500
2000
2500
3000
3500
4000
4500
13
60
13
90
14
20
14
50
14
80
15
10
15
40
15
70
16
00
16
30
16
60
16
90
17
20
17
50
17
80
18
10
18
40
18
70
19
00

Source: Ge Jianxiong (ed.), Zhongguo Yimin Shi (A History of Migration in China)
(Fuzhou: Fujian People’s Press, 1997), vol. 1, pp. 342-40.
Note: Ordinate – persons. Abscissa – Calendar years.
The concern behind the Qing migration policy was an explicit economy-wide resource
re-allocation policy called ‘filling regions with land abundance with population from
regions of high population density’ (‘yi zhai bu kuan’).27 Often, the Qing state provided
migrants with free passage, working capital (seed and tools) and tax holidays for a
number of years. Overall, the policy proved effective (see Table 1).
Table 1. Internal Economic Migration during the Qing Period
Donor Region Recipient Region
Shanxi Sichuan
Hunan Guangdong, Fujian
Anhui, Hubei Shanxi
Henan, Jiangxi Shanxi
Hunan, Guangdong Sichuan
Jiangxi Fujian
Fujian, Guangdong Hunan
Fujian Zhejiang, Taiwan
Shandong Manchuria
Shanxi Mongolia
Source: Ge Jianxiong (ed.), Zhongguo Yimin Shi (A History of Migration in China)
(Fuzhou: Fujian People’s Press, 1997), vol. 1, pp. 169-402.
27 Anon., Qing Gaozong Shilu (Veritable Records of Emperor Gaozong of the Qing Dynasty) (1799. Reprint. Taipei:
Hualian Press, 1964), vol. 311, Entry ‘Shisannian Sanyue’.

Note: The actual numbers of migrants are difficult to assess. Often, only vague amounts
are mentioned in reference to a migration scheme, such as, ‘several tens of thousands of
persons or households’, or ‘60 to 70 percent of the locals migrated’.
Large numbers of migrants from the old core regions (such as Shandong, Shanxi,
Shaanxi, Hebei, and Henan) resettled elsewhere for a better life.28 By 1668, the frontier
region of Manchuria had absorbed 14 million immigrants from China proper.29 In the
nineteenth century, the annual immigrants to that region were 600,000. By the very end
of the Qing (at 1907), the government immigration quota for Heilongjiang, the northern
tip of Manchuria, was two million per year.30 Large-scale immigration also took place in
Mongolia. In 1712, the number of immigrants from Shandong counted for over
100,000. 31 As a result, modern-day Manchuria, Mongolia and Sichuan are lineage
enclaves of clans from Shandong, Hebei, Hubei and Hunan.32
Likewise in Sichuan near the upper reaches of the Yangtze River, a surge of
immigration began in 1713 under Emperor Kangxi’s edict of ‘filling up Sichuan with the
28 For the eighteenth century, see Pierre-Etienne Will, Bureaucracy and Famine in Eighteenth-Century China
(Stanford: Stanford University Press, 1990), pt. 2.
29 Anon., Veritable Records of Emperor Gaozong of the Qing Dynasty, vol. 311, Entry ‘Shisannian Sanyue’ (The
Third Month of the Thirteenth Year under the Gaozong Reign).
30 Tian and Chen, Brief History of Migration, pp. 110-12.
31 The Qing state eventually imposed a ban on permanent immigration to Manchuria (1668-1860) and Mongolia
(1740-1897). But there was little control over seasonal migrants to both regions. Moreover, by the time when the
restriction was introduced in 1740-2, a large number of immigrants had already settled in; see Zhao Erxun, Qingshi
Gao (Draft of the History of the Qing Dynasty) (1927), vol. 120 ‘Shihuo Zhi’ (Economy), in Twenty-Five Official
Histories, vol. 11, pp. 9252-9.
32 Yuan Yida and Zhang Cheng, Zhongguo Xingshi Qunti Yichuan He Renkou Fenbu (Chinese Surnames, Group
Genetics and Demographic Distribution) (Shanghai: East China Normal University Press, 2002), pp. 6-57.

population from Hubei’ (huguang tian sichuan).33 In 1743-8 alone, a quarter of a million
migrants re-settled there.34 Minor waves of migration also occurred elsewhere.35
Such vigorous economic-driven migration and farming resettlement significantly
altered China’s resource allocation regarding labour, capital, technology and land.
However, the actual impact of this economic migration on Qing population growth has
thus far remained unclear. This study regards internal migration as inherently related to
the increase in farmland. In other words, new gains in farmland became an effective
factor in the economy only because new immigrants settled and farmed the new land. We
thus consider internal migration attached to the factor of farmland.
The second factor we find central to explaining Qing population dynamics is food
production. Some scholars see the Qing population growth as subject to technological
determinism. Mark Elvin’s heuristic ‘High-Level Equilibrium Trap’ hypothesises a
mutually-reinforcing mechanism between labour-intensive agriculture and population
density until the Qing economy reached equilibrium. Under his argument, China’s
technology was fixed indefinitely and only imported new technology could unlock
China’s equilibrium.36 Elvin’s approach has been modified by Francesca Bray who,
inspired by Ester Boserup,37 argued specifically that rice-farming was the determinant for
China’s (as well as the whole of Monsoon Asia’s) demographic pattern. She presented a
notion that rice production suffers little diminishing returns and hence eliminates the
ceiling for population growth.38 In other words, under rice farming, population growth
becomes unlimited. Evidence suggests, however, that the average wheat yield level
33 Tian Fang and Chen Yijun, Zhongguo Yimin Shilue (Brief History of Migration in China) (Beijing: Knowledge
Press, 1986), pp. 113-14; Chen, Regional Socio-Economic Conditions, ch. 8; Jiang Tao, Renkou Yu Lishi, Zhongguo
Chuantong Renkou Jiego Yanjiu (Population and History, A Study of Chinese Traditional Demographic Structure)
(Beijing: People’s Press, 1998), p. 96.
34 Anon., Veritable Records of Emperor Gaozong of the Qing Dynasty, vol. 311, Entry ‘Shisannian Sanyue’ (The
Third Month of the Thirteenth Year under the Gaozong Reign).
35 James Lee, ‘Population Growth in Southwest China, 1250-1850’, The Journal of Asian Studies, 41/4 (1982), pp.
711-46.
36 Elvin, The Pattern of the Chinese Past, ch. 9.
37 Ester Boserup, The Conditions of Agricultural Growth: The Economies of Agrarian Change under Population
Pressure (London: Allen and Unwin, 1965).
38 Bray, The Rice Economies.

remained largely unchanged while the average rice yield level increased but modestly
(see Figure 5). This suggests that the Qing crop yield levels remained very stable over
time.39
Figure 5. Crop Yield Levels, 1640-1910
0
50
100
150
200
250
300
350
16
50
16
70
16
90
17
10
17
30
17
50
17
70
17
90
18
10
18
30
18
50
18
70
18
90
Average crop yield,
dou/mu
Rice single crop,
dou/mu
Wheat single crop,
dou/mu
Source: Shi Zhihong, ‘Shijiu Shiji Shangbanqide Zhongguo Liangshi Muchanliang Ji
Zongchanliang Zai Guji’ (Re-Estimation of Yields per Mu and the Aggregate Food
Output in Early Nineteenth Century China), Zhongguo Jingjishi Yanjiu (Research into
Chinese Economic History) 3 (2012), pp. 52-66.
Note: Rice and wheat crops only. (1) Average rice yields from 12 southern provinces
(Anhui, Jiangsu, Zhejiang, Hubei, Hunan, Jiangxi, Fujian, Guangdong, Guangxi, Sichuan,
Guizhou, Yunnan), (2) average wheat yields from 8 northern provinces (Zhili, Shandong,
Shanxi, Henan, Shaanxi, Gansu, Manchuria, Xinjiang), counting one crop only.
Similarly, Kang Chao has argued that, with China’s arable land being fixed, the Qing
peasantry had to farm more, and more intensively, to increase food provision.40 However,
the reality was that in Shandong, Jiangnan, Fujian and Guangdong — places where food
shortage perpetuated during the Qing — local farmers did not necessarily farm more
39 According to Wu Hui, there was mere a 1.7 percent increase in China’s crop yield level from the Ming to the Qing;
see Wu Hui, Zhongguo Jingjishi Rugan Wentide Jiliang Yanjiu (Quantitative Studies of Chinese Economic History)
(Fuzhou: Fujian People’s Press, 2009), p. 147.
40 Chao, Man and Land in Chinese History, ch. 1.

intensively for staple food.41 Instead, they often grew more cash crops, especially cotton,
tea and, later tobacco, in exchange for rice imported from food-surplus regions.42 This
was rural ‘involution’ in full swing.43 There were as many as ten shipping routes running
from rice-surplus provinces to cash crop producing provinces, transporting as much as
36-57 million piculs (shi) of rice per annum.44 Since one picul contained 75 kilograms,
this makes the total shipment 2.7-4.3 million tonnes. Given that it takes 180 kilograms of
cereal to maintain an adult at the subsistence level, approximately 15-24 million adults
were able to live entirely on imported rice in the four food-deficit provinces.
Other scholars see new crop species from outside the empire as a new driver for the
Qing population growth. These were the ‘New World crops’ – maize (Zea mays), white
potatoes (Solanum tuberosum) and sweet potatoes (Ipomoea batatas). 45 Anecdotal
41 Contemporary scholars such as Li Bozhong and Pomeranz mention little about the New World crops in the Ming-
Qing Jiangnan region. See Li Bozhong, Duoshijiao Kan Jiangnan Jingjishi, 1250-1850 (Multiple Dimensional View on
Economic History of the Jiangnan Region, 1250-1850) (Beijing: Sanlian Books, 2003); Kenneth Pomeranz, The Great
Divergence, Europe, China and the Making of the Modern World Economy (Princeton: Princeton University Press,
2000).
42 Chen Hua, Qingdai Quyu Shehui Jingji Yanjiu (Regional Socio-Economic Conditions during the Qing Period)
(Beijing: People’s University Press, 1996), pp. 106-7; K. L. So, Prosperity, Region, and Institutions in Maritime China,
the Fukien Pattern, 946-1368 (Cambridge [MA]: Harvard University Asia Center, 2000), pp. 95-6.
43 Philip Huang, The Peasant Economy and Social Change in North China (Stanford: Stanford University Press, 1985);
Chen Chunsheng and Liu Zhiwei, ‘Qingdai Jingji Yunzuode Liangge Tedian’ (Two Characteristics of Qing Economic
Operation), Zhongguo Jingjishi Yanjiu (Research into Chinese Economic History), 3 (1990), pp. 84-9.
44 Wu Chengming, Zhongguode Xiandaihua: Shichang Yu Shehui (China’s Modernisation: the Market and Society)
(Beijing: Sanlian Books, 2001), pp. 152-7; Zhang Haiying, Mingqing Jiangnan Shangpin Liutong Yu Shichang Tixi
(Commodity Flows and Market Structure in the Jiangnan Region during the Ming-Qing Period) (Shanghai: East China
Normal University Press, 2001), pp. 198-203; Wu, Quantitative Studies of Chinese Economic History, p. 376.
45 These crops were introduced in the following sequence: Sweet potato vines (fanshu, Ipomoea batatas) were
smuggled to China from Luzon in 1593. Maize (yumi, Zea mays) was first mentioned in Li Shizhen’s Compendium of
Materia Medica (Bencao Gangmu) written in 1578 (Reprint. Beijing: People’s Press, 1977), vol. 23; and then in Xu
Guangqi’s Nongzheng Quanshu (Complete Treatise on Agricultural Administration of 1628 (Reprint. Shanghai:
Shanghai Classics Press, 1979), p. 629. The white potato (malingshu, Solanum tuberosum) was first introduced to
Taiwan around 1650. See Guo Wentao, Zhongguo Nongyie Keji Fazhan Shilue (A Brief History of Development of
Agricultural Science and Technology in China) (Beijing: Chinese Science and Technology Press, 1988), pp. 383-4. Yet
until the 1630s, their spread was very limited. According to Song Yingxing’s Exploitation of the Works of Nature
(Tiangong Kaiwu) of 1637, seventy percent of the Chinese lived on rice and thirty percent on wheat, barley, sorghum
and millet. The New World crops were excluded; see Song Yingxing, Tiangong Kaiwu (Exploitation of the Works of

evidence suggests that in the early seventeenth century, sweet potatoes were able to yield
ten times (gross weight) that of rice;46 similarly, maize allegedly increased the land yield
by 30 percent.47 A common assumption has thus been made that there was a close link
between these crops and the fast growth in China’s population.48 In this study, we clarify
the role of the New World crops in regard to the Qing population growth. The spread of
new crops is our third factor.
A complicating issue, however, is that not until the first comprehensive survey of
China’s agrarian economy in the 1920s was the geographic spread of New World crops
ever systematically mapped.49 Therefore, due to data availability, we use maize as a
representative for these crops. Official records for the spread of sweet potatoes are
limited to the provincial level (18 provinces governed by the Qing Court).50 Official
records for maize are much better: at the county level (over 1,300 counties).51 However,
there is no record on the actual sown area for sweet potato or maize. Thus, we use the
Nature) (1637. Reprint. Guangzhou: Guangdong People’s Press, 1976), p. 11. These crops became better known during
the Qing Period.
46 Shi Shenghan, Nongzheng Quanshu Jiaozhu (Annotated Edition of the ‘Complete Treatise on Agricultural
Administration’) (Shanghai: Shanghai Classics Publisher, 1979), p. 692.
47 See J. K. Fairbank and Kwang-ching Liu (eds), Cambridge History of China, Late Ch’ing, 1800-1911, Part II
(Cambridge: Cambridge University Press, 1980), p. 11. Also see R. H. Myers, The Chinese Peasant Economy:
Agricultural Development in Hopei and Shangtung, 1890-1949 (Cambridge [MA]: Harvard University Press, 1970),
Appendix.
48 E.g. Mark Elvin, The Pattern of the Chinese Past (Stanford: Stanford University Press, 1973), p. 298; F. W. Mote,
Imperial China, 900-1800 (Cambridge [MA]: Harvard University Press, 1999), p. 750; L. E. Stover and T. K. Stover,
China: an Anthropological Perspective (Pacific Palisades [CA]: Goodyear Publishing Co., 1976), p. 115. See also, Lee
James, ‘Population Growth in Southwest China, 1250-1850’ The Journal of Asian Studies, 41/4 (1982), pp. 711-46; L.
E. Stover and T. K. Stover, China: an Anthropological Perspective (Pacific Palisades [CA]: Goodyear Publishing Co.,
1976), p. 115. See also, Lee James, ‘Population Growth in Southwest China, 1250-1850’ The Journal of Asian Studies,
41/4 (1982), pp. 711-46.
49 J. L. Buck, Land Utilization in China: Atlas (London: Oxford University Press, 1937).
50 Jia, Ruixue, ‘Weather Shocks, Sweet Potatoes and Peasant Revolts in Historical China’, The Economic Journal,
124/575 (2014), pp. 92-118; cf. Chen Shuping, ‘Yumi He Fanshu Zai Zhongguo Chuanbo Qingkuang Yanjiu’ (Studies
of the Spread of Maize and Sweet Potatoes in China), Zhongguo Shehui Kexue (Social Sciences in China), 3 (1980), pp.
188-204.
51 Xian Jinshan, ‘Cong Fangzhi Jizai Kan Yumi Zai Woguode Yinjin He Chuanbo’ (Adoption and Spread of Maize
Seen from Local Gazetteers), Gujin Nongye (Agriculture, Past and Present), 1 (1988), pp. 99-111.

geographic spread of maize-farming as a proxy for the new farming technology of the
time (see Figure 6).
Figure 6. Spread of Maize-farming (% of All Counties), 1650-1910
0
20
40
60
80
100
16
50
16
70
16
90
17
10
17
30
17
50
17
70
17
90
18
10
18
30
18
50
18
70
18
90
19
10
Source: Xian Jinshan, ‘Cong Fangzhi Jizai Kan Yumi Zai Woguode Yinjin He Chuanbo’
(Adoption and Spread of Maize Seen from Local Gazetteers), Gujin Nongye (Agriculture,
Past and Present), 1 (1988), pp. 99-111.
The fourth factor we consider is the tax burden imposed on the citizenry. We are fully
aware rent-seeking by the gentry class in the form of local dues/surcharges on the village
level and often against the law. However, one has to distinguish gentry’s rent-seeking
from legal revenue extraction by the state. After all, the number of officials on the Qing
government payroll was a trivial fraction of the Imperial Degree-holders in society.52 One
has to separate salaried officials from non-salaried gentry members. Otherwise, the state
behaviour will no longer be identifiable. In the beginning of the Qing rule, the heavy
taxes of the previous Ming Period were abandoned, a policy known as ‘abolishment of
52 To understand where the gentry ended and the bureaucracy began during the Qing, see Chung-li Chang, The
Chinese Gentry: Studies on Their Role in Nineteenth-Century Chinese Society (Seattle: University of Washington Press,
1955), pp. 83-92; J. K. Fairbank, Chinese Thought and Institutions (Chicago: Chicago University Press, 1957), pp. 251-
68; Ping-ti Ho, The Ladder of Success in Imperial China (New York: Columbia University Press, 1962), p. 262; Deng
Ciyu, Zhongguo Kaoshi Zhidu Shi (History of the Chinese Imperial Examination System) (Taipei: Xuesheng Books,
1967), pp. 163-4; and Wang Dezhao, Qingdai Keju Zhidu Yanjiu (Civil Examinations during the Qing Period) (Hong
Kong: The Chinese Univerisyt Press, 1982), pp. 65-6.

the Ming practice’ (fei mingfa).53 Until 1840 when fiscal crises occurred, the Qing
bureaucracy maintained strong distaste for tax increases.54 In 1712, the total revenue of
the Land-Poll Combined Tax (diding) was frozen for good to allow surpluses to be
retained by ordinary households.55 As a result, the highest annual tax revenue collected in
grain under the Qing (as of 1820) was 29 percent of its Ming counterpart (as of 1502).
The Qing tax burden per unit of land (as of 1661) was 17 percent of the peak of the Ming
(as of 1542).56 The Qing tax burden per capita (as of 1766) was 8 percent of the Ming (as
of 1381). 57 Conceptually, a significantly declining tax burden benefited population
growth (see Figure 7).
Figure 7. Tax Burden Indices (1660 = 100), 1660-1900
0
20
40
60
80
100
120
140
16
60
16
80
17
00
17
20
17
40
17
60
17
80
18
00
18
20
18
40
18
60
18
80
19
00
Per capita silver tax
index
Per mu grain tax
index
Sources: Population is based on Deng, ‘Unveiling China’s True Population Statistics’.
Farmland is based on Liang, Dynastic Data, pp. 396, 400, 401. Taxes are based on Liang,
Dynastic Data, pp. 10, 380, 384; Xiang Huaicheng, Zhongguo Caizheng Tongshi (A
53 Zhao, Draft of the History of the Qing Dynasty, vol. 14 ‘Shizuji Yuannian’ (Biography of Emperor Shizu, the First
Year of His Reign).
54 W. J. Peterson (ed.), The Cambridge History of China (Cambridge: Cambridge University Press, 2002), vol. 9. pp.
604-5.
55 Deng, China’s Political Economy, pp. 16-18.
56 Gang Deng, The Premodern Chinese Economy – Structural Equilibrium and Capitalist Sterility (London and New
York: Routledge, 1999), p. 124.
57 Liang, Dynastic Data, p. 428.

General History of Government Finance in China) (Beijing: China’s Finance Press,
2006), vol. 8, pp. 78, 222.
Exogenous shocks can also affect the standing population. During the first 100 years of
the Qing rule, while the number of natural disasters increased, the total number of all
disasters (natural and man-made) declined (see Figure 8).
Figure 8. Qing Disaster Index (1646 = 100), 1646-1910
0
25
50
75
100
125
150
175
200
225
250
16
45
16
65
16
85
17
05
17
25
17
45
17
65
17
85
18
05
18
25
18
45
18
65
18
85
19
05
All disaster index
Natural destaster index
Source: Chen Gaoyong, Zhongguo Lidai Tianzai Renhuo Biao (Chronological Tables of
Chinese Natural and Man-made Disasters) (Shanghai: Jinan University Press, 1937).
We consider government spending on disaster relief as the fifth factor. Ever since the
early Qing, the state provided the population with a safety net against famine (see Figure

9).58 Relief aid during a bad year sometimes exceeded the state annual tax revenue
several times over.59
Figure 9. Qing Disaster Relief Recipient Index (1646 = 100), 1646-1910
0
50
100
150
200
250
300
350
400
16
40
16
60
16
80
17
00
17
20
17
40
17
60
17
80
18
00
18
20
18
40
18
60
18
80
19
00
Source: Zhao Erxun, Qingshi Gao (Draft of the History of the Qing Dynasty) (1927), vols
4-25 ‘Benji’ (Biographies of the Qing Emperors), in Er-shi-wu Shi (Twenty-Five Official
Histories) (Shanghai: Shanghai Classics Press, 1986), vol. 11, pp. 8827-8937.
Note: Recipient county as the basic accounting unit.
Over the course of its reign, the Qing state managed 1,672-1,704 counties. 60 As
indicated in Table 2, our preliminary observations indicate that all counties were covered
29 times by aid schemes. Densely populated core farming zones received more aid than
the periphery (see Table 3).
58 Pierre-Etienne Will, Bureaucracy and Famine in Eighteenth-Century China (Stanford: Stanford University Press,
1990); Pierre-Etienne Will and R. B. Wong, Nourish the People: the State Civilian Granary System in China, 1650-
1850 (Ann Arbor: University of Michigan Center for Chinese Studies, 1991); Kent Deng, China’s Political Economy in
Modern Times (London: Routledge, 2011), pp, 19-24.
59 W. J. Peterson (ed.), The Cambridge History of China (Cambridge: Cambridge University Press, 2002), vol. 9, pt. 1,
p. 307.
60 Zhao, History of the Qing Dynasty, vols 54-81 ‘Dili Zhi’ (Administrative Geography), in Twenty-Five Official
Histories, vol. 11, pp. 9071-9131.

Table 2. Disaster Relief Coverage, 1674-1911
Year Tax exemptions* Aid hand-outs* Total (A) * A/B† index
1674-1723 3,281 – 3,281 2.0
1724-73 9,784 6,082 15,866 9.5
1774-1823 8,850 1,889 10,739 6.4
1824-73 7,295 3,004 10,299 6.2
1874-1911 6,278 2,465 8,743 5.2
Total 35,443 13,440 48,883 29.2
Annual average 149.5 56.7 206.3
Source: Zhao, History of the Qing Dynasty, vols 4-25 ‘Benji’ (Biographies of the Qing
Emperors), in Twenty-Five Official Histories, vol. 11, pp. 8827-8937.
Note: * Total recipient counties. † Calculated based on 1,672 counties.
Table 3. Provincial Aggregate Disaster-Aid Entries, 1644-1911
Provincial entries % in China’s total
Northern core farming provinces 693 40.7
Southern core farming provinces 677 39.7
Northern periphery farming provinces 148 8.7
Southern periphery farming provinces 170 10.0
Non-farming provinces 16 0.9
Total entries 1,704*
Total shares 100.00

Source: Zhao, Draft of the History of the Qing Dynasty, vols 4-25 ‘Benji’ (Biographies of
the Qing Emperors) and vols 54-81 ‘Dili Zhi’ (Administrative Geography), in Twenty-
Five Official Histories), vol. 11, pp. 8827-8937, 9071-9131.61
Note: Northern core farming provinces: Zhili, Henan, Shandong, Shanxi, Shaanxi, and
Gansu. Southern core farming provinces: Anhui, Jiangsu, Zhejiang, Hubei, Hunan,
Jiangxi, Fujian, Guangdong. Northern periphery farming provinces: Fengtian, Jilin,
Heilongjiang, and Xinjiang. Southern periphery farming provinces: Sichuan, Guizhou,
Guangxi, Yunnan, and Taiwan. Non-farming provinces: Tibet, Qinghai, Chahar, and
Mongolia. * Including country-equivalent units.
The cost of living represents the sixth major factor influencing population. Studies by
scholars like Kenneth Pomeranz, Fang Xing, Bozhong Li, Fan Jinmin, and Gao Wangling
have indicated that until circa 1850 ordinary rural Chinese lived rather well.62 We use
food prices and currency purchasing power as proxies for the cost of living. The most
complete records of prices are those from the urban market of the Lower Yangtze Valley
(see Figure 10).
Figure 10. Average Urban Rice Prices in Jiangsu and Zhejiang, 1740-1910
61 Zhao’s history is commonly recognised authoritative for the Qing dynasty, ranked equally with all the official
histories of the other dynasties.
62 Pomeranz, Kenneth, The Great Divergence, Europe, China and the Making of the Modern World Economy
(Princeton: Princeton University Press, 2000), ch. 1; Fang Xing, ‘Qingdai Diannongde Zhongnonghua’ (Tenants
Joining the Middle-Income Group during the Qing Period), Zhongguo Xueshu (Chinese Academics) 2 (2000), pp. 44-
61; Li Bozhong, ‘Rengen Shimu Yu Mingqing Jiangnan Nongminde Jingying Guimo’ (The Practice of ‘Ten Mu per
Farmer’ and the Scale of the Traditional Peasant Economy), Zhongguo Nongshi (Agricultural History of China), 1
(1996), pp. 1-14; Fan Jinmin, Guoji Minsheng, Mingqing Shehui Jingji Yanjiu (National Economy and People’s
Livelihood in the Ming-Qing Period) (Fuzhou: Fujian People’s Press, 2008); Gao Wangling, Zudian Guanxi Xinlun:
Dizhu, Nongmin He Dizu (New Theory of Tenancy: Landlords, Tenants and Rents) (Shanghai: Shanghai Books, 2005).

1
1.5
2
2.5
3
3.5
4
17
40
17
50
17
60
17
70
17
80
17
90
18
00
18
10
18
20
18
30
18
40
18
50
18
60
18
70
18
80
18
90
19
00
19
10
Jiangsu average
Zhenjiang average
Source: Yejian Wang, The Database of Grain Prices in the Qing Dynasty. Institute of
Modern History, Academia Sinica, 2013.
Note: * In amount of silver (taels) per shi of rice. Prices of the Ninth Month when supply
was plenty. Locations were the seats of governments of the named prefectures.
Given its use throughout the Qing era as currency, we also construct a silver purchasing
power index — measured by amount of rice one tael of silver purchased — to gauge the
cost of living (see Figure 11). At first glance, the silver purchasing power index seems to
move in the opposite direction of rice prices. This would suggest that the increase in rice
prices might have been dictated more by inflations of the silver currency, as opposed to
population pressure.
Figure 11. Silver Purchasing Power Index (1646 = 100),* 1640-1910

0
50
100
150
200
250
300
350
400
1640
1660
1680
1700
1720
1740
1760
1780
1800
1820
1840
1860
1880
1900
Sources: (1) Before 1693, based on Ye Mengzhu, Yueshi Bian (Record of Life-time
Experience in Songjiang) (c. 1688. Reprint. Shanghai: Shanghai Classics Press, 1981),
vol.7, pp. 153-4; Yao Tinglin, Linian Ji (Personal Annals) (c. 1698. Reprint. Shanghai:
Shanghai People’s Press, 1982), pp. 43-156. (2) During 1693-1722, based on Department
of Archives, Palace Museum (ed.), Li Xu Zouzhe (Li Xu’s Memorials to the Throne)
(Beijing: Zhonghua Books, 1976), pp. 1-293. (3) During 1723-35, based on H. S. Chuan
and R. A. Kraus, Mid-Ch’ing Rice Markets and Trade: An Essay in Price History (East
Asian Research Center, Harvard University, 1975), pp. 145-8. (4) After 1736, based on
Wang, The Database of Grain Prices.
Note: * The index represents the amount of rice one silver tael was able to buy. Data are
from Jiangsu Province of the Lower Yangtze.
Alternatively, we use the terms of trade between cotton cloth and rice. The cotton cloth
price relative to per unit of rice shows a downward trend similar to silver purchasing
power index (see Figure 12). There exists no evidence indicating any significant technical
progress in cotton farming and cotton textile production to drive relative cotton prices
down.63 Hence, it is apparent that food became substantively more expensive during the
Qing.
63 Xu Xinwu, Jiangnan Tubu Shi (A History of Homemade Cotton Cloth in the Lower Yangtze Delta) (Shanghai:
Shanghai Social Sciences Press, 1989).

Figure 12. Rice-Cloth Terms of Trade Index (1700 = 100),* 1700-1910
0
50
100
150
2001
70
0
17
20
17
40
17
60
17
80
18
00
18
20
18
40
18
60
18
80
19
00
Sources: Huang Miantang, Zhongguo Lidai Wujia Wenti Kaoshu (Study of Prices in
China’s History over the Long Term) (Jinan: Qilu Books, 2007), pp. 10, 11-12, 47-9, 52-
7, 61-5, 101-7, 109-14, 314, 318-21, 330-3, 336-9 ; Xu Xinwu, Jiangnan Tubu Shi (A
History of Homemade Cotton Cloth in the Lower Yangtze Delta) (Shanghai: Shanghai
Academy of Social Science Press, 1989), pp. 176, 201; Yu Yaohua, Zhongguo Jiage Shi
(A History of Prices in China) (Beijing: China’s Prices Press, 2000), pp. 805, 921-2,
929.64
Note: * Amount of rice (urban prices) per bolt of cotton cloth was able to buy. Cloth
here is measured in three zhang per bolt, a common unit for tax payment and domestic
trade. Rice means white rice, husked and ready to cook.
Meanwhile, rice prices and population growth moved at the different rates and in
different directions (see Figure 13). As such, a more in depth analysis is necessary in
order to understand the impact of cost of living on population growth.
Figure 13. Index Values for Changes in Local Population and Urban Rice Prices, 1775/6-
1820
64 For much lower cotton cloth pries, see Xu Xinwu, Jiangnan Tubu Shi (A History of Homemade Cotton Cloth in the
Lower Yangtze Delta) (Shanghai: Shanghai Academy of Social Science Press, 1989), pp. 92, 94.

Source: See Table 4.
Note: Prefectures in the Lower Yangtze.
Table 4. Changes in Local Total Population (Both Rural and Urban) and Rice Prices
Prefecture 1775/6 (A) 1820 (B) Index (B/A x 100)
A. Jiangsu Province
1. Changzhou
Population* 311.5 389.6 115
Rice prices† 1.8 2.1 117
2. Haizhou
Population* 103.3 122.6 119
Rice prices† 1.8 3.2 178
3. Huai-an
Population* 263.0 300.0 114
Rice prices† 2.0 2.4 120

4. Jiangning
Population* 394.1 525.2 133
Rice prices† 1.9 2.1 111
5. Songjiang
Population* 227.7 263.2 116
Rice prices† 1.7 2.0 118
6. Suzhou
Population* 511.1 590.8 116
Rice prices† 1.9 2.1 111
7. Taichang
Population* 142.3 177.2 125
Rice prices† 2.1 2.5 119
8. Tongzhou
Population* 245.5 280.1 114
Rice prices† 2.1 2.4 114
9. Yangzhou
Population* 515.7 666.3 129
Rice prices† 2.1 2.1 100
10. Zhenjiang
Population* 177.0 219.5 124
Rice prices† 2.0 2.3 115
B. Zhejiang Province
11. Hangzhou
Population* 268.2 319.7 119
Rice prices† 1.8 2.3 128
12. Huzhou
Population* 215.3 256.8 119
Rice prices† 1.8 2.2 122
13. Jiaxing
Population* 235.3 280.5 119
Rice prices† 1.9 2.1 110

14. Jinhua
Population* 204.8 255.0 125
Rice prices† 1.5 2.4 160
15. Ningbo
Population* 186.1 235.6 127
Rice prices† 1.7 2.2 129
16. Quzhou
Population* 102.0 114.1 112
Rice prices† 1.6 2.1 131
17. Shaoxing
Population* 426.5 539.2 126
Rice prices† 1.9 2.1 111
18. Taizhou
Population* 222.7 277.4 125
Rice prices† 1.6 2.2 138
19. Wenzhou
Population* 162.0 201.7 125
Rice prices† 1.4 1.7 121
20. Yanzhou
Population* 127.4 146.1 115
Rice prices† 1.6 2.5 156
Source: Population data are based on Ge, A Demographic History of China, Vol. 5, pp.
87-8, 113.
Note: * In 104 persons. † Silver taels per picul.
Overall, most explanations presented here are based on the back-of-the-envelope style
of calculations. The present research seeks to address this issue more comprehensively by
employing a quantitative approach that allows for the independent and simultaneous
effects of the identified factors to be estimated and analysed. To that end, we have

developed an extensive dataset drawn from Qing sources. The key data of population,
farmland, tax regimes and burden, government revenues and expenditures, food prices,
China’s territorial borders, and disasters and disaster relief, are extracted from the
following authoritative works: Zhao Erxun’s Qingshi Gao (Draft of the History of the
Qing Dynasty), Liang Fangzhong’s Zhongguo Lidai Hukou Tiandi Tianfu Tongji
(Dynastic Data for China’s Households, Cultivated Land and Land Taxation), Xiang
Huaicheng’s Zhongguo Caizheng Tongshi (A General History of Government Finance in
China), Peng Xinwei’s, Zhongguo Houbishi (A History of Currencies in China), H. S.
Chuan and R. A. Kraus’ Mid-Ch’ing Rice Markets and Trade: An Essay in Price History,
Yeh-chien Wang’s ‘Secular Trends of Rice Prices in the Yangzi Delta, 1638-1935’,
Yejian Wang’s The Database of Grain Prices in the Qing Dynasty, Zhongguo Houbishi
(A History of Currencies in China), Tan Qixiang’s Jianming Zhongguo Lishi Dituji
(Concise Maps of Chinese History), Chen Gaoyong’s Zhongguo Lidai Tianzai Renhuo
Biao (Chronological Tables of Chinese Natural and Man-made Disasters), and Fu
Zhongxia, Zhang Xing, Tian Zhaolin, and Yang Boshi’s Zhongguo Junshi Shi (A Military
History of China). All of these works are based on confirmed government records which
are commonly regarded as the best available information sources.
Information regarding silver purchasing power comes from local accounts in the Lower
Yangtze River: Ye Mengzhu’s Yueshi Bian (Record of Life-time Experience in
Songjiang), Yao Tinglin’s Linian Ji (Personal Annals), and Department of Archives’ Li
Xu Zouzhe (Li Xu’s Memorials to the Throne), H. S. Chuan and R. A. Kraus’ Mid-Ch’ing
Rice Markets and Trade: An Essay in Price History, Yeh-chien Wang’s ‘Secular Trends
of Rice Prices in the Yangzi Delta, 1638-1935’, Yejian Wang’s The Database of Grain
Prices in the Qing Dynasty, Zhongguo Houbishi (A History of Currencies in China).
Internal migration figures are based on Ge Jianxiong’s Zhongguo Yimin Shi (A History
of Migration in China), a comprehensive five-volume study based heavily on local
government records.
Information on the spread of maize-farming comes from detailed accounts of the
adoption of the new crops as recorded in Qing local gazetteers (fangzhi), presented in
Xian Jinshan’s ‘Cong Fangzhi Jizai Kan Yumi Zai Woguode Yinjin He Chuanbo’

(Adoption and Spread of Maize Seen from Local Gazetteers). Local gazetteers are
commonly regarded as a reliable source of information, too.
Qing crop yield levels are based on Shi Zhihong’s ‘Shijiu Shiji Shangbanqide
Zhongguo Liangshi Muchanliang Ji Zongchanliang Zai Guji’ (Re-Estimation of Yields
per Mu and the Aggregate Food Output in Early Nineteenth Century China), a work that
systematically tests all the main estimates hitherto. Shi’s analysis covers twelve southern
provinces (Anhui, Jiangsu, Zhejiang, Hubei, Hunan, Jiangxi, Fujian, Guangdong,
Guangxi, Sichuan, Guizhou, Yunnan), enough to serve as a proxy for the improvement in
the existing technology in food production.65 Shi’s yield range is similar to John Buck’s
comprehensive surveys in the 1920s.66 We decide to use Shi’s information not only due
to its economy-wide vision, but also because of its realistically modest approach
compared with many regional ‘anecdotes-based’ or ‘best practice-based’ claims.67
Due to the lack of data, goods for trade in the Qing economy have to come from
estimates. To strike a balance, we compared four major works, two in Chinese and two in
English: (1) Wu Chengming’s Zhongguode Xiandaihua: Shichang Yu Shehui (China’s
Modernization: Market and Society), (2) Liu Foding, Wang Yuru and Zhao Jin’s
Zhongguo Jindai Jingji Fazhan Shi (A History of Economic Development in Early
Modern China), (3) Chung-li Chang’s The Income of the Chinese Gentry, and (4) Albert
Feuerwerker’s The Chinese Economy, 1870-1949. However, given that the market share
of the Qing economy plays no part in our modelling, any inaccuracy in this respect has no
bearing on our analysis.
Table 5 contains a complete list of data sources.
Table 5. Sources of Variables
Variable (Type) Sources
65 Note: the average wheat yield level in eight provinces in North China (Zhili, Shandong, Shanxi, Henan, Shaanxi,
Gansu, Manchuria, and Xinjiang) did not have much change and is thus unsuited for our purpose.
66 Buck, Land Utilization in China: Atlas, pp. 4, 49.
67 Shi published a new version of in 2015: Shi Zhihong, ‘Qingdai Nongye Shengchan Zhibiaode Guji’ (Estimation of
Rural Production Parameters’, Zhongguo Jingjishi Yanjiu (Research into Chinese Economic History) 5 (2015), pp. 5-30.
But the genral trend of his two works are the same. We thus stick to his 2012 results.

Population (LP) (Dependant)
Qing official figures: Liang, Dynastic Data, p.
10; Deng, ‘Unveiling China’s True Population
Statistics’, Appendix 2.
Farmland, mu (LLAND) (Predictor)
Qing official figures: Liang, Dynastic Data,
pp. 10, 380, 384, 396, 400, 401.
Rice output level (single crop),
dou/mu (LOUTPUT) (Predictor)
Crop yield levels (dou/mu): Shi Zhihong, ‘Re-
Estimation of Yields per Mu and the
Aggregate Food Output in Early Nineteenth
Century China’, pp. 52-66.
Maize-farming (recipient counties)
(LMAIZE) (Predictor)
Xian, ‘Adoption and Spread of Maize Seen
from Local Gazetteers’.
Agricultural tax (Land-Poll and
Stipend Rice) (LTAX) (Predictor)
Qing official figures: Liang, Dynastic Data,
pp. 10, 380, 384, 396, 400, 401, 414-16, 482;
also Xiang, A General History of Government
Finance, vol. 8, pp. 78, 222.
Number of disasters and wars
(LWARDI) (Control)
Disasters: Chen, Chronological Tables of
Chinese Natural and Man-Made Disasters.
Wars: Fu et al., A Military History of China,
pp. 65-85.
Disaster relief (counting recipient
counties) (LRELIEF) (Control)
Qing official records: Zhao, History of the
Qing Dynasty, vols 4-25 ‘Benji’ (Biographies
of the Qing Emperors), in Twenty-Five
Official Histories, vol. 11, pp. 8827-8937.
Prices of rice, taels/shi
(LPRICE) (Control)
Official figures: Wang, ‘Secular Trends of
Rice Prices in the Yangzi Delta, 1638-1935’;
Wang, The Database of Grain Prices in the
Qing Dynasty; Peng, A History of Currencies
in China, pp. 824-5, 837, 844, 850-1.
Silver purchasing power index
(LINDEX) (Control)
Period information: Ye, Record of Life-time
Experience in Songjiang; Yao, Personal

Annals; Department of Archives, Palace Museum
(ed.), Li Xu’s Memorials to the Throne);
Wang, Database of Grain.
II. Hypothesis and Modelling
Our hypothesis is that the sustained population growth during the Qing period was the
result of a range of factors: (1) farmland availability, as the main resource base of the
economy, (2) crop yield level, which determined a food stock for a population to live on,
(3) maize adoption and adaptation, which serves as a proxy for new farming technology,
and (4) direct taxes (Land-Poll and Stipend Rice Tax) imposed on land and population, a
deduction of wealth from households. Hence, our dependent variable is the growth in
population (P); and our four predictors are farmland availability (LAND), crop output
level (OUTPUT), maize adoption/adaptation (MAIZE), and agricultural taxes (TAX).
Moreover, we include four control variables in our model. The first control is the
combined number of wars and natural disasters to represent shocks on the standing
population. The second is the number of counties receiving government disaster-relief to
assist the standing population. The third is the price of rice (the primary staple food),
which reflects cost of living. Our fourth control is the silver purchasing power index, to
check on food prices. In the model these four controls coded as WARDI, RELIEF,
PRICE, and INDEX, respectively.
Our population figures are ‘numbers of persons’ (kou) counted by the state. We avoid
modern estimates as a matter of principle.68 While the accuracy of the official data has
68 E.g. China’s regional population figures published in Cao Shuji’s Zhongguo Renkou Shi Qing Shiqi (A Demographic
History of China, the Qing Period) (Shanghai: Fudan University Press, 2000), which are a mix of sporadic period
record and modern estimates. Serious doubts remain regarding the legitimacy of taking estimates for real data, despite
the fact that some inspiring works have come out by applying Cao’s figures, such as Ruixue Jia, ‘Weather Shocks,
Sweet Potatoes and Peasant Revolts in Historical China’, The Economic Journal, 124/575 (2014), pp. 92-118; Shuo
Chen and James Kung, ‘Of Maize and Men: The Effect of a New World Crop on Population and Economic Growth in
China’, Journal of Economic Growth, 12/1 (2016), pp. 71-99.

been questioned,69 there has been no independent information to verify either the Qing
official data or recent estimates. In terms of farmland, the practice of land acreage
conversion (zhe mu) is well understood, a system under which all farmland was
commonly converted into a bench-mark mu for taxation purposes.70 Therefore, the mu
figures cited in Qing official documents only make sense if one imagines that all the Qing
farmland had the identical medium fertility. Figures after official conversion still reflect
the size of the Qing resource basis for food production.
Regarding the burden of direct taxes, we incorporate two types of agricultural taxes: (1)
the main type called the Land-Poll Combined Tax (diding) collected in silver from all 18
provinces, and (2) the auxiliary type called Stipend Rice Tax (cao mi, cao liang)
collected exclusively in grain from 8 provinces along the Grand Canal and its inter-
connected rivers.71 Both direct taxes claimed the lion’s share of the Qing government
revenue. Given that any cash payment for the Land-Poll Combined Tax usually came
from peasant grain sales at market, both taxes must have had the same grain origin. Thus,
we convert all the monetary tax payments back to grain (shi) according to the current
prices. Our tax burden is measured by tax revenue per mu of farmland to make it
agriculture-specific.
Here, a paradox emerges regarding tax payment in food. On the one hand, such
payment constituted a deduction of households’ food stock which would have otherwise
been used to support more children. On the other, food surrendered by the peasantry to
the state may not have all been wasted. Rather, it could be consumed by someone else in
69 E.g. G. W. Skinner, ‘Sichuan’s Population in the Nineteenth Century’, Late Imperial China, 8/1 (1987), pp. 1-79.
Noted, Sichuan during the Qing was one of the 18 provinces. It remains unclear the extent of the problem.
70 Liang, Dynastic Data, p. 528, and Zhao Yun, ‘Jishu Wucha, Zhemu Jiqi Juli Shuaijian Guilü Yanjiu’ (Technical
Errors: Land Unit Conversion and the Law of Diminishing Distance), Zhongguo Shehui Jingjishi Yanjiu (Research into
Chinese Social and Economic History), 3 (2007), pp. 1-13; Shi Zhihong, ‘Shijiu Shiji Shangbanqide Zhongguo
Liangshi Muchanliang Jiqi Zongchanliang Zai Guji’ (Re-Estimation of Yields per Mu and the Aggregate Food Output
in Early Nineteenth Century China), Zhongguo Jingjishi Yanjiu (Research into Chinese Economic History) 3 (2012), p.
55; and Shi Zhihong, ‘Qingdai Nongye Shengchan Zhibiaode Guji’ (Estimation of Rural Production Parameters’,
Zhongguo Jingjishi Yanjiu (Research into Chinese Economic History) 5 (2015), pp. 6-7.
71 Zai Ling, Caoyun Quanshu (Complete Records of Stipend Rice Shipping) (N.d. Reprint. Beijing: Beijing Library
Press, no date); Li Wenzhi and Jiang Taixin, Qingdai Caoyun (Stipend Rice during the Qing Period) (Beijing:
Zhonghua Books, 1995).

the economy, be they officials, soldiers and artisans. Non-farming families would have
babies, too. Therefore, in theory, taxes merely redistributed food instead of destroying it.
In reality, however, food was perishable. Regular spoilage during transport and storage
was inevitable. In that sense, the deduction was real.
In addition, a farmland-cum-tax regime affected farmers’ production perspectives and
incentives. It could channel resources to non-food production, and hence reduced food for
potential population growth. So, when rural households paid taxes in cash, that cash
payment could come from sales of non-food produce which in turn represented
opportunity costs for amount of food that would otherwise be produced.
Aside from land taxes, a few minor taxes such as the Salt Tax (yanke) and Customs
Duties (guanshui) were imposed during the Qing. There was also the notorious ‘Transit
Levy’ (lijin or likin). But these were indirect taxes and hence linked to consumers’
choices and are therefore unsuited for our analysis.
Table 6 contains descriptive statistics of variables before their logarithmic conversion.
Table 6. Descriptive Statistics of Variables
Variables Mean S.D. Min Max Obs. Period
Population, 106 237.00 14.60 38.60 39.90 118 1655-1911
Farmland, 106 mu
(LAND) 72.70 10.60 38.80 91.20 104 1655-1877
Rice output level,
dou/mu
(OUTPUT) 313.008 7.515 306 321 122 1646-1911
Maize-farming
(counties)
(MAIZE) 709.287 691.037 113 1944 122 1646-1911
Disasters and
wars (WARDI) 13.672 8.102 2 56 122 1646-1911

Disaster relief
(counties)
(RELIEF) 592 454.675 0 1929 90 1646-1911
Rice Prices
taels/shi (PRICE) 1.919 0.906 0.6 6.2 121 1646-1911
Silver purchasing
power index
(INDEX) 126.486 67.384 37 392.2 112 1646-1911
Agricultural taxes,
in shi (TAX) 0.034 0.016 0.01 0.099 102 1661-1906
Source: See Table 5.
Admittedly, the available data in all 77 China-wide observations have some irregular
gaps in the time series,72 as well as a lack of county-level or prefecture-level information,
which limits our choices of analysis, a problem commonly faced by modern
researchers.73 Technically, we are therefore forced not to carry out the usual tests and
analyses, namely, unit root, autocorrelation, Heteroskedasticity and Autocorrelation
Consistent Standard Error, de-trended and cointegration analyses. Our second best option
is to apply Ordinary Least Squares (OLS) with the Standard Error (SE) to yield robust
results instead of perfecting the time series per se (which seems to be an impossible task
at the moment due to the information constraint).
III. Estimation Strategy and Empirical Results
72 But our data are relatively evenly spread out across the time period in question.
73 E.g. the most recent works by Ruixue Jia, ‘Weather Shocks, Sweet Potatoes and Peasant Revolts in Historical
China’, The Economic Journal 124/575 (2014), pp. 92-118, a work that uses no population datum; Shuo Chen and
James Kung, ‘Of Maize and Men: The Effect of a New World Crop on Population and Economic Growth in China’,
Journal of Economic Growth (2016), pp. 1-29, a work that is based on only six population figures; DOI
10.1007/s10887-01609125-8.
We first conduct an analysis of correlation coefficients of the logged values of one
dependent, four explanatory, and four control variables. Doing so suggests potentially
high levels of collinearity between LLAND, LTAX, and LPRICE: i.e. the correlation
coefficients between LLAND and LTAX, between LTAX and LPRICE, and between
LLAND and LPRICE are -0.7318, -0.9380 and 0.4861, respectively. This is well
expected, considering (1) the deliberate policy of the Qing state of ‘embedding the Poll
Tax in farmland’ (tanding rumu) and (2) the conversion of tax payment from grain to
silver. As a result, we exclude LTAX from modified Models 1 and 2.
The next step in our analysis is to examine the determinants for Qing population growth
with a log-linear model with OLS and SE as Model 1:
LPt = + 1LLANDt + 2LOUTPUTt + 3LMAIZEt + 4LWARDIt+ 5LRELIEFt+
6LPRICEt + error (1)
To perform more robustness checking, modified Model 2 replaces rice prices
(LPRICEt) with silver purchasing power index (LINDEXt) to detect the impact of silver
currency on population:74
LPt = + 1LLANDt + 2LOUTPUTt + 3LMAIZEt + 4LWARDIt + 5LRELIEFt +
6LINDEXt + error (2)
Further, modified Model 3 replaces farmland (LLANDt) and rice prices (LPRICEt) with
taxes (LTAXt) to reveal the impact of taxes on population:
LPt = + 1LOUTPUTt + 2LMAIZEt + 3LWARDIt + 4LRELIEFt + 5LTAXt +
error (3)
74 Rice prices and silver purchasing power are both denominated in the silver currency (taels).

Our results are displayed in Table 7 where Columns (1), (2) and (3) correspond to
Models 1, 2 and 3, respectively. As expected, farmland (LLANDt), rice output level
(LOUTPUTt), adoption of maize-farming (LMAIZEt) and disaster relief (LRELIEFt) are
all positively related to population growth (LPt); and disasters and wars (LWARDIt),
negatively related to it, ceteris paribus. The high adjusted R2 values indicate that all three
models capture most variation of the dependent variable. Moreover, as expected, all
coefficients with Model 1 are at the level of 95% significance or higher. In Models 2 and
3, silver purchasing power and taxes are negatively related to population on the 1%
significance level.
Table 7. Results with SE
Log of Population
(1) (2) (3)
Farmland (LLANDt) 0.910 0.676
(0.340)*** (0.364)*
Rice output level (LOUTPUTt) 14.602 13.699 14.449
(2.873)*** ( 2.791)*** (2.779)***
Adoption of maize (LMAIZEt) 0.235 0.173 0.259
(0.060)*** (0.067)** (0.068)***
Disasters and wars (LWARDIt) -0.226 -0.216 -0.265
(0.086)** (0.086)** (0.091)***
Disaster relief (LRELIEFt) 0.100 0.097 0.131
(0.034)*** (0.032)*** (0.032)***
Rice prices (LPRICEt) 0.327
(0.110)***
Silver’s purchasing power index (LINDEXt) -0.498
(0.134)***
Total direct taxes (LTAXt) -0.431
(0.119)***
Obs 77 71 75

Adj R2 0.880 0.875 0.868
Note: (1) SE readings are in parentheses. (2) , and are significant at the 1%, 5% and
10% levels, respectively.
The impact of either LPRICEt or LINDEXt, is however more complicated. LPRICEt in
Model 1 is positively related to population growth; LINDEXt in Model 2 is negatively
related to population growth. This is because the greater the currency’s purchasing
power, the lower the general price level and hence the lower the cost of living, and vice
versa. Thus, the impact of market prices and silver purchasing power moves in opposite
directions.
Additionally, a positive correlation between rice prices and population growth seems
counter-intuitive. A deeper reason lies in the dualistic nature of China’s market in
general and its food market in particular during the Qing. Firstly, although some studies
have linked commercial expansion with population growth,75 the Qing Period was not
known for an unusual growth in trade and capitalism. Throughout most of the Qing
Dynasty, the share of trade in China’s GDP remained tiny: only 5.5 percent of the grain
output ever entered the intra-regional commodity chain (see Table 8).76 This made the
Qing Period very different from the Song (960-1279 AD), when population growth was
fuelled by an unprecedented degree of commercialisation and proto-industrialisation.77
Table 8. China’s Annual Trade in Value, the 1830s
Market value, in tonnes of silver % in total
1. Rural sector
75 Li Bozhong, Duoshijiao Kan Jiangnan Jingjishi, 1250-1850 (Multiple Dimensional View on Economic History of
the Jiangnan Region, 1250-1850) (Beijing: Sanlian Books, 2003); Li Bozhong and J. L. van Zanden, ‘Before the Great
Divergence? Comparing the Yangzi Delta at the Beginning of the Nineteenth Century’, Journal of Economic History
72 (2012), pp. 956-90.
76 Wu, Quantitative Studies of Chinese Economic History, pp. 374, 376.
77 K. Deng and L. Zheng, ‘Economic Restructuring and Demographic Growth, Demystifying Growth and
Development in Northern Song China, 960-1127’, Economic History Review, vol. 68, no. 4 (2015), pp. 1107-31.

Grain78 6,123.8 41.0
Cotton fibre and cotton cloth 4027.5 27.0
Tea 1,196.3 8.0
Raw silk and silk textiles 997.5 6.7
2. Urban sector
Salt 2,197.5 14.7
Porcelain 168.8 1.1
Metals 225.0 1.5
3. Total 14,936.3 100.0
4. Trade in GDP
China’s total GDP 104,298.8-131,568.8
Trade in total GDP 11.4-14.3
Of which grain in total GDP 4.7-5.9
Sources: Market values, based on Wu Cengming, Zhongguode Xiandaihua: Shichang Yu
Shehui (China’s Modernization: Market and Society) (Beijing: Sanlian Books, 2001), pp.
148-9. China’s total GDP, based on Chung-li Chang, The Income of the Chinese Gentry
(Seattle: University of Washington Press, 1962), p. 296; Albert Feuerwerker, The
Chinese Economy, 1870-1949 (Ann Arbor: Center for Chinese Studies of the University
of Michigan, 1995), p. 16; Liu Foding, Wang Yuru and Zhao Jin, Zhongguo Jindai Jingji
Fazhan Shi (A History of Economic Development in Early Modern China) (Beijing:
Tertiary Education Press, 1999), p. 66.
Note: Value in current prices.
Secondly, the food market during the Qing was an urban-specific one. On the demand
side, the maximum number of food-market dependent urban residents accounted for
78 The figures for grain represent some of the more optimistic estimates; see Yeh-chien Wang, ‘Evolution of the
Chinese Monetary System, 1644-1850’, in Hou Chi-ming, ed., Modern Chinese Economic History (Taipei: The
Institute of Economics, Academia Sinica, 1979), pp. 425-56.

about 6-7 percent the Qing total population.79 This assessment roughly agrees with the
4.7-5.9 percent of China’s total GDP for marketed food (see Table 8).
Of this 6-7 percent, two percent were made of absentee landlords.80 These landlords
lived on rent paid in kind (mainly food). Roughly, the Qing government-paying
employees (both civilian and military) were one million. With their family dependents,
they totaled about five million, or another 1.5 percent of the Qing population. The
government employee group lived on annual stipends, which came from eight provinces
as tax payments.81 This left about only 3 percent of the Qing population to urban artisans
and the like who lived on commercial food. If so the 4.7-5.9 percent of China’s total GDP
for marketed food became plenty. Therefore, the Qing urban food market was necessarily
very small on both the demand and supply sides. In addition, the ‘urban-food-market
dependents’ (UFMD) were price-takers given that (1) they were unable to alter food
supply and, (2) food consumption was price and income inelastic.
Thirdly, China’s urban food market may be viewed as an integrated one but only in a
relative sense, because local variations were common even in the well inter-connected
Lower Yangtze Region (see Figures 14 and 15).82 For the vast number of isolated rural
79 Ge, A Demographic History of China, Vol. 5, pp. 774, 828-9. Even in the economically-advanced Jiangsu and
Zhenjiang Provinces, urbanisation rates were 10-13 percent (circa 1790); see Ge, A Demographic History of China, Vol.
5, pp. 757, 762.
80 This percentage comes as an average in 89 percent of all provinces of Qing China (16 of 18 provinces); see Fairbank,
Cambridge History of China, vol. 12, p. 84.
81 The total number of the Qing troops included 120,000 Eight Banners (baqi) and 660,000 Green Standards (lüying,
literarily ‘Green Corps’); see Zhao, History of the Qing Dynasty, vol. 131, ‘Military’, in Twenty-Five Official Histories,
vol. 11, pp. 9305, 9307. For the number of salaried officials of 24,150 (c. 1700) to 26,355 (1850), see Yang Zhimei,
Xhongguo Gudai Guanzhi Jiangzuo (Bureaucracy of Premodern China) (Beijing: Zhonghua Books, 1992), pp. 420-1.
According to Chung-li Chang’s, the officials were at one time only 12,000 and no more than 22,830; see Chang,
Income, pp. 42, 197, 329-30. The state stipends were fixed at a total of four million piculs (shi) of rice (300,000 tonnes).
At the aforementioned minimal food consumption level, four million piculs fed 1.7 million adults, sufficient to cover
all the Qing military, officials and their families.
82 For similar plural markets for food during the Qing, see Luo Chang, ‘Liangtao Qingdai Liangjia Shuju Ziliaode
Bijiao Yu Shiyong’ (Comparison and Application of Two Sets of Food Price Data for the Qing Period), Jindaishi
Yanjiu (Study of Modern History), 5 (2012), pp. 142-56.

markets,83 the neo-classical ‘one-price doctrine’ did not apply, which means that China’s
urban rice price was not fit for any China-wide phenomenon.
Figure 14. Urban Rice Prices per Picul (Shi) in Jiangsu Province, 1740-1910
1
1.5
2
2.5
3
3.5
4
4.5
5
17
40
17
60
17
80
18
00
18
20
18
40
18
60
18
80
19
00
Changzhou
Haizhou
Huai-an
Jiangning
Songjiang
Suzhou
Taicang
Tongzhou
Yangzhou
Zhenjiang
Source: Yejian Wang, The Database of Grain Prices in the Qing Dynasty. Institute of
Modern History, Academia Sinica, 2013.
Note: Prices of the Ninth Month, in silver tael. Rice in picul (shi). Locations are seats of
governments of named prefectures.
Figure 15. Urban Rice Prices per Picul (Shi) in Zhejiang Province, 1740-1910
83 See G. W. Skinner, ‘Marketing and Social Structure in Rural China’, Journal of Asian Studies, 24 (1964-5), pp. 3-44,
195-228, 363-400; and his The City in Late Imperial China (Stanford: Stanford University Press, 1977).

1
1.5
2
2.5
3
3.5
4
17
40
17
60
17
80
18
00
18
20
18
40
18
60
18
80
19
00
Hangzhou
Huzhou
Jiaxing
Jinhua
Quzhou
Ningbo
Shaoxing
Taizhou
Wenzhou
Yanzhou
Source: the same as Figure 14.
Note: the same as Figure 14.
Although for half of the urban sector, a high food price led to a high living cost which
in turn led to a low living standard and further a low population growth, for all the ‘non-
urban-food-market dependent population’ (NUFMD), a high food price did not change
living cost or living standard or propensity for a large family. And NUFMD always
formed the vast majority in the Qing population. Moreover, an increase in the urban food
price could generate an ‘income effect’ on NUFMD whose food stock became inflated in
value. As a result, an NUFMD household was likely to switch its tax payment from rice
to cash if cash payment became cheaper. Many families would respond with more
children, too. In this context, therefore, the relationship between living cost (or living
standards) and population growth still stands: a low living cost (or a high living standard)
supports population growth. So, it was the dualistic nature of the Qing economy that
allowed an increase in urban food prices to go hand in hand with a good quality of life in
the NUFMD sector. With a 97-to-3 demographic disparity between UFMD and NUFMD,
a rise in urban food prices was able to coincide with an increase in the Qing population
aggregate.
Figure 16 illustrates this dichotomy, where the Qing economy can be divided into the
market and non-market sectors. Conceptually, an initial move comes from an increase in

food demand in the urban market sector which causes a shift from D to D'. The food price
responds to the new demand by moving from P1 to P2 which attracts more food to the
market (Q1 to Q2). Meanwhile, a high food price increases costs of living in the urban
market sector (C1 to C2) which in turn discourages births there (B1 to B2). At the same
time, an increased food price has an ‘income effect’ on NUFMD households’ wealth as
their existing food stock becomes more valuable than before (Y1 to Y2), with a virtual
gain marked by Y1 Y2 δ γ. With the Qing direct tax revenue (the Land-Poll Combined
Tax) being frozen at 0 Y0 λ Q'1, there is also some tax payment to be saved and hence the
tax obligation now accounts for a smaller share in the households’ gross income:
II + III (0 Y2 δ Q'1) > II (0 Y1 γ Q'1)
Hence,
I (0 Y0 λ Q'1) : II + III < I : II
Figure 16. Dual Sectors of the Qing Economy

Note: Points a, b, γ, δ, λ are equilibria. The solid arrow represents the initial move of the
market demand curve, the hollow arrow represents a subsequent change in market food
prices, the dash arrow represents ‘income effect of changed food prices’ in the non-
market sector, thick dash lines represent key linkages between the two sectors, and the
thick line represents a reduction in income from direct taxes. Areas I, II, and III represent
different components of households’ gross income.
Rural households’ net wealth thus moves from W0-W1 to W0-W2, a situation which
encourages births (P1 to P2), as shown in Figure 17.
Figure 17. Impact on the Non-Market Sector

Note: Points a, b, γ, δ, λ are equilibria. 0-Y0 and 0-W0 show income deduction due to
taxes. The hollow arrow represents a subsequent change in market food prices, and the
dash arrow represents ‘income effect of changed food prices’ in the non-market sector,
Areas I, II, and III represent different components of households’ gross income.
This study is the first one to differentiate the dualistic impact of food prices on sectoral
population growths in China. With this approach, a positive relationship between urban
rice prices and overall population growth can be well justified.
Given that there exists the possibility that causation could run from the dependent
variable to the independent variables, we repeat all three models with lagged values with
SE for all independent variables: (1) Model 1 includes farmland (LLANDt-1), rice output
level (LOUTPUTt-1), adoption of maize (LMAIZEt-1), disaster relief (LRELIEFt-1), rice
prices (LPRICEt-1); (2) Model 2 adds silver purchasing power index (LINDEXt-1); (3)
Model 3 embraces agricultural direct taxes (LTAXt-1). Since wars and disasters
(LWARDI) usually had their impact on population in real time, a time lag cannot apply.
The results of Model 1 with a time lag (TL) shown in Columns (4) to (9) of Table 9;
those of Model 2 (with lagged LINDEX t-1), in Column (10) of Table 9; and those of
Model 3 (with lagged LTAXt), in Table 10.

Table 9. Results of Models 1 and 2 with TL and SE
Population growth
(4) (5) (6) (7) (8) (9) (10)
LLAND 0.874 0.877 0.865 1.003
(0.349)** (0.353)** (0.323)*** (0.332)***
LLANDt-1 0.565 0.943 0.783
(0.271)** (0.297)*** (0.368)**
LOUTPUT 14.526 14.732 13.414 14.436
(2.729)*** (2.752)*** (2.860)*** (2.879)***
LOUTPUT t-1 13.776 12.716 11.745
(2.951)*** (2.992)*** (2.889)***
LMAIZE 0.232 0.275 0.240 0.237
(0.059)*** (0.068)*** (0.063)*** (0.061)***
LMAIZEt-1 0.243 0.257 0.193
(0.059)*** (0.064)*** (0.068)***
LWARDI -0.233 -0.224 -0.217 -0.234 -0.200 -0.162 -0.152
(0 .086)*** (0.088)** (0.085)** (0.077)*** (0.083)** (0.077)** (0.078)*
LRELIEF 0.102 0.113 0.104 0.097
(0.032)*** (0.038)*** (0.034)*** (0.033)***
LRELIEF t-1 0.098 0.090 0.083
(0.034)*** (0.037)** (0.036)**
LPRICE 0.415 0.278 0.330 0.318
(0.110)*** (0.122)** (0.109)*** (0.103)***
LPRICEt-1 0.332 0.322
(0.102)*** (0.105)***
LINDEXt-1 -0.503
(0.126)***
Obs 76 77 77 77 77 77 71
Adj R2 0.884 0.874 0.881 0.883 0.882 0.872 0.868

Note: (1) SE readings of SE are in parentheses. (2) , and are significant at the 1%,
5% and 10% levels, respectively.
Table 10. Results of Model 3 with TL and SE
Population growth
(11) (12) (13) (14) (15)
LOUTPUT
14.361 12.898 14.261
(2.683)*** (2.839)*** (2.766)***
LOUTPUTt-1
13.770 12.342
(2.844)*** (2.980)***
LMAIZE
0.303 0.299 0.253
(0.074)*** (0.075)*** (0.076)***
LMAIZEt-1
0.273 0.329
(0.067)*** (0.075)***
LWARDI
-0.258 -0.250 -0.254 -0.229 -0.174
(0.093)*** (0.090)*** (0.080)*** (0.088)** (0.084)**
LRELIEF
0.143 0.135 0.122
(0.034)*** (0.031)*** (0.030)***
LRELIEFt-1
0.120 0.118
(0.032)*** (0.035)***
LTAX
-0.361 -0.430 -0.358
(0.138)** (0.109)*** (0.121)***
LTAXt-1
-0.473 -0.345
(0.131)*** (0.139)**
Obs 75 75 76 74 75
Adj R2 0.862 0.871 0.868 0.868 0.851
Note: (1) SE readings are in parentheses. (2) , and are significant at the 1%, 5% and
10% levels, respectively.

The results of the modelling specifications 1, 2 and 3 with a time lag are very similar to
the modelling specifications without lags. This warrants a low risk of bi-directional
causality between the dependent and independent variables.
To summaries, Table 7 indicates that all eight predictor variables (see Table 6) were
important for population growth. Farmland (LLANDt), rice output level (LOUTPUTt),
maize-farming (LMAIZEt) and disaster relief (LRELIEFt) had positive and significant
impact on population growth. The effect of rice output level on population growth was
substantial. The second important factor went to farmland, followed by rice prices,
adoption of new technology, and then disaster relief. Overall, improvements in
technology mattered. In this context, a significant amount of ‘free lunches’ still existed in
the Qing economy. 84 On the institutional front, the Qing proto-welfare state that
expanded farmland (migration embedded) and minimised population losses also played a
positive role in population growth.85 Exogenous shocks of wars and disasters (LWARDI)
had a significant but negative influence on population growth, as did taxes (LTAX). The
negative impact of the tax burden was greater than that of wars and disasters, despite the
fact that the Qing tax burden per mu was the lightest hitherto in China’s long history.
Finally, rice prices (LPRICE) had positive and significant impact while the silver
purchasing power index (LINDEX) had negative and significant impact on population
growth due to the urban bias towards rice prices.
IV. Conclusions
In this study, we establish a historical time series to model China’s unprecedented
population expansion during the Qing Period and apply OLS with SE and TL to ascertain
correlations between a variety of factors and population growth. The results warrant a
high degree of robustness and a low risk of bi-directional causality.
84 Joel Mokyr, The Lever of Riches (New York and Oxford: Oxford University Press, 1990), ch. 1.
85 Will, Bureaucracy and Famine; Will and Wong, Nourish the People; Deng, The Premodern Chinese Economy, chs
1-3.

Our findings reveal that the extraordinary growth in China’s population during the
Qing Period was supported by, in the order of weight and importance (1) availability of
farming technology, (2) elastic supply of farmland, and (3) disaster relief provision.
Wars and disasters, and tax burden had a negative impact on population growth. Even
so, the unique combination of increased farmland and capped agricultural direct taxes led
to a steady decline in the tax burden on per unit of land, which softened the negative
impact of taxation on population growth.
It becomes also clear that to a great extent, the extraordinary population growth
experienced in Qing China was mainly propelled by the non-market sector, which
responded to food prices very differently from its market counterpart.
Admittedly, out research is limited on the macro-level with an economy-wide
approach, which only serves the purpose when the Qing economy is conceptually taken
as one entity. We certainly hope that primary-source data for a micro-level become also
available one-day to facilitate more empirical studies of the Qing population.
Bibliography
Anon., Qing Gaozong Shilu (Veritable Records of Emperor Gaozong of the Qing
Dynasty) (1799. Reprint. Taipei: Hualian Press, 1964).
Boserup, Ester, The Conditions of Agricultural Growth: The Economies of Agrarian
Change under Population Pressure (London: Allen and Unwin, 1965).
Bray, Francesca, The Rice Economies, Technology and Development in Asian Societies
(Oxford: Blackwell, 1986).
Buck, J. L., Land Utilization in China: Atlas (London: Oxford University Press, 1937).
Cao Shuji, Zhongguo Renkou Shi Mingqing Shiqi (A Demographic History of China, the
Qing Ming Period) (Shanghai: Fudan University Press, 2000).
Cao Shuji, Zhongguo Renkou Shi Qing Shiqi (A Demographic History of China, the Qing
Period) (Shanghai: Fudan University Press, 2000).
Chang, Chung-li, The Chinese Gentry: Studies on Their Role in Nineteenth-Century
Chinese Society (Seattle: University of Washington Press, 1955).

Chang, Chung-li, The Income of the Chinese Gentry (Seattle: University of Washington
Press, 1962).
Chao, Kang, Man and Land in Chinese History: An Economic Analysis (Stanford:
Stanford University Press, 1986).
Chen Chunsheng and Liu Zhiwei, ‘Qingdai Jingji Yunzuode Liangge Tedian’ (Two
Characteristics of Qing Economic Operation), Zhongguo Jingjishi Yanjiu (Research
into Chinese Economic History), 3 (1990), pp. 84-9.
Chen Gaoyong, Zhongguo Lidai Tianzai Renhuo Biao (Chronological Tables of Chinese
Natural and Man-made Disasters) (Shanghai: Jinan University Press, 1937).
Chen Hua, Qingdai Quyu Shehui Jingji Yanjiu (Regional Socio-Economic Conditions
during the Qing Period) (Beijing: People’s University Press, 1996).
Chen Shuping, ‘Yumi He Fanshu Zai Zhongguo Chuanbo Qingkuang Yanjiu’ (Studies of
the Spread of Maize and Sweet Potatoes in China), Zhongguo Shehui Kexue (Social
Sciences in China), 3 (1980), pp. 188-204.
Chen, Shuo and James Kung, ‘Of Maize and Men: The Effect of a New World Crop on
Population and Economic Growth in China’, Journal of Economic Growth, 12/1
(2016), pp. 71-99.
Chuan, H. S. and R. A. Kraus, Mid-Ch’ing Rice Markets and Trade: An Essay in Price
History. East Asian Research Center, Harvard University, 1975.
Deng Ciyu, Zhongguo Kaoshi Zhidu Shi (History of the Chinese Imperial Examination
System) (Taipei: Xuesheng Books, 1967).
Deng, Gang, The Premodern Chinese Economy – Structural Equilibrium and Capitalist
Sterility (London and New York: Routledge, 1999).
Deng, Kent and Lucy Zheng, ‘Economic Restructuring and Demographic Growth,
Demystifying Growth and Development in Northern Song China, 960-1127’,
Economic History Review, vol. 68, no. 4 (2105), pp. 1107-31.
Deng, Kent, ‘Unveiling China’s True Population Statistics for the Pre-Modern Era with
Official Census Data’, Population Review 43/2 (2004), pp. 1-38.
Deng, Kent, China’s Political Economy in Modern Times (London: Routledge, 2011).
Department of Archives, Palace Museum (ed.), Li Xu Zouzhe (Li Xu’s Memorials to the
Throne) (Beijing: Zhonghua Books, 1976).

Durand, J. D., ‘The Population Statistics of China, A.D. 2-1953’. Population Studies, 13
(1960), pp. 209-57.
Elvin, Mark, The Pattern of the Chinese Past (Stanford: Stanford University Press, 1973).
Fairbank, J. K. and Kwang-ching Liu (eds), Cambridge History of China, Late Ch’ing,
1800-1911, Part II (Cambridge: Cambridge University Press, 1980).
Fairbank, J. K. and Merle Goldman, China: A New History (Harvard University Press,
2005).
Fairbank, J. K., Chinese Thought and Institutions (Chicago: Chicago University Press,
1957).
Fan Jinmin, Guoji Minsheng, Mingqing Shehui Jingji Yanjiu (National Economy and
People’s Livelihood in the Ming-Qing Period) (Fuzhou: Fujian People’s Press,
2008).
Fang Xing, ‘Qingdai Diannongde Zhongnonghua’ (Tenants Joining the Middle-Income
Group during the Qing Period), Zhongguo Xueshu (Chinese Academics) 2 (2000),
pp. 44-61.
Feuerwerker, Albert, The Chinese Economy, 1870-1949 (Ann Arbor: Center for Chinese
Studies of the University of Michigan, 1995).
Fu Zhongxia, Zhang Xing, Tian Zhaolin, and Yang Boshi, Zhongguo Junshi Shi (A
Military History of China) (Beijing: PLA Press, 1986).
Gao Wangling, Zudian Guanxi Xinlun: Dizhu, Nongmin He Dizu (New Theory of
Tenancy: Landlords, Tenants and Rents) (Shanghai: Shanghai Books, 2005).
Ge Jianxion, Minzu Da Qianxi (Ethnic Exodus) (Hong Kong: Zhonghua Books, 2014).
Ge Jianxiong (ed.), Zhongguo Yimin Shi (A History of Migration in China) (Fuzhou:
Fujian People’s Press, 1997).
Ge Jianxiong, Zhongguo Renkou Shi - Qing Shiqi (A Demographic History of China, Vol.
5, the Qing Period) (Shanghai: Fudan University Press, 2000).
Guo Wentao, Zhongguo Nongyie Keji Fazhan Shilue (A Brief History of Development of
Agricultural Science and Technology in China) (Beijing: Chinese Science and
Technology Press, 1988).
Ho, Ping-ti, Studies on the Population of China, 1368-1953 (Cambridge [Mass.]: Harvard
University Press, 1959).

Ho, Ping-ti, The Ladder of Success in Imperial China (New York: Columbia University
Press, 1962).
Huang Miantang, Zhongguo Lidai Wujia Wenti Kaoshu (Study of Prices in China’s
History over the Long Term) (Jinan: Qilu Books, 2007).
Huang, Philip, The Peasant Economy and Social Change in North China (Stanford:
Stanford University Press, 1985).
Jia, Ruixue, ‘Weather Shocks, Sweet Potatoes and Peasant Revolts in Historical China’,
The Economic Journal, 124/575 (2014), pp. 92-118.
Jiang Tao, Lishi Yu Renkou – Zhongguo Chuantong Renkou Jieguo Yanjiu (History and
Demography – China’s Traditional Demographic Pattern) (Beijing: People’s Press,
1998).
Jiang Tao, Renkou Yu Lishi, Zhongguo Chuantong Renkou Jiego Yanjiu (Population and
History, A Study of Chinese Traditional Demographic Structure) (Beijing: People’s
Press, 1998).
Lavely, William and R. Bin. Wong, ‘Revising the Malthusian Narrative: the Comparative
Study of Population Dynamics in Late Imperial China’, The Journal of Asian
Studies, 57/3 (1998), pp. 714-48.
Lee, James and Cameron Campbell, Fate and Fortune in Rural China (Cambridge:
Cambridge University Press, 1997).
Lee, James and Wang Feng, One Quarter of Humanity (Cambridge [ MA]: Harvard
University Press, 1999).
Lee, James, ‘Population Growth in Southwest China, 1250-1850’, The Journal of Asian
Studies, 41/4 (1982), pp. 711-46.
Lee, James, Cameron Campbell, and Guofu Tan, ‘Infanticide and Family Planning in
Late Imperial China’, in Thomas Rawski and Lillian Li, eds., Chinese History in
Economic Perspective (Berkeley: University of California Press, 1992), pp. 145-76.
Leonard, J. K. and J. R. Watt (eds.), To Achieve Security and Wealth (Ithaca: Cornell
University East Asia Program, 1992).
Li Bozhong and J. L. van Zanden, ‘Before the Great Divergence? Comparing the Yangzi
Delta at the Beginning of the Nineteenth Century’, Journal of Economic History 72
(2012), pp. 956-90.

Li Bozhong, ‘Qingdai Qianzhongqi Jiangnan Renkode Disu Zengzhang Jiqi Yuanyin’
(‘The Low Population Growth in the Yangtze Delta and its Reason during Early and
Mid-Qing Times’), Qingshi Yanjiu (Study of Qing History), 2 (1996), pp. 10-19.
Li Bozhong, ‘Rengen Shimu Yu Mingqing Jiangnan Nongminde Jingying Guimo’ (The
Practice of ‘Ten Mu per Farmer’ and the Scale of the Traditional Peasant
Economy), Zhongguo Nongshi (Agricultural History of China), 1 (1996), pp. 1-14.
Li Bozhong, Duoshijiao Kan Jiangnan Jingjishi, 1250-1850 (Multiple Dimensional View
on Economic History of the Jiangnan Region, 1250-1850) (Beijing: Sanlian Books,
2003).
Li Shizhen, Compendium of Materia Medica (Bencao Gangmu) (1578. Reprint. Beijing:
People’s Press, 1977).
Li Wenzhi and Jiang Taixin, Qingdai Caoyun (Stipend Rice during the Qing Period)
(Beijing: Zhonghua Books, 1995).
Liang Fangzhong, Zhongguo Lidai Hukou Tiandi Tianfu Tongji (Dynastic Data for
China’s Households, Cultivated Land and Land Taxation) (Shanghai: Shanghai
People’s Press, 1980).
Liu Foding, Wang Yuru and Zhao Jin, Zhongguo Jindai Jingji Fazhan Shi (A History of
Economic Development in Early Modern China) (Beijing: Tertiary Education Press,
1999).
Luo Chang, ‘Liangtao Qingdai Liangjia Shuju Ziliaode Bijiao Yu Shiyong’ (Comparison
and Application of Two Sets of Food Price Data for the Qing Period), Jindaishi
Yanjiu (Study of Modern History), 5 (2012), pp. 142-56.
Maddison, Angus, Chinese Economic Performance in the Long Run (Paris: OECD,
1998).
Martini, Martino, De Bello Tartarica Historia (Antwerp, 1654), vide: en.wikipedia.org,
available on 20 February 2018.
McEvedy, Colin and Richard Jones (eds), Atlas of World Population History
(Harmondsworth: Penguin Books, 1978).
Mokyr, Joel, The Lever of Riches (New York and Oxford: Oxford University Press,
1990).

Mote, F. W., Imperial China, 900-1800 (Cambridge [MA]: Harvard University Press,
1999).
Myers, R. H., The Chinese Peasant Economy: Agricultural Development in Hopei and
Shangtung, 1890-1949 (Cambridge [MA]: Harvard University Press, 1970).
Nieuhof, John, Voyages & Travels to the East Indies 1653-1670 (Reprint, Oxford:
Oxford University Press, 1988).
Peng Xinwei, Zhongguo Houbishi (A History of Currencies in China) (Shanghai People’s
Press, 1965).
Perkins, D. H., Agricultural Development in China, 1368-1968 (Edinburgh: Edinburgh
University Press, 1969).
Peterson, W. J. (ed.), The Cambridge History of China (Cambridge: Cambridge
University Press, 2002).
Pomeranz, Kenneth, The Great Divergence, Europe, China and the Making of the
Modern World Economy (Princeton: Princeton University Press, 2000).
Rawnsley, G. D. and M. T. Rawnsley (eds.), Political Communications in Greater China
(London: RoutledgeCurzon, 2003).
Shi Shenghan, Nongzheng Quanshu Jiaozhu (Annotated Edition of the ‘Complete
Treatise on Agricultural Administration’) (Shanghai: Shanghai Classics Publisher,
1979).
Shi Zhihong, ‘Qingdai Nongye Shengchan Zhibiaode Guji’ (Estimation of Rural
Production Parameters’, Zhongguo Jingjishi Yanjiu (Research into Chinese
Economic History) 5 (2015), pp. 5-30.
Shi Zhihong, ‘Shijiu Shiji Shangbanqide Zhongguo Liangshi Muchanliang Jiqi
Zongchanliang Zai Guji’ (Re-Estimation of Yields per Mu and the Aggregate Food
Output in Early Nineteenth Century China), Zhongguo Jingjishi Yanjiu (Research
into Chinese Economic History) 3 (2012), pp. 52-66.
Shuo Chen and James Kai-sing Kung, ‘Of Maize and Men: The Effect of a New World
Crop on Population and Economic Growth in China’, Working Paper (Hong Kong
University of Science and Technology, 2013).
Skinner, G. W., ‘Marketing and Social Structure in Rural China’, Journal of Asian
Studies, 24 (1964-5), pp. 3-44, 195-228, 363-400.

Skinner, G. W., ‘Sichuan’s Population in the Nineteenth Century’, Late Imperial China,
8/1 (1987), pp. 1-79.
Skinner, G. W., The City in Late Imperial China (Stanford: Stanford University Press,
1977).
So, K. L., Prosperity, Region, and Institutions in Maritime China, the Fukien Pattern,
946-1368 (Cambridge [MA]: Harvard University Asia Center, 2000).
Song Lian, Yuan Shi (History of the Yuan Dynasty) (1371), in Er-shi-wu Shi (Twenty-
Five Official Histories) (Shanghai: Shanghai Classics Press, 1986), vol. 9.
Song Yingxing, Tiangong Kaiwu (Exploitation of the Works of Nature) (1637. Reprint.
Guangzhou: Guangdong People’s Press, 1976).
Spence, J. D., The Search for Modern China, third edition (New York: Norton, 2012).
Stover, L. E. and T. K. Stover, China: an Anthropological Perspective (Pacific Palisades
[CA]: Goodyear Publishing Co., 1976).
Tan Qixiang, Jianming Zhongguo Lishi Dituji (Concise Maps of Chinese History)
(Beijing: China’s Map Press, 1991).
Tian Fang and Chen Yijun, Zhongguo Yimin Shilue (Brief History of Migration in China)
(Beijing: Knowledge Press, 1986).
Wang Dezhao, Qingdai Keju Zhidu Yanjiu (Civil Examinations during the Qing Period)
(Hong Kong: The Chinese Univerisyt Press, 1982).
Wang Qi, Xu Wenxian Tongkao (Imperially Commissioned Continuation of the
Comprehensive Study of Literature) (publisher unknown, 1586).
Wang Zichun and Gao Jianguo, ‘Zhongguo Jin 2500 Nianlai Zhiwu Chonghua Lishi
Jiluzhi Wuhou Yanjiu’ (Patterns of Second Blossoming of Trees for 2,500 Years in
Chinese Records). Nongye Kaogu (Agricultural Archaeology), no. 1 (1985), pp.
196-99.
Wang, Feng, James Lee and Cameron Campbell, ‘Marital Fertility Control among the
Qing Nobility’, Population Studies 49/3 (1995), pp. 383-400.
Wang, Yeh-chien, ‘Evolution of the Chinese Monetary System, 1644-1850’, in Hou Chi-
ming, ed., Modern Chinese Economic History (Taipei: The Institute of Economics,
Academia Sinica, 1979), pp. 425-56.

Wang, Yeh-chien, ‘Secular Trends of Rice Prices in the Yangzi Delta, 1638-1935’, in
Thomas Rawski and Lillian Li, eds., Chinese History in Economic Perspective
(Berkley: University of California Press, 1992), pp. 35-68.
Wang, Yejian, The Database of Grain Prices in the Qing Dynasty (Taipei: Institute of
Modern History, Academia Sinica, 2013), on line vide:
http://ccts.ascc.net/integration.php?lang=en, available on 1 October 2016.
Will, Pierre-Etienne and R. B. Wong, Nourish the People: the State Civilian Granary
System in China, 1650-1850 (Ann Arbor: University of Michigan Center for
Chinese Studies, 1991).
Will, Pierre-Etienne, Bureaucracy and Famine in Eighteenth-Century China (Stanford:
Stanford University Press, 1990).
Wright, A. F. and Denis Twitchett (eds), Confucian Personalities (Stanford: Stanford
University Press, 1962).
Wu Chengming, Zhongguode Xiandaihua: Shichang Yu Shehui (China’s Modernisation:
the Market and Society) (Beijing: Sanlian Books, 2001).
Wu Hui, Zhongguo Jingjishi Rugan Wentide Jiliang Yanjiu (Quantitative Studies of
Chinese Economic History) (Fuzhou: Fujian People’s Press, 2009).
Xian Jinshan, ‘Cong Fangzhi Jizai Kan Yumi Zai Woguode Yinjin He Chuanbo’
(Adoption and Spread of Maize Seen from Local Gazetteers), Gujin Nongye
(Agriculture, Past and Present), 1 (1988), pp. 99-111.
Xiang Huaicheng, Zhongguo Caizheng Tongshi (A General History of Government
Finance) (Beijing: China’s Finance Press, 2006).
Xu Guangqi, Nongzheng Quanshu (Complete Treatise on Agricultural Administration
(1628. Reprint. Shanghai: Shanghai Classics Press, 1979).
Xu Xinwu, Jiangnan Tubu Shi (A History of Homemade Cotton Cloth in the Lower
Yangtze Delta) (Shanghai: Shanghai Social Sciences Press, 1989).
Yao Tinglin, Linian Ji (Personal Annals) (c. 1698. Reprint. Shanghai: Shanghai People’s
Press, 1982).
Ye Mengzhu, Yueshi Bian (Record of Life-time Experience in Songjiang) (c. 1688.
Reprint. Shanghai: Shanghai Classics Press, 1981).

Yu Yaohua, Zhongguo Jiage Shi (A History of Prices in China) (Beijing: China’s Prices
Press, 2000).
Yuan Yida and Zhang Cheng, Zhongguo Xingshi Qunti Yichuan He Renkou Fenbu
(Chinese Surnames, Group Genetics and Demographic Distribution) (Shanghai:
East China Normal University Press, 2002).
Zai Ling, Caoyun Quanshu (Complete Records of Stipend Rice Shipping) (N.d., Reprint.
Beijing: Beijing Library Press, no date).
Zhang Haiying, Mingqing Jiangnan Shangpin Liutong Yu Shichang Tixi (Commodity
Flows and Market Structure in the Jiangnan Region during the Ming-Qing Period)
(Shanghai: East China Normal University Press, 2001).
Zhao Erxun, Qingshi Gao (Draft of the History of the Qing Dynasty) (1927), in Er-shi-wu
Shi (Twenty-Five Official Histories) (Shanghai: Shanghai Classics Press, 1986),
vols. 11 and 12.
Zhao Gang and Chen Zhongyi, Zhongguo Tudi Zhidu Shi (A History of Land Ownership
in China) (Beijing: New Star Press, 2006).
Zhao Wenlin and Xie Shujun, Zhongguo Renkou Shi (A Demographic History of China)
(Beijing: People’s Press, 1988).
Zhao Yun, ‘Jishu Wucha, Zhemu Jiqi Juli Shuaijian Guilü Yanjiu’ (Technical Errors:
Land Unit Conversion and the Law of Diminishing Distance), Zhongguo Shehui
Jingjishi Yanjiu (Research into Chinese Social and Economic History), 3 (2007),
pp. 1-13.
Zheng Xuemeng, Jiang Zhaocheng and Zhang Wenqi, Jianming Zhongguo Jingji Tongshi
(A Brief Panorama of Chinese Economic History) (Harbin: Heilongjiang People’s
Press, 1984).