china’s experience under the multifiber arrangement … · china’s experience under the...
TRANSCRIPT

China’s Experience Under the Multifiber Arrangement (MFA) and theAgreement on Textile and Clothing (ATC)∗
Irene Brambilla†
Yale Department of Economics & NBER
Amit Khandelwal‡
Columbia Business School
Peter K. Schott§
Yale School of Management & NBER
First Draft: September 2006
This Draft: January 2008
Abstract
This paper analyzes China’s experience under U.S. apparel and textile quotas. It makes use ofa new database that tracks U.S. trading partners’ performance under the quota regimes establishedby the global Multifiber Arrangement (1974 to 1995) and subsequent Agreement on Textiles andClothing (1995 to 2005). We find that China was relatively more constrained under these regimesthan other countries and that, as quotas were lifted, China’s exports grew disproportionately. Whenthe ATC finally ended in 2005, China’s exports surged while those from nearly all other regions fell.
Keywords: Multifiber Arrangement, Agreement on Textiles and Clothing, China, Quotas, Quality
JEL classification: F1
∗Special thanks to Ronald Foote of the U.S. Census Bureau and Ross Arnold and Keith Daly of the U.S.Office of Textiles and Apparel (OTEXA). We thank Judy Dean, Rob Feenstra, Joseph Francois and JamesHarrigan for helpful comments and suggestions. Excellent research assistance was provided by MatthewFlagge and Rocky Huarng. This material is based upon work supported by the National Science Foundationunder Grant No. 0241474. Any opinions, findings, and conclusions or recommendations expressed in thismaterial are those of the authors and do not necessarily reflect the views of the National Science Foundation.
†37 Hillhouse Avenue, New Haven, CT 06520, tel : (203) 432-6563, fax : (203) 432-6323, email :[email protected]
‡3022 Broadway, Uris Hall, New York, NY 10027, tel : (2123) 854-7506, fax : (212) 316-9219, email :[email protected]
§135 Prospect Street, New Haven, CT 06520, tel : (203) 436-4260, fax : (203) 432-6974, email : [email protected]
C����’� E����� � U���� ��� MFA/ATC 2
1. Introduction
On January 1, 2005, restrictions on the fourth and final set of textile and clothing
products regulated by the Agreement on Textile and Clothing (ATC), the successor of the
Multifiber Arrangement (MFA), were removed. The gradual expiration of these quotas
starting in 1995 ended decades of bilateral non-tariff-barrier protection in this industry
and set the stage for a substantial reallocation of production and exports across countries.
Though many analysts expected China’s share of the United States’ textile and clothing
(T&C) imports to rise when the ATC expired in 2005, predictions varied widely.1 In fact,
China’s overall T&C export quantities to the U.S. increased 39 percent in 2005, with exports
of goods whose quotas were relaxed in the beginning of that year jumping 270 percent.
This paper uses a new dataset of U.S. import quotas to examine China’s relative perfor-
mance in the U.S. market under the ATC. Our analysis reveals that China’s T&C exports to
the U.S. were relatively restrained along three dimensions. First, China’s quotas were more
likely to be binding than the quotas imposed on other countries. Second, China’s quotas
grew at a slower rate than the quotas of most other countries. Finally, the U.S. appears
to have placed relatively greater restrictions on China’s ability to shift quota allocations
across different categories of goods or across years.
China’s rapid increase in U.S. market share as quotas were relaxed came at the expense
of both domestic manufacturers and the United States’ other trading partners. We show
that T&C exports from virtually all countries decreased in 2005, and that for some regions,
e.g., Sub-Saharan Africa, these declines represented an abrupt reversal of several years of
previously robust T&C export growth. These reversals suggest that, over time, the MFA
and ATC had evolved from a regime intended to protect domestic U.S. manufacturers into
one which also guaranteed smaller developing countries access to the U.S. market. Among
developing countries, only those from South Asia managed to defend market share in the
face of substantial Chinese growth, but even South Asia’s response was not uniform across
products.
T&C quotas under the ATC were relaxed in four phases. Though China’s responses to
the fourth and final set of quota reductions in 2005 were dramatic, they were to a large
degree predictable given China’s reaction to earlier quota relaxations, particularly once one
focuses on goods in which China faced binding quotas. Because China as a non-WTO
member was ineligible for quota reductions in the first two phases of the ATC in 1995
and 1998, its quotas on these goods as well as its quotas on Phase III goods were lifted
1For example, the computational general equilibrium (CGE) study by Rivera et al (2003) predicted thatChina’s textile and apparel exports would increase between 8 and 104 percent, respectively, following theelimination of quotas in developed countries. Nordas (2004) predicted that China’s post-MFA/ATC textileand clothing market share in the U.S. would increase by 7 and 34 percentage points, respectively. Diao andSomwaru (2001) estimated a more moderate growth of 6 percent in Chinese T&C exports to the world.

C����’� E����� � U���� ��� MFA/ATC 3
simultaneously in early 2002 after it joined the WTO in December 2001. The solid lines in
Figure 1 trace out China’s U.S. export growth in all T&C goods covered by each phase of the
ATC, with arrows indicating the year in which its quotas were relaxed. As indicated in the
figure, China’s response in Phase I and II goods was relatively small (at 42 and 32 percent,
respectively) compared with its reaction to quota removal in Phase III and Phase IV goods
(at 305 percent and 271 percent, respectively) in 2002 and 2005. The total responses noted
by the solid lines, however, do not take into account variation in the relative restrictiveness
of China’s quotas across goods within each phase. The dashed lines, by contrast, report
China’s export growth in goods whose quotas were binding in the year before their removal.
As indicated in the figure, China’s export response in these previously bound goods was
more similar–322 versus 330 percent for Phase III and IV goods, respectively. However,
as we document below, China’s Phase IV growth in 2005 appears to have had an especially
large and negative impact on nearly all regions’ exports that year.
Examination of export price changes under the ATC suggests a reallocation of exports
within as well as across countries as quotas were relaxed. We find quota removal to be
accompanied by large declines in export unit values across all U.S. trading partners. In the
final phase, China’s unit values in unbound versus bound products fell 31 and 41 percent,
respectively. These declines, as well, were anticipated by previous phases of liberalization.
Consistent with models of quality upgrading in response to quantitative restrictions, we
also document evidence of relative quality downgrading within China’s Phase IV products
as its quotas were lifted.
The remainder of this paper is organized as follows. In Section 2 we briefly summarize
the MFA and ATC regimes. Section 3 provides a detailed description of the contents of the
U.S. MFA/ATC database constructed for this paper. Sections 4 and 5 examines countries
quantity and unit value responses to quota relaxation. Section 7 concludes.
2. The MFA and the ATC
The Multifiber Arrangement grew out of a series of voluntary export restraints im-
posed, initially, by the United States on Japanese textile exports in 1955. By the end
up the 1950s, the United Kingdom also began to limit imports from Hong Kong, India
and Pakistan (Spinanger, 1999). Quotas on cotton textiles and apparel products were first
institutionalized with the Short Term Arrangement in 1961, which was extended to two
subsequent Long Term Arrangements throughout the 1960s and early 1970s. As the Asian
economies’ textile and apparel production continued to grow, developed countries sought
the need to create a more systematic mechanism to deal with “market disruptions” in other
fiber markets. This lead to the signing of the Multifiber Arrangement, in 1974, which,
although “temporary” at first, ultimately lead to an additional 30 years of protection. As

C����’� E����� � U���� ��� MFA/ATC 4
a result of the MFA, T&C products were kept out of multilateral trade negotiations under
the General Agreement on Tariffs and Trade (GATT) and its successor, the World Trade
Organization (WTO).2
Amajor development of the Uruguay Round was the signing of the Agreement on Textile
and Clothing (ATC) in 1994. The ATC ended the MFA and began the process of integrating
textile and clothing products into GATT/WTO rules by removing their quotas. Integration
occurred over the four phases outlined in Table 1. During each phase, importing countries
were to integrate a portion of all T&C products covered by the ATC. The particular products
integrated in each phase were specific to importing countries but subject to two rules. First,
the products retired in each phase had to include goods from all four major textile and
clothing segments: Yarn, Fabrics, Made-Up textile products (e.g., table linen, carpets and
curtains), and Clothing. Second, the chosen products had to represent a set portion of each
country’s 1990 T&C imports, by volume. In Phase I, which began on January 1, 1995,
countries had to integrate products representing 16 percent of their 1990 import volumes.
An additional 17 and 18 percent of 1990 export volumes were integrated at the beginning of
Phases II and III on January 1, 1998 and January 1, 2002, respectively. Finally, on January
1, 2005, Phase IV of the ATC culminated in the integration of the remaining 49 percent of
export volumes and all quotas were abolished.
Perhaps unsurprisingly given countries’ ability to choose which quotas to retire in each
phase, quotas removed during the first two phases of the ATC were in general not very
painful for producers in developed countries. In the United States, ATC products accounted
for 17.1 billion square meter equivalents (SME) worth of imports in 1990.3 However, U.S.
imports of products actually subject to quotas in that year totalled just 12.2 billion SMEs
(USITC, 2004). As a result, the U.S. found it relatively easy to defer removal of quotas
on “sensitive” products until the third phase. Products such as tents and life jackets, for
example, were included in the ATC but had not been subject to U.S. import quotas. The
United States integrated these products in the first phase. As indicated in the final column
of Table 1, the United States retired a total of 4,875 ten-digit Harmonized System (HS)
product codes across the four phases, of which 62 percent were retired in 2005. In this paper,
these HS codes are our definition of the set of T&C products imported by the United States
and governed by the ATC.4
In addition to gradually removing quotas, the ATC improved developing countries’ ac-
cess to developed-country markets by accelerating quota growth over the four phases of
2For a more extensive discussions of the road to the ATC, see Spinanger (1999) and Francois and Worz(2006).
3Product quotas under the MFA and ATC were set in terms of square meter equivalents (SME), witheach product having an explicit “conversion factor” to determine the SME of their native units (e.g., pairsof socks). Examples of SME are provided in Table 4.
4We are grateful to Keith Daly at OTEXA for providing us with this list.

C����’� E����� � U���� ��� MFA/ATC 5
quota removal. These changes were governed by what is referred to as the ATC’s “growth-
on-growth” provision and are summarized in the third column of Table 1. At the beginning
of Phase I, existing quota growth rates were accelerated 16 percent per year, while they
were accelerated by 25 and 27 percent in Phases II and III, respectively. A group with
a base quota growth rate of 6 percent in 1994, for example, would grow at 6.96 percent
(0.06*1.16) per year during Phase I, 8.7 percent (0.0696*1.25) per year over Phase II, and
11.05 (0.087*1.27) percent per year during Phase III.5
China’s non-WTOmember status prior to 2001 rendered it ineligible for ATC integration
benefits during its first two phases. After China was admitted formally into the WTO on
December 11, 2001, the United States removed its quotas on China’s Phase I and II imports
simultaneously with the quotas on its Phase III goods on the regularly scheduled Phase III
removal date in 2002. After WTO accession, China also received growth rate increases
consistent with the ATC.6
As part of its entry into the WTO, China agreed to special safeguard provisions, subject
to “consultations,” that would limit its exports to countries experiencing market disrup-
tions after the ATC was phased out. Under the guidelines governing China’s accession into
the WTO, WTO members could enter negotiations for new safeguards on Chinese products
provided those countries could show evidence of the existence or threat of a market dis-
ruption and a role for Chinese goods in that disruption (World Trade Organization, 2001).
The safeguard provision is applicable until December 31, 2008.7
When the final set of products expired in 2005, domestic textile and apparel industry
groups successfully lobbied for new safeguards against China on 22 MFA groups of products
and they remain effective until the end of 2008. However, the U.S. and China reached
a memorandum of understanding that the U.S. would “exercise restraint” on additional
safeguards. Table 2 lists the quota levels that are operative until 2008.
3. The U.S. MFA/ATC Database
This section describes our construction of the U.S. MFA/ATC database and summarizes
its contents. The database is assembled from U.S. trading partners’ Expired Performance
Reports, which were used by the U.S. Office of Textile and Apparel (OTEXA) to monitor
trading partners’ compliance with the MFA and ATC quotas. Generously provided by
Ron Foote of the U.S. Census Bureau, they document imports, base quotas and quota
5Quota growth acceleration was advanced one phase for countries with less than 1.2 percent of theimporting country’s total quotas in 1991.
6China’s growth rates were increased by 27 percent plus an additional pro-rated increase to account forits 3 weeks of WTO membership in 2001 (USITC, 2004).
7For additional details regarding the post-ATC Chinese safeguards, see Whalley and Dayaratna-Banda(2007).

C����’� E����� � U���� ��� MFA/ATC 6
adjustments (defined below) by groups of products (referred to as “MFA groups”) and year
for all countries with which the United States negotiated a bilateral quota arrangement.
Thus far, the database covers 1984 to 2004.8
Between 1984 and 2004 the U.S. signed bilateral MFA/ATC agreements with the 71
countries listed in Table 3. Seven of these countries–Barbados, Canada, Lebanon, Pacific
Islands, Portugal, Spain and Trinidad and Tobago–were not subject to what is known
as “specific limits,” the most restrictive quota classification and the focus or our analysis
(see discussion below). The details of an agreement were negotiated over an “agreement
term” which typically lasted several “agreement periods.” For most countries, an agreement
period corresponded to a full calendar year.9 The United States negotiated quotas on 149
three-digit MFA specific-limit groups, where each group contains a median average of about
17 HS products. The MFA groups span four T&C “segments:” Yarn, Fabric, Made-Ups and
Clothing. Examples of MFA groups in each segment are provided in Table 4.
Quotas were negotiated on individual MFA groups as well as on both aggregations and
subsets of groups, which are known as “merged” or “part” groups, respectively. As a result,
country-year-group observations in the database actually encompass a mixture of groups,
merged groups and part groups. For simplicity, we refer to all of these observations as being
at the “group” level for the remainder of the paper.
The negotiated quota for any particular group is stated in terms of square meter equiv-
alents (SME) of fabric. To pool potentially diverse groups with different native units–e.g.,
pairs of gloves and dozens of shirts–the ATC established “conversion factors” to concord
native units into square meter equivalents. These conversion factors are used to aggregate
base quotas and import levels and to provide a means of shifting quotas across groups with
different units (e.g., shirts to socks).
The Expired Performance Reports refer to nine possible classifications of negotiated
quantities. In this paper, we focus exclusively on “specific limit” quotas, which, according
to OTEXA, were the most restrictive quotas used under the MFA and ATC. The other
classifications are designated consultation levels, minimum consultation levels, other groups,
restraint limits, guaranteed access levels, designated consultation provisions, agreed limits
and tariff preference levels. Several of these designations are not actually quotas, but rather
served as watch lists. Their application is noted in the MFA/ATC Database.10
8Data for 1986 are missing. Refinement of the raw data is discussed in a technical Appendix available onrequest.
9For some countries, including Brazil, Indonesia and Sri Lanka, the agreement period in early yearscovered overlapping calendar years. All periods were standardized to match the calendar year under theATC.
10For some countries, there was another layer of quotas known as “aggregate group limits.”A specific limitwas a group-specific quota while the group limit imposed an aggregate quota over several MFA groups. Agroup could therefore be bound by a specific limit (individual, merged or part), subject to an aggregate

C����’� E����� � U���� ��� MFA/ATC 7
Specific quotas grew at fixed, known rates over an agreement term. Overall, they grew
an average of 6 percent per year, but growth varied across countries and groups. China,
for example, faced annual specific quota growth rates of 1 to 2 percent, and wool products
experienced slower growth than cotton goods.11
The U.S. MFA/ATC Database records the “base” quota, the “adjusted base” quota
and the total exports for each specific limit by country and year. The base quota is the
originally negotiated quota level determined at the start of an agreement term. Adjusted
base quotas reflect the use of what are known as “flexibilities,” which allowed countries to
exceed their base quota in a given period by borrowing unused base quota, up to a specified
percentage of the receiving group, across groups within a year and across years within a
group. Countries could apply multiple flexibilities on a group and the adjustments had to
be met by corresponding offsets in the lending groups.
There were three major flexibilities:
1. Carryforward and carryforward used: A carryforward allowed countries to borrow
base quota from the subsequent period within a group. A carryforward used offset a
carryforward. For example, in 1997 Macau carried forward 20,419 SME in group 338
(“Men/boys knit shirts”). The flexibility was then offset in 1998, under a carryforward
used, by -20,419 SME. Borrowing was subject to a country-product specific limit.
2. Carryover and shortfall used : A carryover utilized unused quota from the previous
period within a group, subject to a country-product specific maximum. A shortfall
used offset a carryover.
3. Shift-add, shift-subtract, swing : Shift-add, shift-subtract, and swings allowed across-
group base movements within a year, subject to limits.
After accounting for all flexibilities, the adjusted base quota for a given year reflects the
country-group deviation in that year from the original base quota. For example, China’s
2002 base quota for group 219 (“duck fabric”) was 2.6 million SME. China made two
adjustments on this group that year. First, it borrowed 2 percent from the previous year’s
unused quota (carryover). Second, it added 5 percent of its original base quota from another
group (swing). These adjustments resulted in an adjusted base quota of 2.8 million SME
for group 219 in 2002. If a country made no adjustment on a group, the adjusted base
quota simply remained at the base quota.
specific limit, or both. One potential explanation for aggregate limits is that it limited the use of flexibilitiesacross MFA groups (see below). We ignore these aggregate limits in this paper but they are available in theMFA/ATC Database.
11We include only specific-limit groups in our examination of fill rates below. In our regression analysis,non-specific limit groups are treated as unbound; the regressions include all T&C HS codes from all T&Cexporters.

C����’� E����� � U���� ��� MFA/ATC 8
Table 5 compares countries’ aggregate adjusted base quotas and exports across all groups
from 1984 to 2004. Results are reported for the thirty countries with the largest aggregate
adjusted base quotas. As indicated in the first two columns of the table, China, Taiwan and
Hong Kong exhibit the highest levels of both adjusted base quota and exports between 1984
and 2004. The final column of Table 5 reports countries’ aggregate “fill rates,” which equal
exports as a percentage of adjusted base quota. Although adjusted base quotas can exceed
base quotas, fill rates cannot exceed 100 because they are defined as exports over adjusted
base. As indicated in the table, Bangladesh, China, Indonesia, Pakistan, India and Sri Lanka
all exhibit aggregate fill rates in excess of 80 percent over the sample period. Countries with
relatively low fill rates include Jamaica, Guatemala, Colombia and Honduras.
Fill rates provide a useful indication of quota restrictiveness. We follow the USITC (and
Evans and Harrigan 2005) in defining a binding quota as one in which the fill rate exceeds
90 percent. Here, too, results are reported for the thirty countries with the largest base
quota. As indicated in Table 6, Bangladesh, India and China exhibited the largest share of
binding quotas over the sample period, in each case above 60 percent. We note that using
a more liberal or conservative definition for binding quotas, that is, fill rates of 80 and 95
percent, respectively, does not result in any substantial re-ranking of counties in terms of
which are most constrained over the sample period.
Interestingly, we find that less than 30 percent of the quotas were binding for other
major developing East Asian economies such as South Korea, Taiwan and Malaysia. Thus,
even though these countries were subject to a relatively large fraction of specific limits (see
Table 7), these limits appear to have been relatively weak. This outcome may be driven
in part by these countries’ relatively fast movement into more sophisticated manufactures
over the sample period. Indeed, we show in the next section that the share of East Asian
observations with binding quotas diminishes over time.
Heterogeneity in fill rates is also apparent across MFA groups. Table 8 reports aggregate
fill rates for the ten largest MFA groups. Trousers and knit shirts are the most constrained
groups, with exporters filling more than 80 percent of the allocated quota. Textile groups
such as cotton sheeting fabric and cotton poplin exhibited fill rates around 50 percent.
The database reveals that the (weighted) average fill rate across all years and exporters for
textile groups was only 48 percent compared to 72 percent for apparel groups. These fill
rates are consistent with research showing that developed countries apply greater protection
to industries where escaping competition from developing countries is harder. Khandelwal
(2007), for example, argues that it is harder for developed economies to differentiate their
products in terms of quality in apparel versus textiles.
Table 8 also shows that while there is heterogeneity in aggregate fill rates across products,
China’s fill rates exhibited substantially less variation: in all but one of the ten groups,

C����’� E����� � U���� ��� MFA/ATC 9
China’s fill rates exceeded 90 percent. Columns three and four report Bangladesh’s and
India’s fill rates in the major groups. Although Bangladesh was bound in the apparel groups,
the U.S. did not impose specific limits on Bangladesh in the major textile groups, even
though Bangladesh exported these products (with the exception of cotton yarns (300/301)).
India’s fill rates varied widely in the ten groups and was not subject to quotas for underwear,
man-made fiber knit shirts and man-made fiber sweaters.
4. The Relative Restrictiveness of U.S. T&C Quotas
In this section we demonstrate the relative restrictiveness of China’s quotas in terms of
the number of goods subject to quotas, how quickly quotas were allowed to grow and the
extent to which China was allowed to shift quota allocations across products and time.
4.1. Quota Coverage, Fill Rates and ETEs
The share of a country’s MFA groups that are covered by specific limits provides one
measure of cross-country variation in quota restrictiveness. Table 7 reports these shares
for the major T&C exporters in the pooled 1990 to 2004 dataset.12 As indicated in the
table, China, at 61 percent, exhibits the highest share of exports covered by specific limits
between 1990 and 2004. Shares for other large Asian exporters are 53 percent for Korea,
51 percent for Taiwan and 46 percent for Hong Kong. By comparison, just 20 percent of
India’s MFA groups were subject to specific limits.
Fill rates, discussed above, are a second measure of quota restrictiveness. As reported in
Table 5, many countries, particularly those in South Asia, exhibited aggregate fill rates over
the pooled sample period that are similar to those experienced by China. Fill rates, however,
varied substantially over time, as can be seen in Figure 2, which reports the distribution
of fill rates for China and three regions–East/Southeast (E/SE) Asia, South Asia and
the rest-of-world (ROW)–which, together, comprise all other countries in the sample.13
Distributions are reported for three cross-sections, 1985, 1995 and 2004. Each row and
column of the figure contains histograms for a different year and region, respectively. In
each histogram, the last bin reports the share of binding quotas (i.e., those with fill rates
exceeding 90 percent). As indicated in the last three columns of the figure, countries in
East/Southeast Asia, South Asia and ROW experienced more-or-less steady declines in
binding quotas over the two decades. East/Southeast Asia’s binding quotas, for example,
12We match the quota data to U.S. import data using a concordance HS-MFA group concordance providedby OTEXA. We have not yet processed the concordance mapping MFA groups to the Tariff Schedule of theU.S. (TSUSA) which would allow an analysis of U.S. T&C imports for earlier years.
13The East/Southeast Asian countries are: Cambodia, Hong Kong, Indonesia, South Korea, Laos,Macau, Malaysia, Philippines, Singapore, Taiwan, Thailand and Vietnam. The South Asian countries are:Bangladesh, India, Maldive Islands, Nepal, Pakistan and Sri Lanka.

C����’� E����� � U���� ��� MFA/ATC 10
drop from 60 percent in 1985 to less than 20 percent in 2004, while the fraction for South
Asia decline from 60 and 70 percent in 1985 and 1995, respectively, to 30 percent in 2004.14
China’s distribution of fill rates, on the other hand, remained essentially constant over the
sample period. This evidence suggest that China’s T&C exports to the U.S. remained
relatively constrained throughout the MFA and ATC. China’s fraction of binding quotas,
coupled with the relatively high extensive-margin constraint described above, provide the
first two pieces of evidence that China faced a tighter quota regime compared to other
countries.
Andriamananjara et al. (2004) argue that the price wedge created by the quota rents is
a better measure of how tightly a quota binds than its fill rate.15 The origin of these price
wedges and the degree to which they can be observed varies by country. While some coun-
tries, such as Hong Kong, created secondary markets to freely trade license permits, others
allocated licenses based on various criteria. China’s quotas, for example, were managed by
its Ministry of Foreign Trade and Economic Cooperation (MOFTEC). MOFTEC auctioned
off only a small share of the quotas available under the MFA. The rest were distributed to
firms according measures of past performace including: their ability to fill at least 90 percent
of their previous quotas; their ability to export other products not subject to constraints;
and their ability to improve the quality of their exports (Yang, 1995).
One way to measure the price wedge created by quota rents is to compute quotas’
export tax equivalents (ETEs). Under a perfectly competitive T&C market, the export tax
equivalent of a quota depends on the prices of quota licenses,
ETEcmt =lcmt
uvcmt − lcmt, (1)
where lcmt is the license price paid by the firm in country c in order to export products in
MFA group m at time t (measured in dollars per SME) and uvcmt is the free on board unit
value.
We find that fill rates and estimated ETE’s are roughly consistent in indicating the
extent to which China’s exports face a binding quota. Using data on Chinese export license
prices available for a subset of MFA groups from 1999 to 2004, we compute the export tax
equivalents of U.S. import quotas on Chinese products for these groups.16 As indicated
in Table 9, which summarizes the results of regressing the log of ETE on MFA group
14The distributions reported in Figure 2 exclude phased-out MFA groups, i.e., the figure displays thedistributions of fill rates among quotas still applied to the countries.
15 In countries where export licenses are used to ensure quota adherence, for example, quotas could be bind-ing even if fill rates are low due to insufficient or mis-allocation of licenses. According to Andriamananjaraet al. (2004), the internal license allocation regime was inefficient and expensive in many countries.
16Data on Chinese export license prices is available at www.chinaquota.com. Unfortunately, similar datais not available for all countries in our sample.

C����’� E����� � U���� ��� MFA/ATC 11
fill rates as well as year fixed effects, fill rates and ETEs are positively correlated. The
estimated coefficient is 2.1 and highly significant; it implies that a 10 percentage point
increase in the fill rate is associated with a 21 percent rise in the ETE. Column two reports
an analogous regression but includes MFA group fixed effects and therefore relies solely on
variation within groups to identify the correlation coefficient. As indicated in the table,
the estimated coefficient is 1.4. These relationships are intuitive: one would expect that
firms pay higher license prices for products in which capacity to export is tighter. While
license price data is only available for China in select years and MFA groups, we interpret
these results as providing support for our and others’ use of fill rates as a gauge of quota
restrictiveness.
Our results regarding the relative restrictiveness of U.S. import quotas on China com-
pared to its other trading partners are consistent with the more detailed inquiry of Francois
and Worz (2006), who estimate ETEs in a gravity-based econometric model that does not
require observation of license prices. They find that China’s ETEs increased non-linearly
under the ATC and estimate China’s ETEs in 2002 at 8 percent and 67 percent for Chinese
textiles and apparel, respectively. By comparison, they estimate India’s ETEs at only 2
percent for textiles and 5 percent for apparel.
4.2. Quota Growth Rates
The evolution of countries’ fill rates over time implies that quota growth exceeded export
growth for all regions except China. Figure 3 traces out the median year-over-year growth in
base quota for the four regions over the sample period. For East/Southeast Asia, South Asia
and ROW, the step increases in base quota growth rates match the ATC growth-on-growth
provision described in Table 1 above. Annual growth for ROW, for example, increased by
16 percent (from 6.00 to 6.96 percent) at the beginning of Phase 1, by 25 percent (to 8.7
percent) at the beginning of Phase II, and by an additional 27 percent (to 11.05 percent)
at the beginning of Phase III. The step functions for East and South Asia exhibit identical
increases.
China’s trajectory of base quota growth, in contrast, is essentially flat. Prior to the
ATC, China’s growth was roughly equal to that for East/Southeast Asian countries, but
in 1994, China’s base quota growth was frozen (set to zero). China became eligible for the
growth-on-growth provision in 2002, after entry into the WTO, and its median growth rate
ticked up slightly, but the magnitude of the increase was small given China’s low growth
rate. China’s overall base growth rate was much lower than the rest of the world for the
remainder of the ATC. This restrictiveness also varied across MFA groups. For example,
the U.S. imposed slower quota growth for wool products (1 percent for all region in 1995),
but even lower growth in these products for China (0.5 percent) overall growth.

C����’� E����� � U���� ��� MFA/ATC 12
4.3. Flexibilities
The restrictiveness of the U.S. quota regime can also be measured in terms of countries’
ability to adjust their base quotas over time. As discussed above, the MFA/ATC agreements
granted trading partners limited flexibility to borrow and lend quotas across groups and
years in response to demand and supply shocks. To our knowledge, use of flexibilities
has received little attention in the literature. In this section, we examine both the use of
flexibilities as well as their intensity, conditional on use. We find that China’s adjustments
to its base quotas were more frequent and smaller than those of other countries.
Table 10 demonstrates that China made relatively greater use of flexibilities in terms of
frequency than many countries between 1984 and 2004. During this period, China made an
adjustment to 92 percent of its quotas. Indeed, a striking feature of the data is that China
made at least one adjustment to every quota group between 2000 and 2004.
One potential explanation for China’s relatively frequent adjustments is that it faced
more restrictive caps on its ability to reallocate quotas across groups and time. If flexibility
caps were small, a desired increase in one group might involve more transfers across groups
or years than if the caps were large. Unfortunately, the Expired Performance Reports do
not provide comprehensive information on countries’ flexibility limits over the entire sample
period.17 Details available for 1997, however, indicate that China was allowed across-group
shifts up to a maximum of 5 percent of the receiving group’s base quota and across-time
movements of up to 3 percent. Bangladesh and Jamaica, by contrast, were permitted shifts
of up to 7 percent across groups and 11 percent across time.
While some countries, notably India and Bangladesh, also made frequent use of the
flexibility provisions, among these countries, China faced relatively tighter “flexibility mar-
gins” across groups. We define these margins to be the absolute percentage deviation of
the adjusted base from the original base for a particular country, group and year. They
are computed across all groups in which adjustments are observed. China’s median margin,
at 5 percent, is the lowest among countries that made adjustments on at least 80 percent
of its quota groups. China’s margin was also about half the level exhibited by India and
Bangladesh.
Another potential explanation for China’s greater use of flexibilities was the relative re-
strictiveness of its quotas. Given the relatively high number of products bound by quotas,
their relatively high fill rates, and their relatively low annual growth rates, frequent adjust-
ments to its base levels may have been necessary to respond to given demand or supply
shocks.18 Countries relatively less constrained by their quota levels and growth rates, by
17Flexibilities were capped at an amount determined by the country’s bilateral agreement. Unfortunately,we do not have these details for all agreements in the database.
18 Indeed, Francois and Worz (2006) find that China’s ETEs spiked to 25 and 112 percent for textiles and
C����’� E����� � U���� ��� MFA/ATC 13
contrast, would have more room to respond without making as many adjustments. More-
over, China’s was limited in its ability to shift quotas to respond to these shocks. Though
we do not pursue this topic here, it is likely that data on countries’ flexibility limits and us-
age under the MFA/ATC could be used to help construct and calibrate a model of optimal
quota borrowing and lending.
5. Quantity Responses to ATC Phase-Outs
In this section, we examine China and other countries’ export quantity responses to the
ATC phaseouts. We show that countries’ export growth occurred primarily in incumbent
products, that it varied according to the relative restrictiveness of China’s quotas, and that
China’s export surge in 2005 had ample precedent in prior phases of quota liberalization.
5.1. Overview
Figure 4 provides an overview of U.S. T&C consumption from 1990 to 2006 according
to whether goods were sourced from domestic manufacturers, China, or other U.S. trading
partners (ROW).19 As indicated in the figure, the contribution of domestic producers and
other trading partners rose more-or-less steadily through the 1990s. China’s exports, on
the other hand, remained relatively flat for the reasons outlined above until 2001. After
2001, China’s exports surge, other trading partners’ exports begin to level off and U.S.
production starts a long-run decline. Between 2000 and 2006, China’s total T&C exports
increased almost six-fold from 4.3 billion to 25 billion SME.
To gain a better sense of the potential impact of China’s reaction to quota relaxation
on other regions’ exports, Figure 5 plots the evolution of export quantities by region be-
tween 2000 and 2006. Several regions’ exports–e.g., North America, the Caribbean and
Oceania–end this period lower than they started, with losses for some (e.g., Oceania) being
deeper than others. Other regions experienced reversals of robust export growth during the
period. Central America’s long-running increase in T&C exports between 2000 and 2005,
for example, declined precipitously in 2006. The importance of this reversal is underscored
by the fact that T&C goods accounted for roughly three quarters of Central America’s total
manufacturing exports to the U.S. in 2004. Similar reversals were experienced by South
America, the former Soviet Union, East Asia, the Middle East and Sub-Saharan Africa. For
each of these regions, T&C exports in 2006 were lower than their maximum between 2000
apparel, respectively, in 2004, when China no longer had the ability to carry forward additional quota levelsbecause of imminent end of the MFA/ATC regime.
19U.S. production figures are taken from a report of U.S. T&C production published quarterly by OTEXA(OTEXA, 2007). This publication states that exports at the MFA group level are unreliable, so we set exportsto zero to calculate the domestic market size.

C����’� E����� � U���� ��� MFA/ATC 14
and 2005. South and Southeast Asia, and, although a bit more erratic, the E.U. and North
Africa, were the only regions to experience steady export growth between 2000 and 2006.
In the remainder of this section, we provide a more formal assessment of China’s impact
on other U.S. trading partners T&C exports to the United States.
5.2. Intensive vs Extensive Margin Export Growth as Quotas are Removed
Export growth in response to quota relaxation has two potential sources. The first
is net growth within countries’ continuing products, i.e., along their “intensive” margin.
The second is net growth due to adding new products or dropping previously exported
products, i.e., along their “extensive” margin.20 A priori, it is not obvious which margin
will dominate; depending upon assumptions, shifting resources into additional product lines
may be more profitable than increasing the capacity of existing product lines.
Table 11 decomposes countries’ aggregate export quantity growth in percentage terms
in the year following each phase of ATC integration. We document export patterns by ATC
integration to emphasize the similarities in exporting behavior across each integration stage.
Except for China, responses are reported by region. The first column for each phase notes
regions’ aggregate growth, while the subsequent two columns decompose this aggregate
growth into the parts due to countries’ intensive and extensive margins. Each panel reports
the change in quantities in the year of integration for each phase. That is, panel one reports
growth in 1995, panel two in 1998, and so on. Since China became eligible for Phase I and II
integration in 2002, the bottom row reports China’s response in this year for those phases.
As indicated in Table, export growth coinciding with Chinese quota relaxation primarily
occurs through the intensive margin. For China, the intensive margin represents more than
90 percent of growth in Phases I, III and IV, and two-thirds of growth in Phase II. Across all
other U.S. trading partners, the intensive margin represented the more important margin
of adjustment in Phases II-IV.
Table 11 also provides an initial view of the contemporaneous response of China’s export
growth following each integration phase. China’s overall response in the year of each phase-
out was 42, 32, 306 and 271 percent for Phases I to IV, respectively. We note that China’s
Phase III increase accounted for 71 percent of the total increase in Phase III exports in 2002
(i.e., 22 of 31 percentage points). In 2005, aggregate exports from all countries excluding
China actually fell 2 percent, a signal that China’s impact on other U.S. trading partners
was potentially large in this final phase.
20As noted earlier, the United States imposed quotas at the level of three-digit MFA groups. These groupscontain a median of 19 HS products.

C����’� E����� � U���� ��� MFA/ATC 15
5.3. Reactions to Relaxation of China’s Quotas
Other U.S. trading partners’ reaction to the relaxation of China’ quotas varied according
to their relative restrictiveness. As noted above, we classify China’s quotas in the year prior
to each phase as being binding if they exhibit a fill rate in excess of 90 percent.21 To estimate
the differential growth associated with relaxation of bound and unbound quotas, we regress
the change in country-products’ export quantity on region-year dummies interacted with a
dummy variable indicating whether China’s quota was previously binding,22
∆ln qcrht = β1rtChinaBoundh,t−1 + β2rtChinaUnboundh,t−1 + νcrht (2)
where ∆ ln qcrht is the change in export quantity of country c in region r in HS product h
between years t and t+1 and β1rt and β2rt are region-year dummies. These region-year dum-
mies are interacted with ChinaBoundh,t−1,a dummy variable which equals unity if China’s
quota in product h in year t−1 had a fill rate exceeding 90 percent, and ChinaUnboundh,t−1,
is a dummy variable which equals one if China was not subject to a binding quota. Vis a
vis the aggregate growth pattern displayed in Table 11, this regression differences out the
country-product fixed effects. β1rt and β2rt therefore identify the average quantity change
across countries in region r within country-products in which China faced binding and non-
binding quotas, respectively.23 We focus here on other countries’ responses in goods in
which China faced non-binding and binding quotas to gain insight into how these regions
were influenced by China. Toward that end, the coefficients we report for Phases I to III
are for 2002; for Phase IV, we report coefficients for 2005. In line with the results of Table
11, equation 2 concentrates on countries’ reactions along the intensive margin.
Table 12 reports OLS estimates for four separate estimations of equation (2), one for
each phase of ATC integration. There are two columns for each phase: the first reports
countries’ average growth in products where China previously faced non-binding quotas
(β2rt), while the second column reports countries’ average growth in products where China
previously faced binding quotas (β1rt).
Results for Phase I in the first panel of Table 12 contain all zeros in the binding column
because none of China’s quotas on Phase I products were binding in 2001.24 The second
panel reports the 2002 region-year fixed effects for Phase II products. Results in this column
21Results do not change when we perturb this cutoff.22Because fill rates are available at the MFA group level, we attribute group-level fill rates to all HS
products in the group.23We exclude the constant in this regression, and standard errors are clustered by exporting country.24Phase I products were placed in the 9xx MFA groups which were a collection of products with which
the U.S. was relatively unconcerned and therefore integrated early. The U.S. MFA/ATC Database doesnot have quota information for these MFA groups. We interpret the fact that this information is missingas evidence that goods in these groups were unconstrained by quotas and this fact was confirmed throughcorrespondences with OTEXA.

C����’� E����� � U���� ��� MFA/ATC 16
indicate that China averaged 153 percent (e0.93−1) export growth in non-binding products
and an incredible 855 percent (e2.26− 1) average increase in bound products. Note that the
growth rates for Phase II are higher than the aggregate growth rate reported at the bottom
of Table 11; this discrepancy is likely due to the fact that small products grew faster than
the large products.25 Results for East Asia and South Asia suggest that exports from these
regions increased in products where China’s quotas were not binding but declined in the
products where China faced binding quotas. Results for Phase III show a similar result with
respect to China’s response, but more muted responses by other countries. China’s exports
in products subject to binding quotas increased 511 percent compared to 291 percent in
unbound products.
The point estimates for Phase IV are perhaps the most dramatic. Here, too, China’s
export quantity growth is significantly higher in its bound versus unbound products, 463
percent versus 261 percent. Response to Chinese growth are equally dramatic, with nine of
fourteen regions experiencing negative and significant declines in China’s bound products.
These response contrast starkly with those associated with Phase III.
Variation in countries’ reactions to the removal of Chinese quotas likely reflects dif-
ferences in comparative advantage across T&C products. Though formal assessment of
countries’ elasticities of substitution with Chinese exports requires structural estimation
beyond the scope of this chapter, the results in Table 12 can be used to provide a rough
guide as to which countries were the biggest “losers” with respect to China. Toward that
end, Table 13 reports the results of a Phase IV regression like that in equation 2 but at the
country level. Countries are ordered according to their average response in China’s previ-
ously bound products, with statistically significant responses in bold. Of the 143 countries in
the table, average exports fell in 102 countries, and these drops were statistically significant
for 54 countries. Statistically significant declines range from a low of 13 percent (e0.14 − 1)
for Italy to a high of more than 80 percent for Kuwait, Russia, the Maldives, Micronesia,
Guinea and Oman. Remarkably, only eight countries exhibit an increase in exports. Three
of the largest South Asian exporters — Bangladesh, India and Pakistan — report positive
but statistically insignificant changes in exports. Though these countries fare much better
than others, it is possible their export growth might have been much higher in the absence
of robust Chinese growth.
Declines among Sub-Saharan African exporters may have been particularly economi-
cally significant. These countries experienced increasing T&C exports to the United States
from 2000 to 2004 because of modifications made to the rules-of-origin requirements un-
der AGOA; as shown in Figure 5, the region’s T&C exports doubled between 2000 and
25See Arkolakis (2007) for a model of market penetration implying that low-volume products grow fasterthan high-volume products as trade costs fall.

C����’� E����� � U���� ��� MFA/ATC 17
2004. These modifications–collectively referred to as the “Special Rule”—allowed countries
to satisfy rules-of-origin requirements using fabric of any origin provided that the clothing
assembly took place within borders. As discussed in Whalley and Dayaratna-Banda (2007),
firms responded to the Special Rule by importing fabrics from Asian countries for assembly
in Africa.26 The Special Rule also lead to substantial inward foreign direct investment as
multinational firms located the final stages of production to “hop” over the quotas (Frazer
and Van Biesebroeck, 2007). The “quota-hopping” lead to a boom in Sub-Saharan T&C
production, particularly in Madagascar, Lesotho and Swaziland. Between 2000 and 2004,
for example, Lesotho’s T&C exports to the United States nearly quadrupled, to $455 mil-
lion as the number of T&C factories located in the country doubled from 21 to 47 (IMF,
2007). In the year following the end of the ATC in 2005, Lesotho’s T&C production shrank
considerably.27 Both the value and quantity of its T&C exports to the United States fell 14
percent; in China’s bound products, the average Lesotho export fell 43 percent. Employ-
ment fell 30 percent, to 35,000 workers, and one quarter of its production facilities closed
down (IMF, 2007).
6. Price Responses to ATC Phaseouts
A second margin along which countries might react to the removal of import quotas is
price. In this section we examine the evolution of the United States’ T&C import free-on-
board unit values (i.e., import value per SME) subsequent to each Phase of ATC integration.
In contrast to the results reported above, we here focus on countries’ unit value changes in
response to their own, not China’s, quota relaxations.
Table 14 reports the results of a regression similar to equation (2) but where the depen-
dent variable is the log difference in unit value rather than export quantity, and where the
binding dummy takes a value of one if the country-product was constrained in its country of
origin the prior year. As a result, coefficient estimates are with respect to 1995, 1998, 2002
and 2005 for Phases I through IV, respectively in the upper portion of the table. China’s
response to its Phase I and II good quota relaxations in the year in which those quotas were
actually removed (i.e., 2002) are reported at the bottom of the table.
As indicated in Table 14, China’s average unit values fell in the years that its products
were integrated. Here, as above, responses varied according to whether or not China faced
binding quotas. Unit value declines for exports previously restrained by China’s binding
quotas were larger in all integration phases. In 2002, Chinese unit values for bound Phase
26The following AGOA countries were not eligible for the Special Rule provision: Botswana, Gabon,Mauritius, Namibia, Seychelles, and South Africa (www.agao.gov).
27As noted by Whalley and Dayaratna-Banda (2007), Sub-Saharan T&C exports in 2005 were also hurtby an appreciation of the South African Rand.
C����’� E����� � U���� ��� MFA/ATC 18
II products fell 55 percent (e−0.81 − 1) versus 32 percent for unbound products. For Phase
III and IV products, the declines for China were 48 versus 42 percent, and 41 versus 31
percent, respectively. More broadly, though unit value responses vary across phases, they
are generally negative and significant for East Asia, Southeast Asia and South Asia, and
generally larger in bound products than unbound products.
One explanation for China’s and other countries’ unit value declines is simply that as
quotas are relaxed, goods prices decline and firms slide down their demand curves as prices
and quantities adjust to the previously unrealizable competitive outcome. Indeed, Francois
and Worz (2006) estimate the export tax equivalent of Chinese quotas to be 25 percent for
textiles and 110 percent for apparel in 2004. With the quotas removed, ETEs, by definition,
fall to zero.
Declining prices might also accompany quota relaxation as a result of quality downgrad-
ing. It is well known in the international trade literature that firms facing quotas have an
incentive to export higher-margin goods; see, for example, the theoretical research of Kr-
ishna (1987) and Das and Donnenfeld (1987) and the empirical studies of Aw and Roberts
(1986) and Feenstra (1988). Evans and Harrigan (2005), for example, find that U.S. imports
of products facing binding quotas exhibit a 6.3 percent price premium relative to unbound
imports. Under the assumption that prices reflect only vertical product differentiation, the
results reported in Table 14 provide prima facie evidence that China’s T&C quality fell
following the removal of quotas.
Quality upgrading in response to quantitative restrictions is possible through changes in
demand or changes in supply-side characteristics. In the former, imposition of quota rents
leads to identical markups across products which induce consumers to substitute towards
higher-priced varieties. This effect is similar to Alchian and Allen’s (1964) Washington
apples story where higher-priced goods are shipped over greater distances to lower the per
dollar transport costs (see also Hummels and Skiba 2004). Feenstra and Boorstein (1994)
infer quality in this context by comparing a unit value index, which uses quantity weights,
to an exact price index, which uses value weights: if the unit value index increases by more
than the exact price index, consumption has shifted towards more expensive goods and
average quality of goods from the restricted country increases. Using this method to study
the affects of quota removal, Harrigan and Barrows (2007) find that the quality of China’s
bound products fell 7 percent more than its unbound products when quotas were removed
in 2005.
Here, we complement Harrigan and Barrows (2007) by using an approach developed in
Khandelwal (2007) to measure quality changes within countries’ products. As discussed in
detail in the Appendix, this approach uses a discrete choice demand system to infer country-
product (i.e., variety) quality, relative to the average U.S. domestic quality, by estimating
C����’� E����� � U���� ��� MFA/ATC 19
differences in relative market shares after controlling for prices. We then examine how these
measures of country-product quality react to quota removal using a specification analogous
to the ones employed above,
∆θcht = β1rtChinaBoundh,t−1 + β2rtChinaUnboundh,t−1 + νcrht. (3)
where θcht is the estimated quality of country c in product h at time t obtained from a
implementing the approach discussed in the Appendix. In this specification, we regress
the change in country-product quality on region-year fixed effects which are interacted with
ChinaBoundh,t−1, a dummy variable which equals unity if China’s quota in product h in
year t−1 had a fill rate exceeding 90 percent, and ChinaUnboundh,t−1, is a dummy variable
which equals one if China was not subject to a binding quota. To focus attention on China,
we estimate a single ROW fixed effect for each year for all other countries and, as before,
run the regressions separately by phase. For Phases I and II, we report coefficients for 2002
when China became eligible for integration, rather than the phaseout defined under the
ATC. Coefficients and standard errors are reported in Table 15.
The coefficients generally report a positive change in quality in the year of integration for
both bound and unbound varieties and for both China and the ROW. On first inspection,
these results appear inconsistent with the idea that dismantling quotas results in quality
downgrading. Recall, however, that our measure of country-product quality reflects con-
sumers’ valuation of Chinese goods relative to “outside goods,” which, in this case, are
domestic varieties. These relative valuations complicate the evaluation of the results in
Table 15 because, for example, a deterioration in the quality of the outside good would lead
to increase in the quality of the imported varieties. That is, our measure of quality does
not separately identify shifts in preferences across HS products versus shifts in preferences
towards the outside good.28
We can use the coefficients in reported in Table 15 to compute a difference-in-differences
estimate of China quality upgrading in bound products that uses quality change in unbound
products and the ROW as baselines.29 First, we first take the difference between China’s
change in quality for bound and unbounded varieties; for Phase IV this is 0.72-1.01, or
-0.29. This first difference controls for country-specific changes in technology or shifts in
demand that are common to all varieties within the country. Second, we compare this
difference to the analogous difference in the ROW’s coefficients for China’s bound and
unbound products; for Phase IV this is -0.29-0.18, or -0.47. This second difference nets out
changes in consumers’ valuation across varieties. For example, suppose there is a positive
28See Nevo (2003) for a detailed discussion on this point.29Actually, this is a triple difference specification, but since we focus on changes in quality, the time
difference is already assumed.

C����’� E����� � U���� ��� MFA/ATC 20
technology shock to the Chinese T&C industry. The first difference would control for
the technology shock since the shock would be common to China’s bound and unbound
exports. Now suppose an extreme winter increases the demand winter clothing; this shock,
common to both China and ROW assuming away compositional differences, is controlled
by differencing Chinese quality with the ROW within products. In this way, the difference-
in-differences estimate provides an uncontaminated estimate of the relative Chinese bound-
versus-unbound quality change following each phase-out.
Difference-in-difference estimates for each Phase are reported in the bottom panel of
Table 15. As mentioned earlier, China’s Phase I products were not subject to binding
quotas, so we merely report the difference between China’s and the ROW’s unbound quality
changes, which is positive and significant at the ten percent level. For Phase II, we find
that China’s bound products actually increase in quality, an outcome that is inconsistent
with theory. One possible explanation for this result is that Phase II products were only
marginally binding in a way that our assessment of bindingness does not pick up.
We do find relative declines in China’s bound products’ quality in response to Phases III
and IV, though only the latter estimate is statistically significant at conventional levels. In
both Phases, China registered improvements in quality within bound and unbound varieties,
but ROW quality increases by more. These results appear consistent with theory and
complement the across-good shifts in demand identified by Harrigan and Barrows (2006)
for Phase IV products. They also support the idea that restrictions on China were relatively
more stringent.
7. China’s T&C Future
China’s share of U.S. textile and clothing imports jumped three-fold, from 10 to 33
percent, between the time it joined the WTO in December 2001 and the end of the ATC
regime in 2005. This growth, and in particular China’s surging exports in the early months
of 2005, spurred domestic firms and other developing countries to lobby the United States,
successfully, for the re-imposition of textile and clothing quotas on China. By the middle of
2005, the U.S. and China had agreed to new limits on China’s exports in a subset of T&C
categories previously covered by Phase IV of the ATC. These categories are listed in Table
2; they are to remain in effect until 2008.
Some analysts believe that China’s large increase in Phase IV exports in early 2005 oc-
curred primarily as a hedge against future protectionist measures. By dramatically increas-
ing their exports early in the year, this line of thinking goes, Chinese firms would be able
to establish higher base levels for an inevitable new round of quotas. Table 2 provides some
evidence in favor of this hypothesis, as the new, post-ATC quota levels agreed to in 2005
were substantially larger than the levels previously imposed by the ATC. Going forward, it

C����’� E����� � U���� ��� MFA/ATC 21
is not clear that China will be free of quotas after 2008. According to its WTO accession
documents, WTO member countries are allowed to impose product-specific safeguards on
China to prevent market disruptions until 2013. As a result, the U.S. might continue to
apply quotas or resort to other forms of protection, such as anti-dumping remedies, once
the current safeguards are removed (Bown, 2007). Whalley and Dayaratna-Banda (2007)
argue that the new safeguards are merely a means of re-imposing an MFA/ATC regime on
China, with the major exception that quotas now just apply to China as opposed to all
developing economies.
China’s exports to the EU also surged after ATC expired. This increase induced a
similar response in the EU, with the result that China and the EU also signed a new bilateral
agreement in 2005 restricting China’s imports in 10 groups of T&C products through 2007.30
As was well reported at the time, China satisfied its quotas in these goods by September
2005, with the result that $501 million worth of Chinese goods backed up on European
ports.31 Only after high-level negotiations led to an amended quota agreement for 2005 were
these goods allowed into the EU. The EU’s new safeguards remain in effectuntil December
31, 2007; they are summarized in Table 16.
Many observers have reacted to China’s T&C export growth with the claim that all of the
world’s T&C production will relocate to China once its quotas are abolished permanently.
Interestingly, Chinese officials appear to be looking beyond their dominance of apparel and
textiles, and have voiced concern that rising wages will erode their comparative advantage
in this sector vis a vis even lower-wage countries like Vietnam, Cambodia and Bangladesh.32
Though such an outcome appears unlikely, at least in the near term, these countries have
become more important sources of T&C exports in recent years. In the year after its trade
relations with the U.S. were normalized in 2001, for example, Vietnam’s T&C exports
to the U.S. increased 240 percent, though its market share in terms of quantity in 2005
remained under 2 percent. Until 2007, when it, too joined the WTO, Vietnam’s exports
were hampered by U.S. quotas on 25 groups of T&C products.
Given the large T&C export capacity of China, China’s dominance of the T&C market
should continue into the near future, especially as the new safeguards expire. As China
continues its transition towards more capital- and and skill-intensive industries, however, it
is likely that the relative importnace of apparel and textiles in the Chinese economy will fall.
Already, T&C exports have declined to 11 percent of the country’s total exports to the U.S.,
down from 26 percent in 1990. As this transition continues, it is likely that countries at
30Dayaratna-Banda and Whalley (2007) report that China has either signed, or is in negotiations to sign,similar quota agreements with Brazil, Turkey, Canada, Mexico and Peru.
31“Europe and China in Accord Over End to a Textile Dispute,”New York Times, September 6, 2005.32See the discussions of the 2007 China Development Forum, “Towards New Models of Economic Growth”,
available at http://www.cdrf.org.cn/en/.
C����’� E����� � U���� ��� MFA/ATC 22
earlier stages of development, such as Cambodia and Vietman, will become bigger players.
8. Appendix: Quality Estimation
This Appendix explains how to identify quality from the T&C import data. The frame-
work is based on the approach taken by Khandelwal (2007) and the reader is referred to
that paper for additional details.
We assume that consumers have discrete choice preferences and select the one country-
product variety that provides them with the highest utility. The (indirect) utility that
consumer obtains from purchasing variety ch is
Vchnt = θ1ch + θ2t + ξcht − αpcht + εchnt, (4)
where θch + θt + ξcht denotes the quality of variety ch at time t, pcht denotes its price and
εchnt is a random consumer-variety specific term. The random term ε introduces horizontal
differentiation; its inclusion precludes prices from being sufficient statistics for quality.33
The random term ε can be decomposed into two randomly distributed components,
εchnt = ψhnt + (1− σ)νchnt, (5)
with 0 ≤ σ < 1. The ψ term is a consumer-HS product random effect which provides
consumer n with an idiosyncratic utility from choosing a variety that resides in product h.
This term generates a nested logit system which is a more flexibility demand model because
it alleviates the IIA problem found in simple logit models. The product-level random effect
creates correlation across varieties within a same HS code which means that consumers are
more likely to substitute towards varieties within the same product.34
Under the assumption that ν is an i.i.d extreme value, we can aggregate over all individ-
ual purchases in the economy to obtain aggregate market shares for each variety (e.g., see
Berry 1994). In order to complete the demand system, the consumer is allowed to choose
an “outside” good if none of the inside varieties provides him with a high enough utility. In
this context, the outside good market share is the U.S. market share.
The aggregation leads to the following demand system equation
ln scht − ln s0t = θ1ch + θ2t − αpcht + σ ln sc|ht + ξcht (6)
33 In a vertical market, prices are sufficient statistics for quality. Here, a variety that happens to possessa low quality, θch, and a high price, pcht, may still be purchased if the consumer draws a high εchnt.
34As σ goes to zero, the within product correlation also goes to zero and the model converges to a standardlogit model.

C����’� E����� � U���� ��� MFA/ATC 23
The left hand side of the demand system measures the variety’s market share scht relative
to the outside good market share (s0t). We run regression (6) separately for aggregates of
the MFA groups.35 This allows price sensitivities and year fixed effects to vary by aggregate
leading to more flexible parameter estimates. The portion of observed quality are captured
by country-product (θ1ch) and year (θ2t) fixed effects. The price is denoted by pcht where
α captures price sensitivity (a semi-elasticity). The sc|ht term results from the demand
structure that nests varieties within products. This term captures the variety’s market
share within product h at time t. Finally, ξcht is the unobserved component of quality that
becomes the residual of the estimating equation. Since this term is potentially correlated
with prices, we have the classic simultaneity problem associated with estimating demand
curves. We identify the equation by instrumenting price with trade costs.36 The estimated
qualities are defined by θcht = θ1ch+θ2t+ξcht. The interpretation of these quality measures
is that conditional on price, the variety with higher market shares have higher quality.37
9. References
References
Alchian, A. and W. Allen (1964). University Economics. Belmont, CA: Wadsworth.
Andriamananjara, S., J. Dean, and D. Spinanger (2004). Trade apparel: Developing coun-
tries in 2005. Kiel Institute of World Economics.
Arkolakis, C. (2007). Market Access Costs and the New Consumers Margin in International
Trade. Mimeo, Yale University.
Aw, B. Y. and M. Roberts (1986). Measuring quality change in quota-constrained import
markets. Journal of International Economics 21, 45–60.
Berry, S. (1994). Estimating Discrete-Choice Models of Product Differentiation. RAND
Journal of Economics 25, 242-262.
35Market share within an MFA group sum to one, but we pool observations over aggregates of the MFAgroups. For example, one aggregate includes dresses which differ according to fabric (e.g., MFA groups 336,436, 636, 736, and 836). MFA groups are classified into 43 aggregates.
36Hummels and Skiba (2004) find evidence supporting the Alchian-Allen conjecture that export qualityincreases with trade costs. This potentially raises concerns that trade costs may be correlated with varietyquality. However, the exclusion restriction remains valid as long as transport costs affect average qualityand not the time-specific deviation, ξ
cht. Since the nest share term is also endogenous, we use the number
of varieties within HS product to instrument this term (Berry et al., 1995)37Note that this intuition for quality is similar to that found in Hallak and Schott (2007). The results of
these regressions are available upon request.

C����’� E����� � U���� ��� MFA/ATC 24
Berry, S., J. Levinsohn, and A. Pakes (1995). Automobile Prices in Market Equilibrium.
Econometrica 63, 841-890.
Boorstein, R. And R. Feenstra (1991). Quality Upgrading and Its Welfare Costs in U.S.
Steel Imports, 1969-1974, in E. Helpman and A. Razzin, eds. International Trade and
Trade Policy. Cambridge: MIT Press, 1991, 157-186.
Bown, C. (2007). China’s WTO Entry: Antidumping, Safeguards and Dispute Settlement.
NBER Working Paper No. 13349.
Das, S. and S. Donnenfeld (1987). Trade policy and its impact on quality of imports: A
welfare analysis. Journal of International Economics 23, 77–95.
Dayaratna-Banda, O. and J. Whalley (2007). After the MFA, the CCAs (China Contain-
ment Arrangments). CIGI Working Paper No. 24.
Diao, X. and A. Somwaru (2001). Impact of the MFA phase-out on the world economy an
intertemporal, gobal general equilibrium analysis. TMD Discussion Paper No. 79.
Evans, C. and J. Harrigan (2005). Tight clothing: How the MFA affects apparel exports. In
T. Ito and A. Rose (Eds.), International Trade in East Asia. Chicago: The University
of Chicago Press.
Feenstra, R. (1988). Quality change under trade restraints in Japanese autos. Quarterly
Journal of Economics 103, 131–146.
Francois, J. and J. Worz (2006). Rags in the High Rent District: The Evolution of Quota
Rents in Textiles and Clothing. CEPR Working Paper 5477.
Frazer, G. and J. Van Biesebroeck (2007). Trade Growth Under the African Growth and
Opportunity Act. NBER Working Paper 13222.
Hallak, J. and P. Schott (2007). Estimating cross-country differences in product quality.
Yale University, Mimeo.
Harrigan, J. and G. Barrows (2006). Testing the theory of trade policy: Evidence from the
abrupt end of the Multifibre Arrangement. NBER Working Paper 12579.
Hummels, D. and A. Skiba (2004). Shipping the Good Apples Out? An Empirical Confir-
mation of the Alchian-Allen Conjecture. Journal of Political Economy. 12(6), 1384-1402.
IMF (2007). End of Quotas Hits African Textiles. IMF Survey Magazine: In the News, July
5, 2007.

C����’� E����� � U���� ��� MFA/ATC 25
Khandelwal, A. (2007). The long and short (of) quality ladders. Yale University, Mimeo.
Krishna, K. (1987). Tariffs versus quotas with endogenous quality. Journal of International
Economics 23, 97–112.
Nevo, A. (2003). New Products, Quality Changes and Welfare Masures Computed from
Estimated Demand Systems. The Review of Economics and Statistics, 85(2), 266-275.
Nordas, H. (2004). The global textile and clothing industry post the agreement on textiles
and clothing. WTO discussion Paper 5.
Rivera, S., L. Agama and J. Dean (2003). Africa beyond 2005: Understanding the impact of
eliminating NTBs and tariffs on textiles and clothing. International Trade Commission,
mimeo.
Schott, P. (2008). The relative sophistication of Chinese exports. Economic Policy 53, 5-49.
Spinanger, D. (1999). Texiles beyond the MFA phase-out. World Economy 22, 455–476.
USITC (2004). Textile and apparel: Assessment of the competitiveness of certain foreign
suppliers to the U.S. market. Investigation No. 332-448.
Whalley, J. and O. Dayaratna-Banda (2007). After the MFA, the CCAs (China Containment
Agreements). CIGI Working Paper No. 24.
World Trade Organization (2001). Report of the working party on the accession of china.
WT/ACC/CHN/49.
Yang, Y. (1995). China’s textile and clothing exports: Challenges in the post-MFA period.
Pacific Economic Papers 250, 6.7–6.12.

C����’� E����� � U���� ��� MFA/ATC 26
Phase Starting DateShare of Export
Volume IntegratedIncrease in Quota
Growth RateNumber of HS
Products Integrated
I January 1, 1995 16 16 318II January 1, 1998 17 25 744III January 1, 2002 18 27 745IV January 1, 2005 49 n/a 2,978
Notes: Table describes the four phases of the Agreement on Textiles and Quotas. First three columns describe aspects of the Agreement that were common to all signatories. Final column reports the integration of products as implemented by the United States. Quota growth acceleration was advanced one phase for countries with less than 1.2 percent of the importing country's total quotas in 1991. Source: OTEXA.
Table 1: ATC Integration Schedule

C����’� E����� � U���� ��� MFA/ATC 27
MFA Group Unit 2004 Quota 2005 Exports 2006 Quota2007 Quota
Growth2008 Quota
Growth200/301 Sewing thread/combed cotton yarn kg 3,374,340 6,949,753 7,529,582 15 17222 Knit fabric kg 9,664,477 18,145,812 15,966,487 15 17229 Special purpose fabric kg - 29,001,226 33,162,019 16 17332/432/632-T Hosiery dp - 59,532,623 64,386,841 14.5 15332/432/632-B Babies garments dp - 3,691,911 61,146,461 15 15338/339-PT Cotton knit shirts dz 2,403,364 12,763,562 20,822,111 12.5 15340/640 Mens/boys woven shirts dz 2,256,734 6,173,242 6,743,644 12.5 15345/645/646 Sweaters dz 965,382 7,850,557 8,179,211 12.5 16347/348 Cotton trousers dz 2,374,254 18,379,851 19,666,049 12.5 15349/649 Brassieres dz 16,828,971 20,717,107 22,785,906 12.5 15352/652 Underwear dz 5,025,472 18,175,964 18,948,937 12.5 15359-S/659-S Swimwear kg 722,299 5,951,219 4,590,626 12.5 16363 Pile towels no 23,593,437 87,842,008 103,316,873 12.5 16666-PT Window blinds/shades kg 546,069 - 964,014 12.5 17443 Men/boys wool suits no 132,818 1,613,356 1,346,082 12.5 16447 Men/boys wool trousers dz 72,716 203,332 215,004 12.5 16619 Polyester filament m2 - 60,348,016 55,308,506 12.5 16620 Other synthetic filaments m2 - 83,531,558 80,197,248 12.5 15622 Glass fabric m2 - 30,274,778 32,265,013 15 17638/639-PT Mmf knit shirts dz 2,583,505 3,762,225 8,060,063 12.5 15647/648-PT Mmf trousers dz 2,855,238 6,490,061 7,960,355 12.5 15847 Sbvf trousers dz - 15,714,461 17,647,255 12.5 16
Notes: Table reports the post-ATC safeguards imposed on Chinese imports for 2006-2008 by the U.S. Quantites are in native units. Source: OTEXA, authors' calculations.
Table 2: Chinese Quotas under Safeguards, 2006-2008

C����’� E����� � U���� ��� MFA/ATC 28
Argentina Dominican Republic Kenya Oman Sri LankaBahrain Egypt Korea, South *Pacific Islands TaiwanBangladesh El Salvador Kuwait Pakistan Thailand*Barbados Fiji Laos Panama *Trinidad TobagoBelarus Germany, East *Lebanon Peru TurkeyBrazil Guam Lesotho Philippines UAEBulgaria Guatemala Macau Poland UkraineBurma Haiti Macedonia *Portugal UruguayCambodia Honduras Malaysia Qatar USSR*Canada Hong Kong Maldive Islands Romania VietnamChina Hungary Mauritius Russia YugoslaviaColombia India Mexico SingaporeCosta Rica Indonesia Nepal Slovak RepublicCzech Republic Jamaica Nigeria South AfricaCzechoslovakia Japan Northern Mariana *Spain
Notes: Table displays the set of countries with which the United States negotiated quantitative restrictions on apparel and textile imports between 1984 and 2004. * denotes countries not subject to Specific Limits (see text). Source: U.S. MFA/ATC Database
Table 3: List of Countries in U.S. MFA/ATC Database

C����’� E����� � U���� ��� MFA/ATC 29
MFA Group Description Segment UnitsSquare Meter Conversion
218 Yarns of different colors (cotton &/or mmf) Yarn SQM 1219 Duck fabric (cotton &/or mmf) Yarn SQM 1606 Non-textured filament yarn (mmf) Yarn KG 20.1621 Impression fabric (mmf) Fabric KG 14.4628 Twills/sateens staple/filament fiber (mmf) Fabric SQM 1629 Other fabrics of staple/filament fiber (mmf) Fabric SQM 1348 W&G trousers, breeches & shorts (cotton) Apparel DOZ 14.9350 Robes, dressing gowns, etc. (cotton) Apparel DOZ 42.6431 Gloves and mittens (wool) Apparel DPR 1.8433 M&B suit-type coats (wool) Apparel DOZ 30.1836 Dresses (silk or non-cotton veg. fibers) Apparel DOZ 37.9362 Bedspreads & quilts (cotton) Made-ups NO 5.8464 Blankets (wool) Made-ups KG 2.4465 Floor coverings (wool) Made-ups SQM 1665 Floor coverings (mmf) Made-ups SQM 1
Notes: Examples of MFA groups, native units and the conversion factors to square meters. Source: U.S. MFA/ATC Database.
Table 4: Sample OTEXA Category Descriptions
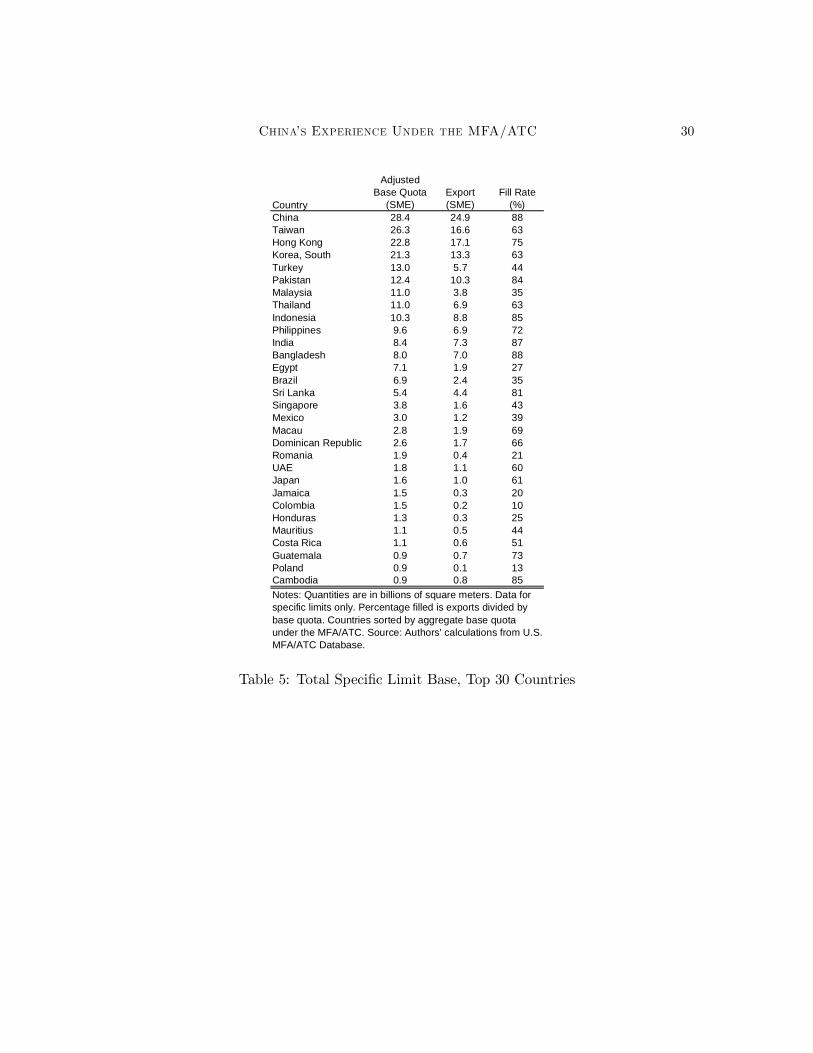
C����’� E����� � U���� ��� MFA/ATC 30
Country
Adjusted Base Quota
(SME)Export (SME)
Fill Rate (%)
China 28.4 24.9 88Taiwan 26.3 16.6 63Hong Kong 22.8 17.1 75Korea, South 21.3 13.3 63Turkey 13.0 5.7 44Pakistan 12.4 10.3 84Malaysia 11.0 3.8 35Thailand 11.0 6.9 63Indonesia 10.3 8.8 85Philippines 9.6 6.9 72India 8.4 7.3 87Bangladesh 8.0 7.0 88Egypt 7.1 1.9 27Brazil 6.9 2.4 35Sri Lanka 5.4 4.4 81Singapore 3.8 1.6 43Mexico 3.0 1.2 39Macau 2.8 1.9 69Dominican Republic 2.6 1.7 66Romania 1.9 0.4 21UAE 1.8 1.1 60Japan 1.6 1.0 61Jamaica 1.5 0.3 20Colombia 1.5 0.2 10Honduras 1.3 0.3 25Mauritius 1.1 0.5 44Costa Rica 1.1 0.6 51Guatemala 0.9 0.7 73Poland 0.9 0.1 13Cambodia 0.9 0.8 85
Notes: Quantities are in billions of square meters. Data for specific limits only. Percentage filled is exports divided by base quota. Countries sorted by aggregate base quota under the MFA/ATC. Source: Authors' calculations from U.S. MFA/ATC Database.
Table 5: Total Specific Limit Base, Top 30 Countries

C����’� E����� � U���� ��� MFA/ATC 31
CountryBinding Quotas -
Liberal Definition (%)Binding Quotas -
Default Definition (%)
Binding Quotas - Conservative Definition
(%)Bangladesh 89 81 75India 76 65 57China 72 64 55Indonesia 73 59 50Pakistan 67 57 47Guatemala 67 45 32Hong Kong 52 42 34Macau 52 41 32UAE 48 39 28Philippines 53 37 30Sri Lanka 50 36 27Thailand 51 36 25Cambodia 42 32 28Korea, South 42 30 19Taiwan 43 30 21Dominican Republic 50 29 17Malaysia 32 23 16Singapore 29 22 15Costa Rica 36 21 12Turkey 22 18 15Colombia 26 18 11Mauritius 18 14 11Brazil 16 12 8Romania 16 11 8Mexico 16 9 7Egypt 12 9 6Poland 14 8 5Japan 10 7 3Jamaica 5 2 1Honduras 0 0 0
Notes: Table reports the fraction of specific limits with fill rates that exceed 80, 90 and 95 percent, respectively. Authors' calculations from U.S. MFA/ATC Database.
Table 6: Top 30 Countries in Terms of Binding Quotas, 1984 to 2004

C����’� E����� � U���� ��� MFA/ATC 32
Country
Fraction of Specific
Limits (%)China 61Korea, South 53Taiwan 51Hong Kong 46Indonesia 42Thailand 41Malaysia 39Mexico 38Sri Lanka 38Romania 33Philippines 31Japan 31Pakistan 25Turkey 25India 22Macau 22Brazil 22Poland 22Singapore 21Uae 20Bangladesh 20Mauritius 18Cambodia 17Dominican Republic 16Jamaica 15Egypt 9Colombia 6Guatemala 4Costa Rica 4Honduras 4
Notes: The Table reports the fraction of OTEXA categories exported by the country that were subject to specific limits from 1990-2004. The table lists the thirty countries with the largest aggregate base quotas. Source: Authors' calculations from U.S. MFA/ATC Database.
Table 7: Fraction of Specific Limits, Top 30 Countries
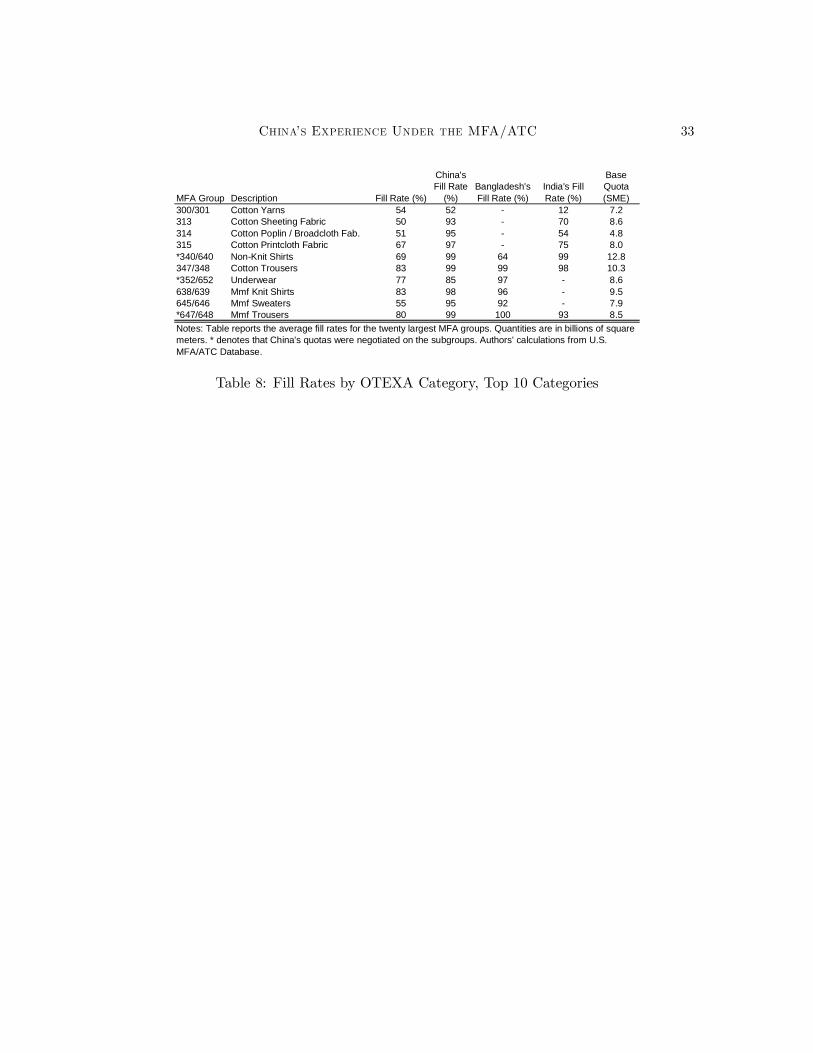
C����’� E����� � U���� ��� MFA/ATC 33
MFA Group Description Fill Rate (%)
China's Fill Rate
(%)Bangladesh's Fill Rate (%)
India's Fill Rate (%)
Base Quota (SME)
300/301 Cotton Yarns 54 52 - 12 7.2313 Cotton Sheeting Fabric 50 93 - 70 8.6314 Cotton Poplin / Broadcloth Fab. 51 95 - 54 4.8315 Cotton Printcloth Fabric 67 97 - 75 8.0*340/640 Non-Knit Shirts 69 99 64 99 12.8347/348 Cotton Trousers 83 99 99 98 10.3*352/652 Underwear 77 85 97 - 8.6638/639 Mmf Knit Shirts 83 98 96 - 9.5645/646 Mmf Sweaters 55 95 92 - 7.9*647/648 Mmf Trousers 80 99 100 93 8.5
Notes: Table reports the average fill rates for the twenty largest MFA groups. Quantities are in billions of square meters. * denotes that China's quotas were negotiated on the subgroups. Authors' calculations from U.S. MFA/ATC Database.
Table 8: Fill Rates by OTEXA Category, Top 10 Categories

C����’� E����� � U���� ��� MFA/ATC 34
Fill Rate 2.1 *** 1.4 ***0.2 0.2
Year FE
Category FE
R-squaredObservations
Yes
Log (ETE) Log (ETE)
Notes: The dependent variable is the log exporttax equivalent (see text). Column 2 includesOTEXA category fixed effects. Significance: * 10percent, ** 5 percent, *** 1 percent. Source:Chinese export license prices obtained fromwww.chinaquota.com.
Yes Yes
No
0.21417 417
0.80
Table 9: Export Tax Equivalents and Fill Rates

C����’� E����� � U���� ��� MFA/ATC 35
CountryFraction of Groups with Adjustments
Flexibility Adjustment Margin
Cambodia 99 15Guatemala 97 7Bangladesh 97 11Dominican Republic 95 8India 93 8Philippines 92 11China 92 5Indonesia 89 10Pakistan 88 8Sri Lanka 88 11UAE 84 6Macau 81 6Thailand 80 6Honduras 78 4Hong Kong 75 5Taiwan 71 5Korea, South 65 4Turkey 60 2Costa Rica 60 1Singapore 52 0Malaysia 50 0Colombia 45 0Romania 30 0Brazil 27 0Mauritius 25 0Mexico 25 0Egypt 16 0Poland 15 0Japan 7 0Jamaica 6 0
Notes: Column 1 reports the median flexibility adjustment margin between 1984-2004. Column 2 displays the fraction of MFA groups that were subject to at least one flexibility adjustment. The table lists the thirty countries with the largest aggregate base quotas. Source: Authors' calculations from U.S. MFA/ATC Database.
Table 10: Flexibility Use, 1984-2004

C����’� E����� � U���� ��� MFA/ATC 36
RegionAggregate
GrowthIntensive Margin
Extensive Margin
Aggregate Growth
Intensive Margin
Extensive Margin
Aggregate Growth
Intensive Margin
Extensive Margin
Aggregate Growth
Intensive Margin
Extensive Margin
China 9 16 -6 9 10 -1 306 288 17 271 269 2
Caribbean 47 23 24 0 0 -1 -12 -12 0 -1 1 -2
Central America 33 6 27 -10 -3 -7 6 10 -4 1 3 -2
East Asia -10 -10 0 24 24 0 57 22 36 -24 -25 0
European Union 2 3 -1 -3 -3 0 13 12 2 64 64 0
Former Soviet Union -50 -45 -5 -21 -22 1 -18 -18 0 -61 -51 -10
Middle East -34 -43 9 -1 -2 2 15 13 2 -12 -12 0
North Africa -46 -31 -15 23 23 0 -8 -27 19 -4 -4 0
North America 13 10 3 5 5 0 4 5 -1 -14 -13 -1
Oceania -42 12 -54 48 45 3 -15 -15 1 -52 -49 -3
Other Europe 102 -36 138 12 -6 18 21 -9 30 -30 -30 -1
South America -65 -58 -7 -51 -51 0 44 44 -1 -13 -12 -1
South Asia 33 33 0 18 18 0 5 3 2 20 19 0
Southeast Asia -47 8 -54 18 18 0 -13 -13 0 0 0 0
Sub-Saharan Africa -53 -42 -11 10 -25 34 69 60 9 -16 -15 -1
All Regions 3 2 1 3 3 0 31 27 4 14 14 0
All Regions (ex. China) 3 1 2 2 2 0 9 6 4 -2 -1 0
China (2002) 42 41 1 32 21 11
All Regions (2002) 8 19 -12 14 11 3
Notes: Decomposition table reports aggregate growth, decomposed into the extensive and intensive margins, by phase and region, in year of integration. In this table, the integration years for Phase I-IV are for 1995, 1998, 2002 and 2005, respectively. Extensive margin is defined as the net SME quantity growth in varieties that enter and exit in the year of integration. Intensive margin is defined as the net SME quantity growth in continuing varieties in the year of integration. Note that the aggregate growth values for Phase I and II differ from the previous table because this table reports values for 1995 and 1998, respectively. The bottom rows in each panel report Phase I and II export growth for China and all regions in 2002, the year that China was eligible for ATC liberalization. The sum of the intensive and extensive margin may not sum to aggregate growth due to rounding.
Phase I Phase II Phase III Phase IV
Table 11: Aggregate Growth Decomposition, by Phase and Region

C����’� E����� � U���� ��� MFA/ATC 37
CoefficientsIntegration Year (2002 for Phase I-III)
x China 0.41 *** 0.00 0.93 *** 2.26 *** 1.36 *** 1.81 *** 1.28 *** 1.73 ***0.11 0.00 0.11 0.24 0.14 0.18 0.07 0.08
x Caribbean 0.21 0.00 -0.16 -0.17 -0.38 -0.25 * -0.36 *** -0.30 ***0.33 0.00 0.27 0.17 0.58 0.14 0.05 0.06
x Central America -0.26 * 0.00 -0.13 -0.05 0.30 * 0.10 -0.19 -0.26 ***0.15 0.00 0.11 0.07 0.17 0.10 0.11 0.04
x East Asia 0.16 0.00 0.17 ** -0.68 *** 0.09 0.00 -0.22 *** -0.58 ***0.13 0.00 0.07 0.19 0.10 0.16 0.08 0.10
x European Union 0.01 0.00 -0.02 -0.12 -0.01 0.05 -0.15 *** -0.20 ***0.05 0.00 0.04 0.16 0.04 0.08 0.02 0.04
x Former Soviet Union 0.09 0.00 0.28 -0.07 -0.49 *** -0.22 -0.92 *** -1.14 **0.43 0.00 0.24 0.22 0.11 0.45 0.30 0.56
x Middle East -0.07 0.00 0.08 0.11 0.11 -0.22 -0.32 *** -0.42 ***0.25 0.00 0.15 0.24 0.20 0.14 0.09 0.16
x North Africa 0.35 0.00 0.33 *** 0.31 -0.17 *** -0.25 0.01 -0.090.28 0.00 0.01 0.26 0.04 0.50 0.03 0.08
x North America 0.01 0.00 0.05 -0.19 -0.11 *** -0.07 *** -0.29 ** -0.20 **0.04 0.00 0.07 0.16 0.02 0.00 0.12 0.09
x Oceania -0.26 ** 0.00 -0.17 *** -0.55 *** -0.13 0.03 -0.19 *** -0.26 ***0.10 0.00 0.06 0.06 0.25 0.29 0.05 0.09
x Other Europe 0.06 0.00 -0.12 *** 1.72 ** -0.11 0.14 -0.02 -0.040.06 0.00 0.03 0.71 0.10 0.12 0.10 0.15
x South America -0.15 0.00 0.03 0.33 * 0.21 0.29 -0.14 -0.110.15 0.00 0.17 0.18 0.14 0.25 0.10 0.08
x South Asia 0.31 *** 0.00 0.36 *** -0.07 0.22 * 0.34 0.09 -0.080.10 0.00 0.12 0.21 0.12 0.37 0.11 0.09
x Southeast Asia 0.34 0.00 0.23 0.20 0.26 0.06 -0.04 -0.110.26 0.00 0.14 0.28 0.22 0.28 0.07 0.09
x Sub-Saharan Africa -0.10 0.00 0.02 0.16 ** 0.38 * -0.26 -0.31 ** -0.50 ***0.14 0.00 0.18 0.08 0.20 0.40 0.14 0.12
Observations 41,100 88,818 97,482 431,069
Unbound Bound
Notes: Table regresses change in the (log of) country-product quantity on year-region-Unbound versus Bound interactions. Each column reports theresult of a regression encompassing all the products whose quotas were relaxed in the noted phase. Phase I-III report year-region fixed effects foryear 2002, the year China entered the WTO, and Phase IV reports fixed effects for 2005. Bound refer to the HS codes in which China had greaterthan a 90 percent fill rate in the previous year. Standard errors clustered by exporting country. Significance: * 10 percent, ** 5 percent, *** 1 percent.
Unbound Bound Unbound Bound Unbound Bound∆ Ln (SME) ∆ Ln (SME) ∆ Ln (SME) ∆ Ln (SME)
Phase I Phase II Phase III Phase IV
Table 12: ATC Phase-outs: Export Quantities and Binding Quotas

C����’� E����� � U���� ��� MFA/ATC 38
Kuwait (-2.89) Taiwan (-0.55) UAE (-0.26) Mozambique (0.05)Russia (-2.81) Swaziland (-0.54) Ukraine (-0.25) Malawi (0.05)Maldives (-2.35) Sweden (-0.52) El Salvador (-0.23) Slovakia (0.06)Micronesia (-2.14) Ghana (-0.51) Guatemala (-0.23) Trinidad and Tobago (0.09)
Georgia (-1.99) Mali (-0.48) Gambia (-0.23) Iceland (0.09)Guinea (-1.85) Bahrain (-0.48) Turkey (-0.23) Vietnam (0.09)Oman (-1.82) Mauritius (-0.47) Czech Republic (-0.21) Chile (0.11)
Suriname (-1.38) Slovenia (-0.46) Lebanon (-0.21) Germany (0.12)Cyprus (-1.35) Poland (-0.45) Nicaragua (-0.21) Cambodia (0.12)Albania (-1.25) Venezuela (-0.45) Colombia (-0.20) Indonesia (0.13)Kyrgyzstan (-1.24) Argentina (-0.45) Ecuador (-0.18) Bangladesh (0.15)
Kazakhstan (-1.21) Hungary (-0.44) Brunei (-0.17) Switzerland (0.16)Azerbaijan (-1.13) Barbados (-0.40) Australia (-0.15) Armenia (0.16)
Tajikistan (-1.09) Belarus (-0.39) Brazil (-0.15) Uzbekistan (0.18)Macedonia (Skopje) (-1.00) Malaysia (-0.39) Belgium (-0.15) Cook Islands (0.18)South Africa (-0.98) Honduras (-0.37) Ireland (-0.14) Bolivia (0.22)Ivory Coast (-0.91) Costa Rica (-0.36) United Kingdom (-0.14) Jordan (0.24)Ethiopia (-0.91) Romania (-0.35) Italy (-0.13) Peru (0.24)Syria (-0.90) Finland (-0.35) Spain (-0.13) Panama (0.25)Moldova (-0.87) Greece (-0.35) Japan (-0.12) Botswana (0.26)Korea, South (-0.85) Guyana (-0.34) Namibia (-0.11) Uganda (0.30)Mongolia (-0.84) Dominican Republic (-0.34) Uruguay (-0.10) Saudi Arabia (0.32)Nepal (-0.77) Haiti (-0.34) Portugal (-0.10) Nigeria (0.48)Israel (-0.72) Fiji (-0.33) Croatia (-0.10) Qatar (0.51)Singapore (-0.69) Latvia (-0.32) Estonia (-0.07) Bosnia-Hercegovina (0.63)
Zambia (-0.69) Sri Lanka (-0.31) Mexico (-0.07) Senegal (0.67)Bermuda (-0.69) Canada (-0.31) Paraguay (-0.04) British Virgin Islands (0.69)
Sierra Leone (-0.68) Austria (-0.31) Turkmenistan (-0.04) San Marino (0.75)Jamaica (-0.65) New Zealand (-0.31) Kenya (-0.02) Malta (0.90)Cape Verde (-0.62) Zimbabwe (-0.30) Morocco (-0.02) Bahamas (1.35)Hong Kong (-0.62) France (-0.30) Tanzania (0.01) Netherlands Antilles (1.60)
Belize (-0.61) Egypt (-0.29) Lithuania (0.02) Laos (1.88)Denmark (-0.59) Norway (-0.28) Tunisia (0.02) Somalia (1.94)Madagascar (-0.57) Philippines (-0.28) Pakistan (0.02) Tokelau (2.05)Lesotho (-0.57) Bulgaria (-0.27) India (0.03) Mauritania (3.43)Macao (-0.55) Thailand (-0.26) Netherlands (0.05)
Notes: Table regresses change in the (log of) country-product quantity on country-year fixed effects on the set of China's Phase IV products that were subject to binding quotas in 2004. The 2005 coefficients for each country are reported in parantheses. Bold denotes that export response is statistically significant at the 10 percent confidence level (robust standard errors).
Table 13: “Winners and Losers”

C����’� E����� � U���� ��� MFA/ATC 39
CoefficientsIntegration Year
x China -0.17 -0.07 0.11 -0.54 *** -0.66 *** -0.37 *** -0.53 ***0.10 0.05 0.14 0.06 0.09 0.02 0.03
x Caribbean -0.08 -0.10 -0.17 * -0.020.24 0.08 0.10 0.03
x Central America -0.13 -0.01 -0.03 -0.03 -0.030.18 0.06 0.06 0.02 0.49
x East Asia 0.07 -0.08 ** -0.17 *** -0.14 -0.01 -0.15 **0.06 0.03 0.03 0.14 0.01 0.06
x European Union 0.00 -0.01 -0.01 0.01 * 0.050.04 0.02 0.02 0.01 0.13
x Former Soviet Union 0.03 -0.11 0.13 -0.09 0.16 *** 0.030.47 0.12 0.09 0.39 0.03 0.18
x Middle East 0.00 0.05 -0.04 -0.15 0.02 0.020.21 0.06 0.05 0.33 0.02 0.16
x North Africa 0.31 0.06 0.10 0.030.30 0.09 0.08 0.03
x North America 0.01 0.05 0.00 0.03 *0.08 0.04 0.04 0.02
x Oceania 0.10 -0.08 0.01 0.030.18 0.08 0.08 0.03
x Other Europe 0.04 -0.01 -0.13 ** 0.01 0.160.12 0.07 0.06 0.02 0.70
x South America 0.39 ** -0.07 -0.06 0.04 ** -0.170.15 0.06 0.05 0.02 0.35
x South Asia 0.12 -0.02 -0.10 -0.15 *** -0.49 * -0.07 *** -0.20 **0.09 0.04 0.86 0.04 0.27 0.01 0.08
x Southeast Asia 0.26 ** -0.13 *** -0.13 *** 0.12 -0.04 *** -0.14 *0.10 0.04 0.03 0.39 0.01 0.07
x Sub-Saharan Africa 0.18 -0.16 -0.19 ** 0.07 ***0.21 0.10 0.08 0.02
Year 2002 x China -0.14 * -0.38 *** -0.81 ***0.08 0.05 0.13
Observations 41,100 88,818 97,482 431,069
Unbound Bound
Notes: Table regresses change in the (log of) country-product unit value on year-region-unbound versus bound interactions. Each columnreports the result of a regression encompassing all the products whose quotas were relaxed in the noted phase. Phase I, II and III report year-region fixed effects for year 1995, 1998 and 2002, respectively. The bottom panel reports 2002 fixed effects for Phases I and II for China.Phase IV reports fixed effects for 2005. Bound refers to the HS codes in which countries had greater than a 90 percent fill rate in the previousyear. Robust standard errors are reported. Significance: * 10 percent, ** 5 percent, *** 1 percent.
Unbound Bound Unbound Bound Unbound Bound
∆ Ln (Price) ∆ Ln (Price) ∆ Ln (Price) ∆ Ln (Price)Phase I Phase II Phase III Phase IV
Table 14: ATC Phase-outs: Unit Values and Binding Quotas
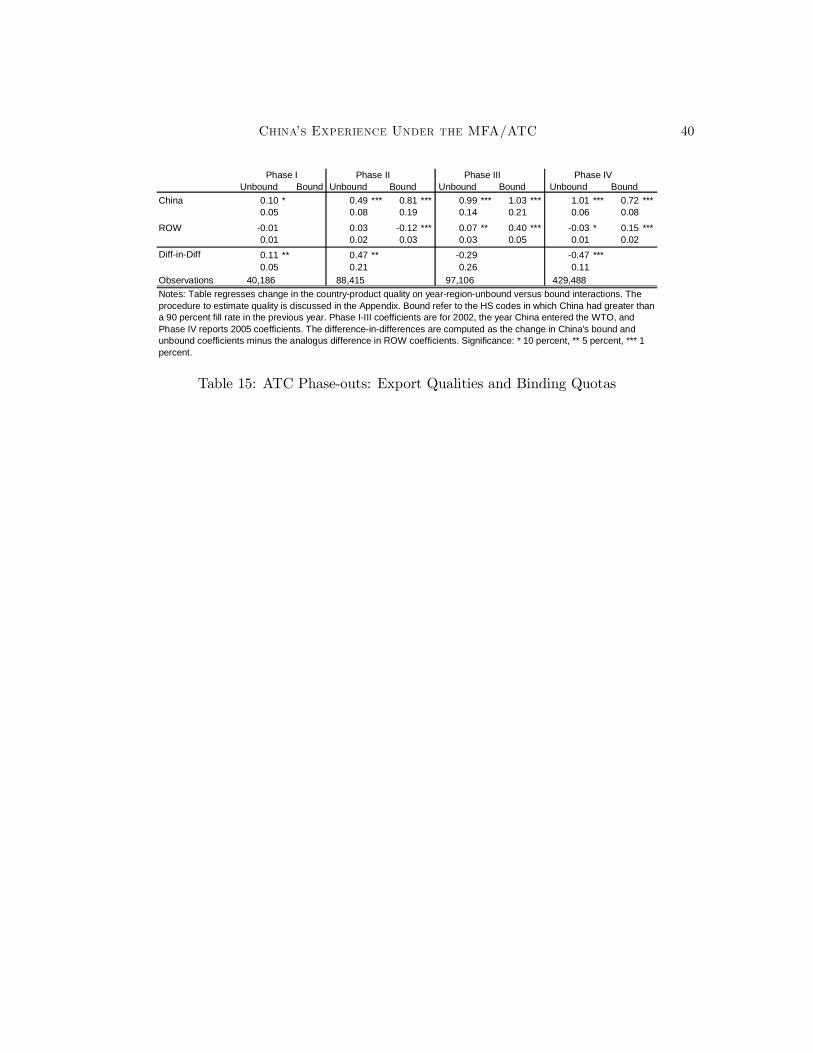
C����’� E����� � U���� ��� MFA/ATC 40
Unbound Bound Unbound Bound Unbound Bound Unbound Bound
China 0.10 * 0.49 *** 0.81 *** 0.99 *** 1.03 *** 1.01 *** 0.72 ***0.05 0.08 0.19 0.14 0.21 0.06 0.08
ROW -0.01 0.03 -0.12 *** 0.07 ** 0.40 *** -0.03 * 0.15 ***0.01 0.02 0.03 0.03 0.05 0.01 0.02
Diff-in-Diff 0.11 ** 0.47 ** -0.29 -0.47 ***0.05 0.21 0.26 0.11
Observations 40,186 88,415 97,106 429,488
Phase IV
Notes: Table regresses change in the country-product quality on year-region-unbound versus bound interactions. The procedure to estimate quality is discussed in the Appendix. Bound refer to the HS codes in which China had greater than a 90 percent fill rate in the previous year. Phase I-III coefficients are for 2002, the year China entered the WTO, and Phase IV reports 2005 coefficients. The difference-in-differences are computed as the change in China's bound and unbound coefficients minus the analogus difference in ROW coefficients. Significance: * 10 percent, ** 5 percent, *** 1 percent.
Phase I Phase II Phase III
Table 15: ATC Phase-outs: Export Qualities and Binding Quotas
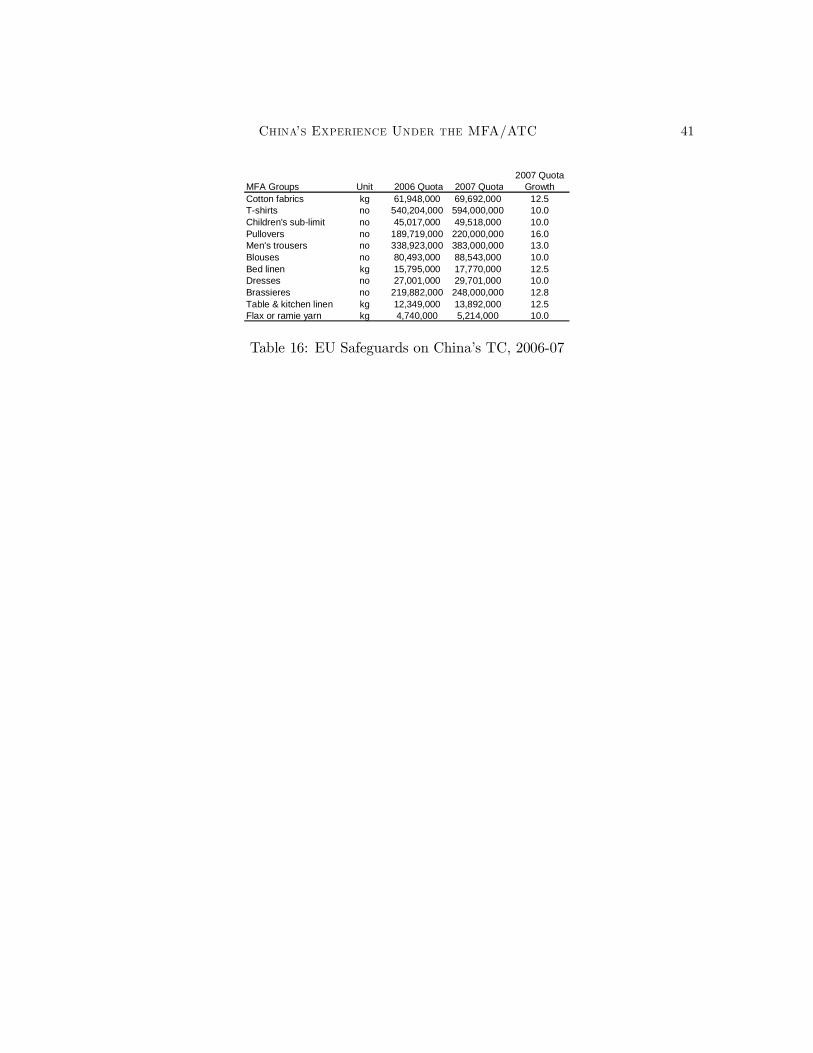
C����’� E����� � U���� ��� MFA/ATC 41
MFA Groups Unit 2006 Quota 2007 Quota2007 Quota
GrowthCotton fabrics kg 61,948,000 69,692,000 12.5T-shirts no 540,204,000 594,000,000 10.0Children's sub-limit no 45,017,000 49,518,000 10.0Pullovers no 189,719,000 220,000,000 16.0Men's trousers no 338,923,000 383,000,000 13.0Blouses no 80,493,000 88,543,000 10.0Bed linen kg 15,795,000 17,770,000 12.5Dresses no 27,001,000 29,701,000 10.0Brassieres no 219,882,000 248,000,000 12.8Table & kitchen linen kg 12,349,000 13,892,000 12.5Flax or ramie yarn kg 4,740,000 5,214,000 10.0
Table 16: EU Safeguards on China’s TC, 2006-07

C����’� E����� � U���� ��� MFA/ATC 42
18
20
22
16
18
20
22
18
20
22
24
20
22
24
199
0
199
5
2000
200
5
199
0
199
5
200
0
200
5
199
0
199
5
200
0
200
5
199
0
19
95
200
0
200
5
Phase I Phase II
Phase III Phase IV
All Products Bound Products
Log
SM
E
Bound products are those with >90% fi ll rates one year pr ior to in tegration.
By ATC PhaseChina's T&C Exports to the United States
Figure 1: China’s T&C Exports, by Phase
0.2
.4.6
0.2
.4.6
0.2
.4.6
0 .5 1 0 .5 1 0 .5 1 0 .5 1
Ch ina -19 85
Ch ina -19 95
Ch ina -20 04
E/ SE . Asia -19 85
E/ SE . Asia -19 95
E. /SE. Asi a-2004
S. Asi a-1985
S. Asi a-1995
S. Asi a-2004
ROW-1985
ROW-1995
ROW-2004
Fra
ctio
n
Fill RateGraphs by Regi on-Year
Distribution of Fill Rates
Figure 2: Fill Rates by Region, 1984-2004

C����’� E����� � U���� ��� MFA/ATC 43
0.0
5.1
Bas
e G
row
th R
ates
1990
1995
2000
2004
China E./SE. Asia
S. Asia ROW
Median Base Growth Rate
Figure 3: Median Base Growth Rate by Region, 1990-2004
02
04
06
0B
illio
n S
ME
1990
1995
2000
2005
China Exports ROW ExportsU.S. Production
Total Quantities, by year
Figure 4: T&C Quantities, by Region

C����’� E����� � U���� ��� MFA/ATC 44
22
.20
23
.95
20
.70
20
.88
21.7
521
.94
22.
75
22.
88
21
.89
22
.13
18
.83
19
.95
21.4
821
.69
19.
46
19.
63
22
.94
23
.15
17
.87
18
.88
18.1
218
.38
20.
22
21.
03
22
.48
22
.93
22
.29
22
.58
19.3
920
.11
20
00
20
05
20
00
20
05
20
00
20
05
200
0
200
5
China Caribbean Central America East Asia
European Union Former Soviet Union Middle East North Africa
North America Oceania Other Europe South America
South Asia Southeast Asia Sub-Saharan Africa
Log
SM
E
Graphs by region
Exports to the U.S., 2000-2006
Figure 5: Exports to the U.S., 2000-2006, by Region