china yangtze power co., ltd. 2020 annual report
TRANSCRIPT

2020 Annual Report
1 / 259
Stock Code: 600900 Abbre.: CYPC
China Yangtze Power Co., Ltd.
2020 Annual Report

2020 Annual Report
2 / 259
Important Note
I. Focus For the purposes of the United Kingdom's Financial Conduct Authority's Transparency
Rule 4.1.12(3), each director (whose names and functions are listed on page 58), to the best of
his or her knowledge, confirms that:
• the financial statements, prepared in accordance with the applicable set of accounting standards, give
a true and fair view of the assets, liabilities, financial position and profit or loss of the company and
the undertakings included in the consolidation taken as a whole; and
• the management report (being this annual report, excluding the financial statements referred to above
(on pages 85 to 106) and the independent auditor's report thereon (on pages 107 to 262)) includes a
fair review of the development and performance of the business and the position of the company and
the undertakings included in the consolidation taken as a whole, together with a description of the
principal risks and uncertainties that they face."
II. Absent Directors
Position of Absent
Director Name of Absent Director Reason for Absence Proxy’s Name
Director HE Hongxin Other business
engagement
MA Zhenbo
Director ZONG Renhuai Other business
engagement
ZHAO Qiang
Director ZHAO Yan Other business
engagement
ZHOU Chuangen
III. ShineWing Certified Public Accountants LLP issued a standard Auditor’s Report without
qualified opinion for the Company.
IV. LEI Mingshan, the Company’s principal, ZHAN Pingyuan, the accounting principal, and
ZHANG Na, the accounting function’s principal (the person in charge of the accounting
function) undertake that: the financial report in this Annual Report is truthful, accurate and
complete.
V. Proposal for Profit Distribution or Proposal for Converting Capital Reserve into Share Capital
for the Reporting Period as Adopted by the Board
It is proposed that on the basis of total share capital of 22,741,859,230 shares as at the end of 2020,
cash dividents be distributed at RMB7.0 for every 10 shares, equivalent to cash dividents of
2020 Annual Report
3 / 259
RMB15,919,301,461.00 in total, and no capital reserve be converted into share capital for 2020. This
proposal will be submitted to the 2020 AGM for approval.
VI. Forward-looking Risk Statements
Applicable
Forward-looking statements such as future plans and development strategies mentioned in this Report
do not constitute the Company's substantive undertakings to investors. Investors should be aware of
investment risks.
VII. Any Funds Occupied by the Controlling Shareholder or its Related Parties for Non-operating
Purpose?
None
VIII. Any Guarantee Provided for Any Third Party in Violation of Required Decision Making
Procedures?
None
IX. Whether over 50% of the directors cannot guarantee the truthfulness, accuracy and
completeness of the Annual Report disclosed by the Company?
No
X. Material Risk Disclosure
The Company has provided specific description of potential risks in the Report. For details, please
refer to “Section 4 Operating Results Discussion and Analysis” – “III. Discussion and Analysis of Future
Development of the Company”.

2020 Annual Report
4 / 259
Contents
Section 1 Interpretations ..................................................................................................................... 5
Section 2 Company Profile and Financial Summary .......................................................................... 5
Section 3 Business Review ............................................................................................................... 10
Section 4 Operating Results Discussion and Analysis ...................................................................... 12
Section 5 Key Matters ....................................................................................................................... 31
Section 6 Changes in Ordinary Shares and Shareholders ................................................................. 51
Section 7 Particulars of Directors, Supervisors, Senior Management and Employees ..................... 58
Section 8 Corporate Governance....................................................................................................... 71
Section 9 Information on Corporate Bonds ....................................................................................... 75
Section 10 Financial Report ................................................................................................................ 79
Section 11 Document Available for Inspection ................................................................................. 259

2020 Annual Report
5 / 259
Section 1 Interpretations
I. Interpretations
For the purpose of this Report, unless the context otherwise requires, the following terms have the
following meanings:
Glossary of Terms
SASAC means State-owned Assets Supervision and Administration
Commission of the State Council
CSRC means China Securities Regulatory Commission
CTG means China Three Gorges Corporation
Comanpy, the Company, CYPC means China Yangtze Power Co., Ltd.
TG Finance means Three Gorges Finance Co., Ltd.
TG Capital means Three Gorges Capital Holding Co., Ltd.
TG Development means Yangtze Three Gorges Technology & Economy
Development Co., Ltd.
Chuanyun means Three Gorges Jinshajiang Chuanyun Hydraulic Power
Development Co., Ltd.
YP Capital means Yangtze Power Capital Holding Co., Ltd.
YP International means China Yangtze Power International (Hong Kong) Ltd.
Three Gorges Power means Three Gorges Power Co., Ltd.
Peru Companies means
100% equity in Andes Bermuda Ltd. (“AB Company”,
formerly known as “Sempra Americas Bermuda Ltd.”) and
around 50.00000069% equity in Peruvian Opportunity
Company S.A.C. (“POC Company”), with the remaining
49.99999931% equity in POC Company held by AB
Company.
Luz del means Luz del Sur S.A.A
YP Andes means Yangtze Power Andes Investment Co., Ltd.
GDR means Global Depository Receipts
Section 2 Company Profile and Financial Summary
I. Corporate Information
Chinese Name of the Company 中国长江电力股份有限公司
Abbreviation of Chinese Name of the
Company 长江电力
English Name of the Company China Yangtze Power Co., Ltd.
Abbreviation of English Name of the
Company
CYPC
Legal Representative of the Company LEI Mingshan
II. Contacts and Contact Information
Secretary to the Board Representative for Securities Affairs
Name LI Shaoping YUAN Haiying
Contact address 22/F, Tower B, Focus Plaza, 19
Financial Street, Xicheng District,
Beijing
22/F, Tower B, Focus Plaza, 19
Financial Street, Xicheng District,
Beijing
Tel 010-58688900 010-58688900
Fax 010-58688898 010-58688898

2020 Annual Report
6 / 259
III. Basic Information
Registered address of the Company Tower B, No. 1, Yuyuantan South Road, Haidian District,
Beijing
Postal code for registered address of the
Company
100038
Domestic office of the Company Tower B, Focus Plaza, 19 Financial Street, Xicheng
District, Beijing
Postal code for domestic office of the
Company
100033
Website of the Company http://www.cypc.com.cn
E-mail [email protected]
IV. Information Disclosure and Place at Which the Report is Available
The Company’s designated press media for
information disclosure
China Securities Journal, Shanghai Securities News,
Securities Times, and China Three Gorges Project
News
CSRC designated website for Annual Report http://www.sse.com.cn, http://www.cypc.com.cn
Annual Report available at Room 2215, Tower B, Focus Plaza ,19 Financial Street,
Xicheng District, Beijing
V. Stock Profile/GDR Profit
Stock Profile/GDR Profile
Share/GDR Class Listed on Stock Abbreviation Stock Code
A Share SSE 长江电力 600900
GDR LSE China Yangtze Power
Co., Ltd. CYPC
VI. Other Relevant Information
Auditor (Domestic)
Name ShineWine Certified Public Accountants LLP
Office address 9/F, Tower A, Fu Hua Mansion, No.8,
Chaoyangmen North Street, Dongcheng
District, Beijing
Names of
accountants who
signed the report
ZHAN Jun and QIU Xin
VII. Key Accounting Figures and Financial Indicators for Recent Three Years
(I). Key Accounting Figures
Unit: RMB Yuan
Key Accounting
Figures 2020 2019
Year-on-
year
Change (%)
2018
Revenue 57,783,367,039.83 49,874,086,874.95 15.86 51,213,965,746.52
Net profit attributable
to shareholders of the
listed company
26,297,890,222.70 21,543,493,635.57 22.07 22,610,936,420.39
Net profit attributable to shareholders of the
listed company net of
26,175,647,473.85 21,130,274,030.69 23.88 22,054,549,240.76

2020 Annual Report
7 / 259
non-recurring gain or
loss
Net cash flow from
operating activities
41,036,864,400.40 36,464,419,570.28 12.54 39,736,666,414.81
As at 31 Dec 2020 As at 31 Dec 2019
Year-on-
year
Change (%)
As at 31 Dec 2018
Net assets attributable
to shareholders of the
listed company
172,118,146,991.60 149,510,174,624.05 15.12 142,203,409,150.12
Total assets 330,827,096,559.03 296,482,881,040.89 11.58 295,496,988,645.53
(II). Key Financial Indicators
Key Financial Indicators 2020 2019 Year-on-year
Change (%) 2018
Basic earnings per share
(RMB/share)
1.1853 0.9792 21.05 1.0278
Diluted earnings per share
(RMB/share)
1.1853 0.9792 21.05 1.0278
Basic earnings per share net of
non-recurring gain or loss
(RMB/share)
1.1798 0.9605 22.84 1.0025
Weighted average ROE (%) 16.71 14.77
+ 1.94 percentage
points 16.31
Weighted average ROE net of
non-recurring gain or loss (%) 16.63 14.49
+ 2.14 percentage
points 15.91
Explanation of key accounting figures and financial indicators of the Company for the three years ended
31 December 2010.
Non-applicable
VIII. Differences in Accounting Figures under PRC Accounting Standards and under International
Accounting Standards
(I) Differences in net profit and in net assets attributable to shareholders of the listed company in
financial reports disclosed under International Accounting Standards and under PRC
Accounting Standards
Non-applicable
(II) Differences in net profit and in net assets attributable to shareholders of the listed company in
financial reports disclosed under overseas accounting standards and under China Accounting
Standards
Non-applicable
(III) Explanation of differences between PRC Accounting Standards and International Accounting
Standards:
Non-applicable
IX. Key Financial Figures by Quarter for 2020
Unit: RMB Yuan
Q1
(Jan-Mar)
Q2
(Apr-Jun)
Q3
(Jul-Sep)
Q4
(Oct-Dec)
Revenue 8,384,404,815.01 11,528,142,497.04 22,947,297,238.16 14,923,522,489.62
2020 Annual Report
8 / 259
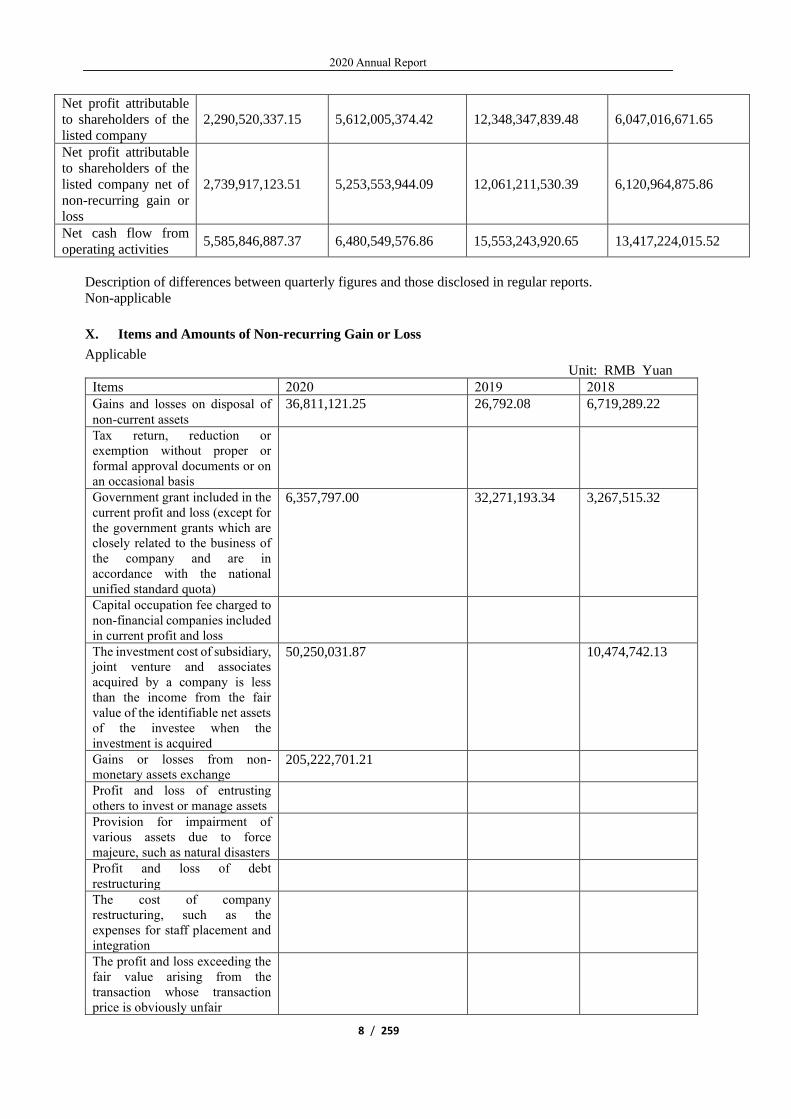
Net profit attributable
to shareholders of the
listed company
2,290,520,337.15 5,612,005,374.42 12,348,347,839.48 6,047,016,671.65
Net profit attributable
to shareholders of the
listed company net of
non-recurring gain or
loss
2,739,917,123.51 5,253,553,944.09 12,061,211,530.39 6,120,964,875.86
Net cash flow from
operating activities 5,585,846,887.37 6,480,549,576.86 15,553,243,920.65 13,417,224,015.52
Description of differences between quarterly figures and those disclosed in regular reports.
Non-applicable
X. Items and Amounts of Non-recurring Gain or Loss
Applicable
Unit: RMB Yuan
Items 2020 2019 2018
Gains and losses on disposal of
non-current assets 36,811,121.25 26,792.08 6,719,289.22
Tax return, reduction or
exemption without proper or
formal approval documents or on
an occasional basis
Government grant included in the
current profit and loss (except for
the government grants which are
closely related to the business of
the company and are in
accordance with the national
unified standard quota)
6,357,797.00 32,271,193.34 3,267,515.32
Capital occupation fee charged to
non-financial companies included
in current profit and loss
The investment cost of subsidiary,
joint venture and associates
acquired by a company is less
than the income from the fair
value of the identifiable net assets
of the investee when the
investment is acquired
50,250,031.87 10,474,742.13
Gains or losses from non-
monetary assets exchange 205,222,701.21
Profit and loss of entrusting
others to invest or manage assets
Provision for impairment of
various assets due to force
majeure, such as natural disasters
Profit and loss of debt
restructuring
The cost of company
restructuring, such as the
expenses for staff placement and
integration
The profit and loss exceeding the
fair value arising from the
transaction whose transaction
price is obviously unfair

2020 Annual Report
9 / 259
Current net profit and loss of
subsidiaries from the beginning
of the period to the date of
business combination under the
common control
Profits and losses arising from
contingencies unrelated to the
normal operation of the company
In addition to the effective
hedging business related to the
company's normal business
operations, the profit and loss of
fair value changes arising from
the holding of trading financial
assets, derivative financial assets,
trading financial liabilities,
derivative financial liabilities,
and investment income obtained
from the disposal of trading
financial assets, derivative
financial assets, trading financial
liabilities, derivative financial
liabilities and other debt
investment
-55,598,675.12 461,825,906.25 800,015,479.62
Reversal of provision for
impairment of receivables tested
individually
1,027,147.83
Profit and loss from external
entrusted loans
Profit and loss from changes in
fair value of investment
properties measured by fair value
model
The impact of one-off adjustment
on the current profit and loss
according to the requirements of
tax, accounting and other laws
and regulations
Custody fee income from
entrusted operation
Other non-operating income and
expenses except the above items -200,395,826.32 -50,219,231.62 -108,221,391.30
Other profit and loss items
conforming to the definition of
non-recurring profit and loss
15,678,172.60 66,991,950.45 15,998,784.43
The impact on non-controlling
interests -24,122,775.82 -13,414.08 83,201.53
The impact of income tax 88,040,202.18 -97,663,591.54 -172,977,589.15
Total 122,242,748.85 413,219,604.88 556,387,179.63
XI. Items Measured at Fair Value
Applicable
Unit: RMB Yuan
Item Opening Balance Ending Balance Change in the
Period
Impact on Profit
for the Year
Other equity instrument
investments 4,432,380,427.04 3,609,195,163.56 -794,969,953.03 226,231,419.93

2020 Annual Report
10 / 259
Other non-current
financial assets 5,812,035,941.91 4,713,666,463.26 -279,505,793.86 71,189,689.12
Financial liabilities held
for trading 768,403,141.10 640,897,029.23 106,618,735.65 106,618,735.65
Total 11,012,819,510.05 8,963,758,656.05 -967,857,011.24 404,039,844.70
XII. Other Information
Non-applicable
Section 3 Business Review
I. Description of Principal Business and Operation Modes of the Company and Industry
Overview for the Reporting Period
The Company is a public power company with largest market value on China’s A-share market, it is
also the world’s largest public hydraulic power company. The Company mainly engages in large-scale
hydraulic power operations. Hydraulic power is featuring with zero-pollution, technology-matured and
strong capability of peak load regulation. The CO2 “Zero-Emission” performance of it will play an
important role in the Chinese strategy of “Carbon Emission Peak” and “Carbon Neutrality”.
The Company operates in a spirit of “Achieving Best of the Best” and an attitude of “Responsiveness”,
which is reflected in its management and operation of the 5 mega hydropower stations, namely the Three
Gorges, Gezhouba, Xiluodu, Xiangjiaba, Wudongde hydropower stations. The installed gross capacity of
the Company reaches 45,595 MW (exclusive of the managed Wudongde hydropower station), where
domestic installed capacity of hydraulic power reaching 45,495 MW, taking up 12.32% of that of the
national total.
Either the proven reserves of water power or the exploitable water resources in China are the largest around
the world. The Company is doing what it should to enhance its own industrial layout, continuously forging
a strong hydropower business. In 2020, the Company keeps strengthening its shareholding and joint
scheduling relationships with those hydropower entities in the mid and upper stream of the Yangtze river,
in that the integration of four networks s in Chongqing region are smoothly completed; the largest power
company in Peru - Luz del is merged by the Company and done with the equity transfer; GDR is issued
successfully on London Stock Exchange and goes public; relevant businesses are expanding. All these
establish a firm foundation for the Company to extend and develop its industrial chain.
II. Material Changes in Major Assets of the Company during the Reporting Period
Applicable
The Company acquire Luz del Sur S.A.A and its assets via YP Andes, a company set up in Hong
Kong by YP International, a wholly-owned subsidiary of the Company and the share transfer was
completed on 24 April 2020. The core asset of this acquisition is the 83.64% equity interests in Luz del.
By the end of 2020, the oversea assets of the company reached RMB44.554 billion, taking up 13.47%
of its total assets.
III. Analysis of the core competiveness during the report period
Applicable
(1) Cascade joint scheduling capability within Yangtze Basin
We vigorously promote the expertise establishment in basin-oriented, market-oriented, decision-wise
and management-innovative scheduling, and continuously increase the scientific scheduling level of
cascade hub. Further expand information share platform and the rain intelligence network coverage,
maintaining a high level of water forecast accuracy. In 2020, the 24-hour water forecast accuracy for the
cascade station in the basin reached 98%.
Closely embracing the national strategy, the Company leverages its cascade hub within the Yangtze
basin to realize various social benefits in flood-prevention, power generation, shipping, water supplement and ecology preservation, proactively serves the construction of the Yangtze River Economical Zone,
guaranteeing the supply of clean energy for the operation of national economy. In 2020, the Company

2020 Annual Report
11 / 259
founded the Hubei Key Lab of Smart Yangtze and Hydropower Science, with an aim to keep promoting
the construction of the innovative platform for water resource scientific survey within the basin and
relevant key technologies research, fulfilling scientifically the 5 reservoirs joint scheduling, and thus
leveraging the cascade hub benefits to a full extend; Xiluodu-Xiangjiaba-Three Gorges Joint Ecological
Operations Trial was conducted, taking full advantage of the scheduling to create conditions suitable for
fish spawning and reproduction; the annual total volume of water supplement to the downstream from the
cascade reservoir is 31.183 billion cubic meters, meeting the downstream water demand of livings and
productions.
(2) Large-scale Hydropower Station Operation and Management Expertise
Scientific organization of power generation ensures lean and efficient power station operation. The
Company operates and manages 5 mega hydropower stations, with a total of 66 sets of 700 MW giant
hydro-generators, taking up 56.4% of that in the whole world. Guided by the principle of "lean and
efficient, scientific division of labor, state-of-art and reasonable", backing up by high-quality talents and
advanced technologies and equipment as well as excellent management concept, the power generations
are scientifically organized with supreme economic and technical indicators and outstanding operation
efficiency.
By mastering the running law of the generators, we gets the world's leading reliability of the
equipment. After years of power production and management practice, the Company has obtained the safe
and stable running law of the cascade giant power stations within Yangtze basin for multiple conditions,
improving the control capability of the power station's "large load, long period, uninterrupted" operation,
assuring that the equipment are under controllable and controlled status 7-24. In 2020, the average
equivalent availability factor of the cascade generators reached 94.26%, with the equipment key indicators
maintained at an industrial leading level.
(3) Overhaul and maintenance capacity of mega hydropower stations
A leading basin maintenance mode in the industry was established through the optimization of
maintenance management system. The Company has the largest maintenance team specialized for
hydropower complex in China, and has grasped the core maintenance technologies of 700,000-kilowatt
giant units. The Company built an expert decision-making support system with the technical committee
as the core to promote the application of advanced technologies in production. The maintenance
management system of cascade hydropower stations in the basin has been formed with the principle of
"mastering core technologies, being lean, efficient and motorized, coordination and cooperation",
safeguarding the long-term safe operation of cascade hydropower stations in the basin.
With the use of cutting-edge management and technical means, the core maintenance capabilities
have been continuously improved. According to the big data concept of hydropower station operation, the
Company established a remote diagnosis and analysis platform for cascade hydropower station equipment
in the basin, allowing for the implementation of lean maintenance strategies based on diagnosis and
evaluation. The Company developed a decision-making support system for maintenance in the basin to
give great impetus to the transformation of maintenance towards digitalization; Focusing on core capacity
building and industry leading objectives, the Company has successfully developed and popularized
various advanced technologies and facilities including special robots, laser repair device and intelligent
maintenance tooling suitable for the maintenance of hydropower stations, greatly improving the
maintenance efficiency and safety coefficient. After maintenance and transformation, the cascade
hydropower station equipment in the basin achieved well-established technical indicators, and the one-
time startup success rate after unit maintenance (including major technical transformation) reached 100%,
and the operation and safety of the equipment were properly guaranteed throughout the year.
(4) Cross-region electric power marketing capability
The Company's hydropower stations are the key national energy projects and the backbone power
source of the "West-to-East Power Transmission", and all of them are trans-regional and trans-provincial
long-distance transmission and consumption, with significant scale advantage and brand effect. Over the
years, the Company has gradually formed a more scientific and perfect trans-regional and trans-provincial
consumption mechanism of large hydropower, which has established a strong foundation for rational and
orderly consumption of electric energy.
The Company actively responded to the impact of the market-based reform of electric energy. The
Company made persisting efforts in forward-looking research, in-depth analysis of the market
environment and focusing on market dynamics and emerging businesses, hoping for grasping the
opportunities and challenges. The Company deeply understood the reform trend, and promotes sustainable

2020 Annual Report
12 / 259
and healthy development by giving full play to professional advantages and actively striving for policy
support.
The electric energy consumption covers 2 major power grids, 3 regions and 12 provinces and cities.
Combining with the characteristics of hydropower station consumption, the Company continued to expand
marketing ideas, innovated marketing strategies, optimized marketing methods, and implemented refined
and precise marketing to maximize the overall benefits of the Company.
(5) Financing and asset merger, acquisition and integration capabilities
The Company has excellent financial situation, stable and abundant cash flow, and good reputation
in both international and domestic capital markets, and has the advantages of international credit rating of
domestic AAA and national sovereign level, with strong investment, merger and financing capabilities. In
September 2020, the Company became the first "A+G" listed entity enterprise in China through the
successful issuance of GDR, which effectively improved the coverage of investors in the overseas market,
further expanded overseas financing channels and laid a solid foundation for its subsequent overseas
investment and financing businesses. In recent years, the Company has placed greater focus on its main
responsibilities and businesses, actively and steadily carried out foreign investment around hydropower,
electricity distribution and sales and smart integrated energy, continuously optimized the investment
structure and investment quality, and realized the contribution ability of investment income commensurate
with its scale.
The Company will further give play to its credit advantages, and optimize the debt structure and
minimize the cost of capital by using various financing tools and channels; The Company will actively
serve the Yangtze River Economic Belt, "the Belt and Road Initiative", Yangtze River Protection, "Peak
Carbon Dioxide Emissions", "Carbon Neutral" and other major national strategies, and seize the national
power system reform, mixed-ownership reform, clean energy transformation, new energy development
and other major opportunities, so as to actively promote the industrial chain extension and international
development; The Company will seize the good opportunities of capital market reform and continuous
improvement of the system, actively and steadily carry out investment around the main business, and
thoughtfully manage the market value.
Section 4 Operating Results Discussion and Analysis
I. Operating Results Discussion and Analysis
In 2020, in the face of the COVID-19 epidemic and the complex and changing domestic and
international circumstances, the whole country has managed to coordinate the prevention and control of
the epidemic scientifically to ensure the stable recovery of the economy and the overall balance of power
supply and demand. China's electricity consumption was 7.51 trillion kilowatt-hours, up 3.1% year on
year.
The year 2020 is the last year of the 13th Five-Year Plan. Under the leadership of the Board of
Directors, the management of the Company led all its staff to work together and overcome difficulties,
and made new progress and results in production and operation, reform and development, party building
and other aspects, fully completed the annual production and operation objectives and tasks, and realized
the successful conclusion of the "13th Five-Year Plan".
(1) Worked together to jointly defeat challenges and achieved wins in both epidemic prevention and
supply guarantee
Success was achieved in combating the epidemic at home and in securing supplies. The Company
established a working group for epidemic prevention and control in the first time, and took measures to
ensure the life safety and health of its staff by organizing special meetings, purchasing epidemic prevention
supplies in an emergency manner, and quickly introducing epidemic prevention and control measures. At
the critical stage of epidemic prevention and control, more than 1,000 staffs of the Company stood firm in
the front line of power generation, ensuring the safe and stable operation of cascade hydropower stations
and reliable supply of electric power, providing a strong and reliable energy support for winning the
defense wars in Wuhan and Hubei.
Our Chinese staffs overseas achieved "zero infection". Under the unfavorable situation of actively
coping with the spread of the epidemic abroad, the Company made donations through various channels
and formulated multiple epidemic prevention measures. The staffs of the Company's overseas projects

2020 Annual Report
13 / 259
have been sticking to their posts, and the Company organized capable forces to go out for Peru. With the
joint efforts of all parties, the Company realized the orderly promotion of overseas business and "zero
infection" of its overseas staffs.
(2) Focused on the main business and strength, and constantly improved the quality and efficiency of
development
Power production hit a new record. The Company has always taken the operation and management
of "the pillars of a great nation" as its greatest responsibility and undertaking, and has continued to practice
the lean production management concept of "accurate scheduling, lean operation, meticulous maintenance
" to improve the utilization efficiency of water resources. The Three Gorges, Gezhouba, Xiluodu and
Xiangjiaba cascade hydropower stations generated 226.93 billion kilowatt-hours of electricity in the year,
hitting a new high. The annual energy output of Three Gorges Hydropower Station reached 111.802 billion
kilowatt-hours, setting a new world record for the annual energy output of a single hydropower station set
by Itaipu Hydroelectric Power Station in 2016. The Company has persistently deepened diagnostic
operation and condition maintenance, solid annual repair and routine maintenance and deficiency
elimination, so that the health level of equipment has been steadily improved, and the key operating
indicators of cascade hydropower station units have been in the leading position in the industry. The
cascade hydropower stations of the Company withstood the test of "long cycle, heavy load and
uninterrupted operation" during the major flood period, and the full-load duration of Xiluodu, Xiangjiaba
and Three Gorges hydropower stations all reached a record high.
Safety and environmental protection were maintained in good shape. The Company pushed forward
the special problem-addressing action of production safety and the construction of dual prevention
mechanism by concentrating on the management and control of five major safety risks, that is, heavy
casualties, flooded plant, widespread blackout, major equipment and facilities damage accidents and key
network information security incidents. Adhering to the principle of "promoting safety through science
and technology", the Company promoted the online operation of the safety management information
platform and the further improvement of the on-site safety intelligent control measures. The Company has
achieved the goal of "zero personal casualties and zero equipment accidents" for the 11th consecutive year,
once again creating the best performance in terms of production safety. Envisioning to providing flood
control capabilities against the Yangtze River and contribute clean energy to the society, the Company
systematically carried out pollution prevention and control, environmental protection and ecological
civilization construction. The Company set up a leading group of environmental protection, and compiled
a list of eco-environment protection responsibilities, in order to fulfill environmental protection
responsibilities level by level.
Comprehensive benefits were fully demonstrated. Through the scientific implementation of the "joint
scheduling of five water reservoirs", the Company successfully dealt with the third largest basin-wide
flood since the founding of new China. The Three Gorges and Xiluodu reservoirs withstood the highest
flood peaks since the construction of the reservoir, reaching 75,000 cubic meters per second and 18,200
cubic meters per second, respectively. The cascade junctions in the basin have impounded nearly 36 billion
cubic meters of flood water during the flood season, accounting for 60% of the total amount of flood
retention by the reservoir group in the middle and upper reaches of the Yangtze River, and have played a
tremendous role in flood control and anti-waterlogging. The new regulations for cascade scheduling of the
Three Gorges and Gezhouba Dam have been approved smoothly, and have achieved remarkable results in
their first application. The annual water-saving and power-increasing capacity of cascade hydropower
stations in the basin reached 9.856 billion kWh.

2020 Annual Report
14 / 259
Power output of cascade hydropower stations in 2020 (100 million kWh)
Significant marketing achievements have been made. The Company wrapped up the task of electric
energy consumption, and signed the 2020 annual power purchase and sale contract for cascade
hydropower stations in a relatively superior way in terms of quantity and price. The Company closely
followed the pace of power system reform for continued improvement of the marketing capabilities, and
set up the power sales company to explore how to optimize the marketing system and mechanism.
The construction of hydropower stations proceeded in an orderly manner. The Company thoroughly
implemented General Secretary Xi Jinping's important instructions for the first batch of units of Wudongde
hydropower station in terms of commissioning and power generation, and taken over the 8 units that have
been put into operation in Wudongde hydropower station, and successfully achieved the goal of "first
stable 100-day operation" for the first 4 units put into operation and "zero unscheduled downtime1" for the
units already taken over. The Company set up Baihetan Power Plant. While deeply practicing the concept
of "combination of construction and management and seamless handover", the Company devoted itself to
the project construction and steadily promoted the construction of production organization system,
technical management system and standardized management system, laying a solid foundation for
impounding and power generation.
(3) Constantly consolidated the "two wings" growth and expanded the scope of development
A breakthrough was made in international business. The Company has successfully completed the
equity delivery of Luz del Sur Project in Peru and the introduction of co-investors, established the Andes
Project Office, and organized capable forces to push forward the stable transition of control of Luz del
Sur. Overcoming the adverse impact of major changes in the international situation, the Company
successfully issued the "Shanghai-London Stock Connect" global depositary receipts (GDR). In addition,
the Company has obtained the green certification and achieved the dual listing of "A+G" for the first time,
an important milestone for the Company to deeply integrate into the international capital market and
promote the development of international strategies. The Company provided high-quality operation and
maintenance services of overseas hydropower stations as well as technology consulting services, and its
first overseas entity project "Pakistan Wind Power Project" operated in an orderly manner. The Company
also actively cooperated with the power production and construction of Karot Hydropower Station.
The power distribution and sale business achieved steady development. The “integration of four
networks” in Chongqing region was smoothly completed, providing an "industry model" for the power
system reform and mixed ownership reform. The scope of the incremental power distribution network that
the Company has participated in has been continuously expanded, and the incremental power distribution
network in Yan'an New District and Xichou County of Yunnan Province has been put into operation
smoothly. With the development idea of "pilot first, overall layout, rapid development and scale formation
", the Company took the lead in the layout of intelligent integrated energy business along the Yangtze
River Economic Belt. The Company actively followed up the development of new business forms. The
world's largest pure electric cruise ship - "Yangtze River Three Gorges No.1 Cruise Ship ", jointly invested
and researched with Yichang Transportation Group, has been officially put into construction.
1 A unit outage in which the facilities must be converted from the usable state to the unavailable state has not occurred.
634
331
1,118
186
615
330
970
185
608
337
969
191
溪洛渡 向家坝 三峡 葛洲坝
实发
计划
去年
Actual
Planned
2019
Xiluodu Xiangjiaba Three Gorges Gezhouba

2020 Annual Report
15 / 259
(4) Constantly enhanced management level and development momentum
Obvious cost reduction and efficiency effects were made. The Company raised low-cost funds
through multiple channels through precise research and judgment, seizing opportunities, innovative
financing and other ways; The financial expenses incurred for the whole year amounted to RMB 4.986
billion, down by RMB 225 million year-on-year; The Company realized the collection of electric charges
to the fullest extent possible, providing a powerful fund guarantee for production and operation. The
Company also made great efforts in deepening the standardization of the management of electricity
generation costs and strengthening the cost management of projects under construction.
Internal management was continuously optimized. The Company has made continuous efforts in
improving the system construction, establishing the compliance management system at all levels of the
Company, improving the risk control list, standardizing the Company's risk event classification standards
and management requirements, carrying out legal risk investigation at home and abroad, and conducting
risk early warning prompt irregularly. The Company achieved preliminary results in the integration of
internal control, risk management and compliance management.
The Company's market value hit a new high. The Company's excellent performance and standardized
governance mode has been recognized by the capital market, with the year's market value reached the
highest RMB 473.7 billion. The Company consistently strengthened investor relation management,
broadened investor communication channels, and conducted in-depth communication with more than
2,000 investors by holding "Webcast" performance briefing and major event presentations. The Company
has won many key awards in the capital market, such as the "Tianma Award - Best Listed Company in
Investor Relations" and the "China Securities Golden Bauhinia Award - Best Listed Company in Investor
Relations".
(5) Continued to advance reform and innovation and unleashed the driving forces for development
Comprehensive reform was deepened. The Company has completed the comprehensive reform task
of the "Double-hundred Action" of the State-owned Assets Supervision and Administration Commission
(SASAC), and pushed forward special reforms such as "Create First-class Hydropower Power",
"Benchmarking World-class Management Improvement Action" and "Science Reform Demonstration
Action", further standardizing the rights and responsibilities of various governance subjects. It has
completed the pilot project of professional managers in joint-stock mixed-ownership enterprise, and
implemented tenure system and contractual management for senior executives. In the special evaluation
of three system reforms of "Double-hundred Enterprises" carried out by the SASAC, the Company was
awarded A-level rating and circular of commendation.
Highlights of scientific and technological innovation have emerged. The Company promoted the top-
level design of smart hydropower, prepared and released the smart hydropower blueprint at a high starting
point, and initiated the construction of industrial Internet platform. It completed the development of
advanced application pilots such as decision-making support system for basin maintenance and unit
holographic monitoring, as well as the R&D of intelligent equipment for hydropower stations, including
penstock testing and maintenance robot and hydraulic hoist piston rod testing robot. In the whole year, the
Company obtained 152 national granted patents, a record high, making the total number of patents more
than 1200.
II. Operating Overview for the Reporting Period
In 2020, the power output of the Company's cascade hydropower stations reached 226.930 billion
kWh, an increase of 16.467 billion kWh over the same period last year, up 7.82%; Its total profit hit RMB
32.456 billion, RMB 5.829 billion more than the same period last year, up 21.89%; Net profit attributable
to the parent company reached RMB 26.298 billion, an increase of RMB 4.755 billion or 22.07% over the
same period last year; The basic earnings per share were RMB 1.1853, an increase of RMB 0.2061 or
21.05% over the same period last year.
(I) Principal Business Analysis
1. Analysis of changes in relevant items on income statement and cash flow statement
Unit: RMB Yuan
Item 2020 2019
Change in
Percentage (%)
Operating revenue 57,783,367,039.83 49,874,086,874.95 15.86
Operating cost 21,149,454,266.44 18,697,294,123.93 13.12

2020 Annual Report
16 / 259
Sales expense 115,417,318.42 27,792,136.69 315.29
Administrative expense 1,292,798,651.45 813,629,745.43 58.89
R&D expense 39,568,009.51 41,066,919.32 -3.65
Financial expense 4,985,909,832.08 5,210,950,725.28 -4.32
Net cash flow from operating
activities
41,036,864,400.40 36,464,419,570.28 12.54
Net cash flow from investing
activities
-36,037,256,431.23 -6,631,454,496.45 443.43
Net cash flow from financing
activities
-3,007,326,032.09 -27,873,589,870.07 -89.21
2. Revenue and cost analysis
Applicable
(1). Principal business by sector, product or region
Unit: RMB Yuan Principal business by sector
By sector Operating revenue Operating cost Gross margin
(%)
Year-on-year
change of
operating revenue (%)
Year-on-year
change of
operating cost (%)
Year-on-
year change of
gross
margin
Domestic
hydropower
sector 52,882,345,871.07 17,776,111,875.66 66.39 6.49 -4.50
+3.87 per
centage p
oints
Other sectors 4,342,971,947.08 2,938,930,720.73 32.33 3,139.66 3,689.57
-9.82 percentage
points
Principal business by product
By product Operating revenue Operating cost
Gross
margin
(%)
Year-on-year
change of operating
revenue (%)
Year-on-year
change of operating cost
(%)
Year-on-year
change of
gross margin
Domestic
hydropower sector
52,882,345,871.07 17,776,111,875.66 66.39 6.49 -4.50
+3.87
percentage points
Other
sectors 4,342,971,947.08 2,938,930,720.73 32.33 3,139.66 3,689.57
-9.82
percentage points
(2). Analysis of production volume and sales volume
Non-applicable
(3). Cost analysis
Unit: RMB Yuan
By sector situation
By sector Cost item Current period Percentage
in total
cost (%) Prior period
Percentage
in total
cost (%)
Year-on-year
Change (%)
Domestic
hydropower
sector
Depreciation,
fiscal
charges, etc.
17,776,111,875.66 61.77 18,614,298,076.73 71.71 -4.50
Other
sectors
Materials,
human cost, etc.
2,938,930,720.73 10.21 77,553,094.17 0.30 3,689.57
By product situation

2020 Annual Report
17 / 259
By product Cost items Current period Percentage
in total
cost (%) Prior period
Percentage
in total
cost (%)
Year-on-year
Change (%)
Domestic
hydropower
sector
Depreciation,
fiscal
charges, etc.
17,776,111,875.66 61.77 18,614,298,076.73 71.71 -4.50
Other
sectors
Materials,
human cost,
etc.
2,938,930,720.73 10.21 77,553,094.17 0.30 3,689.57
(4). Particulars of major customers and major suppliers
Applicable
Sales to top five customers amounted to RMB 59,779,694,900, representing 100% of total domestic
sales for the year, among which sales to related parties amounted to RMB0.
Purchases from top five suppliers amounted to RMB63,726,000, representing 20.56% of total
domestic purchases for the year, among which purchases from related parties amounted to RMB0.
3. Expense
Applicable
Sales expense rose by RMB88 million to RMB115 million, which was mainly due to the acquisition of
Peru Companies during the year.
Administrative expense rose by RMB479 million to RMB1.293 billion, which was mainly due to the
acquisition of Peru Companies during the year.
4. R&D investments
(1). Particulars of R&D investments
Applicable
Unit: RMB’0,000 Yuan
Expensed R&D investment for the year -
Capitalised R&D investment for the year -
Total R&D investment 57,699.32
Percentage of total R&D investment in
operating revenue (%)
1.00
Number of R&D staff 253
Number of R&D staff in total headcount
(%)
6.35
Percentage of capitalised R&D
investment (%)
-
(2). Explanation
Non-applicable
5. Cash flow
Applicable
Net cash flows from investing activities decreased by RMB29,406 million year-on-year, mainly due to the
acquisition of Peru Companies during the year.
Net cash flows from financing activities increased by RMB24,866 million year-on-year, mainly due to
proceeds from issuance of GDRs and the increase in overseas borrowings obtained from the acquisition
of Peru Companies during the year.
2020 Annual Report
18 / 259
(II) Explanation of material changes in profit caused by non-principal business
Non-applicable
(III) Analysis of Assets and Liabilities
Applicable
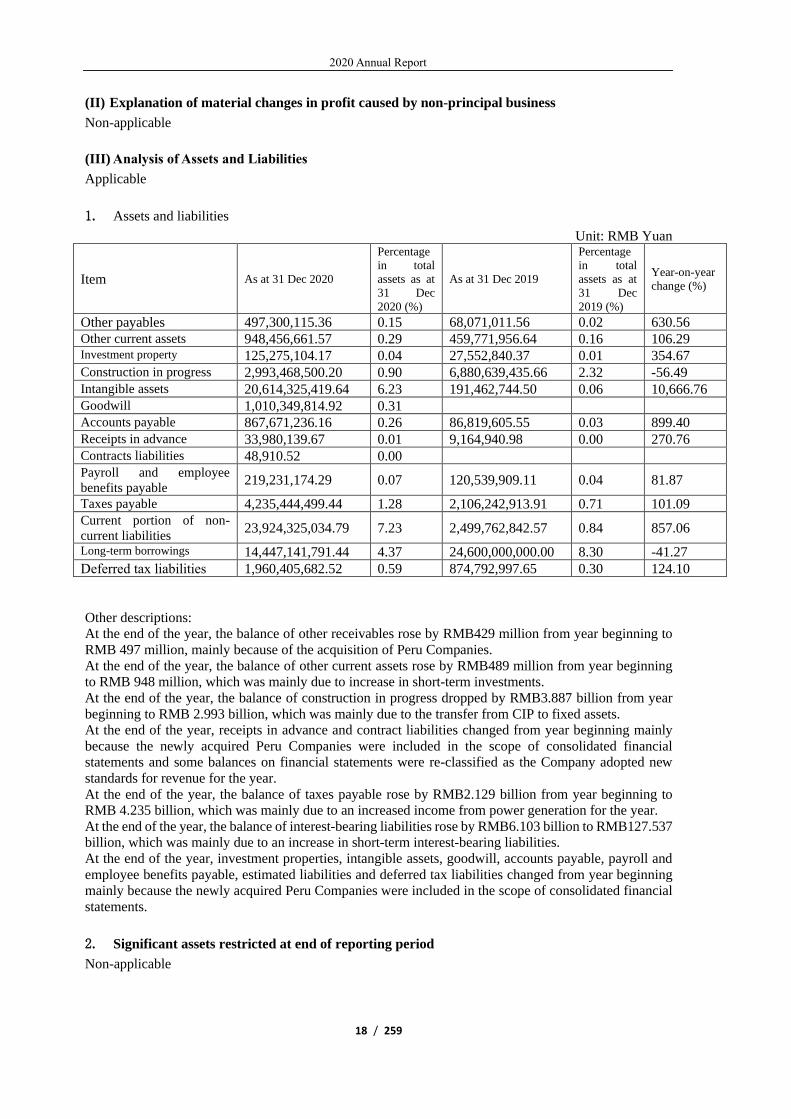
1. Assets and liabilities
Unit: RMB Yuan
Item As at 31 Dec 2020
Percentage
in total
assets as at
31 Dec
2020 (%)
As at 31 Dec 2019
Percentage
in total
assets as at
31 Dec
2019 (%)
Year-on-year
change (%)
Other payables 497,300,115.36 0.15 68,071,011.56 0.02 630.56
Other current assets 948,456,661.57 0.29 459,771,956.64 0.16 106.29 Investment property 125,275,104.17 0.04 27,552,840.37 0.01 354.67
Construction in progress 2,993,468,500.20 0.90 6,880,639,435.66 2.32 -56.49
Intangible assets 20,614,325,419.64 6.23 191,462,744.50 0.06 10,666.76
Goodwill 1,010,349,814.92 0.31
Accounts payable 867,671,236.16 0.26 86,819,605.55 0.03 899.40
Receipts in advance 33,980,139.67 0.01 9,164,940.98 0.00 270.76
Contracts liabilities 48,910.52 0.00
Payroll and employee
benefits payable 219,231,174.29 0.07 120,539,909.11 0.04 81.87
Taxes payable 4,235,444,499.44 1.28 2,106,242,913.91 0.71 101.09
Current portion of non-
current liabilities 23,924,325,034.79 7.23 2,499,762,842.57 0.84 857.06
Long-term borrowings 14,447,141,791.44 4.37 24,600,000,000.00 8.30 -41.27
Deferred tax liabilities 1,960,405,682.52 0.59 874,792,997.65 0.30 124.10
Other descriptions:
At the end of the year, the balance of other receivables rose by RMB429 million from year beginning to
RMB 497 million, mainly because of the acquisition of Peru Companies.
At the end of the year, the balance of other current assets rose by RMB489 million from year beginning
to RMB 948 million, which was mainly due to increase in short-term investments.
At the end of the year, the balance of construction in progress dropped by RMB3.887 billion from year
beginning to RMB 2.993 billion, which was mainly due to the transfer from CIP to fixed assets.
At the end of the year, receipts in advance and contract liabilities changed from year beginning mainly
because the newly acquired Peru Companies were included in the scope of consolidated financial
statements and some balances on financial statements were re-classified as the Company adopted new
standards for revenue for the year.
At the end of the year, the balance of taxes payable rose by RMB2.129 billion from year beginning to
RMB 4.235 billion, which was mainly due to an increased income from power generation for the year.
At the end of the year, the balance of interest-bearing liabilities rose by RMB6.103 billion to RMB127.537
billion, which was mainly due to an increase in short-term interest-bearing liabilities.
At the end of the year, investment properties, intangible assets, goodwill, accounts payable, payroll and
employee benefits payable, estimated liabilities and deferred tax liabilities changed from year beginning
mainly because the newly acquired Peru Companies were included in the scope of consolidated financial
statements.
2. Significant assets restricted at end of reporting period
Non-applicable

2020 Annual Report
19 / 259
(IV) Industry operating information analysis
Applicable

2020 Annual Report
20 / 259
Analysis of operations of the electricity sector
1. Power tariffs for the reporting period
Applicable
Electricity generated (’0,000 kWh) On-grid electricity (’0,000 kWh) Electricity sold (’0,000 kWh) On-grid tariff
(RMB/MWh)
Sales tariff
(RMB/MWh) Category 2020 2019 Year-on-year change (%) 2020 2019 Year-on-year change (%) 2020 2019 Year-on-year change (%) 2020 2020
Domestic
hydropower 22,693,022 21,046,277 7.82 22,567,075 20,923,931 7.85 22,582,869 20,940,799 7.84 264.90 264.90
Total 22,693,022 21,046,277 7.82 22,567,075 20,923,931 7.85 22,582,869 20,940,799 7.84
2. Electricity, revenue and cost for the reporting period
Applicable
Unit: RMB’00,000,000 Yuan
Category
Electricity
generated
(’0,000
kWh)
Year-
on-
year(%
)
Electricit
y sold
(’0,000
kWh)
Year-
on-
year(
%)
Revenue
Same
period
last
year
Change
ratio (%)
Cost
components
Current period
2020
percentage
in total cost
(%)
Prior period
2019
percentage
in total
cost (%)
Year-
on-year
change
(%)
Domestic
hydropower 22,693,022 7.82
22,582,8
69 7.84 528.82 496.59 6.49
Depreciatio
n, fiscal
charges, etc.
177.76 61.77 186.14 71.71 -4.50
Total 22,693,022 7.82 22,582,8
69 7.84 528.82 496.59 6.49 - 177.76 61.77 186.14 71.71 -4.50

2020 Annual Report
21 / 259
3. Installed capacity analysis
Applicable
At the end of 2020, the Company had a controllable installed capacity of 45,595,000 kilowatts,
including 45,495,000 kilowatts controllable domestic installed capacity and 100,000 kilowatts controllable
overseas installed capacity (Luz del).
4. Power generation efficiency analysis
Applicable
In 2020, the utilization hours of power generation equipment at Three Gorges Power Station was
4,998.66 hours, up 15.18% year-on-year; the service power consumption rate was 0.07%, which remained
at similar level with last year;
The utilization hours of power generation equipment at Gezhouba Power Station was 7,064.34 hours,
down 4.10% year-on-year; the service power consumption rate was 0.15%, down 0.01 percentage point
year-on-year;
The utilization hours of power generation equipment at Xiluodu Power Station was 5,152.97 hours,
up 1.57% year-on-year; the service power consumption rate was 0.13%, down 0.01percentage points year-
on-year;
The utilization hours of power generation equipment at Xiangjiaba Power Station was 5,748.81 hours,
down 1.86% year-on-year; the service power consumption rate was 0.06%, which remained at similar
level with last year.
5. Capital expenditures
Applicable
During the reporting period, the Company's investment in fixed assets amounted to RMB1,564
million, of which RMB67 million was spent on the acquisition of fixed assets and RMB1,497 million was
invested in infrastructure.
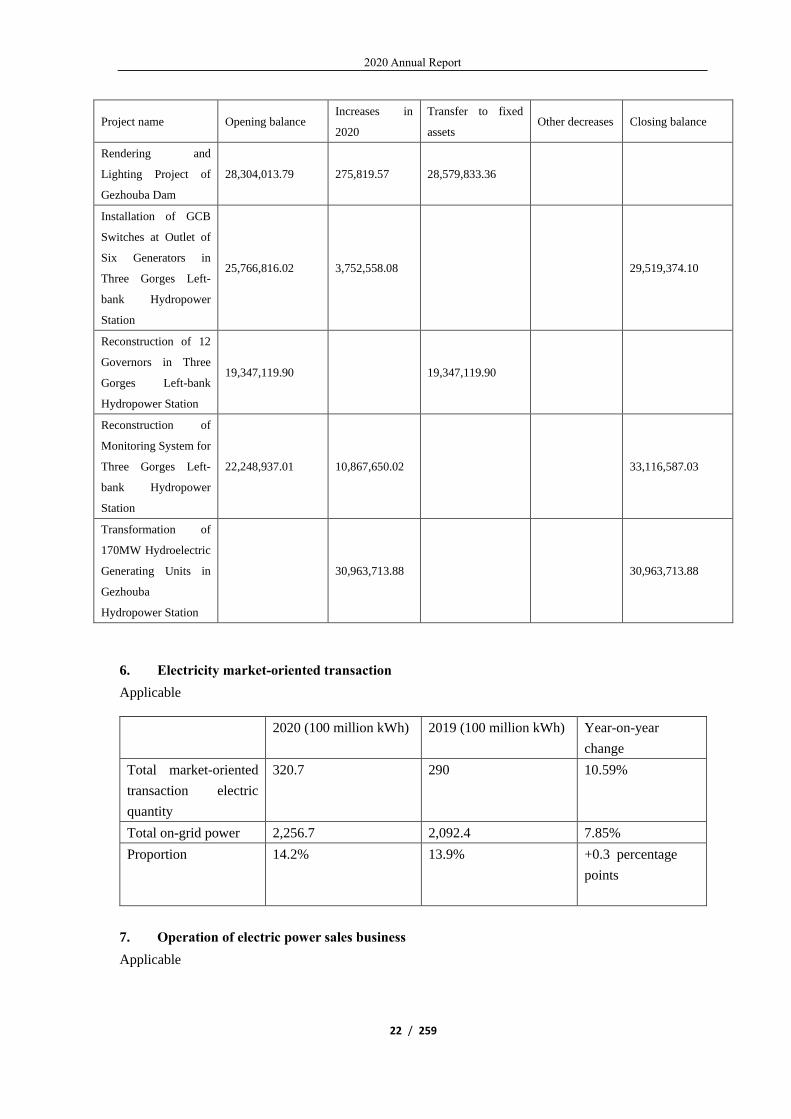
Significant constructions in progress are as follows.
Unit: RMB Yuan
Project name Opening balance Increases in
2020
Transfer to fixed
assets Other decreases Closing balance
Xiangjiaba Project 5,816,605,608.15 61,323,121.19 4,392,915,232.85 1,485,013,496.49
Transformation,
Renovation and
Capacity Increase of
Hydroelectric
Generating Units of
Gezhouba
Hydropower Station
49,230,429.26 71,755,303.23 59,342,372.40 61,643,360.09
Transformation of
220kV Switching
Station of Gezhouba
Hydropower Station
122,424,114.45 43,120,176.41 89,264,591.12 375,943.06 75,903,756.68
Auxiliary Housing of
Kunming Base 541,058,560.68 25,237,967.59 514,581,052.01 51,715,476.26
2020 Annual Report
22 / 259
Project name Opening balance Increases in
2020
Transfer to fixed
assets Other decreases Closing balance
Rendering and
Lighting Project of
Gezhouba Dam
28,304,013.79 275,819.57 28,579,833.36
Installation of GCB
Switches at Outlet of
Six Generators in
Three Gorges Left-
bank Hydropower
Station
25,766,816.02 3,752,558.08 29,519,374.10
Reconstruction of 12
Governors in Three
Gorges Left-bank
Hydropower Station
19,347,119.90 19,347,119.90
Reconstruction of
Monitoring System for
Three Gorges Left-
bank Hydropower
Station
22,248,937.01 10,867,650.02 33,116,587.03
Transformation of
170MW Hydroelectric
Generating Units in
Gezhouba
Hydropower Station
30,963,713.88 30,963,713.88
6. Electricity market-oriented transaction
Applicable
2020 (100 million kWh) 2019 (100 million kWh) Year-on-year
change
Total market-oriented
transaction electric
quantity
320.7 290 10.59%
Total on-grid power 2,256.7 2,092.4 7.85%
Proportion 14.2% 13.9% +0.3 percentage
points
7. Operation of electric power sales business
Applicable

2020 Annual Report
23 / 259
In order to acclimate the trend of national power system reform, the Company established Three
Gorges Electric Energy Co., Ltd. with TG Capital in June 2016, and carried out power sales business with
Three Gorges Electric Energy as the platform.
In 2020, Three Gorges Electric Energy made constant efforts in optimizing the power sales
organization system and gradually expanding its complex power sales team. It has completed the
construction of the power sales management system, expanded the power sale market in Anhui, Zhejiang
and other regions, and realized the continuous expansion of market-oriented transaction scale. It
participated in the pilot run of the full-week and full-month settlement in Guangdong Province, and was
invited to take part in the construction of the spot electricity market in Hubei Province, which further
consolidated the sales synergetic mechanism.
(V) Investment Analysis
1. Overall analysis of equity investments
Applicable
As at the end of 2020, the Company invested in equity of 51 companies, with an accumulated balance of
approximately RMB 47.2 billion at cost, and equity investments increased by approximately RMB 35.2
billion during the reporting period.
(1) Significant equity investments
Applicable
On April 24, 2020, the Company, through Yangtze Andes, a platform of its wholly-owned subsidiary
Yangtze International, and Sempra Energy completed the business transaction pursuant to the Equity
Acquisition Agreement dated September 28, 2019, with underlying transaction consideration of US $3.59
billion, and core assets acquired of 83.64% equities in Luz del Sur. Upon completion of the acquisition,
the Company proceeded in an orderly manner with the mandatory tender offer for the remaining 13.68%
equities in Luz del Sur as stipulated in the local laws of Peru. The shares subject to the mandatory tender
offer represented approximately 13.5% of the total share capital of Luz del Sur and the transfer registration
of acquired shares was completed on February 24, 2021. Upon completion of the tender offer, Yangtze
Andes indirectly held approximately 97.14% of shares in Luz del Sur.
Details of the above transactions can be found in the Announcement 2020-017,2021-012 published
on the website of Shanghai Stock Exchange (http://www.sse.com.cn/).
(2) Significant non-equity investments
Non-applicable
(3) Financial assets measured at fair value
Applicable
As at the end of 2020, the Company's investment in other equity instruments was
RMB3,609,195,163.56, with a fair value change of RMB-794,969,953.03 for the period; the balance of
other non-current financial assets was RMB4,713,666,463.26, with a fair value change of RMB-
279,505,793.86 for the period.
2020 Annual Report
24 / 259
(VI) Disposal of significant assets and equity investments
Applicable
On August 28, 2020, Yangtze Andes, a wholly-owned subsidiary of Yangtze International in Hong
Kong, has introduced co-investors CYAN Holdings Limited ("CYAN"), MAGENTA Investment
Company Limited ("MAGENTA") and LLAMAS (BVI) Investment Limited ("LLAMAS"). Upon
completion of the transaction, Yangtze International, CYAN, MAGENTA and LLAMAS held 70.03%,
9.99%, 9.99% and 9.99% of the shares of Yangtze Andes respectively, and each shareholder provided
Yangtze Andes with shareholder loans corresponding to their shareholding ratio. In addition, CYAN,
MAGENTA and LLAMAS shared the transaction costs of Yangtze International's investment in the power
distribution project in South America according to the above proportion. On September 16, 2020, the
above transaction was considered and approved by the Second Extraordinary General Meeting of the
Company in 2020.
On November 10, 2020, Yangtze International, Yangtze Andes, CYAN, MAGENTA and LLAMAS
signed the Share Subscription Agreement, Shareholders Agreement and Shareholders Loan Transfer
Agreement, aimed to agree on matters relating to the subscription of shares by co-investors and the transfer
of shareholder loans. On December 23, 2020, the transacting parties completed the settlement as agreed,
and each co-investor subscribed US $71,326,574 in new capital of Yangtze Andes and received US
$288,526,035.33 in shareholder loans, respectively. After the completion of the transaction, the
shareholding ratio of all parties in Yangtze Andes remained unchanged.
For details on the above transactions, refer to Announcements 2020-050, 2020-056 and 2020-078 on
SSE website (http://www.sse.com.cn/).
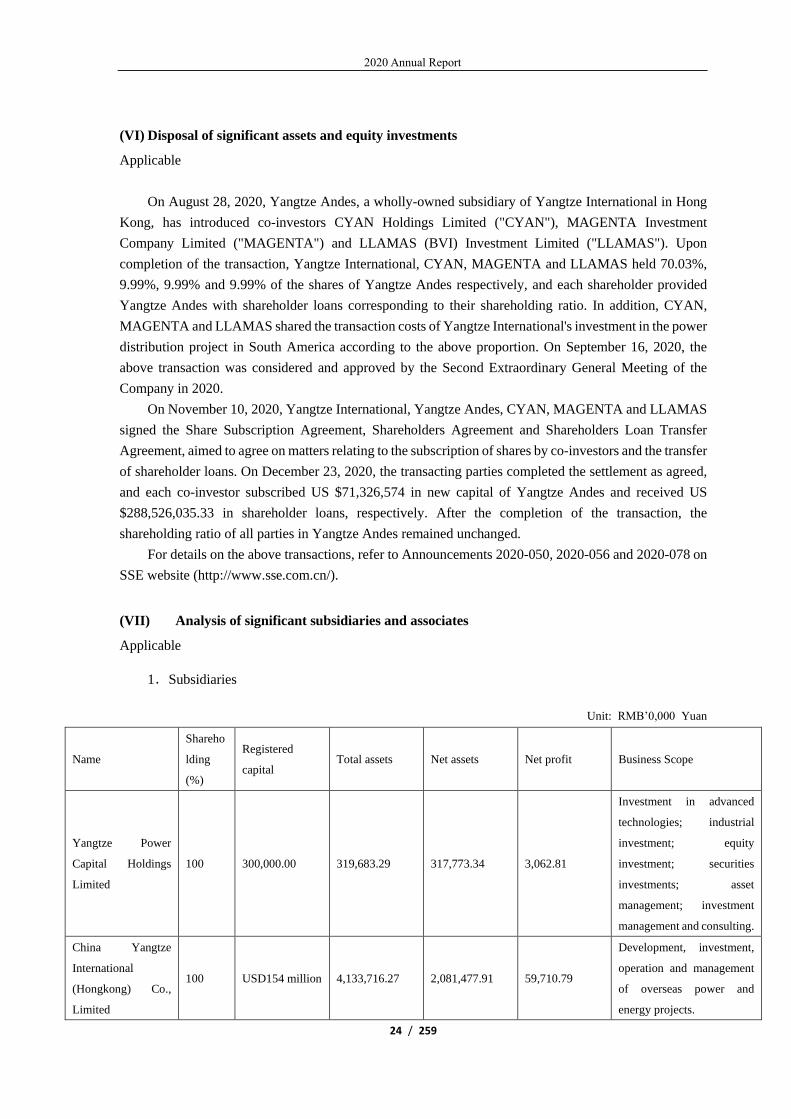
(VII) Analysis of significant subsidiaries and associates
Applicable
1.Subsidiaries
Unit: RMB’0,000 Yuan
Name
Shareho
lding
(%)
Registered
capital Total assets Net assets Net profit Business Scope
Yangtze Power
Capital Holdings
Limited
100 300,000.00 319,683.29 317,773.34 3,062.81
Investment in advanced
technologies; industrial
investment; equity
investment; securities
investments; asset
management; investment
management and consulting.
China Yangtze
International
(Hongkong) Co.,
Limited
100 USD154 million 4,133,716.27 2,081,477.91 59,710.79
Development, investment,
operation and management
of overseas power and
energy projects.

2020 Annual Report
25 / 259
Three Gorges Jinsha
River Yunchuan
Hydropower
Development Co.,
Ltd.
100 3,400,000.00 13,235,702.58 8,592,337.74 1,032,095.50
Hydropower development,
construction, investment,
operation and management;
clean energy development
and investment; specialized
technical services of clean
energy.
Three Gorges
Electric Energy Co.,
Ltd.
70 100,000.00 139,873.93 137,657.80 11,083.61
Development, construction,
design and operation
management of power
distribution and sales
system; power sales and
service; development,
consulting, transfer and
service of power
technologies; installation,
maintenance and test of
power equipment and
facilities; electric vehicle
charging service;
comprehensive utilization
service of distributed new
energy; comprehensive
energy service integrating
power supply, gas supply,
water supply and heat
supply.
China Yangtze
Power Sales Co.,
Ltd.
100 100,000.00 2,000.09 2,000.08 0.08
Power supply business.
General project: energy-
saving management
services, sales agency,
information consulting
services (excluding
licensing information
consulting services),
technology service,
technology development,
technology consulting,
technology exchange,
technology transfer,
technology promotion,
comprehensive energy
management service and
contracting energy

2020 Annual Report
26 / 259
management service in the
field of electric power
science and technology.
2.Analysis of major invested companies
Unit: RMB’0,000 Yuan
Name
Sharehold
ing
(%)
Registered
capital Business Scope
Hubei Energy Group
Co., Ltd. 28.62 650,744.95 Energy investment, development and management; other business operations within the
scope permitted by national policies.
Three Gorges
Finance Co., Ltd. 19.35 500,000.00
Providing financial and financing consulting, credit verification and related consulting
and agency services to member units; assisting the member units in the receipt and
payment of transaction funds; providing guaranty to member units; handling entrusted
loans and entrusted investments among member units; dealing with bill acceptance and
discount for member units; handling internal transfer settlement among member units
and designing corresponding settlement and liquidation schemes; absorbing deposits of
member units; conducting loans and financial leasing for member units; inter-bank
borrowing; issuing financial corporation bonds upon approval; underwriting the
corporate bonds of member units; equity investment in financial institutions; portfolio
investment; buyer's credit and finance leases for the products of member units; other
businesses approved by the China Banking Regulatory Commission.
Guangzhou
Development Group
Incorporated
19.96 272,619.66
Retail trade of commodities (except items subject to administrative permit or approval);
wholesale trade of commodities (except items subject to administrative permit or
approval); investment of enterprises’ own funds; enterprise management services
(except services involving licensed business items); corporate headquarters
management; wholesale of coal and products; wholesale of petroleum products (except
refined oil products and dangerous chemicals); retail of electrical equipment; retail of
general machinery and equipment; development of natural gas utilization technology;
R&D and design of solar photovoltaic power supply system; engineering project
management service; promotion service of energy-saving technologies; promotion
service of environmental protection technologies; technical consulting and services in
the field of renewable energy; municipal facilities management; technical services
(excluding items subject to permit or approval).
Three Gorges
Capital Holdings
Co., Ltd.
10.00 714,285.71 Industrial investment; equity investment; asset management; investment consulting.
Chongqing Three
Gorges Water
Conservancy and
Electric Power Co.,
Ltd.
16.55 191,214.29
Power generation; power supply, sales and service; development, construction, design
and operation management of power distribution and sales system; engineering survey
and design; installation (repair, commissioning) of electric power facilities;
development, technology transfer, technical consulting and technical services of electric
power technologies; sales and leasing of electric power supplies; power project
development; comprehensive utilization service of distributed energy; comprehensive
energy services integrating power supply, gas supply, water supply and heat supply;
production, processing and sales of roasting manganese, manganese carbonate, silicon-
manganese alloy and manganese-iron alloy.
SDIC Power
Holding Co., Ltd.2 15.19 678,602.33
Investment, construction, operation and management of energy projects mainly in
electric power production; development and operation of new energy projects, advanced
technologies and environmental protection industries; development and management of
electric power supporting products, information and consulting services.
Sichuan Chuantou
Energy Co., Ltd. 14.01 440,214.05
Investment, development, operation and management of energy projects mainly in
electric power production; development and operation of new energy projects, electric
power supporting products, information and consulting services; investment and
2As of December 31, 2020, the Company and Yangtze Power Capital held 14.02% of the shares of SDIC Power Holding
Co., Ltd. Yangtze International held 8,149,959 "Shanghai-London Stock Connect" global depositary receipts (GDR) of
SDIC Power Holding Co., Ltd., representing 81,499,590 A-shares of underlying securities and accounting for 1.17% of
the total share capital of SDIC Power Holding Co., Ltd.

2020 Annual Report
27 / 259
operation of railway, traffic system automation and intelligent control products, optical
fiber optic cable and other high-tech industries.
Yunnan Huadian
Jinsha River
Midstream
Hydropower
Development Co.,
Ltd
23.00 779,739.00
Planning and preliminary work of basin cascades; investment, construction, operation
and management of hydropower stations; operation regulation and dispatching of
hydropower stations in the basin; production and sale of electric energy; procurement of
water conservancy and hydropower supplies and equipment; technical consulting service
of water conservancy and hydropower projects.
(VIII) Particulars of structured entities controlled by the Company
Non-applicable
III. Discussion and Analysis of Future Development of the Company
(I) Industry landscape and trend
Applicable
1. It is expected that the supply and demand of the national electric power will be balanced in 2021,
and the power supply in some areas will be tight
Electricity consumption will see continued growth. With the full recovery of domestic production
and living order, China's economic growth rate is expected to achieve a substantial increase in 2021.
China's electricity consumption in 2021 will increase by 6%-7% year on year, according to a forecast by
relevant authorities after taking into account the economic situation at home and abroad as well as electric
energy substitution factors.
2. The green and low-carbon strategy provides a favorable policy environment for the development
of the Company
The power supply structure will be transformed to low carbon. As required by the goal of "We aim
to have CO2 emissions peak before 2030 and achieve carbon neutrality before 2060", the power industry
will speed up the transformation process of clean and low-carbon supply structure and achieve the carbon
emission reduction target. The 14th Five-Year Plan is a critical period for China to construct a new
development pattern and transform its energy power structure. The proportion of installed power
generation from non-fossil energy is expected to continue to increase in 2021.
Hydropower, as a renewable energy source, is safe, stable, clean, efficient and flexible in operation,
which is highly in line with the spirit of the national energy strategy. The mega hydropower stations
operated and managed by the Company are all national key energy projects and the backbone power source
of the "West-to-East Power Transmission", and will be consumed in accordance with relevant national
policies. The Company maintains a good government-enterprise interaction relationship with the
provinces and cities that send and receive electricity in terms of power supply and low-carbon
development. With the development of the electricity market, the transaction of the electricity market will
be more perfect and mature, which will give the Company strong policy support and price advantage, and
further improve the competitiveness of the hydropower stations of the Company.
(II) Corporate development strategy
Applicable

2020 Annual Report
28 / 259
Completion of the 13th Five-Year Plan: During the "13th Five-Year" period, faced with such severe
situations as in-depth reform of the electricity market, intricate reservoir operation and power dispatching
environment, fluctuations in the capital market, sudden outbreak of COVID-19 and expiration of tax
preferential policies, the Company unswervingly adhered to its own development strategies, that is, to
firmly grasp the "one main line" (to be the leader of the global hydropower industry), deeply cultivate the
"two markets" (electricity market and capital market), and remain committed to the "three strategies"
(hydropower operation brand strategy, internationalization strategy, water and electricity extension
strategy). The Company devoted all its efforts to promote the market-oriented transformation of its value
chain of "water flow – electricity flow - cash flow" and the strategic extension of its industrial chain of
"power generation – power distribution - power sales". Through lean production management, active
marketing, steady capital operation, in-depth reform and efficiency increasing, and strengthening the
guidance of Party building, the Company has preliminarily constructed a well-established pattern with
mega hydropower as the core, accompanied with flourishing power distribution, power sale and
international business, and has achieved high-quality development in connotation and extension, and
witnessed successful conclusion of the "13th Five-Year Plan". During the "13th Five-Year Plan", the
Company's four cascade hydropower stations operated stably, generating a power output of 1,069.8 billion
kilowatt-hours, a main business income of RMB 257.2 billion and a total profit of RMB 137.9 billion. The
Company has fully completed the goals and tasks of the development plan, laying a solid foundation for
the development of the "14th Five-Year Plan".
During the 14th Five-Year Plan period, the Company will stick to the new development concept and
take the initiative to serve the Yangtze River Economic Belt, "the Belt and Road Initiative", "Carbon
Neutral", "New Power System Dominated by New Energy" and other major national strategies. The
Company will unswervingly promote market-oriented reform, digital transformation, international
expansion, and the integrated extension of "power generation – power distribution - power sales", so as to
further consolidate its leading position in the world hydropower industry, and strive to forge a world-class
clean energy listed company centering on hydropower.
During the 14th Five-Year Plan period, the company will further consolidate, deepen and expand the
development mode of "mega hydropower station", and continue to advance in five directions: (1) Build
up the hydropower "base", and adhere to the concept of "precise scheduling, lean operation, elaborate
maintenance " in the operation and management of the giant cascade hydropower stations in the Yangtze
River Basin, complete the production preparation, connection, power generation and asset acquisition of
Wudongde and Baihetan hydropower stations with high quality, and make persisting efforts in the joint
optimized scheduling of the basin. (2) Actively promote the development of clean energy and smart
integrated energy business. (3) Continue to develop power distribution and sales businesses, optimize the
stock and seize the increment, constantly expand the construction of incremental distribution network, and
improve the scale of market-based power sale. (4) Continue to focus on investment and merger, and
actively carry out investment and merger of high-quality projects in the upstream and downstream of the
clean energy industry chain while centering on the main responsibilities and main businesses. (5) Actively
and prudently explore the international energy market and consistently expand our international business
strength.
(III) Operational Plan
Applicable

2020 Annual Report
29 / 259
Power generation plan: In 2021, it is predicted that the total inflow water of Xiluodu Reservoir will
be no less than 135.5 billion cubic meters, and that of Three Gorges Reservoir will be no less than 435.3
billion cubic meters. The planned annual power output of the Company's cascade hydropower stations
will reach 202.7 billion kilowatt-hours at favorable distribution of inflow water for power generation.
Power marketing plan: The Company will actively respond to the market situation and make further
efforts in deepening the market concept, strengthening forward-looking research, promoting top-level
design and strictly controlling market risks. Adhering to the benefit as the core, the Company will
effectively complete the consumption of electric energy from mega hydropower stations, and actively
strive to establish a long-term mechanism of large hydropower consumption; The Company will strive for
and implement the priority power generation plan of mega hydropower stations, take multiple measures
to ensure the consumption of electric energy, find a solution for related problems of electric energy
consumption, and promote the realization of the Company's production and operation goals. The Company
will closely center on its own strategic layout, actively explore the market and potential customers,
enhance the market competitiveness comprehensively, and promote the sustainable development of the
Company.
Investment plan: Guided by value creation, the Company will stick to the main responsibilities and
main business, and actively and steadily carry out strategic investment around the business development
direction of clean energy, power distribution and sales and smart integrated energy. The Company will
persist in putting the stock assets to good use, strengthen the management of active market value, and fully
tap the stock equity value by combining the trend of the capital market. The Company will persist in
selecting investment targets by high standards, aim at value investment, long-term investment and large-
proportion equity participation, and make important contributions to the Company's solid start of the "14th
Five-Year Plan" and the sustained growth of both scale and performance.
Financing plan: The Company will continue to closely follow the market trend, formulate financing
strategies in a scientific way, and give play to the advantages of the Company's high credit rating by
accurately grasping the issuance window, selecting superior financing tools, innovating financing methods
and expanding financing channels, so as to further optimize the Company's capital structure and minimize
financing costs.
(IV) Potential Risks
Applicable
1. Risk of water coming from the Yangtze River
Currently, the Company has 4 huge hydropower plants located in the upper and middle reaches of
the Yangtze River. Power generating capacity is closely related to water from reservoir. Water from
watershed is uncertain and the newly built hydropower project in the upper reaches is used to retain water
for the first time. Both electricity production and power generating capacity of the Company may be
affected to a certain extent.
The Company will pay close attention to the influence of meteorological changes on water and rain
levels, strengthen cooperation with hydrologic, meteorological and construction units, continue to improve
the mechanism of sharing information related to reservoirs in the upper reaches of the Yangtze River,
continuously enhance the capability of forecasting and analyzing water and rain levels, deeply develop the
mechanism of cascade joint reservoir dispatchment in the watershed, plan the demands in such areas as
2020 Annual Report
30 / 259
flood prevention, power generation, shipping and water replenishment as a whole and fully exert the
comprehensive benefits of cascade hubs.
2. Production safety risk
All the cascade power stations operated and managed by the Company are the huge hydropower
stations in the main stream of the Yangtze River, carrying out several tasks such as flood prevention,
power generation, shipping and water replenishment under complicated operation conditions; the units
have large capacity and the quantity of the units is big, there are a lot of different types of equipment and
the operation periods are long, it is very difficult to manage the operation of the equipment and there are
heave responsibilities for managing the safety of the dams; the current safety management mode is subject
to the new requirements during the development of the new business; and the safety management system
is not sound and the basis of safe production is weak in some participating enterprises and so the Company
should continue to explore the methods of safety management and control.
The Company will continue to deeply promote the construction of the double prevention mechanism
based on the safety risk management and control in such five aspects as material personal injury and death,
factory premise flooding, large-scale power outages, damage to and destruction of significant equipment
and facilities and material internet information safety events to form the long-term mechanism of safety
management. The Company will further research and identity the safety management and control modes
of the participating and holding enterprises and overseas projects and determine the responsibilities of the
enterprise for safety management; continue to improve the risk management and control measures,
enhance the application of such new technologies and new equipment as information technology and
intelligent diagnosis in safety management and utilize modern technologies in safety management and
control.
3. Risk in the electricity market
Electricity marketization is further accelerated and middle-and-long-term transactions and the spot
market are promoted in depth, and so the Company has to face the influence brought about by the
uncertainty in the external market.
The Company will take proactive actions in the trend of electricity marketization reform, pay great
attention to the change to electricity supply and demands, plan in advance with respect to the influence on
the production and operation of the Company brought about by such uncertain factors arising during the
process of electricity marketization as market-based transactions, spot market and auxiliary service market;
continue to exert its advantages in such aspects as professionalism and policies and closely follow up with
the policies related to the construction of the electricity market; and deepen the internal business
cooperation, enhance the development of the external market, improve and optimize the marketing system
and further raise its competitiveness in the electricity market.
4. Risk in investment management and control
While COVID-19 is spreading, the global economic growth becomes slow and the internal economic
structure is adjusted, the Company is affected by such various factors in the course of outbound investment
as domestic and foreign politics, economy, significant natural disasters, capital market changes and
intensified market competition so that it becomes more difficult for the Company to make outbound
investment and the return on investment may be less than the expected return; and, after completion of
investment, such aspects as regions, culture, policy and way of thinking may be different and M&A
projects may also face risks in management and control and cultural integration to a certain extent.
The Company establishes the regulated investment management system, carries out preliminary
research, due diligence investigation and feasibility study, strictly examine and evaluate such factors as

2020 Annual Report
31 / 259
investment direction, work procedure, investment return indicators and potential risks; continues to pay
attention to changes to domestic and foreign capital and financial market, enhances researches on the trend
of such aspects as exchange rate and interest rate in the relevant regions and selects the appropriate window
period to make investment; and explores the innovative management mode and mechanism to ensure the
flexible and highly-efficient subsequent management of the projects.
IV. Failure to Make Disclosure under the Standards due to the Inapplicability of the Standards to
the Company, State Secrets, Trade Secretes and other Special Reasons
Non-applicable
Section 5 Key Matters
I. Proposal for Profit Distribution to Ordinary Shareholders or for Converting Capital Reserve
into Share Capital
(I) Formulation, execution and adjustments to cash dividend policy
Applicable
The profit distribution of the Company complies with the Articles of Association and the resolutions
of the shareholders’ meeting, the standards and percentages of dividends are definite and clear, the relevant
decision-making procedures and mechanism are sound, the independent directors have given their explicit
opinions, the small and medium shareholders have fully expressed their opinions and claims and their
legitimate rights and interests have been protected.
For the purpose of further regulating cash dividends, improving transparency of cash dividends and
duly protecting investors’ legitimate rights and interests, the Company promulgated the Announcement
concerning Soliciting Investors’ Opinions on Matters related to 2010 Profit Distribution Plan on 27
February 2021 in accordance with the Guidance for Listed Companies on Supervision No.3 – Cash
Dividends of Listed Companies to solicit the investors’ opinions and suggestions on 2020 annual profit
distribution plan of the Company, and reports the same to the Audit Committee of the Board of Directors.
(II) Plan or proposal for dividend distribution to ordinary shareholders, or plan or proposal for
converting capital reserve into share capital of the Company for the recent three years
(including reporting period)
Unit: RMB Yuan
Year of
profit
distribution
Number
of
bonus
shares
per 10
Dividends
per10
shares
(RMB)
(pretax)
Number of
shares
converted
from capital
reserve per
Amount of cash
dividends (pretax)
Net profit
attributable to
ordinary
shareholders of the
listed company on
Percentage
in net profit
attributable
to ordinary
shareholders

2020 Annual Report
32 / 259
shares 10
shares(share)
the consolidated
statement for the
year of profit
distribution
of the listed
company on
the
consolidated
statement
(%)
2020 0 7.0 0 15,919,301,461.00 26,297,890,222.70 60.53
2019 0 6.8 0 14,960,000,000.00 21,543,493,635.57 69.44
2018 0 6.8 0 14,960,000,000.00 22,610,936,420.39 66.16
(III) Share buyback in cash included in cash dividends
Non-applicable
(IV) If the Company has positive profit for the reporting period and the parent has positive profit
available for distribution to ordinary shareholders, but the Company does not have a plan for
profit distribution in cash to ordinary shares, the Company shall disclose the reasons in detail
as well as the purpose and intended use of undistributed profit.
Non-applicable

2020 Annual Report
33 / 259
II. Performance of Commitments
(I) Commitments of the Company and its effective controller, shareholders, related parties, acquirers that were made in or continued into the reporting
period
Applicable
Background of
commitment
Type of
commitment
Commitment
made by Content of Commitment
Date and
term of
commitment
Whether
there is time
limit for
performance
Whether
commitment
is performed
strictly in a
timely
manner
Undertakings
related to
material
asset
restructuring
Asset
injection
China Three
Gorges
Corporation
Relevant agreements and undertakings of China Three Gorges Corporation and the Company in
the Report of China Yangtze Power Co., Ltd. on Material Asset Purchase and Affiliated
Transactions: 1. As the relevant disposal formalities of certain lands of TGDC have not been
completed, China Three Gorges Corporation and the Company agree that China Three Gorges
Corporation will sell 100% equity interests of TGDC to the Company when the relevant
transaction conditions are satisfied and the Company undertakes to purchase such equity
interests; 2. According to the Agreement on Material Asset Restructuring and the Agreement on
Assuming Three Gorges Bonds between the Company and China Three Gorges Corporation, the
Company agrees to assuming the rights and obligations of the issuer specified in the bonds issue
documents of the four traches of Three Gorges Bonds of China Three Gorges Corporation,
namely 99, 01, 02 and 03 traches and the outstanding principal of the target Three Gorges Bonds
not repaid at 0:00 on the closing and the payable interests of the bonds from the last interest
payment date to 0:00 on the closing date from 0:00 on the closing date, and undertakes to perform
the payment obligation according to the original terms and conditions in the issue documents of
the target Three Gorges Bonds. China Three Gorges Corporation undertakes that China Three
Gorges Corporation will perform the corresponding payment obligation to the investors who
require China Three Gorges Corporation to continue to perform the payment obligation; 3. China
From 9
Aug 2009,
long term
effective
No Yes
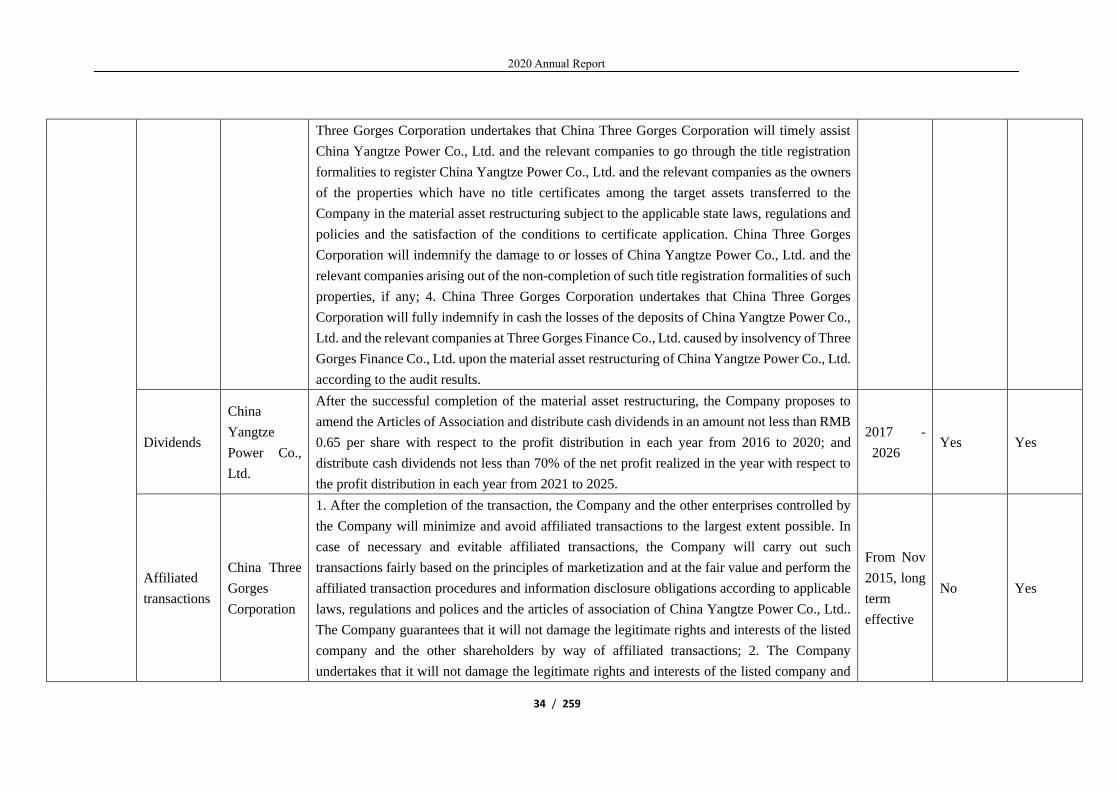
2020 Annual Report
34 / 259
Three Gorges Corporation undertakes that China Three Gorges Corporation will timely assist
China Yangtze Power Co., Ltd. and the relevant companies to go through the title registration
formalities to register China Yangtze Power Co., Ltd. and the relevant companies as the owners
of the properties which have no title certificates among the target assets transferred to the
Company in the material asset restructuring subject to the applicable state laws, regulations and
policies and the satisfaction of the conditions to certificate application. China Three Gorges
Corporation will indemnify the damage to or losses of China Yangtze Power Co., Ltd. and the
relevant companies arising out of the non-completion of such title registration formalities of such
properties, if any; 4. China Three Gorges Corporation undertakes that China Three Gorges
Corporation will fully indemnify in cash the losses of the deposits of China Yangtze Power Co.,
Ltd. and the relevant companies at Three Gorges Finance Co., Ltd. caused by insolvency of Three
Gorges Finance Co., Ltd. upon the material asset restructuring of China Yangtze Power Co., Ltd.
according to the audit results.
Dividends
China
Yangtze
Power Co.,
Ltd.
After the successful completion of the material asset restructuring, the Company proposes to
amend the Articles of Association and distribute cash dividends in an amount not less than RMB
0.65 per share with respect to the profit distribution in each year from 2016 to 2020; and
distribute cash dividends not less than 70% of the net profit realized in the year with respect to
the profit distribution in each year from 2021 to 2025.
2017 -
2026 Yes Yes
Affiliated
transactions
China Three
Gorges
Corporation
1. After the completion of the transaction, the Company and the other enterprises controlled by
the Company will minimize and avoid affiliated transactions to the largest extent possible. In
case of necessary and evitable affiliated transactions, the Company will carry out such
transactions fairly based on the principles of marketization and at the fair value and perform the
affiliated transaction procedures and information disclosure obligations according to applicable
laws, regulations and polices and the articles of association of China Yangtze Power Co., Ltd..
The Company guarantees that it will not damage the legitimate rights and interests of the listed
company and the other shareholders by way of affiliated transactions; 2. The Company
undertakes that it will not damage the legitimate rights and interests of the listed company and
From Nov
2015, long
term
effective
No Yes

2020 Annual Report
35 / 259
the other shareholders by utilizing the position of the listed company as the holding shareholder;
3. The Company will desist from occupying funds and capital of the listed company for the
purposes other than operation; and will not require the listed company to provide any guarantee
of any form to the Company and the other enterprises controlled by the Company without
approval of the shareholders’ meeting; and 4. The Company guarantees that it will indemnify the
listed company and its subsidiaries for the damage or losses or expenditures incurred by them
due to the breach of the undertakings by the Company.
Competition
China Three
Gorges
Corporation
1. Currently, the Company and the other enterprises directly or indirectly controlled by the
Company are not involved in the business materially competitive with the main business of China
Yangtze Power Co., Ltd. and do not directly or indirectly operate or operate for others any
business materially competitive with the main business of China Yangtze Power Co., Ltd. by
such ways as investment and holding shares, participation, joint venture and joint operation; 2.
For the purpose of avoiding the material competition between the Company and the other
enterprises controlled by the Company and the listed company and its subsidiaries, the Company
undertakes that it will not directly or indirectly be involved in, participate in or assist others in
carrying out the business or other operating activities materially competitive with the business
of the listed company and its subsidiaries in any form (including but not limited to independent
or joint venture, cooperation, joint operation, investment, M&A and trusted operation), and will
do the best to procure the other enterprises controlled by the Company to comply with the same
obligations as the undertakings of the Company; and 3. The Company undertakes that it will
indemnify the listed company and its subsidiaries for the damage or losses or expenditures
incurred by them due to the breach of the undertakings by the Company.
From Nov
2015, long
term
effective
No Yes
Others
China Three
Gorges
Corporation
I. Independence of personnel of the listed company: 1. Such officers of the listed company as
general manager, vice general manager, chief finance officer and secretary to the board of
directors of the listed company shall work for the listed company as full-time staff and receive
remuneration from the listed company and not work for the Company and its affiliated natural
persons, affiliated enterprises or affiliated legal persons (collectively as the “Company and its
From Nov
2015, long
term
effective
No Yes
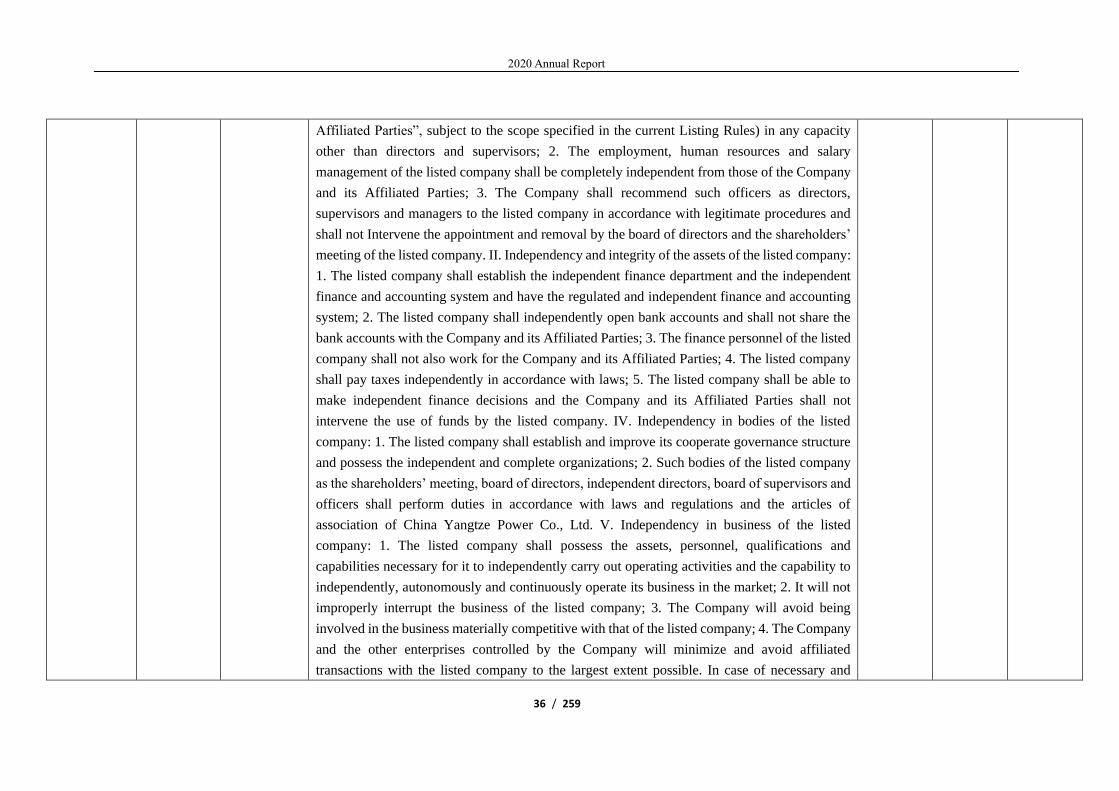
2020 Annual Report
36 / 259
Affiliated Parties”, subject to the scope specified in the current Listing Rules) in any capacity
other than directors and supervisors; 2. The employment, human resources and salary
management of the listed company shall be completely independent from those of the Company
and its Affiliated Parties; 3. The Company shall recommend such officers as directors,
supervisors and managers to the listed company in accordance with legitimate procedures and
shall not Intervene the appointment and removal by the board of directors and the shareholders’
meeting of the listed company. II. Independency and integrity of the assets of the listed company:
1. The listed company shall establish the independent finance department and the independent
finance and accounting system and have the regulated and independent finance and accounting
system; 2. The listed company shall independently open bank accounts and shall not share the
bank accounts with the Company and its Affiliated Parties; 3. The finance personnel of the listed
company shall not also work for the Company and its Affiliated Parties; 4. The listed company
shall pay taxes independently in accordance with laws; 5. The listed company shall be able to
make independent finance decisions and the Company and its Affiliated Parties shall not
intervene the use of funds by the listed company. IV. Independency in bodies of the listed
company: 1. The listed company shall establish and improve its cooperate governance structure
and possess the independent and complete organizations; 2. Such bodies of the listed company
as the shareholders’ meeting, board of directors, independent directors, board of supervisors and
officers shall perform duties in accordance with laws and regulations and the articles of
association of China Yangtze Power Co., Ltd. V. Independency in business of the listed
company: 1. The listed company shall possess the assets, personnel, qualifications and
capabilities necessary for it to independently carry out operating activities and the capability to
independently, autonomously and continuously operate its business in the market; 2. It will not
improperly interrupt the business of the listed company; 3. The Company will avoid being
involved in the business materially competitive with that of the listed company; 4. The Company
and the other enterprises controlled by the Company will minimize and avoid affiliated
transactions with the listed company to the largest extent possible. In case of necessary and

2020 Annual Report
37 / 259
evitable affiliated transactions, the Company will carry out such transactions fairly based on the
principles of marketization and at the fair value and perform the affiliated transaction procedures
and information disclosure obligations according to applicable laws, regulations and polices and
the articles of association of China Yangtze Power Co., Ltd..
Other
undertakings
Competition
China Three
Gorges
Corporation
For the purpose of avoiding possible competition, China Three Gorges Corporation, the holding
shareholder, issued the Letter of Undertaking on Avoiding Competition before the issuance and
listing of the company, undertaking that China Three Gorges Corporation will not directly or
indirectly carry out any business that is or may be competitive with the main business of the
company specified in its business license both at home and abroad and procure its subsidiaries
not to carry out any business that is or may be directly or indirectly competitive with the main
business of the company when it is the controlling shareholder of the company.
From 26
Aug 2001,
long term
effective
No Yes
2020 Annual Report
38 / 259
(II) If any profit forecast exists for an asset or project of the Company, and the reporting period
falls into the forecast period, the Company should specify whether the asset or project meets
the profit forecast and provide reasons
Non-applicable
(III) Realization of guaranteed performance and its impact on goodwill impairment test
Non-applicable
III. Misappropriation of Funds during the Reporting Period and Developments in Recovery
Non-applicable
IV. Explanation of Non-standard Auditor’s Opinions
Non-applicable
V. Analysis of Reasons of Changes in Accounting Policies and Accounting Estimates or Correction
to Significant Accounting Errors and Their Impact
(I) Analysis of reasons and impact of changes in accounting policies and accounting estimates of
the Company
applicable
Changes in accounting policies
and their reasons Approval procedure
Remark (the account name and amount which
have been significantly influenced)
The Ministry of Finance
amended and published the
“Accounting Standards for
Business Enterprises No. 14 –
Revenue” (Cai Kuai [2017]
No.22)( the “New Revenue
Standards”)
The change in relevant
accounting policy has
been considered and
approved in the fifteenth
meeting of the fifth
session of the Board of
Directors of the
Company.
The Company applied the New Revenue
Standard from 1 January 2020 and made
disclosures in the financial statements
according to the requirements under such
standard. The opening retained profits and
other relevant items in the financial
statements will be adjusted while the
information in respect of the comparable
period will not be adjusted. The application
of the above new standard will not have
substantial impacts on the financial
statements of the Company.
(II) Analysis of reasons for correction to significant accounting errors and its impact
Non-applicable

2020 Annual Report
39 / 259
(III) Communication with the former auditor
Non-applicable
(IV) Other information
Non-applicable
VI. Appointment and Removal of Auditor
Unit: RMB Yuan
Current
Name of domestic auditor ShineWing Certified Public Accountants LLP
Compensation of domestic auditor 3,150,000
Years of service of domestic auditor 5
Name Compensation
Internal control auditor Grant Thornton LLP (致同会计师事
务所(特殊普通合伙))
499,825
Explanation of appointment and removal of the auditor
Non-applicable
Change in auditor during the audited period
Non-applicable
VII. Potential Risk of Suspension in Listing
(I) Reason giving rise to suspension in listing
Non-applicable
(II) Proposed countermeasures
Non-applicable
VIII. Circumstance in Which the Company Faces De-listing and Reasons
Non-applicable
IX. Bankruptcy Reorganization Related Issues
Non-applicable
X. Material Litigation and Arbitration
The Company has no any material litigation or arbitration during the year

2020 Annual Report
40 / 259
XI. Punishments upon the Listed Company and its Directors, Supervisors, Senior Management,
Controlling Shareholder, Beneficial Owner, Acquirer and Rectifications
Non-applicable
XII. Credibility of the Company and its Controlling Shareholder and Effective Controller during
the Reporting Period
Non-applicable
XIII. Share Incentive Plan, Employee Stock Option Plan or Other Employee Incentive Measures
and Their Impact
(I) Incentives disclosed in provisional announcements and with no subsequent development or
change in implementation
Non-applicable
(II) Incentives not disclosed in provisional announcements or with subsequent development
Particulars of equity incentives
Non-applicable
Other information
Non-applicable
Particulars of employee stock option plan
Non-applicable
Other incentive measures
Non-applicable
XIV. Material connected transactions
(I) Connected transaction in ordinary course of operations
1. Events disclosed in provisional announcements and without subsequent development or change
in implementation
Non-applicable
2. Events disclosed in provisional announcements but with subsequent development or change in
implementation
Non-applicable
3. Events not disclosed in provisional announcements
Non-applicable

2020 Annual Report
41 / 259
(II) Connected transactions in asset or equity acquisition or disposal
1. Events disclosed in provisional announcements and without subsequent development or change
in implementation
Applicable
Overview Details available at
On 28 August 2020, the Company disclosed the Public Announcement on
Transferring 2% Ordinary Shares of Beijing Enterprises Water Group Limited by
Agreement and Affiliated Transactions and the Company transferred 200,422,000
ordinary shares of Beijing Enterprises Water Group Limited (0371.HK) held by it
at the average price of HK$4.3072/share (with the total consideration being
HK$863,257,638.40) by agreement at the price of the investment cost to Yangtze
Ecology and Environment (HK) Limited, the wholly-owned subsidiary of Yangtze
Ecology and Environment Co., Ltd in Hong Kong, the wholly subsidiary of China
Three Gorges Corporation, through China Yangtze International, the wholly
subsidiary of the Company, as the platform, accounting for about 2% of the total
equity capital of Beijing Enterprises Water Group Limited.
For details, please see
Announcement No. 2020-052 on
SSE website
(http://www.sse.com.cn)
On 28 August 2020, the Company disclosed the Public Announcement on
Introducing Joint Investors to the South America Electricity Distribution Project
and Affiliated Transactions. On 23 December 2020, the Company disclosed the
Public Announcement on the Progress of the Project of Introducing Joint Investors
to the South America Electricity Distribution Project and Affiliated Transactions,
pursuant to which the parties completed the closing as agreed in the agreement.
(Please refer to “II(VI) Sale of Material Assets and Equity Interests” in Section IV
(Discussion and Analysis on Operation) of this Report for the summary of the
transaction.)
For details, please see
Announcements No. 2020-050,
2020-056 and 2020-078 on SSE
website (http://www.sse.com.cn)
2. Events disclosed in provisional announcements but with subsequent development or change in
implementation
Non-applicable
3. Events not disclosed in provisional announcements
Non-applicable
4. In case of any guaranteed performance, whether the performance is achieved for the reporting
period shall be disclosed.
Non-applicable

2020 Annual Report
42 / 259
(III) Material connected transactions in joint external investments
1. Events disclosed in provisional announcements and without subsequent development or change
in implementation
Applicable
Overview Details available at
On 28 August 2020, the Company disclosed the Public Announcement on Capital
Increase of Three Gorges Electric Energy Co., Ltd. and Affiliated Transactions. For the
purpose of meeting the demands of the relevant investment projects of Three Gorges
Electric Energy Co., Ltd. For funds, the original shareholders of Three Gorges Electric
Energy Co., Ltd.(the Company and Three Gorges Capital Holding Co., Ltd.) increase
the capital of Three Gorges Electric Energy Co., Ltd.by RMB 1,000,000,000 by two
tranches by way of non-public agreement, after which the registered capital of Three
Gorges Electric Energy Co., Ltd.is creased from RMB 1,000,000,000 to RMB
2,000,000,000. The subject matter of the transaction is 100% equity interests of Three
Gorges Electric Energy Co., Ltd. after capital increase and capital stock expansion
which is RMB 1,000,000,000. The Company contributes RMB 700,000,000,
accounting for 70% equity interests after capital increase and capital stock expansion.
For details, please see
Announcements No. 2020-051
on SSE website
(http://www.sse.com.cn)
2. Events disclosed in provisional announcements but with subsequent development or change in
implementation
Non-applicable
3. Events not disclosed in provisional announcements
Non-applicable
(IV) Amounts due to or from related parties
For details, refer to Note “Related parties and connected transactions” to 2020 financial statements.
(V) Other information
Non-applicable
XV. Material Contracts and Their Performance
(I) Custody, contracting and lease
1. Custody
Non-applicable
2. Contracting
Non-applicable

2020 Annual Report
43 / 259
3. Lease
Non-applicable
(II) Guarantees
Applicable
Unit: RMB Yuan
Guarantees provided for external parties (except those for subsidiaries)
The
guarantor
Relatio
n of the
guarant
or to
the
listed
compa
ny
The
guarantee
d
Guaranteed
amount
Date of
guarante
e
(agreem
ent
signing
date)
Commence
ment date
Endi
ng
date
Type of
guarant
ee
Guarant
ee
perform
ed or
not
Overd
ue or
not
Overd
ue
amoun
t
Counter
guarante
ed or not
Related
party
guarant
ee or
not
Relatio
n to the
Compa
ny
Hanzhong
Ninth
Metallurgi
cal
Constructi
on Co.,
Ltd.
Mian
County
Urban and
Rural
Infrastruct
ure
Constructi
on Co.,
Ltd.
251,468,00
0.00
Nov
2019
Nov 2019 Nov
202
5
/
Cumulative amount of guarantees provided during the reporting period
(excluding those for subsidiaries )
Total balance of guarantees at end of the reporting period (A) (excluding those
for subsidiaries)
251,468,000.00
Guarantees provided by the Company and its subsidiaries to subsidiaries
Cumulative amount of guarantees provided for subsidiaries during the reporting
period
22,445,656,000.00
Total balance of guarantees provided for subsidiaries at end of the reporting
period (B)
1,892,221,000.00
Total amount of guarantees provided by the Company (including those provided for subsidiaries)
Total amount of guarantees (A+B) 2,143,689,000.00
Ratio of total amount of guarantees to net assets of the Company (%) 1.20
Including:
Amount of guarantees provided for shareholders, effective controller and their
related parties (C)
251,468,000.00
Amount of guarantees provided directly or indirectly to secure debts of the
guaranteed with a assets-liabilities ratio over 70% (D)
251,468,000.00

2020 Annual Report
44 / 259
Total amount of guarantees in excess of 50% of net assets (E)
Total of the above three types of guarantees (C+D+E) 251,468,000.00
Description of possible joint and several liability for unexpired
guarantees
Description of guarantees During the year, the Company has provided
guarantees for an internationally syndicated
loan of US$3,440 million to its wholly-owned
subsidiary YP International. As at 31 December
2020, the balance of the international syndicated
loan was US$290 million and was translated at
an exchange rate of US$1 = RMB6.5249.
(III) Particulars of cash under discretionary management
1. Assets under discretionary management
(1) Overview of assets under discretionary management
Non-applicable
Other information
Non-applicable
(2) Details of single assets under discretionary management
Non-applicable
Other information
Non-applicable
(3) Provision for impairment of assets under discretionary management
Non-applicable
2. Particulars of entrusted loans
(1) Overview of entrusted loans
Non-applicable
Other information
Non-applicable
(2) Details of single entrusted loans
Non-applicable
Other information
Non-applicable
2020 Annual Report
45 / 259
(3) Entrusted loan impairment provision
Non-applicable
3. Other information
Non-applicable
(IV) Other material contracts
Applicable
On 5 June 2020, the Company, as the seller, and the Central China Branch of State Grid, as the
purchaser, concluded the 2020 Gezhouba Dam Power Station Electricity Purchase and Sale Contract.
On 30 December 2020, the Company, as the seller, and State Grid, as the purchaser, concluded the
2020 Supplementary Agreement on Electricity Purchase and Sale of Three Gorges Hydropower Station.
On 30 December 2020, the Company, as the seller and China Southern Power Grid Company Limited,
as the purchaser and State Grid, as the transmitter, concluded the 2020 Supplementary Agreement on
Electricity Purchase and Sale and Transmission of Three Gorges Hydropower Station.
On 30 December 2020, Yongshan Xiluodu Power Plant of Chuanyun Company, as the seller, and
State Grid, as the purchaser, concluded the 2020 Xiluodu Zuo’an Power Station Electricity Purchase and
Sale Contract.
On 30 December 2020, Yongshan Xiluodu Power Plant of Chuanyun Company, as the seller, and
Super High Electricity Power Transmission Company of China Southern Power Grid Company Limited,
as the purchaser, concluded the 2020 Xiluodu Zuo’an Power Station Electricity Purchase and Sale
Contract.
On 30 December 2020, Yibin Xiangjiaba Dam Power Plant of Chuanyun Company, as the seller, and
State Grid, as the purchaser, concluded the 2020 Xiangjiaba Dam Power Station Electricity Purchase and
Sale Contract
XVI. Explanations of other material matters
Applicable
Pursuant to the Approval of the China Securities Regulatory Commission on the Approval of the
Offering of Global Depositary Receipts by China Yangtze Power Company Limited and the Listing on
the London Stock Exchange (Zheng Jian Xu Ke [2020] No. 2288) and the approval of relevant domestic
and overseas regulatory authorities, the Company completed the GDR offering on 19 October 2020,
issuing a total of 74,185,923 GDRs (including over-allotment of 5,085,923 GDRs) at an offer price of
$26.46 per share for gross proceeds of USD1,962,959,522.58. After deducting expenses of
US$7,229,354.04 in connection with the offering, the actual net proceeds raised were
USD1,955,730,168.54.
According to the use of proceeds disclosed in the Company's GDR prospectus, the proceeds, after
deduction of relevant offering expenses, would be used to refinance the relevant international syndicated
loan related to the acquisition of equity interest in Luz Del in Peru by China YP International (Hong Kong)
Limited, a wholly-owned subsidiary of the Company, and to supplement the Company's working capital.
As at 31 December 2020, the Company had utilised USD1,955,360,594.77 of the proceeds, representing

2020 Annual Report
46 / 259
99.98% of the net proceeds, and the remaining USD369,573.77 of the proceeds will be used for
management fees for subsequent GDR-related matters and to supplement working capital.
XVII. Particulars on Efforts Regarding Positive Performance of Social Responsibility
(I) Poverty alleviation efforts of the listed company
Applicable
1. Targeted poverty alleviation plan
Applicable
Guiding idea: studying and implementing in depth General Secretary Xi Jinping’s strategic thinking
on poverty alleviation and development and the spirit of the Central Poverty Alleviation Work Conference,
upholding the "Four Ones" concept, i.e. "building a power station, driving the economy of one side,
improving the environment, and benefiting a group of immigrants", well conducting paired assistance in
reservoir areas, targeted poverty alleviation counties and poverty-stricken areas, and improving the
accuracy and effectiveness of paired assistance through overall deployment, layer-by-layer promotion,
and on-site guidance, and making positive contributions to the sustainable development of China’s
economy, creating a good social environment for the safe and stable operation of the power stations of the
Company.
Overall goal: improving the ability of poor households in generating income, cultivating the ability
of poor households in self-development, and assisting local governments in consolidating the results of
poverty alleviation while eliminating absolute poverty, and ensuring that the people who have been lifted
out of poverty really get out of poverty and do not return to poverty based on the resource characteristics
and development reality of poverty stricken areas with the goal of reducing the vulnerability of poor
households and enhancing the resilience of poverty alleviation through various means such as medical
care guarantee, education and income increase by way of tourism and consumption.
Main tasks: carrying out targeted assistance and assistance in reservoir areas, improving the
infrastructure construction in paired assistance areas, and providing support in science and technology,
transportation, education, electricity, health and other similar aspects.; providing volunteer services to left-
behind children, left-behind women, left-behind elderly and the disabled and implementing key donations
and temporary assistance; carrying out industrial poverty alleviation, developing local characteristic
industries, and strengthening the endogenous motivation of poverty alleviation in poverty-stricken areas;
striving to form a batch of poverty alleviation projects with good social impact in all areas of the Company
and establishing a corporate social responsibility brand .
Guarantee measures: establishing a poverty alleviation organization system in which the main leaders
personally participate, the members of the poverty alleviation leading group regularly dock, the cadres to
coordinate and promote, the full-time staff serve as the first secretary of the village, the leader of the
poverty alleviation work team and the team members stay in the village to help all the year, and
establishing a life-cycle poverty alleviation project management mechanism of "field research, plan
formulation, project implementation, and evaluation and assessment" based on the principles of “seeking
truth from facts, adapting measures to local conditions, classified guidance, and targeted poverty
alleviation” to continuously improve the standardization and effectiveness of poverty alleviation work,
and ensuring the implementation and execution of various poverty alleviation work.

2020 Annual Report
47 / 259
2. Overview of targeted poverty alleviation efforts for the year
Applicable
Summary of the targeted poverty alleviation work of the Company in 2020: currently, the Company
has fulfilled all of its main tasks and goals of targeted poverty alleviation in reservoir areas, targeted
poverty counties and paired assistance regions. It has 48 poverty alleviation projects within an investment
of RMB 213,000,000. The Company proactively organized Wushan and Fengjie to train the poverty
alleviation cadres and technical personnel. 2807 cadres at the basic level and 2358 technicians have
participated in the trainings. The Company proactively assist the Group in introducing the fee support
funds of RMB 35,660,000 provided by such institutions as China Poverty Alleviation Foundation in the
two countries and rolled out such projects in the two counties as assistance for teenagers’ major and serious
diseases, 100 villages dorms project and China’s rural credit cooperatives; purchased the agricultural and
sideline products of RMB 10,170,000 sold badly due to the epidemic and help Wushan and Fengjie in
selling such products as plums and oranges of RMB 25,590,000, effectively helping the poor households
in increasing income.
3. Achievements in targeted poverty alleviation
Applicable
Unit: RMB’0,000 Yuan
Indicators Quantity and details
I. Overview
Including, 1. Funds 21,267.5
2. Number of registered poverty-stricken
people receiving help lifted out from poverty
800
II Investment by item
1. Poverty alleviation through industrial development
Including,
1.1 Type of poverty alleviation program through
industrial development
✓ Poverty alleviation through agricultural
and forestry industry
✓ Poverty alleviation through tourism
Poverty alleviation through e-commerce
Poverty alleviation through tourism
Poverty alleviation through science and
technology
Others
1.2 Number of poverty alleviation programs
through industrial development (program)
10
1.3 Funds invested in poverty alleviation
programs through industrial development
5,350
1.4 Number of registered poverty-stricken
people receiving help lifted out from poverty (person)
500
2. Poverty alleviation through employment transfer

2020 Annual Report
48 / 259
Including, 2.1 Funds invested in vocational
skill training
363
2.2 Number of people receiving vocational
skill training (person/time)
2,358
2.3 Number of registered poverty-stricken
people receiving help in employment (person)
50
3. Poverty alleviation through education
Including, 3.1
Funds invested in supporting poverty-stricken
students
245
3.2 Number of subsidized poverty-stricken
students
500
3.3 Funds invested in improving educational
resources in poverty-stricken areas
1,729
4. Poverty alleviation in health domains
Including, 4.1 Funds invested in medical and health
resources in poverty-stricken areas
7,380
5. Poverty alleviation through ecological protection
Including, 5.1
Program name
✓ Ecological protection and construction
Establishing way of compensation for
ecological protection
Establishing ecological public welfare
post
Others
5.2 Investment amount 500
6. Other programs
6.1 Including: Number of 17
6.2 Investment amount 5,700.5
6.3 Number of registered poverty-stricken
people receiving help lifted out from poverty
250
III. Awards Received (content, rank)
4. Subsequent targeted poverty alleviation plan
Applicable
2021 is the first year for China to begin the new journey of comprehensively constructing a socialism
modern country, a year when overall liberation from poverty and rural vitalization and also the first year
of the “14th five year plan” of the Company. The Company will promote the various tasks related to social
responsibilities at a higher position and with bigger determination and greater strength, continue the
subsequent assistance after poverty liberation, construct a new poverty government system, smoothly link
poverty alleviation and rural vitalization and help people in difficulties in leaping from “getting out of
poverty” to “becoming rich”.
2020 Annual Report
49 / 259
The Company will further enhance organization and leadership, establish and improve working
mechanism, transfer the organization and talent resources of the enterprise into the resources for
performing duties, exert the advantages of the Company in its main business and optimize development
quality and drive the local economic development through its high-quality development. The Company
will work together with targeted poverty assistance counties and poverty stricken regions to jointly
promote rural vitalization, focus on key projects in industrial poverty assistance, cultivate and expand the
advantageous industries with rural characteristics in poverty assistance regions, construct the steady and
long-term poverty liberation mechanism and form the brand demonstration effects of industrial projects.
The Company will integrate in depth the business advantages with the resources in the reservoir regions
and the poverty assistance regions in combination of the development strategy of “one main task and two
auxiliary tasks” of the Company, creating good social environment for the operation of the power stations
of the Company, providing supports to the new business development, and organically combining social
responsibilities and strategic development of the Company.
(II) Corporate social responsibility
Applicable
Refer to CSR report for details.
(III) Environmental Information
1. Explanation of environmental protection information of companies and their important
subsidiaries on the watch list of key pollutant discharging units published by the environmental
protection authority
Non-applicable
2. Explanation of environmental protection information of companies not on the watch list of key
pollutant discharging units
Applicable
The Company is mainly engaged in the hydropower business which effectively replaces the use of
fossil energy and materially reduces the release of pollutant and greenhouse gases. According to the
Administration Regulations on the List of Key Pollutant Discharge Units (For trial) promulgated by the
Ministry of Ecology and Environment and the other applicable laws and regulations, the Company is not
the key pollutant discharge unit.
In 2020, the Company strictly followed the laws and regulations on environment protection, fully
performed its responsibilities as an enterprise and completed the environment protection tasks in high
quality. There is no sudden environment event or penalty due to violation of environment-related laws in
the whole year.
The cascade power stations of the Company have played an active role in aspects like electricity
supply guarantee during the epidemic, reduction of emissions of pollutants and grid operation safety
guarantee and the comprehensive benefits of biological and environment protection are fully exerted.
(1) Producing clean electricity highly effectively and helping realization of the goal of “peak carbon
dioxide emissions and carbon neutrality”

2020 Annual Report
50 / 259
In 2020, the Company overcome the impacts of the epidemic and proactively guaranteed the supply
of clean electricity and the accumulated electricity generated by the cascade power stations in the whole
year was 226,930,000,000kw, reaching a new record high, among which the Three Gorges Power Station
generated 111,802,000,000kwh, setting a world record with respect to the annual electricity output of a
single power station.
The clean electricity of 226,930,000,000kw will reduce the standard coal of 69,531,400 tons, reduce
CO2 discharge of 190,167,300 tons, reduce SO2 discharge of 42,400 tons and reduce Nitrogen oxides of
44,300 tons, setting an example and making contribution for the realization of the goal of “peak carbon
dioxide emissions and carbon neutrality” in the whole society.
(2) Implementing “multiple water governance” and exerting the biological and environment
protection comprehensive benefits of power stations.
With respect to the operation of cascade reservoirs, the organic link of such aspects as water
environment, water biologics, water resources, water safety, water culture and shoreline were
comprehensively considered to fully exert the comprehensive benefits.
“Precision dispatch” promoted water conservation for generation. In 2020, the forecast precision of
the cascade reservoir for 24 hours reached 98%, the accumulated electricity generated by water
conservation is 9,856,000,000kwh and the water utilization growth rate is 4.54%. The accumulated flood
blocked and stored by the cascade reservoir was about 36,000,000,000m3, the highest in the history.
"Ecological Dispatch" continued to improve the water ecological environment. During the Xiluodu-
Xiangjiaba-Three Gorges joint hydrological process ecological regulation experiment conducted in late
May, the cumulative fish spawning scale was about 533 million; the first Three Gorges Reservoir’s viscous
egg fish natural reproduction ecological regulation experiment was carried out, which had a good effect
on the spawning and hatching of carp and crucian in the tributary of the reservoir area. The previous
ecological regulation experiments have promoted the matching of the discharge flow and water
temperature of the reservoir with the upstream and downstream water ecological environment, and
continued to promote the reproduction of natural fish in the Yangtze River and the improvement of the
water ecological environment.
"Water replenishment dispatch" guaranteed comprehensive water demand. Under the premise of
meeting flood control and power generation, the Company fully considered the comprehensive water
demand of downstream ecology, shipping and coastal city life production, increased the discharge flow
during dry seasons, and ensured the ecological base flow. In 2020, the water supply of cascade reservoirs
reached 31.183 billion cubic meters, fully realizing the goal of ecological flow control.
In addition, the company carried out the upgrading of sewage treatment facilities and the
reinforcement of sewage pipe network in the dam area, and carried out the bleaching of floating objects
in front of the dam to protect the "clear water of the Yangtze River.
(3)Adhering to the green development road
In addition to the main business of large hydropower operation, the Company actively explored the
path of green development, jointly promoted the construction and operation of the Three Gorges shore
power trial zone with State Grid Corporation, and explored business models such as intelligent operation
and maintenance of ships along the Yangtze River, charging and swapping services, and battery leasing,
and the world’s first pure electric vehicle with electricity tourist passenger ships created together with
Yichang Jiaotong Group have entered the construction stage; the total investment in biomass energy
business projects has exceeded 160 million yuan. The Company was also actively exploring new business

2020 Annual Report
51 / 259
projects such as integrated energy, distributed energy, optical storage and charging, and smart energy to
further improve the efficiency of resource and energy utilization.
3. Reason why companies not on the watch list did not disclose environmental information
Non-applicable
4. Explanation of subsequent development or changes of environmental information disclosed in
the reporting period
Non-applicable
(IV) Other information
Non-applicable
XVIII. Particulars of Convertible Bonds
Non-applicable
Section 6 Changes in Ordinary Shares and Shareholders
I. Changes in Ordinary Share Capital
(I) Changes in ordinary shares
1. Table of changes in ordinary shares
Unit: Shares
Before change Change (+, -) After change
Number of
shares
Percentage
(%)
New shares
issued Sub-total
Number of
shares
Percentage
(%)
I. Restricted shares - - - - - -
II. Unrestricted shares
outstanding
22,000,000,000 100.00 741,859,230 741,859,230 22,741,859,230 100.00
1. RMB ordinary shares 22,000,000,000 100.00 741,859,230 741,859,230 22,741,859,230 100.00
2. Domestic-listed
foreign shares
-
3. Overseas-listed
foreign shares
-
4. Others
III. Total number of
ordinary shares
22,000,000,000 100.00 741,859,230 741,859,230 22,741,859,230 100.00

2020 Annual Report
52 / 259
2. Explanation of changes in ordinary shares
Applicable
The GDRs issued by the Company through "Shanghai-London Stock Connect" were listed on the
London Stock Exchange on 30 September 2020. Before the exercise of the over-allotment option, a total
of 69,100,000 GDRs were issued, representing 691,000,000 A-shares of the Company. After this issue
and before the exercise of the over-allotment option, the total share capital of the Company changed to
22,691,000,000 shares.
As a result of partial exercise of the over-allotment option by UBS AG London Branch (as the Price
Stabilization Manager) as agreed in the prospectus, the Company issued additional 5,085,923 GDRs,
representing 50,859,230 A shares of the Company, which were listed on the Shanghai Stock Exchange on
19 October 2020 (Beijing time). The total share capital of the Company were changed to 22,741,859,230
shares after the listing.
3. Impact (if any) of changes in ordinary shares on EPS, net assets per share and other financial
indicators for the latest year and the latest period
Applicable
During the reporting period, the Company issued a total of 74,185,923 GDRs, representing a total of
741,859,230 underlying A shares, which increased the total number of shares of the Company from
22,000,000,000 shares to 22,741,859,230 shares. The above new shares accounted for 3.26% of the total
number of shares of the Company and had no material impact on the earnings per share and net assets per
share of the Company.
4. Other information disclosure which the Company deems necessary or is required by the
securities regulatory authority
Non-applicable
(II) Particulars of changes of restricted shares
Non-applicable
II. Securities Offering and Listing
(I) Securities offering during the reporting period
Applicable
Unit: Share Currency: RMB Yuan
Class of stocks
and derivative
securities
Date of offer
Offer price
(or interest
rate)
Offer quantity Listing date
Quantity
Admitted for
trading
Trading
close date
Exchange bonds, warrant bons, corporate bonds
Corporate
bonds
8 Jan 2020 3.37% RMB1.5 billion 14 Jan 2020 RMB1.5
billion
8 Jan 2023
Corporate 8 Jan 2020 3.70% RMB0.5 billion 14 Jan 2020 RMB0.5 8 Jan 2025

2020 Annual Report
53 / 259
bonds billion
Other derivative securities
GDRs 23 Sep 2020 USD26.46 69,100,000
GDRs3
30 Sep 2020 69,100,000
GDRs
-
GDRs 23 Sep 2020 USD26.46 5,085,923
GDRs
19 Oct 2020 5,085,923
GDRs
-
Description of securities issued during the reporting period (for bonds with different interest rates during
its term, please specify separately):
Applicable
With the approval of the CSRC and the UK Financial Conduct Authority, on 30 September 2020,
69,100,000 GDRs through "Shanghai-London Stock Connect" were listed on the London Stock Exchange,
with each GDR representing 10 A shares in the Company and the corresponding 691,000,000 underlying
A shares were listed on SSE. On 19 October 2020, as a result of partial exercise of the over-allotment
option by the Price Stabilization Manager, the Company issued additional 5,085,923 GDRs and the
corresponding 50,859,230 additional underlying A shares were listed on the Shanghai Stock Exchange. In
total, the Company issued 74,185,923 GDRs, representing 741,859,230 underlying A shares.
On 8 January 2020, the Company issued "Publicly Offered 2020 Corporate Bonds (Tranche I) of
China Yangtze Power Co., Ltd." to eligible investors at an issue price of RMB100 per bond. The bonds
are divided into two varieties: Variety 1 is RMB1.5 billion, 3-year, 3.37%, with short name of "20 CYPC
01" and bond code of "163096", listed on 14 January 2020 and maturing on 8 January 2023; Variety 2 is
RMB0.5 billion, 5-year, 3.70%, with short name of "20 CYPC 02" and bond code of "163097", listed on
14 January 2020 and maturing on 8 January 2025.
(II) Changes in total number of ordinary shares and shareholder structure of the Company and
changes in assets and liabilities structure of the Company
Applicable
During the reporting period, the total number of shares of the Company changed from 22,000,000,000
shares to 22,741,859,230 shares as a result of the issuance of GDRs by the Company. Details of the
changes in the structure of the Company's assets and liabilities are set out in Section IV “Operating Results
Discussion and Analysis”- "II. Operating overview for the reporting period" - "(III) Analysis of assets and
liabilities".
(III) Existing employee shares
Non-applicable
III. Particulars of shareholders and effective controller
(I) Total number of shareholders
Total Number of ordinary shareholders at end of reporting
period
158,930
Total Number of ordinary shareholders at end of the last
month immediately preceding the disclosure date of the
192,816
3 A GDR repreents 10 A shares in the Company.

2020 Annual Report
54 / 259
Annual Report
(II) Table of Shareholding by top 10 shareholders and top 10 unrestricted shareholders as at end of
the reporting period
Unit: Share
Shareholding of top 10 shareholders
Shareholder
name
(full name)
Changes in
reporting
period
Number of
shares held at
end of the year
Percentage
(%)
Number of
restricted
shares held
Pledged or frozen shares Nature of
shareholder Status of
shares
Number of
shares
China Three
Gorges
Corporation
-8,123,847 12,734,105,445 55.99 0 Pledged 1,886,176,153
State-
owned
legal
person
Hong Kong
Securities
Clearing
Company Ltd.
-34,949,727 1,241,098,586 5.46 0 Unknown Other
Ping An Life
Insurance Co.,
Ltd. –
conventional –
ordinary
insurance
products
0 988,076,143 4.34 0 Unknown Other
China Three
Gorges
Construction
Management
Co., Ltd.
0 880,000,000 3.87 0 None
State-
owned
legal
person
Yunnan Energy
Investment
Group Co., Ltd.
-51,336,444 828,740,060 3.64 0 Pledged 44,485,067
State-
owned
legal
person
Sichuan Energy
Investment
Group Co., Ltd.
-95,600,100 784,399,900 3.45 0 Unknown
State-
owned
legal
person
Citibank,
National
Association4
741,859,230 741,859,230 3.26 0 Unknown Other
4 Citibank, National Association is the depositary of the Company's GDRs and A shares underlying the GDRs are
registered in its name in accordance with the law.

2020 Annual Report
55 / 259
China
Securities
Finance Corp
0 657,980,472 2.89 0 Unknown Other
Sunshine Life
Insurance Co.,
Ltd. – Jili
endowment
insurance
products
0 420,000,000 1.85 0 Unknown Other
China National
Nuclear
Corporation
0 261,594,750 1.15 0 Unknown
State-
owned
legal
person
Shareholding of top 10 unrestricted shareholders
Shareholder name Number of unrestricted shares
held
Class and number of shares
Class Number of shares
China Three Gorges Corporation 12,734,105,445 RMB ordinary shares 12,734,105,445
Hong Kong Securities Clearing Company Ltd. 1,241,098,586 RMB ordinary shares 1,241,098,586
Ping An Life Insurance Co., Ltd. – conventional
– ordinary insurance products 988,076,143 RMB ordinary shares 988,076,143
China Three Gorges Construction Management
Co., Ltd. 880,000,000 RMB ordinary shares 880,000,000
Yunnan Energy Investment Group Co., Ltd. 828,740,060 RMB ordinary shares 828,740,060
Sichuan Energy Investment Group Co., Ltd. 784,399,900 RMB ordinary shares 784,399,900
Citibank, National Association 741,859,230 RMB ordinary shares 741,859,230
China Securities Finance Corp 657,980,472 RMB ordinary shares 657,980,472
Sunshine Life Insurance Co., Ltd. – Jili
endowment insurance products 420,000,000 RMB ordinary shares 420,000,000
China National Nuclear Corporation 261,594,750 RMB ordinary shares 261,594,750
Explanation of related
relationship or acting in
concert in respect of the
above shareholders
China Three Gorges Construction Management Co., Ltd. is a wholly owned subsidiary of our
controlling shareholder China Three Gorges Corporation. Apart from that, whether any other
shareholders are related or acting in concert is not known to the Company.
Number of shares held by top ten restricted shareholders and restriction conditions
Non-applicable
(III) Strategic investors or general legal persons who become top 10 shareholders due to rights
issue
Non-applicable

2020 Annual Report
56 / 259
IV. Particulars of Controlling Shareholder and Effective Controller
(I) Controlling shareholder
1 Legal person
Applicable
Name China Three Gorges Corporation
Principal or legal
representative
LEI Mingshan
Incorporated on 18 September 1993
Principal business Project investment; equity investment; hydropower; wind power; solar
power; ecological protection services; water pollution control; sewage
treatment and recycling; water resources management; consulting services
related to water resources; new energy and resource recycling technology
research and development; new energy and environmental protection
technology development, technology consultation, technology exchange,
technology transfer, technology promotion, technical services; urban
drainage facility management services; municipal facilities management
services; environmental protection consulting services; engineering
management services; engineering supervision services; Internet of Things
application services; goods import Export, technology import and export,
agent import and export; domestic tourism business.
Equity in other domestic or
overseas listed companies
during the reporting period
China Nuclear Power holding 50,000,000 shares, accounting for 0.32%.
Hubei Energy, holding 1,021,100,000 shares, accounting for 15.69%. Bank
of Beijing, holding 398,230,000 shares, accounting for 1.88%. China
Development Bank Leasing, holding 687,024,000 shares, accounting for
5.43%.
(II) Effective controller
1 Legal person
Applicable
Name State-owned Assets Supervision and Administration
Commission of the State Council
2 Chart of property rights and shareholding structure between the Company and its controlling
shareholder
Applicable

2020 Annual Report
57 / 259
V. Other Corporate Shareholders with 10% or more Shareholding
Non-applicable
VI. Description on restrictions on reducing shareholding
Non-applicable
State-owned Assets Supervision and Administration Commission of
the State Council 100%
China Three Gorges Corporation
China Yangtze Power Co., Ltd.
directly holds 55.99% in

2020 Annual Report
58 / 259
Section 7 Particulars of Directors, Supervisors, Senior Management and Employees
I. Particulars of Changes in Shareholding and Emoluments
(I) Particulars of changes in shareholding and emoluments of existing and resigned directors, supervisors and senior management during the reporting
period
Applicable
Unit: Share
Name Position Gender Age Start date
of term
End date
of term
Number of
shares held at
beginning of
the year
Number of
shares
held at end
of the year
Change in
number of
shares held
during the
year
Reason for
change
Pretax
emoluments
received from
the Company
for the
reporting
period (in
RMB’0,000)
Received
compensation
from related
party of the
Company or
not
LEI
Mingshan
Chairman M 59 Dec 2018 0 0 YES
MA
Zhenbo
Vice
Chairman
M 57 Jul 2018 0 0 109.18
ZHANG
Xingliao
Director /
GM
M 49 Nov 2020/
Oct 2020
0 0 15.125 YES
HE
Hongxin
Director M 50 Dec 2018 0 0 YES
ZONG
Renhuai
Director M 55 May 2016 0 0
ZHOU
Chuangen
Director M 55 May 2016 0 0
ZHAO
Yan
Director F 51 May 2016 0 0
ZHAO
Qiang
Director M 55 Jul 2018 0 0 YES
ZHANG
Chongjiu
Independent
Director
M 68 May 2015 0 0 15
5 Mr. ZHANG Xingliao started receving remuneration from the Company as from 1 Nov 2020.

2020 Annual Report
59 / 259
LV
Zhenyong
Independent
Director
M 73 Oct 2015 0 0 15
ZHANG
Biyi
Independent
Director
M 67 Mar 2017 0 0 15
WEN
Bingyou
Independent
Director
M 66 Mar 2017 0 0 15
YAN Hua Independent
Director
M 66 Nov 2017 0 0 15
MO Jinhe Supervisor M 56 May 2015 0 0
XIA Ying Supervisor F 51 May 2017 0 0
SHENG
Xiang
Supervisor M 56 Dec 2018 0 0
TENG
Weiheng
Supervisor M 38 Aug 2019 0 0
HU Yang Employee
Supervisor
F 53 Aug 2019 0 0 84.54
CHEN
Yanshan
Employee
Supervisor
M 47 Aug 2019 0 0 98.13
YANG
Xingbin
Employee
Supervisor
M 59 Dec 2018 0 0 70.42
ZHAN
Pingyuan
CFO/General
Counsel
M 48 Apr 2019/
Oct 2019
0 0 88.64
GUAN
Jielin
Vice GM M 56 Oct 2015 0 0 96.21
XIE Jun Vice GM M 51 Oct 2020 0 0 91.19
CHEN
Hui
Vice GM M 45 Oct 2020 0 0 94.48
LI
Shaoping
Board
Secretary
M 57 Aug 2016 0 0 89.25
CHEN
Guoqing
Director/GM M 55 Jul 2018 Oct
2020/
Aug
2020
30,000 30,000 70.576
6 Mr. Chen Guoqing ceased receving remuneration from the Company as from 1 Aug 2020.

2020 Annual Report
60 / 259
HONG
Wenhao
Director M 57 May 2016 Feb
2021
0 0 YES
HUANG
Ning
Director M 50 May 2016 Apr
2020
0 0
LI
Qinghua
Director F 51 May 2020 April
2021
0 0
YANG
Xingshi
Chairman of
the Board of
Supervisors
M 55 Dec 2018 Mar
2021
YES
XIE Feng Vice GM M 49 Apr 2020 Aug
2020
0 0 70.497
XUE
Fuwen
Vice GM M 56 May 2015 Dec
2020
0 0 94.06
LI
Pingshi
Vice GM M 58 Oct 2015 Oct
2020
0 0 94.06
WANG
Hong
Vice GM M 59 2017-09 Jul 2020 0 0 94.04
Total 30,000 30,000 / 1,335.38 /
Name Main work experience
LEI
Mingshan
Chairman, master, senior economist. Served as deputy director of the economic and legal department of China International Engineering Consulting
Corporation, deputy manager of China Consulting Assets Appraisal Firm, assistant general manager and deputy general manager (at the director
level) of China International Engineering Consulting Corporation, Member of the Party Group and deputy general manager of China International
Engineering Consulting Corporation, deputy director of the inspection department of the Three Gorges Office of the State Council (at the director
level), director of the Funding Planning Department, deputy director of the Three Gorges Office of the State Council, member of the Party
Leadership Group, Deputy Minister of the Ministry of Water Resources, and Member of the Party Leadership Group. Currently, Chairman and
Party Secretary of China Three Gorges Group Co., Ltd.
MA Zhenbo Vice Chairman, secretary of the Party Committee, master of engineering, senior engineer. Served as director and party secretary of Gezhouba
Power Plant, director and party secretary of Three Gorges Power Plant, deputy general manager of the Company, director and party secretary of
the Three Gorges Power Plant, party secretary and deputy general manager of the Company, and director of the human resources department and
director of the office of retired employees of China Three Gorges Group Co., Ltd.. Currently, assistant to the general manager, vice chairman and
secretary of the Party Committee of China Three Gorges Corporation.
7 Mr. XIE Feng ceased receving remuneration from the Company as from 1 Sep 2020.

2020 Annual Report
61 / 259
ZHANG
Xingliao
Director, general Manager, deputy secretary of the Party Committee, master of management, senior accountant. Served as deputy manager of the
company’s finance department, deputy manager of the company’s finance department and deputy general manager and chief financial officer of
Hubei Daye Nonferrous Metals Co., Ltd., deputy manager of the company’s finance department and vice chairman of the board of supervisors of
Hubei Daye Nonferrous Metals Co., Ltd., and deputy chief economist and director, member of the Party Committee, deputy general manager, chief
accountant of Hubei Qingneng Real Estate Group Co., Ltd., deputy director, deputy director (in charge of work), and director of the asset finance
department of China Three Gorges Group Co., Ltd., general manager and vice secretary of the Party Committee of Three Gorges Finance Co., Ltd..
Currently, director, general manager and deputy secretary of the party committee of the Company.
HE Hongxin Director, MBA, senior accountant. Served as deputy director of the capital operation department of China Three Gorges Corporation, executive
director and chief executive officer of China Power New Energy Development Co., Ltd. and principal of China Power International New Energy
Holdings Co., Ltd., deputy general manager of China Three Gorges New Energy Co., Ltd., Deputy director (in charge of work) and director of the
asset finance department of Three Gorges Corporation. Currently, deputy chief accountant, director of the asset finance department and director of
the capital finance management center of China Three Gorges Corporation.
ZONG
Renhuai
Director, master of engineering, EMBA, professor-level senior engineer. Served as executive deputy general manager and general manager of
Panzhihua China Resources Hydropower Development Co., Ltd. He was responsible for power development and other work of Sichuan Energy
Investment Group Co., Ltd. and served as secretary of the Party Branch, director and chairman of Sichuan Energy Investment Distributed Energy
Co., Ltd. Currently, deputy general manager of Sichuan Energy Investment Group Co., Ltd.
ZHOU
Chuangen
Director, master of business administration, Certified Financial Analyst (CFA) in the United States. Served as deputy director of the Administration
and Inspection Department of the State Administration of Foreign Exchange, senior researcher of Societe Generale Securities Asia Co., Ltd.,
director of the research department of Cathay Pacific Fund Co., Ltd. and deputy general manager of Ping An Asset Management Co., Ltd. Currently,
deputy general manager of Ping An Pension Insurance Co., Ltd.
ZHAO Yan Director, master of science, master of business administration, Financial Risk Manager (FRM). He served as portfolio manager of Taikang Asset
Management Co., Ltd., manager of Deloitte Management Consulting Company, general manager of the asset management center of Sunshine
Insurance Group Co., Ltd., assistant general manager and chief risk officer of Sunshine Asset Management Co., Ltd. Currently, deputy general
manager, director and secretary of the board of directors of Sunshine Asset Management Co., Ltd.
ZHAO Qiang Director, master degree, senior accountant. Served as chief staff member and deputy director of the education division of the personnel and labor
bureau of China National Nuclear Corporation, deputy director of the director and supervisory office of the investment operation department,
deputy director of the investment and financing division of the financial audit department, and director of the budget division of the finance and
accounting department, director of the capital division of China National Nuclear Corporation, chief accountant of Jiangsu Nuclear Power Co.,
Ltd., chief accountant and general counsel of Jiangsu Nuclear Power Co., Ltd., deputy director of the Finance Department (in charge of work),
director of Finance and Capital Operation Department, and director of Finance Department of China National Nuclear Corporation. Currently,
Director of the Finance Department of China National Nuclear Corporation.
ZHANG
Chongjiu
Independent director, doctor of management, senior economist. Served as a member of the Standing Committee of the Party Committee, deputy
general manager and general counsel of China Gezhouba Group Co., Ltd., a member of the strategic advisory committee of China Energy
Construction Group Co., Ltd., and a member of the advisory committee of China Gezhouba Group Co., Ltd.
LV Zhenyong Independent director, bachelor degree, practicing lawyer, senior economist. Served as deputy director and director of the political and legal bureau of the Ministry of Electric Power Industry, chief legal counsel and director of the legal department of the State Power Corporation, and chief legal

2020 Annual Report
62 / 259
counsel and consultant of the State Grid Corporation of China.
ZHANG Biyi Director, senior accountant. Served as deputy general manager, chief accountant, and member of the Party Leadership Group of China Shipbuilding
Industry Corporation.
WEN
Bingyou
Director, senior engineer. Served as vice chairman and general manager of Dongfang Boiler (Group) Co., Ltd., chief economist of China Dongfang
Electric Group Corporation, director, member of the leading party group, and leader of the discipline inspection team of the leading party Group
of China Dongfang Electric Group Co., Ltd.
YAN Hua Director, senior economist. Served as member of the Party Committee, assistant to the general manager, and deputy secretary of the Party
Committee of the Headquarters of Commercial Aircraft Corporation of China.
MO Jinhe Supervisor, undergraduate accounting, professor-level senior economist, senior auditor, and internationally registered internal auditor. Served as
chief accountant of Hainan Power Grid Company, deputy director of the finance department of China Southern Power Grid Co., Ltd., and chief
accountant of Guangdong Power Grid Co., Ltd. Currently, a first-level employee, director, deputy general manager, chief accountant, and member
of the party committee of Guangdong Power Grid Co., Ltd.
XIA Ying Supervisor, bachelor degree, senior engineer. Served as deputy director and director of the capital market division of the capital operation
department of China National Petroleum Corporation. Currently, a full-time director and supervisor of China National Petroleum Corporation.
SHENG
Xiang
Supervisor, senior accountant. Served as deputy director and director of the finance department of Sichuan Tianhua Co., Ltd. Currently, deputy
chief accountant and director of the financial assets department (settlement center) of Sichuan Energy Investment Group Co., Ltd.
TENG
Weiheng
Supervisor, Master of Economics. Served as deputy director of the channel management department of China Postal Savings Bank Co., Ltd.,
manager of the investment department of Anhui Guofu Industrial Investment Fund Management Co., Ltd., and head of the institutional business
department of Essence Securities Co., Ltd. Yunnan Branch. Currently, deputy general manager of the capital management center of Yunnan Energy
Investment Group Co., Ltd.
HU Yang Employee supervisor, secretary of the Disciplinary Committee, master of economics, senior economist. Served as general manager of the operation
and management department of China Water Resources Investment Corporation, general manager of the operation and management department,
director of the corporate management and legal affairs department, the chief economist, and the general legal adviser of China Three Gorges New
Energy Corporation. Currently, secretary of the disciplinary committee of the Company.
CHEN
Yanshan
Employee supervisor, MBA, senior political engineer. Served as administrative director and assistant manager of the general manager work
department (party and mass work department) of the Company, deputy manager and manager of the general manager work department (legal
affairs office) of the Company, director of the general manager work department of the Company. Currently, party secretary of the Party Committee
and deputy factory director of the Overhaul Factory.
YANG
Xingbin
Employee supervisor, doctor of engineering, senior engineer. Served as deputy chief engineer, chief engineer, and deputy director of the Dajiang
branch of Gezhouba Power Plant, director and deputy chief engineer of the electrical maintenance department of Gezhouba Power Plant, assistant
to the chief engineer of the Three Gorges Power Plant, technical leader of the Jinshajiang Electric Power production preparation working group
and assistant to the director of the Three Gorges Power Plant , The head and deputy director of the production management department of the
Xiluodu Power Plant preparation office, deputy director of the Xiluodu Power Plant, and deputy general manager of Three Gorges Jinsha River
Chuanyun Hydropower Development Co., Ltd. Currently, secondary consulting of the Company.
ZHAN
Pingyuan
Chief financial officer, general counsel, doctor of management, senior accountant, senior international financial manager. Served as director of the
asset finance department of China Hydropower International Investment Co., Ltd., director of the asset finance department, chief accountant and
2020 Annual Report
63 / 259
director of the asset finance department, chief accountant and chairman of the Labor Union of Three Gorges International Energy Investment Group
Co., Ltd. Currently, chief financial officer and general counsel of the Company.
GUAN Jielin Deputy general manager, master of engineering, senior engineer. Served as chief engineer and deputy director of the Three Gorges Power Plant,
deputy leader of the Jinshajiang Electric Power production preparatory working group, deputy director, director and party secretary of the Xiluodu
Power Plant Preparation Office, and director and party secretary of the Xiluodu Power Plant. Currently, deputy general manager of the company.
XIE Jun Deputy general manager, master of management, senior engineer. Served as deputy director and director of the electrical maintenance department
of Three Gorges Power Plant, deputy director and secretary of the Party Branch of the Three Gorges Mechanical and Electrical Installation Project
Department of the Mechanical and Electrical Engineering Department of China Three Gorges Power Plant, deputy plant director and member of
the Party Committee of the Three Gorges Power Plant, and deputy leader of the preparatory group of the Yangtze Three Gorges Power Distribution
Co., Ltd., general manager and secretary of the Party Committee of Three Gorges Power Co., Ltd. Currently, deputy general manager of the
Company.
CHEN Hui Deputy general manager, master of engineering, senior engineer. Served as deputy director of the production technology department of Three
Gorges Power Plant, head of production management department, deputy chief engineer and deputy director of the production management
department of Xiluodu Power Plant Preparation Department, deputy chief engineer and deputy director of the production management department,
chief engineer and director of the production management department of Xiluodu Power Plant, deputy leader of Uzbekistan East German and
Baihetan Electric Power production preparation team, director of Baihetan Power Plant preparation office, plant director and deputy secretary of
the Party Committee of Three Gorges Power Plant. Currently, deputy general manager of the Company.
LI Shaoping Board secretary, chief professional, bachelor of economics, senior accountant. Served as manager of the financial department, assistant to the
company's general manager, secretary of the board of directors and manager of the strategic investment department of the Company. Currently,
company secretary of the board of directors and chief professional of the Company.
Other information
Non-applicable
(II) Share incentives granted to Directors and senior management during the reporting period
Non-applicable
II. Positions of Existing and Resigned Directors, Supervisors and Senior Management During the Reporting Period
(I) Positions held at the Shareholder
Applicable
Position holder’s name Shareholder’s name Position at the Shareholder Term From Term To
LEI Mingshan China Three Gorges Corporation Chairman, Secretary of the Aug 2018

2020 Annual Report
64 / 259
Party Group
MA Zhenbo China Three Gorges Corporation Assistant to GM Jun 2020
HE Hongxin China Three Gorges Corporation Deputy Chief Accountant Nov 2018
HE Hongxin China Three Gorges Corporation Head of Assets and Finance
Department
Jun 2017
HE Hongxin China Three Gorges Corporation Head of Asseets and Financial
Management Center
Oct 2020
HE Hongxin Three Gorges Capital Holding Co., Ltd. Chairman of the Board of
Supervisors
Jan 2018
ZONG Renhuai Sichuan Energy Investment Group Co.,
Ltd.
Vice GM Jan 2019
ZHOU Chuangen Ping An Asset Management Co., Ltd. Vice GM Nov 2008 Mar 2020
ZHOU Chuangen Ping An Pension Insurance Co., Ltd. Vice GM Mar 2020
ZHAO Yan Sunshine Insurance Group Co., Ltd. Director Jun 2015
ZHAO Yan Sunshine Asset Management Co., Ltd. Director, Vice GM, Board
Secretary
Dec 2014
ZHAO Qiang China National Nuclear Corporation Head of Finance Department Jun 2015
MO Jinhe Guangdong Power Grid Co., Ltd. Director, Vice GM, Member of
the Party Committee, Chief
Accountant
Mar 2014 Dec 2020
MO Jinhe Guangdong Power Grid Co., Ltd. First-level staff, Director, Vice
GM, Chief Accountant,
member of the Party
Committee
Dec 2020
XIA Ying CNPC Full-time Director/Supervisor Mar 2017
TENG Weiheng Yunnan Energy Investment Group Co.,
Ltd.
Vice GM of Capital
Management Center
Jun 2018
SHENG Xiang Sichuan Energy Investment Group Co.,
Ltd.
Head of Finance and Assets
Department (Clearing Center)
Sep 2018
SHENG Xiang Sichuan Energy Investment Group Co.,
Ltd.
Deputy Chief Accountant Nov 2020
ZHAN Pingyuan Three Gorges Finance Co., Ltd. Director Dec 2020
LI Shaoping Three Gorges Finance Co., Ltd. Supervisor Aug 2018

2020 Annual Report
65 / 259
(II) Position held at other companies
Applicable
Position holder’s name Other company’s name Position at other company From To
ZHANG Xingliao China Three Gorges International
Corporation
Director Dec 2015
ZHANG Xingliao Minsheng Royal Fund Management Co., Ltd. Director Jan 2017 Feb 2021
HE Hongxin China Three Gorges Renewables (Group)
Co., Ltd.
Chairman of the Board of
Supervisors
Oct 2018
HE Hongxin Bank of Beijing Director Dec 2018
HE Hongxin China Power New Energy Co., Ltd. Non-executive Director Dec 2019
HE Hongxin Yangtze Three Gorges Investment
Management Co., Ltd
Chairman, Secretary of
the Party Committee
Mar 2021
ZONG Renhuai Investment Decision-Making Committee
under Beijing Huading New Power Equity
Investment Fund
Member of Committee Sep 2016
ZONG Renhuai Huading Guolian Power Battery Co., Ltd. Director May 2017
ZONG Renhuai Huading Guolian Battery Materials Co., Ltd Director May 2017
ZHAO Qiang National Military-Military Integration
Industry Investment Fund Co., Ltd.
Director May 2020
ZHAO Qiang Expert Committee of the Alliance for the
Promotion and Application of Management
Accounting in the Industrial and Information
and Communication Sector
Vice Chairman Dec 2019
ZHAO Qiang Chinese Nuclear Society Supervisor May 2018
ZHANG Chongjiu External Director and Expert of SASAC
under the State Council
Expert Jul 2015
ZHANG Chongjiu Independent Directors Committee of the
Listed Company Association of CSRC
Member of Committee Feb 2016
YANG Hua China State Shipbuilding Corporation Director Nov 2019
YANG Hua Angang Group Co., Ltd. Director Jul 2019
MO Jinhe China Southern Power Grid Finance Co., Ltd. Director Aug 2013
MO Jinhe Dinghe Property Insurance Co., Ltd. Director Sep 2013
XIA Ying Jinzhou Port Co., Ltd. Supervisor Mar 2017
XIA Ying China Tendering Public Service Platform Supervisor Feb 2017

2020 Annual Report
66 / 259
Co., Ltd.
TENG Weiheng Yunnan Energy Investment Co., Ltd. Director Apr 2019
TENG Weiheng Yunnan Yunwei Co., Ltd. Director Oct 2019
TENG Weiheng Guodian Jinsha River Xulong Hydropower
Development Co., Ltd.
Supervisor Nov 2020
TENG Weiheng Guodian Jinsha River Benzilan Hydropower
Development Co., Ltd.
Chairman of the Board of
Supervisors
Nov 2020
SHENG Xiang Sichuan Chemical Holdings (Group) Co.,
Ltd.
Head of Asset and
Finance Department
Jan 2007
ZHAN Pingyuan SDIC Power Holdings Co., Ltd. Director Sep 2019
ZHAN Pingyuan Changjiang Power Capital Holdings Co., Ltd. Chairman, President Nov 2019
ZHAN Pingyuan Changdian Andes Investment Co., Ltd. Director Nov 2019 Apr 2020
ZHAN Pingyuan Changjiang Power Investment Management
Co., Ltd.
Chairman, GM Sep 2020
ZHAN Pingyuan China Yangtze International (Hongkong)
Co., Ltd.
Director Dec 2020
GUAN Jielin China Three Gorges International Power
Operation Co., Ltd.
Director Dec 2015
GUAN Jielin Three Gorges Mechanical and Electrical
Engineering Co., Ltd.
Director Sep 2017
GUAN Jielin Hubei Energy Group Co., Ltd. Director Jun 2020
GUAN Jielin China Nuclear Power Co., Ltd. Director Feb 2021
XIE Jun Chongqing Three Gorges Hydropower
(Group) Co., Ltd.
Vice Chairman, Secretary
of the Party Committee
Jul 2020
XIE Jun China Yangtze Power Sales Co., Ltd. Executive Director, legal
representative
Dec 2020
XIE Jun Three Gorges Electric Energy (Hubei)Co.,
Ltd.
Chairman Sep 2015 Jan 2021
XIE Jun Three Gorges Electric Energy Co., Ltd. Director, GM, Secretary
of the Party Committee
Dec 2019
LI Shaoping China Yangtze International (Hongkong)
Co., Limited
Director, President Nov 2016
LI Shaoping China Three Gorges Power Operation Int'l
Co., Limited
Supervisor Dec 2015
LI Shaoping Hunan Taohua River Nuclear Power Co., Ltd Director Dec 2017

2020 Annual Report
67 / 259
LI Shaoping Three Gorges Jinsha River Chuanyun
Hydropower Development Co., Ltd.
Supervisor Aug 2016
LI Shaoping Hubei Energy Group Co., Ltd. Vice Chairman of the
Board of Supervisors
Nov 2016 Jun 2020
LI Shaoping Beijing Yangtze River Juyuan Investment
Management Co., Ltd.
Director, GM Dec 2016 Dec 2020
LI Shaoping Chongqing Yangtze Power United Energy
Co., Ltd
Chairman, legal
representative
Feb 2017 May 2020
LI Shaoping Chongqing Yangtze Power United Energy
Co., Ltd
Chairman of the Party
Committee
Apr 2018 Aug 2020
LI Shaoping Three Gorges Electric Energy Co., Ltd. Chairman Dec 2019
Chen Yanshan Three Gorges Base Development Co., Ltd. Director Aug 2018

2020 Annual Report
68 / 259
III. Emoluments of Directors, Supervisors and Senior Management
Applicable
Decision-making procedures for
remuneration of directors,
supervisors and senior
management
The independent director’s remuneration is determined based on the
standards specified by the shareholders’ meeting. The staff’s and
workers’ representative supervisor’s remuneration is determined
based on his/her position at the Company and the performance
appraisal result; and the Company pays no remuneration to any
supervisor, except the staff’s and workers’ representative
supervisor. The officer’s remuneration is determined by the board
of directors according to the Administration Measures on Officer’s
Remuneration, the production and operation performance of the
Company and his/her personal performance appraisal result during
the year and his/her term of office.
Basis for determining the
remuneration of directors,
supervisors and senior
management
The independent director’s remuneration is determined based on the
standards specified by the shareholders’ meeting. The staff’s and
workers’ representative supervisor’s remuneration is determined
based on his/her position at the Company and the performance
appraisal result; and the Company pays no remuneration to any
supervisor, except the staff’s and workers’ representative
supervisor. The officer’s remuneration is determined by the board
of directors according to the Administration Measures on Officer’s
Remuneration.
Actual payment of remuneration
to Directors, supervisors and
senior management
Ma Zhenbo RMB 1,091,800; Zhang Xinglian RMB 151,200; Chen
Guoqing RMB 705,700; Xue Fuwen RMB 940,600; Xie Feng RMB
704,900; Zhan Pingyuan RMB 886,400; Guan Jielin RMB 962,100;
Xie Jun RMB 911,900; Chen Hui RMB 944,800; Li Pingshi RMB
940,600; Wang Hong RMB 940,400; Hu Yang RMB 845,400; Li
Shaoping RMB 892,500; Chen Yanshan RMB 981,300; Yang
Xingbin RMB 704,200; Zhang Chongjiu RMB150,000; Lv
Zhenyong RMB150,000; Zhang Biyi RMB 150,000 ; Wen Bingyou
RMB 150,000; Yanhua RMB 150,000
Total remuneration actually
received by all directors,
supervisors and senior
management at the end of the
reporting period
Total remuneration of RMB 13,353,800
IV. Changes in Directors, Supervisors and Senior Management of the Company
Applicable
Name Position held Change Reason for Change
ZHANG Xingliao Director Elected Additional
LI Qinghua Director Elected Additional
ZHANG Xingliao GM Recruited Additional
XIE Jun Vice GM Recruited Additional
CHEN Hui Vice GM Recruited Additional
CHEN Guoqing Director/GM Resigned Resigned
HONG Wenhao Director Resigned Resigned
HUANG Ning Director Resigned Resigned
LI Qinghua Director Resigned Resigned
YANG Xingshi Chairman of Board of
Supervisors
Resigned Resigned
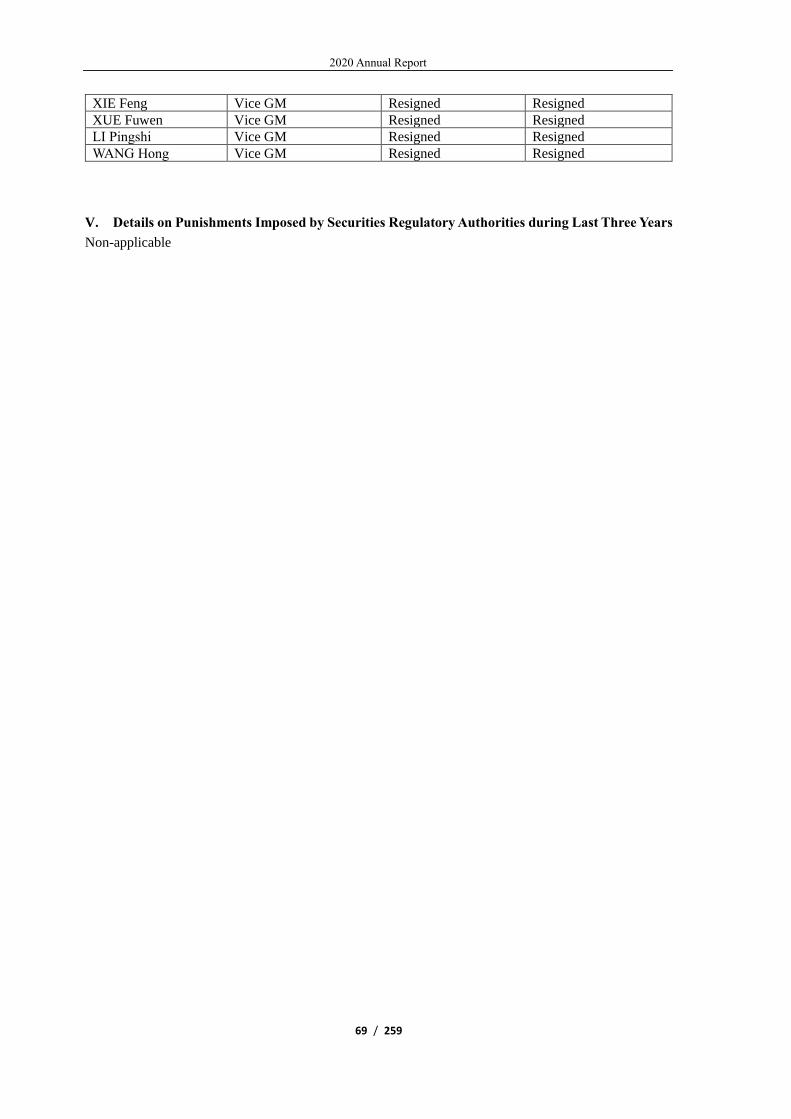
2020 Annual Report
69 / 259
XIE Feng Vice GM Resigned Resigned
XUE Fuwen Vice GM Resigned Resigned
LI Pingshi Vice GM Resigned Resigned
WANG Hong Vice GM Resigned Resigned
V. Details on Punishments Imposed by Securities Regulatory Authorities during Last Three Years
Non-applicable

2020 Annual Report
70 / 259
VI. Particulars of Employees of the Parent Company and Significant Subsidiaries
(I) Employees
Number of existing employees of the parent company 3,751
Number of existing employees of significant
subsidiaries
234
Total number of existing employees 3,985
Number of resigned and retired employees born
expenses by the parent company and major subsidiaries
1,436
By profession
Profession cetagory Number of employees
Production staff 2,771
Sales staff 54
Technical staff 555
Financial staff 89
Administrative staff 516
Total 3,985
By level of education
Level of education cetagory Number of employees (person)
PhD 15
Master 947
Undergraduate 2,253
College 387
Technical secondary school and below 383
Total 3,985
(II) Remuneration policy
Applicable
The Company adopts the performance-and-market-oriented income distribution system based on the
value of the position and establishes the remuneration and incentive mechanism within several incentive
measures. The Company determines the standard position salary based on the requirements of the position
and the scope of duties, pays performance salary and other incentive income according to the performance
appraisal result of the Company and the employees, increases incentives for marketization business unit,
scientific and technological innovation, special contribution and key work and further improves the
differentiated remuneration distribution strategy. The Company adopts total salary budget management in
the electricity production units and establishes the salary and performance linkage mechanism oriented by
production and operation performance and value creation. The Company pays various social insurance
premium for the employees and implements such systems as housing provident fund, enterprise annuity,
supplementary medical insurance, paid leaves, health rehabilitation and periodic health inspection.
The Company establishes and improves the marketization mechanism oriented by value creation. The
Company controls the number of personnel and total salary of various subsidiaries according to the
realization of the annual production and operation targets, economic profits and human resources
management requirements of the Company and has the various subsidiaries to formulate the corresponding
remuneration policies based on their own production and operation characteristics.
(III) Training plan
Applicable
In 2020, the Company sets up the philosophy of “gathering talents, achieving talents and properly
utilizing talents”, continues to optimize the top-level design for talent cultivation, establishes the talent
ability standard system based on its development strategy and core organization ability and establishes
and improves the systematic talent cultivation system led by its development strategy, oriented by talent

2020 Annual Report
71 / 259
value matching, with the improvement of performance ability as the core and supported by the key talents
projects.
The talent training work of the Company closely revolves around the development strategy and
annual key tasks of the Company, combined with the COVID-19 prevention and control situation
throughout the year, and flexibly adopts multiple measures such as online training, cloud learning, sub-
regional training, and overseas training., organizes and implements key talent training projects, and
promotes the precise empowerment of all kinds of talents. The Company optimizes and improves the
expert management system, selects and hires new corporate experts, conducts in-depth job technical skills
training and job skills qualification evaluation, encourages employees to study professional skills based
on their positions, and cultivates and inherits the craftsman spirit and culture within the Company,
organizes and implements training programs such as rotation exercises for management positions in the
department, operation management practice training, corporate mergers and acquisitions and restructuring
training, overseas project management and team building, carries out English and Spanish training, and
enhances reserve and training of operation management talents, especially including market-oriented and
internationalized talents, and strives to gather the employees that are compatible with the world's leaders
in the hydropower industry.
Section 8 Corporate Governance
The Company is required to comply with the Code of Corporate Governance for Listed Companies.
The Code of Corporate Governance for Listed Companies is available at the CSRC website. The Company is principally governed by the general meeting of its shareholders (“general meeting”),
the Board of Directors, the Supervisory Committee and senior management.
The general meeting is the governing authority of the Company. General meetings include annual
general meetings and extraordinary general meetings. An annual general meeting is required to be called
once a year, within six months following the end of the previous fiscal year.
The Board of Directors is responsible for the general management of the Company and is accountable
to the general meeting. Board meetings include routine board meetings and extraordinary board meetings.
A routine board meeting is required to be called twice a year. An extraordinary board meeting may be
called upon demand.
The Supervisory Committee conducts independent supervision and inspection of the finance and
accounting work of the Company and the performance of the duties of the Directors and senior managers.
The Supervisory Committee is accountable to the general meeting. A routine supervisory committee
meeting is required to be called semi-annually.
The senior management is responsible for daily operations of the Company and performs duties in
accordance with laws and regulations as well as the authorizations of the Board. All senior managers have
a current term of office of three years.
The Company operates within a comprehensive governance framework, which aims to add value to
shareholders through the adoption of international best practice. Certain responsibilities of the Board of
Directors are delegated to the specialised committees to assist the Board with carrying out its functions
and to ensure independent oversight of internal control and risk management. The three principal
specialised committees (the Strategy and Environment Committee, the Audit Committee and the
Remuneration and Appraisal Committee) play an essential role in supporting the Board of Directors in
fulfilling its responsibilities and ensuring that the highest standards of corporate governance are
maintained throughout the Company. All the specialised committees are accountable to, and submit
working reports to, the Board of Directors, which shall consider the opinions of the specialised committees
before making any decisions on matters related to the duties of the specialised committees.
The Strategy and Environment Committee is mainly responsible for studying and giving suggestions
on the Company’s development strategies, major investment decisions, major environmental protection
issues and construction of rule of law-related work.
The Audit Committee assists the Board of Directors with, amongst the other matters: (i) making
proposals on the engagement or change of the Company’s external auditors; (ii) supervising the
Company’s internal controls; and (iii) monitoring the Company’s internal audit policy and its
implementation.

2020 Annual Report
72 / 259
The Remuneration and Appraisal Committee assists the Board of Directors with, amongst other: (i)
studying the appraisal standards for Directors and senior management; and (ii) formulating remuneration
plans or schemes for Directors and senior management based on the coverage, responsibility and
significance of their management role with reference to the remuneration of relevant positions in other
relevant enterprises.
The Company believes that the increasing diversity of the administrative, management and
supervisory bodies is one of the key factors that help support its strategic objectives and maintain
sustainable development. At present, the Company’s administrative, management and supervisory bodies
are diversified in terms of gender, region and professional background.
I. Particulars in Relation to Corporate Governance
Applicable
The Company continues to improve the corporate legal person governance structure, establishes and
improves the corporate legal person governance structure with the “three boards and one level” (namely,
shareholders’ meetings, board of directors, board of supervisors and operation level) as the key in strict
accordance with such laws and regulations as the Company Law, the Securities Law, the Code of
Corporate Governance for Listed Companies and the Stock Listing Rules of Shanghai Stock Exchange,
carries out work according to their respective authorities and procedures, creates a good corporate
governance environment and duly protects the shareholders’ interests.
During the reporting period, the Company organized 25 general shareholders’ meetings and meetings
of board of directors and its committees and board of supervisors, considered and passed 138 proposals
and 100% proposals are passed. The Company provides services to directors and supervisors for them to
perform duties, establishes the decision-making mechanism of “pre-reporting, daily reporting and material
matter reporting”, organized on-site survey and periodic trainings for directors and supervisors to increase
their performance level. The Company timely amends and formulates the basic management rules, amends
the Insiders Registration Rules and the Information Disclosure System to promote the regulated operation
of the Company. The information disclosure is true, correct, complete, timely and fair and zero error is
realized. The Company continues to innovate the investor relationship management approach, develop the
investor communication channel and properly protect the investors’ rights and interests.
Whether the Company’s corporate governance deviated materially from relevant CSRC requirements? If
any, provide the reason.
Non-applicable
II. General Meeting
Session of meeting Convening date Websites designated for
disclosure of resolutions
Resolution disclosing
date
2019 Annual General
Meeting 21 May 2020
http://www.sse.com.cn
Announcement No.
2020-026
22 May 2020
2020 1st Extraordinary
General Meeting 30 Jun 2020
http://www.sse.com.cn
Announcement No.
2020-034
1 Jul 2020
2020 2nd Extraordinary
General Meeting 16 Sep 2020
http://www.sse.com.cn
Announcement No.
2020-056
17 Sep 2020
2020 3rd Extraordinary
General Meeting 25 Nov 2020
http://www.sse.com.cn
Announcement No.2020-
074
26 Nov 2020
Particulars of the general meeting Non-applicable

2020 Annual Report
73 / 259
III. Duty Performance of Directors
(I). Directors attendance at the Board meeting and the general meeting
Director’s
name
Independent
director or
not
Attendance at the Board meeting Attendance
at the general
meeting
Number of
required
attendances
at the
Board
meeting of
the year
Number
of
attendance
in person
Number of
attendances by
communication
means
Number of
attendances
by proxy
Number
of
absences
Failing to
attend the
meeting in
person for
two
consecutive
times or not
Number of
attendances
at the general
meeting
LEI
Mingshan
No 8 5 5 3 0 Yes 0
MA
Zhenbo
No 8 8 5 0 0 No 4
ZHANG
Xingliao
No 0 0 0 0 0 No 0
HE
Hongxin
No 8 5 5 3 0 Yes 0
ZONG
Renhuai
No 8 5 5 3 0 Yes 0
LI
Qinghua
No 5 5 3 0 0 No 0
ZHOU
Chuangen
No 8 7 5 1 0 No 0
ZHAO
Yan
No 8 6 5 2 0 No 0
ZHAO
Qiang
No 8 7 5 1 0 No 0
ZHANG
Chongjiu
Yes 8 8 5 0 0 No 0
LV
Zhenyong
Yes 8 8 5 0 0 No 0
ZHANG
Biyi
Yes 8 8 5 0 0 No 0
WEN
Bingyou
Yes 8 8 5 0 0 No 0
YAN Hua Yes 8 8 5 0 0 No 0
Explanation of failure to attend the Board meeting for two consecutive times
Applicable
In 2020, due to the impact of the COVID-19 pandemic, some directors failed to attend the Board
meetings in person for two consecutive times, but participated in Board decisions by proxy.
Number of Board meetings held during the year 8
Including: number of onsite meetings 3
Number of meetings through communication
means
5
Number of meetings both onsite and through
communication means
0
(II). Independent Directors’ objections to relevant matters
Non-applicable

2020 Annual Report
74 / 259
(III). Other information
Non-applicable
IV. Disclosure of Important opinions and recommendations and details on objections (if any) from
the special committees under the Board during the reporting period
Non-applicable
V. Explanation of Risks Identified by the Board of Supervisors
Non-applicable
VI. Explanation of Circumstances Where the Company Cannot Maintain the Ability to Operate
Independently and Maintain Independence from Its Controlling Shareholder in Terms of
Business, Personnel, Assets, Organizational Structure and Finance
Non-applicable
In case of competition with its controlling shareholder, the Company should have countermeasures, work
progress and subsequent work plan.
Non-applicable
VII. Establishment and Execution of Assessment Mechanism and Incentive Mechanism for Senior
Management during the Reporting Period
Applicable
The Company adopts a tenure system and contractual management for senior management personnel.
The annual remuneration is determined by the Board of Directors in accordance with the "Regulations
Governing the Remuneration of Senior Management" and is based on the operating performance of the
Company as well as the results of their individual performance appraisals.
VIII. Whether the Self-assessment Report on Internal Control Is Disclosed
Applicable
At the twenty-third meeting of the Fifth Session of the Board of Directors of the Company, the "2020
Annual Report on Internal Control Report" was considered and approved, and the full report was disclosed
on the website of the Shanghai Stock Exchange at http://www.sse.com.cn on 30 April 2021.
Explanation of material defects with internal control during the reporting period
Non-applicable
IX. Particulars of Internal Control Audit Report
Applicable
Grant Thornton LLP (致同会计师事务所(特殊普通合伙)) was engaged to evaluate the Company's
internal control over its financial reporting for 2020 for its effectiveness, and issued the Auditor’s Report
on Internal Control for 2020, the full texts of which was disclosed on the website of the Shanghai Stock
Exchange at http://www.sse.com.cn on 30 April 2021.
Whether to disclose the auditor’s report on internal control: Yes
Type of auditor’s opinion on internal control: standard report without qualified opinion
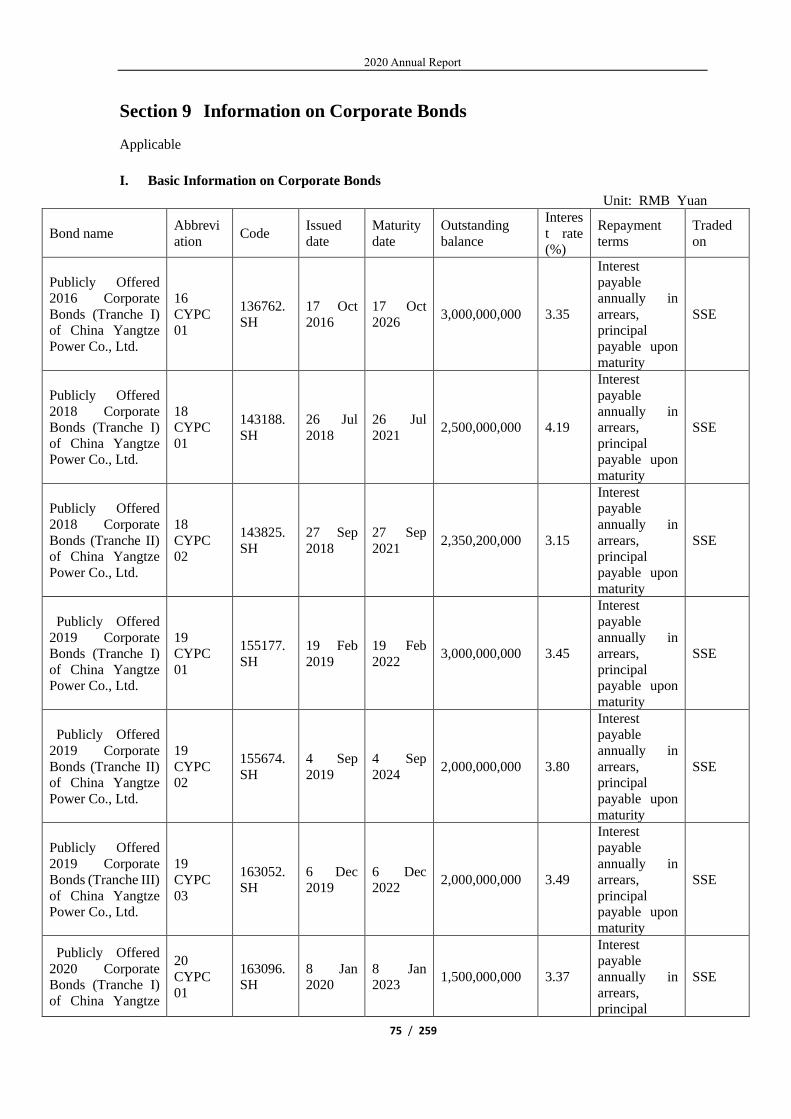
2020 Annual Report
75 / 259
Section 9 Information on Corporate Bonds
Applicable
I. Basic Information on Corporate Bonds
Unit: RMB Yuan
Bond name Abbrevi
ation Code
Issued
date
Maturity
date
Outstanding
balance
Interes
t rate
(%)
Repayment
terms
Traded
on
Publicly Offered
2016 Corporate
Bonds (Tranche I)
of China Yangtze
Power Co., Ltd.
16
CYPC
01
136762.
SH
17 Oct
2016
17 Oct
2026 3,000,000,000 3.35
Interest
payable
annually in
arrears,
principal
payable upon
maturity
SSE
Publicly Offered
2018 Corporate
Bonds (Tranche I)
of China Yangtze
Power Co., Ltd.
18
CYPC
01
143188.
SH
26 Jul
2018
26 Jul
2021 2,500,000,000 4.19
Interest
payable
annually in
arrears,
principal
payable upon
maturity
SSE
Publicly Offered
2018 Corporate
Bonds (Tranche II)
of China Yangtze
Power Co., Ltd.
18
CYPC
02
143825.
SH
27 Sep
2018
27 Sep
2021 2,350,200,000 3.15
Interest
payable
annually in
arrears,
principal
payable upon
maturity
SSE
Publicly Offered
2019 Corporate
Bonds (Tranche I)
of China Yangtze
Power Co., Ltd.
19
CYPC
01
155177.
SH
19 Feb
2019
19 Feb
2022 3,000,000,000 3.45
Interest
payable
annually in
arrears,
principal
payable upon
maturity
SSE
Publicly Offered
2019 Corporate
Bonds (Tranche II)
of China Yangtze
Power Co., Ltd.
19
CYPC
02
155674.
SH
4 Sep
2019
4 Sep
2024 2,000,000,000 3.80
Interest
payable
annually in
arrears,
principal
payable upon
maturity
SSE
Publicly Offered
2019 Corporate
Bonds (Tranche III)
of China Yangtze
Power Co., Ltd.
19
CYPC
03
163052.
SH
6 Dec
2019
6 Dec
2022 2,000,000,000 3.49
Interest
payable
annually in
arrears,
principal
payable upon
maturity
SSE
Publicly Offered
2020 Corporate Bonds (Tranche I)
of China Yangtze
20
CYPC
01
163096.SH
8 Jan 2020
8 Jan 2023
1,500,000,000 3.37
Interest
payable
annually in
arrears,
principal
SSE

2020 Annual Report
76 / 259
Power Co., Ltd.
(Variety 1)
payable upon
maturity
Publicly Offered
2020 Corporate
Bonds (Tranche I)
of China Yangtze
Power Co., Ltd.
(Variety 2)
20
CYPC
02
163097.
SH
8 Jan
2020
8 Jan
2025 500,000,000 3.70
Interest
payable
annually in
arrears,
principal
payable upon
maturity
SSE
Information on principal and interest payment on corporate bonds
Applicable
During the reporting period, the Company made timely payment of interest on “16 CYPC 01”, “18
CYPC 01”, “18 CYPC 02”, “19 CYPC 01”, “19 CYPC 02” and “19 CYPC 03” for year 4, year 2, year 2,
year 1, year 1 and year 1 respectively, and made timely payment of interest on and principal of “17 CYPC
01”. During the reporting period, the Company made no interest payment on “20 CYPC 01” and “20
CYPC 02” as the same was not due.
Other information on corporate bonds
Non-applicable
II. Contact person and Contact Details of Custodian and Credit Rating Agency of Corporate
Bonds
Custodian of bonds
Name CITIC Securities Co., Ltd.
Office
address
CITIC Securities Building, No 48, Liangmaoqiao Rd,
Chaoyang District, Beijing
Contacts CHEN Xiaodong
Tel 010-60837028
Credit rating agency
Name China Chengxin International Credit Rating Co., Ltd.
Office
address
Building 6, Galaxy SOHO, No.2 Nanzhugan hutong,
Chaoyangmennei Avenue, Dongcheng District, Beijing
Others:
Applicable
During the reporting period, there was no change in the custodian for corporate bonds issued by the
Company and the credit rating agency was changed from China Chengxin Securities Rating Co., Ltd. to
China Chengxin International Credit Rating Co., Ltd.
China Chengxin Securities Rating Co., Ltd. ceased to engage in securities market credit rating
business as from 26 February 2020, and its securities market credit rating business was succeeded by
China Chengxin International Credit Rating Co. Ltd. The change of credit rating agency will not have any
adverse impact on investors.
III. Use of Proceeds of Bond Offering
Applicable
Proceeds have been used for purposes specified in the prospectus.
IV. Credit Rating of Bonds
Applicable
The latest rating is expected to be issued by 30 June 2021 and will be disclosed on the website of
SSE. During the reporting period, the Company engaged China Chengxin International Credit Rating Co., Ltd. to assign a rating on the issuer as well as on "16 CYPC 01", "17 CYPC 01", "18 CYPC 01" "18 CYPC
02" "19 CYPC 01" "19 CYPC 02" "19 CYPC 03" "20 CYPC 01" and "20 CYPC 02". China Chengxin

2020 Annual Report
77 / 259
International Credit Rating Co., Ltd. maintained AAA rating on the issuer with a stable outlook and
assigned AAA rating on "16 CYPC 01", "17 CYPC 01", "18 CYPC 01" "18 CYPC 02" "19 CYPC 01" "19
CYPC 02" "19 CYPC 03" "20 CYPC 01" and "20 CYPC 02". Rating on the Company remained stable
without change. The AAA rating indicates that the rated has very strong payment ability and has very low
default risk, basically immune to adverse economic environment.
V. Credit Enhancement Mechanism, Repayment Scheme and Other Relevant Information of and
on Corporate Bonds during the Reporting Period
Applicable
There were no changes to the credit enhancement mechanism, debt servicing plan and other related
circumstances of the Company's bonds during the reporting period.
VI. Holding of Bondholder Meetings
Non-applicable
VII. Duty Performance by Custodian of Corporate Bonds
Applicable
The 2019 Annual Custodian Report has been disclosed as required and is available on the website
of SSE. The custodian has no conflict of interest in the performance of its duties.
VIII. Accounting Figures and Financial Indicators of the Company for the Last Two Years as
at the End of the Reporting Period
Applicable
Unit: RMB Yuan
Main Indicators 2020 2019 Year-on-year
Change (%)
EBITDA 49,260,397,415.55 43,886,978,391.20 12.24
Current ratio 0.19 0.20 -5.00
Quick ratio 0.18 0.19 -5.26
Asset-liability ratio (%) 46.10 49.40 -6.69
Debt to EBITDA ratio 3.10 3.34 -7.19
Interest coverage ratio 7.28 6.12 18.95
Net cash from operating activities
to interest ratio
10.09 8.98 12.36
EBITDA to interest ratio 9.53 8.44 12.91
Loan repayment rate (%) 100 100 0.00
Interest payment rate (%) 100 100 0.00
IX. Information on Payment of Principal of and Interest on Other Bonds and Debt Instruments of
the Company
Applicable
During 2020, the Company repaid principal of “19 CYPC CP001”, “19 CYPC CP002”, “19 CYPC
CP003”, “19 CYPC SCP005”, “20 CYPC SCP001”, “20 CYPC SCP002”, “20 CYPC SCP003” and “20
CYPC SCP004” on maturity and made due payment of interest on “02 Three Gorges Bond”, “03 Three
Gorges Bond”, “15 CYPC MTN001”, “16 CYPC MTN001”, “16 CYPC MTN002”, “18 CYPC MTN001”,
“19 CYPC MTN001” and “19 CYPC MTN002”. Payment of principal of and interest on the above bonds
and debt financing instruments amounted to about RMB 19.823 billion.

2020 Annual Report
78 / 259
X. Credit Line Granted by Banks during the Reporting Period
Applicable
During the reporting period, the Company received bank facility of RMB 191.7 billion. The balance
of bank facility was RMB 161.723 billion at the end of the year. The Company repaid RMB 78.548 billion
of loans during the reporting period.
XI. Performance of Agreements or Undertakings in the Prospectus for Bonds During the Reporting
Period
Applicable
During the reporting period, the Company strictly observed relevant agreements in the Prospectus for
bonds of the Company and protected the interests of bond investors.
XII. Material Events of the Company and the Impact on Operating Results and Solvency of the
Company
Non-applicable

2020 Annual Report
79 / 259
Section 10 Financial Report
I. Auditor’s Report
Applicable
XYZH/2021BJAA30771
To All Shareholders of China Yangtze Power Co., Ltd.,
1. Auditor’s Opinion
We have audited the accompanying financial statements of China Yangtze Power Co., Ltd.
(hereinafter referred to as “CYPC ” or “the Company”) which comprise the consolidated balance sheet
and the parent’s balance sheet as at 31 December 2020, the consolidated income statement and the parent’s
income statement, the consolidated statement of cash flows and the parent’s statement of cash flows, the
consolidated statement of changes in shareholders’ equity and the parent’s statement of changes in
shareholders’ equity for year 2020, and notes to the financial statements.
In our opinion, the accompanying financial statements, in all material respects, have been prepared
in accordance with the requirements of Accounting Standards for Business Enterprises and give a fair
view of the consolidated financial position of the Company and the financial position of the parent as at
31 December 2020, and the consolidated operating results and cash flows of the Company and the
operating results and cash flows of the parent for the year then ended.
2. Basis for Opinion
We conducted our audit in accordance with the China Certified Public Accountants Auditing
Standards. Our responsibilities under those standards are further described in the Auditor’s
Responsibilities for the Audit of the Financial Statements section of our report. We are independent of the
Company have fulfilled our other ethical responsibilities in accordance with China Code of Ethics for
Certified Public Accountants. We believe that the audit evidence we have obtained is sufficient and
appropriate to provide a basis for our opinion.
3. Key Audit Matters
The key audit matters are matters that we consider to be the most important for the audit of the current
financial statements based on professional judgment. The response to these matters is based on the overall
audit of the financial statements and the formation of audit opinions. We do not express a separate opinion
on these matters.
Accuracy in operating cost

2020 Annual Report
80 / 259
Key audit matters Audit response
As described in Note VI. 40 to consolidated
financial statements of the Company, the
Company incurred operating costs totaling
RMB21,149 million in 2020, representing
65.17% of total profit, which had a material
impact on the financial statements;
The Company's operating costs are mainly
depreciation of fixed assets used in production
and fiscal charges, and such amounts have a
material impact on the financial statements;
For the above reasons, we have identified the
accuracy of operating costs as a key audit matter.
Main audit procedures we performed:
- Observe and supervise counting of significant
fixed assets used for production onsite;
-Apply methods such as re-calculation to check
amounts of fixed asset depreciation and fiscal
charges included in operating costs for their
accuracy;
-Analyze operating costs for the year for its
reasonableness using analytical review methods in
conjunction with audit on accounts including fixed
assets and construction in progress;
Significant asset acquisition and recognition of identifiable intangible assets arising therefrom
Key audit matters Audit response
As described in Note III and Note VII. 26 to
consolidated financial statements of the
Company, on 24 April 2020, the Company
acquired 100% equity in Sempra Americas
Bermuda Ltd. (now renamed Andes Bermuda
Ltd., "AB Company") and 100% equity in
Peruvian Opportunity Company S.A.C. ("POC")
(collectively, “Peru Companies”) for a
consideration of RMB25,422 million, and
engaged a qualified third party valuer to assess
Peru Companies' identifiable assets and liabilities
at the acquisition date. And the concession for
electricity distribution and sales s was separately
identified as an intangible asset.
As at 31 December 2020, this significant asset
acquisition resulted in goodwill of approximately
RMB1,010 million and separately identified
concessions of approximately RMB20,227
million.
The equity acquisition transaction involves the
determination of the acquisition date, the
Main audit procedures we performed:
- Obtain and review the transaction agreement for
the acquisition of the Peru Companies, the payment
of the acquisition price and, in this regard, review
the Company's judgment as to the acquisition date;
-evaluate the objectivity, independence and
professional competence of the third-party valuer
engaged by the Company;
-evaluate the reasonableness of the valuation
methods, period and important parameters of the
intangible assets;
-review the reasonableness of the methods,
assumptions and important parameters used to
assess the fair value of the identifiable assets and
liabilities of the Peru company at the acquisition
date;
-Evaluate the reasonableness of the Company's
division of asset groups and review the calculation
of goodwill and the accounting for business
combination;
-Assess the adequacy of the disclosure of the
acquisition in the financial statements.

2020 Annual Report
81 / 259
determination of the transaction consideration and
fair value at the acquisition date, the calculation
and apportionment of goodwill, the analysis of
control and the accounting for a business
combination under common control, which are
significant in amount and involve management's
estimates and judgments.
For these reasons, we have identified significant
asset acquisitions and the recognition of
identifiable intangible assets arising therefrom as
key audit matters.
4. Other Information
Management of CYPC (“management”) is responsible for the other information which comprises the
information included in the Company’s annual report for the year ended 31 December 2020 other than the
financial statements and our auditor’s report thereon.
Our opinion on the financial statements does not cover the other information and we do not express
any form of assurance conclusion thereon.
In connection with our audit of the financial statements, our responsibility is to read the other
information and, in doing so, consider whether the other information is materially inconsistent with the
financial statements or our knowledge obtained in the audit or otherwise appears to be materially misstated.
If, based on the work we have performed, we conclude that there is a material misstatement of this
other information, we are required to report that fact. We have nothing to report in this regard.
5. Responsibilities of Management and Those Charged with Governance for the Financial
Statements
Management is responsible for the preparation of the financial statements that give a fair view in
accordance with requirements of Accounting Standards for Business Enterprises, and for such internal
control as management determines is necessary to enable the preparation of financial statements that are
free from material misstatement, whether due to fraud or error.
In preparing the financial statements, management is responsible for assessing the Company's ability
to continue as a going concern, disclosing, as applicable, matters related to going concern and using the
going concern basis of accounting unless management either intends to liquidate the Company or to cease
operations, or has no realistic alternative but to do so.

2020 Annual Report
82 / 259
Those charged with governance are responsible for supervising the Company's financial reporting
process.
6. Auditor's Responsibilities for the Audit of the Financial Statements
Our objectives are to obtain reasonable assurance about whether the financial statements as a whole
are free from material misstatement, whether due to fraud or error, and to issue an auditor’s report that
includes our opinion. Reasonable assurance is a high level of assurance but is not a guarantee that an audit
conducted in accordance with the China Certified Public Accountants Auditing Standards will always
detect a material misstatement when it exists. Misstatements can arise from fraud or error and are
considered material if, individually or in the aggregate, they could reasonably be expected to influence the
economic decisions of users taken on the basis of these financial statements.
As part of an audit, in accordance with accordance with the Auditing Standards, we exercise
professional judgment and maintain professional skepticism throughout the audit. We also:
(1) Identify and assess the risks of material misstatement of the financial statements, whether due to
fraud or error, design and perform audit procedures responsive to those risks, and obtain audit
evidence that is sufficient and appropriate to provide a basis for our opinion. The risk of not detecting
a material misstatement resulting from fraud is higher than for one resulting from error, as fraud may
involve collusion, forgery, intentional omissions, misrepresentations, or the override of internal
control.
(2) Obtain an understanding of internal control relevant to the audit in order to design audit
procedures that are appropriate in the circumstances, but not for the purpose of expressing an opinion
on the effectiveness of internal control.
(3) Evaluate the appropriateness of accounting policies used and the reasonableness of accounting
estimates and related disclosures made by management.
(4) Conclude on the appropriateness of management’s use of the going concern basis of accounting
and, based on the audit evidence obtained, whether a material uncertainty exists related to events or
conditions that may cast significant doubt on the Company’s ability to continue as a going concern.
If we conclude that a material uncertainty exists, we are required to draw attention in our auditor’s
report to the related disclosures in the financial statements or, if such disclosures are inadequate, to
modify our opinion. Our conclusions are based on the audit evidence obtained up to the date of our
auditor’s report. However, future events or conditions may cause the Company to cease to continue
as a going concern.
(5) Evaluate the overall presentation, structure and content of the financial statements, and whether
the financial statements represent the underlying transactions and events in a manner that achieves

2020 Annual Report
83 / 259
fair presentation.
(6) Obtain sufficient and appropriate audit evidence about the financial information of entities or
operations in CYPC to express our opinion on the financial statements. We are responsible for
directing, supervising and performing audit at group level and are solely liable for our opinion.
We communicate with those charged with governance regarding, among other matters, the planned
scope and timing of the audit and significant audit findings, including any significant deficiencies in
internal control that we identify during our audit.
We also provide a statement to those charged with governance on compliance with the ethical
requirements associated with independence and communicate with those charged with governance all
relationships and other matters that may reasonably be considered to affect our independence, and related
precautions (if applicable).
From the matters communicated with those charged with governance, we determine those matters
that were of most significance in the audit of the financial statements of the current period and are therefore
the key audit matters. We describe these matters in our auditor's report unless law or regulation precludes
public disclosure about the matter or when, in extremely rare circumstances, we determine that a matter
should not be communicated in our report because the adverse consequences of doing so would reasonably
be expected to outweigh the public interest benefits of such communication.
ShineWing Certified Public Accountants LLP China Certified Public Accountant: ZHAN Jun
(Engagement Partner)
China Certified Public Accountant: QIU Xin
Beijing · PRC 29 April 2021
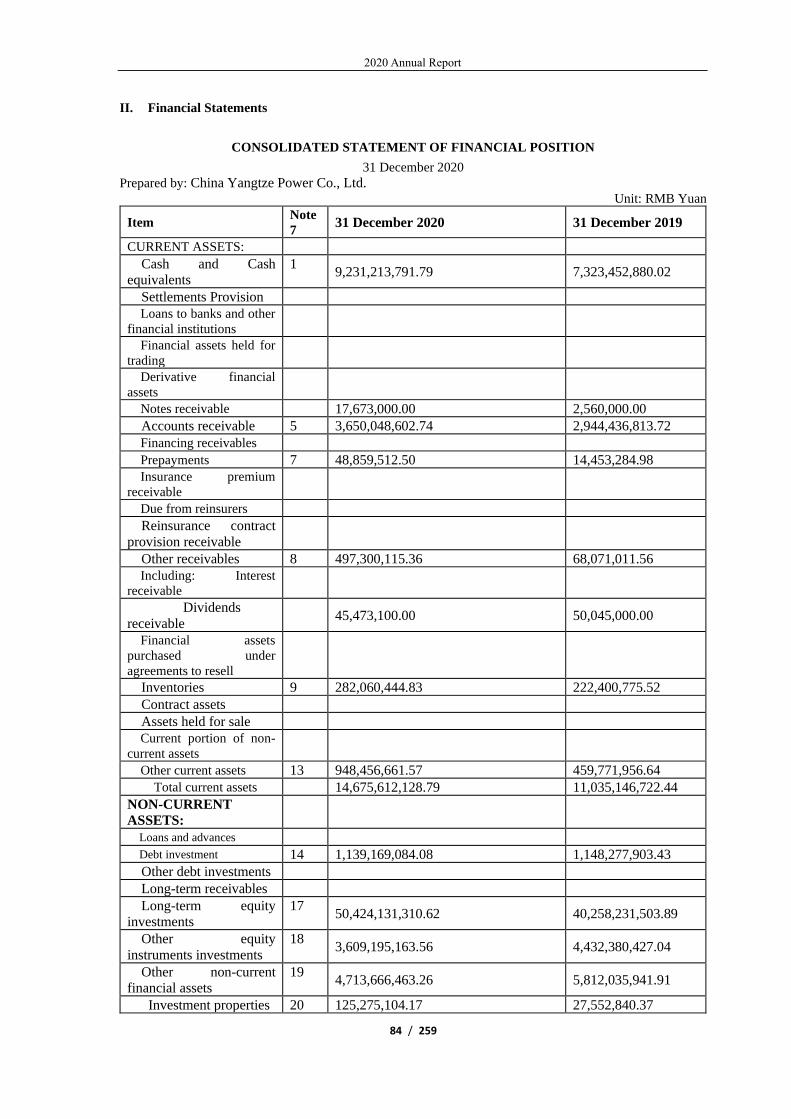
2020 Annual Report
84 / 259
II. Financial Statements
CONSOLIDATED STATEMENT OF FINANCIAL POSITION
31 December 2020
Prepared by: China Yangtze Power Co., Ltd. Unit: RMB Yuan
Item Note
7 31 December 2020 31 December 2019
CURRENT ASSETS:
Cash and Cash
equivalents
1 9,231,213,791.79 7,323,452,880.02
Settlements Provision
Loans to banks and other
financial institutions
Financial assets held for
trading
Derivative financial
assets
Notes receivable 17,673,000.00 2,560,000.00
Accounts receivable 5 3,650,048,602.74 2,944,436,813.72
Financing receivables
Prepayments 7 48,859,512.50 14,453,284.98
Insurance premium
receivable
Due from reinsurers
Reinsurance contract
provision receivable
Other receivables 8 497,300,115.36 68,071,011.56
Including: Interest
receivable
Dividends
receivable
45,473,100.00 50,045,000.00
Financial assets
purchased under
agreements to resell
Inventories 9 282,060,444.83 222,400,775.52
Contract assets
Assets held for sale
Current portion of non-
current assets
Other current assets 13 948,456,661.57 459,771,956.64
Total current assets 14,675,612,128.79 11,035,146,722.44
NON-CURRENT
ASSETS:
Loans and advances
Debt investment 14 1,139,169,084.08 1,148,277,903.43
Other debt investments
Long-term receivables
Long-term equity
investments
17 50,424,131,310.62 40,258,231,503.89
Other equity
instruments investments
18 3,609,195,163.56 4,432,380,427.04
Other non-current financial assets
19 4,713,666,463.26 5,812,035,941.91
Investment properties 20 125,275,104.17 27,552,840.37

2020 Annual Report
85 / 259
Fixed assets 21 231,119,863,354.48 226,291,965,212.17
Construction in
progress
22 2,993,468,500.20 6,880,639,435.66
Productive biological assets
Oil and gas assets
Right-of-use asset
Intangible assets 26 20,614,325,419.64 191,462,744.50
Development
expenditures
Goodwill 28 1,010,349,814.92
Long-term prepaid expenses 1,205,923.35 1,742,787.89
Deferred tax assets 30 385,247,857.13 369,173,036.54
Other non-current assets 15,586,434.83 34,272,485.05
Total non-current assets 316,151,484,430.24 285,447,734,318.45
Total assets 330,827,096,559.03 296,482,881,040.89
Current liabilities
Short-term borrowings 32 24,057,628,342.50 21,308,000,000.00 Borrowing from the central
bank
Deposits and balances from
banks and other financial
institutions
Financial liabilities held for
trading 33 640,897,029.23 768,403,141.10
Derivative financial
liabilities
Notes payable 26,658,209.68 18,701,549.83
Accounts payable 36 867,671,236.16 86,819,605.55
Receipts in advance 37 33,980,139.67 9,164,940.98
Contract liabilities 48,910.52
Financial assets sold
under agreements to buy
Customer deposits and
balances
from banks and other
financial institutions
Customer brokerage
deposits
Securities underwriting
brokerage deposits
Payroll and employee
benefits payable 39 219,231,174.29 120,539,909.11
Taxes payable 40 4,235,444,499.44 2,106,242,913.91
Other payables 41 16,960,189,786.68 21,042,264,353.26
Including: Interest
payable
1,091,987,201.14 897,073,966.87
Dividend Payable 36,473,316.08 Fees and commission
payable
Payable Reinsurance Liabilities classified as held
for sale
Current portion of non-
current liabilities 43 23,924,325,034.79 2,499,762,842.57
Other current liabilities 44 7,500,533,260.58 7,998,650,574.74
Total current liabilities 78,466,607,623.54 55,958,549,831.05
Non-current liabilities

2020 Annual Report
86 / 259
Insurance reserves
Long-term borrowings 45 14,447,141,791.44 24,600,000,000.00
Bonds payable 46 37,527,057,075.03 43,794,792,492.21
Including: Preference
share
Perpetual debt
Lease liabilities
Long-term Payable 48 20,080,756,020.71 21,232,945,436.94
Long-term payroll and
employee benefits payable
Provisions 16,245,669.92
Deferred income 7,276,220.13 5,833,758.06
Deferred Tax Liabilities 30 1,960,405,682.52 874,792,997.65
Other non-current liabilities Total non-current
liabilities 74,038,882,459.75 90,508,364,684.86
Total Liabilities 152,505,490,083.29 146,466,914,515.91 SHAREHOLDERS’
EQUITY:
Paid-in Capital 53 22,741,859,230.00 22,000,000,000.00
Capital Reserves
Including: Preference
share
Perpetual debt
Capital reserve 55 56,928,124,174.94 44,364,313,786.27
Less: Treasury Shares Other comprehensive
income 57 313,556,807.71 2,352,431,567.60
Special reserve
Surplus reserve 59 24,319,522,433.93 24,319,522,433.93
General reserve
Retained earnings 60 67,815,084,345.02 56,473,906,836.25 Equity attributable to
owners of the parent 172,118,146,991.60 149,510,174,624.05
Non-controlling
interests
6,203,459,484.14 505,791,900.93
Total shareholders’ equity 178,321,606,475.74 150,015,966,524.98 TOTAL LIABILITIES
AND SHAREHOLDERS’
EQUITY
330,827,096,559.03 296,482,881,040.89
Legal Representative:Lei Mingshan Chief Accountant: Zhan Pingyuan
Head of Accounting Department: Zhang Na
COMPANY STATEMENT OF FINANCIAL POSITION
31 December 2020
Prepared by: China Yangtze Power Co., Ltd. Unit: RMB Yuan
Item Note
17 31 December 2020 31 December 2019
CURRENT ASSETS:
Cash and Cash
equivalents
3,978,908,570.72 4,195,981,088.98
Financial assets held
for trading

2020 Annual Report
87 / 259
Derivative financial
assets
Notes receivable 16,800,000.00 2,300,000.00
Accounts receivable 1 1,681,426,962.93 1,640,765,860.31
Financing
receivables
Prepayments 21,721,249.03 13,370,253.30
Other receivables 2 382,249,508.06 67,315,820.17
Including: Interest
receivable
Dividends
receivable
45,473,100.00 50,045,000.00
Inventories 148,625,915.93 128,785,215.82
Contract assets
Assets held for sale
Current portion of
non-current assets
Other current assets 400,005,769.04 315,531,193.73
Total current
assets
6,629,737,975.71 6,364,049,432.31
NON-CURRENT
ASSETS:
Debt investment
Other debt
investments
Long-term
receivables
Long-term equity
investments
3 103,001,611,185.89 78,052,733,566.35
Other equity
instruments
investments
3,217,073,876.83 3,912,606,164.86
Other non-current
financial assets
3,535,850,527.86 4,255,519,358.34
Investment
properties
26,460,352.37 27,552,840.37
Fixed assets 91,912,217,948.12 95,931,292,255.59
Construction in
progress
464,366,936.37 946,462,767.36
Productive
biological assets
Oil and gas assets
Right-of-use asset
Intangible assets 195,210,484.09 89,336,000.23
Development
expenditures
Goodwill
Long-term prepaid
expenses
Deferred tax assets 73,320,614.32 98,251,997.77
Other non-current
assets
15,586,434.83 34,272,485.05
Total non-current assets
202,441,698,360.68 183,348,027,435.92
Total assets 209,071,436,336.39 189,712,076,868.23

2020 Annual Report
88 / 259
Current liabilities:
Short-term
borrowings
10,850,000,000.00 4,920,000,000.00
Financial liabilities
held for trading
Derivative financial
liabilities
Notes payable 25,618,826.08 18,701,549.83
Accounts payable 42,133,196.84 49,275,071.09
Receipts in advance 8,788,393.38 8,788,393.37
Contract liabilities
Payroll and
employee benefits
payable
82,124,919.31 97,805,901.99
Taxes payable 2,689,038,478.78 1,018,564,145.60
Other payables 1,627,706,272.34 4,082,085,127.73
Including: Interest
payable
902,865,871.52 837,531,967.98
Dividend
Payable
Liabilities classified
as held for sale
Current portion of
non-current liabilities
20,453,152,452.60 2,499,762,842.57
Other current
liabilities
7,500,526,902.22 7,998,650,574.74
Total current
liabilities
43,279,089,441.55 20,693,633,606.92
Non-current
liabilities:
Long-term
borrowings
Bonds payable 7,000,000,000.00 17,600,000,000.00
Including:
Preference share
34,948,377,070.45 40,439,102,884.09
Perpetual
debt
Lease liabilities
Long-term Payable
Long-term payroll
and employee benefits
payable
Provisions
Deferred income
Deferred Tax
Liabilities
Other non-current
liabilities
715,444,884.34 902,756,097.24
Total non-current liabilities

2020 Annual Report
89 / 259
Total
Liabilities
42,663,821,954.79 58,941,858,981.33
SHAREHOLDERS’
EQUITY:
85,942,911,396.34 79,635,492,588.25
Paid-in Capital
Capital Reserves 22,741,859,230.00 22,000,000,000.00
Including:
Preference share
Perpetual
debt
Capital reserve
Less: Treasury
Shares
59,502,183,193.81 46,906,964,332.39
Other
comprehensive income
Special reserve 1,820,853,213.49 2,502,766,455.34
Surplus reserve
Retained earnings 22,934,762,401.97 22,934,762,401.97
Total
shareholders’ equity
16,128,866,900.78 15,732,091,090.28
TOTAL
LIABILITIES AND
SHAREHOLDERS’
EQUITY
123,128,524,940.05 110,076,584,279.98
Legal Representative:Lei Mingshan Chief Accountant:Zhan Pingyuan
Head of Accounting Department:Zhang Na
CONSOLIDATED INCOME STATEMENT
For the year ended 31 December 2020 Unit: RMB yuan
Item Note
7 2020 2019
I、Total revenue 57,783,367,039.83 49,874,086,874.95
Including: Operating revenue 61 57,783,367,039.83 49,874,086,874.95
Interest income
Net earned premiums
Net fee and
commission revenue
II、Total cost of sales 28,776,077,425.53 25,959,547,802.90
Including: Cost of sales 61 21,149,454,266.44 18,697,294,123.93
Interest expenses
Fees and commission
expenses
Surrenders
Net payments for
insurance claims
Net provision of
insurance reserve
Policyholder
dividends
Reinsurance expenses
Taxes and surcharges 62 1,192,929,347.63 1,168,814,152.25
Selling expenses 63 115,417,318.42 27,792,136.69

2020 Annual Report
90 / 259
General and
administrative expenses 64 1,292,798,651.45 813,629,745.43
Research and
development expenses 65 39,568,009.51 41,066,919.32
Finance expenses 66 4,985,909,832.08 5,210,950,725.28
Including: Interest expenses
(expressed
with positive value) 5,166,955,172.60 5,200,957,545.39
Interest
income 100,213,191.69 71,556,891.30
Add: Other income 67 5,886,834.66 2,606,789.45
Investment
income/(loss) 68 4,052,756,076.57 3,074,753,621.99
Including: Share of
profits or loss of associates
and joint ventures 3,182,977,402.41 2,077,234,391.59
Gain from
derecognition of financial
assets measured at amortized
cost
Exchange gains or
losses
Net exposure hedging gains/
(losses)
Gain/ (loss) on the
changes in fair value 70 -172,887,058.21 -26,947,041.04
Credit impairment
losses 71 -1,492,867.05 3,342,701.66
Assets impairment
losses 72 -17,737,932.85 -35,595,283.18
Gain/ (loss) from
disposal of assets 73 22,038,670.15 26,792.08
III、Operating profit 32,895,853,337.57 26,932,726,653.01
Add: Non-operating
income 74 50,968,275.16 29,219,094.32
Less: Non-operating
expenses 75 491,280,818.61 334,933,992.54
IV、 Profit/(loss) before tax 32,455,540,794.12 26,627,011,754.79
Less: Income tax expense 76 5,949,278,995.30 5,059,564,654.60
V、 Net profit /(loss) 26,506,261,798.82 21,567,447,100.19
(1) Categorized by operation continuity
1. Net profit from
continuing operations
26,506,261,798.82 21,567,447,100.19
2. Net profit from
discontinuing operations
(2)Categorized by ownership
1. Net profit attributable
to owners of the parent
26,297,890,222.70 21,543,493,635.57
2. Net profit attributable
to non-controlling interests
208,371,576.12 23,953,464.62
VI 、 Other comprehensive
income, net of tax
-2,342,891,062.80 407,999,197.81
(I)Other comprehensive
income, net of tax, attributable
to owners of the parent
-2,034,622,149.75 406,775,213.14

2020 Annual Report
91 / 259
1.Other comprehensive
income that will not be
reclassified to profit or loss
-618,339,810.10 251,672,950.90
(1)Remeasurement gains
or losses of a defined benefit
plan
(2)Other comprehensive
income using the equity
method that will not be
reclassified to profit or loss
2,747,070.92 46,955,233.27
(3)Changes in fair value
of other equity instrument
investments
-621,086,881.02 204,717,717.63
(4)Changes in fair value
of enterprise's own credit risk
2.Other comprehensive
income to be reclassified to
profit or loss
-1,416,282,339.65 155,102,262.24
(1)Other comprehensive
income that can be reclassified
to profit or loss in equity
method
-151,969,944.28 90,347,208.15
(2)Changes in fair value
of other debt investments
(3)Amount of financial
assets reclassified into other
comprehensive income
(4)Provision for credit
impairment of other debt
investments
(5)Cash flow hedging
reserves (effective part of
profit and loss of cash flow
hedging)
(6)Exchange differences
on translation of foreign
currency financial statements
-1,264,312,395.37 64,755,054.09
(7)Others
(II)Other comprehensive
income, net of tax, attributable
to non-controlling interests
-308,268,913.05 1,223,984.67
VII 、 Total comprehensive
income
24,163,370,736.02 21,975,446,298.00
(I)Total comprehensive
income attributable to owners
of the parent
24,263,268,072.95 21,950,268,848.71
(II)Total comprehensive
income attributable to non-
controlling interests
-99,897,336.93 25,177,449.29
VIII、Earnings per share:
( I ) Basic earnings per
share (yuan / share)
1.1853 0.9792
(II)Diluted earnings per
share (yuan / share)
1.1853 0.9792

2020 Annual Report
92 / 259
Amongst business combination under common control in the current period, the net profit realized by the
mergee prior to the combination is:0 yuan (previous year: 0)
Legal Representative:Lei Mingshan Chief Accountant: Zhan Pingyuan
Head of Accounting Department: Zhang Na
INCOME STATEMENT OF COMPANY
For the year ended 31 December 2020
Unit: RMB yuan
Item Note 17 2020 2019
I、Total revenue 4 28,904,856,391.56 25,543,879,408.36
Less: Total cost of sales 4 8,931,263,633.65 9,180,512,555.71
Taxes and surcharges 455,436,526.45 444,095,537.49
Selling expenses 15,935,883.90 13,040,013.62
Administrative expenses 640,685,662.72 469,739,955.76
Research and development
expenses 27,873,504.45 33,182,530.97
Finance expenses 2,997,856,378.73 2,776,197,071.16
Including: Interest expenses
(expressed with positive value) 3,042,612,320.94 2,799,073,815.23
Interest income 46,510,946.37 49,078,803.92
Add: Other income 3,213,340.84 1,227,811.32
Investment income/(loss) 5 3,739,463,466.11 2,709,620,090.44
Including: Share of profits or
loss of associates and joint ventures 3,072,615,088.68 1,955,217,269.35
Gain from derecognition of
financial assets measured at amortized
cost
Net exposure hedging gains/
(losses)
Gain/ (loss) on the changes in
fair value -209,840,546.90 292,704,083.17
Credit impairment losses -350,732.57 472,724.55
Assets impairment losses 2,874,293.16 -13,136,165.82
Gain/ (loss) from disposal of
assets 22,067,694.01 10,769.12
II、Operating profit/Loss 19,393,232,316.31 15,618,011,056.43
Add: Non-operating income 50,769,195.13 27,852,846.92
Less: Non-operating expenses 203,146,732.61 52,629,588.57
III、Profit/(loss) before tax 19,240,854,778.83 15,593,234,314.78
Less: Income tax expense 3,885,963,636.63 3,384,402,803.96
IV、Net profit /(loss) 15,354,891,142.20 12,208,831,510.82
( I ) Net profit from continuing
operations 15,354,891,142.20 12,208,831,510.82
(II)Net profit from discontinuing
operations
V、Other comprehensive income, net of
tax -679,063,249.48 289,048,452.22
(I)Other comprehensive income,
net of tax -518,292,306.81 192,298,455.67
1. Other comprehensive income
that will not be reclassified to profit or
loss
2. Other comprehensive income
using the equity method that will not be
reclassified to profit or loss 3,356,909.21 41,568,789.15

2020 Annual Report
93 / 259
3. Changes in fair value of other
equity instrument investments -521,649,216.02 150,729,666.52
4. Changes in fair value of
enterprise's own credit risk
(II)Other comprehensive income
to be reclassified to profit or loss -160,770,942.67 96,749,996.55
1. Other comprehensive income
that can be reclassified to profit or loss
in equity method -160,770,942.67 96,749,996.55
2. Changes in fair value of other
debt investments
3. Amount of financial assets
reclassified into other comprehensive
income
4. Provision for credit impairment
of other debt investments
5. Cash flow hedging reserves
6. Exchange differences on
translation of foreign currency financial
statements
7.Other
VI、Total comprehensive income 14,675,827,892.72 12,497,879,963.04
VII、Total comprehensive income
( I ) Basic earnings per share
(yuan / share)
(II)Diluted earnings per share
(yuan / share)
Legal Representative:Lei Mingshan Chief Accountant: Zhan Pingyuan
Head of Accounting Department: Zhang Na
CONSOLIDATED STATEMENT OF CASH FLOWS
For the year ended 31 December 2020 Unit: RMB yuan
Item Note7 2020 2019 I 、 CASH FLOWS FROM
OPERATING ACTIVITIES
Cash receipts from the sale of goods
and the rendering of services 65,699,895,013.35 56,423,104,095.88
Net increase in customer bank
deposits and due to banks and other
financial institutions
Net increase in loans from the central
bank
Net increase in funds borrowed from
other financial institutions
Cash premiums received on original
insurance contracts
Net cash received from re-insurance
business
Net increase in deposits and
investments from insurers
Cash received from interest, fees and
commission
Net increase in funds deposit Net increase in repurchase business
funds

2020 Annual Report
94 / 259
Net income from securities trading
brokerage business
Tax refunds received Cash received relating to other
operating activities 78 528,865,293.99 196,076,781.07
Sub-total of cash inflows 66,228,760,307.34 56,619,180,876.95 Cash paid for purchase of goods and
services 9,499,436,962.27 4,970,935,679.15
Net increase in loans and payments
on behalf of customers
Net increase in deposits with central
bank and other financial institutions
Payments for claims for original
insurance contracts
Net increase in funds lent Cash paid for interest, fees and
commission
Commissions on insurance policies
paid
Cash paid to and on behalf of
employee 2,610,978,872.63 1,681,923,377.15
Cash paid for taxes 12,180,759,493.47 12,971,173,075.60 Cash paid relating to other operating
activities 78 900,720,578.57 530,729,174.77
Sub-total of cash outflows 25,191,895,906.94 20,154,761,306.67 Net cash flows from operating
activities 41,036,864,400.40 36,464,419,570.28
II 、 CASH FLOWS FROM
INVESTING ACTIVITIES
Cash received from disposal of
investments 91,515,324,035.50 74,479,542,574.14
Cash received from investment
income 1,588,089,130.39 1,401,270,454.59
Net proceeds from disposal of
property, plant and equipment,
intangible assets and other long-term
assets
11,688,319.11 12,178,908.70
Cash received from disposal of
subsidiaries and other business units
Cash received relating to other
investing activitie
Sub-total of cash inflows 93,115,101,485.00 75,892,991,937.43 Purchase of property, plant and
equipment, intangible assets and other
non-current assets 3,627,862,822.44 2,716,832,699.30
Cash paid for investments 101,333,734,312.21 79,807,613,734.58 Net increase in secured loans Net cash paid for acquisition of a
subsidiary and other operating units 24,000,543,409.77
Cash paid relating to other investing
activities 78 190,217,371.81
Sub-total of cash outflows 129,152,357,916.23 82,524,446,433.88 Net cash flows from investing
activities -36,037,256,431.23 -6,631,454,496.45
III 、 Cash flows from financing
activities:
Cash received from investment 14,931,906,615.82 Including: Cash receipts from capital
contributions from non-controlling
interests of subsidiaries 1,476,545,673.69
Proceeds from borrowings 99,092,695,765.97 87,122,964,416.74 Cash receipts relating to other
financing activities 78 5,974,723,001.24

2020 Annual Report
95 / 259
Subtotal of cash inflows 119,999,325,383.03 87,122,964,416.74 Repayments for debts 95,990,337,350.22 81,704,081,939.00 Cash payments for distribution of
dividends or profit and interest
expenses 19,291,552,358.96 18,643,807,212.31
Including: Dividends or profit paid to
non-controlling shareholders of
subsidiaries 108,579,541.22 2,592,739.85
Cash payments relating to other
financing activities 78 7,724,761,705.94 14,648,665,135.50
Subtotal of cash outflows 123,006,651,415.12 114,996,554,286.81 Net cash flows from financing
activities -3,007,326,032.09 -27,873,589,870.07
IV、EFFECT OF EXCHANGE RATE
CHANGES ON CASH AND CASH
EQUIVALENTS
-86,009,125.31 24,080,600.22
V、NET INCREASE IN CASH AND
CASH EQUIVALENTS 79 1,906,272,811.77 1,983,455,803.98
Add: Cash and cash equivalents at
beginning of year 79 7,317,940,980.02 5,334,485,176.04
VI 、 CASH AND CASH
EQUIVALENTS AT END OF YEAR 79 9,224,213,791.79 7,317,940,980.02
Legal Representative: Lei Mingshan Chief Accountant: Zhan Pingyuan
Head of Accounting Department:Zhang Na
COMPANY STATEMENT OF CASH FLOWS
For the year ended 31 December 2020
Unit: RMB yuan
Item Notes 2020 2019
I.CASH FLOWS FROM
OPERATING ACTIVITIES
Cash receipts from the sale of
goods and the rendering of services 32,127,048,335.16 28,830,424,910.03
Tax refunds received
Cash received relating to other
operating activities 173,211,165.88 151,673,005.61
Sub-total of cash inflows 32,300,259,501.04 28,982,097,915.64
Cash paid for purchase of goods
and services 3,218,720,948.02 2,713,810,036.23
Cash paid to and on behalf of
employee 1,466,666,561.48 1,125,997,660.82
Cash paid for taxes 6,177,649,094.80 7,658,032,625.87
Cash paid relating to other
operating activities 410,422,370.54 336,177,375.67
Sub-total of cash outflows 11,273,458,974.84 11,834,017,698.59
Net cash flows from operating
activities 21,026,800,526.20 17,148,080,217.05
II 、 CASH FLOWS FROM
INVESTING ACTIVITIES:
Cash received from disposal of
investments 80,987,493,485.00 56,365,021,388.44
Cash received from investment
income 1,368,418,342.85 1,171,410,900.13
Cash received from disposal of
subsidiaries and other business
units 11,688,319.11 12,170,157.00
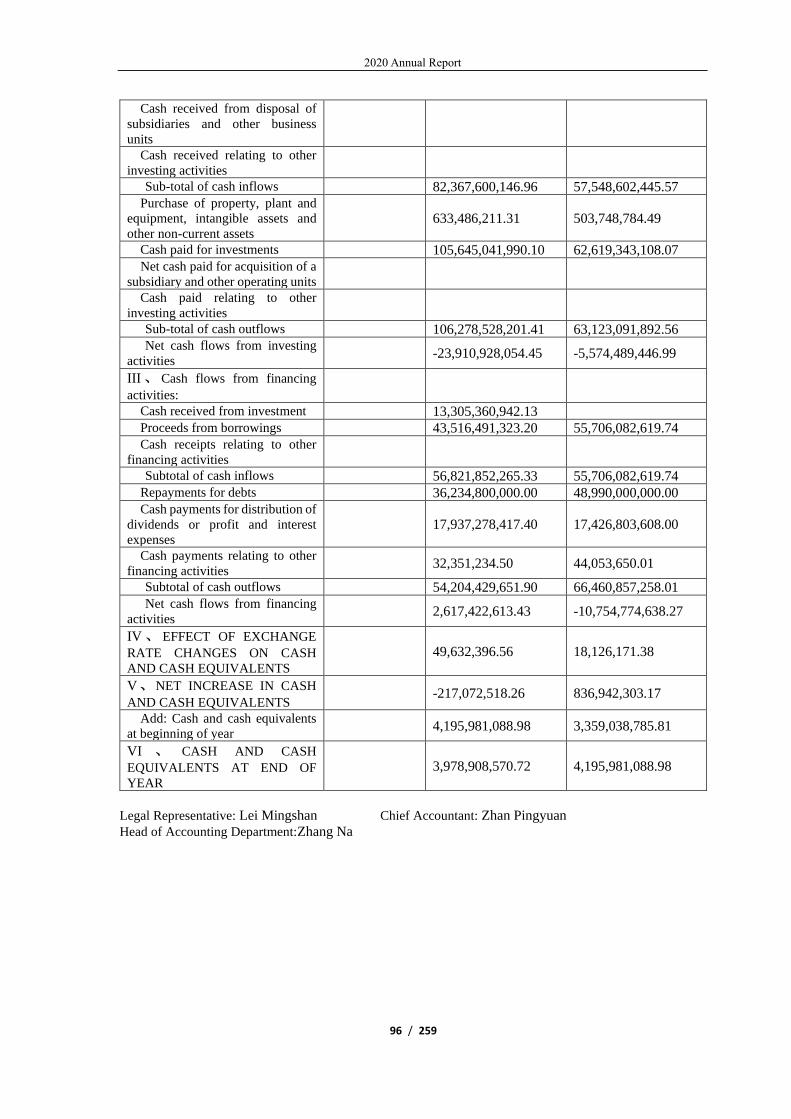
2020 Annual Report
96 / 259
Cash received from disposal of
subsidiaries and other business
units
Cash received relating to other
investing activities
Sub-total of cash inflows 82,367,600,146.96 57,548,602,445.57
Purchase of property, plant and
equipment, intangible assets and
other non-current assets 633,486,211.31 503,748,784.49
Cash paid for investments 105,645,041,990.10 62,619,343,108.07
Net cash paid for acquisition of a
subsidiary and other operating units
Cash paid relating to other
investing activities
Sub-total of cash outflows 106,278,528,201.41 63,123,091,892.56
Net cash flows from investing
activities -23,910,928,054.45 -5,574,489,446.99
III 、 Cash flows from financing
activities:
Cash received from investment 13,305,360,942.13
Proceeds from borrowings 43,516,491,323.20 55,706,082,619.74
Cash receipts relating to other
financing activities
Subtotal of cash inflows 56,821,852,265.33 55,706,082,619.74
Repayments for debts 36,234,800,000.00 48,990,000,000.00
Cash payments for distribution of
dividends or profit and interest
expenses 17,937,278,417.40 17,426,803,608.00
Cash payments relating to other
financing activities 32,351,234.50 44,053,650.01
Subtotal of cash outflows 54,204,429,651.90 66,460,857,258.01
Net cash flows from financing
activities 2,617,422,613.43 -10,754,774,638.27
IV 、 EFFECT OF EXCHANGE
RATE CHANGES ON CASH
AND CASH EQUIVALENTS
49,632,396.56 18,126,171.38
V、NET INCREASE IN CASH
AND CASH EQUIVALENTS -217,072,518.26 836,942,303.17
Add: Cash and cash equivalents
at beginning of year 4,195,981,088.98 3,359,038,785.81
VI 、 CASH AND CASH
EQUIVALENTS AT END OF
YEAR
3,978,908,570.72 4,195,981,088.98
Legal Representative: Lei Mingshan Chief Accountant: Zhan Pingyuan
Head of Accounting Department:Zhang Na

2020 Annual Report
97 / 259
CONSOLIDATED STATEMENT OF CHANGES IN EQUITY
For the year ended 31 December 2020
Unit: RMB yuan
Item
2020
Equity attributable to owners of the parent
Non-
controlling
interests
Total
shareholders’
equity Share capital
Other equity instruments Capital
reserve
Less:
Treasury
Shares
Other
comprehensive
income
Special
reserve
Surplus
reserve
General
reserve
Retained
earnings preference
share
Perpetual
debt Others
I、Balance at the
end of previous
year
22,000,000,000.00 44,364,313,786.27 2,352,431,567.60 24,319,522,433.93 56,473,906,836.25 505,791,900.93 150,015,966,524.98
Changes in
accounting policies
Corrections of
prior period errors
Business
combination under
common control
Others
II、Balance at the
beginning of the
year
22,000,000,000.00 44,364,313,786.27 2,352,431,567.60 24,319,522,433.93 56,473,906,836.25 505,791,900.93 150,015,966,524.98
III 、Increase/(decrease)
during the period
741,859,230.00 12,563,810,388.67 -2,038,874,759.89 11,341,177,508.77 5,697,667,583.21 28,305,639,950.76
( i ) Total
comprehensive
income
-2,034,622,149.75 26,297,890,222.70 -99,897,336.93 24,163,370,736.02

2020 Annual Report
98 / 259
(ii)Shareholders’
contributions and
reduction
741,859,230.00 12,562,562,126.53 5,913,416,400.70 19,217,837,757.23
1 . Shareholders
‘contributions in
ordinary share
741,859,230.00 12,562,562,126.53 1,444,847,184.99 14,749,268,541.52
2 . Other equity
instruments
contributions
3 . Amount of
share-based
payments
recognized in
equity
4.Others 4,468,569,215.71 4,468,569,215.71
(3) Profit
distribution
-
14,960,000,000.00 -115,806,445.47 -15,075,806,445.47
(i) Transfer to
surplus reserve
(ii) Transfer to
general Reserve
(iii) Distribution to
shareholders
-
14,960,000,000.00 -115,806,445.47 -15,075,806,445.47
(iv) Others
(4) Transfer within
equity -4,252,610.14 4,252,610.14
(i) Capital reserves
converted to share
capital
(ii) Surplus
reserves converted
to share capital
(iii) Loss made up
by surplus reserves
(iv) Changes in the
defined benefit
plan transferred to
retained earnings

2020 Annual Report
99 / 259
(v) Other
comprehensive
income transferred
to retained
earnings
-4,252,610.14 4,252,610.14
(vi) Others
(5). Special reserve
(i). Additions
(ii). Utilisation
(6) Others 1,248,262.14 -965,324.07 -45,035.09 237,902.98
V、Balance at the
end of the period 22,741,859,230.00 56,928,124,174.94 313,556,807.71 24,319,522,433.93 67,815,084,345.02 6,203,459,484.14 178,321,606,475.74

2020 Annual Report
100 / 259
Item
CONSOLIDATED STATEMENT OF CHANGES IN EQUITY
For the year ended 31 December2020
Unit: RMB yuan
2019
Equity attributable to owners of the parent
Non-controlling
interests
Total shareholders’
equity Share capital
Other equity instruments
Capital reserve
Less:
Treasury
Shares
Other
comprehensive
income
Special
reserve
Surplus
reserve
Genera
l
reserve
Retained
earnings preference
share
Perpetua
l debt Others
I、Balance at the end
of previous year 22,000,000,000.00 44,295,503,166.39 3,187,914,292.67 24,319,522,433.93 48,400,469,257.13 481,143,916.91 142,684,553,067.03
Changes in
accounting policies -543,118,753.60 561,377,843.66 6,742.18 18,265,832.24
Corrections of prior
period errors
Business
combination under common control
Others
II、 Balance at the
beginning of the year 22,000,000,000.00 44,295,503,166.39 2,644,795,539.07 24,319,522,433.93 48,961,847,100.79 481,150,659.09 142,702,818,899.27
III 、Increase/(decrease) during the period
68,810,619.88 -292,363,971.47 7,512,059,735.46 24,641,241.84 7,313,147,625.71
(1) Total
comprehensive income
406,775,213.14 21,543,493,635.57 25,177,449.29 21,975,446,298.00
(2) Shareholders’
contributions and
reduction
(i) Shareholders’
contribution in
ordinary share
(ii) Other equity instruments
contributions
3 . (iii) Amount of
share-based
payments recognized in equity
(iv) Others
(3). Profit
distribution -14,960,000,000.00 -2,592,739.85 -14,962,592,739.85
(i) Transfer to surplus
reserve
(ii) Transfer to
general Reserve
(iii) Distribution to shareholders
-14,960,000,000.00 -2,592,739.85 -14,962,592,739.85

2020 Annual Report
101 / 259
Legal Representative:Lei Mingshan Chief Accountant:Zhan Pingyuan Head of Accounting Department:Zhang Na
COMPANY STATEMENT OF CHANGES IN EQUITY
For the year ended 31 December 2020
Unit: RMB yuan
Item
2020
Share capital
Other equity instruments
Capital reserve
Less:
Treasury
Shares
Other
comprehensive
income
Special
reserve Surplus reserve Retained earnings
Total shareholders’
equity preference
share
Perpetual
debt Others
1. Balance at the end of previous year
22,000,000,000.00 46,906,964,332.39 2,502,766,455.34 22,934,762,401.97 15,732,091,090.28 110,076,584,279.98
(iv) Others
(4) Transfer within equity
-699,139,184.61 699,139,184.61
(i) Capital reserves
converted to share capital
(ii) Surplus reserves
converted to share
capital
(iii) Loss made up by
surplus reserves
(iv) Changes in the
defined benefit plan transferred to
retained earnings
(v) Other comprehensive
income transferred to
retained earnings.
-699,139,184.61 699,139,184.61
(vi)Others
(5). Special reserve
(i). Additions
(ii). Utilisation
(6) Others 68,810,619.88 229,426,915.28 2,056,532.40 300,294,067.56
4. Balance at the end of the period
22,000,000,000.00 44,364,313,786.27 2,352,431,567.60 24,319,522,433.93 56,473,906,836.25 505,791,900.93 150,015,966,524.98

2020 Annual Report
102 / 259
Changes in accounting policies
Corrections of
prior period errors
Other
2. Balance at the beginning of the year
22,000,000,000.00 46,906,964,332.39 2,502,766,455.34 22,934,762,401.97 15,732,091,090.28 110,076,584,279.98
3. Increase/(decrease)
during the period 741,859,230.00 12,595,218,861.42 -681,913,241.85 396,775,810.50 13,051,940,660.07
(1) Total comprehensive
income
-679,063,249.48 15,354,891,142.20 14,675,827,892.72
(2) Shareholders’ contributions
741,859,230.00 12,562,562,126.53 13,304,421,356.53
(i)Shareholders’
contributions in
ordinary share 741,859,230.00 12,562,562,126.53 13,304,421,356.53
(ii)Other equity
instruments
contributions
(iii) Amount of share-based payments
recognized in equity
(iv) Others
(3). Profit distribution -14,960,000,000.00 -14,960,000,000.00
(i) Transfer to
surplus reserve
(ii) Distribution to
shareholders -14,960,000,000.00 -14,960,000,000.00
(iii) Others
(4) Transfer within
equity -2,849,992.37 2,849,992.37
(i) Capital reserves
converted to share
capital
(ii) Surplus reserves
converted to share capital
(iii) Loss made up by
surplus reserves
(iv) Changes in the defined benefit plan

2020 Annual Report
103 / 259
transferred to retained earnings
(v) Other
comprehensive
income transferred to retained earnings
-2,849,992.37 2,849,992.37
(vi) Others
(5). Special reserve
(i). Additions
(ii). Utilisation
(6) Others 32,656,734.89 -965,324.07 31,691,410.82
4. Balance at the end
of the period 22,741,859,230.00 59,502,183,193.81 1,820,853,213.49 22,934,762,401.97 16,128,866,900.78 123,128,524,940.05
Item
2019
Share capital
Other equity instruments
Capital reserve
Less:
Treasury
Shares
Other
comprehensive
income
Special
reserve
Surplus
reserve
Retained
earnings
Total
shareholders’
equity preference
share
Perpetual
debt Others
1. Balance at the end of previous
year 22,000,000,000.00 46,853,868,130.51 3,240,207,021.24 22,934,762,401.97 17,223,756,309.16 112,252,593,862.88
Changes in accounting policies -327,349,833.51 330,937,170.41 3,587,336.90
Corrections of prior period
errors
Others
2. Balance at the beginning of the year
22,000,000,000.00 46,853,868,130.51 2,912,857,187.73 22,934,762,401.97 17,554,693,479.57 112,256,181,199.78
3. Increase/(decrease) during
the period 53,096,201.88 -410,090,732.39 -1,822,602,389.29 -2,179,596,919.80
(1) Total comprehensive
income 289,048,452.22 12,208,831,510.82 12,497,879,963.04
(2) Shareholders’ contributions and reduction
(i) Shareholders’ contributions
in ordinary share
(ii)Other equity instruments contributions
(iii) Amount of share-based
payments recognized in equity
(iv) Others
(3). Profit distribution -14,960,000,000.00 -14,960,000,000.00
(i) Transfer to surplus reserve
(ii) Distribution to shareholders -14,960,000,000.00 -14,960,000,000.00
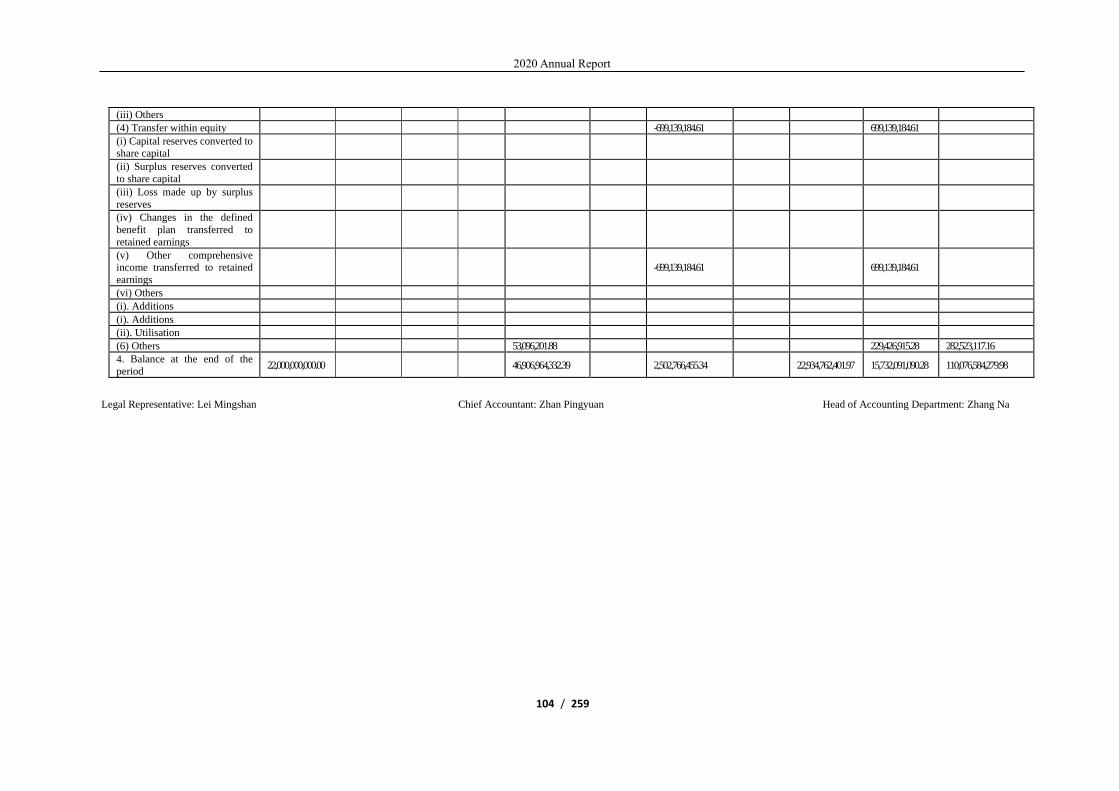
2020 Annual Report
104 / 259
(iii) Others
(4) Transfer within equity -699,139,184.61 699,139,184.61
(i) Capital reserves converted to share capital
(ii) Surplus reserves converted
to share capital
(iii) Loss made up by surplus
reserves
(iv) Changes in the defined
benefit plan transferred to
retained earnings
(v) Other comprehensive
income transferred to retained
earnings
-699,139,184.61 699,139,184.61
(vi) Others
(i). Additions
(i). Additions
(ii). Utilisation
(6) Others 53,096,201.88 229,426,915.28 282,523,117.16
4. Balance at the end of the
period 22,000,000,000.00 46,906,964,332.39 2,502,766,455.34 22,934,762,401.97 15,732,091,090.28 110,076,584,279.98
Legal Representative: Lei Mingshan Chief Accountant: Zhan Pingyuan Head of Accounting Department: Zhang Na

2020 Annual Report
105 / 259
III. GENERAL INFORMATION OF THE COMPANY
1. Company profile
Applicable
China Yangtze Power Co., Ltd. ("the Company") was established by China Three Gorges Corporation
(formerly “China Yangtze Three Gorges Project Development Corporation, hereinafter referred to as
"CTG") as the leading sponsor, together with five sponsors including Huaneng Power International, Inc.,
China National Nuclear Corporation, China National Petroleum Corporation, China Gezhouba Water
Conservancy and Hydropower Engineering Corporation and Changjiang Institute of Survey, Planning,
Design and Research under the Changjiang Water Resource Commission by way of promotion. The
Company was established on 23 September 2002 with the approval of the former State Economic and
Trade Commission under Approval Guo Jing Mao Qi Gai [2002] No. 700 and was registered with the
State Administration for Industry and Commerce on 4 November 2002.
With the approval of the China Securities Regulatory Commission, the Company issued A shares to
the public by way of stock floatation and was listed and traded on the Shanghai Stock Exchange on 18
November 2003.
In 2009, pursuant to the resolution of the Company's first Extraordinary General Meeting of 2009
and with the approval of the China Securities Regulatory Commission, the Company performed a major
asset restructuring by acquiring the power generation assets of the Three Gorges Project and equity
interests in five auxiliary production specialised enterprises.
On 25 March 2016, the Company issued shares to acquire assets and raise supporting funds as
approved by the China Securities Regulatory Commission. The Company issued a total of 3,500,000,000
shares to China Three Gorges Corporation, Sichuan Energy Investment Group Co., Ltd. and Yunnan
Energy Investment Group Co., Ltd. to acquire their combined 100% equity in Three Gorges Jinshajiang
Chuanyun Hydraulic Power Development Co., Ltd.; Meanwhile, the Company privately issued
2,000,000,000 shares to Ping An Asset Management Co., Ltd., Sunshine Life Insurance Co., Ltd.,
Guangzhou Development Group Incorporated, Pacific Ocean Asset Management Co., Ltd. , GIC Private
Limited and Shanghai Chongyang Strategic Investment Co., Ltd. Upon completion of the above share
issue, the total share capital of the Company was changed to 22,000,000,000 shares.
The Company is licensed by the State Administration for Industry and Commerce under Business
License for Corporation No. 91110000710930405L, with LEI Mingshan as its legal representative and its
registered office in Beijing.
On 19 October 2020, the Company issued a total of 74,185,923 Global Depository Receipts ("GDRs")
on the London Stock Exchange, raising gross proceeds of approximately US$1,963 million. The GDRs
were listed on the London Stock Exchange, with each GDR representing 10 shares of the Company's A-
shares, resulting in an additional 741,859,230 underlying A-shares.
As at 31 December 2020, the total cumulative issued share capital of the Company was
22,741,859,200,000 shares.
Our controlling shareholder is China Three Gorges Corporation, and our main subsidiaries include:
1. Yangtze Power Capital Holding Co., Ltd. (formerly Beijing Yangtze Power Venture Capital
Management Co., Ltd., “YP Capital”);
2. China Yangtze Power International (Hong Kong) Ltd. (“YP International”)
3. Three Gorges Jinshajiang Chuanyun Hydraulic Power Development Co., Ltd. (“Chuanyun”);
2020 Annual Report
106 / 259
4. Three Gorges Power Co., Ltd. (“Three Gorges Power”)
The Company operates in the power generation industry and its principal products or services include
electricity production, operation and investment, and technical advice on electricity production.
2. Scope of consolidated financial statements
Applicable
On 24 April 2020, by payment of cash, the Company acquired 100% equity in Andes Bermuda Ltd.
(now renamed “Andes Bermuda Ltd.”, “AB Company”) and about 50.00000069% equity in Peruvian
Opportunity Company S.A.C. (“POC Company”) with the remaining 49.99999931% equity in POC
Company held by AB Company) (AB Company and POC Company are hereinafter referred to as “Peru
Company”).Please refer to “8. Change in the scope of business combination” for details
IV. PREPARATION BASIS OF FINANCIAL STATEMENTS
1. Basis of Preparation
The financial statements have been prepared on the going concern basis of actual transactions and
events in accordance with “the Accounting Standards for Business Enterprises – Basic Standards” and
relevant specific standards (together “the Accounting Standards for Business Enterprises”) issued by the
Ministry of Finance, and based on the following accounting policies and accounting estimates set out in
“V. Critical Accounting Policies and Accounting Estimates”.
2. Going concern
Applicable
The Company has evaluated its ability to continue as a going concern for the 12 months from the end
of the reporting period and no matters or circumstances have been identified that cast significant doubt on
its ability to continue as a going concern. The Company has a recent history of profitable operations and
has the financial resources to support it, and it is reasonable to prepare the financial statements on a going
concern basis.
V. SIGNIFICANT ACCOUNTING POLICIES AND ACCOUNTING ESTIMATES
Notes on specific accounting policies and accounting estimates:
Non-applicable
1. Statement of compliance with accounting standards for business enterprises
The financial statements have been prepared in accordance with the requirements of accounting standards for business
enterprises, which truly and completely reflect the Company's financial status, operating results, changes in shareholders'
equity, cash flow and other relevant information.
2. Accounting period
The Company’s financial year is the calendar year, from 1st January to 31st December each year.
3. Operating cycle
Applicable
The Company takes a 12-months year as a usual operating cycle.
4. Reporting currency
The Company’s functional currency is Renminbi.
2020 Annual Report
107 / 259
5. Accounting treatments of “Business combination involving entities under common control” and
“Business combination involving entities not under common control”
Applicable
Assets and liabilities acquired by the Company as a acquirer in a business combination under common
control are measured at the book value of the acquiree in the consolidated statements of ultimate controller
at the combination date. In case of any difference between the book value of the net assets acquired and
the book value of the consideration paid for the combination, adjust capital surplus and if capital surplus
is not sufficient to offset the difference, adjust retained earnings.
The identifiable assets, liabilities and contingent liabilities of the acquiree acquired in a business
combination not under common control are measured at fair value at the acquisition date. The combination
cost is the sum of the fair value of cash or non-cash assets paid, liabilities issued or assumed and equity
securities issued, and all directly related costs incurred in the business combination at the acquisition date
to obtain control of the acquiree (for business combinations achieved in stages through multiple
transactions, the combination cost is the sum of the costs of each individual transaction). The difference
between the combination cost and the fair value of the share of identifiable net assets of the acquiree
acquired in the combination is recognized as goodwill. If the combination cost is less than the fair value
of the share of identifiable net assets of the acquiree acquired in the combination, the fair value of each
identifiable asset, liability and contingent liability acquired in the combination, as well as the fair value of
non-cash assets or equity securities issued in consideration of the combination, are reviewed first. If, after
the review, the combination cost is still less than the share of the fair value of the identifiable net assets of
the acquiree acquired in the combination, the difference is recognized as non-operating income in the
period of combination.
6. Basis of consolidated financial statements
Applicable
The Company includes all controlled subsidiaries and structured entities in the scope of its
consolidated financial statements.
In preparing the consolidated financial statements, if the accounting policies or accounting periods
adopted by the subsidiaries are different from those of the Company, the financial statements of the
subsidiaries are aligned to the Company's accounting policies or accounting periods as necessary.
All significant inter-company transactions, balances and unrealized profits within the scope of
consolidation are eliminated in the preparation of consolidated financial statements. The shares of owners’
equity in subsidiaries not attributable to the parent, net profit or loss of subsidiaries, and the shares of net
profit or loss, other comprehensive income and total comprehensive income for the current period that are
attributable to non-controlling interests are presented in the consolidated financial statements under "non-
controlling interests, profit or loss attributable to minority shareholders, other comprehensive income
attributable to minority shareholders and total comprehensive income attributable to minority
shareholders", respectively.
For a subsidiary acquired through a business combination under common control, the operating
results and cash flows are included in the consolidated financial statements from the beginning of the
period of combination. When preparing the comparative consolidated financial statements, relevant items
in the prior period's financial statements are adjusted as if the reporting entity resulting from the
combination had been in existence since the point at which the ultimate controlling party began to exercise
control.
For a subsidiary acquired through a business combination not under common control, the operating
results and cash flows are included in the consolidated financial statements from the date the Company

2020 Annual Report
108 / 259
obtains control. In preparing the consolidated financial statements, the financial statements of the
subsidiary are adjusted on the basis of the fair value of each identifiable asset, liability and contingent
liability determined at the acquisition date.
When the Company partially disposes of its long-term equity investments in subsidiaries without loss
of control, in the consolidated financial statements, capital premium or equity premium is adjusted by the
difference between the disposal price and the share of net assets of the subsidiaries corresponding to the
disposal of the long-term equity investments calculated on an ongoing basis from the acquisition date or
the combination date, and retained earnings is adjusted if capital surplus is not sufficient to offset the
difference.
If the Company loses control over an investee for reasons such as the disposal of a portion of its
equity investment, the remaining equity investment is re-measured at its fair value at the date of loss of
control in the preparation of consolidated financial statements. The difference between the sum of the
consideration received for the disposal of the equity investment and the fair value of the remaining equity
investment, less the share of net assets of the original subsidiary calculated on a continuing basis from the
acquisition date or the combination date in proportion to its original shareholding, is recognized as
investment gain or loss in the period in which control is lost, and goodwill is reduced accordingly. Other
comprehensive income related to the equity investment in the original subsidiary, is transferred to
investment gain or loss in the period when control is lost.
If the Company disposes of its equity investment in a subsidiary through multiple transactions until
it loses control, each transaction shall be accounted for as a single disposal of the subsidiary and loss of
control if the disposal of the equity investment in the subsidiary until it loses control is a package deal.
However, the difference between the disposal price and the share of the net assets of the subsidiary
corresponding to each disposal before the loss of control is recognized as other comprehensive income in
the consolidated financial statements and transferred to the investment gain or loss in the period when
control is lost.
7. Joint arrangement and joint operations
Applicable
The Company's joint arrangements are joint ventures.
8. Cash and cash equivalents
Cash in the Company's cash flow statement represents cash on hand and deposits readily available
for disbursement. Cash equivalents in the cash flow statement represent investments that are held for less
than three months, are highly liquid, are readily convertible to known amounts of cash and are subject to
an insignificant risk of change in value.
9. Foreign operations and foreign currency translation
Applicable
(1) Foreign currency transactions
The Company's foreign currency transactions are translated into RMB at the spot exchange rate on
the date of the transaction. At the balance sheet date, monetary items denominated in foreign currencies
are translated into RMB using the spot exchange rate at the balance sheet date. The resulting translation
differences are recorded directly in profit or loss for the current period, except for exchange differences
arising from special borrowings in foreign currencies for the purpose of acquiring or producing assets
eligible for capitalization, which are treated in accordance with the principle of capitalization.

2020 Annual Report
109 / 259
(2) Translation of foreign currency financial statements
Asset and liability items in the foreign currency balance sheet are translated using the spot exchange
rate at the balance sheet date; equity items, except for "undistributed profits", are translated at the spot
exchange rate at the time of the transaction; items in the income statement under revenue and expenses
are translated using the spot exchange rate (or actuals) at the date of the transaction. Translation differences
arising from the above translation of foreign currency statements are shown in the other comprehensive
income line. Cash flows in foreign currencies are translated using the spot exchange rates (or actuals) at
the dates when the cash flows occur. The effect of changes in exchange rates on cash is shown separately
in the cash flow statement.
10. Financial instruments
Applicable
The Company recognises a financial asset or financial liability when it becomes a party to a financial
instrument contract.
(3) Financial assets
1) Classification, recognition and measurement of financial assets
The Company classifies financial assets as financial assets carried at amortised cost, financial assets
at fair value through other comprehensive income and financial assets at fair value through profit or loss
based on the business model for managing financial assets and the contractual cash flow characteristics of
the financial assets.
The Company classifies financial assets as financial assets carried at amortized cost if both of the
following conditions are met: (i) the business model for managing the financial asset is to collect the
contractual cash flows; and (ii) the contractual terms of the financial asset provide that the cash flows
arising on a specific date are solely payments of principal and interest based on the principal amount
outstanding. Such financial assets are initially measured at fair value, with related transaction costs
included in the initially recognized amount, and are subsequently measured at amortised cost. Except for
those designated as hedged items, the difference between the initial amount and the maturity amount is
amortized using the effective interest method, and the amortization, impairment, exchange gain or loss
and gain or loss arising on derecognition are recognized in profit or loss for the period. The Company's
financial assets classified as financial assets carried at amortized cost include cash and cash equivalents,
notes receivable, accounts receivable, other receivables and debt investments.
The Company recognizes interest income using the effective interest rate method. Interest income is
determined by multiplying the carrying amount of the financial assets by the effective interest rate, except
for the following: (i) for financial assets acquired or originated with credit impairment, interest income is
determined from initial recognition on the basis of the amortized cost of the financial assets and the
effective interest rate adjusted for credit; and (ii) For financial assets acquired or originated that are not
credit impaired but become credit impaired in a subsequent period, interest income is determined in the
subsequent period based on the amortized cost of the financial assets and the effective interest rate.
The Company designates its investments in non-trading equity instruments as financial assets at fair
value through other comprehensive income. This designation, once made, is not revocable. Investments
in non-trading equity instruments designated by the Company as at fair value through other comprehensive
income are initially measured at fair value, with related transaction costs recognized in the initially
recognized amount; except for dividends received (other than those attributable to the recovery of
investment costs), which are recognized in profit or loss, all other related gains and losses (including
exchange gains and losses) are recognized in other comprehensive income and are not subsequently
transferred to profit or loss. When they are derecognised, the cumulative gain or loss previously included

2020 Annual Report
110 / 259
in other comprehensive income is transferred from other comprehensive income and included in retained
earnings. The Company reports such investments in equity instruments as investments in other equity
instruments.
Financial assets other than those classified as financial assets carried at amortized cost and those
classified as financial assets at fair value through other comprehensive income as described above. The
Company classifies them as financial assets at fair value through profit or loss. Such financial assets are
initially measured at fair value, with related transaction costs recognized directly in profit or loss. Gains
or losses on such financial assets are included in profit or loss for the current period. The Company reports
financial assets classified as at fair value through profit or loss that have a maturity of more than one year
from the balance sheet date and are expected to be held for more than one year as other non-current
financial assets.
If the contingent consideration recognized by the Company in a business combination not under
common control constitutes a financial asset, the financial asset is classified as a financial asset at fair
value through profit or loss.
2) Recognition and measurement of transfer of financial assets
A financial asset is derecognized when one of the following conditions is met: (i) the contractual
rights to receive cash flows from the financial asset cease; (ii) the financial asset is transferred and the
Company transfers substantially all the risks and rewards associated with ownership of the financial asset
to the transferor; or (iii) the financial asset is transferred and, although the Company neither transfers nor
retains substantially all the risks and rewards associated with ownership of the financial asset, it
relinquishes control over the financial asset.
If the derecognition condition is met for a transfer of a financial asset as a whole, the difference
between the carrying amount of the financial asset transferred and the sum of the consideration received
for the transfer and the cumulative amount of changes in fair value previously recognized in other
comprehensive income is recognized in profit or loss for the current period.
If a partial transfer of a financial asset satisfies the derecognition condition, the carrying amount of
the financial asset transferred as a whole is apportioned between the derecognized portion and the not
derecognized portion in accordance with their respective fair values, and the difference between the sum
of the consideration received for the transfer and the cumulative amount of changes in fair value previously
recognized in other comprehensive income that should be apportioned to the derecognized portion and the
apportioned previous carrying amount is recognized in profit or loss for the current period.
3) Impairment of financial assets
For financial assets measured at amortized cost and investments in debt instruments measured at fair
value through other comprehensive income, the Company recognizes allowance for losses on the basis of
expected credit losses.
The Company recognizes expected credit losses by calculating the probability-weighted amount of
the present value of the difference between the cash flows receivable under the contract and the cash flows
expected to be received, taking into account reasonable and substantiated information about past events,
current conditions and projections of future economic conditions, weighted by the risk of default.
At each balance sheet date, the Company measures expected credit losses separately for financial
instruments that are in different stages of development. If the credit risk of a financial instrument has not
increased significantly since initial recognition, it is in the first stage and the Company measures the
allowance for losses based on expected credit losses over the next 12 months; if the credit risk of a financial
instrument has increased significantly since initial recognition but no credit impairment has occurred, it is

2020 Annual Report
111 / 259
in the second stage and the Company measures the allowance for losses based on expected credit losses
over the entire life of the instrument; if the credit impairment of a financial instrument has occurred since
initial recognition, it is in the third stage and the Company measures the allowance for losses based on
expected credit losses over the entire life of the instrument.
For financial instruments with low credit risk at the balance sheet date, the Company measures the
allowance for losses based on the expected credit losses over the next 12 months, assuming that the credit
risk has not increased significantly since initial recognition.
The Company calculates interest income for financial instruments at stages 1 and 2, and at lower
credit risk, based on their carrying amounts before impairment allowances and effective interest rates. For
financial instruments at stage 3, interest income is calculated on the basis of their carrying amount less
impairment allowances, amortized cost and effective interest rate. For accounts receivable, the Company
measures the allowance for losses on expected credit losses over the entire life of the receivable, regardless
of whether there is a significant financing component.
For receivables for which objective evidence of impairment exists, and for other receivables for
which a separate assessment is applicable, a separate impairment test is performed, an expected credit loss
is recognized and a separate provision for impairment is made. For receivables for which no objective
evidence of impairment exists or when information on expected credit losses cannot be assessed at a
reasonable cost for a single financial asset, the Company classifies receivables into groups based on credit
risk characteristics and calculates expected credit losses on a group basis, with the basis for grouping as
follows:
a. Notes receivable
Group: Bank acceptances bills
b. Accounts receivable
Group 1: Amounts from large-scale hydropower business
Group 2: Receivables from Peru Company
Group 2: Other receivables
c. Other receivables
Group 1: Dividends receivable
Group 2: Receivables from Peru Company
Group 3: Others
For notes receivable classified into a group, the Company calculates expected credit losses by taking
into account historical credit loss experience, current conditions and forecasts of future economic
conditions through default exposures and expected credit loss rates over the life of notes receivable.
For accounts receivable classified into a group, the Company calculates expected credit losses by
taking into account historical credit loss experience, current conditions and forecasts of future economic
conditions through default exposures and expected credit loss rates over the life of accounts receivable.
For other receivables classified into a group, the Company calculates expected credit losses by taking
into account historical credit loss experience, current conditions and projections of future economic
conditions through default exposures and expected credit loss rates over the next 12 months or the entire
life of the receivables.
The Company records the allowance for losses accrued or reversed in profit or loss for the period.
For debt instruments held at fair value through other comprehensive income, the Company adjusts other

2020 Annual Report
112 / 259
comprehensive income at the same time as it recognizes impairment losses or gains in profit or loss for
the period.
(4) Financial liabilities
1) Classification, recognition and measurement of financial liabilities
The Company's financial liabilities are classified at initial recognition as financial liabilities at fair
value through profit or loss and other financial liabilities.
Financial liabilities at fair value through profit or loss comprise financial liabilities held for trading
and financial liabilities designated as at fair value through profit or loss on initial recognition. Financial
liabilities are subsequently measured at fair value, with gains or losses arising from changes in fair value
and dividend and interest expenses relating to the financial liabilities recognized in profit or loss.
Other financial liabilities are subsequently measured at amortised cost using the effective interest
method.
2) Derecognition of financial liabilities
A financial liability or a portion of an obligation that is discharged is derecognised when all or part
of the present obligation of the financial liability has been discharged. When an agreement is entered into
between the Company and a creditor to replace an existing financial liability by the assumption of a new
financial liability, and the contractual terms of the new financial liability are substantially different from
those of the existing financial liability, the existing financial liability is derecognised and the new financial
liability is recognised at the same time. If the Company materially modifies the contractual terms of all or
part of an existing financial liability, it derecognises the existing financial liability or part of it and
recognises the modified financial liability as a new financial liability at the same time. The difference
between the carrying amount of the derecognized portion and the consideration paid is recognized in profit
or loss for the current period.
(5) Determination of the fair value of financial assets and financial liabilities
The Company measures the fair value of financial assets and financial liabilities at prices in the
principal market or, if no principal market exists, at prices in the most advantageous market, using
valuation techniques that are applicable at the time and supported by sufficient available data and other
information. There are three levels of inputs used in fair value measurement. Specifically, Level 1 inputs
are unadjusted quoted prices in active markets for identical assets or liabilities that are available at the
measurement date; Level 2 inputs are inputs other than level 1 inputs that are directly or indirectly
observable for the underlying asset or liability; and Level 3 inputs are unobservable inputs for the
underlying asset or liability. The Company prioritizes the use of Level 1 inputs and then uses Level 3
inputs last. The level to which the fair value measurement results belong is determined by the lowest level
to which the inputs that are significant to the fair value measurement as a whole belong.
(6) Offsetting of financial assets and financial liabilities
The Company's financial assets and financial liabilities are presented separately in the balance sheet
and are not offset against each other. However, they are presented in the balance sheet on a netting basis
if both of the following conditions are met: (1) the Company has a legal right to offset the recognised
amounts and such legal right is currently enforceable; and (2) the Company plans to settle on a net basis
or to realise the financial asset and settle the financial liability simultaneously.

2020 Annual Report
113 / 259
(7) Distinction between and treatment of financial liabilities and equity instruments
The Company distinguishes between financial liabilities and equity instruments on the following
principles: (1) A contractual obligation meets the definition of a financial liability if the Company cannot
unconditionally avoid meeting that obligation by delivering cash or other financial assets. Some financial
instruments do not explicitly contain terms and conditions for an obligation to deliver cash or other
financial assets, but it is possible that a contractual obligation may arise indirectly through other terms and
conditions. (2) If a financial instrument is required to be, or may be, settled with the Company's own equity
instruments, consideration needs to be given to whether the Company's own equity instruments used to
settle the instrument are intended as a substitute for cash or other financial assets or are intended to give
the holder of the instrument a residual interest in the assets of the issuer after deducting all liabilities. In
the former cases, the instrument is a financial liability of the issuer; in the latter cases, the instrument is an
equity instrument of the issuer. In certain circumstances, a financial instrument contract requires the
Company to settle the financial instrument with or using its own equity instruments, where the amount of
the contractual right or contractual obligation is equal to the number of its own equity instruments available
for acquisition or delivery multiplied by their fair value at the time of settlement, whether the amount of
the contractual right or obligation is fixed or based wholly or partly on variables other than the market
price of the Company's own equity instruments (e.g. interest rates, the price of a commodity or the price
of a financial instrument), the contract is classified as a financial liability.
In classifying financial instruments (or components thereof) in the consolidated statements of
operations, the Company considers all terms and conditions agreed between the members of the Company
and the holder of the financial instrument. An instrument is classified as a financial liability if the Company
as a whole has an obligation to deliver cash, other financial assets or settle in a manner that otherwise
results in the instrument becoming a financial liability.
Where a financial instrument or a component thereof is a financial liability, the related interest,
dividend (or dividends), gains or losses, and gains or losses arising from redemption or refinancing are
included in the Company's profit or loss for the current period.
If a financial instrument or a component thereof is an equity instrument, upon its issuance (including
refinancing), repurchase, sale or cancellation, the Company treats it as a change in equity and does not
recognise changes in the fair value of the equity instrument.
(8) Exchangeable bonds
Exchangeable bonds issued by the Company that contain both a liability and an exchange option are
initially recognized separately by splitting them on initial recognition. Of these, exchange options that are
settled by exchanging the principal and interest included in the liability portion for financial assets held
by the Company are presented as financial liabilities held for trading.
On initial recognition, the fair value of the liability component is determined using the discounted
bond cash flow method, and the fair value of the exchange option component is determined by the option
binomial tree method using a Bermuda call option. The value of the liability portion of the exchangeable
bond and the value of the exchange option are allocated to the overall issue price in the proportion that the
fair value of the liability portion and the fair value of the exchange option represent the sum of the fair
value of the liability portion and the fair value of the exchange option, respectively.
For subsequent measurement, the liability portion of the exchangeable bonds is measured at
amortised cost using the effective interest method and the value of the exchange option classified as a
financial liability continues to be retained in liabilities. No loss or gain arises on maturity or exchange of
exchangeable bonds.

2020 Annual Report
114 / 259
Transaction costs incurred in connection with the issuance of exchangeable bonds are apportioned between
the liability component and the exchange option component on the basis of their respective fair values.
Transaction costs relating to the exchange option component are charged directly to profit or loss;
transaction costs relating to the liability component are charged to the carrying value of the liability and
amortised over the term of the exchangeable bond using the effective interest rate method.
11. Notes receivable
Expected credit loss model and accounting treatments of notes receivable
Non-applicable
12. Accounts receivable
Expected credit loss model and accounting treatments of accounts receivable
Non-applicable
13. Financing receivables
Non-applicable
14. Other receivables
Expected credit loss model and accounting treatments of other receivables
Non-applicable
15. Inventories
Applicable
The Company's inventories mainly comprise raw materials, revolving materials, spare parts, low-
value consumables and goods on hand.
Inventories are carried using a perpetual inventory system and are initially measured at cost when
acquired, including purchase cost, processing cost and other costs. Inventories are valued on weighted
average method or specific identification method when issued.
At the end of the period, inventories are fully counted and provision for inventories is made or
adjusted at the lower of cost or net realisable value. The net realisable value of inventories of finished
goods, goods on hand and materials for sale, which are directly for sale, is determined in the usual and
ordinary course of production and operation as the estimated selling price of such inventories, less
estimated selling expenses and related taxes. The net realizable value of inventories of materials subject
to processing are determined in the usual and ordinary course of production and operation as the estimated
selling price of the finished goods produced, less the estimated costs to completion, estimated selling
expenses and related taxes. The net realisable value of inventories held for the purpose of performing sales
contracts or service contracts is calculated on the basis of the contract price, and if the quantity of
inventories held exceeds the quantity ordered under the sales contract, the net realisable value of the excess
inventories is calculated at normal selling price.
Provision for inventories is made at period end on an individual basis; however, provision for
inventories of large quantities and lower unit prices is made by category; and provision is made on a
combined basis for inventories that are related to a product line manufactured and sold in the same region,
have the same or similar end use or purpose and are difficult to measure separately from other items.
Where the factors affecting the value of inventories previously written down have disappeared, the write-
down is reversed to the extent of the amount of recognized provision for inventories, with the reversal
credited to profit or loss for the current period.

2020 Annual Report
115 / 259
16. Contract assets
(1). Recognition methods and standards for the contractual
Non-applicable
(2). Method of determination of expected credit loss of contract assets and accounting treatment
methods
Non-applicable
17. Assets classified as held for sale
Non-applicable
18. Debt investment
(1). Expected credit loss model and accounting treatments of debt investment
Non-applicable
19. Other debt investments
(1). Expected credit loss model and accounting treatments of other debt investments
Non-applicable
20. Long-term receivables
(1). Expected credit loss model and accounting treatments of long-term receivables
Non-applicable
21. Long-term equity investments
Applicable
The Company's long-term equity investments are mainly investments in subsidiaries, investments in
associates and investments in joint ventures.
The Company bases its judgment of joint control on the fact that all participants or a combination of
participants collectively control the arrangement and that the policies of activities related to the
arrangement must be unanimously agreed by those participants who collectively control the arrangement.
The Company is generally considered to have significant influence over an investee when it owns,
directly or indirectly through a subsidiary, no less than 20 per cent but less than 50 per cent of the voting
rights in the investee. If the Company holds less than 20% of the voting rights of an investee, it is also
necessary to consider the facts and circumstances of having representatives on the board of directors or
similar authority of the investee, or participating in the process of formulating financial and operating
policies of the investee, or having significant transactions with the investee, or sending management
personnel to the investee, or providing key technical information to the investee, in order to determine
whether it has significant influence over the investee.
Where control over the investee exists, it is a subsidiary of the Company. Long-term equity
investments acquired through business combinations under common control are initially measured at the
share of the carrying value of the net assets of the investee on the consolidated income statements of the
ultimate controller on the combination date. If the carrying value of the net assets of the investee is negative
on the combination date, the cost of the long-term equity investment is determined at zero.
Where an equity in an investee under common control is acquired in stages through multiple
transactions that ultimately result in a business combination, additional disclosures should be made for the
reporting period in which control is acquired as to treatment of long-term equity investments in the parent

2020 Annual Report
116 / 259
company's financial statements. For example, if an equity in an investee under common control is acquired
in steps through multiple transactions, which ultimately results in a business combination, this should be
a package deal, and the Company accounts for each transaction as one transaction to obtain control. If the
transaction is not a package deal, on the combination cost, the long-term equity investment is initially
recognized based on the share of the carrying value of the net assets of the investee in the consolidated
financial statements of the ultimate controller upon the combination. In case of any difference between
the initial investment cost and the sum of the carrying amount of the long-term equity investment up to
the combination plus the carrying amount of the consideration newly paid for further acquisition of shares
at the combination date, adjust capital reserve, and if capital reserve is not sufficient to offset the difference,
adjust retained earnings.
Long-term equity investments acquired through business combinations not under common control
are stated at the cost of the combination as the initial investment cost.
Where an equity in an investee not under common control is acquired in stages through multiple
transactions that ultimately result in a business combination, additional disclosure should be made for the
reporting period in which control is obtained as to the treatment of the cost of the long-term equity
investment in the parent company's financial statements. For example, if an equity in an investee not under
common control is acquired through multiple transactions in stages, which ultimately results in a business
combination, this should be a package deal, and the Company accounts for each transaction as a one
transaction for the acquisition of control. If the transaction is not a package deal, the sum of the book value
of the equity investment originally held plus the cost of the new investment is recorded as the initial cost
of investment under cost method of accounting. If the equity interest held prior to the acquisition date is
accounted for under the equity method of accounting, the relevant other comprehensive income previously
recognized under the equity method of accounting is not adjusted until its disposal, at which point the
investment is accounted for on the same basis as adopted by the investee for directly disposing of the
relevant assets or liabilities. If the equity interest held prior to the acquisition date is accounted for at fair
value, the cumulative fair value changes previously recognized in other comprehensive income are
transferred to investment income or loss at the combination date.
Except for long-term equity investments acquired through business combinations as described above,
long-term equity investments acquired by cash payments are accounted for at the cost of investment based
on the actual purchase price paid; long-term equity investments acquired by the issuance of equity
securities are accounted for at the fair value of the equity securities issued; long-term equity investments
invested by investors are accounted for at the cost of investment based on the value agreed in the
investment contract or agreement; if the Company has long-term equity investments acquired by way of
debt restructuring, non-monetary asset exchange, etc., the method of determining the cost of the
investment should be disclosed in accordance with the provisions of the relevant ASBEs and taking into
account the actual situation of the Company.
The Company adopts the cost method of accounting for its investments in subsidiaries and the equity
method of accounting for its investments in joint ventures and associates.
For long-term equity investments accounted for under the cost method of accounting for subsequent
measurement, the carrying amount of the cost of long-term equity investments is increased by the fair
value of the cost paid for the additional investment and related transaction costs incurred when the
additional investment is made. The Company’s share in cash dividends or profits declared by the investee
are recognized as current investment.
For long-term equity investments accounted for using the equity method of accounting for subsequent
measurement, the carrying amount of the long-term equity investment is adjusted to increase or decrease
accordingly with changes in the ownership interest of the investee. In particular, when recognising the
share of net profit or loss of the investee, on the basis of the fair value of all identifiable assets, etc. of the
2020 Annual Report
117 / 259
investee at the time of acquisition of the investment, the net profit of the investee is aligned to the
Company's accounting policies and accounting periods, and adjusted eliminating the portion of the profit
or loss on inter-company transactions with associates and joint ventures attributable to the investor in
proportion to the shareholding.
On disposal of a long-term equity investment, the difference between the carrying amount and the
actual acquisition price is recognized as investment income in the current period. For a long-term equity
investment accounted for using the equity method of accounting, if any sum is recognized in the owner's
equity as a result of changes in the owner's equity of the investee other than net profit or loss, the portion
previously recognized in the owner's equity is transferred to profit or loss for the current period in
proportion upon disposal of the investment.
If, due to partial disposal of an equity investment or other reasons, joint control or significant
influence over the investee is lost, the remaining equity investment is accounted for in accordance with
the relevant regulations on recognition and measurement of financial instruments, and the difference
between the fair value and the carrying amount of the remaining equity investment at the date of loss of
joint control or significant influence is recognized in profit or loss for the current period. Other
comprehensive income recognised as a result of the equity method of accounting for the previous equity
investment is accounted for on the same basis as direct disposal of related assets or liabilities by the
investee upon the termination of the equity method of accounting.
If, as a result of the disposal of part of a long-term equity investment, control over the investee is lost,
but the Company continues to be capable of exercising joint control or significant influence over the
investee, the remaining equity investment is accounted for under the equity method of accounting instead,
and the difference between the carrying amount of the equity disposed of and the consideration for disposal
is recognized as investment income and the remaining equity is adjusted as if it had been accounted for
under the equity method of accounting from the time of acquisition; if upon the disposal, the Company is
not capable of exercising joint control or significant influence over the investee, the remaining equity
should be accounted for according to principles for recognition and measurement of financial instrument,
the difference between the carrying amount of the equity disposed of and the consideration for disposal is
recognized in investment income, and the difference between the fair value and the carrying amount of
the remaining equity interest at the date of loss of control is recognized in profit or loss for the current
period.
The Company separately accounts for each transaction that is not part of a package deal for the step-by-
step disposal of an equity investment to the date of loss of control. If they are a "package deal", each
transaction is accounted for as a disposal of a subsidiary and loss of control, except that the difference
between the disposal price and the carrying amount of the long-term equity investment corresponding to
the disposal in each transaction prior to the loss of control is recognized as other comprehensive income
and is transferred to profit or loss in the period in which control is lost.
22. Investment properties
(1). The cost measurement mode is adopted
Depreciation or amortization method
The Company's investment properties are buildings and land that have been leased out and are
measured using the cost model.
The estimated useful lives, net residual value rates and annual depreciationrates of investment
properties of the Company are set out below.

2020 Annual Report
118 / 259
Category Estimated useful li
fe (year)
Estimated residual
value rate (%)
Annual
depreciation rate
(%)
Buildings 8-50 0-3 1.94-12.50
The estimated useful lives, net residual value rates and annual depreciation rates of investment
properties of Peru Company are set out below.
Category Estimated useful life
(year)
Estimated residual
value rate (%)
Annual depreciation
rate (%)
Buildings 80 years - 1.25
Land Permanent - -
23. Fixed assets
(1). Derecognition Conditions
Applicable
The Company's fixed assets are tangible assets with the following characteristics: they are held for
the production of goods, provision of services, rental or operation management, have a useful life of more
than one year and have a high unit value.
Fixed assets are recognised when it is probable that the economic benefits associated with them are
likely to flow to the Company and their cost can be measured reliably. The Company's fixed assets include
water retaining buildings, buildings and structures, machinery and equipment, electronic equipment,
transportation equipment, office equipment, lands and others.
The Company depreciates all of its fixed assets, except for those that are fully depreciated and
continue to be used and land that is separately recorded in the accounts. The Company depreciates water
retaining buildings, buildings and structures, machinery and equipment, transportation equipment, and
office equipment on a straight-line basis and charges the depreciation in the cost of the related assets or to
profit or loss, depending on their use.
(2). Depreciation method
Applicable
The estimated useful lives, estimated residual value rate and the depreciation rates of the Company
by categories are as follows:
Category Depreciation method Depreciation life
(year) Residuals rate (%)
Annual
depreciation
rate (%)

2020 Annual Report
119 / 259
Water retaining
structures
Straight-line basis 40-60 -- 1.67-2.50
Plant and
buildings
Straight-line basis 8-50 0-3 1.94-12.50
Machinery and
equipment
Straight-line basis 5-32 0-3 3.03-20.00
Transportation
equipment
Straight-line basis 3-10 0-3 9.70-33.33
Electronic and
other equupment
Straight-line basis 3-12 0-3 8.08-33.33
Note: Water retaining structures include Gezhouba, Three Gorges Dam, Xiangjiaba and Xiluodu
Dam, etc.
The estimated useful lives, estimated residual value rate and the depreciation rates of the fixed assets
of Peru Company are as follows:
Order Category Highest economic useful
lives (year) Estimated residuals
rate (%)
Annual
depreciation
rate (%)
1 Plant and
buildings 20-100 -- 1.00-5.00
2 Machinery and
equipment 5-60 -- 1.67-20.00
3 Transportation
equipment 5-8 -- 12.50-20.00
4 Other 2-20 -- 5.00-50.00
At the end of each year, the Company reviews the estimated useful lives, estimated net residual values
and depreciation methods of fixed assets and treats any changes therein as changes in accounting estimates.
(3). Identification, valuation and depreciation method of fixed assets under financing lease
Non-applicable
24. Construction in progress
Applicable
Construction in progress is carried forward to fixed assets at their estimated value on the basis of
project budget, construction cost or actual cost of the project from the date they reach their intended
useable condition, and depreciation will commence from the following month onwards, and the difference
in the original value of fixed assets will be treated after the completion of the final account procedures.
25. Borrowing costs
Applicable
Borrowing costs directly attributable to fixed assets, investment properties and inventories that
require more than one year of acquisition or production activities to reach their intended use or saleable
condition are capitalised when the expenditure on the assets has been incurred, the borrowing costs have
been incurred and the acquisition or production activities necessary to bring the assets to their intended
use or saleable condition have commenced; Capitalisation ceases when the asset eligible for capitalisation
reaches its intended use or saleable condition and any subsequent borrowing costs incurred are charged to
current profit or loss. If there is an unusual interruption in the process of acquisition or production of an
asset eligible for capitalisation and the interruption lasts for more than three consecutive months,
capitalisation of borrowing costs is suspended until acquisition or production activities of the asset resume.
Interest expenses actually incurred in the period on special borrowings are capitalised, net of interest
income earned on unused borrowed funds deposited in banks or investment income earned on temporary

2020 Annual Report
120 / 259
investments; interest expense on general borrowings are capitalised on the basis of the weighted average
of the cumulative expenditure on assets in excess of special borrowings multiplied by the capitalisation
rate of the general borrowings taken up. The capitalisation rate is determined on the basis of the weighted
average interest rate on general borrowings.
26. Productive biological assets
Non-applicable
27. Oil and gas assets
Non-applicable
28. Right-of-use ass
Non-applicable
29. Intangible assets
(1). Valuation, useful life and impairment testing
Applicable
The Company's intangible assets, including land use rights, software, car parking rights and
concessions, are measured at actual cost at the time of acquisition. Specifically, the actual cost of an
intangible asset purchased is based on the actual price paid and related other expenses; the actual cost of
an intangible asset invested by an investor is determined at the value agreed in the investment contract or
agreement, except where the agreed value in the contract or agreement is not fair, in which case the actual
cost is determined at fair value; for intangible assets acquired in a business combination not under common
control that are owned by the acquiree but not recognised in its financial statements, they are recognized
as intangible assets at fair value upon initial recognition of the assets of the acquiree.
Land use rights are amortised evenly over its term from the inception of the grant; software, patented
technology and other intangible assets are amortised evenly over the shortest of the estimated useful life,
the contractual term and the legitimate term. Amortisation is charged to the cost of the relevant asset and
to profit or loss depending on the object which it is intended to benefit. The estimated useful life and
amortization method of intangible assets with definite useful lives are reviewed at the end of each year
and any changes are treated as changes in accounting estimates.
Among Peru Company’ intangible assets, concession is an intangible asset with an indefinite useful
life. At the end of each financial year, the Company reviews the estimated useful life of intangible assets
with an indefinite useful life and performs an impairment test.
The estimated useful lives of intangible assets with finite useful life of the Company are as follows:
Number Category Estimated useful lives (year)
1 Softwares 3-4
2 Car park use rights 40-50
3 Land use rights 30-40

2020 Annual Report
121 / 259
The estimated useful lives of the softwares and other intangible assets are 5 years.
(2). Accounting policy for internal research and development expenditure
Applicable
The Company's research and development expenditures are classified into research stage
expenditures and development stage expenditures, depending on their nature and whether there is a high
degree of uncertainty that the research and development activities will result in intangible assets. Research
stage expenditures are charged to profit or loss as incurred; development stage expenditures are recognized
as intangible assets when the following conditions are met.
(1) It is technically feasible to complete the intangible asset so that it can be used or sold;
(2) The Company has an intention to complete the intangible asset and to use or sell it;
(3) A market exists for the product produced by applying the intangible asset or a market exists for
the intangible asset itself;
(4) The Company has sufficient technical, financial and other resources to support the completion
of the intangible asset and the ability to use or sell the intangible asset;
(5) Expenditure attributable to the development stage of the intangible asset can be measured
reliably.
Development stage expenditure that does not meet the above criteria is charged to profit or loss as incurred.
Development expenditure previously charged to profit or loss is no longer recognised as an asset in
subsequent periods. Development stage expenditures that have been capitalised are shown as development
expenditure on the balance sheet and are presented as intangible assets from the date the it reaches its
intended useable condition.
30. Impairment of long-term assets
Applicable
The Company examines long-term equity investments, investment properties measured using the cost
model, fixed assets, construction in progress and intangible assets with definite useful lives at each balance
sheet date and conducts impairment tests when there is an indication of impairment. For goodwill and
intangible assets with indefinite useful lives, impairment tests are performed at the end of each period,
regardless of whether there is an indication of impairment.
If, after the impairment test, the carrying amount of the asset exceeds its recoverable amount, the
difference is recognized as an impairment loss, and the impairment loss on the above assets, once
recognized, is not reversed in subsequent financial periods.
31. Long-term deferred and prepaid expenses
Non-applicable
32. Contract liabilities
(1). Recognition of contract liabilities
Non-applicable
33. Payroll and employee benefits payable
(1). Short-term employee benefits payable
Applicable

2020 Annual Report
122 / 259
Short-term payroll and employee benefits mainly includes salaries, bonuses, allowances and
subsidies, employee benefits, social insurance premiums and housing provident fund, trade union expenses
and employee education expenses and other expenses related to the services rendered by employees.
Actual short-term remuneration incurred is recognized as a liability in the accounting period in which the
services are rendered by the employees and is charged to profit or loss or the cost of relevant assets
depending on the beneficiary.
(2). Post-employment benefit Applicable
Post-employment benefits, which mainly include basic pension insurance premiums, unemployment
insurance premiums, enterprise annuities and supplementary benefits provided by the Company for retired
employees, are classified as defined contribution plans and defined benefit plans depending on risks and
obligations assumed by the Company. For defined contribution plans, a liability is recognized on the basis
of contributions made to a separate entity at the balance sheet date in exchange for services rendered by
employees during the financial period, and is charged profit or loss or to the cost of related assets
depending on the beneficiary. For defined benefit plans, the Company measures the obligation arising
from the defined benefit plan and determines the period over which the related obligation vests, using
unbiased and mutually consistent actuarial assumptions about the relevant demographic and financial
variables using the projected unit credit method. The deficit or surplus resulting from the present value of
the defined benefit plan obligation less the fair value of the defined benefit plan assets is recognized as a
net liability or net asset of defined benefit plan. If a defined benefit plan has a surplus, the Company
measures the net assets of defined benefit plan at the lower of the surplus or asset limit of the defined
benefit plan.
The Company discounts defined benefit plan obligations, including those expected to be paid within
twelve months after the end of the reporting period in which employees render services, based on market
yields on treasury bonds or high quality corporate bonds in active markets that match the maturity and
currency of the defined benefit plan obligations at the balance sheet date.
Service costs incurred for defined benefit plans and net interest on net liabilities or net assets of
defined benefit plan are charged to profit or loss for the period or to the cost of the related assets; changes
arising from the remeasurement of net defined benefit plan are charged to other comprehensive income
and are not reversed to profit or loss in subsequent periods. On settlement of a defined benefit plan, a gain
or loss on settlement is recognized as the difference between the present value of the defined benefit plan
obligation and the settlement price determined at the settlement date.
(3). Termination benefits
Applicable
Termination benefits are compensation given to an employee by the enterprise to terminate the
employment with the employee before the expiry of the employee's employment contract or to encourage
the employee to voluntarily accept redundancy.
(4). Other long-term employee benefits
Applicable
Other long-term employee benefits refer to all employee benefits other than short-term payroll and
employee benefits, post-employment benefits and termination benefits.
34. Lease liabilities
Non-applicable

2020 Annual Report
123 / 259
35. Provisions
Applicable
The Company recognizes a liability when operations related to contingencies such as external
guarantees, discounting of commercial acceptances, pending litigation or arbitration and product quality
warrants meet all of the following conditions: the obligation is a present obligation assumed by the
Company; it is probable that the performance of the obligation will result in an outflow of economic
benefits from the enterprise; and the amount of the obligation can be measured reliably.
An estimated liability is initially measured at the best estimate of the expenditure required to settle
the related present obligation, taking into account the risks associated with the contingency, uncertainty
and the time value of money. Where the effect of the time value of money is material, the best estimate is
determined by discounting the related future cash outflows. The carrying amount of estimated liability is
reviewed at each balance sheet date and, if changed, the carrying amount is adjusted to reflect the current
best estimate.
36. Share based payment
Non-applicable
37. Preferred shares, perpetual debts and other financial instruments
Non-applicable
38. Revenue
(1). Accounting policies adopted for revenue recognition and measurement
Applicable
The Company recognizes revenue when it has fulfilled its performance obligations under a contract,
i.e., when the customer obtains control of the related goods or services.
If a contract contains two or more performance obligations, the Company measures revenue at the
contract commencement date by apportioning the transaction price to each individual performance
obligation based on the relative proportion of the individual selling price of the goods or services promised
by each individual performance obligation, and measuring revenue based on the transaction price
apportioned to each individual performance obligation.
The transaction price is the amount of consideration to which the Company expects to be entitled as
a result of the transfer of goods or services to the customer, excluding amounts collected on behalf of third
parties. The Company does not recognize transaction prices in excess of the amount for which it is highly
probable that there will be no material reversal of revenue recognized in the aggregate when the related
uncertainty is removed. Amounts expected to be returned to customers as a liability for returned goods are
not included in the transaction price. Where there is a significant financing component in the contract, the
Company determines the transaction price based on the amount payable in cash assuming that the customer
2020 Annual Report
124 / 259
will pay for the goods or services as soon as control is obtained. The difference between this transaction
price and the contract consideration is amortized over the term of the contract using the effective interest
method. If, at the contract commencement date, the Company expects that the interval between the
customer's acquisition of control of the goods or services and the customer's payment of the price will not
exceed one year, the existence of a significant financing component in the contract is not considered.
The Company is performing its performance obligations over a certain period of time if one of the
following conditions is met, otherwise, it is performing its performance obligations at a certain point in
time.
(i) The customer acquires and consumes the economic benefits arising from the Company's
performance at the same time as the Company's performance.
(ii) The customer is able to control the goods in progress in the course of the Company's performance.
(iii) The goods produced in the course of the Company's performance have irreplaceable use and the
Company is entitled to receive payment for the portion of the performance that has been completed to date
in aggregate throughout the contract period.
For performance obligations performed within a certain period of time, the Company recognizes
revenue in proportion to the progress in performance during that period. When the progress in performance
is not reasonably determinable, the Company recognizes revenue in the amount of costs already incurred
until the progress in performance can be reasonably determined, if the costs already incurred are expected
to be reimbursed.
For performance obligations performed at a point in time, the Company recognizes revenue at the
point in time when the customer obtains control of the relevant goods or services. In determining whether
a customer has acquired control of goods or services, the Company considers the following indications.
(i) The Company has a present right to receive payment for the goods or services;
(ii) The Company has physically transferred the goods to the customer;
(iii) The Company has transferred to the customer major risks and rewards associated with legitimate
ownership or ownership of the goods;
(iv) The customer has accepted the goods or services.
(2). Differences in accounting policies for revenue recognition due to different operating models for
the same type of business activities
Non-applicable
39. Contract cost
Non-applicable
40. Government grants
Applicable

2020 Annual Report
125 / 259
Government grants, which are monetary and non-monetary assets obtained by the Company from the
government without compensation, excluding capital invested by the government as the owner of the
enterprise, are classified into asset-related government grants and revenue-related government grants.
Asset-related government grants refer to government grants acquired by the Company for the
acquisition and construction or otherwise forming long-term assets; revenue-related government grants
refer to government grants other than asset-related government grants. If the objects of government grants
are not specified in government documents, the Company makes judgment on the above principles, and if
it is difficult to distinguish, the same is fully classified as revenue-related government grants.
Government grants are measured at the amount actually received if they are monetary assets, or at
the amount receivable if the grant is allocated at a fixed standard or if there is conclusive evidence at the
end of the period that the relevant conditions stipulated in the fiscal support policy can be met and the
funds are expected to be received. Government grants are measured at fair value if they are non-monetary
assets, and measured at the nominal amount (RMB1) if the fair value cannot be reliably obtained.
Government grants related to assets reduce the carrying amount of the related assets or recognized as
deferred income. If deferred income is recognized, it is recognized in profit or loss over the useful life of
the related assets using a reasonable and systematic method.
If the relevant assets are sold, transferred, scrapped or destroyed before the end of their useful lives,
the unallocated balance of the relevant deferred income is transferred to profit or loss in the period when
the assets are disposed of.
Revenue-related government grants that are used to compensate for related costs and expenses or
losses in subsequent periods are recognized as deferred income and are recognized in profit or loss or
reduce the related costs in the period in which the related costs and expenses or losses are recognized.
Government grants related to ordinary activities are recognized in other income or offset against related
costs and expenses based on the substance of the economic operations. Government grants that are not
related to ordinary activities are recorded as non-operating income or expense.
If the government grants recognized by the Company are required to be returned, they are accounted
for in the period in which they are required to be returned as follows:
(1) If the carrying value of the related asset is reduced upon initial recognition, the carrying value of
the asset is adjusted.
(2) If there is a related deferred income, the carrying amount of the related deferred income is reduced,
and the excess is recognized in profit or loss for the current period.
(3) In other cases, it is recognized directly in profit or loss for the current period
41. Deferred income tax assets / deferred income tax liabilities
Applicable
The Company's deferred tax assets and deferred tax liabilities are recognized based on the difference
between the tax basis of assets and liabilities and their carrying amounts (temporary differences). For
deductible losses that can be offset against taxable income in subsequent years in accordance with the tax
2020 Annual Report
126 / 259
law, a deferred tax asset is recognized accordingly. For temporary differences arising from the initial
recognition of goodwill, no deferred tax liabilities are recognized. For temporary differences arising from
the initial recognition of assets or liabilities in transactions other than business combinations that affect
neither accounting profit nor taxable income (or deductible losses), no deferred tax assets and deferred tax
liabilities are recognized. At the balance sheet date, deferred tax assets and deferred tax liabilities are
measured at the tax rates that are expected to apply in the period when the asset is expected to be recovered
or the liability settled.
The Company recognizes deferred tax assets to the extent that it is probable that future taxable income
will be available against which deductible temporary differences, deductible losses and tax credits can be
utilized.
42. Leases
(1). Accounting treatment of operating lease
Applicable
A lease is a finance lease if the terms of the lease transfer substantially all the risks and rewards
associated with the ownership of the leased asset to the lessee, while other leases are operating leases.
Operating leases are accounted for as follows:
(1) Lease payments made by the Company for leased assets are amortised on a straight-line basis
over the entire lease term without deducting the rent-free period and are expensed. The initial direct costs
paid by the Company in connection with the lease transaction are expensed when incurred.
When the lessor bears the expenses related to the lease that should be borne by the Company, the
Company deducts such expenses from the total rental amount, and amortize and expense the remaining
rental over the lease term.
(2) Lease payments received by the Company for leasing assets are allocated on a straight-line basis
over the entire lease term without deducting the rent-free period and recognized as lease income. The
initial direct costs paid by the Company in connection with the lease transaction are expensed when
incurred, or capitalized if the amount is significant, in which case it is amortized and expensed over the
entire lease term on the same basis as lease income is recognized.
When the Company incurs lease related expenses that should be borne by the lessee, the Company
deducts such expenses from the total rental income and allocates the remaining amount over the lease term.
(2). Accounting treatment of financing lease
Non-applicable
(3). Identification and accounting treatment method of lease under the new lease standard
Non-applicable
43. Other significant accounting judgments and estimates
Non-applicable
44. Changes in significant accounting policies and estimates
(1). Changes in significant accounting policies
Applicable

2020 Annual Report
127 / 259
Content of and reasons for
changes in accounting policies
Approval procedure
Remarks (materially affected
financial statement items and
amounts)
The Ministry of Finance revised
and issued Accounting
Standard for Business
Enterprises No. 14 - Revenue
(Cai Kuai [2017] No. 22)
(hereinafter referred to as the
new standard for revenue) in
July 2017
Relevant changes in accounting
policy was adopted at the 15th
meeting of the Fifth Session of
the Board of Directors of the
Company.
The Company has adopted the
new standard for revenue from 1
January 2020 and made financial
statement disclosures as required,
adjusting opening retained
earnings and other related items in
the financial statements without
adjustments for comparable
periods. The adoption of the
above new standard will not have
a material impact on the
Company's financial statements.
Others
Nil
(2). Changes in accounting estimates
Non-applicable
(3). The impacts arising from adoption of New financial Instrument Standard, New Lease Standard
and New Revenue Standard on the balance sheet as at 1 January 2020
Applicable
CONSOLIDATED STATEMENT OF FINANCIAL POSITION
Unit: RMB 100 million
Item 31 December 2019 1 January 2020 Adjustments
CURRENT ASSETS:
Cash and Cash equivalents 7,323,452,880.02 7,323,452,880.02
Settlements Provision Loans to Banks and Other
Financial Institutions
Trading financial assets
Derivative financial assets
Notes receivable 2,560,000.00 2,560,000.00
Accounts receivable 2,944,436,813.72 2,944,436,813.72
Financing receivables
Prepayments 14,453,284.98 14,453,284.98
Insurance premium receivable
Due from reinsurers Reinsurance contract provision
receivable
Other receivables 68,071,011.56 68,071,011.56
Including: Interest receivable
Dividends receivable 50,045,000.00 50,045,000.00 Financial assets purchased under
agreements to resell
Inventories 222,400,775.52 222,400,775.52
Contract Asset
Assets classified as held for sale Current portion of non-current
assets
Other current assets 459,771,956.64 459,771,956.64
Total current assets 11,035,146,722.44 11,035,146,722.44 NON-CURRENT ASSETS:
Loans and advances Debt investment 1,148,277,903.43 1,148,277,903.43

2020 Annual Report
128 / 259
Other debt investments
Long-term receivables
Long-term equity investments 40,258,231,503.89 40,258,231,503.89 Other equity instruments
investments 4,432,380,427.04 4,432,380,427.04
Other non-current assets 5,812,035,941.91 5,812,035,941.91
Investment properties 27,552,840.37 27,552,840.37
Fixed assets 226,291,965,212.17 226,291,965,212.17
Construction in progress 6,880,639,435.66 6,880,639,435.66
Productive biological assets
Oil and gas assets
Right-of-use asset
Intangible assets 191,462,744.50 191,462,744.50
Development expenditures
Goodwill
Long-term prepaid expenses 1,742,787.89 1,742,787.89
Deferred tax assets 369,173,036.54 369,173,036.54
Other non-current assets 34,272,485.05 34,272,485.05
Total non-current assets 285,447,734,318.45 285,447,734,318.45
Total assets 296,482,881,040.89 296,482,881,040.89 Current liabilities:
Short-term borrowings 21,308,000,000.00 21,308,000,000.00
Borrowing from the central bank Deposits and balances from
banks and other financial
institutions
Financial liabilities held for trading 768,403,141.10 768,403,141.10
Derivative financial liabilities
Notes payable 18,701,549.83 18,701,549.83
Accounts payable 86,819,605.55 86,819,605.55
Receipts in advance 9,164,940.98 8,788,393.37 -376,547.61
Contract liabilities 370,387.27 370,387.27 Financial assets sold under
agreements to buy
Customer deposits and balances
from banks and other financial
institutions
Customer brokerage deposits Securities underwriting brokerage
deposits
Payroll and employee benefits
payable 120,539,909.11 120,539,909.11
Taxes payable 2,106,242,913.91 2,106,242,913.91
Other payables 21,042,264,353.26 21,042,264,353.26
Including: Interest Payable 897,073,966.87 897,073,966.87
Dividend Payable
Fees and commission payable
Payable Reinsurance Liabilities classified as held for
sale
Current portion of non-current
liabilities 2,499,762,842.57 2,499,762,842.57
Other current liabilities 7,998,650,574.74 7,998,656,735.08 6,160.34
Total current liabilities 55,958,549,831.05 55,958,549,831.05 Non-current liabilities:
Insurance reserves Long-term borrowings 24,600,000,000.00 24,600,000,000.00
Bonds payable 43,794,792,492.21 43,794,792,492.21
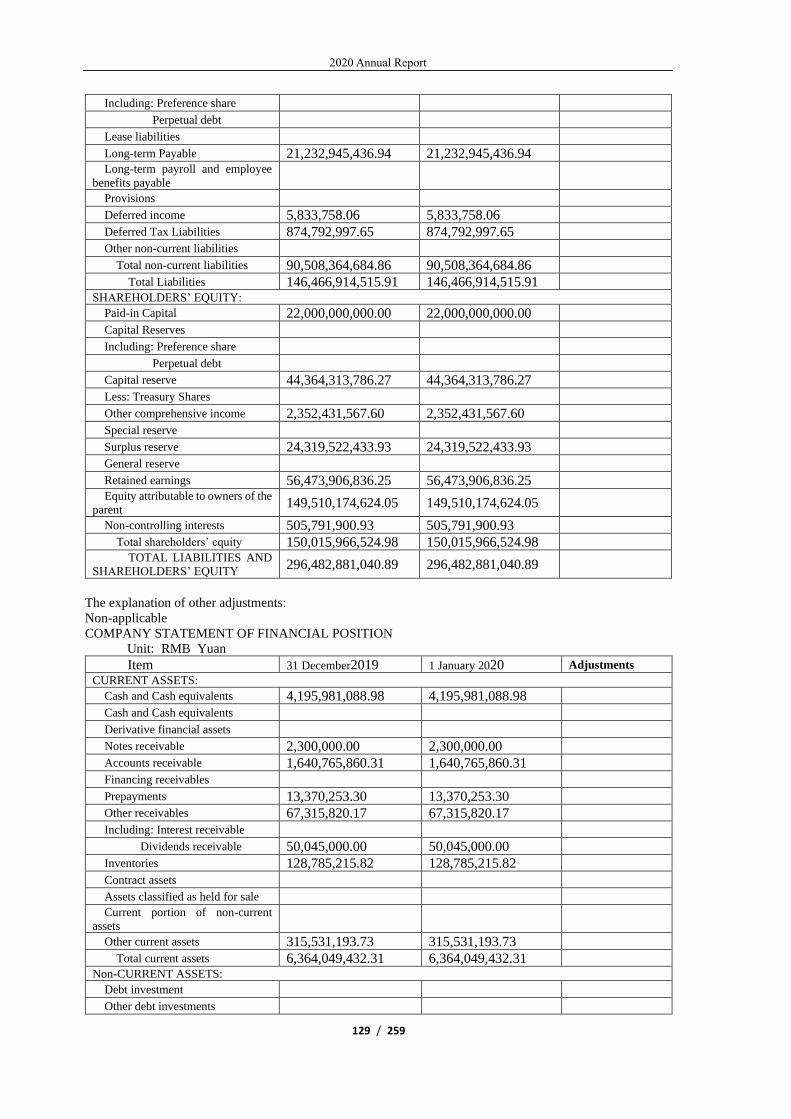
2020 Annual Report
129 / 259
Including: Preference share
Perpetual debt
Lease liabilities
Long-term Payable 21,232,945,436.94 21,232,945,436.94 Long-term payroll and employee
benefits payable
Provisions
Deferred income 5,833,758.06 5,833,758.06
Deferred Tax Liabilities 874,792,997.65 874,792,997.65
Other non-current liabilities
Total non-current liabilities 90,508,364,684.86 90,508,364,684.86
Total Liabilities 146,466,914,515.91 146,466,914,515.91 SHAREHOLDERS’ EQUITY:
Paid-in Capital 22,000,000,000.00 22,000,000,000.00
Capital Reserves
Including: Preference share
Perpetual debt
Capital reserve 44,364,313,786.27 44,364,313,786.27
Less: Treasury Shares
Other comprehensive income 2,352,431,567.60 2,352,431,567.60
Special reserve
Surplus reserve 24,319,522,433.93 24,319,522,433.93
General reserve
Retained earnings 56,473,906,836.25 56,473,906,836.25 Equity attributable to owners of the
parent 149,510,174,624.05 149,510,174,624.05
Non-controlling interests 505,791,900.93 505,791,900.93
Total shareholders’ equity 150,015,966,524.98 150,015,966,524.98 TOTAL LIABILITIES AND
SHAREHOLDERS’ EQUITY 296,482,881,040.89 296,482,881,040.89
The explanation of other adjustments:
Non-applicable
COMPANY STATEMENT OF FINANCIAL POSITION
Unit: RMB Yuan
Item 31 December2019 1 January 2020 Adjustments CURRENT ASSETS:
Cash and Cash equivalents 4,195,981,088.98 4,195,981,088.98
Cash and Cash equivalents
Derivative financial assets
Notes receivable 2,300,000.00 2,300,000.00
Accounts receivable 1,640,765,860.31 1,640,765,860.31
Financing receivables
Prepayments 13,370,253.30 13,370,253.30
Other receivables 67,315,820.17 67,315,820.17
Including: Interest receivable
Dividends receivable 50,045,000.00 50,045,000.00
Inventories 128,785,215.82 128,785,215.82
Contract assets
Assets classified as held for sale Current portion of non-current
assets
Other current assets 315,531,193.73 315,531,193.73
Total current assets 6,364,049,432.31 6,364,049,432.31 Non-CURRENT ASSETS:
Debt investment
Other debt investments
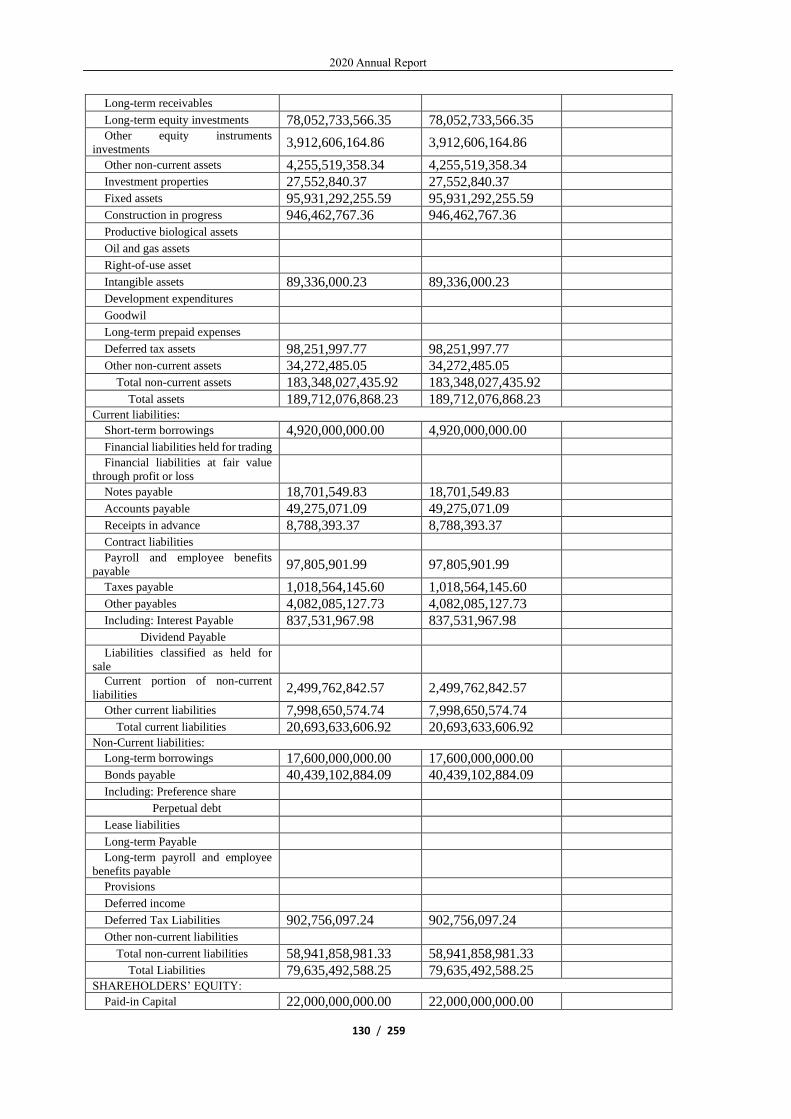
2020 Annual Report
130 / 259
Long-term receivables
Long-term equity investments 78,052,733,566.35 78,052,733,566.35 Other equity instruments
investments 3,912,606,164.86 3,912,606,164.86
Other non-current assets 4,255,519,358.34 4,255,519,358.34
Investment properties 27,552,840.37 27,552,840.37
Fixed assets 95,931,292,255.59 95,931,292,255.59
Construction in progress 946,462,767.36 946,462,767.36
Productive biological assets
Oil and gas assets
Right-of-use asset
Intangible assets 89,336,000.23 89,336,000.23
Development expenditures
Goodwil
Long-term prepaid expenses
Deferred tax assets 98,251,997.77 98,251,997.77
Other non-current assets 34,272,485.05 34,272,485.05
Total non-current assets 183,348,027,435.92 183,348,027,435.92
Total assets 189,712,076,868.23 189,712,076,868.23 Current liabilities:
Short-term borrowings 4,920,000,000.00 4,920,000,000.00
Financial liabilities held for trading Financial liabilities at fair value
through profit or loss
Notes payable 18,701,549.83 18,701,549.83
Accounts payable 49,275,071.09 49,275,071.09
Receipts in advance 8,788,393.37 8,788,393.37
Contract liabilities Payroll and employee benefits
payable 97,805,901.99 97,805,901.99
Taxes payable 1,018,564,145.60 1,018,564,145.60
Other payables 4,082,085,127.73 4,082,085,127.73
Including: Interest Payable 837,531,967.98 837,531,967.98
Dividend Payable Liabilities classified as held for
sale
Current portion of non-current
liabilities 2,499,762,842.57 2,499,762,842.57
Other current liabilities 7,998,650,574.74 7,998,650,574.74
Total current liabilities 20,693,633,606.92 20,693,633,606.92 Non-Current liabilities:
Long-term borrowings 17,600,000,000.00 17,600,000,000.00
Bonds payable 40,439,102,884.09 40,439,102,884.09
Including: Preference share
Perpetual debt
Lease liabilities
Long-term Payable Long-term payroll and employee
benefits payable
Provisions
Deferred income
Deferred Tax Liabilities 902,756,097.24 902,756,097.24
Other non-current liabilities
Total non-current liabilities 58,941,858,981.33 58,941,858,981.33
Total Liabilities 79,635,492,588.25 79,635,492,588.25 SHAREHOLDERS’ EQUITY:
Paid-in Capital 22,000,000,000.00 22,000,000,000.00

2020 Annual Report
131 / 259
Capital Reserves
Including: Preference share
Perpetual debt
Capital reserve 46,906,964,332.39 46,906,964,332.39
Less: Treasury Shares
Other comprehensive income 2,502,766,455.34 2,502,766,455.34
Special reserve
Surplus reserve 22,934,762,401.97 22,934,762,401.97
Retained earnings 15,732,091,090.28 15,732,091,090.28
Total shareholders’ equity 110,076,584,279.98 110,076,584,279.98 TOTAL LIABILITIES AND
SHAREHOLDERS’ EQUITY 189,712,076,868.23 189,712,076,868.23
The explanation of other adjustments:
Non-applicable
(1). The retrospective adjustment of the comparative data from adoption of New financial Instrument
Standard, New Lease Standard on the balance sheet as at 1 January 2019.
Non-applicable
45. Other
Non-applicable
VI. Taxation
1. The principal kinds of taxes and related tax rates:
The principal kinds of taxes and related tax rates:
Applicable
Tax Tax Basis Tax Rate
Value-added tax
Revenue from power sales,
commodity trading income,
income arising from leasing
movable assets
13%、3%
Value-added tax Income arising from leasing
immovable assets 9%
Value-added tax Taxable services income, taxable
labor income 3%、6%、9%
Value-added tax Transfer income of financial
products 6%
City construction and
maintenance tax Turnover tax amount payable 7%、5%
Education surcharges Turnover tax amount payable 3%
Local Education surcharges Turnover tax amount payable
(note 1) 2%、1.5%
Income tax Taxable income (note 2) 15%、16.5%、25%、29%、29.5%
House property tax 70% or 75% of the original value
of real estate, rental income 1.2%、12%
Water resources tax
Actual production of electricity,
actual amount of water drawing
RMB0.008/kWh,
RMB0.09/cubic metre,
RMB0.1/cubic metre
Peru IGV tax Revenue from power sales and
commodity trading income 18%
The statements of the subjects of taxation adapted different income tax rates in Group.
Applicable

2020 Annual Report
132 / 259
The name of taxation unit Income tax rate (%)
The Company and its subsidiary (except the
following companies)
25
Three Gorges Electric Energy Co., Ltd. 15
China Yangtze International (Hongkong) Co.,
Limited
16.5
China Three Gorges Power Operation Int’l Co.,
Limited
16.5
Yangtze Andes Holding Co., Limited 16.5
Peru Company 29.5
Note 2: According to the State Administration of Taxation Announcement No. 12 of 2012
"Announcement on Corporate Income Tax Issues Related to the Further Implementation of the Western
Development Strategy" and other policies, Chuanyun was eligible for the tax concessions for the Western
Development and paid corporate income tax at a reduced rate of 15% from 1 January 2011 to 31 December
2020.
According to the Announcement of the Ministry of Finance No. 23 of 2020 "Announcement on the
Renewal of the Enterprise Income Tax Policy for Western Development", during the renewal period of
the tax concession, from 1 January 2021 to 31 December 2030, Chuanyun will continue to pay corporate
income tax at a reduced rate of 15%.
According to the Notice of the Continuation of the Enterprise Income Tax for Implementation of
Exploration and Development of Western Region (Notice of the Ministry of Finance No. 23 [2020]),during
the execution period of continued preferential tax treatments, Chuanyun is subject to corporate income tax
at a reduced rate at 15% from 1 January 2021 to 31 December 2030.
2. Preferential taxation
Applicable
Note 1: Pursuant to Er Zheng Ban Fa [2016] No. 27, the rate of local education surcharge for
enterprises in the Hubei was reduced from 2% to 1.5% provisionally for two years, effect from 1 May
2016. Pursuant to Er Zheng Ban Fa [2018] No. 13, the preferential policy on local education surcharge for
enterprises in the Hubei was extended to 31 December 2020.
3. Others
Applicable
(1) Property tax
Property tax is mainly based on 70% (Beijing, Chengdu, Yibin, Shuifu, Leibo and Yongshan) or 75%
(Yichang) of the original value of the property, at a rate of 1.2%, or on rental income, at a rate of 12%
(Chengdu, Beijing and Yichang). Underground plants are taxed on the basis of 75% (Yichang) of the
original value of the taxable property which is 50% (Yichang) of the original price of the building, with a
tax rate of 1.2%.
(2) Water resource tax
Pursuant to the Notice on the Issuance of the Implementation Measures for the Expansion of Pilot
Water Resources Tax Reform (Cai Shui [2017] No. 80) jointly issued by the Ministry of Finance, the State
Administration of Taxation and the Ministry of Water Resources, it was clarified that Sichuan Province
was in the second batch of pilot provinces for water resources tax reform nationwide. Chuanyun began to
pay water resources tax from 1 December 2017 at rates shown in the table below.

2020 Annual Report
133 / 259
Type of tax Classification Tax basis Tax rate
Water resources
tax
Water for power
generation
Actual power
generation RMB0.008/kWh
Power for
production
Actual water
consumption
Xiluodu Power
Station
RMB0.09/cubic
meter
Xiangjiaba Power
Station
RMB0.1/cubic
meter
VII. Notes to Items of the Consolidated Financial Statements
For the financial statement data disclosed below, unless otherwise stated, “opening” refers to 1
January 2020 and “closing” refers to 31 December 2020. “Current year” refers to the period from 1
January 2020 to 31 December 2020 and “last year” refers to the period from 1 January 2019 to 31
December 2019. The currency unit is RMB.
1、 Cash and Cash equivalents
Applicable
Unit:RMB Yuan
Item Closing balance Opening balance
Cash on hand 6,680,457.72
Bank balances 9,159,811,937.11 4,989,301,496.47
Other monetary funds 64,721,396.96 2,334,151,383.55
Total 9,231,213,791.79 7,323,452,880.02
Including: Total amount deposited in
foreign countries
3,924,867,095.04 4,231,648,449.48
Others
Note: Of the Company's other cash and cash equivalents, performance bond of RMB7,000,000.00 is
classified as restricted cash, and the remaining was cash for investments not subject to restrictions such as
pledge or freeze.
2、 Financial assets held for trading
Non-applicable
3、 Derivative financial assets
Non-applicable
4、 Notes receivable
(1). Categories of notes receivable
Non-applicable
(2). Notes receivable which have been pledged as security at the end of the reporting period
Non-applicable

2020 Annual Report
134 / 259
(3). Endorsed or discounted notes receivable that is not yet matured as at the end of the reporting
period
Non-applicable
(4). Notes transferred to accounts receivable due to the drawer's non-performance as at the end of the
reporting period
Non-applicable
(5). Disclosed by bad debt provision methods
Non-applicable
Bad debt provision assessed individually Non-applicable
Bad debt provision assessed by groups Non-applicable
Refer to the disclosure of other receivables if bad debt provision is made based on the general ECL model:
Non-applicable
(6). Details of bad debt provision
Non-applicable
(7). Notes receivable written off as at the end of the reporting period
Non-applicable
Others Non-applicable
5、 Accounts receivable
(1). Disclosure by aging
Applicable
Unit:RMB Yuan
Aging Book balance at the end of the reporting period
Within 1 year
Including: Item aged within 1 year
Within 1 year 3,645,074,118.32
1-2 years 6,124,352.24
2-3 years 5,974.17
More than 3 years
3-4 years
4-5 years
More than 5 years
Total 3,651,204,444.73

2020 Annual Report
135 / 259
(2). Disclosed by bad debt provision methods
Applicable
Unit:RMB Yuan
Category
Closing balance Opening balance
Book balance Bad debt provision Carrying
amount
Book balance Bad debt provision
Carrying amount Amount
Proportion
(%) Amount
Proportio
n (%) Amount
Proportio
n (%) Amount
Proportio
n (%)
Bad debt provision
assessed individually
Including:
Bad debt provision
assessed by groups 3,651,204,444.73 100.00 1,155,841.99 0.03 3,650,048,602.74 2,945,342,993.44 100.00 906,179.72 0.03 2,944,436,813.72
Including:
Receivables portfolio of
large-scale hydropower
business
2,657,790,696.57 72.79 2,657,790,696.57 2,878,922,946.13 97.74 2,878,922,946.13
Receivables portfolio of
Peru Company
946,681,812.8
3 25.93 1,155,841.99 0.12 945,525,970.84
Other receivables
portfolio 46,731,935.33 1.28 46,731,935.33 66,420,047.31 2.26 906,179.72 1.36 65,513,867.59
Total 3,651,204,444.73 / 1,155,841.99 / 3,650,048,602.74 2,945,342,993.44 / 906,179.72 / 2,944,436,813.72

2020 Annual Report
136 / 259
Bad debt provision assessed individually:
Non-applicable
Bad debt provision assessed by groups:
Non-applicable
Refer to the disclosure of other receivables if bad debt provision is made based on the general ECL model:
Non-applicable
(3). Details of bad debt provision
Applicable
Unit:RMB Yuan
Category Opening
balance
Changes in the current period Closing
balance Provision Recovery
or
reversal
Elimination
or write-off Other changes
Accounts
receivable 906,179.72 1,531,903.86 -1,282,241.59 1,155,841.99
Total 906,179.72 1,531,903.86 -1,282,241.59 1,155,841.99
Significant recovery or reversal of bad debt provision for the current period:
Non-applicable
(4). Accounts receivable written off as at the end of the reporting period
Non-applicable
(5). Top five accounts receivable based on debtors
Applicable
Entity Closing balance Aging
Proportion of
the total
balance of
other
receivables at
the end of the
year (%)
Balance of provision
for bad debt at the end of
the year
State Grid Corporation 1,979,486,679.59 Within 1
year 54.21
China Southern Power Grid Co.,
Ltd. 377,422,324.55
Within 1
year 10.34
State Grid Corporation, Central
China branch 292,644,485.26
Within 1
year 8.02
Three Gorges First Wind Farm Pakistan
(Pvt) Limited 15,847,778.90
Within 1
year 0.43
State Grid Hubei Electric Power
Company 8,160,810.85
Within 1
year 0.22
Total 2,673,562,079.15 73.22
(6). Accounts receivable derecognized due to transferred financial asset
Non-applicable
(7). Carrying amount of continuing involvement after transferring accounts receivable
Non-applicable
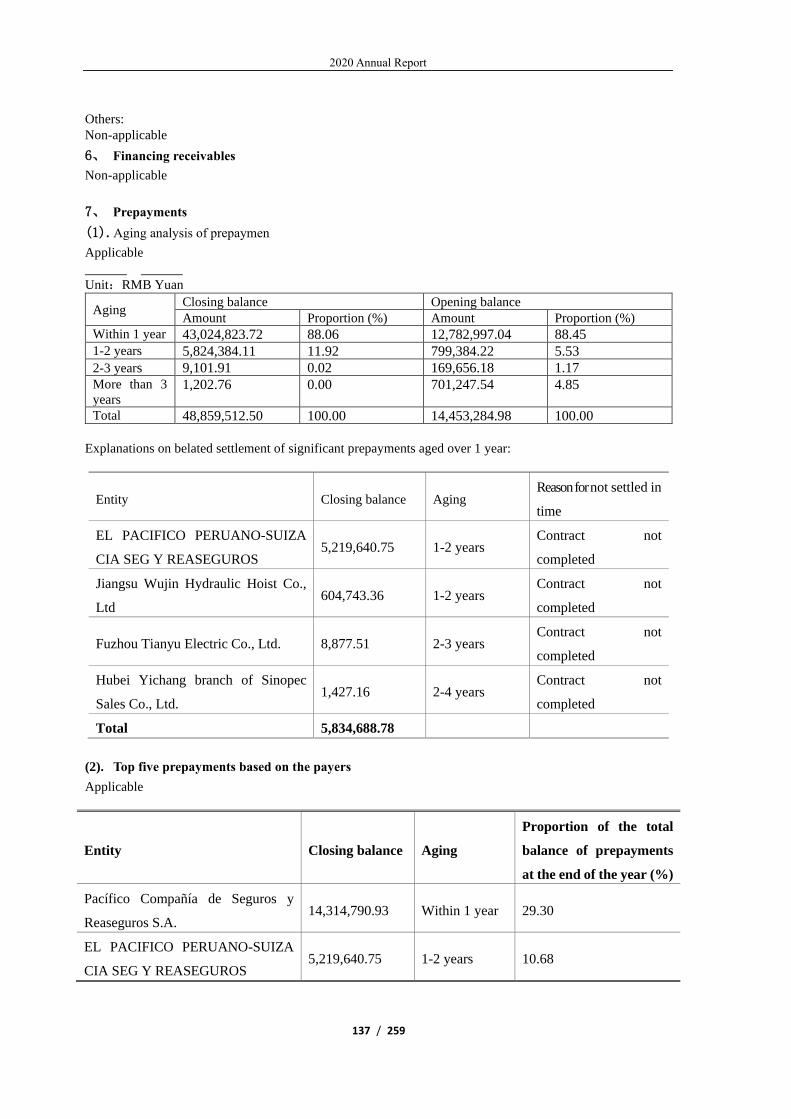
2020 Annual Report
137 / 259
Others:
Non-applicable
6、 Financing receivables
Non-applicable
7、 Prepayments
(1). Aging analysis of prepaymen
Applicable
Unit:RMB Yuan
Aging Closing balance Opening balance
Amount Proportion (%) Amount Proportion (%)
Within 1 year 43,024,823.72 88.06 12,782,997.04 88.45
1-2 years 5,824,384.11 11.92 799,384.22 5.53
2-3 years 9,101.91 0.02 169,656.18 1.17
More than 3
years 1,202.76 0.00 701,247.54 4.85
Total 48,859,512.50 100.00 14,453,284.98 100.00
Explanations on belated settlement of significant prepayments aged over 1 year:
Entity Closing balance Aging Reason for not settled in
time
EL PACIFICO PERUANO-SUIZA
CIA SEG Y REASEGUROS 5,219,640.75 1-2 years
Contract not
completed
Jiangsu Wujin Hydraulic Hoist Co.,
Ltd 604,743.36 1-2 years
Contract not
completed
Fuzhou Tianyu Electric Co., Ltd. 8,877.51 2-3 years Contract not
completed
Hubei Yichang branch of Sinopec
Sales Co., Ltd. 1,427.16 2-4 years
Contract not
completed
Total 5,834,688.78
(2). Top five prepayments based on the payers
Applicable
Entity Closing balance Aging
Proportion of the total
balance of prepayments
at the end of the year (%)
Pacífico Compañía de Seguros y
Reaseguros S.A. 14,314,790.93 Within 1 year 29.30
EL PACIFICO PERUANO-SUIZA
CIA SEG Y REASEGUROS 5,219,640.75 1-2 years 10.68

2020 Annual Report
138 / 259
Entity Closing balance Aging
Proportion of the total
balance of prepayments
at the end of the year (%)
Jiangsu Wujin Hydraulic Hoist Co.,
Ltd 2,570,159.28 0-2 years 5.26
Jiangsu Huaneng Pipeline Industry
Co., Ltd.* 1,251,005.67 Within 1 year 2.56
Nexsys del Perú S.A.C. 289,723.27 Within 1 year 0.59
Total 23,645,319.90 48.39
Others
Non-applicable
8、 Other receivables
Presentation of items
Applicable
Unit:RMB Yuan
Item Closing balance Opening balance
Interest receivable
Dividends receivable 45,473,100.00 50,045,000.00
Other receivables 451,827,015.36 18,026,011.56
Total 497,300,115.36 68,071,011.56
Others:
Non-applicable
Interest receivable
(1). Classification of interest receivable
Non-applicable
(2). Significant overdue interest
Non-applicable
(3). Details of bad debt provision
Non-applicable
Other Non-applicable
Dividends receivable
(4). Dividends receivable
Applicable
Unit:RMB Yuan
Item (or investee) Closing balance Opening balance
Hubei Qingneng Investment
Development Group Limited
45,473,100.00 50,045,000.00
Total 45,473,100.00 50,045,000.00
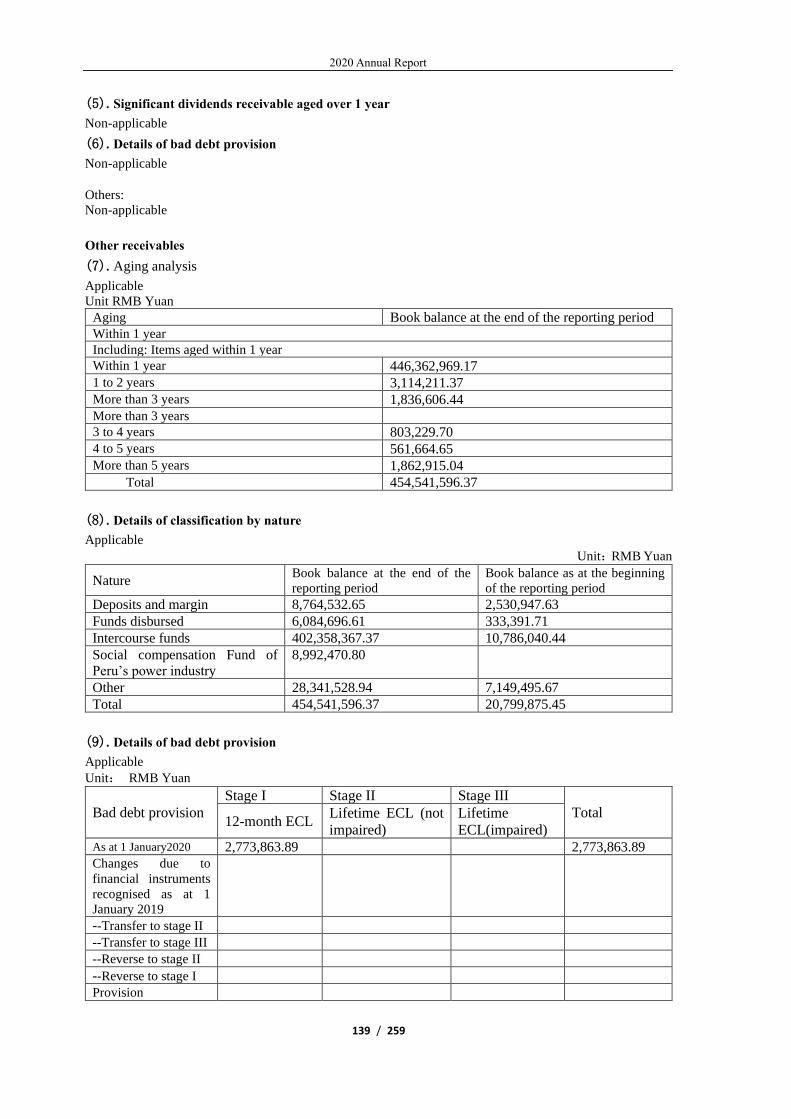
2020 Annual Report
139 / 259
(5). Significant dividends receivable aged over 1 year
Non-applicable
(6). Details of bad debt provision
Non-applicable
Others:
Non-applicable
Other receivables
(7). Aging analysis
Applicable
Unit RMB Yuan
Aging Book balance at the end of the reporting period
Within 1 year
Including: Items aged within 1 year
Within 1 year 446,362,969.17
1 to 2 years 3,114,211.37
More than 3 years 1,836,606.44
More than 3 years
3 to 4 years 803,229.70
4 to 5 years 561,664.65
More than 5 years 1,862,915.04
Total 454,541,596.37
(8). Details of classification by nature
Applicable
Unit:RMB Yuan
Nature Book balance at the end of the
reporting period Book balance as at the beginning
of the reporting period
Deposits and margin 8,764,532.65 2,530,947.63
Funds disbursed 6,084,696.61 333,391.71
Intercourse funds 402,358,367.37 10,786,040.44
Social compensation Fund of
Peru’s power industry
8,992,470.80
Other 28,341,528.94 7,149,495.67
Total 454,541,596.37 20,799,875.45
(9). Details of bad debt provision
Applicable
Unit: RMB Yuan
Bad debt provision
Stage I Stage II Stage III
Total 12-month ECL
Lifetime ECL (not
impaired)
Lifetime
ECL(impaired) As at 1 January2020 2,773,863.89 2,773,863.89
Changes due to
financial instruments
recognised as at 1
January 2019
--Transfer to stage II
--Transfer to stage III
--Reverse to stage II
--Reverse to stage I
Provision

2020 Annual Report
140 / 259
Reversal 39,036.81 39,036.81
Elimination
Write-off
Other changes -20,246.07 -20,246.07
As at 31 December
2020 2,714,581.01 2,714,581.01
Explanations on significant changes in the book balance of interest receivable where there are changes in
provision for the current period:
Non-applicable
Bad debt provision for the current period and basis for assessing whether there's significant increase in the credit
risk of financial instruments:
Non-applicable
(10). Details of bad debt provision
Applicable
Unit: RMB Yuan
Category
Opening
balance
Changes in the current period Closing
balance Provision Recovery
or reversal Elimination
or write-off Other
changes
Other
receivables
portfolio
2,773,863.89 39,036.81 -20,246.07 2,714,581.01
Total 2,773,863.89 39,036.81 -20,246.07 2,714,581.01
Significant recovery or reversal of bad debt provision for the current period:
Non-applicable
(11). Other receivables written off as at the end of the current period
Non-applicable
(12). Top five other receivables based on debtors
Applicable
Unit: RMB Yuan
Entity Nature Closing balance Aging
Proportion to
the total
closing balance
of other
receivables
(%)
Closing
balance of
bad debt
provision
Three Gorges Jinsha River
Yunchuan Hydropower
Development Co., Ltd
Intercourse
funds 332,323,286.73
Within
1 year 73.11 332,323.29
Superintendencia
Nacional de Aduanas y de
Administración Tributaria
Intercourse
funds 12,433,461.84
Within
1 year 2.74
Yangtze Three Gorges
Industrial Co., Ltd.
Intercourse
funds 9,974,110.51
Within
1 year 2.19 9,974.11
Programa de Gobierno
Regional de Lima
Metropolitana
Intercourse
funds 5,646,470.76
Within
1 year 1.24
KALLPA
GENERACION S
Intercourse
funds 5,210,999.91
Within
1 year 1.15
Total / 365,588,329.75 / 80.43 342,297.40
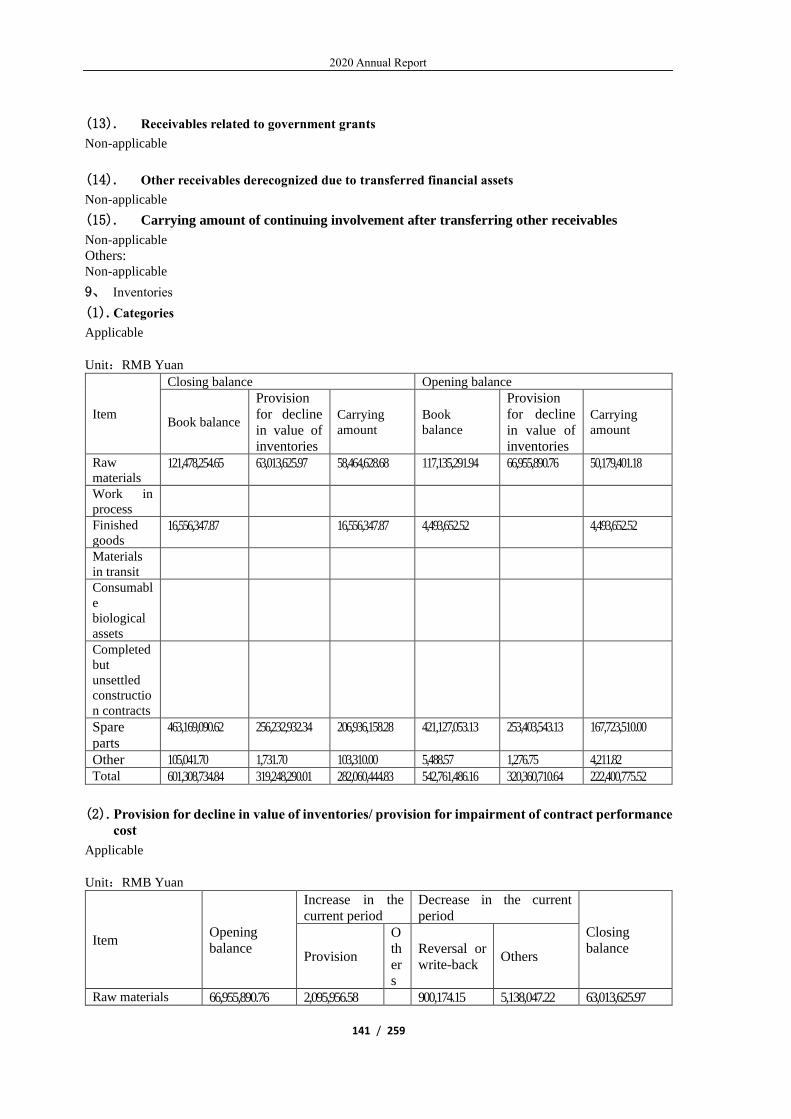
2020 Annual Report
141 / 259
(13). Receivables related to government grants
Non-applicable
(14). Other receivables derecognized due to transferred financial assets
Non-applicable
(15). Carrying amount of continuing involvement after transferring other receivables
Non-applicable
Others: Non-applicable
9、 Inventories
(1). Categories
Applicable
Unit:RMB Yuan
Item
Closing balance Opening balance
Book balance
Provision
for decline
in value of
inventories
Carrying
amount Book
balance
Provision
for decline
in value of
inventories
Carrying
amount
Raw
materials 121,478,254.65 63,013,625.97 58,464,628.68 117,135,291.94 66,955,890.76 50,179,401.18
Work in
process
Finished
goods 16,556,347.87 16,556,347.87 4,493,652.52 4,493,652.52
Materials
in transit
Consumabl
e
biological
assets
Completed
but
unsettled
constructio
n contracts
Spare
parts
463,169,090.62 256,232,932.34 206,936,158.28 421,127,053.13 253,403,543.13 167,723,510.00
Other 105,041.70 1,731.70 103,310.00 5,488.57 1,276.75 4,211.82
Total 601,308,734.84 319,248,290.01 282,060,444.83 542,761,486.16 320,360,710.64 222,400,775.52
(2). Provision for decline in value of inventories/ provision for impairment of contract performance
cost
Applicable
Unit:RMB Yuan
Item Opening
balance
Increase in the
current period
Decrease in the current
period
Closing
balance Provision
O
th
ers
Reversal or
write-back Others
Raw materials 66,955,890.76 2,095,956.58 900,174.15 5,138,047.22 63,013,625.97
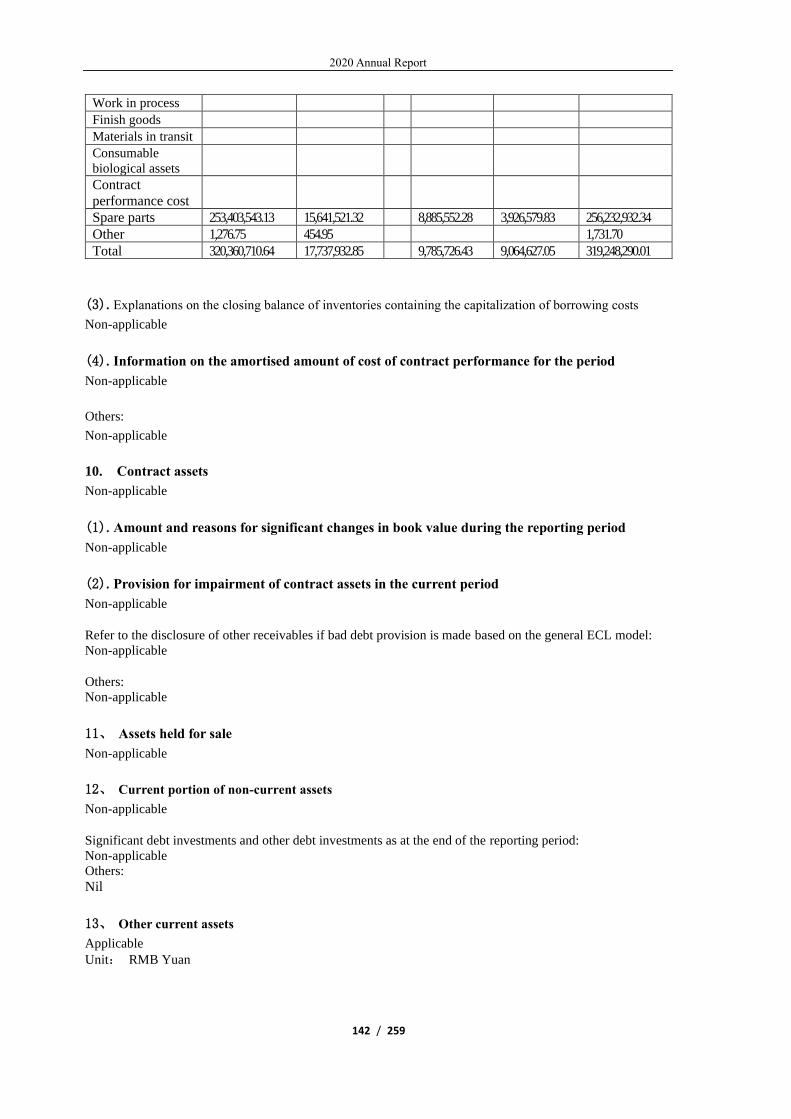
2020 Annual Report
142 / 259
Work in process
Finish goods
Materials in transit
Consumable
biological assets
Contract
performance cost
Spare parts 253,403,543.13 15,641,521.32 8,885,552.28 3,926,579.83 256,232,932.34
Other 1,276.75 454.95 1,731.70
Total 320,360,710.64 17,737,932.85 9,785,726.43 9,064,627.05 319,248,290.01
(3). Explanations on the closing balance of inventories containing the capitalization of borrowing costs
Non-applicable
(4). Information on the amortised amount of cost of contract performance for the period
Non-applicable
Others:
Non-applicable
10. Contract assets
Non-applicable
(1). Amount and reasons for significant changes in book value during the reporting period
Non-applicable
(2). Provision for impairment of contract assets in the current period
Non-applicable
Refer to the disclosure of other receivables if bad debt provision is made based on the general ECL model:
Non-applicable
Others:
Non-applicable
11、 Assets held for sale
Non-applicable
12、 Current portion of non-current assets
Non-applicable
Significant debt investments and other debt investments as at the end of the reporting period:
Non-applicable
Others:
Nil
13、 Other current assets
Applicable
Unit: RMB Yuan

2020 Annual Report
143 / 259
Item Closing balance Closing balance
Outstanding VAT credit 261,516.66 16,450,697.70
Government bonds purchased
under agreements to resell (Note 1,
note 2)
852,007,760.00 442,307,961.50
Prepaid tax 1,932,668.63 1,013,297.44
Recoverable Peru IGV tax 94,254,716.28
Total 948,456,661.57 459,771,956.64
Others
Note 1: Treasury bond reverse repo represents the principal amount of funds offered by the Company
on the treasury bond reverse repo market to obtain interest income during the period. During the reporting
period, the Company held 1-day, 2-day, 3-day, 4-day, 7-day, 14-day and 28-day treasury bond reverse
repo, and interest income was calculated at effective interest rate at the time of repo transactions in
Shanghai market and Shenzhen market.
Note 2: Other current assets at the end of the year increased from the beginning of the year due largely
to the increase in treasury bond reverse repo at the end of the year.
14、 Debt investment
(1). Details of debt investment
Applicable
Unit: RMB Yuan
Item
Closing balance Opening balance
Book balance Provision
for
impairment
Provision Book
balance
Provision
for
impairment
Carrying amount
Preferen
ce
shares
and
sharehol
ders’
loans
1,139,169,084.08 1,139,169,0
84.08
1,148,277,903
.43 1,148,277,903.43
Total 1,139,169,084.08 1,139,169,0
84.08
1,148,277,903
.43 1,148,277,903.43
(2). Significant debt investment as at the end of the reporting period
Non-applicable
(3). Details of provision for impairment
Non-applicable
Provision for impairment for the current period and basis for assessing whether there’s significant increase
in the credit risk of financial instruments: Non-applicable
Others Non-applicable
2020 Annual Report
144 / 259
15、 Other debt investment
(1). Other debt investments
Non-applicable
(2). Significant other debt investments as at the end of the reporting period
Non-applicable
(3). Details of provision for impairment
Non-applicable
Provision for impairment for the current period and basis for assessing whether there’s significant increase
in the credit risk of financial instruments: Non-applicable
Others: Non-applicable
16、 Long-term receivables
(1). Details of long-term receivables
Non-applicable
(2). Details of bad debt provision
Non-applicable
Bad debt provision for the current period and basis for assessing whether there's significant increase in the credit
risk of financial instruments:
Non-applicable
(3). Long-term receivables derecognized due to transferred financial assets
Non-applicable
(4). Carrying amount of continuing involvement after transferring long-term receivables
Non-applicable Others
Non-applicable

2020 Annual Report
145 / 259
17、 Long-term equity investments
Applicable Unit: RMB Yuan
Investee Opening
balance
Changes for the current period
Closing balance
Closing balance of
provision for
impairment
Additional investment
Decrease in investment
Investment
income or
losses recognised
under equity
method
Adjustment to
other comprehensive
income
Other equity changes
Declared cash
dividend or
profit
Provision
for
impairment Others
I. Joint ventures
Three Gorges
Electric
Energy
(Anhui) Co.,
Ltd
72,404,849.29 -4,890,073.99 67,514,775.30
Yangtze
Intelligent
Distributed
Energy Co.,
Ltd
84,587,864.85 8,400,000.00 -4,254,853.71 1,541,526.33 90,274,537.47
Three Gorges
Electric
Energy
(Guangdong)
Co., Ltd
31,166,705.99 1,148,410.08 32,315,116.07
Shaanxi
Yan'an
Electric
Power
Co., Ltd. *
13,182,398.63 15,000,000.00 1,706,991.12 -324,003.71 29,565,386.04
Three Gorges
Electric
Energy
(Yunnan) Co.,
Ltd
37,876,350.13 -3,455,576.38 880,994.38 35,301,768.13

2020 Annual Report
146 / 259
Subtotal 239,218,168.89 23,400,000.00 -9,745,102.88 2,098,517.00 254,971,583.01
II. Associates
Hubei Energy
Group Co.,
Ltd.
7,942,851,468.62 702,146,724.85 -62,136,933.68 -17,607,509.95 186,215,663.30 8,379,038,086.54
Hubei
Qingneng
Investment
Development
Group
Limited
1,906,684,945.84 208,005,653.56 -2,610,006.94 45,473,100.00 2,066,607,492.46
Guangzhou
Development
Group
Incorporated
3,768,911,523.89 180,564,961.10 4,080,925.76 5,104,838.13 27,205,162.90 3,931,457,085.98
Three Gorges
Finance Co.,
Ltd.
2,022,060,388.81 233,249,838.22 -157,100.16 100,390,644.91 2,154,762,481.96
Shanghai
Electric Power
Co., Ltd
1,051,951,594.37 857,456,424.31 64,346,668.25 8,709,022.33 5,071,690.17 25,612,345.59 1,961,923,053.84
Hunan
Taohua River
Nuclear
Power Co.,
Ltd
224,119,537.52 224,119,537.52
Chongqing
Three Gorges
Water
Conservancy
and Electric
Power
Co.,Ltd.
1,935,840,645.13 851,049,375.14 104,627,516.64 -3,947,695.67 -697,078.25 20,280,119.50 2,866,592,643.49
Three Gorges
Base 508,225,161.18 32,136,349.33 -5,699,939.92 6,878,679.12 527,782,891.47
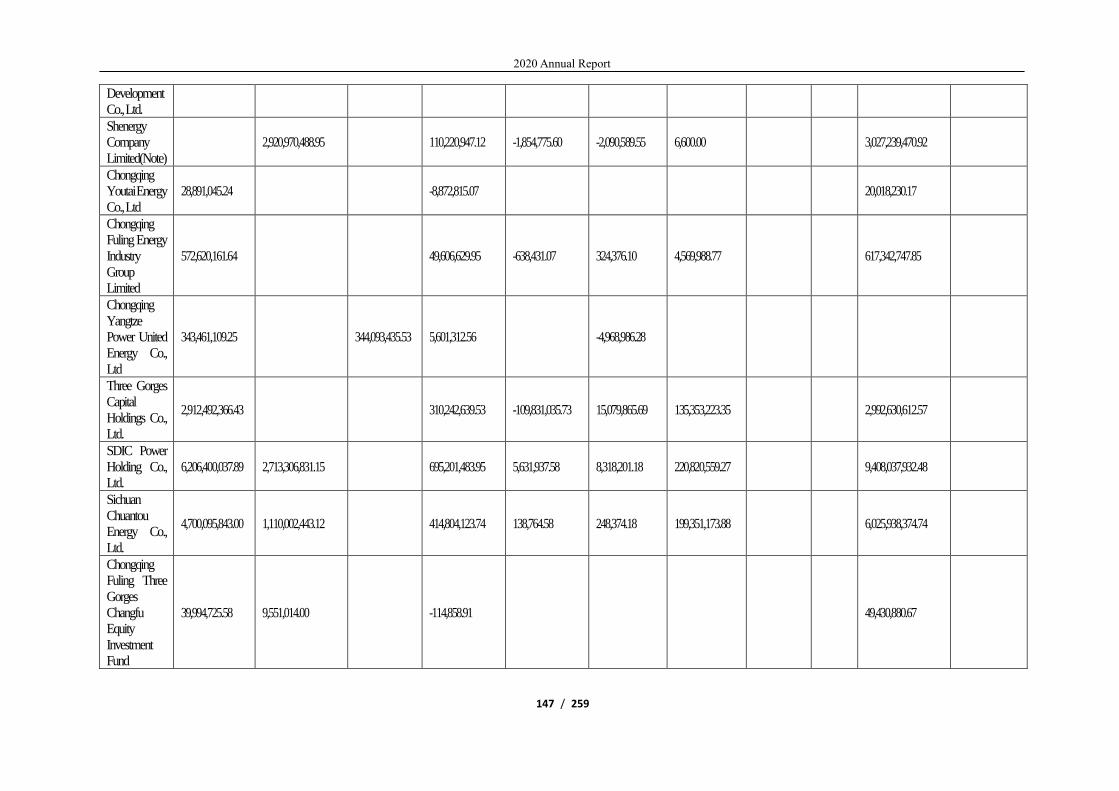
2020 Annual Report
147 / 259
Development
Co., Ltd.
Shenergy
Company
Limited(Note)
2,920,970,488.95 110,220,947.12 -1,854,775.60 -2,090,589.55 6,600.00 3,027,239,470.92
Chongqing
Youtai Energy
Co., Ltd
28,891,045.24 -8,872,815.07 20,018,230.17
Chongqing
Fuling Energy
Industry
Group
Limited
572,620,161.64 49,606,629.95 -638,431.07 324,376.10 4,569,988.77 617,342,747.85
Chongqing
Yangtze
Power United
Energy Co.,
Ltd
343,461,109.25 344,093,435.53 5,601,312.56 -4,968,986.28
Three Gorges
Capital
Holdings Co.,
Ltd.
2,912,492,366.43 310,242,639.53 -109,831,035.73 15,079,865.69 135,353,223.35 2,992,630,612.57
SDIC Power
Holding Co.,
Ltd.
6,206,400,037.89 2,713,306,831.15 695,201,483.95 5,631,937.58 8,318,201.18 220,820,559.27 9,408,037,932.48
Sichuan
Chuantou
Energy Co.,
Ltd.
4,700,095,843.00 1,110,002,443.12 414,804,123.74 138,764.58 248,374.18 199,351,173.88 6,025,938,374.74
Chongqing
Fuling Three
Gorges
Changfu
Equity
Investment Fund
39,994,725.58 9,551,014.00 -114,858.91 49,430,880.67

2020 Annual Report
148 / 259
Partnership
(Limited)
Chongqing
Liangjiang
Three Gorges
Xinghong
Equity
Investment
Fund
Partnership
(Limited)
41,029,335.77 389,442.27 41,418,778.04
Chongqing
Qianjiang
Changhong
Three Gorges
Equity
Investment
Fund
Partnership
(Limited)
40,087,715.80 136,000,000.00 541,523.82 176,629,239.62
Yunnan
Huadian
Jinsha River
Midstream
Hydropower
Development
Co., Ltd
4,897,610,000.00 102,516,396.53 5,000,126,396.53
CCB
Internatio
nal
Medical
Industry
Equity
Investmen
t Limited
Company*
49,150,715.11 11,514,309.86 -7,570,734.24 28,626,278.70 24,468,012.03
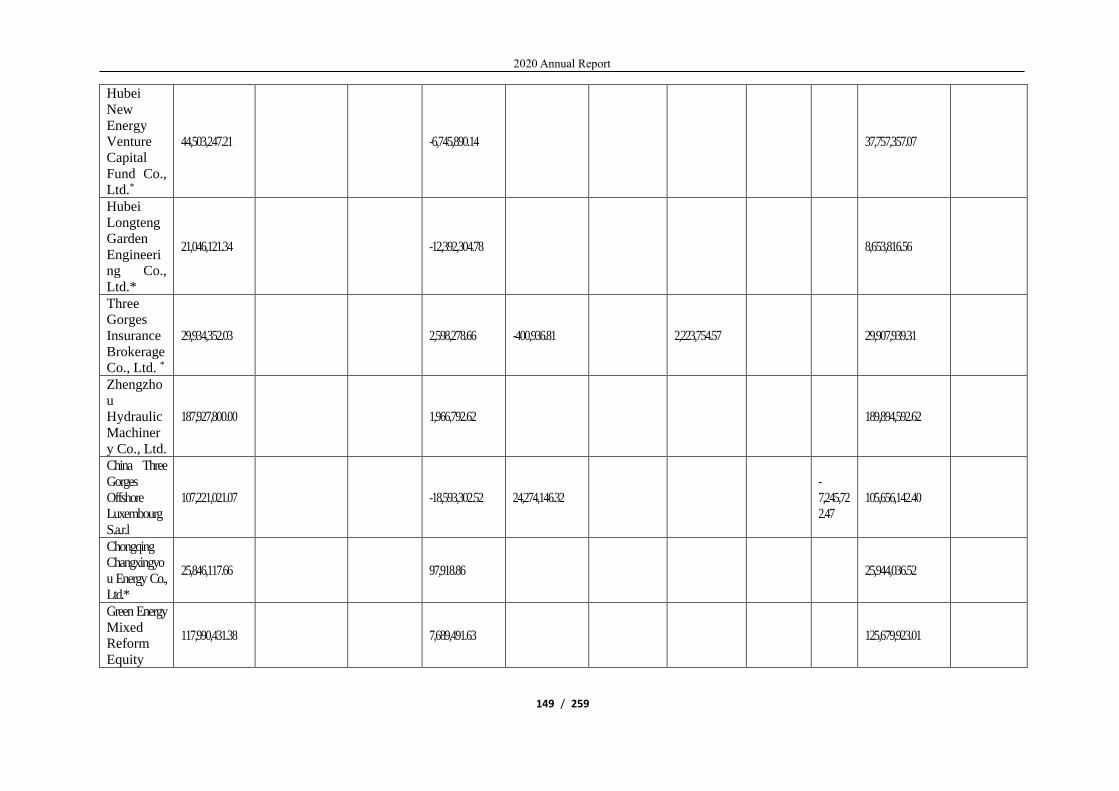
2020 Annual Report
149 / 259
Hubei
New
Energy
Venture
Capital
Fund Co.,
Ltd.*
44,503,247.21 -6,745,890.14 37,757,357.07
Hubei
Longteng
Garden
Engineeri
ng Co.,
Ltd.*
21,046,121.34 -12,392,304.78 8,653,816.56
Three
Gorges
Insurance
Brokerage
Co., Ltd. *
29,934,352.03 2,598,278.66 -400,936.81 2,223,754.57 29,907,939.31
Zhengzho
u
Hydraulic
Machiner
y Co., Ltd.
187,927,800.00 1,966,792.62 189,894,592.62
China Three
Gorges
Offshore
Luxembourg
S.a.r.l
107,221,021.07 -18,593,302.52 24,274,146.32
-
7,245,72
2.47
105,656,142.40
Chongqing
Changxingyo
u Energy Co.,
Ltd.*
25,846,117.66 97,918.86 25,944,036.52
Green Energy
Mixed
Reform
Equity
117,990,431.38 7,689,491.63 125,679,923.01

2020 Annual Report
150 / 259
Investmen
t Fund
(Guangzh
ou)
Partnershi
p
Enterprise
(Limited
Partnershi
p)*
Other 292,065,923.24 124,170,421.05 267,794,638.44 1,372,673.66 581.75 287,009.98 150,101,971.24
Subtotal
40,019,013,335.00 8,722,506,997.72 611,888,073.97 3,192,722,505.29 -149,402,204.56 6,460,184.46 1,003,007,293.86
-
7,245,72
2.47
50,169,159,727.61
Total 40,258,231,503.89 8,745,906,997.72 611,888,073.97 3,182,977,402.41 -149,402,204.56 8,558,701.46 1,003,007,293.86
-
7,245,72
2.47
50,424,131,310.62
Other descriptions
Note 1: From January to June 2020, the Company incrementally held 155,001,162.00 shares in Shenergy Company Limited. As of the end of June 2020, the
Company held a total of 399,860,123.00 shares in Shenergy Company Limited. As its second largest shareholder, the Company has assigned a director to its board
and is able to exercise significant influence over it. Therefore, this investment became long-term equity investment and subsequently measured under the equity
method.
Note 2: During the current year, the Company increased its investments in Shanghai Electric Power Co., Ltd., SDIC Power Holdings Co., Ltd. and Sichuan
Chuantou Energy Co., Ltd. through secondary market.

2020 Annual Report
151 / 259
18、 Other equity instruments investments
(1). Details of other equity instruments investments
Applicable
Unit: RMB Yuan
Item Closing balance Opening balance
Details of investments in non-trading equity instrumentsp 3,609,195,163.56 4,432,380,427.04
Total 3,609,195,163.56 4,432,380,427.04
(2). Details of investments in non-trading equity instruments
Applicable
Unit: RMB Yuan
Item Dividends income recognized
in the current period Accumulated income
Accumulated
loss
Transfer from
other
comprehensive
income to
retained earnings
Reason for
designation as at
FVTOCI
Reason for
transfer from
other
comprehensive
income to
retained
earnings
Non-trading equity
instruments 226,231,419.93 2,186,609,407.78
Holding for long-
term
Total 226,231,419.93 2,186,609,407.78 - -
Others:
Non-applicable
19、 Other non-current financial assets
Applicable
Unit: RMB Yuan
Item Closing balance Opening balance
Classified as financial assets at fair value through profit or loss 4,713,666,463.26 5,812,035,941.91
Including: equity instrument investments 4,713,666,463.26 5,812,035,941.91
Total 4,713,666,463.26 5,812,035,941.91

2020 Annual Report
152 / 259
Others:
Non-applicable
20、 Investment properties
Measurement of investment properties (1) Investment properties measured at cost
Unit:RMB Yuan
Item Buildings Land Construction in
progress Total
I. Cost
1.Opening balance 44,432,089.06 44,432,089.06
2.Increase in the current period
(1)Purchases
( 2 ) Transfer from inventories\fixed
assets\construction in progress
3. Decrease in the current period
(1)Disposal
(2)Other transfer-out
4. Change in scope of business
combinations
43,654,237.04 84,277,742.88 127,931,979.92
5. Foreign currency translation -5,937,590.99 -11,087,995.66 -17,025,586.65
6.Closing balance 82,148,735.11 73,189,747.22 155,338,482.33
II.Accumulated depreciation and amortization
1.Opening balance 16,879,248.69 16,879,248.69
2.Increase in the current period 1,657,910.01 1,657,910.01
(1)Depreciation or amortization 1,657,910.01 1,657,910.01
3.Decrease in the current period
(1)Disposal
(2)Other transfer-out
4. Change in scope of business
combinations
13,414,222.82 13,414,222.82

2020 Annual Report
153 / 259
5. Foreign currency translation -1,888,003.36 -1,888,003.36
6.Closing balance 30,063,378.16 30,063,378.16
三、Provision for impairment
1.Opening balance
2.Increase in the current period
(1)Provision
3.Decrease in the current period
(1)Disposal
(2)Other transfer-out
4. Change in scope of business
combinations
5. Foreign currency translation
6.Closing balance
IV. Carrying amount
1. Carrying amount at the end of the
reporting period 52,085,356.95 73,189,747.22 125,275,104.17
2.Carrying amount at the beginning of the
reporting period
27,552,840.37 27,552,840.37
(2). Investment property of which certificates of title have not been obtained
Non-applicable
Others Non-applicable
21、 Fixed assets
Presentation of items
Applicable
Unit:RMB Yuan
Item Closing balance Opening balance
Fixed assets 231,101,152,705.45 226,290,667,101.97
Disposal of fixed assets 18,710,649.03 1,298,110.20
Total 231,119,863,354.48 226,291,965,212.17

2020 Annual Report
154 / 259
Other:
Non-applicable
Fixed assets
(1). Details of fixed assets
Applicable
Unit: RMB Yuan
Item Water retaining
structures
Plant and
buildings Machinery and equipment Vehicles
Electronic and
other
equipment
Land Total
(I)Cost:
1.Opening
balance 141,895,865,197.29 89,691,386,575.64 101,283,382,806.28 202,702,510.64 905,369,243.76 333,978,706,333.61
2.Increase
in the current
period
6,263,912.42 2,051,925,947.33 3,511,046,661.17 67,732,521.52 237,016,550.68 30,341,319.03 5,904,326,912.15
( 1 )Additions
469,026.53 24,248,108.76 15,809,100.24 26,849,242.27 67,375,477.80
( 2 )Transfer from
construction in
progress
6,263,912.42 2,051,456,920.80 3,486,798,552.41 51,923,421.28 210,167,308.41 30,341,319.03 5,836,951,434.35
3.Decrease
in the current
period
231,575.16 3,803,700.68 229,885,321.59 17,392,935.73 39,027,194.31 290,340,727.47
( 1 )Disposals,
abandonment
and others
231,575.16 3,803,700.68 229,885,321.59 17,392,935.73 39,027,194.31 290,340,727.47
4. Change
in scope of
business
combinations
1,551,373,720.94 12,344,903,256.31 106,783,334.84 367,344,816.09 1,254,249,293.14 15,624,654,421.32

2020 Annual Report
155 / 259
5. Foreign
currency
translation
-206,766,063.24 -1,843,695,357.76 -15,959,141.96 -57,986,682.76 -179,719,240.43 -2,304,126,486.15
6.Closing
balance 141,901,897,534.55 93,084,116,479.99 115,065,752,044.41 343,866,289.31 1,412,716,733.46 1,104,871,371.74 352,913,220,453.46
II.Accumulated
depreciation
1.Opening
balance 30,264,402,807.38 19,777,731,189.85 57,045,533,235.65 148,139,869.48 452,232,129.28 107,688,039,231.64
2.Increase
in the current
period
3,204,940,998.08 2,450,145,513.67 5,853,357,946.72 21,457,612.11 71,863,324.83 11,601,765,395.41
( 1 )Provision
3,204,940,998.08 2,450,145,513.67 5,853,357,946.72 21,457,612.11 71,863,324.83 11,601,765,395.41
3.Decrease
in the current
period
81,840.24 2,695,352.03 220,264,323.28 12,346,931.94 37,828,796.81 273,217,244.30
( 1 )Disposals,
abandonment
and others
81,840.24 2,695,352.03 220,264,323.28 12,346,931.94 37,828,796.81 273,217,244.30
4. Change
in scope of
business
combinations
140,302,729.49 2,804,969,086.44 46,675,214.79 279,256,877.84 3,271,203,908.56
5. Foreign
currency
translation
-21,556,652.31 -405,613,650.42 -7,271,210.90 -41,282,029.67 -475,723,543.30
6.Closing
balance 33,469,261,965.22 22,343,927,428.67 65,077,982,295.11 196,654,553.54 724,241,505.47 121,812,067,748.01
III. Provision
for impairment
1.Opening
balance

2020 Annual Report
156 / 259
2.Increase
in the current
period
( 1 )Provision
3.Decrease
in the current
period
( 1 )Disposals,
abandonment
and others
4. Change
in scope of
business
combinations
5. Foreign
currency
translation
6.Closing
balance
IV. Carrying
amount
1.Carrying
amount at the
end of the
reporting period
108,432,635,569.33 70,740,189,051.32 49,987,769,749.30 147,211,735.77 688,475,227.99 1,104,871,371.74 231,101,152,705.45
2.Carrying
amount at the
beginning of the
reporting period
111,631,462,389.91 69,913,655,385.79 44,237,849,570.63 54,562,641.16 453,137,114.48 226,290,667,101.97
Note: The land is the land ownership right of Peru Company.

2020 Annual Report
157 / 259
(2). Temporary idle fixed assets
Non-applicable
(3). Fixed assets acquired under finance leases
Non-applicable
(4). Fixed assets leased out under operating leases
Non-applicable
(5). Fixed assets of which certificates of title have not been obtained
Applicable
Unit: RMB Yuan
Item Carrying amount Reasons why certificates of title
have not been obtained
Plant and buildings 19,692,745.69 In the process of applying for the
certificates of title
Others: Non-applicable
Disposal of fixed assets
Applicable
Unit: RMB Yuan
Item Closing balance Opening balance
Disposal of fixed assets 18,710,649.03 1,298,110.20
Total 18,710,649.03 1,298,110.20
Others:
Nil

2020 Annual Report
158 / 259
22、 Construction in progress
Presentation of items
Applicable
Unit: RMB Yuan
Item Closing balance Opening balance
Construction in progress 2,978,656,023.35 6,820,572,132.91
Construction materials 14,812,476.85 60,067,302.75
Total 2,993,468,500.20 6,880,639,435.66
Others: Non-applicable
(1). Construction in progress
Applicable
Unit:RMB Yuan
Item
Closing balance Opening balance
Book balance Provision for
impairment Carrying amount Book balance
Provision for
impairment Carrying amount
Xiangjiaba construction
(Note) 1,485,013,496.49 1,485,013,496.49 5,816,605,608.15 5,816,605,608.15
Ancillary buildings of
Kunming base 541,058,560.68 541,058,560.68
Transformation of 220kV
switch station of Gezhouba 75,903,756.68 75,903,756.68 122,424,114.45 122,424,114.45
Renovation, transformation
and increase in capacity of
hydraulic generators of the
power station of Gezhouba
61,643,360.09 61,643,360.09 49,230,429.26 49,230,429.26
Illuminated construction of
hub rendering of Gezhouba 28,304,013.79 28,304,013.79

2020 Annual Report
159 / 259
Addition of GCB switches to
six generators in the Three
Gorges Left Bank power
station
29,519,374.10 29,519,374.10 25,766,816.02 25,766,816.02
Transformation of the
monitoring system of Three
Gorges Left Bank power
station
33,116,587.03 33,116,587.03 22,248,937.01 22,248,937.01
Tranformation of 12
governors of Three Gorges
Left Bank power station
19,347,119.90 19,347,119.90
Transformation of 170 MW
hydraulic generators of
Gezhouba
30,963,713.88 30,963,713.88
220/60kV power substation of
Pachacutec 270,942,739.53 270,942,739.53
220/22,9/10 kV power
substation of Progreso 113,494,623.02 113,494,623.02
Other 878,058,372.53 878,058,372.53 195,586,533.65 195,586,533.65
Total 2,978,656,023.35 2,978,656,023.35 6,820,572,132.91 6,820,572,132.91
Note: The main works of Xiangjiaba Power Station has been reached its intended use and transferred to fixed assets, and CIP represents closing works of Xiangjiaba
project.
(2). Changes in significant construction in progress
Applicable
Unit:RMB Yuan
Item Budget Opening balance Increase in the current period
Transfer to fixed assets
Other decreases
Closing balance
Amount
injected as a
proportio
n of
budget
amount
(%)
Constructi
on
progress
Amount of
accumulated capitalized
interest
Including:
capitaliz
ed interest
for the
current period
Intere
st capital
izatio
n rate for the
curren
t period
(%)
Source of funds

2020 Annual Report
160 / 259
Xiangjiaba
construction 54,165,000,000.00 5,816,605,608.15 61,323,121.19 4,392,915,232.85 1,485,013,496.49
Self-
financing
Ancillary
buildings of
Kunming
base
616,250,000.00 541,058,560.68 25,237,967.59 514,581,052.01 51,715,476.26 91.89 100.00 Self-
financing
Transformati
on of 220kV
switch station
of Gezhouba
393,350,000.00 122,424,114.45 43,120,176.41 89,264,591.12 375,943.06 75,903,756.68 57.32 90.00 Self-
financing
Renovation,
transformatio
n and increase
in capacity of
hydraulic
generators of
the power
station of
Gezhouba
1,800,000,000.00 49,230,429.26 71,755,303.23 59,342,372.40 61,643,360.09 78.62 95.00 Self-
financing
Illuminated
construction
of hub
rendering of
Gezhouba
37,000,000.00 28,304,013.79 275,819.57 28,579,833.36 77.25 100.00 Self-
financing
Addition of
GCB switches
to six
generators in
the Three
Gorges Left
Bank power
station
40,000,000.00 25,766,816.02 3,752,558.08 29,519,374.10 73.79 95.00 Self-
financing

2020 Annual Report
161 / 259
Transformati
on of the
monitoring
system of
Three Gorges
Left Bank
power station
70,000,000.00 22,248,937.01 10,867,650.02 33,116,587.03 47.31 50.00 Self-
financing
Transformation of of
12 governors
of Three
Gorges Left
Bank power
station
27,000,000.00 19,347,119.90 19,347,119.90 71.65 100.00 Self-
financing
Transformation of
170 MW
hydraulic
generators of
Gezhouba
471,500,000.00 30,963,713.88 30,963,713.88 6.57 5.00 Self-
financing
Total 57,620,100,000.00 6,624,985,599.26 247,296,309.97 5,104,030,201.64 52,091,419.32 1,716,160,288.27 / / / /
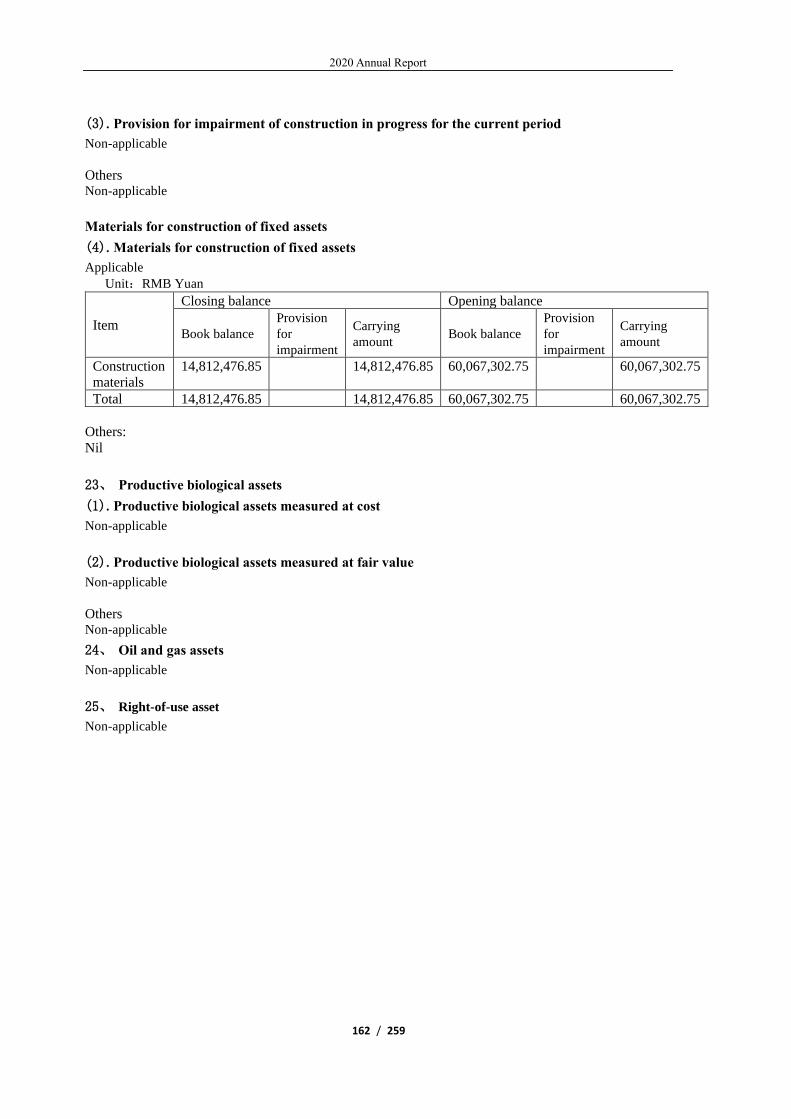
2020 Annual Report
162 / 259
(3). Provision for impairment of construction in progress for the current period
Non-applicable
Others Non-applicable
Materials for construction of fixed assets
(4). Materials for construction of fixed assets
Applicable
Unit:RMB Yuan
Item
Closing balance Opening balance
Book balance
Provision
for
impairment
Carrying
amount Book balance
Provision
for
impairment
Carrying
amount
Construction
materials
14,812,476.85 14,812,476.85 60,067,302.75 60,067,302.75
Total 14,812,476.85 14,812,476.85 60,067,302.75 60,067,302.75
Others:
Nil
23、 Productive biological assets
(1). Productive biological assets measured at cost
Non-applicable
(2). Productive biological assets measured at fair value
Non-applicable
Others Non-applicable
24、 Oil and gas assets
Non-applicable
25、 Right-of-use asset
Non-applicable

2020 Annual Report
163 / 259
26、 Intangible assets
(1). Intangible assets
Applicable
Unit:RMB Yuan
Item Land use rights 软件及其他 车位使用权 特许经营权 Total
I. Cost
1.Opening balance 122,644,899.00 186,889,656.45 47,061,908.89 356,596,464.34
2.Increase in the current period 90,806,661.36 52,434,426.20 9,727,200.15 152,968,287.71
(1) Additions 90,806,661.36 52,434,426.20 9,727,200.15 152,968,287.71
(2) Internal R&D
3.Decrease in the current period 1,966,954.72 2,605.60 1,969,560.32
(1) Disposals, abandonment
and others 1,966,954.72 2,605.60 1,969,560.32
4. Change in scope of business
combinations 99,256,000.00 -362,050.53 21,877,609,000.00 21,976,502,949.47
5. Foreign currency translation -15,492,648.83 -1,594,560,827.26 -1,610,053,476.09
6.Closing balance 122,644,899.00 359,492,714.26 99,131,678.96 20,292,775,372.89 20,874,044,665.11
II. Accumulated amortization
1.Opening balance 18,413,759.48 139,590,356.34 7,129,604.02 165,133,719.84
2.Increase in the current period 3,076,411.48 29,601,185.99 1,263,681.40 33,941,278.87
(1) Provision 3,076,411.48 29,601,185.99 1,263,681.40 33,941,278.87
3.Decrease in the current period 1,966,954.72 1,966,954.72
(1) Disposals, abandonment
and others 1,966,954.72 1,966,954.72
4. Change in scope of business
combinations 71,905,000.00 -40,153.02 71,864,846.98
5. Foreign currency translation -9,253,645.50 -9,253,645.50
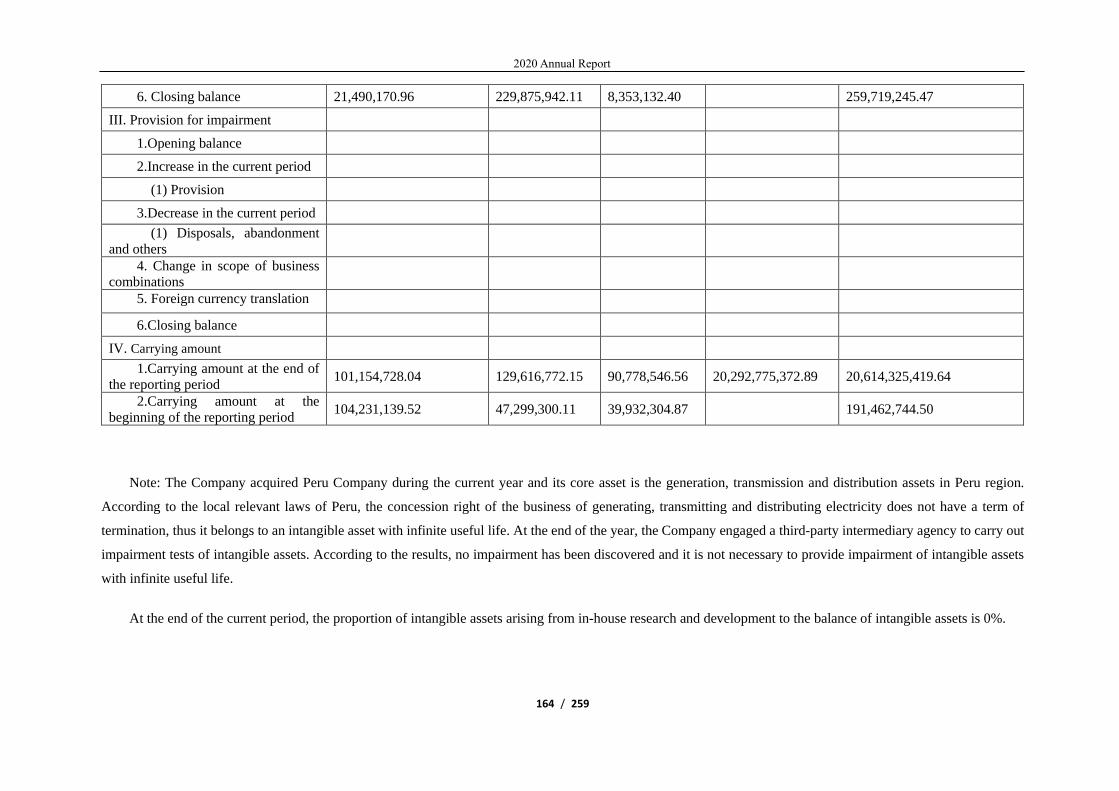
2020 Annual Report
164 / 259
6. Closing balance 21,490,170.96 229,875,942.11 8,353,132.40 259,719,245.47
III. Provision for impairment
1.Opening balance
2.Increase in the current period
(1) Provision
3.Decrease in the current period
(1) Disposals, abandonment
and others
4. Change in scope of business
combinations
5. Foreign currency translation
6.Closing balance
IV. Carrying amount
1.Carrying amount at the end of
the reporting period 101,154,728.04 129,616,772.15 90,778,546.56 20,292,775,372.89 20,614,325,419.64
2.Carrying amount at the
beginning of the reporting period 104,231,139.52 47,299,300.11 39,932,304.87 191,462,744.50
Note: The Company acquired Peru Company during the current year and its core asset is the generation, transmission and distribution assets in Peru region.
According to the local relevant laws of Peru, the concession right of the business of generating, transmitting and distributing electricity does not have a term of
termination, thus it belongs to an intangible asset with infinite useful life. At the end of the year, the Company engaged a third-party intermediary agency to carry out
impairment tests of intangible assets. According to the results, no impairment has been discovered and it is not necessary to provide impairment of intangible assets
with infinite useful life.
At the end of the current period, the proportion of intangible assets arising from in-house research and development to the balance of intangible assets is 0%.

2020 Annual Report
165 / 259
(2). Land use rights of which certificates of title have not been obtained
Non-applicable
Others: Non-applicable
27、 Development expenditures
Non-applicable
28、 Goodwill
(1). Cost of goodwill
Applicable
Unit:RMB Yuan
Name of the
investee or
item resulting
in goodwill
Opening
balance
Increase in the current period Decrease in the current
period Closing balance Arising from
business
combination Other
Disposa
l Other
Peru
companies
1,092,758,460.4
9 82,408,645.57 1,010,349,814.92
Total 1,092,758,460.4
9 82,408,645.57 1,010,349,814.92
Note: “Decrease in the year – other” represents the effect of exchange rate changes.
(2). Provision for impairment of goodwill
Non-applicable
(3). Relevant information of asset groups or portfolios of asset groups of which the goodwill forms
a part
Applicable
According to the operating business of Peru Company and assets that generates cash inflows
independently, it is classified as an asset group of generation, transmission and distribution and an asset
group of power generation. Goodwill is allocated to each of the above asset group.
(4). Explanations on impairment testing process of goodwill, key parameters (e.g., projected growth
rate, stable period growth rate, profit margin, discount rate and forecast period, as applicable,
when determining the present value of future cash flows) and recognition method of
impairment losses
Applicable
At the end of the year, the Company engaged a third-party intermediary institution to carry out
impairment tests on goodwill. According to the historical operating condition of asset groups and the
forecast estimate of future operations, the recoverable amount of asset groups amounted US$5.295 billion
which is higher than its carrying value (US$5.116 billion), thus there are no impairment against goodwil.
(5). Impact of impairment testing of goodwill
Non-applicable
Others Non-applicable

2020 Annual Report
166 / 259
29、 Long-term prepaid expenses
Non-applicable
30、 Deferred tax assets/deferred tax liabilities
(1). Deferred tax assets before offset
Applicable
Unit:RMB Yuan
Item Closing balance Opening balance
Deductible temporary
differences Deferred tax
assets Deductible temporary
differences Deferred tax
assets
Provision for
assets impairment 323,118,712.98 74,776,102.55 324,035,755.25 76,529,364.02
Staff’s
remuneration 41,440,302.22 10,360,075.56
Depreciation of
fixed asset 551,060,215.03 50,647,382.21 631,917,685.53 80,929,930.49
Transfer fee of
social functions 1,344,397,357.72 205,652,742.93 1,163,482,497.00 181,739,027.75
Accruals 151,947,852.00 22,792,177.80 121,041,327.99 18,156,199.20
Government
grants 5,614,119.30 1,403,529.83 5,833,758.06 1,458,439.52
Staff’s
remuneration of
Peru Company
28,569,765.25 8,428,080.75
Other projects
of Peru Company 73,043,529.01 21,547,841.06
Total 2,477,751,551.29 385,247,857.13 2,287,751,326.05 369,173,036.54
(2). Deferred tax liabilities before offset
Applicable
Unit:RMB Yuan
Item
Closing balance Opening balance
Taxable
temporary
differences
Deferred tax
liabilities
Taxable
temporary
differences
Deferred tax
liabilities
Fair value change of
other non-current
financial assets
99,761,870.00 24,940,467.50 352,848,712.87 88,212,178.23
Changes in fair value of
other debt investments 2,450,790,989.64 612,697,747.41 3,146,323,277.66 786,580,819.42
Appreciation of the
value of assets of Peru
Company
4,483,957,517.33 1,322,767,467.61
Other projects of Peru
Company 7,034,510,376.97 1,960,405,682.52 3,499,171,990.53 874,792,997.65
Total 99,761,870.00 24,940,467.50 352,848,712.87 88,212,178.23
(3). Deferred tax assets or liabilities presented at the net amount after offset
Non-applicable
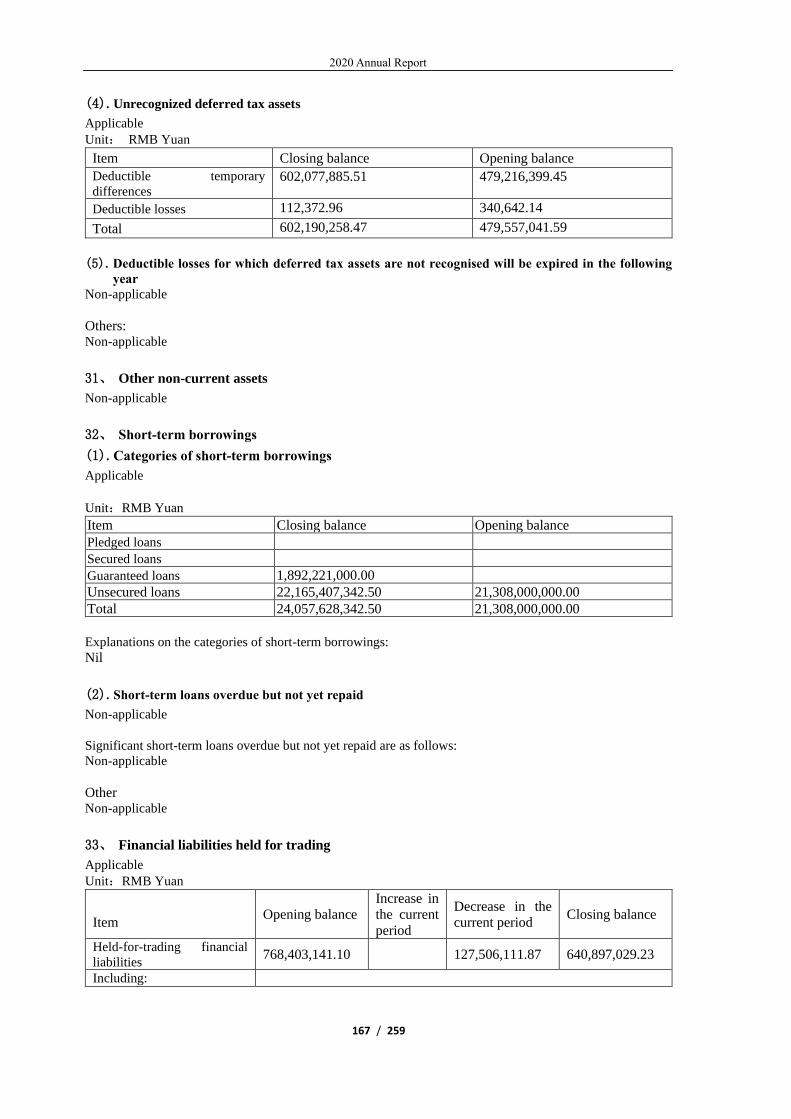
2020 Annual Report
167 / 259
(4). Unrecognized deferred tax assets
Applicable
Unit: RMB Yuan
Item Closing balance Opening balance
Deductible temporary
differences 602,077,885.51 479,216,399.45
Deductible losses 112,372.96 340,642.14
Total 602,190,258.47 479,557,041.59
(5). Deductible losses for which deferred tax assets are not recognised will be expired in the following
year
Non-applicable
Others: Non-applicable
31、 Other non-current assets
Non-applicable
32、 Short-term borrowings
(1). Categories of short-term borrowings
Applicable
Unit:RMB Yuan
Item Closing balance Opening balance
Pledged loans
Secured loans
Guaranteed loans 1,892,221,000.00
Unsecured loans 22,165,407,342.50 21,308,000,000.00
Total 24,057,628,342.50 21,308,000,000.00
Explanations on the categories of short-term borrowings:
Nil
(2). Short-term loans overdue but not yet repaid
Non-applicable
Significant short-term loans overdue but not yet repaid are as follows:
Non-applicable
Other Non-applicable
33、 Financial liabilities held for trading
Applicable
Unit:RMB Yuan
Item Opening balance
Increase in
the current
period
Decrease in the
current period Closing balance
Held-for-trading financial
liabilities 768,403,141.10 127,506,111.87 640,897,029.23
Including:

2020 Annual Report
168 / 259
Options of
exchangeable bonds (note) 768,403,141.10 127,506,111.87 640,897,029.23
Financial liabilities
designated as at FVTPL
Total 768,403,141.10 127,506,111.87 640,897,029.23
Others: Applicable
Note: Please see “7. 46. Bonds Payable Note 4 and Note 5”for details.
34、 Derivative financial liabilities
Non-applicable
35、 Notes payable
(1). Notes payable
Non-applicable
36、 Accounts payable
(1). Accounts payable
Applicable
Unit:RMB Yuan
Item Closing balance Opening balance
Within 1 year 862,834,503.47 72,801,074.57
1-2 years 1,565,560.87 13,022,392.72
2-3 years 3,188,816.24 731,546.04
More than 3 years 82,355.58 264,592.22
Total 867,671,236.16 86,819,605.55
Note: The accounts payable as at the end of the period mainly represent the payables for purchase of
electricity.
(2). Significant accounts payable aged over 1 year
Non-applicable
Other Non-applicable
37、 Receipts in advance
(1). Receipts in advance
Applicable
Unit:RMB Yuan
Item Closing balance Opening balance
Within 1 year 33,980,139.67 8,788,393.37
Total 33,980,139.67 8,788,393.37
(2). Significant receipts in advance aged over 1 year
Non-applicable
Others Non-applicable

2020 Annual Report
169 / 259
38、 Contract liabilities
(1). Contract liabilities
Non-applicable
(2). Amount and reasons for significant changes in book value during the reporting period
Non-applicable
Others: Non-applicable
39、 Payroll and employee benefits payable
(1). Payroll and employee benefits payable
Applicable
Unit: RMB Yuan
Item Opening balance Increase in the
current period
Decrease in the
current period
Closing
balance
I. Short-term benefits 120,539,909.11 2,521,295,186.77 2,429,697,423.08 212,137,672.80
II.Post-employment
benefits – Defined
contribution plan 202,355,239.78 199,624,284.09 2,730,955.69
III. Termination benefits 18,271,554.06 13,909,008.26 4,362,545.80
IV.Other benefits due
within one year
Total 120,539,909.11 2,741,921,980.61 2,643,230,715.43 219,231,174.29
(2). Short-term benefits
Applicable
Unit:RMB Yuan
Item Opening
balance
Increase in the
current period
Decrease in the
current period
Closing
balance
I.Wages or salaries, bonuses,
allowances and subsidies 34,970,719.17 1,659,869,110.16 1,674,357,848.75 20,481,980.58
II. Staff welfare 218,763,319.97 212,787,186.68 5,976,133.29
III. Social security
contributions 123,241,927.42 119,075,260.53 4,166,666.89
Including: Medical insurance 64,331,575.61 61,860,949.34 2,470,626.27
Work injury insurance 1,326,553.94 1,298,110.47 28,443.47
Maternity insurance 4,069,973.73 4,069,973.73
Supplementary
medical insurance 45,159,869.79 45,159,869.79
Other 8,353,954.35 6,686,357.20 1,667,597.15
IV. Housing funds 106,099,042.21 106,099,042.21
V. Labor union and
employee education costs 85,569,189.94 62,927,816.94 36,764,685.86 111,732,321.02
VI. Short-term paid leave
VII.Short-term profit-sharing
plan 324,254,633.65 254,474,062.63 69,780,571.02
VIII.Other short-term
remuneration 26,139,336.42 26,139,336.42
Total 120,539,909.11 2,521,295,186.77 2,429,697,423.08 212,137,672.80

2020 Annual Report
170 / 259
(3). Defined contribution plan
Applicable
Unit: RMB Yuan
Item Opening
balance
Increase in the
current period
Decrease in the
current period Closing balance
1.Basic pension insurance 66,633,829.39 64,247,967.88 2,385,861.51
2.Unemployment insurance 1,932,913.05 1,932,913.05
3. Enterprise annuity 133,788,497.34 133,443,403.16 345,094.18
Total 202,355,239.78 199,624,284.09 2,730,955.69
Others: Non-applicable
40、 Taxes payable
Applicable
Unit:RMB Yuan
Item Closing balance Opening balance
Value added tax 1,771,618,935.33 565,168,563.12
Consumption tax 84,477,127.01 110,122,250.31
Enterprise income tax 1,740,507,264.91 994,450,590.67
Individual income tax 40,527,856.06 32,967,873.52
City construction and
maintenance tax 48,761,003.59 35,919,275.51
House property tax 173,255,002.86 154,495,388.93
Land use tax 176,249,045.04 169,132,142.26
Education surcharges 23,836,339.53 27,008,248.59
Peru IGV tax 159,036,867.30
Other 17,175,057.81 16,978,581.00
Total 4,235,444,499.44 2,106,242,913.91
Others:
Nil
41、 Other payables
Presentation of items
Applicable
Unit:RMB Yuan
Item Closing balance Opening balance
Interest payable 1,091,987,201.14 897,073,966.87
Dividends payable 36,473,316.08
Other payables 15,831,729,269.46 20,145,190,386.39
Total 16,960,189,786.68 21,042,264,353.26
Others: Non-applicable
Interest payable
(1). Categories
Applicable
Unit:RMB Yuan
Item Closing balance Opening balance

2020 Annual Report
171 / 259
Interest of long-term borrowings with
interest payable by installments and
principal payable on maturity
144,913,993.70 63,195,356.45
Interest on corporate debenture 854,358,367.81 690,571,246.89
Interest payable on short-term
borrowings 35,128,538.28 25,720,341.70
Interest payable on short-term
commercial paper
57,586,301.35 117,587,021.83
Total 1,091,987,201.14 897,073,966.87
Significant interest overdue but not yet paid:
Non-applicable
Others:
Non-applicable
Dividends payable
(2). Categories
Non-applicable
Other payables
(1). Other payables presented by nature
Applicable
Unit: RMB Yuan
Item Closing balance Opening balance
Project payment 12,080,023,651.03 14,321,897,653.78
Deposit and Margin 495,415,527.99 466,446,442.12
Fees to be paid 3,083,967,956.79 5,319,872,751.01
Other payables 172,322,133.65 36,973,539.48
Total 15,831,729,269.46 20,145,190,386.39
s
(2). Significant other payables aged over 1 year
Applicable
Unit:RMB Yuan
Item Closing balance Reasons for not being repaid or
transferred
China Gezhouba Group Stock Company
Limited
104,382,559.02 Not yet due
SinoHydro Bureau 14 Co., Ltd.* 47,067,650.70 Not yet due
SinoHydro Bureau 8 Co., Ltd.* 44,766,310.33 Not yet due
SinoHydro Bureau 4 Co., Ltd.* 14,900,307.61 Not yet due
SinoHydro Bureau 7 Co., Ltd.* 14,273,905.83 Not yet due
Total 225,390,733.49 /
Others: Non-applicable
42、 Liabilities classified as held for sale
Non-applicable
43、 Current portion of non-current liabilities
Applicable
Unit:RMB Yuan

2020 Annual Report
172 / 259
Item Closing balance Opening balance
Long-term borrowings due
within one year 8,600,000,000.00
Bonds payable due within one
year 15,324,325,034.79 2,499,762,842.57
Long-term payables due within
one year
Lease liabilities due within one
year
Total 23,924,325,034.79 2,499,762,842.57
Others:
Nil
44、 Other current liabilities
Other current liabilities
Applicable
Unit:RMB Yuan
Item Closing balance Opening balance
Short-term bonds payable 7,500,526,902.22 7,998,650,574.74
Output VAT tax to be
transferred
6,358.36 6,160.34
Total 7,500,533,260.58 7,998,656,735.08

2020 Annual Report
173 / 259
Changes in short-term bonds payable:
Applicable
Unit: RMB Yuan
Bond name Nominal
value Issue date Maturity
of bond Issue amount Opening balance Issued in the
current period
Interest accrued
per nominal value
Amortization
of premium and discount
Repaid in the
current period Closing balance
Short-term
Financing Bonds
(Tranche I) in
2019
100.00 2019-3-20 1 year 2,500,000,000.00 2,499,464,699.93 17,538,934.44 535,300.07 2,500,000,000.00
Short-term
Financing Bonds
(Tranche II) in
2019
100.00 2019-5-16 1 year 2,500,000,000.00 2,498,940,792.84 30,887,978.16 1,059,207.16 2,500,000,000.00
Short-term
Financing Bonds
(Tranche III) in
2019
100.00 2019-12-5 1 year 3,000,000,000.00 3,000,245,081.97 89,686,065.57 -245,081.97 3,000,000,000.00
Short-term
Financing Bonds
(Tranche V) in
2019
100.00 2019-12-30 1 year 1,500,000,000.00 1,499,233,490.57 14,754,098.36 766,509.43 1,500,000,000.00
Short-term
Financing Bonds
(Tranche I) in
2020 (Note 1)
100.00 2020-1-8 245 days 1,000,000,000.00 999,165,356.40 16,400,273.22 834,643.60 1,000,000,000.00
Short-term
Financing Bonds
(Tranche I) in
2020 (Note 2)
100.00 2020-5-14 1 year 2,500,000,000.00 2,496,933,962.26 27,328,767.10 2,030,137.00 2,498,964,099.26
Short-term
Financing Bonds
(Tranche II) in
2020 (Note 3)
100.00 2020-7-6 160 days 3,000,000,000.00 2,996,100,000.00 23,013,698.63 3,900,000.00 3,000,000,000.00

2020 Annual Report
174 / 259
Short-term
Financing Bonds
(Tranche III) in
2020 (Note 4)
100.00 2020-7-9 46 days 2,000,000,000.00 1,997,400,000.00 3,654,794.52 2,600,000.00 2,000,000,000.00
Short-term
Financing Bonds
(Tranche IV) in
2020 (Note 5)
100.00 2020-7-13 135 days 3,000,000,000.00 2,996,099,999.99 19,417,808.22 3,900,000.01 3,000,000,000.00
Short-term
Financing Bonds
(Tranche II) in
2020 (Note 6)
100.00 2020-8-24 1 year 2,500,000,000.00 2,500,000,000.00 26,038,356.17 1,139,726.04 2,501,139,726.04
Short-term
Financing Bonds
(Tranche V) in
2020(Note 7)
100.00 2020-12-8 130 days 2,500,000,000.00 2,500,000,000.00 4,219,178.08 423,076.92 2,500,423,076.92
Total / / / 26,000,000,000.00 7,998,650,574.74 17,984,932,809.22 272,939,952.47 16,943,518.26 18,500,000,000.00 7,500,526,902.22
Others:
Applicable
Note 1: On 8 January 2020, the Company issued RMB1.0 bn 245-day 2.45% CYPC 2020 SCP (Tranche I), with value date of 9 January 2020 and maturity date
of 10 September 2020, and all interest and principal due and payable on maturity.
Note 2: On 14 May 2020, the Company issued RMB2.5 bn 1-year 1.75% CYPC 2020 CP (Tranche I), with value date of 18 May 2020 and maturity date of 18
May 2021, and all interest and principal due and payable on maturity.
Note 3: On 6 July 2020, the Company issued RMB3.0 bn 160-day 1.75% CYPC 2020 SCP (Tranche II), with value date of 8 July 2020 and maturity date of 15
December 2020, and all interest and principal due and payable on maturity.
Note 4: On 9 July 2020, the Company issued RMB2.0 bn 46-day 1.45% CYPC 2020 SCP (Tranche III), with value date of 13 July 2020 and maturity date of 28
August 2020, and all interest and principal due and payable on maturity.
Note 5: On 13 July 2020, the Company issued RMB3.0 bn 135-day 1.75% CYPC 2020 SCP (Tranche IV), with value date of 15 July 2020 and maturity date of
27 November 2020, and all interest and principal due and payable on maturity.
Note 6: On 24 August 2020, the Company issued RMB2.5 bn 135-day 2.97% CYPC 2020 CP (Tranche II), with value date of 26 August 2020 and maturity date
of 26 August 2021, and all interest and principal due and payable on maturity.

2020 Annual Report
175 / 259
Note 7: On 8 December 2020, the Company issued RMB2.5 bn 130-day 2.8% CYPC 2020 SCP (Tranche V), with value date of 10 December 2020 and maturity
date of 19 April 2021, and all interest and principal due and payable on maturity.
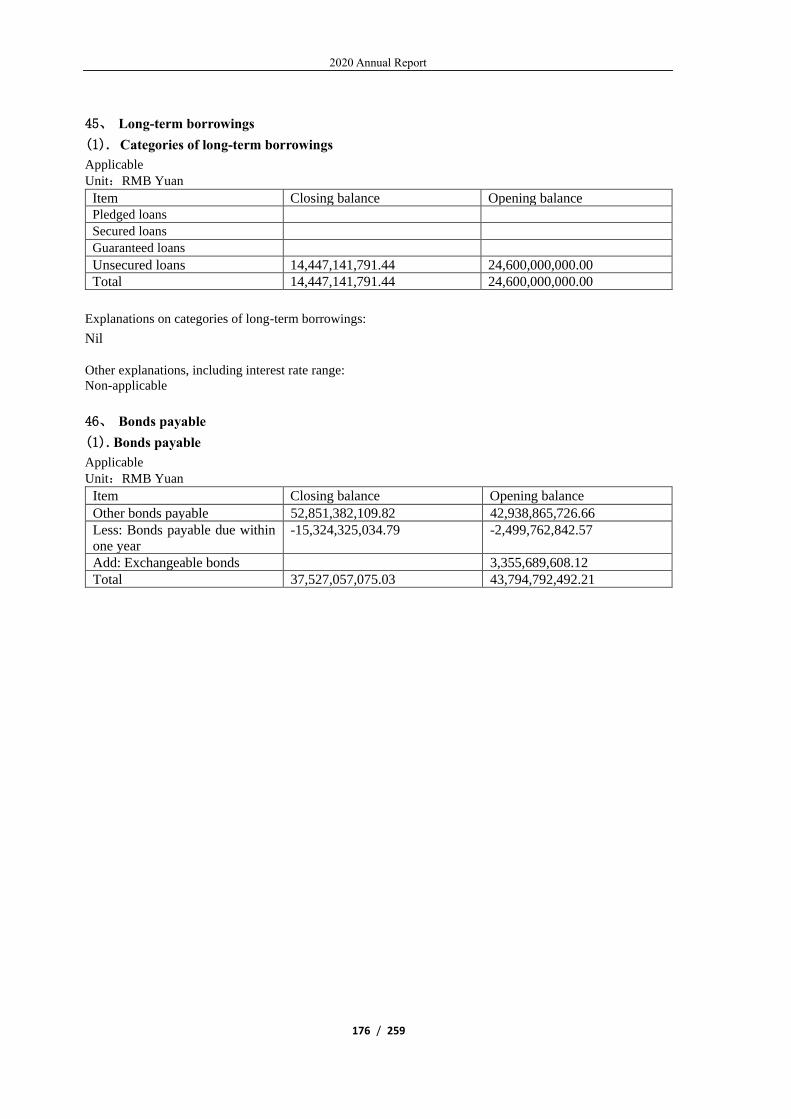
2020 Annual Report
176 / 259
45、 Long-term borrowings
(1). Categories of long-term borrowings
Applicable
Unit:RMB Yuan
Item Closing balance Opening balance
Pledged loans
Secured loans
Guaranteed loans
Unsecured loans 14,447,141,791.44 24,600,000,000.00
Total 14,447,141,791.44 24,600,000,000.00
Explanations on categories of long-term borrowings:
Nil
Other explanations, including interest rate range:
Non-applicable
46、 Bonds payable
(1). Bonds payable
Applicable
Unit:RMB Yuan
Item Closing balance Opening balance
Other bonds payable 52,851,382,109.82 42,938,865,726.66
Less: Bonds payable due within
one year
-15,324,325,034.79 -2,499,762,842.57
Add: Exchangeable bonds 3,355,689,608.12
Total 37,527,057,075.03 43,794,792,492.21

2020 Annual Report
177 / 259
(2). Changes in bonds payable: (excluding other financial instruments, such as preference shares and perpetual bonds classified as financial liabilities)
Applicable
Unit:RMB Yuan
Bond name
Nomin
al
value
Issue
date
Maturit
y of
bond
Issue amount Opening
balance
Issued in the
current
period
Addition in
business
combinatio
n
Interest
accrued per
nominal
value
Amortizatio
n of
premium
and discount
Repaid in
the current
period
Closing
balance
02 Three Gorges
Bond 100.00 2002/9/21 20 years 5,000,000,000.00 4,992,751,983.66 238,000,000.00 2,671,474.33 4,995,423,457.99
03 Three Gorges
Bond 100.00 2003/8/1 30 years 3,000,000,000.00 2,985,458,357.41 145,800,000.00 1,072,816.21 2,986,531,173.62
15 CYPC
MTN001 100.00 2015/9/14 10years 3,000,000,000.00 2,987,683,328.91 135,000,000.00 2,164,139.10 2,989,847,468.01
16 CYPC
MTN001 100.00 2016/1/13 5 years 3,000,000,000.00 2,996,763,875.19 91,199,999.99 3,125,123.15 2,999,888,998.34
16 CYPC
MTN002 100.00 2016/8/1 5 years 4,000,000,000.00 3,996,874,207.06 124,799,999.99 2,405,257.43 3,999,279,464.49
18 CYPC
MTN001 100.00 2018/12/3 5 years 2,000,000,000.00 1,995,627,683.95 78,000,000.01 1,202,628.66 1,996,830,312.61
19 CYPC
MTN001 100.00 2019/3/13 5 years 3,000,000,000.00 2,992,947,857.61 109,725,409.83 1,802,955.66 2,994,750,813.27
19 Yangtze
MTN002 100.00 2019/8/7 5 years 2,000,000,000.00 1,994,815,813.12 67,999,999.98 1,201,970.46 1,996,017,783.58
16 Yangtze 01 100.00 2016/10/17 10 years 3,000,000,000.00 2,998,505,399.97 100,499,999.99 240,525.73 2,998,745,925.70
18 Yangtze 01 100.00 2018/7/26 3 years 2,500,000,000.00 2,499,069,411.92 104,749,999.99 667,883.21 2,499,737,295.13
18 Yangtze 02 100.00 2018/9/27 3 years 3,000,000,000.00 3,001,941,623.30 90,014,562.29 2,105,071.34 3,004,046,694.64
19 Yangtze 01 100.00 2019/2/19 3 years 3,000,000,000.00 2,998,820,864.88 103,499,999.99 601,094.89 2,999,421,959.77
19 Yangtze 02 100.00 2019/9/4 5 years 2,000,000,000.00 1,998,946,085.44 76,000,000.01 240,394.09 1,999,186,479.53
19 Yangtze 03 100.00 2019/12/6 3 years 2,000,000,000.00 1,998,896,391.67 69,800,000.03 400,729.97 1,999,297,121.64
20 Yangtze 01 (Note
1) 100.00 2020/1/8 3 years 1,500,000,000.00 1,499,150,943.39 49,583,196.73 294,799.26 1,499,445,742.65
20 Yangtze 02 (Note
1) 100.00 2020/1/8 5 years 500,000,000.00 499,716,981.13 18,146,174.84 58,949.09 499,775,930.22

2020 Annual Report
178 / 259
20 Yangtze (for
COVID-19
prevention
and
control)
MTN001 (Note 2)
100.00 2020/3/12 3 years 2,500,000,000.00 2,492,924,528.30 58,797,945.22 1,993,150.69 2,494,917,678.99
20 Yangtze
MTN002(Note 3) 100.00 2020/4/13 5 years 2,500,000,000.00 2,497,113,207.55 54,881,506.85 1,072,015.32 2,498,185,222.87
CYPIBVI1 N2111
(Note 4)
US 300 mill
ion 2016/11/9 5 years US 300 million 1,934,241,932.36 -123,314,218.03 1,810,927,714.33
CYPIBVI2 N2111
(Note 5)
EUR2
00
million
2016/11/9 5 years EUR200
million 1,421,447,675.76 39,566,854.66 1,461,014,530.42
B.C.LUZ DEL
SUR 2P 2EM S-U-
SECOND
PEN
27,210,000.0
0
2011/10/26 10 years PEN 27,210,000.00 57,015,834.00 2,503,534.30 -8,197,108.56 48,818,725.44
B.C.LUZ DEL
SUR 2P 6EM S-U-
SECOND
PEN
77,580,000.0
0
2012/10/29 10 years PEN 77,580,000.00 162,561,132.00 5,282,727.44 -22,900,071.38 139,661,060.62
B.C.LUZ DEL
SUR 2P 9EM S-U-
SECOND
PEN
83,460,000.0
0
2013/12/20 8 years PEN 83,460,000.00 174,882,084.00 7,611,321.13 -24,470,472.00 150,411,612.00
B.C.LUZ DEL
SUR 2P 10EM S-
U-SECOND
PEN
84,570,000.0
0
2014/2/12 8 years PEN 84,570,000.00 177,207,978.00 8,123,886.04 -24,963,380.21 152,244,597.79
B.C.LUZ DEL
SUR 3P1EM S-A-
THIRD
PEN
138,950,000.
00
2014/6/5 10 years PEN 138,950,000.00 291,155,830.00 12,052,342.66 -41,015,273.51 250,140,556.49
B.C.LUZ DEL
SUR 3P2EM S-A-
THIRD
PEN
81,175,000.0
0
2015/9/3 11 years PEN 81,175,000.00 170,094,095.00 9,212,541.87 -23,961,243.81 146,132,851.19
B.C.LUZ DEL
SUR 3P3EM S-A-
THIRD
PEN
143,150,000.
00
2014/9/22 15 years PEN 143,150,000.00 299,956,510.00 12,764,775.45 -42,255,029.88 257,701,480.12
B.C.LUZ DEL
SUR 3P4EM S-A-
THIRD
PEN
164,100,000.
00
2016/7/14 9 years PEN 164,100,000.00 343,855,140.00 13,834,741.93 -48,439,052.77 295,416,087.23

2020 Annual Report
179 / 259
B.C.LUZ DEL
SUR 3P5EM S-A-
THIRD
PEN
162,450,000.
00
2017/2/7 6 years PEN 162,450,000.00 340,397,730.00 13,432,258.14 -47,952,005.62 292,445,724.38
B.C.LUZ DEL
SUR 3P6EM S-A-
THIRD
PEN
161,800,000.
00
2017/12/14 10 years PEN 161,800,000.00 339,035,720.00 12,460,379.37 -47,760,138.56 291,275,581.44
B.C.LUZ DEL
SUR 3P7EM S-A-
THIRD
PEN
167,350,000.
00
2018/10/30 10 years PEN 167,350,000.00 350,665,190.00 15,194,026.57 -49,398,459.81 301,266,730.19
B.C.LUZ DEL
SUR 3P8EM S-A-
THIRD
PEN
82,800,000.0
0
2019/4/3 7 years PEN 82,800,000.00 173,499,120.00 6,175,147.09 -24,440,911.45 149,058,208.55
B.C.LUZ DEL
SUR 4P1EM S-A-
FOURTH
PEN
168,500,000.
00
2019/10/17 15 years PEN 168,500,000.00 353,074,900.00 11,405,531.36 -49,737,773.42 303,337,126.58
Total / / / 43,794,792,492.21 6,988,905,660.37 3,233,401,263.00 1,846,552,009.09 -515,917,305.76 15,974,125,034.79 37,527,057,075.03
Note 1: On 8 January 2020, the Company issued 2020 CYPC Corporate Bonds, including 20 CYPC 01 (RMB1.5 bn, 3.37%, 3-year, interest payable annually in
arrears, and final interest and principal payable on maturity), and 20 CYPC 02 (RMB5.0 bn, 3.70%, 5-year, interest payable annually in arrears, and final interest and
principal payable on maturity).
Note 2: On 12 March 2020, the Company issued 2020 CYPC MTN (Tranche I), i.e. 20 CYPC (Pandemic Control Notes) MTN001 (RMB2.5 bn, 2.95%, 3-year,
interest payable annually in arrears, and final interest and principal payable on maturity).
Note 3: On 13 April 2020, the Company issued 2020 CYPC MTN (Tranche II), i.e. 20 CYPC MTN002 (RMB2.5 bn, 3.07%, 5-year, interest payable annually in
arrears, and final interest and principal payable on maturity).
Note 4: As approved by the 10th meeting of the 4th session of the Board of Directors of CYPC, on 9 November 2016, China Yangtze International (BVI) 1
Limited (“中国长电国际(英属维尔京群岛)1 有限公司”), a wholly-owned subsidiary, issued USD 300 mn 5-year 0% overseas non-public exchangeable bonds
(“CYPIBVI1N2111”), exchangeable for up to 294,639,058 H shares in CCB. The exchange starts from 20 December 2016 to 26 October 2021 in general conditions,
or in the event of early redemption, from 20 December 2016 to 10 days prior to the specified redemption date, with an initial exchange price of HK$7.8960 per share.
The exchangeable bonds are listed on The Stock Exchange of Hong Kong Limited. As the exchangeable bonds are compound financial instruments, the value of the
exchangeable bonds and the value of the exchange option are split upon initial measurement, and determined in proportion to the fair value of the liability component
or the fair value of the exchange option to the sum of the fair value of the liability component and the fair value of the exchange option, respectively. On 9 November
2016, the value of the liability component in amount of RMB1,884,189,900 was included in bonds payable, and the value of the exchange option component in amount
2020 Annual Report
180 / 259
of RMB150,770,100 million was included in financial liabilities at fair value through profit or loss. As at 31 December 2020, the fair value of the exchange option
component was RMB398,232,300. The amortisation of the premium or discount for the period was mainly due to the effect of exchange rate changes.
Note 5: As approved by the 10th meeting of the 4th session of the Board of Directors of CYPC, on 9 November 2016, China Yangtze International (BVI) 2
Limited (“中国长电国际(英属维尔京群岛)2 有限公司”), a wholly-owned subsidiary, issued EURO 200 mn 5-year 0% overseas non-public exchangeable bonds
(“CYPIBVI2N2111”), exchangeable for up to 202,898,346 H shares in CCB. The exchange starts from 20 December 2016 to 26 October 2021 in general conditions,
or in the event of early redemption, from 20 December 2016 to 10 days prior to the specified redemption date, with an initial exchange price of HK$8.4600 per share.
The exchangeable bonds are listed on The Stock Exchange of Hong Kong Limited. As the exchangeable bonds are compound financial instruments, the value of the
exchangeable bonds and the value of the exchange option are split upon initial measurement, and determined in proportion to the fair value of the liability component
or the fair value of the exchange option to the sum of the fair value of the liability component and the fair value of the exchange option, respectively. On 9 November
2016, the value of the liability component in amount of RMB1,361,874,200 was included in bonds payable, and the value of the exchange option component in amount
of RMB132,965,800 million was included in financial liabilities at fair value through profit or loss. As at 31 December 2020, the fair value of the exchange option
component was RMB242,664,800. The amortisation of the premium or discount for the period was mainly due to the effect of exchange rate changes.

2020 Annual Report
181 / 259
(3). Explanation on the conditions and time for conversion of convertible bonds
Non-applicable
(4). Explanation on other financial instruments classified as financial liabilities
Basic information of other financial instruments (such as outstanding preference shares and perpetual
bonds) as at the end of the reporting period
Non-applicable
Changes in financial instruments (such as outstanding preference shares and perpetual bonds) as at the end of
the reporting period
Non-applicable
Basis of other financial instruments classified as financial liabilities:
Non-applicable
Others:
Non-applicable
47、 Lease liabilities
Non-applicable
48、 Long-term payables
Presentation of items
Applicable
Unit:RMB Yuan
Item Closing balance Opening balance
Long-term payables 20,080,756,020.71 21,232,945,436.94
Special payables
Total 20,080,756,020.71 21,232,945,436.94
Others:
Non-applicable
Long-term payables
(1). Long-term payables presented by nature
Applicable
Unit: RMB Yuan
Item Opening balance Closing balance
Construction expenditures advanced by
China Three Gorges Corporation
14,432,945,436.94 21,232,945,436.94
Shareholders’ loans by co-investors of Yangtze Andes Holding Co., Limited
5,647,810,583.77
Total 20,080,756,020.71 21,232,945,436.94
Others:
Nil
Special payables
(2). Special payables presented by nature
Non-applicable
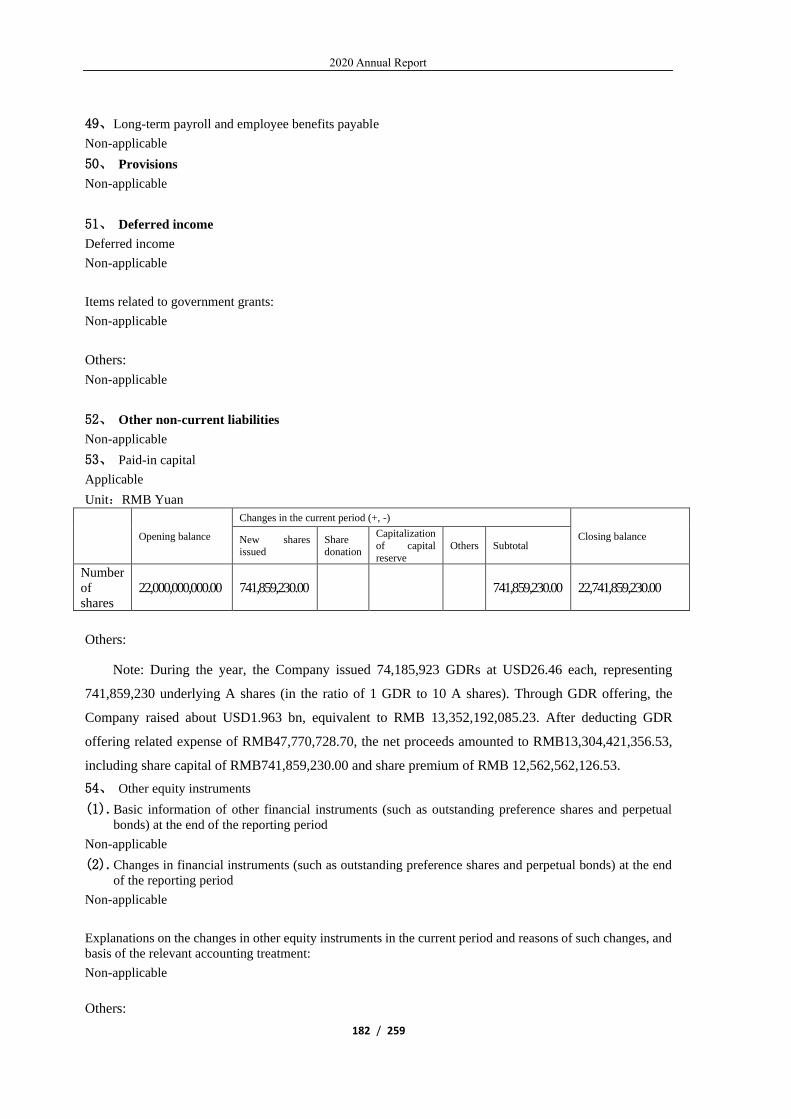
2020 Annual Report
182 / 259
49、 Long-term payroll and employee benefits payable
Non-applicable
50、 Provisions
Non-applicable
51、 Deferred income
Deferred income
Non-applicable
Items related to government grants:
Non-applicable
Others:
Non-applicable
52、 Other non-current liabilities
Non-applicable
53、 Paid-in capital
Applicable
Unit:RMB Yuan
Opening balance
Changes in the current period (+, -)
Closing balance New shares issued
Share donation
Capitalization
of capital
reserve
Others Subtotal
Number
of
shares 22,000,000,000.00 741,859,230.00 741,859,230.00 22,741,859,230.00
Others:
Note: During the year, the Company issued 74,185,923 GDRs at USD26.46 each, representing
741,859,230 underlying A shares (in the ratio of 1 GDR to 10 A shares). Through GDR offering, the
Company raised about USD1.963 bn, equivalent to RMB 13,352,192,085.23. After deducting GDR
offering related expense of RMB47,770,728.70, the net proceeds amounted to RMB13,304,421,356.53,
including share capital of RMB741,859,230.00 and share premium of RMB 12,562,562,126.53.
54、 Other equity instruments
(1). Basic information of other financial instruments (such as outstanding preference shares and perpetual
bonds) at the end of the reporting period
Non-applicable
(2). Changes in financial instruments (such as outstanding preference shares and perpetual bonds) at the end
of the reporting period
Non-applicable
Explanations on the changes in other equity instruments in the current period and reasons of such changes, and
basis of the relevant accounting treatment:
Non-applicable
Others:

2020 Annual Report
183 / 259
Non-applicable
55、 Capital reserve
Applicable
Unit:RMB Yuan
Item Opening balance Increase in the
current period
Decrease
in the
current
period
Closing balance
Capital
premium
(share
premium)(Note
1)
43,820,006,348.75 12,562,562,126.53 56,382,568,475.28
Other capital
reserves(Note
2) 544,307,437.52 1,248,262.14 545,555,699.66
Total 44,364,313,786.27 12,563,810,388.67 56,928,124,174.94
Other explanations, including explanations on changes in the current period and reasons of such changes:
Note 1: Please refer to "VII.53. Share capital" for details.
Note 2: The change in “Capital surplus - other capital surplus” for the year mainly represents changes
in owners' equity of the investees under the equity method of accounting other than net profit or loss and
other comprehensive income.
56、 Treasury shares
Non-applicable

2020 Annual Report
184 / 259
57、 Other comprehensive income
Applicable
Unit: RMB Yuan
Item Opening balance
Amount incurred in the current period
Closing balance Amount incurred before income tax in the current
period
Less: Amount
included in other
comprehensive
income in the prior periods
that is
transferred to profit or loss
for the current
period
Less: Income
tax expenses Less: Other Attributable to the Company
after tax
Attributable to
minority
interests after
tax
I. Other
comprehensive
income that cannot be
reclassified to
profit or loss
2,213,942,752.92 -792,402,213.31 -
173,883,072.01 4,252,610.14 -622,592,420.24 -179,331.20 1,591,350,332.68
Including: Remeasurement
of changes in
defined benefit
plan
Other
comprehensive income that
cannot be
transferred to profit or loss
under equity
method
44,423,777.32 2,567,739.72 4,252,610.14 -1,505,539.22 -179,331.20 42,918,238.10
Changes in
fair value of
investments in other equity
instruments
2,169,518,975.60 -794,969,953.03 -
173,883,072.01 -621,086,881.02 1,548,432,094.58
Changes in
fair value of the Company's own
credit risk

2020 Annual Report
185 / 259
II. Other
comprehensive
income to be reclassified to
profit or loss
138,488,814.68 -1,724,371,921.50 -1,416,282,339.65 -
308,089,581.85 -1,277,793,524.97
Including:
Other comprehensive
income that
may be transferred to
profit or loss
under equity method
84,829,424.53 -151,969,944.28 -151,969,944.28 -67,140,519.75
Translation
differences of financial
statements
denominated in foreign
currencies
53,659,390.15 -1,572,401,977.22 -1,264,312,395.37 -
308,089,581.85 -1,210,653,005.22
Total other
comprehensive income
2,352,431,567.60 -2,516,774,134.81 -
173,883,072.01 4,252,610.14 -2,038,874,759.89
-
308,268,913.05 313,556,807.71
Other explanations, including the adjustment to the transfer of the effective portion of gains or losses on cash flow hedging to the initial recognition amount of hedged items:
Nil

2020 Annual Report
186 / 259
58、 Special reserve
Non-applicable
59、 Surplus reserve
Applicable
Unit: RMB Yuan
Item Opening balance Increase in the
current period
Decrease in the
current period
Closing balance
Statutory surplus
reserve 13,856,359,416.39 13,856,359,416.39
Discretionary
surplus reserve 10,462,022,156.76 10,462,022,156.76
Reserve fund
Enterprise
development fund
Others 1,140,860.78 1,140,860.78
Total 24,319,522,433.93 24,319,522,433.93
Explanation on surplus reserve, including explanations on the changes in the current period and reasons of such
changes:
Nil
60、 Retained earnings
Applicable
Unit:RMB Yuan
Item Current period Prior period
Before adjustment: retained earnings of the prior
period 56,473,906,836.25 48,400,469,257.13
Adjustment: Total retained earnings at the beginning
of the reporting period (increase “+”, decrease “-”) 561,377,843.66
After adjustment: retained earnings at the beginning of
the reporting period 56,473,906,836.25 48,961,847,100.79
Add: Net profit attributable to owners of the Company
for the current period 26,297,890,222.70 21,543,493,635.57
Other 4,252,610.14 928,566,099.89
Less: Transfer to statutory surplus reserve
Transfer to discretionary surplus reserve
Transfer to general risk reserve
Declaration of dividends on ordinary shares
(Note) 14,960,000,000.00 14,960,000,000.00
Conversion of ordinary shares' dividends into
share capital
Other 965,324.07
Retained earnings at the end of the reporting period 67,815,084,345.02 56,473,906,836.25
Details of the adjustments to retained earnings at the beginning of the reporting period:
1、The effect of retrospective adjustments made in accordance with the Accounting Standards for Business
Enterprises and relevant new requirements on retained earnings at the beginning of the reporting period is RMB
0.
2、The effect of changes in accounting policies on retained earnings at the beginning of the reporting period is
RMB0.

2020 Annual Report
187 / 259
3、The effect of significant corrections of accounting errors on retained earnings at the beginning of the
reporting period is RMB0.
4、The effect of changes in the scope of consolidation resulting business combination involving enterprises
under common control on retained earnings at the beginning of the reporting period is RMB 0.
5、The total effect of other adjustments on retained earnings at the beginning of the reporting period is RMB
0.
Note: According to the "2019 Profit Distribution Plan" adopted at the general meeting of the
Company on 21 May 2020, the Company distributes cash dividends of RMB 6.80 per 10 shares on the
basis of a total share capital of 22,000,000,000 shares, resulting in a total cash dividends of
RMB14,960,000,000.00.
61、 Operating revenue and costs of sales
(1). Operating revenue and costs of sales
Applicable
Unit: RMB Yuan
Item Amount incurred in the current period Amount incurred in the prior period
Revenue Cost Revenue Cost
Principal
operating
activities 57,225,317,818.15 20,715,042,596.39 49,793,366,227.87 18,691,851,170.90
Others 558,049,221.68 434,411,670.05 80,720,647.08 5,442,953.03
Total 57,783,367,039.83 21,149,454,266.44 49,874,086,874.95 18,697,294,123.93
(2). Revenue arising from the contract
Non-applicable
Explanation of revenue from contracts:
Non-applicable
(3). Details of performance obligation
Non-applicable
(4). Explanation about allocation to the remaining performance obligations
Non-applicable
Others:
Nil
62、 Taxes and surcharges
Applicable
Unit:RMB Yuan
Item Amount incurred in the current
period Amount incurred in the prior
period
City construction and
maintenance tax
402,110,929.38 385,293,181.68
Education surcharges 198,000,927.33 189,554,871.64
Local education surcharge 115,211,267.29 109,646,033.52
House property tax 59,897,056.19 76,976,325.35
Stamp duty 23,463,766.45 22,231,151.61
Water resources tax 327,624,063.65 321,695,182.65

2020 Annual Report
188 / 259
Land use tax 62,901,394.67 62,987,255.80
Tax of Peru Company 3,375,891.74
Other 344,050.93 430,150.00
Total 1,192,929,347.63 1,168,814,152.25
Others:
Nil
63、 Selling expenses
Applicable
Unit:RMB Yuan
Item Amount incurred in the current
period Amount incurred in the prior
period
Payroll and employee benefits
payable 83,810,039.22 17,039,755.28
Travelling expenses 1,650,511.95 2,770,775.26
Sales service fee 5,778,950.65 4,990,991.18
Labor service fees 12,284,977.80
Other fees 11,892,838.80 2,990,614.97
Total 115,417,318.42 27,792,136.69
Others:
Nil
64、 General and administrative expenses
Applicable
Unit:RMB Yuan
Item Amount incurred in the current period Amount incurred in the prior
period
Payroll and employee
benefits payable 464,232,151.32 222,025,479.29
Depreciation of fixed
assets 112,387,077.72 66,017,241.45
Amortisation of
intangible assets and low-
cost consumables
37,449,581.09 21,764,354.27
Hub dedicated
expenditure
57,426,008.45 54,873,914.67
Repair cost 391,053,028.26 265,862,933.30
Traveling expenses 8,895,120.38 14,876,106.49
Property insurance fees 12,479,088.69 8,993,685.74
Property management
fees
46,776,098.96 39,742,436.81
Fees of intermediary
institutions
76,901,911.54 43,753,717.95
Office expense 12,665,312.42 3,837,253.24
Lease expenses 8,496,729.57 5,272,716.20
Other expenses 64,036,543.05 66,609,906.02
Total 1,292,798,651.45 813,629,745.43
Others:
Nil

2020 Annual Report
189 / 259
65、 Research and development expenses
Applicable
Unit: RMB Yuan
Item Amount incurred in the
current period Amount incurred in the
prior period
Payroll and employee benefits payable 25,549,620.90 16,635,301.60
Depreciation expense 1,716,980.61 2,052,699.51
Consultation fees 3,515,685.06 4,503,489.19
Project costs 5,309,530.23 15,342,316.83
Other 3,476,192.71 2,533,112.19
Total 39,568,009.51 41,066,919.32
Others:
Nil
66、 Financial expenses
Applicable
Unit:RMB Yuan
Item Amount incurred in the
current period Amount incurred in the
prior period
Interest expense 5,166,955,172.60 5,200,957,545.39
Less:Interest income -100,213,191.69 -71,556,891.30
Add: exchange losses -151,653,289.18 36,243,084.10
Other expense 70,821,140.35 45,306,987.09
Total 4,985,909,832.08 5,210,950,725.28
Others:
Nil
67、 Other income
Applicable
Unit:RMB Yuan
Item Amount incurred in the
current period Amount incurred in the prior
period
VAT super-credit 1,372,999.01 305,316.22
Refunds of handling fees of
withholding tax 3,539,937.07 1,559,670.43
Shore power projects 365,006.76 395,354.28
Policy supporting fund 605,500.00 337,000.00
Exemption from VAT 3,391.82 9,448.52
Total 5,886,834.66 2,606,789.45
Others:
Nil
68、 Investment income
Applicable
Unit:RMB Yuan
Item Amount incurred in the
current period Amount incurred in the
prior period
Income from long-term equity investments under
equity method 3,182,977,402.41 2,077,234,391.59

2020 Annual Report
190 / 259
Investment income on disposal of long-term equity
investments 219,995,152.31
Investment income from holding financial assets at
FVTPL
Dividend income from holding investments in other
equity instruments 226,231,419.93 283,487,259.19
Interest income from holding debt investments 61,109,567.16 114,463,500.45
Interest income from holding other debt investments
Investment income from disposal of held-for-trading
financial assets
Investment income from disposal of investments in
other equity instruments
Investment income from disposal of debt investments
Investment income from disposal of other debt
investments
Investment income from other non-current
financial assets
233,407,099.89 96,312,190.64
Investment income from disposal of other non-
current financial assets
117,288,383.09 488,772,947.29
Other 11,747,051.78 14,483,332.83
Total 4,052,756,076.57 3,074,753,621.99
Others:
Nil
69、 Net exposure hedging gains
Non-applicable
70、 Gains from changes in fair value
Applicable
Unit: RMB Yuan
Source resulting in gains from
changes in fair values
Amount incurred in the current
period Amount incurred in the prior
period
Other non-current financial assets -279,505,793.86 242,408,192.63
Including: Gains from changes in
fair values arising from derivatives
Held-for-trading financial liabilities 106,618,735.65 -269,355,233.67
Investment properties carried at fair
value
Total -172,887,058.21 -26,947,041.04
Others:
Nil
71、 Credit impairment losses
Applicable
Unit:RMB Yuan
Item Amount incurred in the
current period Amount incurred in the prior
period
Loss on bad debts of notes receivable -1,531,903.86 2,467.92
Bad debt provision of other receivables 39,036.81 3,340,233.74
Impairment on debt investments
Impairment on other debt investments

2020 Annual Report
191 / 259
Bad debt provision of long-term
receivables
Contract asset impairment losses
Total -1,492,867.05 3,342,701.66
Others:
Nil
72、 Assets impairment losses
Applicable
Unit:RMB Yuan
Item Amount incurred in the
current period Amount incurred in the
prior period
I. Bad debt provision
II. Inventory depreciation loss and contract
performance
-17,737,932.85 -35,595,283.18
III. Impairment on long-term equity investments
IV. Impairment on investment properties
V. Impairment on fixed assets
VI. Impairment on materials for construction of
fixed assets
VII. Impairment on construction in progress
VIII. Impairment on productive biological assets
IX. Impairment on oil and gas assets
X.Impairment on intangible assets
XI.Impairment on goodwill
XII. Others
Total -17,737,932.85 -35,595,283.18
Others:
Nil
73、 Gains from disposal of assets
Applicable
Unit:RMB Yuan
Item Amount incurred in the current
period
Amount incurred in the prior
period
Gains from disposal of non-
current assets 22,038,670.15 26,792.08
Including: Gains on disposal of
non-current assets not
classified as held-for-sale
22,038,670.15 26,792.08
Including: Gains from disposal
of fixed assets 22,038,670.15 26,792.08
Total 22,038,670.15 26,792.08
Others:
Nil
74、 Non-operating income
Non-operating income
Applicable
Unit:RMB Yuan

2020 Annual Report
192 / 259
Item Amount incurred in the
current period
Amount incurred in the
prior period
Amount included in
non-recurring profit or
loss in the current period
Total gains on disposal
of non-current assets
Including: Gains on
disposal of fixed assets
Gains on disposal of
intangible assets
Gains on debt
restructuring
Gains on exchange of
non-monetary assets
Donations received
Government grants 198,100.00 28,740,000.00 198,100.00
Other 50,770,175.16 479,094.32 50,770,175.16
Total 50,968,275.16 29,219,094.32 50,968,275.16
Note: During the current year, non-operating income – other represents the amounts of the fair value of
the investee’s identifiable net assets the Company is entitled when the initial investment cost of the
Company in respect of Shenergy Company Limited, an associate of the Company is less than its
investments.
Government grants included in profit or loss
Applicable
Unit:RMB Yuan
Item Amount incurred in the
current period Amount incurred in
the prior period Asset-related/income-
related
2019 central fiscal
subsidy funds for the
separation and transfer of
“utility supply and
property management”
27,790,000.00 Income-related
Subsidies for Step-wise
Cultivation and
Innovation of Industrial
Enterprises in Yibin
950,000.00 Income-related
Incentive for Micro- and
Small-sized Enterprises
to Become Sizable
Enterprises in the Service
Industry
50,000.00 Income-related
2020 Epidemic Subsidy 148,100.00 Income-related
Total 198,100.00 28,740,000.00
Others:
Non-applicable
75、 Non-operating expenses
Applicable
Unit: RMB Yuan

2020 Annual Report
193 / 259
Item Amount incurred in the
current period
Amount incurred in the
prior period
Amount included in
non-recurring profit or
loss in the current period
Total losses on
disposal of non-
current assets 222,224.19 227.80 222,224.19
Including: Losses on
disposal of fixed
assets 222,224.19 227.80 222,224.19
Losses on disposal of
intangible assets
Losses on debt
restructuring
Losses on exchange
of non-monetary
assets
Donations to third
parties 200,675,000.00 50,374,313.04 200,675,000.00
Penalty 5,351.74 323,785.10 5,351.74
Research funds of
acipenser sinensis 2,250,000.00 2,250,000.00
Maintenance
expense of reservoir
area
288,114,849.00 281,985,666.60
Other expense 13,393.68 13,393.68
Total 491,280,818.61 334,933,992.54 200,915,969.61
Others:
Nil
76、 Income tax expense
(1). Income tax expense
Applicable
Unit: RMB Yuan
Item Amount incurred in the current
period
Amount incurred in the prior
period
Current tax expenses 6,038,094,127.20 5,112,745,783.43
Deferred tax expenses -88,815,131.90 -53,181,128.83
Total 5,949,278,995.30 5,059,564,654.60
(2). Reconciliation of income tax expenses to the accounting profit
Applicable
Unit:RMB Yuan
Item Amount incurred in the current period
Total profit 32,455,540,794.12
Income tax expenses calculated at statutory/applicable tax
rate 8,113,885,198.53
Effect of different tax rates applicable to subsidiaries -1,281,000,954.74
Effect of adjustment to income tax of prior periods -4,918,645.31
Effect of non-taxable income -952,647,179.64
Effect of non-deductible costs, expenses and losses 37,801,614.32
Effect of using deductible losses for which deferred tax
assets were previously not recognised
Effect of deductible temporary differences or deductible
losses unrecognized in the current period 10,483.96
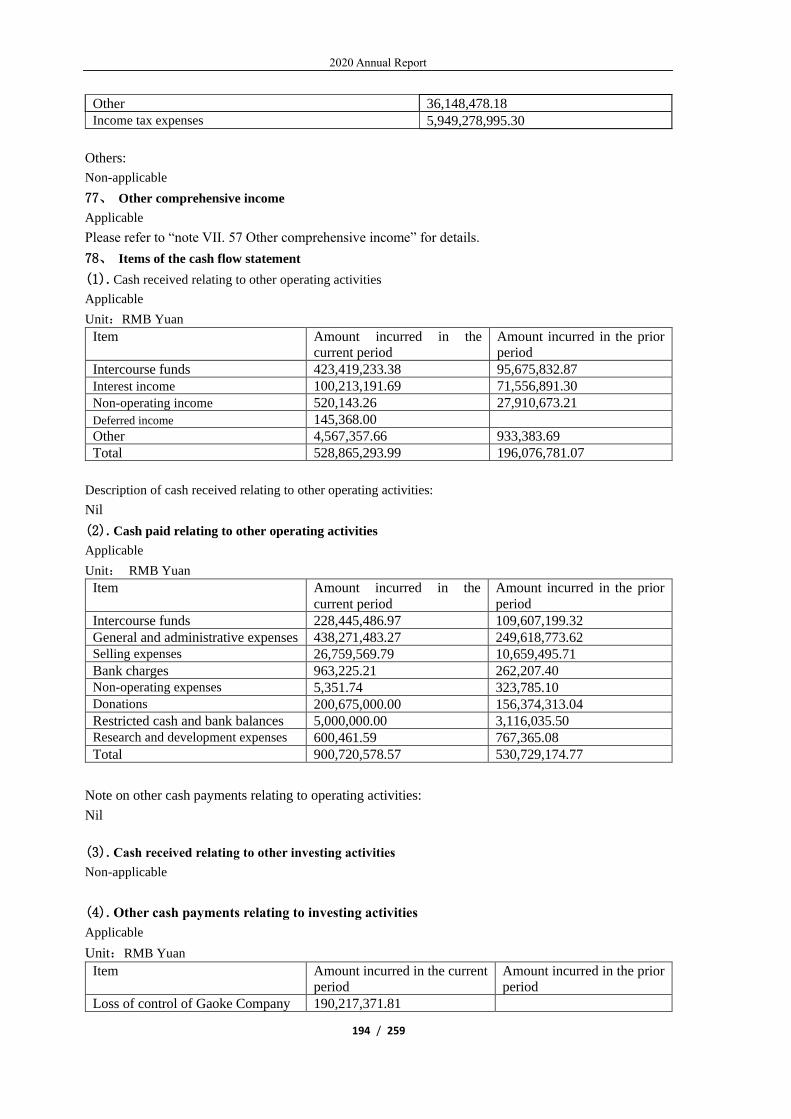
2020 Annual Report
194 / 259
Other 36,148,478.18
Income tax expenses 5,949,278,995.30
Others:
Non-applicable
77、 Other comprehensive income
Applicable
Please refer to “note VII. 57 Other comprehensive income” for details.
78、 Items of the cash flow statement
(1). Cash received relating to other operating activities
Applicable
Unit:RMB Yuan
Item Amount incurred in the
current period
Amount incurred in the prior
period
Intercourse funds 423,419,233.38 95,675,832.87
Interest income 100,213,191.69 71,556,891.30
Non-operating income 520,143.26 27,910,673.21
Deferred income 145,368.00
Other 4,567,357.66 933,383.69
Total 528,865,293.99 196,076,781.07
Description of cash received relating to other operating activities:
Nil
(2). Cash paid relating to other operating activities
Applicable
Unit: RMB Yuan
Item Amount incurred in the
current period
Amount incurred in the prior
period
Intercourse funds 228,445,486.97 109,607,199.32
General and administrative expenses 438,271,483.27 249,618,773.62
Selling expenses 26,759,569.79 10,659,495.71
Bank charges 963,225.21 262,207.40
Non-operating expenses 5,351.74 323,785.10
Donations 200,675,000.00 156,374,313.04
Restricted cash and bank balances 5,000,000.00 3,116,035.50
Research and development expenses 600,461.59 767,365.08
Total 900,720,578.57 530,729,174.77
Note on other cash payments relating to operating activities:
Nil
(3). Cash received relating to other investing activities
Non-applicable
(4). Other cash payments relating to investing activities
Applicable
Unit:RMB Yuan
Item Amount incurred in the current period
Amount incurred in the prior period
Loss of control of Gaoke Company 190,217,371.81

2020 Annual Report
195 / 259
Total 190,217,371.81
Description of cash received relating to other investing activities:
Nil
(5). Cash receipts relating to other financing activities
Applicable
Unit: RMB Yuan
Item Amount incurred in the current
period
Amount incurred in the prior
period
Shareholders’ loans by co-investors
of Yangtze Andes Holding Co.,
Limited 5,974,723,001.24
Total 5,974,723,001.24
Description of cash receipts relating to other financing activities:
Nil
(6). Cash payments relating to other financing activities
Applicable
Unit: RMB Yuan
Item
Amount incurred in the current
period
Amount incurred in the prior
period
Issue costs of short-term commercial
paper and bonds 21,028,944.44
32,320,833.35
Loans guarantee and surcharges 19,522,746.17 6,011,219.18
Payments of purchase and
construction of fixed assets by
instalments 7,672,887,725.27
14,604,539,810.95
Other 11,322,290.06 5,793,272.02
Total 7,724,761,705.94 14,648,665,135.50
Description of cash payments relating to other financing activities:
Nil
79、 Supplementary information to the cash flow statement
(1). Supplementary information to the cash flow statement
Applicable
Unit:RMB Yuan
Supplementary information Current period Prior period
1.Reconciliation of net profit to cash
flow from operating
Net profit 26,506,261,798.82 21,567,447,100.19
Add: Provision for impairment losses of
assets 17,737,932.85 35,595,283.18
Credit impairment loss 1,492,867.05 -3,342,701.66
Depreciation of fixed assets, depletion
of oil and gas assets, depreciation of
productive biological assets 11,603,423,305.42 12,038,664,044.18
Amortization of right-of-use assets
Amortization of intangible assets 33,941,278.87 20,345,046.84
Amortization of long-term prepaid
expenses 536,864.54 536,864.54

2020 Annual Report
196 / 259
Losses on disposal of fixed assets,
intangible assets and other long-term
assets (gains are indicated by "-") -22,038,670.15 -26,792.08
Losses on retirement of fixed assets
(gains are indicated by "-") 222,224.19 227.80
Losses on changes in fair values (gains
are indicated by "-") 172,887,058.21 26,947,041.04
Financial expenses (income is indicated
by "-") 5,085,012,116.94 5,281,953,849.47
Losses arising from investments (gains
are indicated by "-") -4,052,756,076.57 -3,074,753,621.99
Decrease in deferred tax assets (increase
is indicated by "-") -13,901,101.22 -27,850,006.10
Increase in deferred tax liabilities
(decrease is indicated by "-") -74,914,030.68 -25,331,122.73
Decrease in inventories (increase is
indicated by "-") 37,719,301.45 -17,652,717.34
Decrease in receivables from operating
activities (increase is indicated by "-") -190,232,556.87 -300,121,582.59
Increase in payables from operating
activities (decrease is indicated by "-") 1,981,722,119.42 942,008,657.53
Others -50,250,031.87
Net cash flow from operating activities 41,036,864,400.40 36,464,419,570.28
2.Significant investing and financing
activities that do not involve cash
receipts and payments
Conversion of debt into capital
Convertible bonds due within one year
Fixed assets acquired under finance
leases
3. Net changes in cash and cash
equivalents:
Closing balance of cash 9,224,213,791.79 7,317,940,980.02
Less: Opening balance of cash 7,317,940,980.02 5,334,485,176.04
Add: Closing balance of cash
equivalents
Less: Opening balance of cash
equivalents
Net increase in cash and cash
equivalents 1,906,272,811.77 1,983,455,803.98
(2). Net cash paid to acquire subsidiaries in the current period
Applicable
Unit:RMB Yuan
Amount
Cash or cash equivalents paid in the current period for business
combinations occurred in the current period 24,857,381,434.57
Less: Cash and cash equivalents held by subsidiaries at the date of
acquisition 856,838,024.80
Add: Cash or cash equivalents paid in the current period for business
combinations occurred in prior periods
Net cash paid to acquire subsidiaries 24,000,543,409.77
Others:
Nil

2020 Annual Report
197 / 259
(3). Net cash received for disposal of subsidiaries in the current period
Non-applicable
(4). Composition of cash and cash equivalents
Applicable
Unit:RMB Yuan
Item Closing balance Opening balance
I. Cash 9,224,213,791.79 7,317,940,980.02
Including: Cash on hand 6,680,457.72
Bank deposits 9,159,811,937.11 4,989,301,496.47
Other monetary funds 57,721,396.96 2,328,639,483.55
Deposits with the central bank
Deposits with other banks
Placements with banks
II. Cash equivalents
Including: Investments in debt securities
due within three months
III. Closing balance of cash and cash
equivalents 9,224,213,791.79 7,317,940,980.02
Including: Restricted cash and cash
equivalents of the Company and
subsidiaries within the Group
Others:
Non-applicable
80、 Notes to items in the statement of changes in owners' equity
Describe matters such as the names and the adjustment amount of the items included in "others" in respect of
adjustments to the closing balances of the prior reporting period:
Non-applicable
81、 Assets with restricted ownership or right-of-use
Applicable
Unit:RMB Yuan
Item Carrying amount at the end of the
reporting period
Reasons for such restriction
Cash and Cash equivalents 7,000,000.00 Performance bonds
Notes receivable
Inventories
Fixed assets 19,692,745.69 In the process of applying for
the certificates of title
Intangible assets
Investment in other equity
instruments 3,040,287,564.30 Target shares of the
Exchangeable Bond
Total 3,066,980,309.99 /
Others:
Nil
82、 Foreign currency monetary items
(1). Foreign currency monetary items
Applicable
Unit:Yuan
Item Closing balances of
foreign currencies Exchange rates for
translation Closing balance of
RMB

2020 Annual Report
198 / 259
Cash and Cash equivalents - - 3,922,333,109.55
Including: USD 507,018,359.51 6.5249 3,308,244,093.97
EUR 12,830,134.48 8.0250 102,961,829.20
HKD 389,575,943.57 0.8416 327,867,114.11
PKR 218,469,276.31 0.0404 8,826,158.76
PEN 96,896,963.40 1.8002 174,433,913.51
Accounts receivable - - 977,863,578.59
Including: USD 3,125,198.58 6.5249 20,391,608.21
PKR 531,914,975.18 0.0404 21,489,365.00
PEN 519,932,566.03 1.8002 935,982,605.38
Other receivables - - 101,435,540.78
Including: USD 1,587,913.35 6.5249 10,360,975.82
PKR 1,007,122.00 0.0404 40,687.73
PEN 50,568,757.48 1.8002 91,033,877.23
Other current assets - - 96,209,293.54
Including: PKR 18,392,733.89 0.0404 743,066.45
PEN 53,030,900.50 1.8002 95,466,227.09
Debt investment - - 1,139,169,084.08
Including::EUR 141,952,533.84 8.0250 1,139,169,084.08
Short-term borrowings - - 4,857,628,342.50
Including:USD 540,000,000.00 6.5249 3,523,446,000.00
PEN 741,130,064.71 1.8002 1,334,182,342.50
Accounts payable - - 808,369,254.70
Including:USD 9,465,089.01 6.5249 61,758,759.28
PKR 92,472,942.33 0.0404 3,735,906.87
PEN 412,662,253.39 1.8002 742,874,588.55
Interest payable - - 149,506,053.68
Including: USD 14,785,588.39 6.5249 96,474,485.69
PEN 29,458,709.03 1.8002 53,031,567.99 Dividend Payable - - 36,473,316.08
Including: PEN 20,260,702.19 1.8002 36,473,316.08 Other payables - - 190,836,692.20
Including: USD 2,928,589.76 6.5249 19,108,755.32
HKD 108,913.74 0.8416 91,661.80
PKR 147,640,950.99 0.0404 5,964,694.42
PEN 92,029,541.53 1.8002 165,671,580.66
Current portion of non-current
liabilities - - 3,471,172,582.19
Including: USD 277,541,067.96 6.5249 1,810,927,714.33
EUR 182,057,885.41 8.0250 1,461,014,530.42
PEN 110,671,224.00 1.8002 199,230,337.44
Long-term borrowings - - 447,141,791.44
Including: PEN 248,384,508.08 1.8002 447,141,791.44
Bonds payable - - 2,578,680,004.58
Including: PEN 1,432,440,842.45 1.8002 2,578,680,004.58 Long-term Payable - - 5,647,810,583.77
Including:sSD 865,578,105.99 6.5249 5,647,810,583.77
Others:
Nil
(2). Description of foreign operations: for significant foreign operations, major domicile and functional
currency and its basis of selection shall be disclosed, and reasons for foreign operations changing
their functional currencies shall also be disclosed.
Applicable

2020 Annual Report
199 / 259
Company
Principal
place of
business
Recording
currency Selection basis
China Yangtze International
(Hongkong) Co., Limited Hong Kong USD
The business is mainly measured and
settled by such currency
China Three Gorges Power Operation
Int’l Co., Limited Hong Kong USD
The business is mainly measured and
settled by such currency
Grupo de Contratistas Internacionales
S.A.C. Lima, Peru PEN
The business is mainly measured and
settled by such currency
Los Andes Servicios Corporativos
S.A.C.
Lima, Peru PEN The business is mainly measured and
settled by such currency
Tecsur S.A. Lima, Peru PEN The business is mainly measured and
settled by such currency
Luz del Sur S.A.A. Lima, Peru PEN The business is mainly measured and
settled by such currency
Inmobiliaria Luz del Sur S.A. Lima, Peru PEN The business is mainly measured and
settled by such currency
Inland Energy S.A.C. Lima, Peru PEN The business is mainly measured and
settled by such currency
83、 Hedges
Non-applicable
84、 Government grants
(1). Basic information of government grants
Applicable
Unit:RMB Yuan
Category Amount Presenting
items
Amount included in
profit or loss
Policy supporting fund 605,500.00 Other income 605,500.00
Shore power project 365,006.76 Other income 365,006.76
Shore power project 145,368.00 Deferred
income
2020 Epidemic Subsidy 148,100.00 Non-
operating
income 148,100.00
Incentive for Micro- and Small-
sized Enterprises to Become Sizable
Enterprises in the Service Industry
50,000.00 Non-
operating
income 50,000.00
Subsidies for job stabilization
6,159,697.00
Offset of
costs and
expenses
6,159,697.00

2020 Annual Report
200 / 259
(2). Return of government grants
Non-applicable
Others:
Nil
85、 Others
Non-applicable

2020 Annual Report
201 / 259
VIII. Changes of the scope of consolidation
1、 Business combination involving entities not under common control
Applicable
(1). ies not under common control in the current period
Applicable
Unit: RMB’00,000,000 Yuan
Acquiree
Date of equity
acquisition
Consideration
of equity
acquisition
Equity
acquisition
ratio
Method of
equity
acquisition Acquisition date
Basis for
determination of
acquisition date
Income of the
acquiree from the
date of purchase to
the end of the
period
Net profit of
the acquiree
from the
date of
purchase to
the end of
the period
AB
Company 24 April 2020 254.22 100.00
Acquired
by cash 24 April 2020
The company
obtained effective
control of the
acquiree by
completing assets
delivery
2.58
41.30 6.33 POC
Company
Other descriptions:
Note:
On 24 April 2020, the Company acquired 100% of equity interests in Peru Company through cash and has engaged a third-party intermediary institution to issue
a distribution report of the trade consideration on the purchase day, of which, the multi-period excess earnings method was adopted to separately identify the concession
right of the business of generating, transmitting and distributing electricity as an intangible asset. The fair value of the identifiable net assets of Peru Company at the
acquisition date of purchase was approximately RMB24.329 billion, the combination cost was approximately RMB25,422 million and goodwill recognized was
approximately RMB1,093 million.

2020 Annual Report
202 / 259
(2). Cost of business combination and goodwill
Applicable
Unit:RMB Yuan
Consideration of business combination Peru Company
-- Cash and Cash equivalents 25,421,863,445.87
--Fair value of non-cash assets
--Fair value of debt issued or assumed
--Fair value of equity securities issued
--Fair value of contingent consideration
--Fair value of equity held before the acquisition date
on the acquisition date
--Others
Total consideration of business combination 25,421,863,445.87
Less: fair value share of identifiable net assets
obtained 24,329,104,985.38
Goodwill / combination cost less than the fair value
share of identifiable net assets obtained 1,092,758,460.49
The description of determination method of the fair value of the combination cost, the contingent consideration
and its changes
Nil The main reasons for the formation of large amount of goodwill
Nil
Others:
Nil
(3). Identifiable assets and liabilities of the acquiree on the acquisition date
Applicable
Unit:RMB Yuan
Peru Company
Fair value on the acquisition date Carrying value on the acquisition date
ASSETS: 37,296,653,581.66 12,879,755,241.33
LIABILITIES: 8,216,618,075.40 7,196,181,999.98
NET ASSETS 29,080,035,506.26 5,683,573,241.35
Less: non-
controlling
interests
4,750,930,520.88 771,207,000.00
Net assets
acquired 24,329,104,985.38 4,912,366,241.35
Methods for determining the fair value of identifiable assets and liabilities:
Nil
Contingent liabilities of the acquiree in business combination:
Nil
Others:
Nil
(4). Gains or losses arising from the re-measurement of equity held before the acquisition date at fair
value
Any transaction that realizes business combination step by step through multiple transactions and obtains
control right in the reporting period
Non-applicable

2020 Annual Report
203 / 259
(5). Relevant explanations on the acquisition date or at the end of the current period when the
acquisition consideration or the fair value of the identifiable assets and liabilities of the acquiree
cannot be reasonably determined
Non-applicable
(6). Others
Non-applicable
2、 Business combination involving entities under common control
Non-applicable
3、 Reverse acquisition
Non-applicable
4、 Disposal of subsidiaries
Whether there is the situation that loss of control is from a single disposal of subsidiaries
Non-applicable
Others: Non-applicable
5、 Changes in consolidation scope due to other reasons
Explain the changes in the consolidation scope caused by other reasons (such as the establishment of new
subsidiaries, liquidation of subsidiaries, etc.) and relevant situations:
Applicable
Number Company Level Reason of change
1 China Yangtze Power Sales Co., Ltd. 2 newly-added
2 Yangtze Andes Holding Co., Limited 3 newly-added
3 Three Gorges High-tech Information
Technology Co., Ltd
2 loss of control
4 Three Gorges Yangtze Power Big Data
Technology (Yichang) Co., Ltd
3 loss of control
5 Three Gorges Powwe (Henan) Co., Ltd 3 deregistered
6、 Other
Non-applicable

2020 Annual Report
204 / 259
IX. Equity in other entities
1、 Equity in subsidiaries
(1). Composition of the Group
Applicable
Subsidiary Main
place of
business
Place of
registration Business nature
Shareholding ratio Acquisition
method Directly Indirectly
Yangtze Power
Capital Holdings
Limited
Yichang,
Hubei
Yichang,
Hubei Equity investment 100.00 Investment
Beijing
Changjiang
Juyuan
Investment
Management
Co., Ltd
Beijing Beijing Equity investment 85.00 Investment
China Yangtze
International
(Hongkong) Co.,
Limited
Hong
Kong
Hong
Kong Overseas
investment 100.00 Investment
China Three
Gorges Power
Operation Int’l
Co., Limited
Hong
Kong
Hong
Kong
Operation and
management of
overseas power
stations
80.00 Investment
China Yangtze
Power (BVI) 1
Co., Ltd
British
Virgin
Islands
British
Virgin
Islands
Special purpose
vehible 100.00 Investment
China Yangtze
Power (BVI) 2
Co., Ltd
British
Virgin
Islands
British
Virgin
Islands
Special purpose
vehible 100.00 Investment
Three Gorges
Electric Energy
Co., Ltd.
Chengdu,
Sichuan
Chengdu,
Sichuan
Development of
hydropower 100.00
Business
consolidation
Three Gorges
Electric Energy
Co., Ltd.
Wuhan,
Hubei
Wuhan,
Hubei
Electricity
dispatch and sale 70.00 Investment
Three Gorges
Power (Hubei)
Co., Ltd
Yichang,
Hubei
Yichang,
Hubei
Sale of electricity,
investment and
development of
technology
51.00 Investment
China Yangtze
Power Sales Co.,
Ltd.
Shanghai Shanghai
Production and
supply of
electricity and heat
100.00 Investment
Yangtze Andes
Holding Co.,
Limited
Hong
Kong
Hong
Kong
Investment in
energy, electricity
dispatch and sale,
consultancy
service and
operation
management of
power generation
70.03 Investment
Grupo de
Contratistas
Internacionales
S.A.C.
Lima,
Peru
Lima,
Peru
Emergency
maintenance 100.00
Business
consolidation

2020 Annual Report
205 / 259
Los Andes
Servicios
Corporativos
S.A.C.
Lima,
Peru
Lima,
Peru Transportation
services 100.00
Business
consolidation
Tecsur S.A. Lima,
Peru
Lima,
Peru
Development and
consultation of
projects
90.21 Business
consolidation
Inversiones en
Servicios
Electricos S.R.L.
Lima,
Peru
Lima,
Peru Shareholding
platform 100.00
Business
consolidation
Peruvian
Services
Company S.R.L.
Lima,
Peru
Lima,
Peru
Shareholding
platform 100.00 Business
consolidation
Peruvian
Services
Company II
S.R.L.
Lima,
Peru
Lima,
Peru
Shareholding
platform 100.00
Business
consolidation
Blue River Corp
S.A.C.
Lima,
Peru
Lima,
Peru
Electronic
industry 100.00
Business
consolidation
Luz del Sur
S.A.A.
Lima,
Peru
Lima,
Peru
Generation,
transmission and
distribution of
electricity
83.64 Business
consolidation
Inmobiliaria Luz
del Sur S.A.
Lima,
Peru
Lima,
Peru
Investment and
asset management 100.00
Business
consolidation
Inland Energy
S.A.C.
Lima,
Peru
Lima,
Peru Power generation 100.00
Business
consolidation
Andes Power
S.A.C.
Lima,
Peru
Lima,
Peru
Electronic
industry 100.00
Business
consolidation
Energy Business
International
S.R.L.
Lima,
Peru
Lima,
Peru
Shareholding
platform 100.00 Business
consolidation
Ontario-Quinta
S.R.L.
Lima,
Peru
Lima,
Peru
Shareholding
platform 100.00
Business
consolidation
Andes Bermuda
Ltd. Bermuda Bermuda
Shareholding
platform 100.00
Business
consolidation
Peruvian
Opportunity
Company S.A.C.
Lima,
Peru
Lima,
Peru
Shareholding
platform 100.00 Business
consolidation
Explanation of the difference between the shareholding proportion in the subsidiary and the voting right
proportion:
Nil The basis for holding half or less voting rights but still controlling the investee, and holding more than half of
the voting rights but not controlling the investee:
Nil The control basis for the important structured entities included in the consolidation scope:
Nil The basis for determining whether the company is an agent or a principal:
Nil
Others:
Nil
(2). Important non-wholly owned subsidiaries
Non-applicable

2020 Annual Report
206 / 259
(3). Major financial information of significant non-wholly owned subsidiaries
Non-applicable
(4). Major restrictions on the use of Group assets and repayment of Group debts
Non-applicable
(5). Financial support or other support provided to structured entities included in the consolidated
financial statements
Non-applicable
Others: Non-applicable
2、 The owner's equity share of the subsidiary changes and still controls the transactions of the
subsidiary
Non-applicable
3、 Equity in joint ventures or associates
Applicable
(1). Material joint ventures or associates
Applicable
Unit:RMB Yuan
Joint ventures
/associates Main place
of business Place of
registration Business nature
Shareholding ratio Accounting
treatment for joint
ventures
/associates Directly Indirectly
Guangzhou
Development
Group
Incorporation Guangzhou Guangzhou
Investment and
management of
energy industry,
logistics, urban
public utilities,
industry and
commerce
17.98 1.98 Equity
method
Hubei
Energy
Group Co.,
Ltd.
Hubei
Province
Wuhan,
Hubei
Province
Investment,
development and
management of
energy
25.35 3.26 Equity
method
Three Gorges
Capital
Holdings
Co., Ltd.
Beijing Beijing
Industrial
investment, equity
investment, asset
management
10.00 Equity
method
SDIC Power
Holding Co.,
Ltd.
Beijing Beijing Electrical power
production 13.93 1.27
Equity
method
Sichuan
Chuantou
Energy Co.,
Ltd.
Chengdu Chengdu
Investment in clean
energy 14.01
Equity
method
Yunnan
Huadian
Jinsha River
Midstream
Hydropower
Development
Co., Ltd
Kunming Kunming
Investment,
construction and
operation
management of
power stations
23.00 Equity
method

2020 Annual Report
207 / 259
Explanation on the difference between the shareholding proportion in joint ventures or associates and the
proportion of voting right:
Nil The basis for holding less than 20% of the voting rights but having significant influence, or holding 20% or
more of the voting rights but without significant influence:
Description of circumstances where the percentage of shareholding in a joint venture or an associate
differs from the percentage of voting rights:
Basis for circumstances where the Company has significant influence with less than 20% voting rights or
where the Company has no less than 20% voting rights without significant influence
The Company holds 19.96% equity in Guangzhou Development Group Incorporated but has
significant influence on it as the Company assigns one director to its board.
The Company holds 10.00% equity in Three Gorges Capital Holdings Co., Ltd. but has significant
influence on it as the Company assigns one director to its board.
The Company holds 15.19% equity in SDIC Power Holding Co., Ltd. but has significant influence
on it as the Company assigns one director to its board.
The Company holds 14.01% equity in Sichuan Chuantou Energy Co., Ltd. but has significant
influence on it as the Company is its second largest shareholder and has the right to nominate director.
(2). Main financial information of important joint ventures
Non-applicable

2020 Annual Report
208 / 259
(3). Main financial information of significant associates
Applicable
Unit:RMB Yuan
Closing balance/ current period Opening balance/ prior period
Hubei
Energy
Group Co.,
Ltd.
Guangzhou
Development
Group
Incorporated
Yunnan
Jinsha River
HydroPowe
r Co.,Ltd.
Three
Gorges
Capital
Holdings
Co.,Ltd.
Sichuan
Chuantou
Energy
Co., Ltd.
Hubei
Energy
Group Co.,
Ltd.
Guangzhou
Developme
nt Group
Incorporate
d
Three
Gorges
Capital
Holdings
Co., Ltd.
SDIC Power
Holding Co.,
Ltd.
Sichuan
Chuantou
Energy Co.,
Ltd.
Current assets 5,298,991,359.11 9,550,325,283.86 907,138,290.42 9,704,211,803.38 4,543,410,941.59 5,424,357,455.95 9,987,657,576.90 3,537,066,262.61 24,933,681,339.32 5,442,710,103.46
Including: cash
and cash
equivalents 1,013,975,987.67 2,686,133,552.98 310,238,859.66 406,729,928.85 601,386,644.61 1,215,771,418.19 4,358,822,320.77 104,018,962.34 8,447,826,019.91 708,195,762.59
Non-current
assets 54,867,848,441.33 33,850,343,861.74 25,309,166,470.49 56,528,248,477.41 36,785,721,299.58 54,940,620,189.02 32,397,762,533.29 43,971,108,091.06 199,787,831,879.48 32,012,587,167.54
Total assets 60,166,839,800.44 43,400,669,145.60 26,216,304,760.91 66,232,460,280.79 41,329,132,241.17 60,364,977,644.97 42,385,420,110.19 47,508,174,353.67 224,721,513,218.80 37,455,297,271.00
Current
liabilities 10,993,798,083.18 8,386,615,925.96 1,856,842,682.11 15,001,082,627.55 5,394,274,490.09 12,380,797,972.01 8,028,054,526.99 8,334,766,814.94 34,219,864,091.92 5,584,889,099.74
Non-current
liabilities 14,118,800,581.70 13,961,610,468.06 16,216,852,850.36 20,814,757,319.71 6,177,160,892.11 14,387,014,034.86 13,827,731,550.45 9,514,338,219.21 116,107,469,281.60 4,213,777,861.07
Total liabilities 25,112,598,664.88 22,348,226,394.02 18,073,695,532.47 35,815,839,947.26 11,571,435,382.20 26,767,812,006.87 21,855,786,077.44 17,849,105,034.15 150,327,333,373.52 9,798,666,960.81
Non-controlling
interests 6,185,917,516.27 3,093,421,535.02 6,167,234.69 962,061,247.37 6,305,071,387.07 3,386,988,410.31 34,011,667,621.63 527,710,564.05
Equity
attributable to
owners of the
parent
28,868,323,619.29 17,959,021,216.56 8,136,441,993.75 30,416,620,333.53 28,795,635,611.60 27,292,094,251.03 17,142,645,622.44 29,659,069,319.52 40,382,512,223.65 27,128,919,746.14
Share of net
assets calculated
by shareholding
ratio
8,259,227,387.48 3,584,620,634.83 1,871,381,658.56 3,041,662,033.35 4,034,268,549.19 7,808,268,165.22 3,421,672,066.24 2,965,906,931.95 4,324,967,059.15 3,054,716,363.42
Adjustments 119,810,699.06 346,836,451.15 3,128,744,737.97 -49,031,420.78 1,991,669,825.55 134,583,303.40 347,239,457.65 -53,414,565.52 1,881,432,978.74 1,645,379,479.58
--Goodwill 119,909,672.06 346,391,247.01 3,128,744,737.97 1,991,669,825.55 134,682,276.40 346,794,253.51 1,881,432,978.74 1,645,379,479.58

2020 Annual Report
209 / 259
--Unrealized
profit of internal
transaction
--Others -98,973.00 445,204.14 -49,031,420.78 -98,973.00 445,204.14 -53,414,565.52
Carrying value
of equity
investment in
associates
8,379,038,086.54 3,931,457,085.98 5,000,126,396.53 2,992,630,612.57 6,025,938,374.74 7,942,851,468.62 3,768,911,523.89 2,912,492,366.43 6,206,400,037.89 4,700,095,843.00
Fair value of
equity
investment of
associates with
public offer
7,225,167,736.04 3,547,553,242.16 6,199,095,079.05 7,765,193,159.61 3,558,435,307.32 6,671,917,117.26 4,883,224,367.15
Operating
revenue 17,023,439,111.20 31,645,123,124.53 2,952,056,422.41 894,031,237.51 1,031,120,302.57 15,810,756,895.30 29,534,215,007.20 1,498,099,186.10 42,433,460,265.79 838,331,604.28
Financial
expenses 709,556,695.38 563,855,649.61 866,576,160.31 1,272,825,763.04 355,693,399.74 663,386,409.36 656,461,436.93 611,668,588.69 4,779,200,990.74 288,846,266.67
Income tax
expense 794,460,838.02 254,896,934.15 70,106,680.16 384,179,277.01 39,952,478.65 657,235,845.63 199,648,676.41 159,308,626.21 1,586,010,055.27 32,557,429.82
Net profit 2,759,225,614.69 1,092,279,134.76 445,828,114.56 3,095,718,323.91 3,209,998,367.37 1,799,538,493.61 961,455,803.84 2,009,119,204.86 8,731,062,250.95 2,987,713,781.77
Net profit from
discontinuing
operations
Other
comprehensive
income -409,028,063.50 20,445,519.78 -1,128,284,368.14 -192,806.58 292,463,956.81 207,123,789.66 797,745,799.73 -293,581,432.47 1,468,532.48
Total
comprehensive
income 2,350,197,551.19 1,112,724,654.54 445,828,114.56 1,967,433,955.77 3,209,805,560.79 2,092,002,450.42 1,168,579,593.50 2,806,865,004.59 8,437,480,818.48 2,989,182,314.25
Dividends
received from
associates in the
current year
186,215,663.30 27,205,162.90 135,353,223.35 199,351,173.88 203,655,565.41 53,415,773.90 97,823,736.79 163,527,380.33 148,727,645.70
Others
Nil
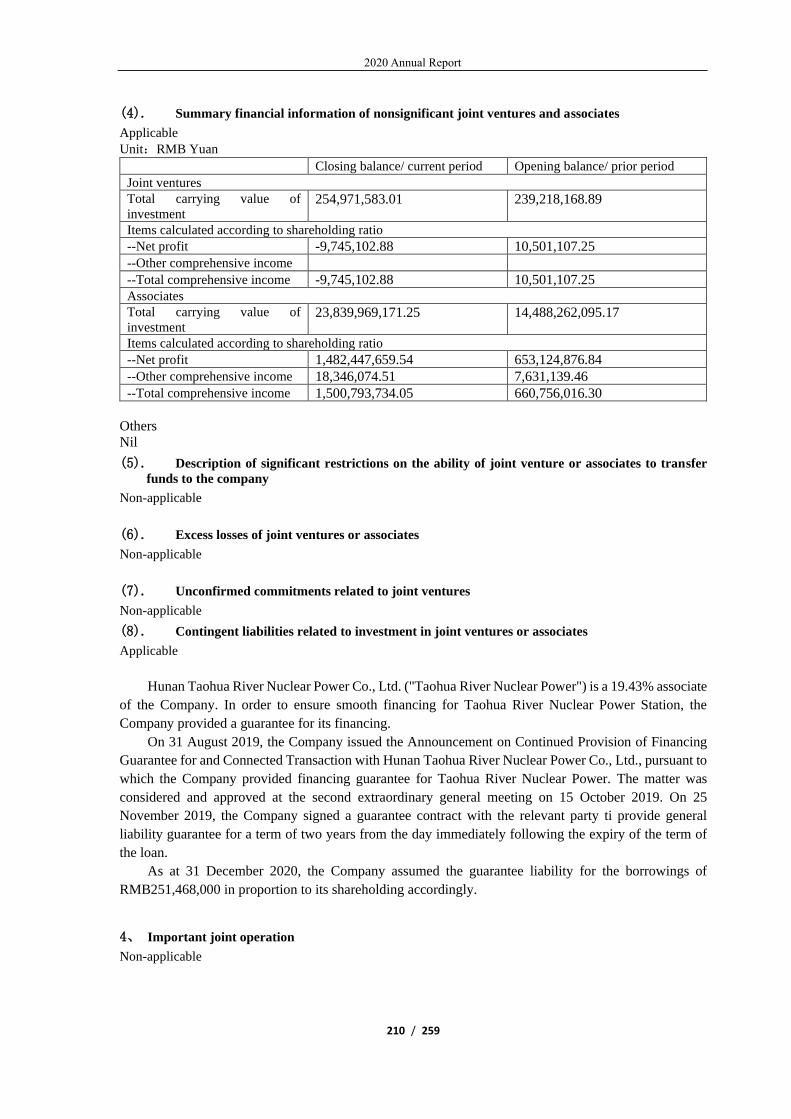
2020 Annual Report
210 / 259
(4). Summary financial information of nonsignificant joint ventures and associates
Applicable
Unit:RMB Yuan
Closing balance/ current period Opening balance/ prior period
Joint ventures
Total carrying value of
investment 254,971,583.01 239,218,168.89
Items calculated according to shareholding ratio
--Net profit -9,745,102.88 10,501,107.25
--Other comprehensive income
--Total comprehensive income -9,745,102.88 10,501,107.25
Associates
Total carrying value of
investment 23,839,969,171.25 14,488,262,095.17
Items calculated according to shareholding ratio
--Net profit 1,482,447,659.54 653,124,876.84
--Other comprehensive income 18,346,074.51 7,631,139.46
--Total comprehensive income 1,500,793,734.05 660,756,016.30
Others
Nil
(5). Description of significant restrictions on the ability of joint venture or associates to transfer
funds to the company
Non-applicable
(6). Excess losses of joint ventures or associates
Non-applicable
(7). Unconfirmed commitments related to joint ventures
Non-applicable
(8). Contingent liabilities related to investment in joint ventures or associates
Applicable
Hunan Taohua River Nuclear Power Co., Ltd. ("Taohua River Nuclear Power") is a 19.43% associate
of the Company. In order to ensure smooth financing for Taohua River Nuclear Power Station, the
Company provided a guarantee for its financing.
On 31 August 2019, the Company issued the Announcement on Continued Provision of Financing
Guarantee for and Connected Transaction with Hunan Taohua River Nuclear Power Co., Ltd., pursuant to
which the Company provided financing guarantee for Taohua River Nuclear Power. The matter was
considered and approved at the second extraordinary general meeting on 15 October 2019. On 25
November 2019, the Company signed a guarantee contract with the relevant party ti provide general
liability guarantee for a term of two years from the day immediately following the expiry of the term of
the loan.
As at 31 December 2020, the Company assumed the guarantee liability for the borrowings of
RMB251,468,000 in proportion to its shareholding accordingly.
4、 Important joint operation
Non-applicable

2020 Annual Report
211 / 259
5、 Equity in structured entities not included in the consolidated financial statements
Related description of structured entities not included in the scope of consolidated financial statements:
Non-applicable
6、 Others
Non-applicable
X. Risks relevant to financial instruments
Applicable
The Company's business activities expose it to various financial risks: credit risk, liquidity risk and
market risk (mainly exchange rate risk and interest rate risk). The Company's overall risk management
plan addresses the unpredictability of financial markets and seeks to reduce the potential adverse impact
on the Company's performance. Risk management objectives and policies are as follows:
1. Credit risk
The Company's credit risk mainly arises from cash and cash equivalents, notes receivable, accounts
receivable, other receivables and other non-current financial assets. Management has established
appropriate credit policies and continuously monitors these credit risk exposures.
The Company's cash and cash equivalents are mainly deposited with financial institutions such as
state-controlled banks and other large and medium-sized commercial banks. Management believes that
these commercial banks have high creditworthiness and tremendous assets and do not have significant
credit risks and that the company will not incur any significant losses due to default of the counter-parties.
For accounts receivable, other receivables and notes receivable, the Company sets relevant policies
to control credit risk exposures. The Company evaluates customers' credibility and sets credit periods
accordingly based on the customers' financial status, the possibility of obtaining guarantees from third
parties, credit history and other factors including current market conditions. The Company regularly
monitors the credit history of its customers and will send written reminders, shorten the credit term or
cancel the credit term for customers with poor credit history to keep the Company's overall credit risk
manageable.
As of 31 December 2020, top five customers accounted for 73.22% of the Company's total balance
of accounts receivable.
The Company's maximum exposure to credit risk is the carrying amount of each financial asset
(including derivative financial instruments) in the balance sheet. Other than the financial guarantees given
by the Company as set forth in Note IX, the Company has not provided any other guarantees that may
expose the Company to credit risk. The maximum exposure of credit risk exposed to the Company is the
carrying amount of each financial asset (including derivative financial instrument) in the balance sheet.
Except the financial guarantees made by the Company as set out in Note 9, the Company has not provided
any other guarantee which may expose the Group to credit risk.
2. Liquidity risk
Liquidity risk refers to the risk that the Company is unable to obtain sufficient funds in a timely
manner to meet its business needs or to pay its debts and other payment obligations as they fall due.

2020 Annual Report
212 / 259
The Company's finance department continuously monitors the Company's short-term and long-term
capital requirements to ensure that adequate cash reserves are maintained. It also continuously monitors
whether commitments to provide sufficient standby facility commitment from major financial institutions
to meet short-term and long-term capital requirements are met in accordance with the terms of borrowing
agreements.
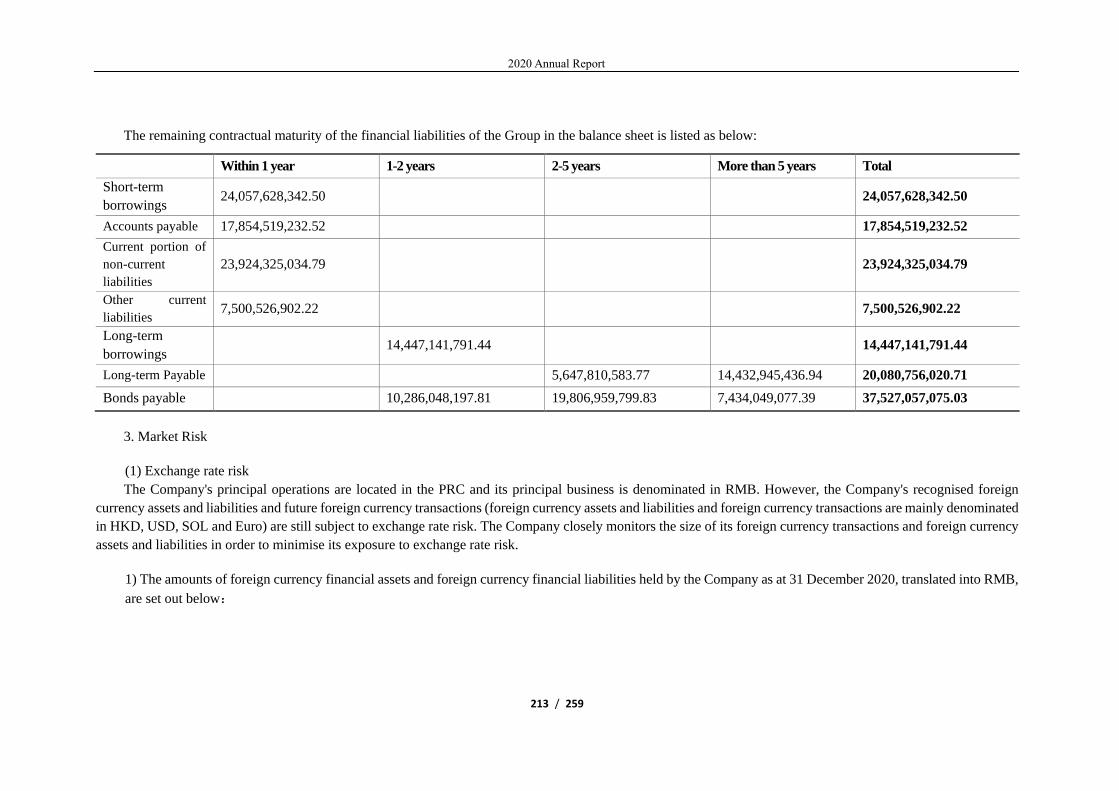
2020 Annual Report
213 / 259
The remaining contractual maturity of the financial liabilities of the Group in the balance sheet is listed as below:
Within 1 year 1-2 years 2-5 years More than 5 years Total
Short-term
borrowings 24,057,628,342.50 24,057,628,342.50
Accounts payable 17,854,519,232.52 17,854,519,232.52
Current portion of
non-current
liabilities
23,924,325,034.79 23,924,325,034.79
Other current
liabilities 7,500,526,902.22 7,500,526,902.22
Long-term
borrowings 14,447,141,791.44 14,447,141,791.44
Long-term Payable 5,647,810,583.77 14,432,945,436.94 20,080,756,020.71
Bonds payable 10,286,048,197.81 19,806,959,799.83 7,434,049,077.39 37,527,057,075.03
3. Market Risk
(1) Exchange rate risk
The Company's principal operations are located in the PRC and its principal business is denominated in RMB. However, the Company's recognised foreign
currency assets and liabilities and future foreign currency transactions (foreign currency assets and liabilities and foreign currency transactions are mainly denominated
in HKD, USD, SOL and Euro) are still subject to exchange rate risk. The Company closely monitors the size of its foreign currency transactions and foreign currency
assets and liabilities in order to minimise its exposure to exchange rate risk.
1) The amounts of foreign currency financial assets and foreign currency financial liabilities held by the Company as at 31 December 2020, translated into RMB,
are set out below:

2020 Annual Report
214 / 259
Item Closing balance
USD HKD EUR PKR PEN Total
Foreign currency
financial assets:
Cash and Cash
equivalents 3,308,244,093.97 327,867,114.11 102,961,829.20 8,826,158.76 174,433,913.51 3,922,333,109.55
Accounts receivable 20,391,608.21 21,489,365.00 935,982,605.38 977,863,578.59
Other receivables 10,360,975.82 40,687.73 91,033,877.23 101,435,540.78
Other current assets 743,066.45 95,466,227.09 96,209,293.54
Other non-current
financial assets 697,646,273.05 697,646,273.05
Investments in other
equity instruments 3,609,195,163.56 3,609,195,163.56
Long-term equity
investments 105,656,142.40 105,656,142.40
Debt investment 1,139,169,084.08 1,139,169,084.08
Subtotal 10,649,508,185.55
Foreign currency
financial liabilities:
Short-term borrowings 3,523,446,000.00 1,334,182,342.50 4,857,628,342.50
Accounts payable 61,758,759.28 3,735,906.87 742,874,588.55 808,369,254.70
Interest Payable 96,474,485.69 53,031,567.99 149,506,053.68
Dividend Payable 36,473,316.08 36,473,316.08

2020 Annual Report
215 / 259
Item Closing balance
USD HKD EUR PKR PEN Total
Financial liabilities held
for trading 398,232,264.23 242,664,765.00 640,897,029.23
Other payables 19,108,755.32 91,661.80 5,964,694.42 165,671,580.66 190,836,692.20
Current portion of non-
current liabilities 1,810,927,714.33 1,461,014,530.42 199,230,337.44 3,471,172,582.19
Long-term borrowings 447,141,791.44 447,141,791.44
Bonds payable 2,578,680,004.58 2,578,680,004.58
Long-term Payable 5,647,810,583.77 5,647,810,583.77
Subtotal 18,828,515,650.37
(continued)
Item Opening balancee
USD HKD EUR PKR Total
Foreign currency
financial assets:
Cash and Cash
equivalents 1,440,652,516.18 2,601,156,725.10 181,328,449.49 4,223,137,690.77
Accounts
receivable 15,567,590.63 15,567,590.63
Other current assets 1,089.05 1,089.05
Other non-current
financial assets 825,438,170.71 825,438,170.71

2020 Annual Report
216 / 259
Item Opening balancee
USD HKD EUR PKR Total
Other equity
instruments
investments
4,432,380,427.04 4,432,380,427.04
Long-term equity
investments 107,221,021.07 107,221,021.07
Debt investment 1,148,277,903.43 1,148,277,903.43
Subtotal 10,752,023,892.70
Foreign currency
financial liabilities:
Financial liabilities
held for trading 463,751,512.28 304,651,628.82 768,403,141.10
Other payables 80,867.57 80,867.57
Bonds payable 1,934,241,932.36 1,421,447,675.76 3,355,689,608.12
Subtotal 4,124,173,616.79
2) Sensitivity analysis:
For the year ended 31 December 2020, for each class of the Company's foreign currency financial assets and foreign currency financial liabilities, if the RMB
appreciates or depreciates by 10% against each foreign currency and other factors remain unchanged, the Company's net profit will decrease or increase by
approximately RMB159,937,200.

2020 Annual Report
217 / 259
(2)Interest rate risk
The Company's interest rate risk arises mainly from long-term interest-bearing debt such as long-
term borrowings and bonds payable. Floating-rate financial liabilities expose the Company to cash flow
interest rate risk, while fixed-rate financial liabilities expose the Company to fair value interest rate risk.
The Company determines the relative proportion of fixed rate and floating rate contracts based on
prevailing market conditions.
The Company's finance department monitors the level of the Company's interest rates on an ongoing
basis. Rising interest rates could increase the cost of new interest-bearing debt and interest expense on the
Company's outstanding floating-rate interest-bearing debt and adversely affect the Company's results, and
management will make timely adjustments to mitigate interest rate risk based on the latest market
conditions.
1)As of December 31, 2020, the Company's long-term interest-bearing debt is mainly long-term
borrowings, bonds payable and long-term payables. Of these, long-term borrowings and long-term
payables are mainly RMB-denominated floating rate contracts, with the total amount of long-term
borrowings and long-term payables floating rate contracts being RMB34,528 million. For details, please
refer to Note VII 45, 46 and 48.
2)Sensitivity analysis:
For the year ended December 31, 2020, if the interest rate on borrowings at floating rates had
increased or decreased by 50 basis points, with all other factors held constant, the Company's net profit
would have decreased or increased by approximately RMB 138,824,700.
The sensitivity analysis above assumes that changes in interest rates have occurred at the balance
sheet date and has been applied to all of the Company's floating-rate borrowings.
(3)Price risk
The Company's price risk is primarily the risk that the fair value of equity financial instruments held
will fluctuate due to changes in market price factors other than market interest rates and foreign exchange
rates. The Company's maximum exposure to market price risk is determined by the fair value of the
financial instruments it holds, as it invests primarily in stocks and funds listed on the stock exchange.
The Company tracks the prices of financial assets daily and submits price analysis reports on a regular
or irregular basis in response to changes in the market environment, and makes timely management
recommendations.
1)As at 31 December 2020, the Company held equity financial instruments measured at fair value
amounted to RMB8,322,861,600, as detailed in Note "XI. Fair value disclosures1".
2)Sensitivity analysis:
As at 31 December 2020, if the fair value of the above investments had increased or decreased by
10% while other factors remained unchanged, the Company's other comprehensive income would have
increased or decreased by RMB281,549,200 and the Company's net profit would have increased or
decreased by RMB371,173,300.

2020 Annual Report
218 / 259
XI. Disclosure of fair value
1、 Fair value of assets and liabilities measured at fair value at the end of the period
Applicable
Unit:RMB Yuan
Item
Fair value at the end of the period
Fair value
measurement at
the level 1
Fair value
measurement
at the level 2
Fair value
measurement
at the level 3 Total
I 、 Continuous fair value
measurement
( I)Financial assets held for
trading 4,407,114,117.16 306,552,346.10 4,713,666,463.26
1. Financial assets at fair value
through profit or loss 4,407,114,117.16 306,552,346.10 4,713,666,463.26
(1)Debt instrument investment
( 2 ) Equity instrument
investment 4,407,114,117.16 306,552,346.10 4,713,666,463.26
(3)Derivative financial assets
2. Financial assets designated at
fair value through profit or loss
(1)Debt instrument investment
( 2 ) Equity instrument
investment
(II)Other debt investment
(III)Investment in other equity
instruments 3,609,195,163.56 3,609,195,163.56
(IV) Investment properties
1. Land use right for lease
2. Buildings for lease
3. Land use right held for sale
after appreciatio
(V)Biological assets
1. Consumptive biological assets
2. Productive biological assets
Total assets continuously
measured at fair value 8,016,309,280.72 306,552,346.10 8,322,861,626.82
(VI)Financial liabilities held
for trading 640,897,029.23 640,897,029.23
1. Financial liabilities at fair
value through profit or loss 640,897,029.23 640,897,029.23
Including: trading bonds issued
Derivative financial
liabilities 640,897,029.23 640,897,029.23
Others
2. Financial liabilities designated
at fair value through profit or loss
Total liabilities continuously
measured at fair value 640,897,029.23 640,897,029.23
II、Non-continuous fair value
measurement
(I)Assets held for sale

2020 Annual Report
219 / 259
Total assets that are not
continuously measured at fair
value
Total liabilities that are not
continuously measured at fair
value
2、 The basis for determining the market price of continuous and non-continuous level 1 fair value
measurement items:
Applicable
The Company's investments in equity instruments that are measured at continuous level 1 fair value
are the A shares and H shares held by the Company, and the market price is determined based on the
closing price on the last trading day of the period
3、 Qualitative and quantitative information on the valuation techniques used and important
parameters for continuous and non-continuous level 2 fair value measurement items
Applicable
The Company uses continuous level 2 fair value measurement for exchangeable options on
exchangeable bonds, and the fair value of exchangeable options is calculated using an option pricing model
(binomial tree model). The risk-free interest rate, the standard deviation of the underlying stock and the
market price of the underlying stock are the main input variables.
4、 Qualitative and quantitative information on the valuation techniques used and important
parameters for continuous and non-continuous level 3 fair value measurement items
Applicable
The Company uses continuous level 3 fair value measurement for investments in unlisted equity
instruments, and the fair value of investments in unlisted equity instruments is determined based on their
net assets.
5、 Continuous level 3 fair value measurement items, adjustment information between the opening and
closing carrying value and sensitivity analysis of unobservable parameters
Non-applicable
6、 Continuous fair value measurement items, if there is a conversion between various levels during the
current period, the reasons for the conversion and the policy for determining the timing of the
conversion
Non-applicable
7、 Changes in valuation technology during the current period and reasons for the changes
Non-applicable
8、 The fair value of financial assets and financial liabilities not measured at fair value
Non-applicable
9、 Others
Non-applicable
XII. Related parties and related party transactions
1、 The company’s parent company
Applicable
Unit:RMB Yuan

2020 Annual Report
220 / 259
Parent
company Place of
registration Business
nature Registered capital
Shareholding
ratio of parent
company to the
company (%)
Proportion of
voting rights of
parent company
to the company
(%)
China Three
Gorges
Corporation
Beijing
Development
and
operation of
large-scale
hydropower
211,500,000,000.00 55.99 55.99
Description of the parent company of the company
(1) Registered capital of the controlling shareholder and its movements
Controlling
shareholder
Opening balance Increase
during the
year
Decrease
during the
year
Closing balance
China Three
Gorges
Corporation
211,500,000,000.00 211,500,000,000.00
(2) Shares or equity held by the controlling shareholders and its changes
Controlling
shareholder
Shareholding amount Shareholding
proportion(%) Closing balance Opening balance Closing
proprtion
Opening
proportio
n
China Three Gorges
Corporation 12,734,105,445.00 12,742,229,292.00 55.99 57.92
The ultimate controller of the enterprise is the State-owned Assets Supervision and Administration
Commission of the State Council
Others:
Nil
2、 Subsidiaries of the company
Please refer to the notes for details of the company's subsidiaries
Applicable
For details of the subsidiaries, please refer to Note "IX.1. Equity in subsidiaries
3、 Joint venture and associates of the enterprise
Please refer to the notes for details of the company's joint venture and associates
Applicable
For details of the Company's significant joint ventures or associates, please refer to Note “IX.3. (1)
Significant joint ventures or associates”.
Other joint ventures or associates that have related party transactions with the company in the current period or
have opening balance due to related party transactions with the company in the previous period are as follows
Applicable
Name of joint ventures/associates Relationship with the company
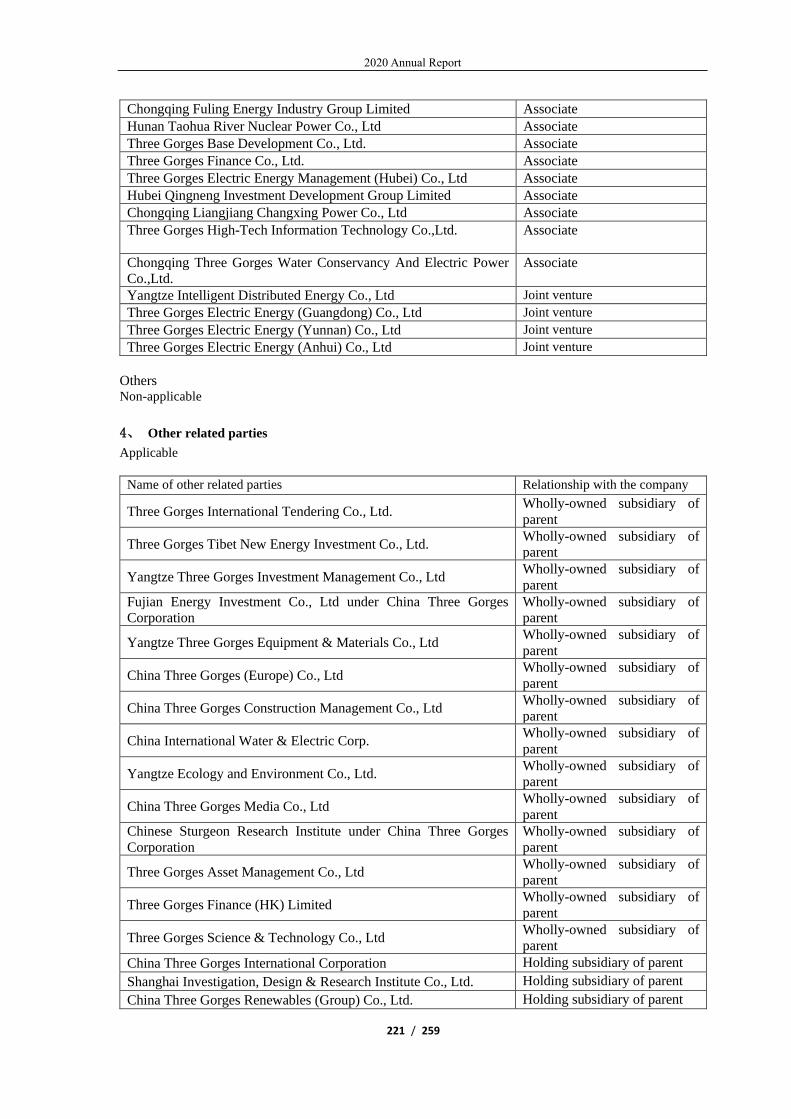
2020 Annual Report
221 / 259
Chongqing Fuling Energy Industry Group Limited Associate
Hunan Taohua River Nuclear Power Co., Ltd Associate
Three Gorges Base Development Co., Ltd. Associate
Three Gorges Finance Co., Ltd. Associate
Three Gorges Electric Energy Management (Hubei) Co., Ltd Associate
Hubei Qingneng Investment Development Group Limited Associate
Chongqing Liangjiang Changxing Power Co., Ltd Associate
Three Gorges High-Tech Information Technology Co.,Ltd. Associate
Chongqing Three Gorges Water Conservancy And Electric Power
Co.,Ltd.
Associate
Yangtze Intelligent Distributed Energy Co., Ltd Joint venture
Three Gorges Electric Energy (Guangdong) Co., Ltd Joint venture
Three Gorges Electric Energy (Yunnan) Co., Ltd Joint venture
Three Gorges Electric Energy (Anhui) Co., Ltd Joint venture
Others Non-applicable
4、 Other related parties
Applicable
Name of other related parties Relationship with the company
Three Gorges International Tendering Co., Ltd. Wholly-owned subsidiary of
parent
Three Gorges Tibet New Energy Investment Co., Ltd. Wholly-owned subsidiary of
parent
Yangtze Three Gorges Investment Management Co., Ltd Wholly-owned subsidiary of
parent
Fujian Energy Investment Co., Ltd under China Three Gorges
Corporation
Wholly-owned subsidiary of
parent
Yangtze Three Gorges Equipment & Materials Co., Ltd Wholly-owned subsidiary of
parent
China Three Gorges (Europe) Co., Ltd Wholly-owned subsidiary of
parent
China Three Gorges Construction Management Co., Ltd Wholly-owned subsidiary of
parent
China International Water & Electric Corp. Wholly-owned subsidiary of
parent
Yangtze Ecology and Environment Co., Ltd. Wholly-owned subsidiary of
parent
China Three Gorges Media Co., Ltd Wholly-owned subsidiary of
parent
Chinese Sturgeon Research Institute under China Three Gorges
Corporation
Wholly-owned subsidiary of
parent
Three Gorges Asset Management Co., Ltd Wholly-owned subsidiary of
parent
Three Gorges Finance (HK) Limited Wholly-owned subsidiary of
parent
Three Gorges Science & Technology Co., Ltd Wholly-owned subsidiary of
parent
China Three Gorges International Corporation Holding subsidiary of parent
Shanghai Investigation, Design & Research Institute Co., Ltd. Holding subsidiary of parent
China Three Gorges Renewables (Group) Co., Ltd. Holding subsidiary of parent

2020 Annual Report
222 / 259
Three Gorges Mechanical & Electrical Engineering Technology Co.,
Ltd
Holding subsidiary of parent
Three Gorges Jinsha Jiangyunchuan Hydroelectric Development
Co., Ltd
Holding subsidiary of parent
Bin County Dageling Wind Power Co., Ltd Brother company ofthe Group
Butuo Junsheng New Energy Co., Ltd Brother company of the Group
Butuo Zhongtian New Energy Development Co., Ltd Brother company of the Group
Chaohu Jiaoyang New Energy Co., Ltd Brother company of the Group
Cixi Yangtze Wind Power Co., Ltd Brother company of the Group
Delingha Xiayang New Energy Power Generation Co., Ltd Brother company of the Group
Fujian Three Gorges Offshore Wind-power Industrial Park
Operation Co., Ltd
Brother company of the Group
Fuqing Haixia Power Generation Co., Ltd Brother company of the Group
Fuzhou Haixia Power Generation Co., Ltd Brother company of the Group
Golmud Yangguang Qiheng New Energy Co., Ltd Brother company of the Group
Guyuan Hengyi New Energy Co, Ltd Brother company of the Group
Huade Wind Power Co., Ltd under China Water Affairs Group
Limited
Brother company of the Group
Hainan Haijin Kstar New Energy Co., Ltd Brother company of the Group
Hainan Jiepu Green Energy Co., Ltd Brother company of the Group
Hainan Yixin New Energy Technology Co., Ltd Brother company of the Group
Hainan Zhuma Optical New Energy Co., Ltd Brother company of the Group
Haixia Power Generation Co., Ltd Brother company of the Group
Qiyueshan Wind Power Co., Ltd under Hubei Energy Group Brother company of the Group
Hubei Qingjiang Hydropower Development Co., Ltd Brother company of the Group
Huili Zhaoguang New Energy Co., Ltd Brother company of the Group
Jinfeng New Energy Gonghe Power Generation Co., Ltd Brother company of the Group
Jiuquan Zhaoyang New Energy Power Generation Co., Ltd Brother company of the Group
Jiuquan Sanyang New Energy Power Generation Co., Ltd Brother company of the Group
Kaiyuan Hongyu Sunshine New Energy Power Generation Co., Ltd Brother company of the Group
Leling Zhongtian New Energy Co., Ltd Brother company of the Group
Linqu Tianrong Wind Power Co., Ltd Brother company of the Group
Lingwu Baitugang Angli Photovoltaic Power Generation Co., Ltd Brother company of the Group
Macheng Zhongguang Shenghui New Energy Co., Ltd Brother company of the Group
Ningde Dagang Hydropower Station Development Co., Ltd Brother company of the Group
Qingdao Runlai Wind Power Co., Ltd Brother company of the Group
Three Gorges New Energy (Zuoyun) Power Generation Co., Ltd Brother company of the Group
Three Gorges New Energy Angli (Lingwu) Power Generation Co.,
Ltd
Brother company of the Group
Three Gorges New Energy Binchuan Power Generation Co., Ltd Brother company of the Group
Three Gorges New Energy Bole Power Generation Co., Ltd Brother company of the Group
Three Gorges New Energy Dachaidan Wind Power Co., Ltd Brother company of the Group
Three Gorges New Energy Delingha Power Generation Co., Ltd Brother company of the Group
Three Gorges New Energy Golmud Qingneng Power Generation
Co., Ltd
Brother company of the Group
Three Gorges New Energy Golmud Power Generation Co., Ltd Brother company of the Group
Three Gorges New Energy Guyuan Power Generation Co., Ltd Brother company of the Group
Three Gorges New Energy Hami Wind Power Co., Ltd Brother company of the Group
Three Gorges New Energy Huaping Power Generation Co., Ltd Brother company of the Group
Three Gorges New Energy Huili Zhongyi Power Generation Co., Ltd Brother company of the Group
Three Gorges New Energy Jinchang Wind Power Co., Ltd Brother company of the Group

2020 Annual Report
223 / 259
Three Gorges New Energy Jiuquan Co., Ltd Brother company of the Group
Three Gorges New Energy Kangbao Power Generation Co., Ltd Brother company of the Group
Three Gorges New Energy Laiyuan Power Generation Co., Ltd Brother company of the Group
Three Gorges New Energy Lichuan Wind Power Co., Ltd Brother company of the Group
Three Gorges New Energy Mengyin Power Generation Co., Ltd Brother company of the Group
Three Gorges New Energy Mianning Power Generation Co., Ltd Brother company of the Group
Three Gorges New Energy Pishan Power Generation Co., Ltd Brother company of the Group
Three Gorges New Energy Pingquan Power Generation Co., Ltd Brother company of the Group
Three Gorges New Energy Pingshan Power Generation Co., Ltd Brother company of the Group
Three Gorges New Energy Pu'an Power Generation Co., Ltd Brother company of the Group
Three Gorges New Energy Puge Power Generation Co., Ltd Brother company of the Group
Three Gorges New Energy Quyang Power Generation Co., Ltd Brother company of the Group
Three Gorges New Energy Shanshan Power Generation Co., Ltd Brother company of the Group
Weixi Longdu Power Generation Co., Ltd Brother company of the Group
Three Gorges New Energy Shidian Power Generation Co., Ltd Brother company of the Group
Three Gorges New Energy Siziwang Wind Power Co., Ltd Brother company of the Group
Three Gorges New Energy Taiyang Mountain Power Generation
Co., Ltd
Brother company of the Group
Three Gorges New Energy Diaobingshan Wind Power Co., Ltd Brother company of the Group
Three Gorges New Energy Tongcheng Power Generation Co., Ltd Brother company of the Group
Three Gorges New Energy Wuzhong Power Generation Co., Ltd Brother company of the Group
Three Gorges New Energy Wujiaqu Power Generation Co., Ltd Brother company of the Group
Three Gorges New Energy Xinjiang Dabancheng Wind Power Co.,
Ltd
Brother company of the Group
Three Gorges New Energy Xintai Power Generation Co., Ltd Brother company of the Group
Three Gorges New Energy Yangjiang Power Generation Co., Ltd Brother company of the Group
Three Gorges New Energy Yiwu Power Generation Co., Ltd Brother company of the Group
Three Gorges New Energy Yiyuan Power Generation Co., Ltd Brother company of the Group
Three Gorges New Energy Yuanmou Power Generation Co., Ltd Brother company of the Group
Three Gorges New Energy Yunnan Shizong Power Generation Co.,
Ltd
Brother company of the Group
Three Gorges New Energy Yunnan Yao'an Power Generation Co.,
Ltd
Brother company of the Group
Three Gorges New Energy Tongxin Power Generation Co., Ltd Brother company of the Group
Three Gorges New Energy Tian'e Power Generation Co., Ltd Brother company of the Group
Three Gorges New Energy Suide Power Generation Co., Ltd Brother company of the Group
Three Gorges New Energy Qingshui Power Generation Co., Ltd Brother company of the Group
Three Gorges New Energy Pingnan Power Generation Co., Ltd Brother company of the Group
Three Gorges New Energy Pingding Power Generation Co., Ltd Brother company of the Group
Three Gorges New Energy Mizhi Power Generation Co., Ltd Brother company of the Group
Three Gorges New Energy Hongsibao Power Generation Co., Ltd Brother company of the Group
Three Gorges New Energy Dunhuang Power Generation Co., Ltd Brother company of the Group
Three Gorges New Energy Dao County Power Generation Co., Ltd Brother company of the Group
Three Gorges New Energy Dalian Power Generation Co., Ltd Brother company of the Group
Three Gorges Shantou Chaoyang New Energy Power Generation
Co., Ltd
Brother company of the Group
Chongqing Wushan Three Gorges Comprehensive Water &
Environment Management Co., Ltd
Brother company of the Group
Chongqing Wushan Chengguang New Energy Co., Ltd Brother company of the Group
Chongqing Liangping Three Gorges Comprehensive Water &
Environment Management Co., Ltd
Brother company of the Group

2020 Annual Report
224 / 259
Chongqing Banan Three Gorges Comprehensive Water Environment
Management Co., Ltd
Brother company of the Group
China Huashui Hydropower Development Co., Ltd Brother company of the Group
Wuhan Three Gorges Clear-water into Rivers Water Services Co.,
Ltd
Brother company of the Group
Wuhan Three Gorges Linkonggang Wastewater Treatment Co., Ltd Brother company of the Group
Wuhu Three Gorges Water Services Co., Ltd Brother company of the Group
Three Gorges First Comprehensive Water Environment
Management Wuwei Co., Ltd
Brother company of the Group
Weinan Xiayang New Energy Power Generation Co., Ltd Brother company of the Group
Tongchuan Xiaguang New Energy Power Generation Co., Ltd Brother company of the Group
Shixing Jinxu New Energy Power Generation Co., Ltd Brother company of the Group
Three Gorges Green Development Co., Ltd Brother company of the Group
Puge Ziyue Optical New Energy Power Generation Co., Ltd Brother company of the Group
Pengze Three Gorges Comprehensive Water & Environment
Management Co., Ltd
Brother company of the Group
Liu'an Three Gorges Phase I Comprehensive Water Environment
Management Co., Ltd
Brother company of the Group
Lixin Three Gorges Comprehensive Water Environment
Management Co., Ltd
Brother company of the Group
Lijiang Longji Clean Energy Co., Ltd Brother company of the Group
Jiujiang Three Gorges Water Services Co., Ltd Brother company of the Group
Huludao Quanfang New Energy Wind Power Co., Ltd Brother company of the Group
Dao County Three Gorges Kaihang Water Services Co., Ltd Brother company of the Group
Shandong Jianeng Solar Energy Technology Co., Ltd Brother company of the Group
Sheqi Guohe Wind Power Co., Ltd Brother company of the Group
Shenmu Yuanhang New Energy Development Co., Ltd Brother company of the Group
Shuangliao Qingda Photovoltaic Power Generation Co., Ltd Brother company of the Group
Weixi Longdu Power Generation Co., Ltd Brother company of the Group
Wulan Jinfeng New-energy Photovoltaic Power Generation Co., Ltd Brother company of the Group
Xiyang Sineng New Energy Co., Ltd Brother company of the Group
Xiangshui Yangtze Wind Power Co., Ltd Brother company of the Group
Suzhou Fuyang Photovoltaic Power Geneartion Co., Ltd Brother company of the Group
Yongdeng Hongyang New Energy Power Generation Co., Ltd Brother company of the Group
Yunnan Longling Lazhai Hydropower Development Co., Ltd Brother company of the Group
Yunnan Mile Shidong Mountain Power Generation Co., Ltd Brother company of the Group
Zhangjiachuan Tianyuan Wind Power Co., Ltd Brother company of the Group
Zhangpu Haixia Power Generation Co., Ltd Brother company of the Group
Yangtze Three Gorges Technology & Economy Development Co.,
Ltd.
Brother company of the Group
Yangtze Three Gorges Industrial Co., Ltd. Brother company of the Group
Yangtze Three Gorges Hydropower Engineering Co., Ltd Brother company of the Group
Zhejiang Changlong Mountain Pumped Storage Co., Ltd Brother company of the Group
Yangtze Three Gorges (Chengdu) Electronic Commerce Co., Ltd. Brother company of the Group
Zhong County Jidian New Energy Co., Ltd Brother company of the Group
Zhucheng Tianrong Wind Power Co., Ltd Brother company of the Group
Jiujiang Three Gorges Comprehensive Water Environment
Management Co., Ltd
Brother company of the Group
Yueyang Three Gorges Comprehensive Water Environment
Management Co., Ltd
Brother company of the Group
Yueyang Junshan Three Gorges Comprehensive Water Environment
Management Co., Ltd
Brother company of the Group

2020 Annual Report
225 / 259
Three Gorges New Energy Offshore Wind Power Operation &
Maintenance Jiangsu Co., Ltd
Brother company of the Group
Chongqing Wulong Daliangzi Wind Power Co., Ltd Brother company of the Group
Yangtze Three Gorges Water Services (Yichang) Co., Ltd Brother company of the Group
Enshi Banqiao Wind Power Co., Ltd Brother company of the Group
Yangtze Three Gorges Tourism Development Co., Ltd Brother company of the Group
Yangtze Three Gorges Ecological Garden Co., Ltd Brother company of the Group
Leshan Damo Hydropower Co., Ltd Brother company of the Group
Shanghai Jikai Engineering Inspection Technology Co., Ltd Brother company of the Group
Wuhu Three Gorges Phase I Water Environment Comprehensive
Treatment Co., Ltd.
Brother company of the Group
Three Gorges New Energy Longling Power Generation Co., Ltd Brother company of the Group
Pakistan Branch of Yangtze Three Gorges Technology & Economy
Development Co., Ltd.
Brother company of the Group
China Three Gorges Sounth Asia Investment Ltd Brother company of the Group
Shanghai Donghua Engineering Consulting Co., Ltd Brother company of the Group
Sui County Aikang Energy Investment Co., Ltd Brother company of the Group
Three Gorges New Energy Panzhou Power Generation Co., Ltd Brother company of the Group
Three Gorges First Wind Farm Pakistan (Pvt) Limited Brother company of the Group
Three Gorges Second Wind Farm Pakistan (Pvt) Limited Brother company of the Group
Three Gorges Third Wind Farm Pakistan (Pvt) Limited Brother company of the Group
Yichang Three Gorges Duoneng Asset Management Co., Ltd Brother company of the Group
China Three Gorges International Co., Ltd Brother company of the Group
Three Gorges Media Corporation Brother company of the Group
Yangtze Ecology and Environment (HK) Investment Limited Brother company of the Group
Three Gorges Yangtze Power Big Data Technology (Yichang) Co.,
Ltd
Brother company of the Group
Hubei Energy Group New Energy Development Co., Ltd Brother company of the Group
Others
Nil
5、 Related party transaction
(1). Related party transactions of purchase and sales of goods, render and accept services
Purchase of goods / accept of services
Applicable
Unit: RMB’ 0000Yuan
Related party Related party
transaction Amount incurred in
the current period
Amount
incurred
in the
prior
period
Controlling shareholder and ultimate
controlling party
China Three Gorges Corporation Entrusted
management 3,273.73 2,313.64
Joint ventures/associates
Three Gorges Base Development Co.,
Ltd.
Property management,
entrusted management 4,316.91 2,486.61
Three Gorges Finance Co., Ltd. Handling fee for letters of guarantee
540.16 614.99
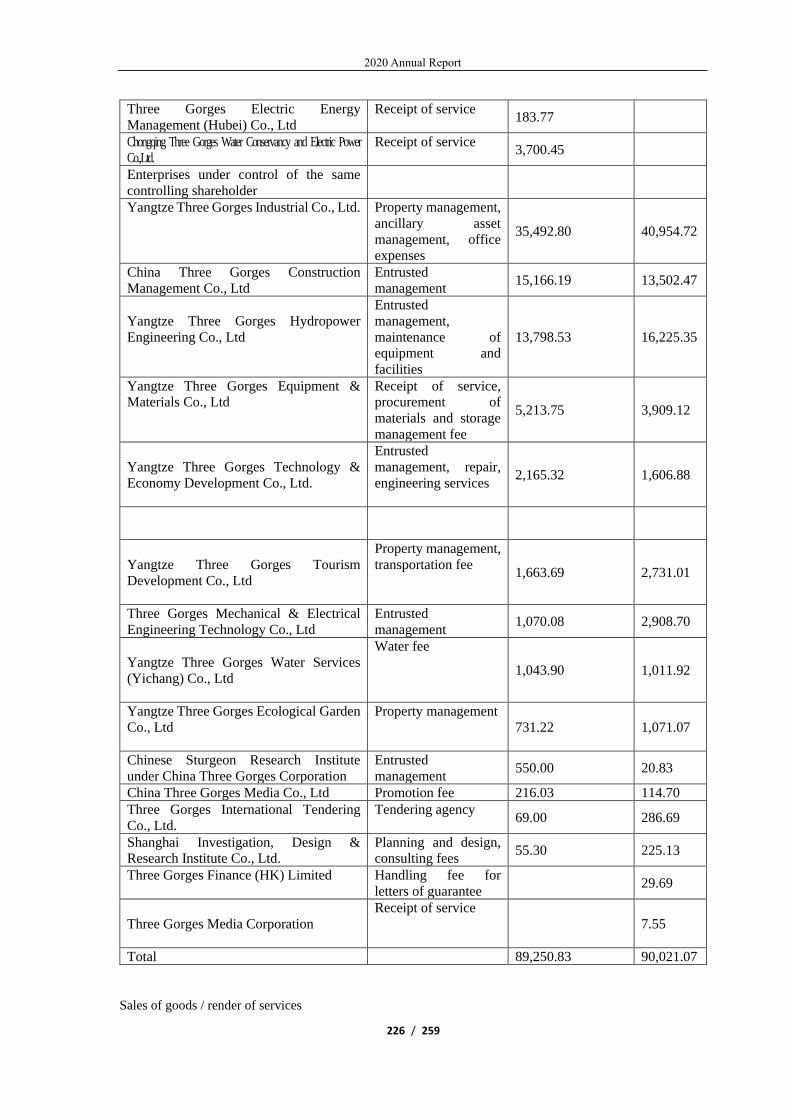
2020 Annual Report
226 / 259
Three Gorges Electric Energy
Management (Hubei) Co., Ltd
Receipt of service 183.77
Chongqing Three Gorges Water Conservancy and Electric Power
Co.,Ltd.
Receipt of service 3,700.45
Enterprises under control of the same
controlling shareholder
Yangtze Three Gorges Industrial Co., Ltd. Property management,
ancillary asset
management, office
expenses
35,492.80 40,954.72
China Three Gorges Construction
Management Co., Ltd
Entrusted
management 15,166.19 13,502.47
Yangtze Three Gorges Hydropower
Engineering Co., Ltd
Entrusted
management,
maintenance of
equipment and
facilities
13,798.53 16,225.35
Yangtze Three Gorges Equipment &
Materials Co., Ltd
Receipt of service,
procurement of
materials and storage
management fee
5,213.75 3,909.12
Yangtze Three Gorges Technology &
Economy Development Co., Ltd.
Entrusted
management, repair,
engineering services 2,165.32 1,606.88
Yangtze Three Gorges Tourism
Development Co., Ltd
Property management,
transportation fee 1,663.69 2,731.01
Three Gorges Mechanical & Electrical
Engineering Technology Co., Ltd
Entrusted
management 1,070.08 2,908.70
Yangtze Three Gorges Water Services
(Yichang) Co., Ltd
Water fee
1,043.90 1,011.92
Yangtze Three Gorges Ecological Garden
Co., Ltd
Property management
731.22 1,071.07
Chinese Sturgeon Research Institute
under China Three Gorges Corporation
Entrusted
management 550.00 20.83
China Three Gorges Media Co., Ltd Promotion fee 216.03 114.70
Three Gorges International Tendering
Co., Ltd.
Tendering agency 69.00 286.69
Shanghai Investigation, Design &
Research Institute Co., Ltd.
Planning and design,
consulting fees 55.30 225.13
Three Gorges Finance (HK) Limited Handling fee for
letters of guarantee 29.69
Three Gorges Media Corporation
Receipt of service
7.55
Total 89,250.83 90,021.07
Sales of goods / render of services

2020 Annual Report
227 / 259
Applicable
Unit: RMB ’0000 Yuan
Related party Related party transaction
Amount
incurred in the
current period
Amount
incurred in
the prior
period
Controlling shareholder and ultimate
controlling party
China Three Gorges Corporation Sales of goods,
technology service
7,403.81 3,641.34
Joint ventures or associates
Hubei Energy Group Co., Ltd. Technology service 25.10 37.66
Three Gorges Finance Co., Ltd. Technology service 24.40 25.17
Three Gorges Base Development Co., Ltd. Electricity bills,
technology service
11.40 13.81
Enterprises under control of the same
controlling shareholder
Three Gorges Jinsha River Yunchuan
Hydropower Development Co., Ltd
Sales of goods,
technology service,
entrusted management
44,772.95 1,937.57
China Three Gorges International Co., Ltd Consultancy service 3,182.58 1,263.35
Three Gorges First Wind Farm Pakistan
(Pvt) Limited
Operations and
maintenance service 1,356.50 446.89
Three Gorges Second Wind Farm Pakistan
(Pvt) Limited
Operations and
maintenance service 1,211.44 500.61
Three Gorges Third Wind Farm Pakistan
(Pvt) Limited
Operations and
maintenance service 1,107.54 603.76
Yangtze Ecology and Environment Co.,
Ltd.
Sales of goods,
technology service 799.71 477.68
Pakistan Branch of Yangtze Three Gorges
Technology & Economy Development Co.,
Ltd.
Consultancy service,
technology service 584.03 85.41
Yangtze Three Gorges Tourism
Development Co., Ltd
Technology service,
electricity bill 294.65 426.69
Yangtze Three Gorges Industrial Co., Ltd. Electricity bills,
technology service 224.64 284.96
Three Gorges International Tendering Co.,
Ltd.
Sales of goods,
technology service 192.05 168.87
Zhejiang Changlong Mountain Pumped
Storage Co., Ltd
Sales of goods,
technology service 154.33 415.66
Three Gorges Science & Technology Co.,
Ltd
Sales of goods 142.54
Yangtze Three Gorges Water Services
(Yichang) Co., Ltd
Sales of electricity,
technology service 107.09 121.35
Yueyang Three Gorges Comprehensive
Water Environment Management Co., Ltd
Technology service,
sales of goods 72.52
Three Gorges Tibet New Energy
Investment Co., Ltd.
Technology service 69.58 59.43
China Three Gorges Renewables (Group)
Co., Ltd.
Technology service 68.01 8.83
Yunnan Mile Shidong Mountain Power
Generation Co., Ltd
Technology service 67.61 14.90
Yangtze Three Gorges Technology &
Economy Development Co., Ltd.
Technology service,
sales of goods 60.54 26.26
Three Gorges Mechanical & Electrical
Engineering Technology Co., Ltd
Technology service,
sales of goods 54.46

2020 Annual Report
228 / 259
Fuzhou Haixia Power Generation Co., Ltd Sales of goods,
technology service 52.04
Three Gorges New Energy Mianning Power
Generation Co., Ltd
Sales of goods,
technology service 51.54 40.17
Three Gorges New Energy Siziwang Wind
Power Co., Ltd
Sales of goods,
technology service 35.32 72.33
Fujian Three Gorges Offshore Wind-power
Industrial Park Operation Co., Ltd
Technology service,
sales of goods 29.94 5.09
China Three Gorges Media Co., Ltd Technology service 28.28 47.28
Shanghai Investigation, Design & Research
Institute Co., Ltd.
Technology service,
sales of goods 26.31 140.49
Yangtze Three Gorges Equipment &
Materials Co., Ltd
Sales of goods,
technology service 22.46 84.73
Wuhu Three Gorges Phase I Water
Environment Comprehensive Treatment
Co., Ltd.
Technology service
21.89 8.70
Jiujiang Three Gorges Comprehensive
Water Environment Management Co., Ltd
Technology service 20.94 19.69
China Huashui Hydropower Development
Co., Ltd
Technology service 20.36
Three Gorges First Comprehensive Water
Environment Management Wuwei Co., Ltd
Technology service,
sales of goods 19.24
Fujian Energy Investment Co., Ltd under
China Three Gorges Corporation
Technology service 15.88 47.32
Haixia Power Generation Co., Ltd Technology service 15.88 15.22
Three Gorges New Energy Yangjiang
Power Generation Co., Ltd
Technology service 15.85 85.33
Puge Ziyue Optical New Energy Power
Generation Co., Ltd
Technology service,
sales of goods 13.07
Chongqing Wushan Chengguang New
Energy Co., Ltd
Technology service,
sales of goods 13.07
Three Gorges Shantou Chaoyang New
Energy Power Generation Co., Ltd
Sales of goods 12.84
Yangtze Three Gorges Hydropower
Engineering Co., Ltd
Electricity bill,
technology service 8.87 19.50
Zhong County Jidian New Energy Co., Ltd Technology service 8.73 8.80
Chongqing Wulong Daliangzi Wind Power
Co., Ltd
Sales of goods 8.73 8.80
Yangtze Three Gorges Ecological Garden
Co., Ltd
Electricity bills,
technology service 7.29 3.16
Three Gorges New Energy Dao County
Power Generation Co., Ltd
Technology service,
sales of goods 7.23
Chaohu Jiaoyang New Energy Co., Ltd Technology service 7.19 4.43
Butuo Zhongtian New Energy
Development Co., Ltd
Technology service 6.60 6.60
Three Gorges New Energy Wujiaqu Power
Generation Co., Ltd
Technology service 6.51 11.27
Three Gorges New Energy Golmud
Qingneng Power Generation Co., Ltd
Technology service 6.51 8.85
Lijiang Longji Clean Energy Co., Ltd Technology service 6.51
Huludao Quanfang New Energy Wind
Power Co., Ltd
Technology service 6.51
Three Gorges New Energy Pingding Power Generation Co., Ltd
Technology service 6.51
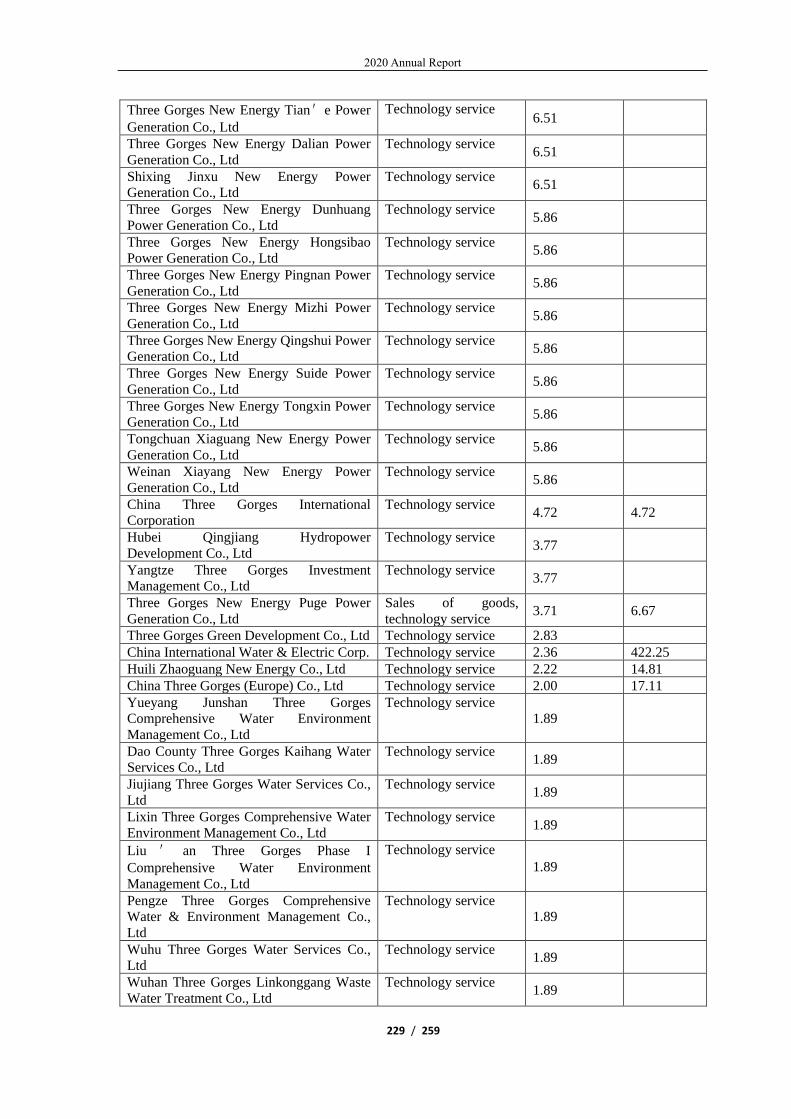
2020 Annual Report
229 / 259
Three Gorges New Energy Tian'e Power
Generation Co., Ltd
Technology service 6.51
Three Gorges New Energy Dalian Power
Generation Co., Ltd
Technology service 6.51
Shixing Jinxu New Energy Power
Generation Co., Ltd
Technology service 6.51
Three Gorges New Energy Dunhuang
Power Generation Co., Ltd
Technology service 5.86
Three Gorges New Energy Hongsibao
Power Generation Co., Ltd
Technology service 5.86
Three Gorges New Energy Pingnan Power
Generation Co., Ltd
Technology service 5.86
Three Gorges New Energy Mizhi Power
Generation Co., Ltd
Technology service 5.86
Three Gorges New Energy Qingshui Power
Generation Co., Ltd
Technology service 5.86
Three Gorges New Energy Suide Power
Generation Co., Ltd
Technology service 5.86
Three Gorges New Energy Tongxin Power
Generation Co., Ltd
Technology service 5.86
Tongchuan Xiaguang New Energy Power
Generation Co., Ltd
Technology service 5.86
Weinan Xiayang New Energy Power
Generation Co., Ltd
Technology service 5.86
China Three Gorges International
Corporation
Technology service 4.72 4.72
Hubei Qingjiang Hydropower
Development Co., Ltd
Technology service 3.77
Yangtze Three Gorges Investment
Management Co., Ltd
Technology service 3.77
Three Gorges New Energy Puge Power
Generation Co., Ltd
Sales of goods,
technology service 3.71 6.67
Three Gorges Green Development Co., Ltd Technology service 2.83
China International Water & Electric Corp. Technology service 2.36 422.25
Huili Zhaoguang New Energy Co., Ltd Technology service 2.22 14.81
China Three Gorges (Europe) Co., Ltd Technology service 2.00 17.11
Yueyang Junshan Three Gorges
Comprehensive Water Environment
Management Co., Ltd
Technology service
1.89
Dao County Three Gorges Kaihang Water
Services Co., Ltd
Technology service 1.89
Jiujiang Three Gorges Water Services Co.,
Ltd
Technology service 1.89
Lixin Three Gorges Comprehensive Water
Environment Management Co., Ltd
Technology service 1.89
Liu ' an Three Gorges Phase I
Comprehensive Water Environment
Management Co., Ltd
Technology service
1.89
Pengze Three Gorges Comprehensive
Water & Environment Management Co.,
Ltd
Technology service
1.89
Wuhu Three Gorges Water Services Co.,
Ltd
Technology service 1.89
Wuhan Three Gorges Linkonggang Waste
Water Treatment Co., Ltd
Technology service 1.89

2020 Annual Report
230 / 259
Wuhan Three Gorges Clear-water into
Rivers Water Services Co., Ltd
Technology service 1.89
Chongqing Liangping Three Gorges
Comprehensive Water & Environment
Management Co., Ltd
Technology service
1.89
Chongqing Banan Three Gorges
Comprehensive Water Environment
Management Co., Ltd
Technology service
1.89
Chongqing Wushan Three Gorges
Comprehensive Water & Environment
Management Co., Ltd
Technology service
1.89
New Energy Development Co., Ltd under
Hubei Energy Group
Technology service 0.75
Fuqing Haixia Power Generation Co., Ltd Technology service 0.66 98.31
Zhangpu Haixia Power Generation Co., Ltd Technology service 0.66
Three Gorges New Energy Huili Zhongyi
Power Generation Co., Ltd
Technology service 0.60 4.43
Chinese Sturgeon Research Institute under
China Three Gorges Corporation
Electricity bills 5.81
China Three Gorges Construction
Management Co., Ltd
Sales of goods,
technology service 69.30
Zhucheng Tianrong Wind Power Co., Ltd Technology service 4.43
Linqu Tianrong Wind Power Co., Ltd Technology service 4.43
Cixi Yangtze Wind Power Co., Ltd Technology service 4.43
Xiangshui Yangtze Wind Power Co., Ltd Technology service 8.86
Ningde Dagang Hydropower Station
Development Co., Ltd
Technology service 4.43
Yunnan Longling Lazhai Hydropower
Development Co., Ltd
Technology service 9.24
Weixi Longdu Power Generation Co., Ltd Technology service 0.97
Weixi Longdu Power Generation Co., Ltd Technology service 4.43
Huade Wind Power Co., Ltd under China
Water Affairs Group Limited
Technology service 3.78
Three Gorges New Energy Diaobingshan
Wind Power Co., Ltd
Technology service 19.19
Three Gorges New Energy Xinjiang
Dabancheng Wind Power Co., Ltd
Technology service 2.77
Three Gorges New Energy Dachaidan Wind
Power Co., Ltd
Technology service 4.43
Three Gorges New Energy Hami Wind
Power Co., Ltd
Technology service 12.52
Three Gorges New Energy Yunnan Yao'an Power Generation Co., Ltd
Technology service 11.17
Three Gorges New Energy Jinchang Wind
Power Co., Ltd
Technology service 17.71
Three Gorges New Energy Yunnan Shizong
Power Generation Co., Ltd
Technology service 6.31
Three Gorges New Energy Wuzhong Power
Generation Co., Ltd
Technology service 4.43
Qingdao Runlai Wind Power Co., Ltd Technology service 4.43
Three Gorges New Energy Shanshan Power
Generation Co., Ltd
Technology service 1.07
Three Gorges New Energy Pishan Power
Generation Co., Ltd
Technology service 2.23

2020 Annual Report
231 / 259
Three Gorges New Energy Angli (Lingwu)
Power Generation Co., Ltd
Technology service 4.43
Wulan Jinfeng New-energy Photovoltaic
Power Generation Co., Ltd
Technology service 4.43
Hainan Yixin New Energy Technology Co.,
Ltd
Technology service 4.43
Hainan Haijin Kstar New Energy Co., Ltd Technology service 4.43
Three Gorges New Energy Quyang Power
Generation Co., Ltd
Technology service 8.86
Three Gorges New Energy Yiwu Power
Generation Co., Ltd
Technology service 2.77
Three Gorges New Energy Tongcheng
Power Generation Co., Ltd
Technology service 4.43
Three Gorges New Energy Yuanmou Power
Generation Co., Ltd
Technology service 1.54
Three Gorges New Energy Binchuan Power
Generation Co., Ltd
Technology service 2.31
Bin County Dageling Wind Power Co., Ltd Technology service 19.19
Jiuquan Sanyang New Energy Power
Generation Co., Ltd
Technology service 2.21
Jiuquan Zhaoyang New Energy Power
Generation Co., Ltd
Technology service 2.21
Three Gorges New Energy Xintai Power
Generation Co., Ltd
Technology service 4.43
Three Gorges New Energy Pingquan Power
Generation Co., Ltd
Technology service 4.43
Sheqi Guohe Wind Power Co., Ltd Technology service 4.43
Three Gorges New Energy Jiuquan Co., Ltd Technology service 4.43
Zhangjiachuan Tianyuan Wind Power Co.,
Ltd
Technology service 4.43
Shandong Jianeng Solar Energy
Technology Co., Ltd
Technology service 4.43
Three Gorges New Energy Mengyin Power
Generation Co., Ltd
Technology service 4.43
Three Gorges New Energy Laiyuan Power
Generation Co., Ltd
Technology service 4.43
Three Gorges New Energy Taiyang
Mountain Power Generation Co., Ltd
Technology service 8.86
Three Gorges New Energy Bole Power
Generation Co., Ltd
Technology service 2.77
Three Gorges New Energy Guyuan Power
Generation Co., Ltd
Technology service 4.43
Hainan Zhuma Optical New Energy Co.,
Ltd
Technology service 4.43
Three Gorges New Energy Yiyuan Power
Generation Co., Ltd
Technology service 4.43
Lingwu Baitugang Angli Photovoltaic
Power Generation Co., Ltd
Technology service 4.43
Three Gorges New Energy Kangbao Power
Generation Co., Ltd
Technology service 4.43
Three Gorges New Energy Shidian Power
Generation Co., Ltd
Technology service 3.70
Three Gorges New Energy Huaping Power
Generation Co., Ltd
Technology service 2.31
Three Gorges New Energy Pingshan Power
Generation Co., Ltd
Technology service 4.43
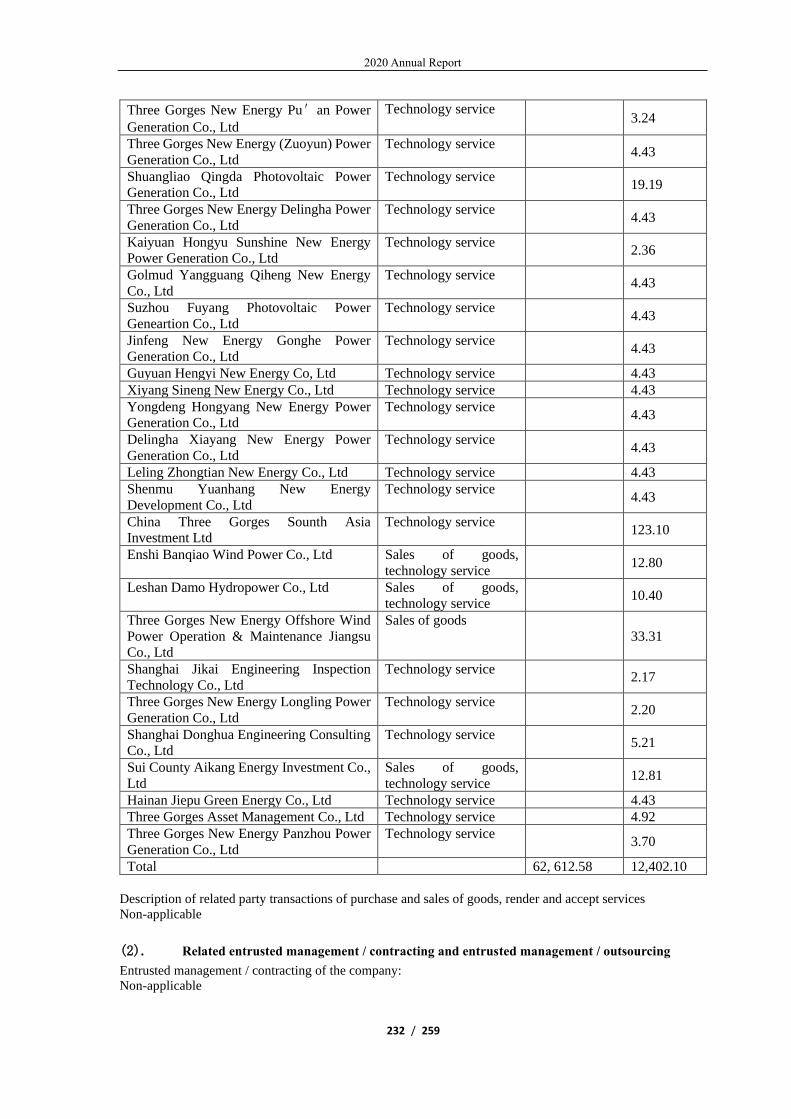
2020 Annual Report
232 / 259
Three Gorges New Energy Pu'an Power
Generation Co., Ltd
Technology service 3.24
Three Gorges New Energy (Zuoyun) Power
Generation Co., Ltd
Technology service 4.43
Shuangliao Qingda Photovoltaic Power
Generation Co., Ltd
Technology service 19.19
Three Gorges New Energy Delingha Power
Generation Co., Ltd
Technology service 4.43
Kaiyuan Hongyu Sunshine New Energy
Power Generation Co., Ltd
Technology service 2.36
Golmud Yangguang Qiheng New Energy
Co., Ltd
Technology service 4.43
Suzhou Fuyang Photovoltaic Power
Geneartion Co., Ltd
Technology service 4.43
Jinfeng New Energy Gonghe Power
Generation Co., Ltd
Technology service 4.43
Guyuan Hengyi New Energy Co, Ltd Technology service 4.43
Xiyang Sineng New Energy Co., Ltd Technology service 4.43
Yongdeng Hongyang New Energy Power
Generation Co., Ltd
Technology service 4.43
Delingha Xiayang New Energy Power
Generation Co., Ltd
Technology service 4.43
Leling Zhongtian New Energy Co., Ltd Technology service 4.43
Shenmu Yuanhang New Energy
Development Co., Ltd
Technology service 4.43
China Three Gorges Sounth Asia
Investment Ltd
Technology service 123.10
Enshi Banqiao Wind Power Co., Ltd Sales of goods,
technology service 12.80
Leshan Damo Hydropower Co., Ltd Sales of goods,
technology service 10.40
Three Gorges New Energy Offshore Wind
Power Operation & Maintenance Jiangsu
Co., Ltd
Sales of goods
33.31
Shanghai Jikai Engineering Inspection
Technology Co., Ltd
Technology service 2.17
Three Gorges New Energy Longling Power
Generation Co., Ltd
Technology service 2.20
Shanghai Donghua Engineering Consulting
Co., Ltd
Technology service 5.21
Sui County Aikang Energy Investment Co.,
Ltd
Sales of goods,
technology service 12.81
Hainan Jiepu Green Energy Co., Ltd Technology service 4.43
Three Gorges Asset Management Co., Ltd Technology service 4.92
Three Gorges New Energy Panzhou Power
Generation Co., Ltd
Technology service 3.70
Total 62, 612.58 12,402.10
Description of related party transactions of purchase and sales of goods, render and accept services
Non-applicable
(2). Related entrusted management / contracting and entrusted management / outsourcing
Entrusted management / contracting of the company:
Non-applicable

2020 Annual Report
233 / 259
Description of related trusteeship / contract
Non-applicable
Entrusted management / outsourcing of the company
Non-applicable
Description of related management / outsourcing
Non-applicable
(3). Related lease
The company as the lessor: Applicable
Unit: RMB ’0000 Yuan
Lessee Types of leased
assets Lease income in the
current period Lease income in the
prior period
China Three Gorges International
Corporation
Building 1,513.10 1,516.90
Yangtze Three Gorges Industrial
Co., Ltd.
Building 463.47 461.17
Yangtze Three Gorges Tourism
Development Co., Ltd
Building 288.04 384.05
Yangtze Three Gorges Industrial
Co., Ltd.
Building 832.80 371.81
The company as the lessee:
Applicable
Unit: RMB ’0000 Yuan
Lessor Types of leased
assets Lease expenses in
the current period Lease expenses in the
prior period
China Three Gorges Corporation Land 7,394.94 7,394.94
Yangtze Three Gorges Industrial Co.,
Ltd.
Building 174.83 114.86
Yichang Three Gorges Duoneng Asset
Management Co., Ltd
Building 26.61 115.51
Yichang Three Gorges Duoneng Asset
Management Co., Ltd
Building 12.48
Description of related lease
Non-applicable
(4). Related party guarantee
The company as the guarantor Applicable
Unit: RMB ’0000 Yuan
Guaranteed company Guarantee
amount Guarantee start
date Guarantee
expiry date Whether the guarantee has
been fulfilled
Hunan Taohua River Nuclear
Power Co., Ltd
25,146.80 November
2019
November
2025
NO
The company as the guarantee
Applicable
Unit: RMB ’0000 Yuan
Guarantor Guarantee
amount Guarantee start
date Guarantee
expiry date Whether the guarantee has
been fulfilled
China Three Gorges
Corporation(Note) 800,000.00
20 September
2002
01 August
2033 NO

2020 Annual Report
234 / 259
Information on related party guarantee Applicable
Note: Pursuant to the Letter of Guarantee issued by CTG on 30 June 2009 and the Guarantee Agreement
by and between CTG and the Company in August 2009, CTG will irrevocably provide joint and several
liability guarantee for the payment of principal and interest payable, penalty, liquidated damages, claim
realization costs and other expenses payable in respect of the RMB16 bn of Three Gorges Bonds. If the
Company fails to pay the principal and interest on the bonds in accordance with the original terms of each
tranche of Three Gorges Bonds, CTG assumes joint and several liability and unconditionally repays all
principal and interest on the bonds and expenses payable by the Company on its behalf. As at 31 December
2020, the Company had repaid RMB8 bn of Three Gorges Bonds due and the balance of the guarantee
was RMB8 billion at the end of the year.
(5). Funds borrowing from related parties
Applicable
Unit:RMB ’0000 Yuan
Related party Amount Starting date Expiry date Description
Borrowing
China Three Gorges Corporation 700,000.00 2017.01.16 2022.01.16
China Three Gorges Corporation 1,443,294.54 2013.05.01 2028.05.01
China Three Gorges Corporation 860,000.00 2017.07.14 2021.07.14
China Three Gorges Corporation 700,000.00 2019.07.17 2022.07.17
China Three Gorges Corporation 620,000.00 2020.03.18 2021.03.18
China Three Gorges Corporation 100,000.00 2020.7.16 2021.7.16
Three Gorges Finance Co., Ltd. 250,000.00 2020.2.26 2021.2.26
Three Gorges Finance Co., Ltd. 600,000.00 2020.7.15 2021.7.15
Three Gorges Finance Co., Ltd. 100,000.00 2020.12.24 2021.7.15
Three Gorges Finance Co., Ltd. 200,000.00 2020.9.14 2021.3.17
Three Gorges Finance Co., Ltd. 50,000.00 2020.9.23 2021.7.15
Three Gorges Finance (HK) Limited 163,122.50 2020.11.13 2021.6.30
(6). Asset transfer and debt restructuring between related parties
Non-applicable
(7). Remuneration of key management personnel
Applicable
Unit:RMB’0,000 Yuan
Item Amount incurred in the current
period
Amount incurred in the
prior period
Remuneration of key management
personnel 959.63 728.77
(8). Other related party transactions
Applicable
(1)Receipt of interests from related parties Unit: RMB ’0000 Yuan

2020 Annual Report
235 / 259
Related party 交易內容 Amount in the
current period
Amount in
the prior
period
Pricing
policy and
decision
process
Three Gorges Finance Co., Ltd. Interest income 5,226.26 3,641.98 Note 1
Three Gorges International
Tendering Co., Ltd. Interest income 0.02 0.02
Three Gorges Finance (HK)
Limited Interest income 1,841.84 949.55 Note 2
Yangtze Ecology and
Environment (HK) Investment
Limited
Fixed annualized
return of shares h
eld on behalf
5,250.86 Agreed price
Note 1: Calculated at bank deposit rate published by the head office of the People's Bank of China
for the same period.
Note 2: Calculated at the demand deposit rates of Bank of China (Hong Kong) Limited for various
currencies.
(2)Payment of interests to related parties Unit: RMB ’0000 Yuan
Name of other related parties Transaction
Amount in
the current
period
Amount in the
prior period
Pricing policy
and decision
process
China Three Gorges
Corporation
Interests on borro
wings 148,448.93 165,834.39 Note 1
China Three Gorges
Corporation
Long-term Payable
Interest 86,351.18 118,606.36 Agreed price
Three Gorges Finance Co., Ltd. Interests on borro
wings 37,925.38 30,933.12 Note 1
Yangtze Three Gorges
Hydropower Engineering Co.,
Ltd
Interests on short-t
erm borrowings 4.54 14.31 Note 1
Three Gorges Finance (HK)
Limited
Interests on borro
wings 1,470.65 674.09 Agreed price
Note: calculated at bank deposit rate published by the head office of the People's Bank of China for
the same period.
(3)Payment of guarantee fee to related parties Unit:RMB ’0000 Yuan

2020 Annual Report
236 / 259
Name of other related parties Transaction Amount in the
current period
Amount in the
prior period
Pricing policy
and decision
process
China Three Gorges
Corporation Guarantee 481.32 600.82 Agreed price
(4)Payment of research fund to related parties Unit:RMB ’0000 Yuan
Type of
transactions Name of other related parties
Amount in the
current period
Amount in the
prior period
Pricing
policy and
decision
process
Research fund
Chinese Sturgeon Research
Institute under China Three
Gorges Corporation 225.00 225.00 Agreed price
(5)Apportionment of public costs of the Three Gorges Project
The public costs and infrastructure operation and maintenance expenses incurred by the Three
Gorges Project during the year were apportioned between CTG and the Company on a 25:75
basisThe Company bore RMB574,897,900.
6、 Receivables and payables of related parties
(1). Receivables
Applicable
Unit:RMB ’0000 Yuan
Item Related party Closing balance Opening balance
Carrying
value Bad
debts Carrying
value Bad debts
Controlling shareholder and ultimate
controlling party
Accounts
receivable
China Three Gorges Corporation 223.24 1,075.24 0.09
Other
receivables
China Three Gorges Corporation 1.62 0.07
Joint ventures or associates
Dividends
receivable
Hubei Qingneng Investment
Development Group Limited 4,547.31 5,004.50
Other
receivables
Yangtze Intelligent Distributed
Energy Co., Ltd 40.70 0.20 0.95 0.09
Other
receivables
Three Gorges Electric Energy
(Guangdong) Co., Ltd 39.46 1.85 29.23 0.03
Other
receivables
Three Gorges Electric Energy
(Anhui) Co., Ltd 28.84 0.03
Other
receivables
Three Gorges Electric Energy
(Yunnan) Co., Ltd 18.32 0.02
Accounts
receivable
Three Gorges Base Development
Co., Ltd.
0.43 0.51
Accounts
receivable
Three Gorges High-tech Information
Technology Co., Ltd 0.02

2020 Annual Report
237 / 259
Other
receivables
Three Gorges Electric Energy
Management (Hubei) Co., Ltd 0.16
Other
receivables
Chongqing Liangjiang Changxing
Power Co., Ltd 16.18 0.02
Enterprises under control of the same
controlling shareholder
Other
receivables
Three Gorges Jinsha River Yunchuan
Hydropower Development Co., Ltd 33,232.33 33.23 2.25 0.23
Accounts
receivable
Three Gorges First Wind Farm
Pakistan (Pvt) Limited 1,584.78 447.31
Other
receivables
Yangtze Three Gorges Industrial Co.,
Ltd. 997.41 1.00 405.27 0.41
Accounts
receivable
Pakistan Branch of Yangtze Three
Gorges Technology & Economy
Development Co., Ltd.
495.69
Accounts
receivable
Three Gorges Second Wind Farm
Pakistan (Pvt) Limited 140.16 502.17
Accounts
receivable
Three Gorges Third Wind Farm
Pakistan (Pvt) Limited 140.16 607.28
Accounts
receivable
Yangtze Three Gorges Industrial Co.,
Ltd. 32.74 38.32
Other
receivables
Yangtze Three Gorges Hydropower
Engineering Co., Ltd 30.00 5.19 38.09 2.96
Accounts
receivable
Yangtze Three Gorges Tourism
Development Co., Ltd 26.49 20.23 0.00
Accounts
receivable
Yangtze Three Gorges Water
Services (Yichang) Co., Ltd 9.40 10.24 0.00
Accounts
receivable
Yangtze Three Gorges Ecological
Garden Co., Ltd 2.60 1.88
Other
receivables
Yichang Three Gorges Duoneng
Asset Management Co., Ltd 2.00 0.35 2.00 0.20
Accounts
receivable
Yangtze Three Gorges Technology &
Economy Development Co., Ltd. 1.33 121.09 0.40
Other
receivables
China Three Gorges Publication and
Media Co., Ltd
1.02 0.47
Accounts
receivable
Yangtze Three Gorges Hydropower
Engineering Co., Ltd
0.73 0.07 0.73 0.00
Accounts
receivable
Yangtze Three Gorges Equipment &
Materials Co., Ltd 4.37 0.00
Accounts
receivable
Three Gorges New Energy Lichuan
Wind Power Co., Ltd 0.20 0.00
Accounts
receivable
Three Gorges New Energy Huili
Zhongyi Power Generation Co., Ltd 2.24 0.00
Accounts
receivable
Three Gorges New Energy Puge
Power Generation Co., Ltd 2.30 0.00
Accounts
receivable
Three Gorges New Energy Mianning
Power Generation Co., Ltd 1.11 0.00
Accounts
receivable
Butuo Zhongtian New Energy
Development Co., Ltd 0.36 0.00
Accounts
receivable
Butuo Junsheng New Energy Co.,
Ltd 0.19 0.00
Accounts
receivable
Shanghai Investigation, Design &
Research Institute Co., Ltd. 120.06 0.01

2020 Annual Report
238 / 259
Accounts
receivable
Fujian Energy Investment Co., Ltd
under China Three Gorges
Corporation
1.08 0.00
Accounts
receivable
Fujian Three Gorges Offshore Wind-
power Industrial Park Operation Co.,
Ltd
9.15 0.01
Accounts
receivable
Qiyueshan Wind Power Co., Ltd
under Hubei Energy Group 0.35 0.00
Accounts
receivable
Macheng Zhongguang Shenghui
New Energy Co., Ltd 0.39 0.00
Accounts
receivable
Fuzhou Haixia Power Generation
Co., Ltd 1.15 0.00
Accounts
receivable
Zhangpu Haixia Power Generation
Co., Ltd 1.00 0.00
Accounts
receivable
Three Gorges Jinsha River Yunchuan
Hydropower Development Co., Ltd 434.22 0.05
Accounts
receivable
Huili Zhaoguang New Energy Co.,
Ltd 2.77 0.00
Accounts
receivable
China Three Gorges Construction
Management Co., Ltd 21.47 0.00
Accounts
receivable
China Three Gorges Renewables
(Group) Co., Ltd. 16.76 0.03
Accounts
receivable
Zhejiang Changlong Mountain
Pumped Storage Co., Ltd 229.77 0.02
Accounts
receivable
Cixi Yangtze Wind Power Co., Ltd 1.88 0.00
Accounts
receivable
China Three Gorges (Europe) Co.,
Ltd 7.00 0.00
Accounts
receivable
Xiangshui Yangtze Wind Power Co.,
Ltd 3.75 0.00
Accounts
receivable
Ningde Dagang Hydropower Station
Development Co., Ltd 1.88 0.00
Accounts
receivable
Yunnan Longling Lazhai
Hydropower Development Co., Ltd 3.92 0.00
Accounts
receivable
Weixi Longdu Power Generation
Co., Ltd 0.41 0.00
Accounts
receivable
Weixi Longdu Power Generation
Co., Ltd 0.47 0.00
Accounts
receivable
Huade Wind Power Co., Ltd under
China Water Affairs Group Limited 1.60 0.00
Accounts
receivable
Three Gorges New Energy
Diaobingshan Wind Power Co., Ltd 8.13 0.00
Accounts
receivable
Three Gorges New Energy Xinjiang
Dabancheng Wind Power Co., Ltd 1.18 0.00
Accounts
receivable
Three Gorges New Energy
Dachaidan Wind Power Co., Ltd 1.88 0.00
Accounts
receivable
Three Gorges New Energy Hami
Wind Power Co., Ltd 5.31 0.05
Accounts
receivable
Three Gorges New Energy Yunnan
Yao'an Power Generation Co., Ltd 4.73 0.00
Accounts
receivable
Three Gorges New Energy Golmud
Power Generation Co., Ltd 3.75 0.00
Accounts
receivable
Three Gorges New Energy Jinchang
Wind Power Co., Ltd 7.51 0.03
Accounts
receivable
Yunnan Mile Shidong Mountain
Power Generation Co., Ltd 6.32 0.00

2020 Annual Report
239 / 259
Accounts
receivable
Three Gorges New Energy Yunnan
Shizong Power Generation Co., Ltd 2.68 0.00
Accounts
receivable
Three Gorges New Energy Wuzhong
Power Generation Co., Ltd 1.88 0.00
Accounts
receivable
Qingdao Runlai Wind Power Co., Ltd 1.88 0.00
Accounts
receivable
Enshi Banqiao Wind Power Co., Ltd 0.72 0.00
Accounts
receivable
Three Gorges New Energy Shanshan
Power Generation Co., Ltd 0.46 0.00
Accounts
receivable
Three Gorges New Energy Pishan
Power Generation Co., Ltd 0.95 0.00
Accounts
receivable
Three Gorges New Energy Angli
(Lingwu) Power Generation Co., Ltd 1.88 0.00
Accounts
receivable
Wulan Jinfeng New-energy
Photovoltaic Power Generation Co.,
Ltd
1.88 0.00
Accounts
receivable
Hainan Yixin New Energy
Technology Co., Ltd 1.88 0.00
Accounts
receivable
Hainan Haijin Kstar New Energy
Co., Ltd 1.88 0.00
Accounts
receivable
Three Gorges New Energy Quyang
Power Generation Co., Ltd 0.94 0.00
Accounts
receivable
Three Gorges New Energy Yiwu
Power Generation Co., Ltd 1.18 0.00
Accounts
receivable
Three Gorges New Energy
Tongcheng Power Generation Co.,
Ltd
1.88 0.00
Accounts
receivable
Three Gorges New Energy Yuanmou
Power Generation Co., Ltd 0.65 0.00
Accounts
receivable
Three Gorges New Energy Binchuan
Power Generation Co., Ltd 0.98 0.00
Accounts
receivable
Three Gorges New Energy Wujiaqu
Power Generation Co., Ltd 4.78 0.00
Accounts
receivable
Bin County Dageling Wind Power
Co., Ltd 8.14 0.00
Accounts
receivable
Jiuquan Sanyang New Energy Power
Generation Co., Ltd 0.94 0.00
Accounts
receivable
Jiuquan Zhaoyang New Energy
Power Generation Co., Ltd 0.94 0.00
Accounts
receivable
Three Gorges New Energy Xintai
Power Generation Co., Ltd 1.88 0.00
Accounts
receivable
Three Gorges New Energy Pingquan
Power Generation Co., Ltd 0.47 0.00
Accounts
receivable
Sheqi Guohe Wind Power Co., Ltd 1.88 0.00
Accounts
receivable
Three Gorges New Energy Jiuquan
Co., Ltd 1.88 0.00
Accounts
receivable
Zhangjiachuan Tianyuan Wind
Power Co., Ltd 1.88 0.00
Accounts
receivable
Shandong Jianeng Solar Energy
Technology Co., Ltd 1.88 0.00
Accounts
receivable
Three Gorges New Energy Mengyin
Power Generation Co., Ltd 1.88 0.00
Accounts
receivable
Three Gorges New Energy Laiyuan
Power Generation Co., Ltd 0.47 0.00

2020 Annual Report
240 / 259
Accounts
receivable
Three Gorges New Energy Taiyang
Mountain Power Generation Co., Ltd 3.75 0.00
Accounts
receivable
Three Gorges New Energy Bole
Power Generation Co., Ltd 1.18 0.00
Accounts
receivable
Three Gorges New Energy Guyuan
Power Generation Co., Ltd 0.47 0.00
Accounts
receivable
Hainan Zhuma Optical New Energy
Co., Ltd 1.88 0.00
Accounts
receivable
Three Gorges New Energy Yiyuan
Power Generation Co., Ltd 1.88 0.00
Accounts
receivable
Lingwu Baitugang Angli
Photovoltaic Power Generation Co.,
Ltd
1.88 0.00
Accounts
receivable
Three Gorges New Energy Kangbao
Power Generation Co., Ltd 0.47 0.00
Accounts
receivable
Three Gorges New Energy Shidian
Power Generation Co., Ltd 1.57 0.00
Accounts
receivable
Three Gorges New Energy Huaping
Power Generation Co., Ltd 0.98 0.00
Accounts
receivable
Leshan Damo Hydropower Co., Ltd 11.48 0.00
Accounts
receivable
China Three Gorges Sounth Asia
Investment Ltd 94.79 0.01
Accounts
receivable
Three Gorges New Energy Pingshan
Power Generation Co., Ltd 0.47 0.00
Accounts
receivable
Three Gorges New Energy Pu'an
Power Generation Co., Ltd 1.37 0.00
Accounts
receivable
Chongqing Wulong Daliangzi Wind
Power Co., Ltd 0.50 0.00
Accounts
receivable
Three Gorges New Energy (Zuoyun)
Power Generation Co., Ltd 0.47 0.00
Accounts
receivable
Shuangliao Qingda Photovoltaic
Power Generation Co., Ltd 8.14 0.00
Accounts
receivable
Three Gorges New Energy Delingha
Power Generation Co., Ltd 1.88 0.00
Accounts
receivable
Kaiyuan Hongyu Sunshine New
Energy Power Generation Co., Ltd 1.00 0.00
Accounts
receivable
Fuqing Haixia Power Generation
Co., Ltd 24.36 0.01
Accounts
receivable
Golmud Yangguang Qiheng New
Energy Co., Ltd 1.88 0.00
Accounts
receivable
Chaohu Jiaoyang New Energy Co.,
Ltd 1.88 0.00
Accounts
receivable
Suzhou Fuyang Photovoltaic Power
Geneartion Co., Ltd 1.88 0.00
Accounts
receivable
Three Gorges New Energy
Yangjiang Power Generation Co.,
Ltd
4.84 0.00
Accounts
receivable
Jinfeng New Energy Gonghe Power
Generation Co., Ltd 1.88 0.00
Accounts
receivable
Guyuan Hengyi New Energy Co, Ltd 0.47 0.00
Accounts
receivable
Xiyang Sineng New Energy Co., Ltd 0.47 0.00
Accounts
receivable
Yongdeng Hongyang New Energy
Power Generation Co., Ltd 1.88 0.00

2020 Annual Report
241 / 259
Accounts
receivable
Delingha Xiayang New Energy
Power Generation Co., Ltd 1.88 0.00
Accounts
receivable
Leling Zhongtian New Energy Co.,
Ltd 1.88 0.00
Accounts
receivable
Hainan Jiepu Green Energy Co., Ltd 1.88 0.00
Accounts
receivable
Shenmu Yuanhang New Energy
Development Co., Ltd 1.88 0.00
Accounts
receivable
Zhong County Jidian New Energy
Co., Ltd 0.40 0.00
Accounts
receivable
Three Gorges New Energy Offshore
Wind Power Operation &
Maintenance Jiangsu Co., Ltd
37.64 0.00
Accounts
receivable
Linqu Tianrong Wind Power Co., Ltd 1.88 0.00
Accounts
receivable
Zhucheng Tianrong Wind Power Co.,
Ltd 1.88 0.00
Accounts
receivable
Three Gorges New Energy Longling
Power Generation Co., Ltd 0.93 0.00
Accounts
receivable
Shanghai Donghua Engineering
Consulting Co., Ltd 5.52 0.00
Accounts
receivable
Shanghai Jikai Engineering
Inspection Technology Co., Ltd 2.30 0.00
Accounts
receivable
Sui County Aikang Energy
Investment Co., Ltd 0.72 0.00
Accounts
receivable
Jiujiang Three Gorges
Comprehensive Water Environment
Management Co., Ltd
22.12 0.00
Accounts
receivable
Yangtze Ecology and Environment
Co., Ltd. 171.28 0.02
Accounts
receivable
Wuhu Three Gorges Phase I Water
Environment Comprehensive
Treatment Co., Ltd.
9.73 0.00
Accounts
receivable
Three Gorges New Energy Panzhou
Power Generation Co., Ltd 1.57 0.00
Accounts
receivable
Three Gorges New Energy Siziwang
Wind Power Co., Ltd 15.29 0.00
Other
receivables
Three Gorges International
Tendering Co., Ltd. 17.00 0.02
Prepayments Three Gorges International
Tendering Co., Ltd. 58.92
Total 41,595.32 41.94 9,811.36 4.68
(2). Payables Items
Applicable
RMB ’0000 Yuan
Item Related party Book balance
at the end of the
reporting
period
Book balance
as at the
beginning of
the reporting
period
Controlling shareholder and ultimate controlling party
Long-term Payable China Three Gorges Corporation 1,443,294.54 2,123,294.54

2020 Annual Report
242 / 259
Long-term
borrowings
China Three Gorges Corporation 1,400,000.00 2,460,000.00
Current portion of
non-current
liabilities
China Three Gorges Corporation
860,000.00
Short-term
borrowings
China Three Gorges Corporation 720,000.00 1,100,000.00
Other payables China Three Gorges Corporation 49,012.84 36,911.58
Interest payable China Three Gorges Corporation 5,964.82 7,708.51
Joint ventures or associates
Short-term
borrowings
Three Gorges Finance Co., Ltd. 1,200,000.00 980,000.00
Interest payable Three Gorges Finance Co., Ltd. 1,415.56 1,115.53
Other payables Three Gorges Finance Co., Ltd. 551.48 600.00
Other payables Three Gorges Base Development Co., Ltd. 41.03 1,556.70
Other payables Chongqing Fuling Energy Industry Group
Limited 4.45 4.46
Other payables
Three Gorges Electric Energy Management
(Hubei) Co., Ltd 3.14
Other payables Three Gorges High-tech Information
Technology Co., Ltd 74.77
Accounts payable Three Gorges High-tech Information
Technology Co., Ltd 67.78
Enterprises under control of the same
controlling shareholder
Short-term
borrowings
Three Gorges Finance (HK) Limited 163,122.50
Other payables Yangtze Three Gorges Hydropower
Engineering Co., Ltd 2,474.41 6,758.59
Other payables China Three Gorges Construction
Management Co., Ltd 2,000.00
Other payables Three Gorges Mechanical & Electrical
Engineering Technology Co., Ltd 1,280.00 1,496.71
Other payables Yangtze Three Gorges Technology &
Economy Development Co., Ltd. 811.95 523.25
Other payables Yangtze Three Gorges Industrial Co., Ltd. 436.87 25,260.84
Interest payable Three Gorges Finance (HK) Limited 367.84
Other payables China Three Gorges International
Corporation 200.00 200.00
Other payables Yangtze Three Gorges Ecological Garden
Co., Ltd 104.31 88.76
Accounts payable Yangtze Three Gorges Equipment &
Materials Co., Ltd 73.69
Other payables Shanghai Investigation, Design & Research
Institute Co., Ltd. 35.48 42.51
Accounts payable Yangtze Three Gorges (Chengdu) E-
commerce Co., Ltd 31.49
Other payables Yangtze Three Gorges Tourism
Development Co., Ltd 20.00 20.00
Other payables Yangtze Three Gorges Equipment &
Materials Co., Ltd 17.90 1,538.07
Other payables China Three Gorges Media Co., Ltd 16.70 16.70
Other payables Three Gorges Yangtze Power Big Data
Technology (Yichang) Co., Ltd 5.00
Accounts payable Three Gorges Third Wind Farm Pakistan
(Pvt) Limited 3.06

2020 Annual Report
243 / 259
Accounts payable Three Gorges First Wind Farm Pakistan
(Pvt) Limited 2.75
Accounts payable Three Gorges Second Wind Farm Pakistan
(Pvt) Limited 2.58
Accounts payable Yangtze Three Gorges Industrial Co., Ltd. 1,301.82
Accounts payable Yangtze Three Gorges Technology &
Economy Development Co., Ltd. 12.80
Accounts payable Yangtze Three Gorges Hydropower
Engineering Co., Ltd 297.74
Prepayments China Three Gorges International
Corporation 878.84
Short-term
borrowings
Yangtze Three Gorges Hydropower
Engineering Co., Ltd 800.00
Interest payable Yangtze Three Gorges Hydropower
Engineering Co., Ltd 1.06
Total 5,851,436.94 6,750,429.01
7、 Commitment of related parties
Non-applicable
8、 Others
Applicable
Bank balances Unit: RMB ’0000 Yuan
Related party Item Closing balance Opening balance
Three Gorges Finance Co., Ltd. Deposit 489,108.20 268,201.35
Total 489,108.20 268,201.35
XIII. Share based payment
1、 General situation of share-based payment
Non-applicable
2、 Equity settled share-based payment
Non-applicable
3、 Cash settled share-based payment
Non-applicable
4、 Modification and termination of share-based payment
Non-applicable
5、 Others
Non-applicable
XIV. Commitments and contingencies
1、 Significant commitments
Applicable
Significant commitments, nature and amount on the balance sheet date
Significant commitments to external parties existing at the balance sheet date and their nature and amounts

2020 Annual Report
244 / 259
1. As at 31 December 2020, the Company had commitments for capital expenditure and expense such
as asset purchases that had been signed but not yet required to be recognized in the financial statements in
amount of RMB31.8491 million.
2. In December 2007, the Company entered into a lease agreement with CTC for the land use rights
in the Gezhouba area for a term of 20 years commencing from 1 January 2007, with the rental subject to
re-negotiation between the parties every three years.
3. In September 2009, the Company entered into a lease agreement with CTG for the land use rights
in the Three Gorges area for a term of 20 years commencing from 28 September 2009, with the rental
subject to re-negotiation between the parties every three years. The most recent adjustment to the rental
was in 2014.
4. Relevant covenants and undertakings of CTG and the Company in the CYPC Report on Significant
Asset Purchase and Connected Transaction:
(1) Relevant costs or expenses that are explicitly required by national regulations or policies to be
included in the power generation costs of the Three Gorges Power Station will be borne by the Company.
(2) CTG and the Company have agreed that when relevant transaction conditions are satisfied, CTG
will sell to the Company and the Company undertakes to purchase CTG’s equity in Yangtze Three Gorges
Technology & Economy Development Co., Ltd.
Apart from the above commitments, as at 31 December 2020, the Company had no other significant
commitments that should be disclosed but were not disclosed.
2、 Contingencies
(1). Material contingency existing at the balance sheet date
√适用 □不适用
For details of contingent liabilities relating to investments in joint ventures or associates, please refer
to Note "IX.3.(8) Contingent liabilities relating to investments in joint ventures or associates".
As at 31 December 2020, the Company had no guarantees for debts of unrelated parties.
Apart from the above-mentioned contingencies, the Company had no other significant contingencies
that should be disclosed but were not disclosed as at 31 December 2020.
(2). Explanation should be provided if the Company has no significant contingencies that are
required to be disclosed.
Non-applicable
3、 Others
Non-applicable
XV. Post balance sheet date events
1、 Important non-adjusting events
Non-applicable
2、 Profit distribution
Applicable Unit: RMB Yuan
Proposed profit distribution or dividend 15,919,301,461.00

2020 Annual Report
245 / 259
Declared profit distribution or dividend
According to the 2020 Profit Distribution Plan considered and approved in the twenty-third meeting
of the fifth session of the Board, the Company proposes cash dividends totaling RMB 15,919,301,461.00
(tax inclusive), subject to approval of the general meeting.
3、 Sales return
Non-applicable
4、 Notes to other subsequent events after the balance sheet date
Applicable
Issuance of bonds
On 6 January 2021, the Company issued RMB2.5 bn of 365-day 2.89% SCP (Tranche I).
On 11 March 2021, the Company issued RMB2.0 bn of 365-day 3.08% SCP (Tranche II).
On 7 April 2021, the Company issued RMB 2.5 bn of 3-year 3.53% SCP (Tranche I)
XVI. Other significant matters
1、 Correction of prior accounting errors
(1). Retrospective adjustment
Non-applicable
(2). Prospective adopt
Non-applicable
2、 Debt restructuring
Non-applicable
3、 Exchange of assets
(1). Exchange of non-monetary assets
Applicable
In May 2020, Chongqing Three Gorges Water Conservancy and Electric Power Co., Ltd. acquired
the Company's 36% equity in Chongqing Liangjiang Changxing Power Co., Ltd. and 8.06% equity in
Chongqing Yangtze Power United Energy Co., Ltd. by way of issuance of shares and payment of cash.
The transaction is a non-monetary asset exchange with commercial substance as the future cash flows
from the incoming assets are expected to be significantly different in risk, timing and amount from those
from the outgoing assets.
(2). Exchange of other assets
Non-applicable
4、 Pension plan
Applicable
The Company implements an enterprise annuity plan in accordance with the relevant state regulations
after CTG filed the same with the Labour and Social Security Bureau. The Company accounts for its
contribution to the annuity plan as employee remuneration and charge it to profit or loss for the current
period, and transfer the annuity payments to employees’ accounts with the account manager. As at 31
December 2020, there were no significant changes to the annuity plan.
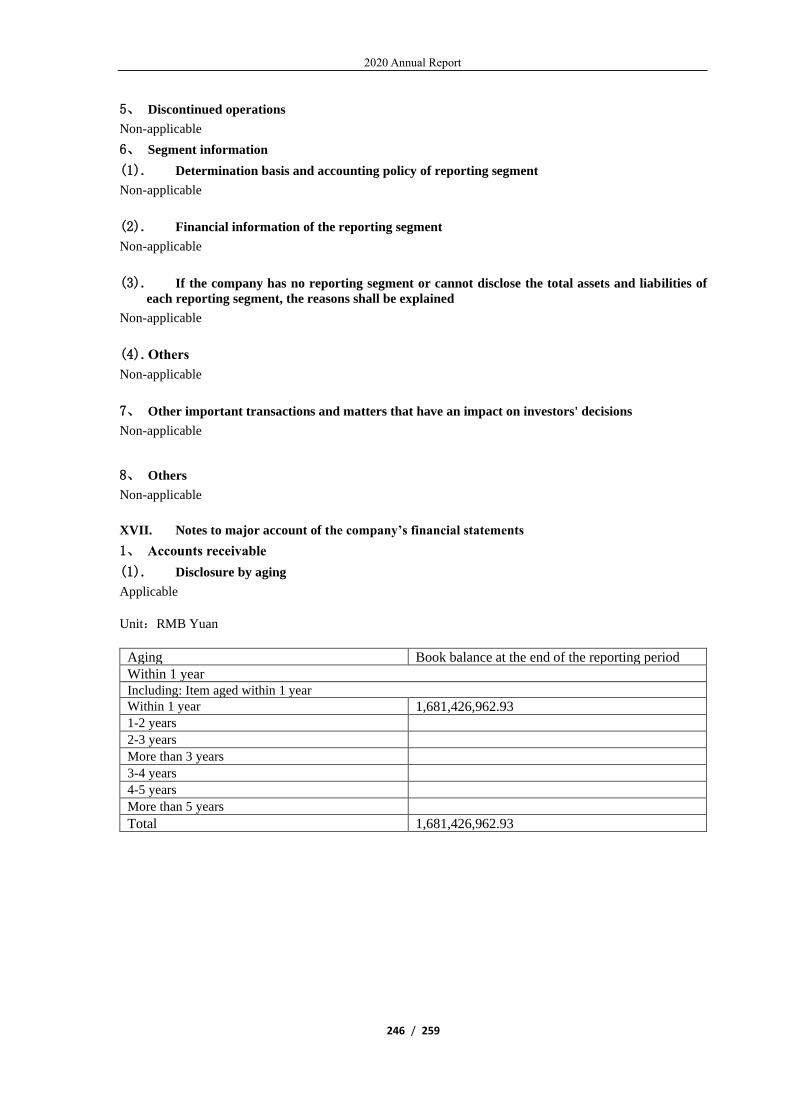
2020 Annual Report
246 / 259
5、 Discontinued operations
Non-applicable
6、 Segment information
(1). Determination basis and accounting policy of reporting segment
Non-applicable
(2). Financial information of the reporting segment
Non-applicable
(3). If the company has no reporting segment or cannot disclose the total assets and liabilities of
each reporting segment, the reasons shall be explained
Non-applicable
(4). Others
Non-applicable
7、 Other important transactions and matters that have an impact on investors' decisions
Non-applicable
8、 Others
Non-applicable
XVII. Notes to major account of the company’s financial statements
1、 Accounts receivable
(1). Disclosure by aging
Applicable
Unit:RMB Yuan
Aging Book balance at the end of the reporting period
Within 1 year
Including: Item aged within 1 year
Within 1 year 1,681,426,962.93
1-2 years
2-3 years
More than 3 years
3-4 years
4-5 years
More than 5 years
Total 1,681,426,962.93

2020 Annual Report
247 / 259
(2). Disclosed by bad debt provision methods
Applicable
Unit:RMB Yuan
Category
Closing balance Opening balance
Book balance Bad debt provision Carrying amount
Book balance Bad debt provision Carrying amount
Amount Proportion
(%) Amount
Proportion
(%) Amount
Proportion
(%) Amount
Proportion
(%)
Bad debt
provision
assessed
individually
Including:
Bad debt
provision
assessed by
groups
1,681,426,962.93 100.00 1,681,426,962.93 1,640,765,860.31 100.00 1,640,765,860.31
Including:
Receivables
portfolio of
large-scale
hydropower
business
1,679,077,351.06 99.86 1,679,077,351.06 1,636,258,291.59 99.73 1,636,258,291.59
Other
receivables
portfolio
2,349,611.87 0.14 2,349,611.87 4,507,568.72 0.27 4,507,568.72
Total 1,681,426,962.93 / / 1,681,426,962.93 1,640,765,860.31 / / 1,640,765,860.31

2020 Annual Report
248 / 259
Explanations on bad debt provision assessed individually:
Non-applicable
Bad debt provision assessed by groups:
Non-applicable
Refer to the disclosure of other receivables if bad debt provision is made based on the general ECL model: Non-applicable
(3). Details of bad debt provision
Non-applicable
Significant recovery or reversal of bad debt provision for the current period:
Non-applicable
(4). Accounts receivable written off as at the end of the reporting period
Non-applicable
Significant write-off of accounts receivable:
Non-applicable
(5). Top five accounts receivable based on debtors
Applicable
Entity Closing balance Aging
Proportion of
total closing
balance of
accounts
receivable
(%)
Closing
balance of
bad debt
provision
State Grid Corporation of
China 1,191,740,985.71
Within 1
year 70.88
Central China branch of State Grid
Corporation of China 292,644,485.26
Within 1
year 17.40
China Southern Power Grid
Company Limited 186,454,672.92
Within 1
year 11.09
State Grid Hubei Electric Power Co.,
Ltd 8,160,810.85
Within 1
year 0.49
Three Gorges Electric Energy Co.,
Ltd. 2,080,392.81
Within 1
year 0.12
Total 1,681,081,347.55 99.98
(6). Accounts receivable derecognized due to transferred financial assets
Non-applicable
(7). Carrying amount of continuing involvement after transferring accounts receivable
Non-applicable

2020 Annual Report
249 / 259
Others:
Non-applicable
2、 Other receivables
List of items
Applicable
Unit:RMB Yuan
Item Closing balance Opening balance
Interest receivable
Dividends receivable 45,473,100.00 50,045,000.00
Other receivables 336,776,408.06 17,270,820.17
Total 382,249,508.06 67,315,820.17
Others: Non-applicable
Interest receivable
(1). Classification of interest receivable
Non-applicable
(2). Significant overdue interest
Non-applicable
(3). Details of bad debt provision
Non-applicable
Others:
Non-applicable
Dividends receivable
(4). Dividends receivable
Applicable
Unit:RMB Yuan
Item (or investee) Closing balance Opening balance
Hubei Qingneng Investment
Development Group Limited
45,473,100.00 50,045,000.00
Total 45,473,100.00 50,045,000.00
(5). Significant dividends receivable aged over 1 year
Non-applicable
(6). Details of bad debt provision
Non-applicable
Others: Non-applicable
Other receivables
(1). Aging analysis
Applicable
Unit:RMB Yuan
Aging Book balance at the end of the reporting period

2020 Annual Report
250 / 259
Within 1 year
Including: Items aged within 1 year
Within 1 year 336,803,220.28
1-2 years
2-3 years 133,000.00
More than 3 years
3-4 years
4-5 years 400,000.00
More than 5 years 206,300.00
Total 337,542,520.28
(2). Details of classification by nature
Applicable
Unit:RMB Yuan
Nature Book balance at the end of the
reporting period Book balance as at the beginning
of the reporting period
Deposit and Margin 739,300.00 739,300.00
Intercourse funds 336,663,086.49 15,605,295.12
Other 140,133.79 1,341,604.70
Total 337,542,520.28 17,686,199.82
(3). Details of bad debt provision
Applicable
Unit:RMB Yuan
Bad debt provision
Stage I Stage II Stage III
Total 12-month ECL
Lifetime ECL
(not impaired)
Lifetime ECL
(impaired)
As at 1 January 2020 415,379.65 415,379.65
Changes due to
financial instruments
recognised as at 1
January 2020
--Transfer to stage II
--Transfer to stage III
---Reverse to stage II
--Reverse to stage I
Provision 350,732.57 350,732.57
Reversal
Elimination
Write-off
Other changes
As at 31 December
2020
766,112.22 766,112.22
Explanations on significant changes in the book balance of other receivables where there are changes in
provision for the current period:
Non-applicable
Bad debt provision for the current period and basis for assessing whether there's significant increase in the
credit risk of financial instruments: Non-applicable

2020 Annual Report
251 / 259
(4). Details of bad debt provision
Applicable
Unit: RMB Yuan
Category Opening
balance
Changes in the current period Closing
balance Provision Recovery
or reversal Elimination
or write-off Other
changes
Other
receivables
portfolio
415,379.65 350,732.57 766,112.22
Total 415,379.65 350,732.57 766,112.22
Significant recovery or reversal of bad debt provision for the current period:
Non-applicable
(5). Other receivables written off as at the end of the current period
Non-applicable
(6). Top five other receivables based on debtors
Applicable
Unit:RMB Yuan
Entity Nature Closing balance Aging
Proportion to
the total closing
balance of other
receivables (%)
Closing
balance of
bad debt
provision
Three Gorges Jinsha
River Yunchuan
Hydropower
Development Co.,
Ltd
Intercourse
funds 331,263,137.73
Within 1
year 98.14 331,263.14
China Three Gorges
Power Operation
Int’l Co., Limited
Intercourse
funds 3,747,348.40
Within 1
year 1.11 3,747.35
Yangtze Three
Gorges Industrial
Co., Ltd.
Intercourse
funds 1,646,135.76
Within 1
year 0.49 1,646.14
Yichang Labor
Security
Supervision Branch
Deposit and
Margin
739,300.00 2-6 years 0.22 429,309.00
Shanghai Clearing
House Other 140,133.79
Within 1
year 0.04 140.13
Total / 337,536,055.68 / 100.00 766,105.76
(7). Receivables related to government grants
Non-applicable
(8). Other receivables derecognized due to transferred financial assets
Non-applicable
(9). Carrying amount of continuing involvement after transferring other receivable
Non-applicable
Others: Non-applicable

2020 Annual Report
252 / 259
3、 Long-term equity investments
Applicable
Unit:RMB Yuan
Item
Closing balance Opening balance
Opening balance Provision for
impairment Carrying amount Book balance
Provision for
impairment Carrying amount
Investment in
subsidiaries 56,819,596,483.34 56,819,596,483.34 41,132,349,756.82 41,132,349,756.82
Investment in joint
ventures and
associates
46,182,014,702.55 46,182,014,702.55 36,920,383,809.53 36,920,383,809.53
Total 103,001,611,185.89 103,001,611,185.89 78,052,733,566.35 78,052,733,566.35
(1). Investment in subsidiaries
Applicable
(5). Unit:RMB Yuan
Investee Opening balance Increase in the
current period
Decrease
in the
current
period
Closing balance
Provision for
impairment
in the
current
period
Closing
balance of
provisions
for
impairment
Yangtze Power Capital Holdings Limited 2,600,000,000.00 2,600,000,000.00
China Yangtze International (Hongkong) Co.,
Limited
965,367,563.77 15,667,246,726.52 16,632,614,290.29
Three Gorges Jinshajiang Chuanyun Hydraulic
Power Development Co., Ltd.
36,866,982,193.05 36,866,982,193.05
Three Gorges Electric Energy Co., Ltd. 700,000,000.00 700,000,000.00
China Yangtze Power Sales Co., Ltd. 20,000,000.00 20,000,000.00
Total 41,132,349,756.82 15,687,246,726.52 56,819,596,483.34

2020 Annual Report
253 / 259
(2). Investment in joint ventures and associates
Applicable
Unit:RMB Yuan
Investor Opening
balance
Increase/decrease in the current period
Closing balance
Closing
balance of
provisions
for
impairmen
t
Increase in
investment Decrease in
investment
Investment profit
and loss recognized
under equity method
Other
comprehens
ive income
adjustment
Other
changes in
equity
Declaration
of cash
dividends or
profits
Pr
ovi
sio
n
for
im
pai
rm
ent
Ot
he
rs
I.Joint ventures
Subtotal
II. Associates
Hubei Energy Group Co.,
Ltd. 6,845,909,686.64 622,139,792.90 -55,056,667.91 -15,601,201.58 164,982,859.30 7,232,408,750.75
Hubei Qingneng
Investment Development
Group Limited
1,906,684,945.84 208,005,653.56 -2,610,006.94 45,473,100.00 2,066,607,492.46
Guangzhou Development
Group Incorporated 3,173,098,564.35 162,653,206.45 3,676,104.46 4,598,446.37 24,505,162.90 3,319,521,158.73
Three Gorges Finance Co.,
Ltd. 2,022,060,388.81 233,249,838.22 -157,100.16 100,390,644.91 2,154,762,481.96
Shanghai Electric Power
Co., Ltd 1,051,951,594.37 857,456,424.31 64,346,668.25 8,709,022.33 5,071,690.17 25,612,345.59 1,961,923,053.84
Hunan Taohua River
Nuclear Power Co., Ltd 224,119,537.52 224,119,537.52
Chongqing Three Gorges
Water Conservancy and
Electric Power Co.,Ltd.
1,570,169,507.31 474,442,103.00 75,275,388.80 -2,810,587.68 -491,193.52 15,966,340.20 2,100,618,877.71
Three Gorges Base Development Co., Ltd.
372,427,477.85 32,136,349.33 -5,699,939.92 6,878,679.12 391,985,208.14

2020 Annual Report
254 / 259
Shenergy Company
Limited 2,920,970,488.95 110,220,947.12 -1,854,775.60 -2,090,589.55 6,600.00 3,027,239,470.92
Chongqing Youtai Energy
Co., Ltd 28,891,045.24 -8,872,815.07 20,018,230.17
Chongqing Fuling Energy
Industry Group Limited 572,620,161.64 49,606,629.95 -638,431.07 324,376.10 4,569,988.77 617,342,747.85
Chongqing Yangtze Power
United Energy Co., Ltd 343,461,109.25 344,093,435.53 5,601,312.56 -4,968,986.28
Three Gorges Capital
Holdings Co., Ltd. 2,912,492,366.43 310,242,639.53 -109,831,035.73 15,079,865.69 135,353,223.35 2,992,630,612.57
Chongqing Fuling Three
Gorges Changfu Equity
Investment Fund
Partnership (Limited)
39,994,725.58 9,551,014.00 -114,858.91 49,430,880.67
SDIC Power Holding Co.,
Ltd. 6,148,143,304.91 2,060,816,851.18 686,098,680.81 6,110,613.24 7,683,665.06 219,152,519.27 8,689,700,595.93
Sichuan Chuantou Energy
Co., Ltd. 4,700,095,843.00 1,110,002,443.12 414,804,123.74 138,764.58 248,374.18 199,351,173.88 6,025,938,374.74
Chongqing Liangjiang
Three Gorges Xinghong
Equity Investment Fund
Partnership (Limited)
41,029,335.77 389,442.27 41,418,778.04
Chongqing Qianjiang
Changhong Three Gorges
Equity Investment Fund
Partnership (Limited)
40,087,715.80 136,000,000.00 541,523.82 176,629,239.62
中核霞浦核电有限公司 1,157,761.04 148,452.27 238,297.75 1,544,511.06
Yunnan Huadian Jinsha
River Midstream
Hydropower
Development Co., Ltd
4,897,610,000.00 102,516,396.53 5,000,126,396.53
Three Gorges High-tech
Information Technology
Co., Ltd
28,378,738.18 42,660,000.00 15,892,295.69 3,625,716.55 30,348,011.16 1,071,866.86 88,048,303.34
Subtotal 36,920,383,809.53 7,611,899,324.56 359,985,731.22 3,072,615,088.68 -157,414,033.46 37,830,748.61 943,314,504.15 46,182,014,702.55

2020 Annual Report
255 / 259
Total 36,920,383,809.53 7,611,899,324.56 359,985,731.22 3,072,615,088.68 -157,414,033.46 37,830,748.61 943,314,504.15 46,182,014,702.55
Others:
Nil

2020 Annual Report
256 / 259
4、 Operating revenue and costs of sales
(1). Operating revenue and costs of sales
Applicable
Unit:RMB Yuan
Item Amount incurred in the current period Amount incurred in the prior period
Revenue Cost Revenue Cost
Principal operating
activities 28,417,422,202.84 8,509,136,185.45 25,485,490,294.18 9,179,257,872.79
Others 487,434,188.72 422,127,448.20 58,389,114.18 1,254,682.92
Total 28,904,856,391.56 8,931,263,633.65 25,543,879,408.36 9,180,512,555.71
(2). Income generated from contracts
Non-applicable
(3). Description of performance obligations
Non-applicable
(4). Allocation to the outstanding performance obligations
Non-applicable
Others:
Nil
5、 Investment income
Applicable
Unit:RMB Yuan
Item Amount incurred in the
current period
Amount incurred in the prior
period
Income from long-term equity
investments under cost method 10,104,596.71 2,156,913.71
Income from long-term equity
investments under equity method 3,072,615,088.68 1,956,213,738.27
Investment income on disposal of long-
term equity investments 143,704,035.28
Investment income from holding held-for-
trading financial assets
Dividend income from holding
investments in other equity instruments 207,677,760.00 264,877,578.00
Interest income from holding debt
investments
Interest income from holding other debt
investments
Investment income from disposal of held-
for-trading financial assets
Investment income from disposal of
investments in other equity instruments
Investment income from disposal of debt
investments
Investment income from disposal of other
debt investments
Investment gain from holding other non-current financial assets
192,843,027.67 67,542,211.45
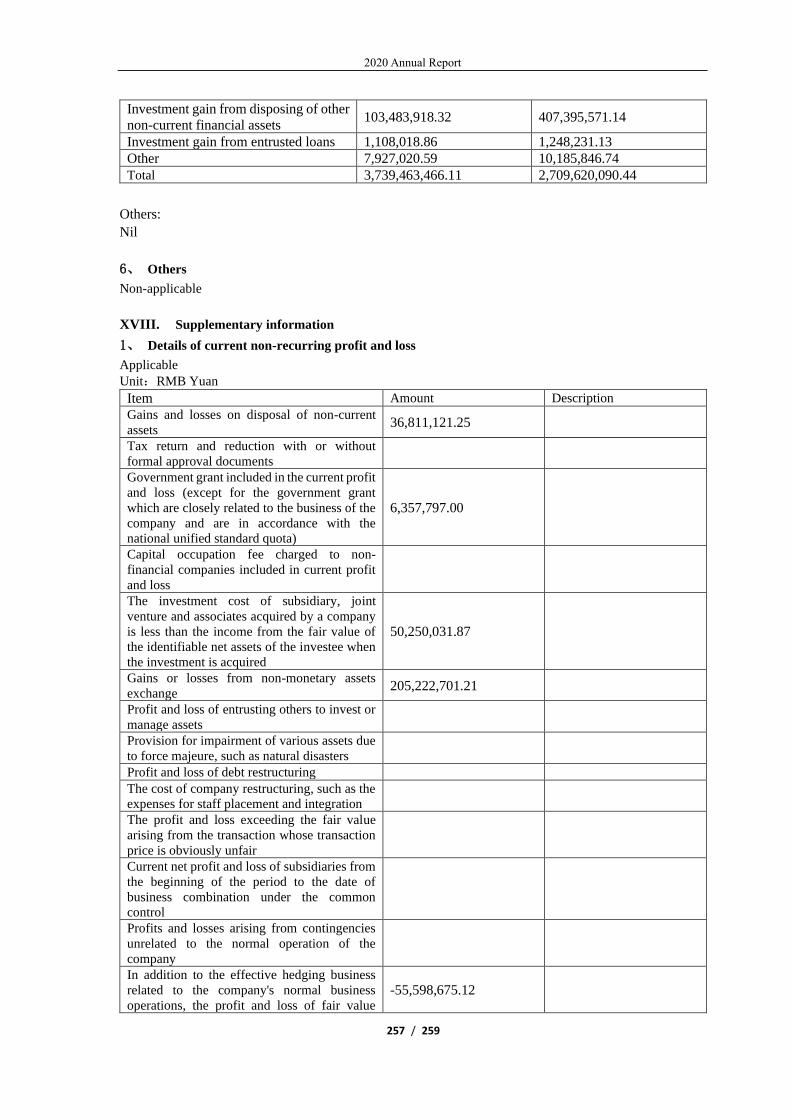
2020 Annual Report
257 / 259
Investment gain from disposing of other
non-current financial assets 103,483,918.32 407,395,571.14
Investment gain from entrusted loans 1,108,018.86 1,248,231.13
Other 7,927,020.59 10,185,846.74
Total 3,739,463,466.11 2,709,620,090.44
Others:
Nil
6、 Others
Non-applicable
XVIII. Supplementary information
1、 Details of current non-recurring profit and loss
Applicable
Unit:RMB Yuan
Item Amount Description
Gains and losses on disposal of non-current
assets 36,811,121.25
Tax return and reduction with or without
formal approval documents
Government grant included in the current profit
and loss (except for the government grant
which are closely related to the business of the
company and are in accordance with the
national unified standard quota)
6,357,797.00
Capital occupation fee charged to non-
financial companies included in current profit
and loss
The investment cost of subsidiary, joint
venture and associates acquired by a company
is less than the income from the fair value of
the identifiable net assets of the investee when
the investment is acquired
50,250,031.87
Gains or losses from non-monetary assets
exchange 205,222,701.21
Profit and loss of entrusting others to invest or
manage assets
Provision for impairment of various assets due
to force majeure, such as natural disasters
Profit and loss of debt restructuring
The cost of company restructuring, such as the
expenses for staff placement and integration
The profit and loss exceeding the fair value
arising from the transaction whose transaction
price is obviously unfair
Current net profit and loss of subsidiaries from
the beginning of the period to the date of
business combination under the common
control
Profits and losses arising from contingencies
unrelated to the normal operation of the
company
In addition to the effective hedging business
related to the company's normal business
operations, the profit and loss of fair value
-55,598,675.12

2020 Annual Report
258 / 259
changes arising from the holding of trading
financial assets, derivative financial assets,
trading financial liabilities, derivative financial
liabilities, and investment income obtained
from the disposal of trading financial assets,
derivative financial assets, trading financial
liabilities, derivative financial liabilities and
other debt investment
Reversal of provision for impairment of
receivables tested individually
Profit and loss from external entrusted loans
Profit and loss from changes in fair value of
investment properties measured by fair value
model
The impact of one-off adjustment on the
current profit and loss according to the
requirements of tax, accounting and other laws
and regulations
Custody fee income from entrusted operation
Other non-operating income and expenses
except the above items -200,395,826.32
Other profit and loss items conforming to the
definition of non-recurring profit and loss 15,678,172.60
The impact of income tax 88,040,202.18
The impact on non-controlling interests -24,122,775.82
Total 122,242,748.85
The reasons shall be explained for the non-recurring profit and loss items defined by the company according to
the definition of "explanatory Announcement No. 1 of information disclosure of companies offering securities
to the public - non recurring profit and loss" and the items of non-recurring profit and loss listed in the
explanatory announcement of information disclosure of companies offering securities to the public No. 1 - non
recurring profit and loss as recurring profit and loss items.
Non-applicable
2、 Return on net assets and earnings per share
Applicable
Profit in the reporting period Weighted
average return
on net assets (%)
Earnings per share
Basic earnings
per share
Diluted
earnings per
share
Net profit attributable to ordinary shareholders of
the company 16.71 1.1853 1.1853
Net profit attributable to ordinary shareholders of
the company after deducting non-recurring profit
and loss 16.63 1.1798 1.1798
3、 Differences of accounting data under domestic and foreign accounting standards
Non-applicable
4、 Others
Non-applicable

2020 Annual Report
259 / 259
Section 11 Document Available for Inspection
Document Available for
Inspection
Financial statements signed and sealed by the chairman of the Company, chief
financial officer and head of accounting department.
Document Available for
Inspection
Original Audit Report with Accounting Firms’ Seals and Certified Public
Accountants’ Signatures and Seals.
Document Available for
Inspection
Original copies of all documents and announcements of the Company which
had been disclosed to the public on the newspapers designated by CSRC and
the website of Shanghai Stock Exchange during the Reporting Period.
Chairman:Lei Mingshan
Submission date approved by the Board of Directors: 29 April 2021
Revision Information Non-applicable