china taiping insurance holdings company limited 2016 ... · at 31 dec 2014 at 31 dec 2015 at 31...
TRANSCRIPT

23 March 2017
China Taiping Insurance
Holdings Company Limited
2016 Annual Results
Presentation

2
Forward-looking Statements
This presentation and subsequent discussions may contain certain forward-looking statements with respect to the financial condition, results of operations and businesses of the CTIH Group. These forward-looking statements represent the CTIH Group’s expectations or beliefs concerning future events and involve known and unknown risks and uncertainties that could cause actual results, performance or events to differ materially from those expressed or implied in such statements

3
Note (1):Ageas owns the remaining 24.9%, 20% and 20% equity interests in TPL, TPeC and TPAM, respectively. Note (2):PT Megah Putra Manunggal owns the remaining 45% equity interest in TP Indonesia. Note (3):TPSM and TPR (BJ) are wholly-owned subsidiaries of TPL. CTIH’s effective interest in TPSM and TPR (BJ) is 75.1%. Note (4):TPIH and TPL own 61% and 39% of the equity interests of TPR (SH), respectively. CTIH’s effective interest in TPR (SH) is 90.3%. Note (5):TPL, TPI and TPPM own 60%, 20% and 20% of the equity interests in TPR (Suzhou), respectively. CTIH’s effective interest in TPR (Suzhou) is 85.1%. Note (6):TPL and TPI own 80% and 20% of the equity interests in TPR (Nanning), respectively. CTIH’s effective interest in TPR (Nanning) is 80.1%. Note (7):Sinopec Group Company owns the remaining 50% equity interests in TSFL. Note (8):In addition to operating its own business lines, TPIH, TPSM and TPP also act as investment platforms in the asset management business. Note (9):The above structure was as of 31 Dec 2016.
Simplified Company Structure

Substantial Success in the “Boutique Strategy”, Significant Increase in
Business Value, Business Scale Continued to Grow Steadily
Total premium reached HK$149.3 billion, increased by 7.8% over the Last Year
Total assets were over HK$505.4 billion, increased by 3.6% over the last year-end
Profit attributable to owners was HK$4.774 billion, decreased by 24.7% over the Last Year, better than
industry average
Life insurance’s new business value was HK$9.115 billion, increased by 28.8% over the Last Year
(increased by 37.6% in terms of RMB);under the same assumption, life insurance’s new business
value increased by 49.9% over the Last Year (increased by 60.1% in terms of RMB)*
Group embedded value per share attributable to owners was HK$28.5, increased by 4.6% over the last
year-end figure of HK$27.3, while TPL’s embedded value increased by 5.3% over the end of Last Year
(increased by 12.4% in terms of RMB); under the same assumption, TPL’s embedded value increased by
11.7% over the last year-end (increased by 19.2% in terms of RMB)*
The Board recommended the payment of a final dividend of HK10 cents per share
The combined ratio of property and casualty insurance and reinsurance business remained stable,
continued in making underwriting profit
4 * Calculated in accordance with the C-Ross assessment standard
Highlights and Consolidated Results of Operations
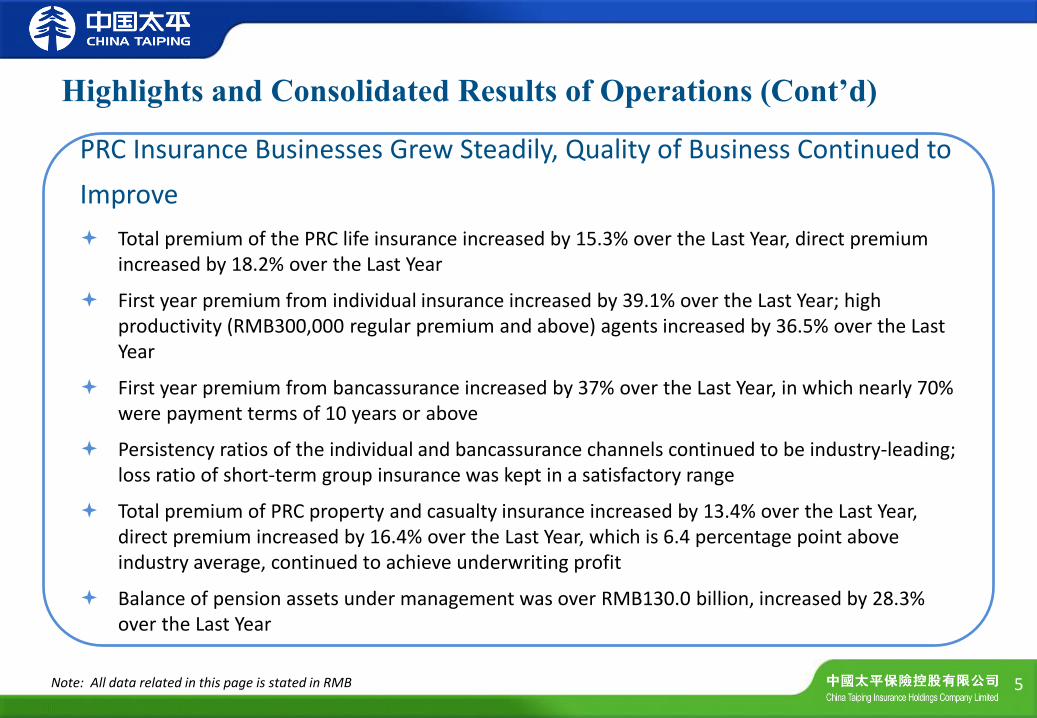
PRC Insurance Businesses Grew Steadily, Quality of Business Continued to
Improve
Total premium of the PRC life insurance increased by 15.3% over the Last Year, direct premium increased by 18.2% over the Last Year
First year premium from individual insurance increased by 39.1% over the Last Year; high productivity (RMB300,000 regular premium and above) agents increased by 36.5% over the Last Year
First year premium from bancassurance increased by 37% over the Last Year, in which nearly 70% were payment terms of 10 years or above
Persistency ratios of the individual and bancassurance channels continued to be industry-leading; loss ratio of short-term group insurance was kept in a satisfactory range
Total premium of PRC property and casualty insurance increased by 13.4% over the Last Year, direct premium increased by 16.4% over the Last Year, which is 6.4 percentage point above industry average, continued to achieve underwriting profit
Balance of pension assets under management was over RMB130.0 billion, increased by 28.3% over the Last Year
5 Note: All data related in this page is stated in RMB
Highlights and Consolidated Results of Operations (Cont’d)
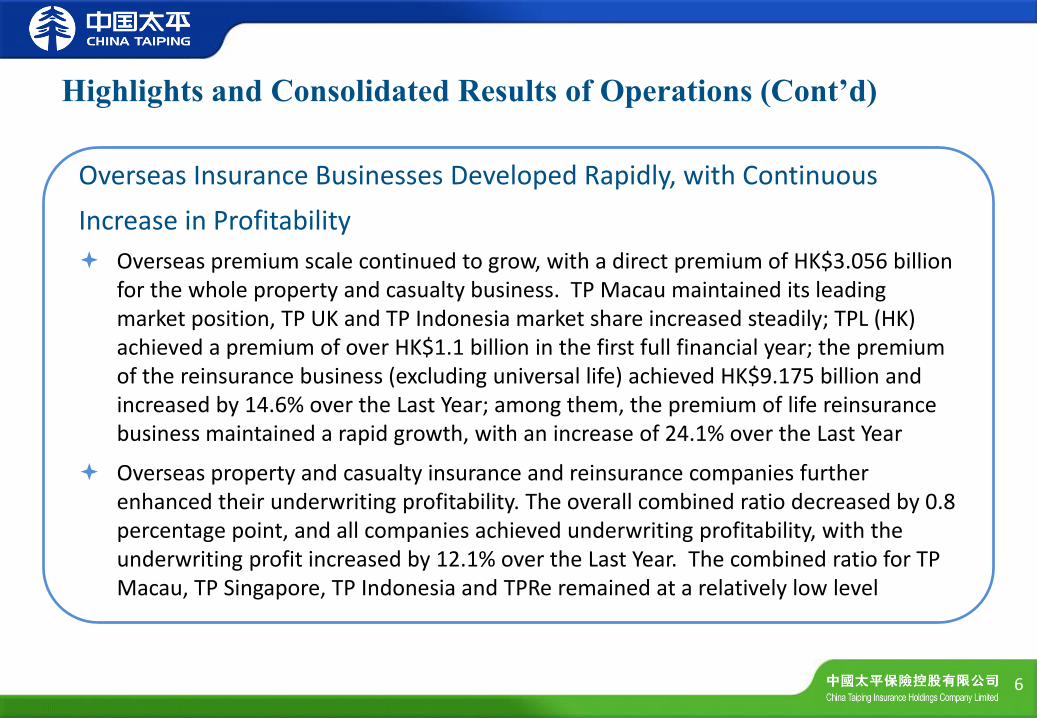
Overseas Insurance Businesses Developed Rapidly, with Continuous
Increase in Profitability
Overseas premium scale continued to grow, with a direct premium of HK$3.056 billion for the whole property and casualty business. TP Macau maintained its leading market position, TP UK and TP Indonesia market share increased steadily; TPL (HK) achieved a premium of over HK$1.1 billion in the first full financial year; the premium of the reinsurance business (excluding universal life) achieved HK$9.175 billion and increased by 14.6% over the Last Year; among them, the premium of life reinsurance business maintained a rapid growth, with an increase of 24.1% over the Last Year
Overseas property and casualty insurance and reinsurance companies further enhanced their underwriting profitability. The overall combined ratio decreased by 0.8 percentage point, and all companies achieved underwriting profitability, with the underwriting profit increased by 12.1% over the Last Year. The combined ratio for TP Macau, TP Singapore, TP Indonesia and TPRe remained at a relatively low level
6
Highlights and Consolidated Results of Operations (Cont’d)

Steady Development of the Investment Business
The asset scale grew steadily. At the end of 2016, the total investment assets of the Group is HK$425.2 billion, increased by 14.1% over the beginning of the Year; the third-party entrusted investment assets amounted to HK$296.0 billion, increased by 26.6% over the beginning of the Year
Reinforced investment income base. In 2016, the Group recorded an investment income of HK$20.018 billion and a net investment income of HK$17.656 billion, representing an increase of 13.1%, which indicates that the Group has well coped with the market fluctuations and laid the foundation for its income base
Traditional investments were prudent and active . As at the end of 2016, the allocation of equity securities and investment funds is 8.1%, 5.2 percentage point lower than the industrial average; domestic available for sale debt investments outperformed the Total Wealth Index of ChinaBond by 95 bp and the Wind Bond Fund Index by 185 bp; the Group’s assets credit risk screening shows sound risk management results
7
Highlights and Consolidated Results of Operations (Cont’d)

Effective Implementation of Strategic Cooperation and Cross-selling
Initiatives with Large Clients
In 2016, China Taiping signed Group Strategic Cooperation Agreements with 16 large clients, including China Everbright Group, Ant Financial and CRRC Group. As at the end of 2016, China Taiping had established strategic cooperation relationships with 68 large clients
Our cross-selling initiatives achieved HK$4.543 billion insurance sales, including HK$3.826 billion of property insurance sales through TPL, HK$0.620 billion of pension sales through TPL, and HK$97 million of property insurance sales through TPP
The Sinopec gas station project achieved rapid development, achieving HK$1.756 billion of insurance sales for the full year of 2016, increased by 51.4% over the Last Year. 5,160 outlets had been stationed by the end of 2016
8
Highlights and Consolidated Results of Operations (Cont’d)

HK$ million 2016 2015 Change
Life Insurance 4,843.41 6,697.77 -27.7%
PRC Property and Casualty Insurance 552.11 821.25 -32.8%
Overseas Property and Casualty Insurance and Reinsurance
920.79 888.41 +3.6%
Pension and Group Life Insurance 24.18 178.36 -86.4%
Others 1 (38.01) (417.55) +90.9%
Net Profit from operations 6,302.48 8,168.24 -22.8%
Non-controlling interests (1,528.23) (1,827.00) -16.4%
Net profit attributable to the owners 4,774.25 6,341.24 -24.7%
1 Others mainly include the operating results of the holding company, asset management, TPeC, TPIH, TPFH and consolidation adjustments. 9
Net Profit by Business Segment

As TPL (HK) is a newly established company in 2015 and its business is still in its initial state, the results under life insurance business for the Year of 2016 is still mainly contributed by TPL. The following figures are the results of TPL from its operations, before intra-group eliminations.
• TPL
• TPL (HK)
Life Insurance Business Review
Note: The Group holds 75.1% of the equity interest in TPL, and 100% in TPL (HK)
10

Direct Premiums Written
(HKD million)
Comprehensive Solvency Ratio
11
Note: 1.Direct Premium Written growth is 18.1% in terms of RMB
2.TPL redeemed all of its residual subordinated notes in 2016
110,395
2016 2015
+10.9% 251%
271%
At 31 Dec 2016 At 31 Dec 2015
C-Ross
99,538
Life Insurance: Premiums Maintained Steady Growth, with
Sufficient Solvency
C-Ross

2015 2016
2,268 2,578
43,295 43,632
53,975 64,185
Further Increase in Proportion of Individual Agency Business (HKD million,%)
Individual
Group and other channels*
Bancassurance
12 * Other channels is mainly telemarketing
2015 2016
54%
44%
2%
58%
40%
2%
Life Insurance: Structure of Gross Premiums – By Distribution
Channels
13
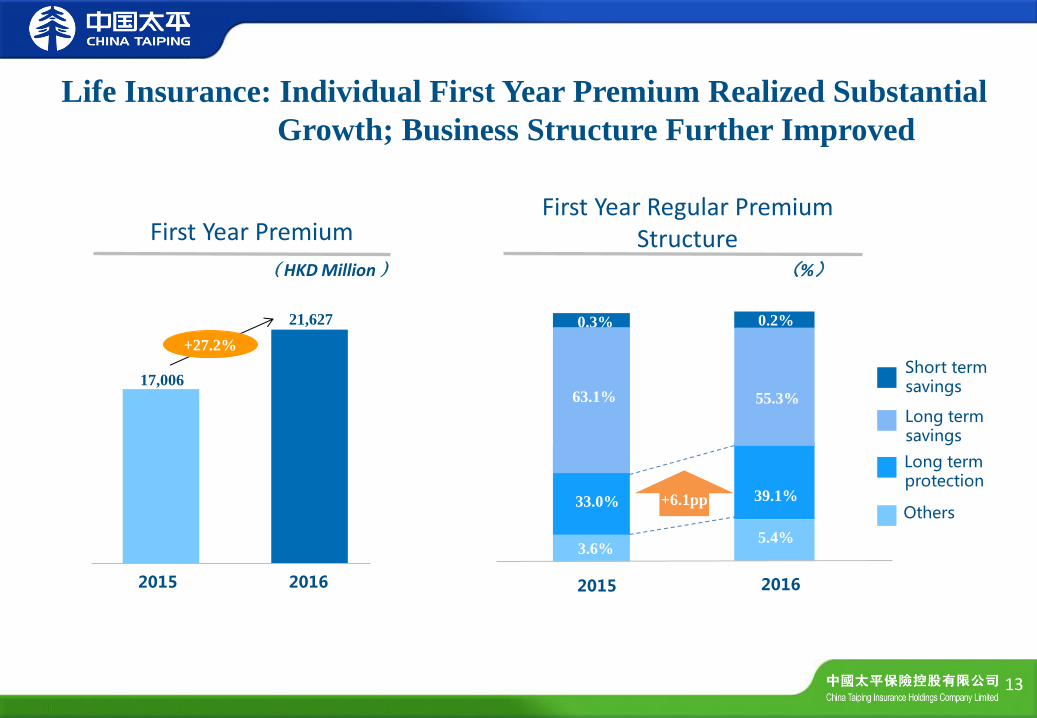
First Year Premium
(HKD Million)
21,627
17,006
2016 2015
+27.2%
Life Insurance: Individual First Year Premium Realized Substantial
Growth; Business Structure Further Improved
First Year Regular Premium Structure
(%)
2015 2016
3.6%
33.0%
0.3%
5.4%
39.1%
55.3%
0.2%
63.1%
Short term savings
Others +6.1pp
Long term savings
Long term protection

Life Insurance: Agency Force Realized Rapid Growth; High
Productivity Agents Grew Substantially
Number of Agents
14
(person)
261,922
231,766
+13.0%
* RMB300,000 regular premium above
10,066
7,373
+36.5%
Number of High Productivity Agents*
(person)
At 31 Dec 2016 At 31 Dec 2015 At 31 Dec 2016 At 31 Dec 2015

15
Note:1.Assumption Change: The annual investment return of 2016 is assumed to be adjusted from 5.5% to 5.0%, and the risk discount rate remained unchanged, and similarly hereinafter
2.NBV Margin=NBV/First Year Annualized Premium; First Year Annualized Premium=First Year Regular Premium + Single Premium/10 3.Year 2016*: result from the same valuation assumptions of 2015 unless otherwise specified, similarly hereinafter
Individual NBV Margin
Life Insurance: Individual NBV Margin Kept Growing
2016* C-Ross
2015 Solvency l
2015 C-Ross
2016 C-Ross
36.2%
43.6% 42.8%
48.2%
+7.4pp
+4.6pp -5.4pp
Standard Change
Business Growth
Assumption Change

First Year Regular Premium
16
(HKD million)
4,207
3,271
2016 2015
+28.6%
Life Insurance: Bancassurance Channel First Year Regular Premium
Grew substantially; Business Structure Kept Improving
Premium Structure
2015 2016
52.6%
39.8%
7.6%
49.8%
40.6%
9.6%
First year regular premium
(%)
Renewal regular premium
Single premium

91% 92%
94%
89% 87%
89%
第13个月之保费继续率
第25个月之保费继续率
93% 93%
95%
89% 88% 89%
第13个月之保费继续率
第25个月之保费继续率
Individual Bancassurance
Persistency ratio – 13th month
Persistency ratio – 25th month
At 31 Dec 2014 At 31 Dec 2015 At 31 Dec 2016 At 31 Dec 2014 At 31 Dec 2015 At 31 Dec 2016
Persistency ratio – 25th month
17
Note: According to communications with peers, TPL was No.1 in both Individual and Bancassurance Channels in terms of 13th month persistency ratio
Persistency ratio – 13th month
Life Insurance: Persistency Ratios Stood at the Forefront of the
Industry

81,862
87,422
92,049 97,610
41,351
40,511
45,511
41,911 53,480
44,130
47,919
44,130
18 ** YoY growth is 19.2% in terms of RMB
+6.8%
+11.7%** -5.7%
Adjusted Net
Worth
In-force Business
Value
+3.5%
+27.6% -10.4%
92,049
87,422
At 31 Dec 2016
+5.3%
At 31 Dec 2015
Embedded Value
Life Insurance: Embedded Value Realized Steady Growth
(HKD million)
2015 Solvency l
2015 C-Ross
2016* C-Ross
2016 C-Ross
Standard Change
Business Growth
Assumption Change
(HKD million)
Standard Change & Assumption Change Moving Analysis
C-Ross C-Ross

19
* Including differences between the actual experience and expected experience in terms of investment return, dividend, mortality, morbidity, lapses, expenses ,etc., as well as exchange rate impact arising from the exchange rate of the RMB
92,049
87,422
9,115
6,672
2,310
(7,015) (2,194)
(4,261)
Embedded Value as at the end of
2015
Expected Return on Embedded
Value
New Business
Value
Minimum Capital
Dispersion Effect
Assumption and Model
Change
Embedded Value as at the end of
2016
Experience Variance
and Others*
Capital Injection or Dividend to
Owners
(HKD million)
Life Insurance: Movement Analysis of Embedded Value
C-Ross C-Ross
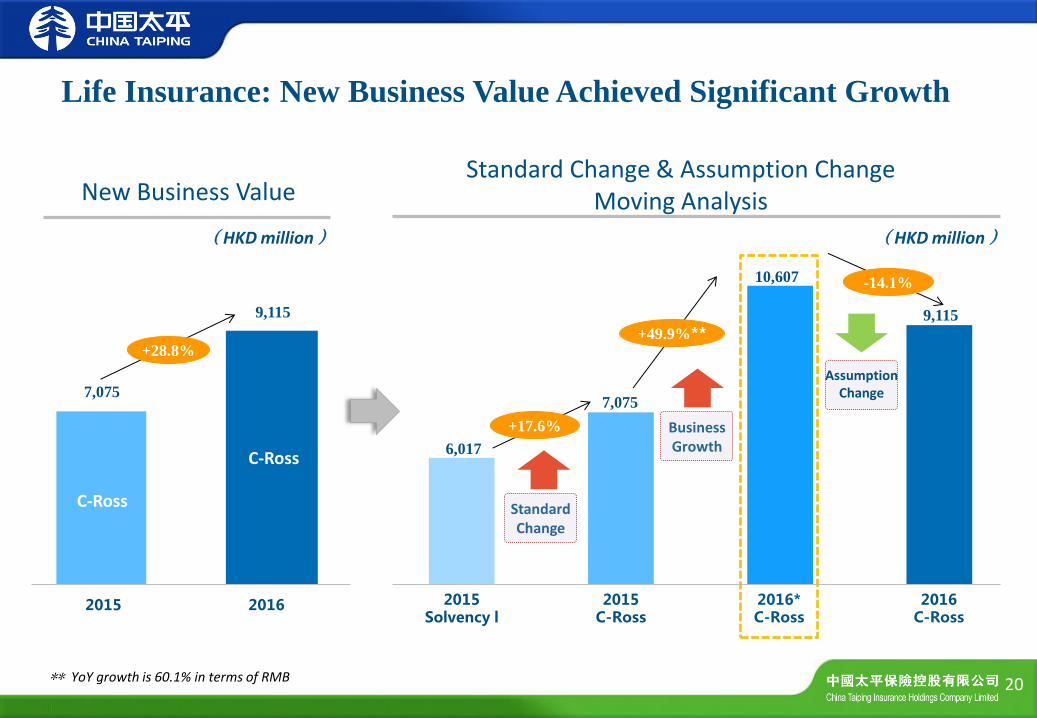
7,075
6,017
9,115
10,607
20 ** YoY growth is 60.1% in terms of RMB
+17.6%
+49.9%**
-14.1%
2016 2015
7,075
9,115
+28.8%
New Business Value
Life Insurance: New Business Value Achieved Significant Growth
(HKD million)
Standard Change & Assumption Change Moving Analysis
(HKD million)
Standard Change
Business Growth
Assumption Change
2015 Solvency l
2015 C-Ross
2016* C-Ross
2016 C-Ross
C-Ross
C-Ross

21
NBV Margin
Life Insurance: NBV Margin Kept Improving
28.0%
32.9% 33.5%
39.0%
+4.9pp
+6.1pp -5.5pp
Standard Change
Business Growth
Assumption Change
2015 Solvency l
2015 C-Ross
2016* C-Ross
2016 C-Ross

• TPI
Mainland P&C Insurance
Business Review
Note:The Group holds the 100% equity interest of TPI
The following figures are the results of TPI from its operations, before intra-group eliminations. 22

Direct Premiums Written
(HKD million)
At 31 Dec 2016 At 31 Dec 2015
Comprehensive Solvency Ratio
23
21,269
19,447
2016 2015
+9.4%
206%
268% -62pp
Note: The decrease of solvency ratio is mainly due to premium growth, increase in the unlisted equity and trust plans, as well as adjustment to impenetrability of asset management products.
Mainland P&C Insurance: Premiums Kept Growing, with
Sufficient Solvency
C-Ross C-Ross
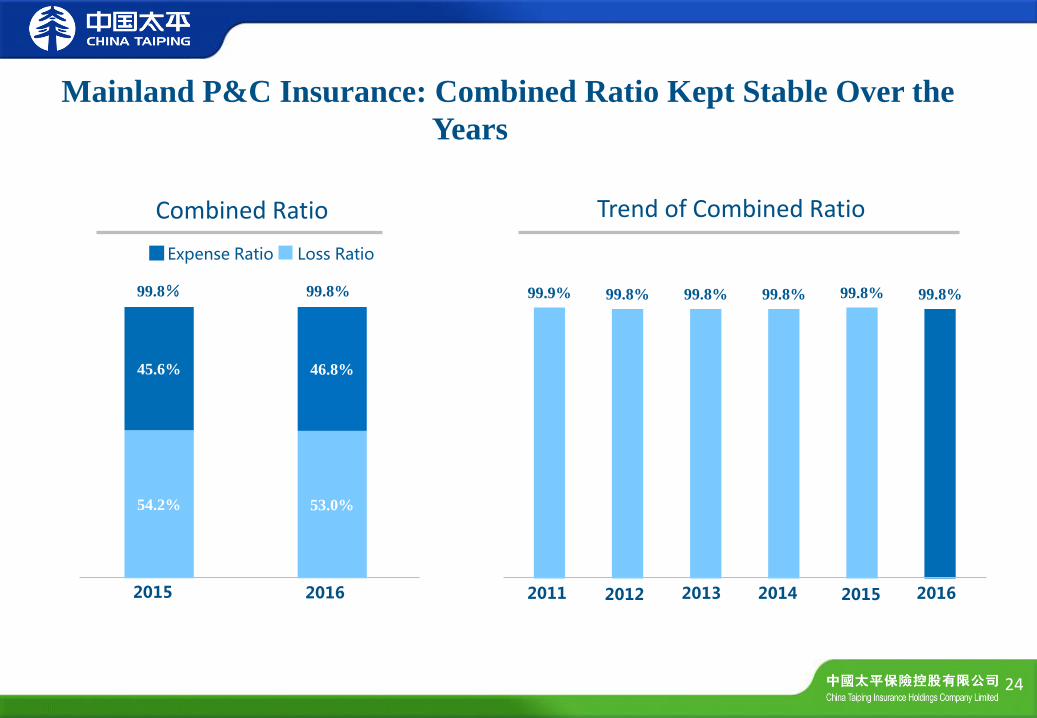
54.2% 53.0%
45.6% 46.8%
2015 2016
Combined Ratio Trend of Combined Ratio
24
Expense Ratio Loss Ratio
99.8% 99.8% 99.9% 99.8% 99.8% 99.8% 99.8% 99.8%
2016 2015 2014 2013 2012 2011
Mainland P&C Insurance: Combined Ratio Kept Stable Over the
Years

The following figures are the results of the respective companies from their respective operations,
before intra-group eliminations.
Overseas P&C Insurance and Reinsurance Businesses Review
HK & Macau
• CTPI (HK)
• TP Macau
Overseas
• TP Singapore
• TP UK
• TP Indonesia
Reinsurance
• TPRe
• TPRe (China)
25
Note:The Group holds 55% of the equity interest in TP Indonesia, and 100% in the other companies listed above

3,016
1,983
1,033
3,056
1,959
1,097
2015
2016
Overseas P&C Direct Premiums Written
Reinsurance Premiums Written**
( HKD million ) ( HKD million )
26
* Excluding innovative type of business; Premiums for Overseas P&C is HK$3.895 billion, and HK$2.862 billion for HK & Macau if including innovative type of business in 2015
Overseas P&C*
HK & Macau*
Other Overseas
3,404 4,224
4,601
4,951
2015 2016
-1.2%
+6.2%
+1.3%
+14.6% 8,005
9,175
** Including business of TPRe (China) and excluding universal insurance
Overseas P&C Insurance and Reinsurance: P&C Premiums Kept
Increasing; TPRe Life Reinsurance Continued to Achieve Breakthroughs
Life
Non-Life

94.3% 95.9%
92.3% 93.3% 93.5%
94.8% 92.6% 92.9%
* non-life reinsurance business
Combined Ratio
27
-1.1pp +0.3pp -0.4pp -0.8pp
Overseas P&C and Re
HK & Macau Other Overseas Reinsurance*
Overseas P&C Insurance and Reinsurance: Combined Ratios
Decreased, With Further Business Quality Improvement
2015
2016

The following figures are the results of TPP from its operations, before intra-group eliminations.
• TPP
Pension and Group Life Insurance Businesses Review
Note: The Group holds 100% of the equity interest in TPP
28
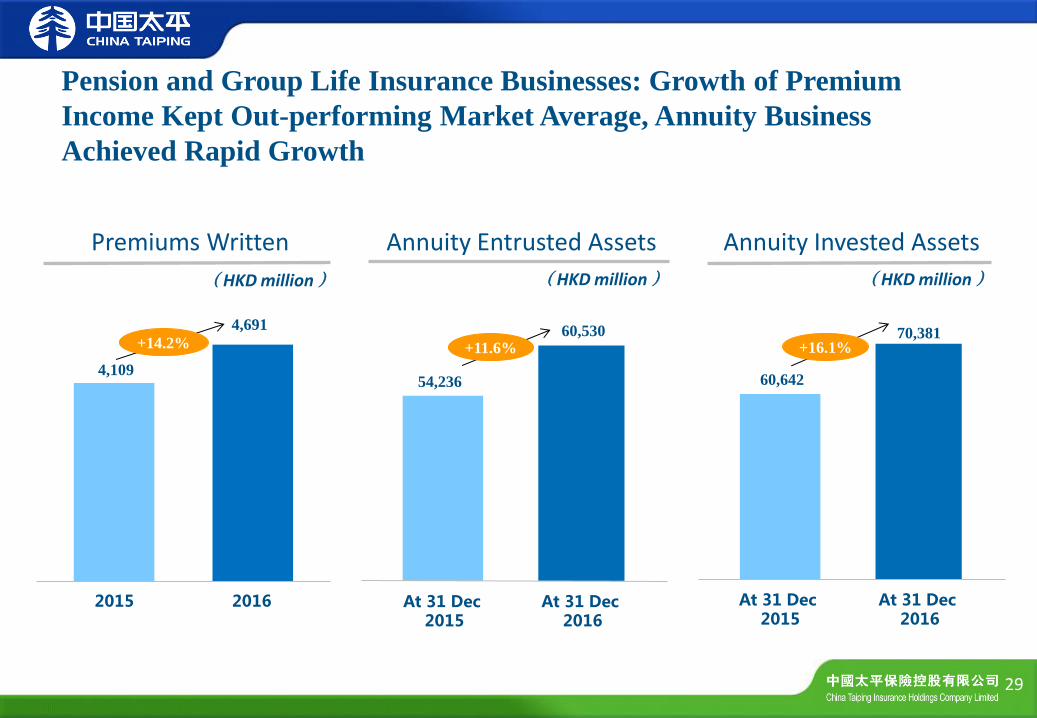
Pension and Group Life Insurance Businesses: Growth of Premium
Income Kept Out-performing Market Average, Annuity Business
Achieved Rapid Growth
(HKD million)
Annuity Entrusted Assets
At 31 Dec 2016
At 31 Dec 2015
Annuity Invested Assets
At 31 Dec 2016
At 31 Dec 2015
(HKD million) (HKD million)
29
60,530
54,236
+11.6% 70,381
60,642
+16.1%
Premiums Written
2016 2015
4,109
+14.2%
4,691

Investment
30

372,667
425,180
31
% of Total 2015 2016
Fixed income 72.8% 73.6%
Debt securities 38.8% 38.7%
Term deposits 9.2% 10.9%
Debt products 19.3% 17.6%
Other fixed income investments 5.5% 6.4%
Equity investments 14.4% 13.3%
Equity securities 7.0% 5.2%
Investment funds 3.4% 2.9%
Other equity investments 4.0% 5.2%
Investment properties 3.3% 4.6%
Cash, cash equivalents and others 9.3% 8.5%
Total 100.0% 100.0%
(HKD million)
Investment Assets
At 31 Dec 2015 At 31 Dec 2016
Note: Figures may not match totals due to rounding.
+14.1%
Allocation of Investment Assets of the Group

15,615 17,656
11,042
2,362
0
5,000
10,000
15,000
20,000
25,000
30,000
26,657
5.01% 7.97%
20,018
-24.9%
32
Note: 1.Including the income from the spread of investment securities, gain or loss on changes in fair value and impairment loss.
2.Including the interest income from deposit, interest income from bonds, dividends from equity investments, rental income from investment properties and deducting interest expense on securities sold under resale agreements.
3.In the calculation of total investment yield, as the denominator, the average investment assets takes into account the effect of securities purchase under resale agreements and securities sold under repurchase agreements.
(HKD million)
Total investment yield 3
Net Realized and unrealized investment gains 1
Net investment income 2
2016 2015
Investment Income

86.5% of the debt securities held by the Group were domestic bonds. 97.2% out of such domestic bonds were government bonds (GB) , financial policy bonds (FPB) with high credit ratings and corporate bonds rated AAA. Investment grade bonds with BBB ratings and above reached 100%
Foreign bonds accounted for the remaining 13.5%, of which 86.2% were investment grade with international ratings, while the remaining were issued by government and large corporations, with adequate credit enhancements.
33
Debt Investments: High Credit Ratings of Debt Asset
46.2%
33.1%
17.9%
1.8% 1.0% 0.0% 0.0%
Credit ratings of domestic bonds
AAA GBs FPBs AA+ A-1 AA- AA

Local Government Debt Financing
Within the local government debt investments, 72% were from provincial or sub-provincial platform, lower level platform projects are guaranteed by the banks
By sector, 63% of them were in the transport and municipal industries, in line with the insurance capital investment infrastructure construction policy guidance
By credit enhancements, 66% were guaranteed by commercial banks or its holding companies, projects exempted from guarantee were debtors of relatively strong repayment ability. The average yield was 5.8% or above, and the average maturity was 6.5 years
Real Estate Financial Investment Debt Products
Real estate financial investment debt products is approximately HK$14.5 billion, representing only 2.8% of the total assets
The credit ratings of the real estate financial investment debt products remained stable
Major projects were located in tier 1 or developed tier 2 cities
Purchased External Financial Products
In 2016, under the background of asset shortage, the Group has actively invested in external financial products and allocated HK$19.8 billion to purchased external alternative assets, with an average yield of 5.3%
Within the purchased external projects, 68% were trust schemes and real estate debt schemes, 82% were in real estate, financial and municipal industries, 76% were guaranteed by commercial banks or its holding companies
Note: including exposures to each other, which is not directly in the total
Alternative investments has been further diversified The proportion of alternative investments held by the Group to total investment assets was 27.7%, from which
"South-to-North Water Diversion" project accounted for HK$11.7 billion. If "South-to-North Water Diversion" project is excluded, the proportion of alternative investments to total investment assets was 25.0%.
Domestic financial investment debt products are mainly debt schemes, with the ratio of trust products and asset management products increased, reflecting the investments has been further diversified.
34
Alternative Investments
Alternative investments risk remained at a low level
Outlook
35
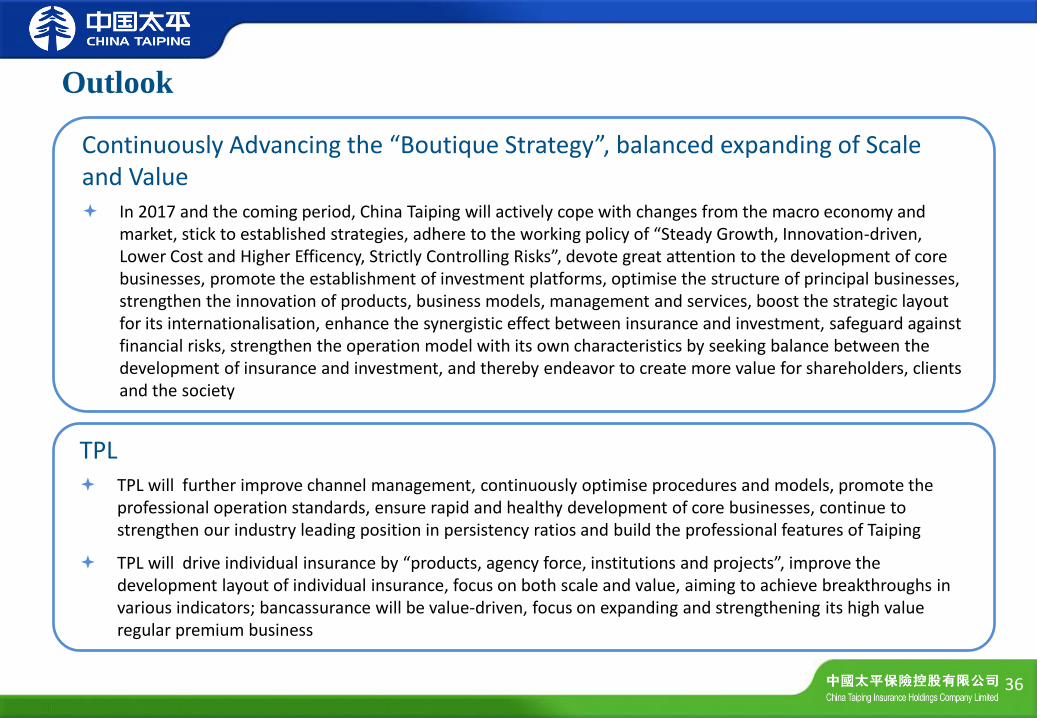
Continuously Advancing the “Boutique Strategy”, balanced expanding of Scale and Value In 2017 and the coming period, China Taiping will actively cope with changes from the macro economy and
market, stick to established strategies, adhere to the working policy of “Steady Growth, Innovation-driven, Lower Cost and Higher Efficency, Strictly Controlling Risks”, devote great attention to the development of core businesses, promote the establishment of investment platforms, optimise the structure of principal businesses, strengthen the innovation of products, business models, management and services, boost the strategic layout for its internationalisation, enhance the synergistic effect between insurance and investment, safeguard against financial risks, strengthen the operation model with its own characteristics by seeking balance between the development of insurance and investment, and thereby endeavor to create more value for shareholders, clients and the society
36
TPL TPL will further improve channel management, continuously optimise procedures and models, promote the
professional operation standards, ensure rapid and healthy development of core businesses, continue to strengthen our industry leading position in persistency ratios and build the professional features of Taiping
TPL will drive individual insurance by “products, agency force, institutions and projects”, improve the development layout of individual insurance, focus on both scale and value, aiming to achieve breakthroughs in various indicators; bancassurance will be value-driven, focus on expanding and strengthening its high value regular premium business
Outlook

TPI To speed up the establishment of professional channels for motor insurance, promote the
expansion of innovative business and strategic sectors, improve the institutional productivity as well as optimise the business structure, actively respond to the implementation and marketisation of the motor insurance rates, further strengthen the risk control and commit concrete efforts to reduce claims and losses, so as to enhance the business value and operating efficiency of the Company
TPP To strengthen, optimise and expand the core business of group insurance and the scale of
pension assets under management, and put great emphasis on the optimisation of business structure, operating model, operational services and profit structure, and accelerate the innovative development, so as to enhance the internal dynamics of the development of the Company
TPL (HK) To continuously grasp the development opportunities in the life insurance market in Hong Kong,
accelerate the business development and realise the objectives of “Creating unique product features, achieving outstanding sales results and establishing good service reputation”
37
Outlook (Cont’d)

Overseas Business Overseas Property and Casualty insurance companies will reinforce company infrastructure,
strengthen refine management, improve customer service, strengthen corporate comprehensive management, and further promote their business quality
CTPI (HK) and TP Macau will further explore the potential in local markets and improve the innovation of products and channels, so as to maintain their leading positions; TP Singapore, TP UK and TP Indonesia will continue to serve the national strategies of “Going Global” and “The Belt and Road”, actively provide risk coverage for overseas projects for Chinese enterprises, and continue rapid growth of their business
Reinsurance Business TPRe will maintain the synchronised growth between scale and efficiency, promote the overall
customer service ability, enhance market position, accelerate the global business layout and improve the international management capabilities
TPRe (China) will promote the development of the company and lay a solid foundation, strive to build up the company's core competitiveness and enhance its market position
38
Outlook (Cont’d)

Investment To build a complete investment segment. The Group will be dedicated to develop an
investment layout covering domestic and overseas, specialising comprehensive and professional fields, integrating traditional and alternative investments, and featuring prominent advantages, resources sharing, rational labor division and effective synergies
To thoroughly exhibit the concept of value investing. The Group will fully utilise the advantages of insurance funds on long term investments, and implement the idea of value investing in areas such as the strategic allocation of assets and the selection of investments
To capture investment priority in line with the state strategies. In view of the national industrial transformation and upgrading, the Group’s investment priority will focus on, among other things, strategic emerging industries, modern manufacturing industry and modern agriculture; in view of the "three state strategies", the Group’s investment priority will focus on, among other things, “The Belt and Road”, Beijing-Tianjin-Hebei Economic Belt and Yangtze River Economic Belt; the Group will also actively invest in major infrastructures and people livelihood projects through various innovative ways.
To serve the insurance business while emphasising on strategic synergies. The Group will improve its investments and efforts in areas that are conform to its principal business, such as pension, health, medical care and automobile industry chain
39
Outlook (Cont’d)

Questions and Answers
40