china passenger vehicle fuel consumption development
TRANSCRIPT

InnovationCenterforEnergyandTransportation(iCET)
December2017
ChinaPassengerVehicleFuelConsumptionDevelopmentAnnualReport2017

-1-
TheInnovationCenterforEnergyandTransportation(iCET)
Phone:+86.10.65857324|Fax:+86.10.65857394
Email:[email protected]|Website:www.icet.org.cn
Acknowledgements
WewishtothanktheEnergyFoundationforprovidinguswiththefinancialsupportrequiredfortheexecutionofthisreportandsubsequentresearchwork.Wewouldalsoliketoexpressoursincerethanksforthevaluableadviceandrecommendationsprovidedbythefollowingdistinguishedexpertsandcolleagues:Prof.WangHewu,Prof.OuXunmin,JinYongfuandXinYan.
ReportTitle
ChinaPassengerVehicleFuelConsumptionDevelopmentAnnualReport2017
ReportDate
December2017
AuthorsLipingKang,LanzhiQin,MayaBenDror,FengAn

-2-
CONTENT
EXECUTIVESUMMARY......................................................................................................................................................3
1. INTRODUCTION:THEDRIVINGFORCEBEHINDCHINA’SPASSANGERVEHICLEENERGYMANAGEMENT.....................................................................................................................................................................11
2. CHINA’SPASSENGERCARSFUELCONSUMPTIONSTANDARD.......................................................132.1PASSENGERCARSFUELCONSUMPTIONSTANDARDSYSTEM............................................................................132.2THEFOURTHPHASEOFCHINA’SFCSTANDARD.................................................................................................15
3. CHINA'SFUELCONSUMPTIONANDNEWENERGYVEHICLEDOUBLEINTEGRALMANAGEMENT.....................................................................................................................................................................163.2FUELCONSUMPTIONANDNEWENERGYVEHICLEINTEGRATEDACCOUNTING...........................................163.3CREDITSTRADINGMECHANISM...............................................................................................................................203.4CREDITSMANAGEMENT.............................................................................................................................................203.5DIFFICULTIESANDCHALLENGESONENERGYEFFICIENCYMANAGEMENT...................................................21
4. COMPARISONBETWEENCHINA’SNEVCREDITSANDCALIFORNIA’SZEVCREDITS........22
5. CURRENTSTATUSANDTRENDSFORPASSENGERCARFCINCHINA.......................................265.1REPORTEDFCVALUELARGELYUNCHANGED......................................................................................................265.22016CAFCCOMPLIANCESTATUS.........................................................................................................................285.3FUELCONSUMPTIONTRENDS...................................................................................................................................305.4BRANDFCPERFORMANCE........................................................................................................................................325.5IMPACTOFSUVANDMPVMARKETEXPANSIONONCHINA’SNATIONALFCPERFORMANCE................33
6. CHINACAFCNEV(SUPER-)CREDITSANDNEVCREDITS.................................................................366.1CORPORATECAFCNEVSUPER-CREDITS............................................................................................................366.2NEVCREDITS...............................................................................................................................................................386.3NEVCREDITSIMPACT:CONCLUDINGREMARKS..................................................................................................41
BIBLIOGRAPHY....................................................................................................................................................................44

-3-
ExecutiveSummary
China'stotaloilconsumption in2016reached556milliontonsrepresentingarateofoil import
dependenceashighas65.5%.Transportationaccountedformorethanhalfoftotaloilconsumption
lastyear,ofwhichpassengercarfuelconsumptioncontributed110milliontons,about90%oftotal
gasolineconsumption(andabout20%of totaloildemand).China’s fueleconomystandardsand
managementregulationwereapprovedasoneofthemosteffectiveeffortstoimprovefuelefficiency
and energymanagement regulation. The standardsweremeant to reduce oil consumption and
advanceChina’senergysecurity.
SinceChinaimplementedpassengervehiclefuelconsumptionstandardsin2005,itunderwentfourphases.Themostrecentone(PhaseIV)enteredintoeffectin2016.In2013,Chinaintroducedtheaverage corporate fuel consumption (CAFC) standard, as part of a series of flexibilitymechanismsthatwereintroducedin2017.Alsoin2017,ChinaannouncedtheformationofanNEVcreditssystemthatwilloperateundertheCAFCstandardregime,andenterintoeffectin2019.
TheInnovationCenterforEnergyandTransportation(iCET)hasbeeninvolvedinthedraftingofChina’sfuelstandardssinceitsfirstiterationandhasbeentrackingitsdevelopmentsince.Thisreport is the7th iCETAnnualReportevaluatingChina’sCAFCstandard implementationstatus with recommendations for policy. This year the report, although covering variousaspects of China’s corporate FC development, places considerable focus on the jointmanagementmechanism of China’s existing CAFC standard and the newly introducedNEVcreditssystem.
Thehighlightsofthisyear’sreportaregroupedaroundthreethemes:(I)fuelefficiencyandtheCAFCstandardregime,(II)NEVsuper-credits(flexibilitymechanism)andCAFCperformance,and,(III)thenewlyintroducedNEVcreditssystemandtheCAFCstandardregime.
I.FuelefficiencyandCAFC:
1. PhaseIVrequirementshaveincreasedinstringencyfrom2016to2020,andthenumberofcompaniesthatfailedtomeetthecorporateaveragefuelconsumptionrequirements
hasgrownin2016whentheflexibilitymechanismwasexcludedfromCAFCcalculations.
About30%ofdomesticmanufacturersand20%ofimportersfailedtomeetthestandard(the
latterisupfromamere4%in2015,thefinalyearofPhaseIII).Thesenon-compliantcompanies
cumulativelysoldover5.68millioncarsin2016,ledbyChangan(ChanaFord,ChanaAuto)and
GreatWall.

-4-
Note:Onlycorporationswithabove100,000unitperyearincluded;bubblesizeindicativeofproductionvolume; NEV
creditsexcludedfromCAFCcalculations.
Improvements intheFCratedecreased inpacesincePhaseIVwas implemented.Fordomestic independentmanufacturers, average FC even increased from2013 to 2016(when the flexibility mechanism was excluded from calculations). Based on FC datareportedbymanufacturersandpublishedbyMIIT,anannualaveragereductionof1.7%wasachieved during a decade of implementation, with importers, JVs, and independentmanufacturers reaching anannual average reduction rateof2.7%,2.2%,and less than1%,respectively.
Note:NEVcreditsexcludedfromCAFCcalculations.
2. Theincreaseofaveragevehicleweightisstymieingfurtherreductionsinpassengercarfuelconsumptionrates,whichtranslatestoFCincreaseof0.5-1L/100kmper100kg.Overthepastdecade,China’saveragefleetweighthasincreasedby13%(163kg).Domesticindependentmanufacturerssawanincreaseof22%overtheperiod(258kg).Independent
128%
132%
136%
140%
144%
148%
6.0 6.5 7.0 7.5 8.0 8.5 9.0
CAFC/Tcafc
CAFC,L/100km
MA IN AUTO MAKERS FA I LED CAFC REQU IRMENT
6.0
7.0
8.0
9.0
10.0
11.0
12.0
2006 2007 2008 2009 2010 2011 2012 2013 2014 2015 2016
CAFC
(L/100km)
BY-COPORATETYPEAVERAGEANNUALCAFC
Domestic(JVs+Indp')JVsIndependentImporters

-5-
andimportersalsoexperiencedasignificantincreaseinaveragefleetweightoverthepastyear.
Note:NEVcreditsexcludedfromCAFCcalculations.
3. ThetrendofweightandenginesizeincreaseisevidentlydrivenbytheincreasingmarketshareofSUVSandlargemodels.In2016,SUVsandMPVstogetheraccountedfornearlyhalfofChina’spassengercarmarket,withSUVsmarketshareincreasingfrom15%in2012to40%in2016.TheaverageFCofSUVs is1.2L/100kmhigher thanthatof theaveragesedan.Itsweightis215kghigheranditsenginedisplacementis130mllarger.
BY-SEGMENT2016AVERAGECURB-WEIGHT,FC,DISPLACEMENTANDPOWER
1100
1300
1500
1700
1900
2009 2010 2011 2012 2013 2014 2015 2016
Cur
b W
eigh
t,kg
BY-COPORATETYPECAFCDEVELOPMENT
JVs Independent Importers
1,309
1,515
1,404
1,141
1000
1100
1200
1300
1400
1500
1600
CurbWeight�kg
car SUV MPV cross-typePV
1576
1709
1548
1286
1000
1100
1200
1300
1400
1500
1600
1700
1800
Displacement�ml
car SUV MPV cross-typePV
95
114
87
68
60
70
80
90
100
110
120
power�kw
car SUV MPV cross-typePV
6.18
7.44
7.06
6.55
5
5.5
6
6.5
7
7.5
8
AverageFC�L/100km
car SUV MPV cross-typePV

-6-
II.NewEnergyVehicle(NEV)supercreditsandCAFC:
4. Abouttwo-thirdsofChina’sFCreductioncomesfromtheincorporationofNEVsupercredits. China’s national average FC rate decreased from 7.04L/100km in 2015 to6.56L/100kmin2016,withfuelsavingtechnologiesaccountingfor33%(0.16L/100km)ofthisreductionandtherest(0.32/100km)fromflexibilitymechanismcalculationsofNEVproduction(eachEVisconsideredfivevehicleswith0L/100kminCAFCcalculations).
2015-2016FCREDUCTIONCOMPONENTS
5. In2016,theindustrygeneratedatotalof1.54millionCAFCcreditsdeficit,whileCAFCcreditssurpluswasseventimeslarger.Over7timesofCAFCsurpluswereproducesin2016andover2millionCAFCcreditssurpluswerecarriedfrom2013to2015bydomesticmanufacturers(nocreditswereforwardedbyimporters),thereforeitisnotaheavyburdenforcompaniestomeetCAFCcreditrequirement.
20157.04L/100km
ICEtechnologyimprovement0.16L/100km NEVpreferenceaward
0.32L/100km
20166.56L/100km
5.00
5.50
6.00
6.50
7.00
7.50
L/100km
33%
67%
397
632
10461117
99 125198
1117
-32 -27 -18-137
-200
0
200
400
600
800
1000
1200
2013 2014 2015 2016
CAFCcredits
,10k
CAFCCREDITSDEVELOPMENTFORDOMESTICPRODUDERS
creditsurplus-previousmethod creditsurplus-newmethod CAFCcreditdeficit

-7-
6. The flexibility mechanism introduced in Phase IV has dramatically reduced thedifficultyofmeetingtheCAFCstandard.WhilecompaniesmayalmostmeettheannualrequirementifCAFCisbasedontheirICEvehiclesalone(134%ofthe2020target),theyactuallyeasilymeet2016targetifNEVsupercreditsareincluded-achieving124%ofthe2020target!The2017targetof128%wasthereforealreadymetin2016,duetothefactthatcalculationsincludedNEVs.
7. LeadingNEVcompanies(e.g.BYD,BAIC,Geely,SAIC,GAC)benefittedgreatlyfromtheincorporationofNEVsupercreditsintoCAFCcaluclations(zeroFCand5timeforproductionforNEV).Evenautocompaniesthat failed tomeet theirCAFCrequirementachievedcompliancewiththehelpofNEVsupercredits(forexmapleJMCholdings).
30
70
85
41
0 0 0
41
-10.6-5.7 -3.2 -17.1
-20
0
20
40
60
80
100
2013 2014 2015 2016
CA
FC c
redi
ts,
10k
CAFC CREDITS DEVELOPMENT FOR IMPORTERS
credit surplus-previous method CAFC credit surplus-new method CAFC credit deficit
132% 131%
135%138%
132%
124%
130%
112%
127% 124%
100%
110%
120%
130%
140%
Domestic JVBrand IndependentBrand
Import NatioanlAverage
BY-CORPORATETYPE2016CAFCWITH/WITHOUTNEVSUPERCREDITS
CAFC/TCAFC(excludingNEV) CAFC/TCAFC(includingNEV)

-8-
8. BAICandBYDleadCAFCcreditssurplus(over950kpointseach),whileGreatWallandChangan,alsoSUVsdominators,leadincreditsdeficit(overminus200kpointseach).
TOPNEVCREDITSSURPLUSANDSHORTFALLHOLDERSOF2016
III.ThenewlyintroducedNEVcreditssystemandCAFC:
9. China’snewNEVcreditssystem,slatedtogointoeffectin2019,isrewardingPEVsandPHEVwithdoublethecreditsthesevehicleswouldhavebeengivenundertheCalifornian ZEV credits system. However, the practice of over-rewarding creditsdowngradestheimpactofboththenewNEVcreditsandtheCAFCstandardtowhichitislinked.
COMPARISONOFPEVANDPHEVCREDITSGENERATEDINTHECAANDINCHINA
0%
20%
40%
60%
80%
100%
120%
140%
160%
BYD-A
uto in
dustr
y
BYD-A
uto
BAIC
-Mot
or
Jiang
nan-
Motor
Geely-
Mot
or
SAIC
-Mot
orChe
ry JAC
Geely-
Dihao
Brillia
nce -
BMW
BY-COMPANY2016CAFCPERFROMANCEWITH/WOTHOUTNEVSUPERCREDITS
CAFC/Tcafc(including NEV) CAFC/Tcafc(exculding NEV)
0.0
20.0
40.0
60.0
80.0
100.0
120.0
CAFCsu
rplus�
10k
-35.0
-30.0
-25.0
-20.0
-15.0
-10.0
-5.0
0.0
CAFCnegetivecredit�10k

-9-
10. TheintegrationofthenewNEVcreditssystemwiththeCAFCstandardregimeisverylikelytodrivecompaniestoabandontheir fuelsavinginvestmentin favorofnewenergyvehicleinvestments,andlikelynotintheformofdirectR&DbutratherthroughthemergingandacquisitionofexistingNEVmanufacturers.
11. In order to ensure that NEVs are making real contribution to China’s emissionreductiongoals,thefollowingissuggested:
(1) The NEV credit system should be a stand-alone mechanism in order to clarifycorporateresponsibilitiesandenablesound implementationandenforcement.EvenbeforetheNEVcreditspolicywasintroduced,theCAFCregimehasproventobetoocomplextomanagewell,givenChina’svastindustrialandinter-ministerialstructures.
(2) Longer term requirements and a predictable baseline of theNEV credits policyshouldbepresentedassoonaspossibletoenablepropermarketstrategicplanning,reduce market failure risks and promote steady investment streams, and soundgradualimprovementsofthequalityofNEVs.
(3) IntroducewellinformedandeffectivepenaltymechanismstoensuretheNEVcreditspolicyisaspowerfulasitcanbe.Thisincludesfeelevels,supplementarypenalties(for
5.28
3.82
5
3.812
2.72
5
2.6882.38 2.13
2.72.08 1.5
4
1.25
BYD-Qin BAIC-EU260 Denz JVC-IEV6s Lifan330EV ModelS CheryQQ3EV
ChinaNEVcredit CaliforniaZEVcredit
0.9250.675 0.6125 0.675
0.81 1.1
2 2 2 2 2 2 2
BYD-Tang RoweiRX5 Arrizo7e Roweie950 BYD-Song VELITE BMW-I3
CaliforniaZEVcredit ChinaNEVcredit

-10-
example,creditowedwillstillbeowedregardlessofpenaltiespaid),andefficientandtransparentpolicyscrutinyandpanelizingprocess.
(4) Considersimplificationofthepolicytoeaseitsmanagement.Forexample,eliminatethepracticeofforwardingcreditstocorporateactors.

-11-
1. INTRODUCTION:THEDRIVINGFORCEBEHINDCHINA’SPASSANGERVEHICLEENERGYMANAGEMENT
China's totaloil consumptionin2016reached556million tons, translating toanoil importdependencerateashighas65.5%,asdemonstratedinFigure1.Transportationaccountedformorethanhalfofthetotaloilconsumptionlastyear,ofwhichpassengercarfuelconsumptioncontributed110million tons,accounting forabout90%of totalgasolineconsumption(andabout 20% of total oil demand). As demonstrated in Figure 2, China’s car energy savingspotentialisstillverylarge.Therefore,China’svehicleenergymanagementismeanttoreduceoilconsumptionandimproveenergysecurity.
Figure1:China’soilimportsgrowthtrend
Source:ChinaPetroleumInstituteofEconomicsandTechnology.
Figure2:By-sourcesplitofChina’soilimportsin2016
54.3%55.9%
56.9% 57.5%59.4%
61.3%
65.5%
50%52%54%56%58%60%62%64%66%68%70%
0
50
100
150
200
250
300
350
400
450
2010 2011 2012 2013 2014 2015 2016
MillionTons
oilproductionvolume oilimportvolume oilimportpercetage
Chemicals20%
Indusrty10.3%
Building2%
Residential5.2%
Agri-Forest-Fishery 3.3%
Business3.5%
PassengerVehicles20%
CommercialVehicles21%
Meritime2.7%
Aviation5%
Other6.2%
Transportation55.5%

-12-
Source:iCETcompiledthefigurebasedondatasourcesfromCNOOCTechnologyResearchInstitute,ChinaAutomotive
TechnologyResearchCenterandNationalBureauofStatistics.
Inaddition,Chinaisthelargestautomobilemarketintheworldforeightconsecutiveyears.Over24millionpassengercarshavebeenproducedinChinaandanadditional1millionwereimportedoverthepastyear,asshowninFigure3.Althoughthemarketisalreadylarge,therateof carownershipper capita is still low(less than118 for1000people1). China’s StateCouncil,inits"MadeinChina2025"plan,hasputforwardanationalpassengervehicleaverageFCratetargetof5.0L/100kmby2020and4L/100kmby2025.
Inthe"ChinaMotorVehicleEnvironmentalManagementAnnualReport(2017),"releasedlastyearbyChina’sMinistryofEnvironmentalProtection(MEP),itisnotedthatmotorvehiclesaccountfor30%-40%of urban PM2.5pollutants in Beijing, Shanghai, Hangzhou, Guangzhou, Shenzhen andothermajorcities.Passengercarsinparticularareapredominantsourceofcarbonmonoxide(CO)andhydrocarbons(HC)pollutants,reaching49%and40%,respectively.
Figure3:2006-2016productionandimportvolumeofChinaPassengerCars
1 http://data.stats.gov.cn/easyquery.htm?cn=C01&zb=A0G0J&sj=2016
0
500
1000
1500
2000
2500
3000
2006 2007 2008 2009 2010 2011 2012 2013 2014 2015 2016
Unit,10k
PassengerVehicleProduction
PasssengerVehicleImport

-13-
2. CHINA’SPASSENGERCARSFUELCONSUMPTIONSTANDARD
2.1PassengercarsfuelconsumptionstandardsystemAt the coreofChina's vehicleFC standard is the conceptof limitations and targets, energyconsumption labeling, and technical guidelines, as detailed in Table 1. It is a weight-binstandard(unliketheUS),measuredinL/100km(notbyCO2,asenactedintheEUandUS),anditisbasedontheNEDCtestcycle(yetthedevelopmentofanewChinacycleisunderway).SinceChinastartedtheimplementationofapassengervehicleFCstandardin2005,itunderwentfourphases, the lastoneentered intoeffect in2016.Thedevelopmentof thestandardregime isoutlinedinTable2.
Table1:China’sPassengerCarFuelEconomyStandards
Type TitleandYearissued Enforcementlevel
Testingstandards
Measurementmethodsoffuelconsumptionforlightdutyvehicles(GB/T19233-2008)
Voluntary
Testmethodsforenergyconsumptionoflight-dutyhybridelectricvehicles(GB/T19753-2013)
Voluntary
Labelstandard
Energyconsumptionlabelforlightvehicle–Partone:gasolineanddieselvehicles(GB22757.1-2017)
Mandatory
Energyconsumptionlabelforlightvehicle–Part2:electricitypoweredvehicles(GB22757.2-2017)
Mandatory
Mandatorystandards
Fuelconsumptionlimitsforpassengercars(GB19578-2014) MandatoryFuelconsumptionevaluationmethodsandtargetsforpassengercars(GB27999-2014)
Mandatory
EVsenergyconsumptionlimit* VoluntaryOthervoluntarystandards
Conversionmethodsforenergyconsumptionofhybridelectricvehicles*
Voluntary
Off-cycletechnology/deviceenergysavingeffectsevaluationmethodsforpassengercars*
Voluntary
*Standardsunderdevelopment.
Table2:China’sBy-PhaseFuelConsumptionStandards
Phase Timeframe Title Comments
PhaseI
2005.07-2008.01newmodelslimit2006.07-2009.01inproductionmodelslimit
GB19578-2004SinglevehicleFClimit(Importedvehiclesnotincluded)
PhaseII
2008.01-2012.07newmodelslimit2009.01-2012.07inproductionmodelslimit
GB19578-2004

-14-
PhaseIII
2012.07-2015.12limitsimilartoPhaseII2012.07-2015.12newCAFCintroduced
GB19578-2004GB27999-2011
SinglevehicleFClimitandcorporateaverageFCtarget;(Importedvehiclesincluded);Includingimportedvehicles.
PhaseIV
2016.01-2020.12newmodelslimit2018.01-2020.12inproductionmodelslimit
2016.01-2020.12 CAFC targetandlimit
GB19578-2014GB27999-2014
SinglevehicleFClimitandcorporateaverageFCtarget;(Importedvehiclesincluded);Includingimportedvehicles.
The standard requirement intensified with each phase. For example, the third standardrequirementwas20%morestringent thanthoseof thesecondphase,and the fourthphaserequirementsare30%-40%morestringentthanthoseofthethirdphase.
Figure4:China’sby-phaseCAFCstandarddevelopment
3.0
4.0
5.0
6.0
7.0
8.0
9.0
10.0
11.0
12.0
13.0
14.0
15.0
16.0
17.0
500 700 900 1100 1300 1500 1700 1900 2100 2300 2500
FuelConsumption(
L/100km)
CurbWeight(kg)
phaseIIIFClimitforMTphaseIIIFClimitforATphaseIIIFCtarget&phaseIVFClimitforMTphaseIIIFCtarget&phaseIVFClimitforATphaseIVFCtargetforseatrows<3phaseIVFCtargetforseatrows>=3

-15-
2.2ThefourthphaseofChina’sFCstandardThefourthphaseisaimedatachievinganationalaverageFCtargetof5L/100kmby2020.Thestandardisheavilyinvestedintheactualvalue(versusthetargetvaluegap)ofthecorporateaveragefuelconsumption(CAFC)rate,Itsaimistoachieveazerogapby2020,asshowninTable3.
Table3:CAFC/TCAFC-IVRequirementforCarProducersandImportersDuringPhaseIV
Year Requiredratio (CAFC/TCAFC-IV)
NationalFCtarget(L/100km)
2016 134% 6.7
2017 128% 6.4
2018 120% 6.0
2019 110% 5.5
2020 100% 5.0
NewEnergyVehicles(NEVs)wereincorporatedintoChina’sCAFCaccountingprocessaspartofthe
“flexibilitymechanism”designedtosupportanincreasedrateoftargetrealization.Accordingtothe
flexibilitymechanism,NEVsarecountedasseveralvehiclesofwith0L/100kmasdetailedinTable
4. Off-cycle technologies (e.g. idle start-stop devices, shift reminders, efficient air conditioning,
brakeenergyrecovery,etc.)arealsoeligibleforFCdiscountstypicallycountedas0.5L/100km.
Table:NewEnergyandEnergySavingVehicleProductionPrivilegeinCAFCCalculation(productionvolume
multiplier)
PEV FCV PHEV* ESV**
~2015 5 5 5 32016-2017 5 5 5 3.5
2018-2019 3 3 3 2.52020 2 2 2 1.5*Plug-inelectricvehicles(PHEVs)aredefinedascarswithelectricrangeofatleast50km.
**EnergySavingVehiclesaredefinedascarswithafuelconsumptionratelowerthan2.8L/100km.
China'spassengercarenergyefficiencystandardhasevolvedandmaturedoverthepastdecade.PhaseVofthestandardiscurrentlyunderway,aswellasthedevelopmentofaChinadrivingcycle,bytheleadautostandarddrafter-ChinaAutomotiveTechnologyandResearchCenter(CATARC).

-16-
3. CHINA'S FUEL CONSUMPTION AND NEW ENERGY VEHICLE DOUBLE INTEGRALMANAGEMENT
China'sCAFC regimemanagement relieson reportingandgovernmentverification,by-companyperformance release, production suspension, and set increasingly stringent CAFC/Tcafcperformancetarget(seetable3).Theambitioustargets--5.0L/100kmby2020and4.0L/100kmby2025–illustratestheseriousnesswithwhichthegovernmentintendstopursueimplementationand enforcement. This chapter reviews the CAFC system, including the newly announced NEVcredits,aswellasananalysisoftheprosandconsofthepolicy.
3.1Requirements
Eachmanufacturerexceeding2,000vehiclesperyearisrequiredtomeettheby-vehiclestandard
limit(weight-binbased)aswellasacorporateaverageFClimitandacertainpercentageoftheCAFC
target.Forthelatter,creditscanbeaccumulatedifsuccessful,or,ifpercentagetargetisn'tmet,the
manufacturercanpurchaseexcesscreditswithinthecomplianceyear.
Inordertoachievethesetargets,China’sMinistryofIndustryandInformationTechnology(MIIT)
enables more benefits from the shift to NEVs– not only the above explained NEV flexibility
mechanism(seeTable3andTable4),butalsoanewNEV-creditssystemhasbeenintegratedinthe
CAFCmanagementlastSeptember.2
Manufacturersofover30,000vehiclesperyeararerequiredtoproduce10%and12%newenergy
vehicles in 2019 and 2020, respectively.Manufacturers that fail tomeet theannual compliance
requirement are required to purchase credits from manufacturers with excess credits to
compensate.
3.2Fuelconsumptionandnewenergyvehicleintegratedaccounting
(1) CAFCactualvalueandtargetvalueaccounting
China’sCAFCusesvehiclemodel,year,andannualsalesdatatocalculateaweightedaverage
for FC based on theNewEuropeanDriving Cycle (NEDC). The CAFC target is based on
individualvehicleFCtargets,whichusethequantityofannualproductionforeachmodel
tocalculateaweightedaverage.BothCAFClimitsandtargetsarecalculatedasshowninthe
formulasbelow:
2 Corporate Average Fuel Consumption and New Energy Vehicles Credits Joint Management Method report released. http://www.icet.org.cn/english/admin/upload/2017102642532337.pdf
1
1
N
i iiN
i ii
FC VCAFC
V W
=
=
´=
´
å
å
N
i ii=1
N
ii=1
T V
VCAFCT
´=å
å

-17-
Whereas: N:thevehiclemodelnumberFCi:fuelconsumptionofthe“i”thmodelVi:annualproductionofthe“i”thmodel|Wi:productiontimesofthe“i”thmodel,if“i”thmodelisqualifiedNEVorESVTi:fuelconsumptiontargetofthe“i”thmodel
(2) CalculationoftheintegratedCAFCandNEVcredits
China’sCAFCPhase IV introducedan integrateddualmanagement thatenables theexchangeof
CAFCNEVsupercredits(differencebetweenthetargetandactualCAFC).
CCAFC=(a´TCAFC-CAFC)´TP
Where:CCAFC-passengercarcorporateaveragefuelconsumptioncredits; TCAFC-passengercarcorporateaveragefuelconsumptiontargetvalue;
CAFC-Passengercarcompanyaveragefuelconsumptionactualvalue; a—annualaveragecorporatefuelconsumptionrequirement(%); TP-passengercarproduction(excludingexports)orimports.
CAFC and NEV credits will be calculated independently. Corporate CAFC and NEV credits
performancewillalsobeevaluatedseparately.YetCAFCcanbeoffsetbyNEVcredits,asillustrated
inFigure5.Theratiooftradingis1:1.
Figure5:Dual-scheme–NEVsupercredits(CAFCcredits)andNEVcreditscalculationmethod
Companiesproducingorimportingover30,000passengercarsperyearareobligedtocomplywith
theNEVcreditsrequirement,anannualNEVversusICEproduction/importationratioof10%and
12%in2019and2020,respectively.The2021ratiotargetwillbedeterminedinthefuture.Credit
calculationsperdifferentvehicletechnologiesisspecifiedinTable5andpresentedFigure5,witha
maximum of five credits per vehicle. The credit calculations are based on range and power
consumption,asexemplifiedforBEVsinFigure6,andforFCVsinFigure7.Pureelectricvehicles
CAFCcredit
NEVcredit
CAFC actualvalue
CAFC standardvalue� a� TCAFC target
value�
CAFCactualvalue
CAFC standardvalue� a� TCAFC target
value�
CAFC surplus=�a´TCAFC -CAFC�´TP
CAFC deficit=�a´TCAFC -CAFC�´TP
NEVcredit pervehicle
Productionof
traditionalcar
NEVProductionofthetype
Proportiontarget
�
�
� �NEV
creditactualvalue
� � NEVcredittargetvalue
Compare
NEV surplus=NEVactualvalue- targetvalue
+
-NEVdeficit=NEVtargetvalue- actualvalue
1:1offset

-18-
models,forexample,receivecreditsaccordingtoelectricenergyconsumption(kW-h)andvehicle
curbweight(referencebase),usingafactorof0.5,1,or1.2.FCVsreceivecreditsbasedontheirrated
powerusingafactorof0.5.
Table4:Creditscalculation
Passengervehicletype
Creditscalculationrequirement
Comments
BEV 0.012×R+0.8 (1) R is calculated according to the joint (urban andsuburban)drivingcycle(measuredbykm).(2)Pistheratedpowerofthefuelcellsystem,inkW (3)Theuppercreditslimitis5points.(4) Credit calculation results are rounded to twodecimalpoints.
PHEV (REEVincluded)
2
FCV 0.16×P
Technologicalspecificationsavailableinreferences.3
Figure6:PEVsandPHEVscreditsaccumulationgraph
3 Technologicalbenchmark:
(1)BEVs:Therequirementisfora30-minutesmaximumdrivespeedofnotlessthan100km/h,andpureelectric
modedrivingrangeofnotlessthan100km.
(2)Thecreditsenableddependontherelationshipsbetweenenergyconsumptionandthevehiclecurbweight(m)
in the followingmanner:ForY1, ifm≤1000kg,Y1≤0.014×m+0.5;if 1000<m≤1600kg,Y1≤0.012×m+2.5;if
m>1600kg,Y≤0.005×m+13.7.ForY2,ifm≤1000kg,Y2≤0.0098×m+0.35;if1000<m≤1600kg,Y2≤0.0084×m+1.75;
ifm>1600kg,Y2≤0.0035×m+9.59.Ofwhich,YstandsforenergyconsumptionandMstandsforthecurbweightof
BEVs.
(3)PHEVs:theminimaldrivingrangeforcrediteligibilityis50km;
PHEVs:whenminimalrangeis80kmorless,theenergyconsumption(GB19578)shouldbelessthan70%ofthe
standardlimit.Otherwisecreditswillbereducedto50%oftheformula.
CreditsfromPHEVsofmorethan80e-rangebutwithlowerenergyconsumptionthanthestandardlimitcannotbe
exchanged.
(4)FCVs:Therequirementtargetsfuelcellsystemratedpowertohavenotlessthan30%oftheratedpowerofthedrivemotor,andnotlessthan30kW.Failuretomeetthisrequirementenablesonly50%ofthecreditsanddisablescreditexchange(ownuseonly).
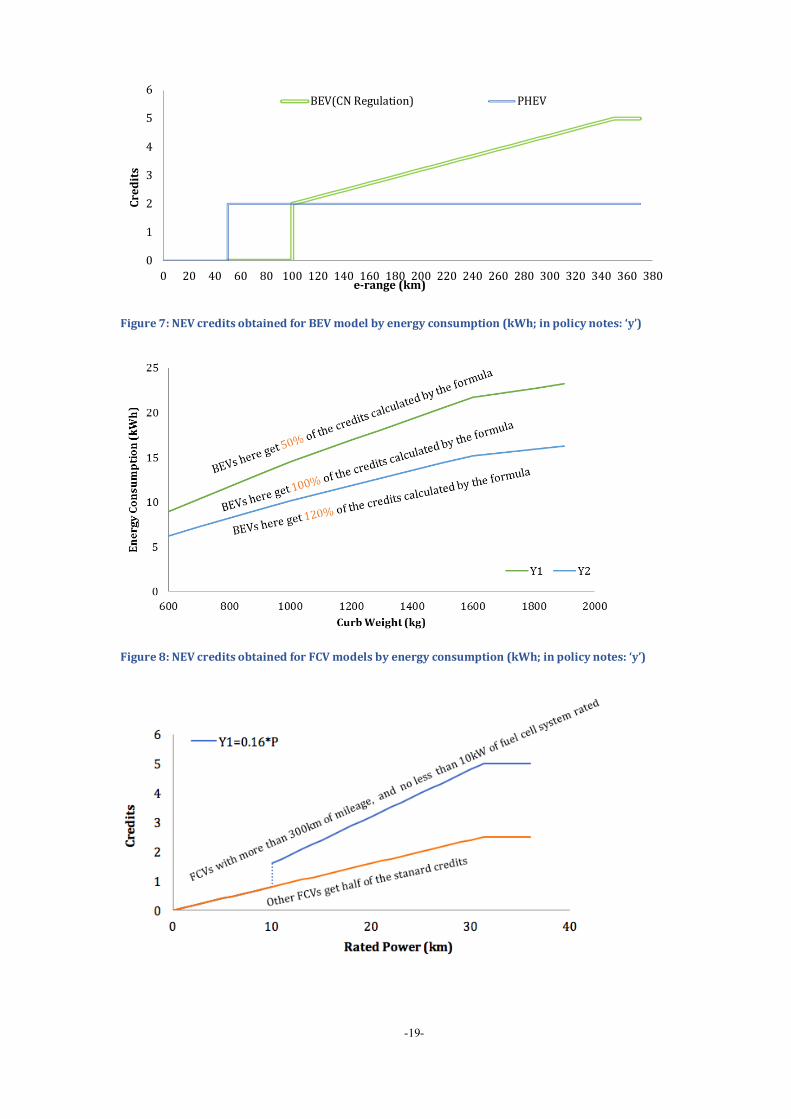
-19-
Figure7:NEVcreditsobtainedforBEVmodelbyenergyconsumption(kWh;inpolicynotes:‘y’)
Figure8:NEVcreditsobtainedforFCVmodelsbyenergyconsumption(kWh;inpolicynotes:‘y’)
0
1
2
3
4
5
6
0 20 40 60 80 100 120 140 160 180 200 220 240 260 280 300 320 340 360 380
Credits
e-range(km)
BEV(CNRegulation) PHEV

-20-
3.3Creditstradingmechanism CAFCandNEVnegativepointsmustbecompensatedforannually.AnexcessofCAFCcreditscanbe
carriedforwardthreeyears,whileNEVexcesscreditscannot(theycanbecarriedforwardoneyear
from2019,asagraceperiod).ThisisillustratedinFigure9.
Figure9:Creditsexchangemechanism,includingNEVSsupercredits(CAFCcredits)andNEVcredits
iCET believes thismechanism is threatening FC rate improvements for ICE vehicles. Given the
alreadylargeflexibilityofCAFCimplementationthroughsupercredits(25%),acombinationofthe
systemisnotuseful.iCEThasbeenanadvocatorforNEVcreditssystemsince2013,yetbelieves
suchasystemshouldbedirectlylinkedtocarbonemissionreductionsandmaintainindependence
fromothersystems.GiventhedifficultiesofmonitoringandenforcingtheCAFCsystemitisunwise
tofurthercomplicationthesystembyintegratingNEVcredits.
3.4CreditsmanagementMIIT,MinistryofFinance(MOF),MinistryofCommerce(MOFCOM),andGeneralAdministrationof
Customs,theStateAdministrationofQualitySupervision,Inspection,andQuarantine(AQSIQ)will
jointlyenforcethe“average fuelconsumptionofpassengercarsandnewenergyvehicle integral
management.”The first twowill oversee the enforcementof domesticmanufacturers,while the
lattertwowillsupportdocumentationsubmissionofimporterstotheformertwo.Thegoverning
entitiesandtheirresponsibilitiesarelistedinFigure10.
MIITwillestablishavehicleFCandNEVintegratedinformationmanagementplatform,including
thesummaryandpublicationofFCandNEVrelatedinformation.Automakersandimporterswill
promptlyreporttheirvehicleproductionandimportationvolumesaswellasvehicleFCtoMIIT–
CAFCcreditsystem
CAFC deficitNEVdeficit
NEVCreditsystem
CAFC surplus
CAFCpreviousyearscreditsurplus,bycompany
CAFCsurplusfromaffiliatedgroupcorp.
NEVsurplusproducedthisyear,bycompany
PurchasingNEV surplus
NEVsurplusBankingofcreditsfornextyearscommitment
Transferofcreditstoaffiliatedcorps(25%ownership)
NEVdependent market�freetrade�
Note�NEVsurpluscreditcan’tbebankedNote�CAFCsurpluscreditcanbebankedforthreeyears
AutoMakers
1:1offset
Purchasetooffset
Offset
Usefor

-21-
aslistedinAppendixIofRegulation.4 Thereportingwillincludeby-vehiclecalculationsperformed
bytheautomakersthemselves.
Figure10:NEVsupercredits(CAFCcredits)andNEVdualnetworkmanagement
Penaltiesincludetheseizureofvehicleproductionorimportationandtheissuingofapublicnotice
(“shaming”approach),summarizedinFigure11.Enforcementwillbepursuedinaccordancewith“Automobile Industry Development Policy” 5 and the “Mandatory Product Certification
ManagementRegulations.”6
Figure11:CACmanagementenforcementinstruments
3.5DifficultiesandChallengesonenergyefficiencymanagementAtpresent,therearenearly100passengercarmanufacturers inChinaandnearly30 importers.
Over2,900newmodelswereaddedtoMIIT’sFuelEconomywebsitein20167.Thehighvolumeof
4 http://zqyj.chinalaw.gov.cn/draftDetail?listType=2&DraftID=1894&1497592757400
5 http://www.miit.gov.cn/n1146295/n1146557/n1146624/c3554600/content.html
6 http://www.cnca.gov.cn/cnca/rdht/qzxcprz/flfg/193003.shtml
7 ChinaAutofuelConsumptionofficialwebsite(中国汽车燃料消耗量网站).http://chinaafc.miit.gov.cn/
CAFC
NEVcredit
Creditinstitutionalmanagement
Creditmanagementplatform
MIIT(Lead)
MOF
MOC
GACC
AQSIQ
VerifyPVimportvolume
Verifydomesticpassengervehicle(PV)producer,fuelconsumptionofPV,newenergyPVindex,andproductionvolumeofPV
VerifyPVimportingofsupplycompany
VerifyfuelconsumptionofimportPV,andimportnewenergyPVindex
Notification
��Notification��Publicannouncementofincompliantcompanies(‘shaming’)
Rectification
��Notifyrectificationprocesses,forconductingscrutinyofcompanyreporting
Suspension
��Suspendmanufacturing��suspendcertificationissuance
Otherpenalties
��Other(monetary)penaltiesmayapply

-22-
vehiclesandnewmodelscreatesenormousenforcementchallenges.Thedualmanagementscheme
governingbothCAFCand thenewNEVcreditssystem is increasing thepressuresongoverning
entities,asillustratedinFigure12.
Figure12:ComplexstructuretoChina’sautoregime
ThegoverninginstitutionalstructureofCAFCandNEVcreditsiscomplex.ItincludesseveralMIIT
departments, the National Development and Reform Commission, the Ministry of Finance, the
Ministry of Commerce, the General Administration of Customs, the General Administration of
QualitySupervision,InspectionandQuarantine,andothergovernmentagencies.Thiscomplexity
increasescoordinationchallengesandhindersprospectsforadequateenforcement.
Chinamadegreateffortstodevelopenergy-savingandnewenergyvehicles,andisinaperiodof
industrial restructuring. Based on iCET’s decade of analysis and research on fuel consumption
standardsandtheirdevelopmentandimplementationinChina,itisadvisedthat:
(1)Companiesbegivenaclearlong-termcomplianceplan,thatwouldsupportthedevelopmentof
competitiveproducts.
(2)Alleconomicmechanisms(penaltiesinparticular)beclear,significant,andenforced.
4. COMPARISONBETWEENCHINA’SNEVCREDITSANDCALIFORNIA’SZEVCREDITS
Inspired by the California’s 1990 ZEV regulation, which has beenmodified multiple times and
adoptedinnineotherUSstates,ChinareleaseditsownadjustedversioninSeptember2017,which
DomesticproducerA
DomesticproducerB
Shareholding≥25%
DomesticproducerA DomesticproducerB
DomesticthirdpartyShareholding
≥25%Shareholding≥25%
ImportsupplierA DomesticproducerB
Shareholding≥25%
OverseasproducerAuthorizing
CompanyA
CompanyB
CompanyC
Shareholding≥25%
Shareholding≥25%

-23-
enteredintoeffectin2018.8 TherearesignificantdifferencesbetweentheZEVcreditsystems,as
showninFigure13andFigure14.
Figure13:ComparisonbetweentheChinaandCaliforniaNECcreditsmanagementmechanisms
Figure14:ComparisonbetweentheChinaandCaliforniaNEVcreditpolicydesign
Figure15:BEVcreditcomparisonsbetweenthenewNEV-creditsdraftandZEVcreditregulationinCalifornia
8 Corporate Average Fuel Consumption and New Energy Vehicles Credits Joint Management Method Regulation http://www.icet.org.cn/english/admin/upload/2017101337455653.pdf
Goal
Scale
Requiremt
Trading
Credits
Penalty
Apost-subsidyregulatoryinstrumenttoforcethetechnologicaltransitiontoNEVs.
Economicinstrumentforadvancingtechnologicaltransitionaimedatcurbingcarbonemissions.
National IntroducedbyCalifornia,witheightotherstatesthatfollowed,enablingintra-statetransfer.
MinimalNEVpercentageproductionrequirementoftotalannualproduction.
MinimalNEVpercentagesales requirementoftotallocalsales.
Oncerequirementismet,excesscreditscanbeobtained. Oncerequirementismet,excesscreditscanbe
obtained.NEVcreditscanbesold(followingnon-transparentnegotiationbetweencompanies)orbanked.
NEVcreditscanbesold,butnottransferredorbanked.
Administrativemainly:productionsuspensionandpublicannouncement(“shaming”)ofnon-compliantcompanies.
Economic:non-compliantcompaniespaypenaltiesandtheircreditsshortageforwardedtothefollowingyear.
JointMngtwithCAFC
Yes No
China’sNEVcredits,partofCAFCregime California’sZEVcredits (independent) regulation
2019-10%,2020-12%,2020-andbeyondTBD. 2018-4.5%with2.5%percentpointsaddedannuallyto22%in2025.
Compliance
CompanySize
Creditstypes
Creditsexpiration
Creditstransfer
Basedonsameyearproductiondata. Averageofpastthreeyears(excludingthepreviousyear);
Productionvolumeof30,000carsormore. Productionexceeding4,500.
NEVcredits,comprisedofPEVs,FCVsandPHEVs.
ZEVcreditscomprisedofaminimumofZEVs(FCVs,PEVs)andgraduallydecreasingmaximumoftransitional-ZEVs(TZEVs);Creditscanonlybeusedinthesameyear,
cannotbebanked(excludingoneyeargraceperiodfor2019credits).
Creditscanbeforwardedandcompensatepartiallyforfuturerequirement;
Excesscreditscanbesoldorcarriedforward.Shortfallofcreditsneedstobecompensatedthroughfineandforwardyearcreditscompliance,orsameyearcreditscompliance.
ExcesscreditscanbetransferredtocompensateforCAFCrequirements.Shortfallmustbemetwithinthesameyear.
Creditsrequireme
nt
China’sNEVcredits,partofCAFCregime California’sZEVcredits (independent) regulation

-24-
Figure16:CombinedcyclecreditresultsforsevenBEVsmodelsunderNEV-creditsdraftandZEV-credits
systemcompared
Figure 17: PHEV credit comparisons between the new NEV-credits draft and ZEV credit regulation in
California
0
1
2
3
4
5
6
70 110 150 190 230 270 310 350 390 430 470 510 550 590
Credits
e-kmCNMIITRegulation US(California)Regulation
560
5.28
3.82
5
3.812
2.72
5
2.688
2.38 2.132.7
2.08 1.5
4
1.25
BYD-Qin BAIC-EU260 Denz JVC-IEV6s Lifan330EV ModelS CheryQQ3EV
ChinaNEVcredit CaliforniaZEVcredit
YNEV=0.012×X+0.8
YZEV=0.01× X /1.6+0.5

-25-
Figure18:ComparisonbetweencreditsfromsevenPHEVsmodelsunderNEV-creditdraftandZEV-credit
system
0
0.5
1
1.5
2
2.5
0 50 100 150 200
Credits
e-km
USPHEVs USPHEVs≥10milesofAERonUS06tetcycle CNPHEVs
0.93
0.68 0.61 0.680.80
1.001.10
2 2 2 2 2 2 2
BYDTang RoeweRX5 Arrizo7e Roewee950
BYDSong VELITE BMWi3
USRegulation CNRegulation

-26-
5. CURRENTSTATUSANDTRENDSFORPASSENGERCARFCINCHINA
5.1ReportedFCvaluelargelyunchangedAccordingtotheMIITin2016,theaverageFCrateofdomesticandimportedcarswas6.51L/100km
and 7.89L/100km, respectively. Comparedwith the 2015 average FC rate of 7.04L/100km, the
reportedannualaverageof6.56L/100kmin2016showsadecreaseof0.16L/100km(33%)thatcan
be attributed to vehicle energy efficiency improvement and 0.32L/100km (67%) that can be
attributedtoNEVsupercredits(theflexibilitymechanism).
Figure19:China'saverageFC-MIITreported,NEVandenergysavingtechnologiescontribution
AfterenteringtheFCstandardimplementationphaseIVin2016,therateofnon-complianceamong
domesticandimportingcarcompaniesreachedabout30%and50%respectively.In2015,thenon-
compliancerateforimporterswasamere4%,indicatingthefuelsavingapplicationinmanyauto
companiesdidnotcatchupwiththestringentstandardrequirements.
Figure20:Bycorporatetype-PhaseIVcompliance
20157.04L/100km
ICEtechnologyimprovement0.16L/100km NEVpreferenceaward
0.32L/100km
20166.56L/100km
5.00
5.50
6.00
6.50
7.00
7.50
L/100km
33%
67%
0102030405060708090100
DomesticManufacturers Importers
automakersnum
ber

-27-
Althoughmanyenterprisesdidnotmeetthestandard,theactualFCrateofthepassengervehicle
industry in 2016 had a value-to-target ratio of 132%, lower than the required ratio of 134%,
highlightedinFigure21.AfterincorporatingNEVreductionstoCAFC,theratiogoesevenlowerto126% -beatingthe2017value-to-target ratioof128%ratiooneyearearlier.This indicates the
standardiscurrentlynotstringentenough.
Figure21:2016companiesreportedversustargetvalue
In2016,asmanyas2,906new(M1class)domesticmodelswereaddedtotheMIIT’sfueleconomy
website, indicating there was huge opportunity for improvements in corporate fuel savings.
However, only 400models in 2016 reached the target, accounting for 15%of the totalmodels,
demonstratedinFigure22.Goingforward,thepolicyregimewillclearlyneedtoplayabiggerroleintheadoptionoffuelsavinginitiatives.
Figure22:ReportedFCof2016M1passengervehicles
132% 131%
135%138%
132%
124%
130%
112%
127% 124%
100%
110%
120%
130%
140%
Domestic JVBrand IndependentBrand
Import NationalAverage
CAFC/TCAFC(excludingNEV) CAFC/TCAFC(includingNEV)
3.04.05.06.07.08.09.010.011.012.013.014.0
500 700 900 1100 1300 1500 1700 1900 2100 2300 2500
L/100km
curbweight(kg)
PhaseIVMTPhaseIV-ATPhaseIVtarget<3RowsPhaseIV>3Rows2016models

-28-
Note:PhaseIVofCAFCofficiallyenteredimplementationin2016.
5.22016CAFCcompliancestatus Among the top 10 selling domestic automakers, GreatWall Motor, Chang'an Changan andChanganForddidnotmeetthevalue-to-targetrequirementratioof134%.FAW-Volkswagen,ontheotherhand,reached125%value-to-targetratio,wellaheadthe2017requirements(seeFigure22).NEVproducers,however,achievedasubstantiallylowerratio:asmanyassixsuchmanufacturers were able to reach the 2020 target in 2016. That said, most of thesemanufacturerswouldperformpoorlyifitwasn’tfortheuseoftheNEVflexibilitymechanism,e.g. JiangnanAutomobile, JAC(seeFigure24).Both independentand importerswouldhavefailedtomeetthetargetifitwasn’tfortheNEVsupercreditoption(seeFigure25).
Figure23:Top2016averageCAFCperformingdomesticmanufacturers
Note:Thesizeofthebubblerepresentscomparativeannualproductionvolume.
Figure24:Domestic2016CAFCincomparisontoChina’s2020target
116%
122%
128%
134%
140%
146%
6.0 7.0 8.0 9.0 10.0 11.0
CAFC/Tcafc
CAFC,L/100km

-29-
Note:Onlyautocompanieswithannualproductionexceeding100,000carsareincluded;Thesizeofthebubblerepresentscomparativeannualproductionvolume.
Figure25:By-corporatetypeCAFCcomparisonwith/withoutNEVcredits
The top 10 importing car companies’CAFCactual-to-target ratiowas relatively scattered; threecompanieshadaratiohigherthan140%,whilesomeachievedthe2017ratioaheadoftime(e.g.BMW,Porsche),asshowninFigure26.
Figure26:Importers’2016CAFCinrelationto2016and2017target
0%
20%
40%
60%
80%
100%
120%
140%
2.0 3.0 4.0 5.0 6.0 7.0 8.0
CAFC/Tcafc
CAFC,L/100km
0%20%40%60%80%100%120%140%160%
BYD-Autoindustry
BYD-Auto
BAIC-Motor
Jiangnan-Motor
Geely-Motor
SAIC-Motor
Chery JAC
Geely-Dihao
Brilliance-BMW
CAFC/Tcafc(includingNEV) CAFC/Tcafc(exculdingNEV)

-30-
Note:Thesizeofthebubblerepresentscomparativeannualproductionvolume.
5.3FuelconsumptiontrendsChina'sfuelconsumptionstandardssawanaverageannualdropof1.7%and2.7%from2006to2016throughoutthe implementationperiodof its three firstphases,respectively.From2012to2016,theaverageannualdeclineintheFCrateforimportedcarswas3.7%,significantlylowerthanthatofdomesticvehicles,whichsawanaveragedeclineof2.2%.Theannualaveragedeclineoverthesameperiodwas2%(seefigure27).JVsandindependentmanufacturersCAFCdecreasedby2.2%and1%from2006to2016,respectively(seefigure28).
Figure27:ImportersanddomesticCAFCdevelopment
Note:NEVflexibilitymechanismexcluded,onlyICEFCcalculationincluded.
Figure28:Importer2016CAFCinrelationto2016and2017target
120%
125%
130%
135%
140%
145%
6.0 6.5 7.0 7.5 8.0
CAFC/Tcafc
CAFC,L/100km
6.0
7.0
8.0
9.0
10.0
11.0
12.0
2006 2007 2008 2009 2010 2011 2012 2013 2014 2015 2016
L/100km
DomesticManufacturers(JVs+Indp') Importers

-31-
Note:NEVflexibilitymechanismexcluded,onlyICEFCcalculationincluded.
ThereisampleevidencethatitistheincreaseinvehicleweightthatslowsFCreductions.Between2006and2016,domesticvehiclecarcurbweightincreasedby160kg(13%),ofwhichindependentcarsweight increasedbyasmuchas258kg(22%),asshowninFigure29.Becauseeach100kgincreaseincurbweightisequivalenttoaFCincreaseofabout0.3-0.6L,China’svehiclecurbweightincrease led to 0.5-1L/100kmFC increase. Domestic vehicle averageweight increase led toFCincrease of 0.7-1.5 L. Luckily, domestic car power and displacement also continued to increase(whilethatofimportedcarsstabilized),absorbingsomeoftheweight-basedFCincrease.
Figure29:By-corporatetypecurb-weight(kg)developmenttrend
Inaddition,theratedpowerofdomesticpassengercarscontinuestoincrease.Theratedpowerofjoint-ventureand independent brands between 2009 and 2016 increased from17kW to 33kW,respectively,asshowninFigure33.
Figure30:By-corporatetypepower(kw)developmenttrend
6.0
6.5
7.0
7.5
8.0
8.5
9.0
2006 2007 2008 2009 2010 2011 2012 2013 2014 2015 2016
FuelConsumption,L/100km
JVs IndependentManufacturers
1100
1300
1500
1700
1900
2009 2010 2011 2012 2013 2014 2015 2016
CurbWeight,
kg
JVs Independent Importers

-32-
5.4BrandFCperformance SixautomakersthatachievedthesteepestCAFCdecline,reaching24%to39%,arelistedinfigure26.Amongthese,NEVswereaninstrumentalCAFCreductionpathwayforGeelyAutomobileandSAIC (Geely Zhidou and Dihao EV production reached 40,000, SAIC Roewe plug-in hybridproductionwas22,000).GAC,ontheotherhand,focusedonfuelsavingflagshipmodelproduction(Chuan Qi GS4 with 6.3-6.7L/100km, which reached 336,000 sales). Beijing Benz, GuangzhouAutomobile and Tianjin FAW Toyota also focused on fuel saving technology integration (e.g.lightweighttechnology,idlestop-start,superchargeddirectinjection,advancedtransmission).
Figure31:TopperformingcompaniesinCAFCreductionbetween2012and2016
Amongimportingbrands,PorscheandVolvosawthelargestFCdecreaseofover30%between2012and2016,asillustratedinFigure32.Porsche’scorporateFCratedroppedfrom9.12L/100kmin2015to7.71L/100kmin2015,down15.4%.Inpart,thisisaresultofhighimportationofPorscheCayenne,theflagshipofthecompany’ssmallandlowFCcapacities.GreatWallMotorandChanganAutomobile,aretheleadersofCAFCincreaseasillustratedinFigure33,likelyduetotheirstrategicfocusonlargeengineandSUVmarkets.
50.0
60.0
70.0
80.0
90.0
100.0
110.0
2009 2010 2011 2012 2013 2014 2015 2016
power,kw
JVs IndependentCooperation
3.0
4.0
5.0
6.0
7.0
8.0
9.0
10.0
Geely
SAIC-Moter
GAC-Moter
BAIC-Benz
GAC-Toyota
FAW-Toyota-…
CAFC
,L/100km
2012 2013 2014 2015 2016

-33-
Figure32:TopperformingimportersinCAFCreductionbetween2012and2016
Figure33:GreatWallMotorsandChanaAutoCAFCtrends
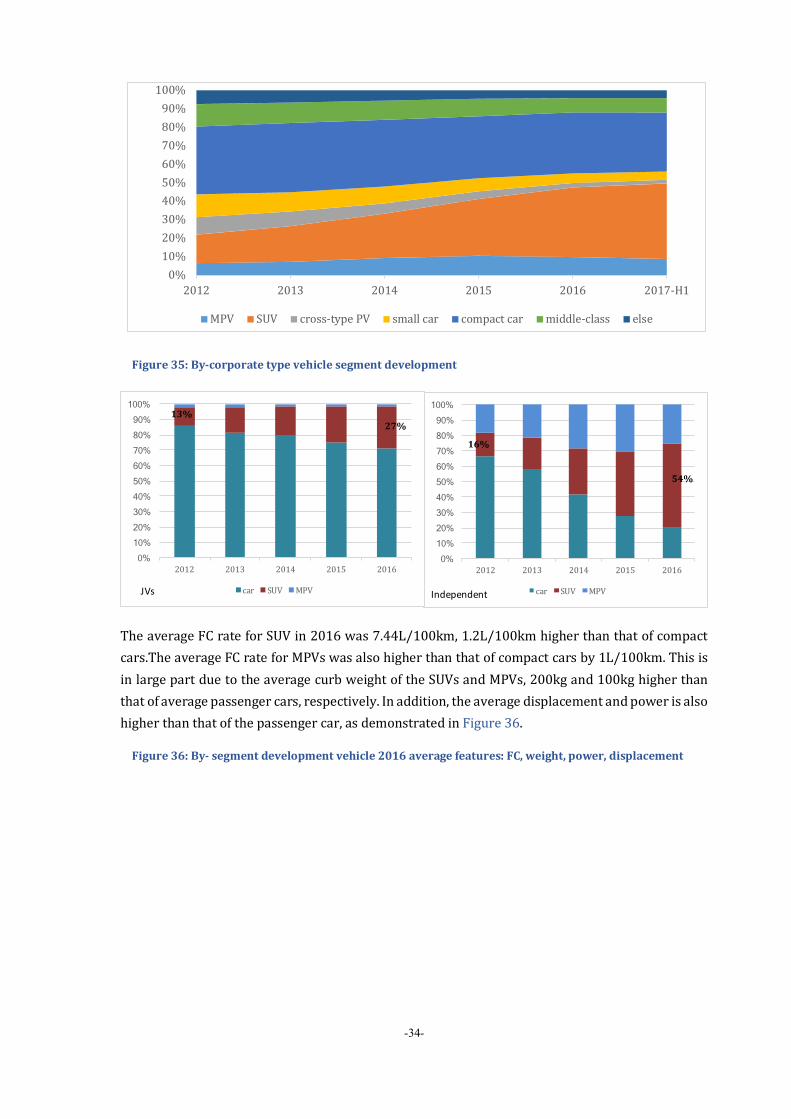
5.5ImpactofSUVandMPVmarketexpansiononChina’snationalFCperformance Whilecompactcarssawlessthan4%growthin2016,SUVandMPVsalesincreasedbyover40%and20%(respectively)forfourconsecutiveyears,erodingthemarketshareofsmallandcompactcar.In2016,SUVsandMPVsaccountedfornearlyone-halfoftheentirepassengercarmarket,asillustratedinFigure34.
SUVmarketshareincreasedfrom15%in2012toover40%in2016.MarketshareofindependentSUVsinparticular,increasedfrom16%to64%,whileJV’sSUVsmarketshareincreasedfrom13%to27%,duringthisperiod–asshowninFigure35.
Figure34:By-segmentmarketsharedevelopment
-32% -30% -19% -13% -13% -13%
5.0
6.0
7.0
8.0
9.0
10.0
11.0
12.0
Porsche Audi Volvo BMW Audi Nissan
CAFC(L/100km)
2012 2013 2014 2015 2016
7.12
6.83
7.11
7.67 7.64
6.58 6.56 6.66
7.017.21
6.0
6.4
6.8
7.2
7.6
8.0
2012 2013 2014 2015 2016
CAFC
,L/100km
GreatWallAuto ChanaAuto
-34-
Figure35:By-corporatetypevehiclesegmentdevelopment
TheaverageFCrateforSUVin2016was7.44L/100km,1.2L/100kmhigherthanthatofcompactcars.TheaverageFCrateforMPVswasalsohigherthanthatofcompactcarsby1L/100km.ThisisinlargepartduetotheaveragecurbweightoftheSUVsandMPVs,200kgand100kghigherthanthatofaveragepassengercars,respectively.Inaddition,theaveragedisplacementandpowerisalsohigherthanthatofthepassengercar,asdemonstratedinFigure36.
Figure36:By-segmentdevelopmentvehicle2016averagefeatures:FC,weight,power,displacement
0%10%20%30%40%50%60%70%80%90%100%
2012 2013 2014 2015 2016 2017-H1
MPV SUV cross-typePV smallcar compactcar middle-class else
0% 10% 20% 30% 40% 50% 60% 70% 80% 90%
100%
2012 2013 2014 2015 2016
car SUV MPV
54%
16%
Independent
0% 10% 20% 30% 40% 50% 60% 70% 80% 90%
100%
2012 2013 2014 2015 2016
car SUV MPV
27%13%
JVs

-35-
GivenhigherFCrateaswellastheincreaseinmarketshareforSUVsandMPVs,FCtargetshavebecomehardertoachievethantheywerebefore.IfthestructureofChina’scarmarketin2016wassimilartothatof2012,averagetotalFCwouldhavebeenabout20%lower,asshowninFigure37.
Figure37:SUV/MPVmarketshareincreasepushesaverageFCupward
Note:PredictedFCisbasedon2012autostructure;becauseSUVandMPVshareislikelytocontinuetoincrease,FCislikelytoincrease.
1,309
1,515
1,404
1,141
1000
1100
1200
1300
1400
1500
1600
CurbWeight�kg
car SUV MPV cross-typePV
1576
1709
1548
1286
1000
1100
1200
1300
1400
1500
1600
1700
1800
Displacement�ml
car SUV MPV cross-typePV
95
114
87
68
60
70
80
90
100
110
120
power�kw
car SUV MPV cross-typePV
6.18
7.44
7.06
6.55
5
5.5
6
6.5
7
7.5
8
AverageFC�L/100km
car SUV MPV cross-typePV
0.05
0.12
0.21
0.28
6.83
6.55
0.00
0.10
0.20
0.30
0.40
6
6.4
6.8
7.2
7.6
2012 2013 2014 2015 2016
L/100km
L/100km
FCgap FC predictedFC

-36-
6. CHINACAFCNEV(SUPER-)CREDITSANDNEVCREDITS
6.1CorporateCAFCNEVsuper-creditsAfter entering Phase IV, given themarket dominance of domestically produced cars and theirincreasedproductionofNEVs,overallCAFCcreditsmaintainedhighvolumeandmanufacturerscompliancepressures remained low–asdemonstrated inFigure38.GreatWallhad the largestshortageofCAFCcreditsin2016,andmaythereforepurchasecreditsfromYogoma,anEVcompanythatGreatWallbought25%of its shares.ChanganAutomobile, the second largestmanufacturerwith CAFCshortage, is likely to be reliant onChanganGroup's affiliatedenterprises for creditscompensation.
Figure38:By-segmentdevelopmentvehicle2016averages:FC,weight,power,displacement
Note: The 2013-15 credits are calculated according to the "AccountingMethod for Average FuelConsumptionofPassengerVehicleEnterprises",while2016creditsarecalculatedincludingflexibilitymechanism.9 If2016calculationswereperformedusing2013-15credits,creditsfortheseyearswouldhavebeensignificantlyreduced.Figure39:Top10surplusCAFCsupercreditsholders
9 Passenger car CAFC calculation method (乘用车企业平均燃料消耗量核算办法)http://chinaafc.miit.gov.cn/n2257/n2783/c86525/content.html
397
632
10461117
99 125198
1117
-32 -27 -18 -137
-200
0
200
400
600
800
1000
1200
2013 2014 2015 2016
CAFCcredits�10k
creditsurplus- previousmethod creditsurplus-newmethod CAFCcreditdeficit
Domestic(JVs+Independent)
1137 5202 10699 14812
37800
152172
16700
62608
4568
5284
0
50000
100000
150000
200000
250000
2010 2011 2012 2013 2014 2015
NEVvolu
me
PEV-domesticproduced PHEV-domesticproduced EVsimported
Imported

-37-
In 2016, as indicated in Figure 38, the top 10 CAFCcredit producerswereNEVmanufacturers(besides FAW-Volkswagen), the majority of which were JVs e.g. FAW-Volkswagen, ShanghaiVolkswagen, Changan Ford, BMW Brilliance, and Dongfeng Nissan. The greatest CAFC creditshortageswere fromSUV leadersGreatWallandChangan,witha totalof290,000and230,000negativepointsrespectively,asshowninFigure40.Thebulkofthe2016CAFCcreditdeficitwasproducedbytwomajorindependentbrandmanufacturers,GreatWallandChangan,withatotalof290,000and230,000negativecredits,respectively.CheetahandSAICalsohadanexcessofover100,000deficitofcredits.
Figure40:Top10deficitCAFCsupercreditsholders
Great Wall, the largest negative credit automanufacturer, has transferred as many as 40,000positivecredits forwardsince2013(only80%of thecreditscanbetransferredtothe followingyear))yetstillholds270,000negativecredits.Inordertocomply,GreatWallisprojectedtoinject25%ofthesharesofelectriccarmakerYogomointoitsaffiliatedcompanyinordertoachieveFCcompliance10.
10 长城入股御捷,新一轮新能源领域的合资合作即将开启.http://auto.sina.com.cn/news/qw/2017-08-30/detail-ifykpuuh9592164.shtml
0.0
20.0
40.0
60.0
80.0
100.0
120.0
BAIC-Motor
BYD-Auto
FAW-VW
BYD-AutoIndustry
Jiangnan-Motor
Geely-Motor
SAIC-Motor
Chery
Geely-Dihao
JAC
CAFCsurplus,
10k
-35.0
-30.0
-25.0
-20.0
-15.0
-10.0
-5.0
0.0
SoueastMoter
Brilliance-Jinbei
Chana-Ford
GAC-FCA
FAW-Toyota-Sichuan
Leopaard
SAIC-GM-BS
Chana-Motor
GWM
CAFCnegetivecredit,
10k

-38-
Changan Automobile, the second largest negative credits manufacturer, has relatively lowcompliancepressure. Some of itsnegativepoints can be carried forward usingpositive creditsproducedinpreviousyears–morethan100,000positivecreditsgeneratedin2013.In2016,thecompany generated about 21,000 new energy credits through its various affiliates companies(Changan Mazda, Changan Suzuki, Hefei Changan, etc.). Recently, Changan Automobile alsointroduced"Shangri-La,"anewenergybrandthatisprojectedtoincreaseinvestmentinnewenergyvehiclestocomply11.
ChanganFordperformedwellincorporateCAFCcomplianceinthepastfewyears,butgeneratedover70,000negativecreditsin2016.Thecompanymainlyproduceshigh-qualitysedansandSUVs.After entering Phase IV, the standard increased in stringency, and is becoming harder tomeetwithoutnewenergyvehiclesproduction.
Inrecentyears,GuangzhouAutomobileGroupproducednegative integrals.From2015to2016,energy-saving technologies were widely employed in the development of the GAIC GS seriesmodels,asGS4withlowFCgainsagoodsales.Inthisway,withouttheaidofnewenergyvehicles,thecompanymanagedtomaketheshiftfromanegativeCAFCtoapositivecreditsmanufacturer.
6.2NEVcreditsIn2016,thenumberofdomesticNEVcarsreached319,000,accountingfor1.35%ofChina’stotalpassengercars.Thismarkedanincreaseof48.5%fromthepreviousyear,asshowninFigure41.Also in this time,pureelectricvehicle (PEV)andplug-inhybridvehicle (PHEV)productionwas248,000and70,000,respectively.Importsofelectricpassengercarsreached16,600,doubledfromlastyear.NEVsgradually shifted fromcommercialandgovernmentprocurement to theprivatepassengercardomain.
Figure41:NEVsproductiondevelopment
11 2025年将全部停售燃油车?长安汽车发布“香格里拉”计划.http://auto.sina.com.cn/j_kandian.d.html?docid=fymzzpv7049586&subch=bauto

-39-
AccordingtotherecentlyintroducedintegratedCAFCsupercreditsandNEVcreditsmanagementsystem,allmanufacturersproducingover30,000vehiclesperyearwouldberequiredtoproduce10%NEVsin2019(about60domesticmanufacturersand10importers).Companiesrequiredtocomplymakeupover90%ofthemarket.In2016,atotalof954,000newenergypassengervehiclesweregenerated,ofwhich813,000werefromPEVsand141,000werefromPHEVs.Accordingtothecompliancerequirementsof2019,3millionNEVcreditsarerequired,equivalenttoabout1millionNEVs.BasedonNEVgrowththusfar–thistargetwillbeeasilymet.
In2016,therewerenineautomobileenterpriseswithanNEVoutputexceeding10,000,includingBYD,Beiqi,Geely,JiangnanAutomobile,SAIC,Chery,andJAC.Atotalof901,000NEVcreditsweregenerated,accountingfor94.4%ofthetotalcredits,asshowninTable6.
MostNEVcreditsareprojectedtobeproducedbyBYD,Beiqi,Geely,Jiangnan,andJMC.Inparticular,BYDgenerated250,000+NEVcreditsurplusthatcouldbeusedtooffsetnegativeCAFCcredits(ownorothers).
Table5:NEVpointsformajorChineseelectricvehiclemanufacturersin2016
Vehiclemanufacturer Mainmodels
NEVproductionvolume
NEVcredits
2019NEVcreditsrequirement(10%)*
Creditssurplus**
BYDindustry Tang/Denz/e6 46458 154784 9652 145132
152172
248283
62608
70463
5284
16595
0
50000
100000
150000
200000
250000
300000
350000
400000
2010 2011 2012 2013 2014 2015 2016
NEV
vol
ume
PEV-domestic produced PHEV-domestic produced EVs imported

-40-
BAICMotor EU200/EV200 42260 113745 29764 83981
BYDAuto Qin/e5 40186 130719 22927 107792
GeelyMotor DihaoEV/ZD 39449 133811 33003 100808
JiangnanMotor
Zotye100/E200/JiangnanTT 35899 104301 25834 78467
SAICMotor Roewee550/e950 22151 45896 29121 16775
Chery Arrizo7/eQ 20118 50415 41219 9196
JAC iEV5 18370 60632 30960 29672
JMC-Landwind E100/E200 17362 45558 7879 37679GeelyHaoqing
Motor ZD 7533 19493 49307 -29814
ChanaMotor EadoEV 5701 21880 99294 -77414
Dongfeng ER30 5298 19734 14583 5151
Note:*The10%NEVcreditsrequirementcalculationherefor2019isbasedon2016vehicleproductioninsteadofsame
yearproduction.
**Surplusiscalculatedincomparisontothe2016-basedgenerated2019NEVcreditsrequirementversus2016NEV
production.
Atpresent,theelectricvehiclemarketisdominatedbyvehiclesofClassAandbelow(about75%).FortheClassB(e.g.sedansorSUVs)vehiclesavailable,NEVsareprimarilyplug-inhybridvehicles.In2016, theaverage curbweightofelectricvehicleswas1480kg.PEVsaveraged1355kgwhilePHEVsaveraged1917kg,66kgheavierthan thatof conventionalvehicles.Althoughtheaverageweight increaseofelectricvehicleswasderived fromaddedbatteryweight, increases inPHEVsweightwasderivedfromlargervehiclemodels.ListedinTable6,PEVsaveragereportedmileagewas204km.
Table6:ComparisonbetweenICEandEVparametersin2016
Vehicleparameters
PureElectricVehicles(PEV)
Plug-inHybridVehicles(PHEV)
InternalCombustionEngine
(ICE)CarsVehiclesizegroup A00/A0/A A/B
All
Energyconsumption*
N/A N/A6.86L/100km
Weight,kg 1355 1917 1391
Power,kW 69 119 101
Displacement,ml
0 16891617
Range,km 204 N/A UnlimitedNote:Themodelparametersinthetablearecalculatedbasedontheaveragefeaturesofdomesticmodels(imported
modelsareexcluded).
*PEVsandPHEVspowerconsumptiondataisnoteasilyaccessible(amongotherreasons,becauseNEVsaretaxexempt
andthereforelessreportingisavailableonline).

-41-
In2016,asmanyastenPEVsexceeded10,000vehiclesales, includingtheBYDe5/e6,BAIC200EU200/EV200, ImperialEV,Zotyeun100,andCheryeQ.Their featureswereas follows:energyconsumptionranged10-20kwh/100km,e-ranged150-400km,andNEVcreditseligibilityranged1.33-5.28credits(averaging3.28credits),asdetailedinTable7.DetailsrelatedtothesefeaturesofmajorPHEVbrandsareavailableinTable8.
Table7:FeaturesofChina’s2016majorPEVbrands
Model Curbweight(kg)
e-range(km)
Energyconsumption(kwh/100km)
2016Annualsales
NEVcreditseligibility
BYDe6 2420 400 19.5 18917 5.00BAICEU200 1600 200 12 17892 3.84
JeelyDihaoEV 1570 300 N/A 16894 4.40Zotye100 1040 150 10 15314 2.60CheryeQ 1128 151 12 15136 2.61ZotyeE200 1080 160 N/A 13497 2.72 BYDe5 1845 256 N/A 12333 3.87
BAICEV200 1295 200 15 10509 3.84JMCE100 825 152 N/A 10005 2.62ZDD2 690 155 N/A 9178 2.66
Note:BecausePEVspowerconsumptiondataisnoteasilyaccessible,thecreditscalculationusesafactorof1forall
models.
Table8:FeaturesofChina’s2016majorPHEVbrands
ModelCurb
weight(kg)e-range(km)
Energyconsumption(kwh/100km)
2016Annualsales
NEVcreditseligibility
BYDTang 2280 80 2.0、N/A 24871 2BYDQin 1720 80 1.4、N/A 19493 2
Roewee550 1699 58 1.6、N/A 16253 2Arrizo7 1590 50 2.7、N/A 3660 2
Roewee950 1590 60 1.7、N/A 3900 2Note:BecausePHEVspowerconsumptiondataisnoteasilyaccessible,thetablestatesN/A(notapplicable).
6.3NEVcreditsimpact:concludingremarksChina’snewNEVcreditssystemisprojectedtodriveNEVproductionwhilelargelyavoidingenergysavingshiftsamongtraditionalandwellsellingICEmodels.Forexample,JMCHoldingsaverageFCrateisashighas9.76L/100km.Thecompany’sFCchallengeisledbyitsbestsellingSUVLandsatX7withFCashighas10.4L/100km.However,theproductionofitsA100E100electriccar(showninFigure24)droppedthecompany’saverageFCto4.71L/100km.Theissueistheresultedcarbonimpact.Werethe10,000E100producedsoldandusedwithinhighlypopulatedareasandthereforebroughtactuallocalcarbonandotheremissionreductionsorisitthe60,000highlypollutingX7swhicharenowthedominantsourceoflocalairquality?
Figure42:SelectedICEversusNEVmodel

-42-
Asmanyas12majorelectricvehiclecompanies(includingNEVandnon-NEV),wereabletoreducetheirICEvehiclebasedcorporateaverageFCby3%to68%,asshowninFigure43.TheaccumulatedNEVcreditsurpluscan,inturn,betransferredtoaffiliatedcompanies(definedasfigure13),orsoldto other companies, but not to save for use in future years. One approach adopted by largemanufacturersistheacquisitionofNEVmanufacturersandthecreationofstrategicJVs,addingtomarketnon-competitiveness,impedingthegoalsofthestandardregimeandfurthercomplicatingthemanagementofthestandard’simplementationandenforcement.
Figure43:NEVsupercreditimpactonCAFCofEVproducers
Intheshortterm,NEVmanufacturerswillbebenefitedbythenewNEVcreditstandardasitwillcreatearevenuestreamandenablefurtherinvestmentsinproductimprovement,aswasthecaseintheUSintheearlyyearsoftheZEV-creditspolicy.Forinstance,theGreatWallinvestmentsintheYogomo.
TosumupiCET’sviewsontheinfluenceofNEVcredits:
JMC-ICEFlagshipmodel–Landwind X7Production2016�approx. 60thousand�75%oftraditionalmodelsKerb mass�1775kgAveragedisplacement�2.0LAverage power�140kWCombinedfuelconsumption�10.4L/100km134%oftarget�7.9L/100km
JMC-EVFlagshipmodel-E100Production2016�approx.10thousand�60%ofelectricmodelsKerb mass�825kgAveragedisplacement�152kmAverage power�20kWCombinedelectricityconsumption�N/ANEV credit�2.62pervehicle
VS
0%10%20%30%40%50%60%70%80%
0.00
2.00
4.00
6.00
8.00
10.00
12.00
BYD-Autoindustry JM
C
BYD-Auto
BAIC-Motor
Jiangnan-Motor
Geely-Motor
SAIC-Motor JAC
Chery
DongfengMotor
Geely-Dihao
ChanaMotor
CAFCDecrease
CAFC
(L/100km
)
CAFC(excludingNEV) CAFC(includingNEV) CAFCdecrease

-43-
(1) NEVcreditswillplayakeyroleinthetransitionofChina’sautosectorintoagloballeaderinzerotailpipeemissionefforts,asitprovidesfinancialincentivestoadvanceinvestmentsinNEVs.
(2) GiventheNEVcreditsystem,investmentsinenergysavingpoliciesandprogramsisevenlessdesirable thanbefore. Since companieshavenotbeendelivering the improvementsneededformeetingthestandard,theshifttoNEVsmayfinallypresentanimplementableapproachtovehicleemissionsreductions.
(3) OverallemissionimpactsoftheNEVcreditshasyettounfold.Yetpoliciesgoverningenergyproductionshouldmoveaheadquicklyandeffectively,andoverallgainsareprojectedinthelongerrun.
InordertoensuretheNEVismakingactualcontributiontoChina’semissionreductiongoals,iCET’ssuggeststhefollowing:
(5) TheNEVcreditsystemshouldbeastand-alonemechanisminordertoclarifycorporateresponsibilitiesandenablegoodimplementationandenforcement.GivenChina’scomplexindustrialandinter-ministerialstructures,theCAFCregimehasproventobetoocomplextomanagewell,evenbeforetheNEVcreditpolicywasintroduced.
(6) Policydesignersshould introduce longertermrequirementsandpredictablebaselineoftheNEVcreditspolicyshouldbepresentedassoonaspossibletoenablestrategicmarketplanning, minimize market risks and promote steady investment streams, and soundgradualimprovementsofqualityNEVs.
(7) Policy makers should introduce well-informed and effectively implementable penaltymechanismtoensurethestrengthandeffectivenessoftheNEVcreditspolicy.Thisincludesfeelevels,supplementarypenalties(forexample,creditowedwillstillbeowedregardlessofpenaltiespaid),andefficientandtransparentpolicyscrutinyandpanelizingprocess.
(8) Policymakers should consider simplification of the policy to ease itsmanagement; forexample,eliminatethepracticeofforwardingcreditsamongcorporateactors.

-44-
BIBLIOGRAPHY 中国石油经济技术研究.2016年国内外油气行业发展报告.2017.01环保部.中国机动车环境管理年报 2017.2017.06http://www.zhb.gov.cn/gkml/hbb/qt/201706/W020170605537942778925.pdf汽车推荐性国家标准《电动汽车与插电式混合动力汽车能耗折算方法》征求意见的函 .http://www.catarc.org.cn/NewsDetails.aspx?ID=2707,2016年 7月 22日查询汽车推荐性国家标准《乘用车循环外技术/装置评价方法第 2部分怠速起停系统》征求意见的
函.http://www.catarc.org.cn/NewsDetails.aspx?ID=2664,2016年 7月 22日查询.汽车推荐性国家标准《乘用车循环外技术装置节能效果评价方法第 1部分节能驾驶指示装置》
征求意见的函.http://www.catarc.org.cn/NewsDetails.aspx?ID=2641,2016年 7月 22日查询.汽车推荐性国家标准《乘用车循环外技术装置节能效果评价方法第 3部分汽车空调》征求意
见的函 http://www.catarc.org.cn/NewsDetails.aspx?ID=2798,2017年 10月 30日查询.
汽车推荐性国家标准《电动汽车能量消耗率限值》征求意见的函.
http://www.catarc.org.cn/NewsDetails.aspx?ID=2882,2017年 10月 30日查询
工信部等五部委 . 乘用车企业平均燃料消耗量与新能源汽车积分并行管理办法
http://www.miit.gov.cn/n1146285/n1146352/n3054355/n3057585/n3057592/c5826834/content.html中国汽车燃料消耗量网站.http://chinaafc.miit.gov.cn/2017年 1月 30日查询工信部.公示 2016年度乘用车企业平均燃料消耗量情况.2017年 8月 31日查询
http://www.miit.gov.cn/n1146285/n1146352/n3054355/n3057585/n3057589/c5560565/content.html康利平,MayaBenDror,秦兰芝,安锋.《中国乘用车燃料消耗量发展年度报告 2016》.(2017-06-28)http://www.icet.org.cn/admin/upload/2016092350679321.pdf