china / hong kong industry focus china banking sector industry focus china banking sector page 2...
TRANSCRIPT

www.dbsvickers.com
ed-JS / sa- AL
2H15 outlook: reforms in place
Pullback creates a good entry opportunity
Asset quality and earnings growth to recove
Sector reforms are long-term drivers
Top picks BoCom-H & CITIC-H; ICBC-A & CMB-A Asset quality and earnings growth to recover. We do not expect much more pressure on NIM during the rate cut cycle (pg5), since China has largely completed its interest rate liberalization process. There is still a lot of room for RRR cuts to boost liquidity and loan growth. (pg4) Concerns on local government loans should be largely eased by local government’s debt swap program (pg8). With GDP growth to stabilise at c.7% in 2H15, which is the New Normal, China banks’ NPL formation ratio and credit cost should stablise (pg10), although overall NPL ratio will likely rise and top at 2% by 2017. As mentioned in our 1Q15 results recap, we believe 2015 will be the slowest year in recent history for banks’ earnings growth, but we expect earnings recovery in 2016-2017.
Fuelled by sector reform. Mixed-ownership reform will make a difference as the better ownership structure will pave the road for a market-oriented compensation system, multi-divisional reforms (pg14) and potential subsidiary spinoffs, and the employee stock ownership plan (ESOP), should enhance banks’ efficiency in the long-run. Overseas markets can be a new growth driver as banks expand alongside clients due to China’s One-Belt-One-Road Plan. (pg15). In future, we also expect higher contribution from private banking and wealth management businesses in tandem with development of China’s capital markets. BoCom’s recent acquisition of Huaying Sec. signals the potential mixed-operation reform in the financial sector and the rise of universal banks.
Entry opportunity for H-share banks; Top picks BoCom-H & CITIC-H; ICBC-A & CMB-A. After the pull-back in the past month, H-share China banks are trading at an attractive 0.9x FY15 P/BV on average, creating a good entry opportunity. We are looking for at least 20% upside for H-share China banks, and A-share banks should see a short-term boost driven by the market bailout plan (pg20). We like banks that will benefit from financial sector reforms and have strong innovative ability in developing new businesses, including internet financing (pg16). We revised up our mid-term growth assumption for BoCom to factor in impact from reforms (pg21) and slightly increased TP.
HSI: 25,236
ANALYST Shujin CHEN CFA, + 852 2820 4920 [email protected] Nicole WU +852 2820 4919 [email protected] Top picks
Closing FY15F Target Stock
price PBV PER yield ROE Price rating
(Lcl$) (X) (X) (%) (%) (Lcl$)
A-share CMB (600036)
18.82 1.29 7.6 4.0 18.3 23.42 Buy
ICBC (601398)
5.79 1.21 7.3 4.6 17.4 6.37 Buy
H-share Citic Bank
(998) 5.97 0.74 5.4 5.5 14.6 8.31 Buy
BoCom (3328)
7.68 0.87 6.8 4.6 13.4 9.34 Buy
Source: Bloomberg Finance L.P., DBS Vickers
Based on closing prices on 6-Jul-15.
Sector average P/BV
0.5
0.7
0.9
1.1
1.3
1.5
1.7
1.9
Jan-11 Jan-12 Jan-13 Jan-14 Jan-15
x
0.99
'13 trough =0.84
'13 max =1.3
14 max = 0.99
14 trough = 0.76
Source: Thomson Reuters, DBS Vickers
DBS Group Research . Equity 7 July 2015
China / Hong Kong Industry Focus
China Banking Sector Refer to important disclosures at the end of this report
Industry Focus
China Banking Sector
Page 2
Table of Contents
Macro: Still room to use monetary tools to boost economic growth 3
Local government's debt concerns now eased by debt swap programme 8
NPL trends up but to stabilise at 2% in 2016-2017 10
Long-term driver: Mixed-ownership reforms 12
Long-term driver: Potential overseas expansion boosted by One-Belt-One-Road Plan 15
Banks are well prepared for trend towards Internet financing 16
Concern on government’s bailout creates entry point for H-share China banks 20
Valuation and recommendation 21
Appendix – PB bands 24
Appendix – Financial summary 26
Industry Focus
China Banking Sector
Page 3
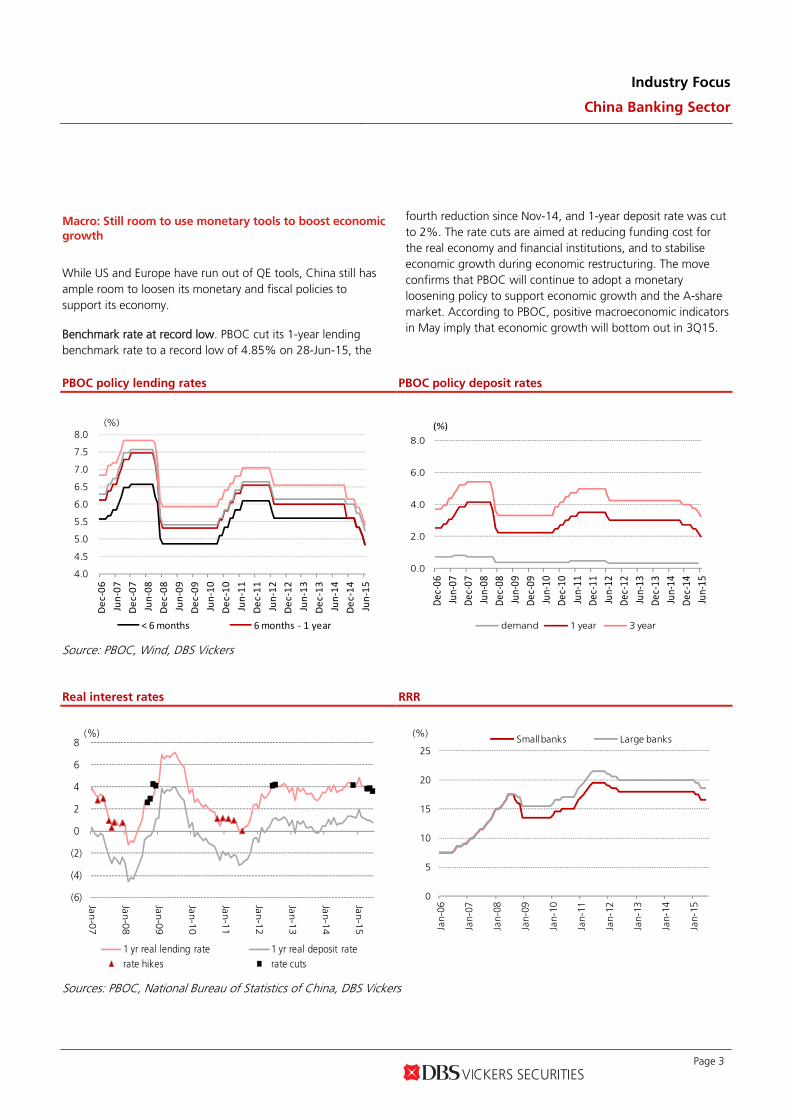
Macro: Still room to use monetary tools to boost economic
growth
While US and Europe have run out of QE tools, China still has ample room to loosen its monetary and fiscal policies to support its economy.
Benchmark rate at record low. PBOC cut its 1-year lending benchmark rate to a record low of 4.85% on 28-Jun-15, the
fourth reduction since Nov-14, and 1-year deposit rate was cut to 2%. The rate cuts are aimed at reducing funding cost for the real economy and financial institutions, and to stabilise economic growth during economic restructuring. The move confirms that PBOC will continue to adopt a monetary loosening policy to support economic growth and the A-share market. According to PBOC, positive macroeconomic indicators in May imply that economic growth will bottom out in 3Q15.
PBOC policy lending rates PBOC policy deposit rates
4.0
4.5
5.0
5.5
6.0
6.5
7.0
7.5
8.0
Dec‐06
Jun‐07
Dec‐07
Jun‐08
Dec‐08
Jun‐09
Dec‐09
Jun‐10
Dec‐10
Jun‐11
Dec‐11
Jun‐12
Dec‐12
Jun‐13
Dec‐13
Jun‐14
Dec‐14
Jun‐15
(%)
< 6 months 6 months ‐ 1 year
0.0
2.0
4.0
6.0
8.0Dec
‐06
Jun‐07
Dec
‐07
Jun‐08
Dec
‐08
Jun‐09
Dec
‐09
Jun‐10
Dec
‐10
Jun‐11
Dec
‐11
Jun‐12
Dec
‐12
Jun‐13
Dec
‐13
Jun‐14
Dec
‐14
Jun‐15
(%)
demand 1 year 3 year
Source: PBOC, Wind, DBS Vickers
Real interest rates RRR
(6)
(4)
(2)
0
2
4
6
8
Jan-0
7
Jan-0
8
Jan-0
9
Jan-1
0
Jan-1
1
Jan-1
2
Jan-1
3
Jan-1
4
Jan-1
5
(%)
1 yr real lending rate 1 yr real deposit raterate hikes rate cuts
0
5
10
15
20
25
Jan-
06
Jan-
07
Jan-
08
Jan-
09
Jan-
10
Jan-
11
Jan-
12
Jan-
13
Jan-
14
Jan-
15
(%)Small banks Large banks
Sources: PBOC, National Bureau of Statistics of China, DBS Vickers
Industry Focus
China Banking Sector
Page 4
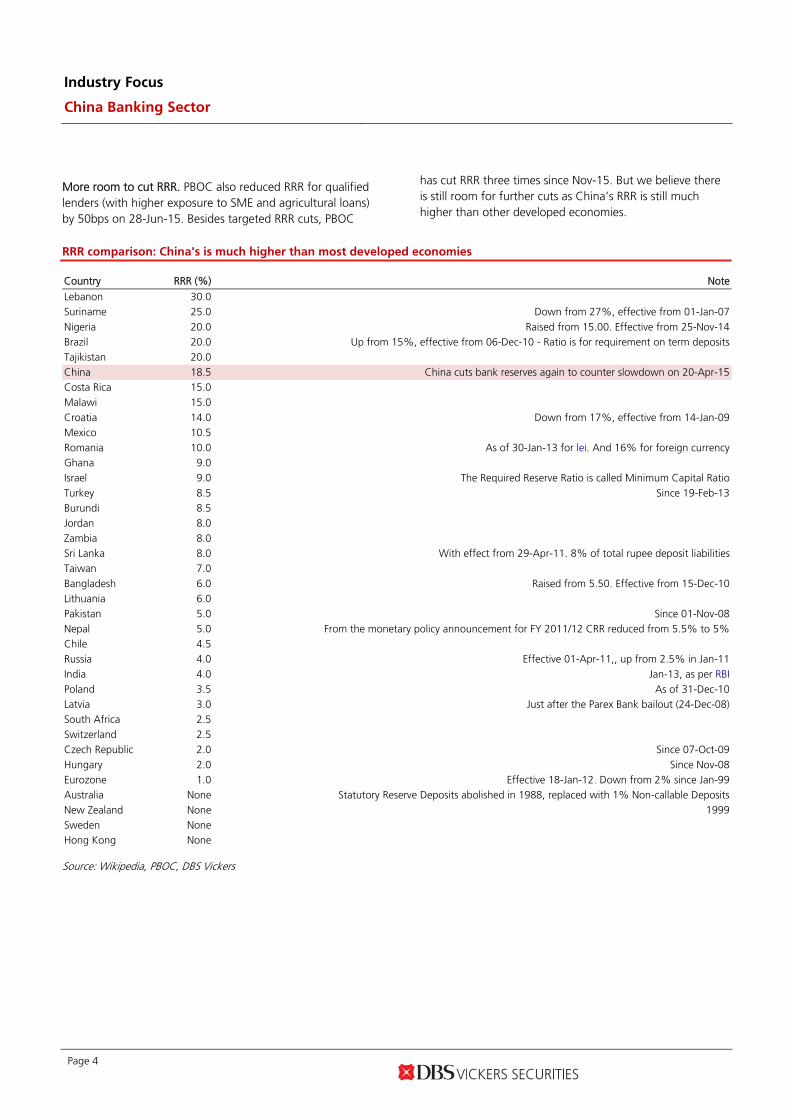
More room to cut RRR. PBOC also reduced RRR for qualified lenders (with higher exposure to SME and agricultural loans) by 50bps on 28-Jun-15. Besides targeted RRR cuts, PBOC
has cut RRR three times since Nov-15. But we believe there is still room for further cuts as China’s RRR is still much higher than other developed economies.
RRR comparison: China's is much higher than most developed economies
Country RRR (%) Note
Lebanon 30.0
Suriname 25.0 Down from 27%, effective from 01-Jan-07
Nigeria 20.0 Raised from 15.00. Effective from 25-Nov-14
Brazil 20.0 Up from 15%, effective from 06-Dec-10 - Ratio is for requirement on term deposits
Tajikistan 20.0 China 18.5 China cuts bank reserves again to counter slowdown on 20-Apr-15 Costa Rica 15.0
Malawi 15.0
Croatia 14.0 Down from 17%, effective from 14-Jan-09
Mexico 10.5 Romania 10.0 As of 30-Jan-13 for lei. And 16% for foreign currency Ghana 9.0
Israel 9.0 The Required Reserve Ratio is called Minimum Capital Ratio Turkey 8.5 Since 19-Feb-13 Burundi 8.5 Jordan 8.0 Zambia 8.0 Sri Lanka 8.0 With effect from 29-Apr-11. 8% of total rupee deposit liabilities Taiwan 7.0
Bangladesh 6.0 Raised from 5.50. Effective from 15-Dec-10 Lithuania 6.0 Pakistan 5.0 Since 01-Nov-08 Nepal 5.0 From the monetary policy announcement for FY 2011/12 CRR reduced from 5.5% to 5% Chile 4.5
Russia 4.0 Effective 01-Apr-11,, up from 2.5% in Jan-11
India 4.0 Jan-13, as per RBI Poland 3.5 As of 31-Dec-10
Latvia 3.0 Just after the Parex Bank bailout (24-Dec-08) South Africa 2.5 Switzerland 2.5
Czech Republic 2.0 Since 07-Oct-09 Hungary 2.0 Since Nov-08 Eurozone 1.0 Effective 18-Jan-12. Down from 2% since Jan-99
Australia None Statutory Reserve Deposits abolished in 1988, replaced with 1% Non-callable Deposits New Zealand None 1999
Sweden None
Hong Kong None
Source: Wikipedia, PBOC, DBS Vickers

Industry Focus
China Banking Sector
Page 5
CPI Official & HSBC PMI
0
2
4
6
8
10
12
14
Jan-
10
Jan-
11
Jan-
12
Jan-
13
Jan-
14
Jan-
15
(%) CPI Food CPI yoy Non-food CPI yoy
35
40
45
50
55
60
65
Jan-
05
Jan-
06
Jan-
07
Jan-
08
Jan-
09
Jan-
10
Jan-
11
Jan-
12
Jan-
13
Jan-
14
Jan-
15
PMI HSBC PMI
Sources: NBS, Wind, DBS Vickers
No further pressure on banks’ NIM and earnings. As we mentioned in our recent rate cut comments, we expect no pressure on banks’ NIM and earnings as 1) most new loans are priced above benchmark rates, and loan prime rate declined less than benchmark lending rate; 2) banks' funding cost will drop due to cut in time deposit rates especially for SOE banks; and 3) RRR cut will help NIM due to lower interbank funding cost and higher interest rates earned by released funds.
Loan prime rate (1-year)
4.6
4.8
5.0
5.2
5.4
5.6
5.8
6.0
Oct
-13
No
v-1
3D
ec-1
3Ja
n-1
4Fe
b-1
4M
ar-1
4A
pr-
14
May
-14
Jun
-14
Jul-
14
Au
g-1
4Se
p-1
4O
ct-1
4N
ov-
14
Dec
-14
Jan-
15
Feb
-15
Mar
-15
Ap
r-1
5M
ay-1
5Ju
n-1
5
(%)
Source: PBOC, DBS Vickers
Industry Focus
China Banking Sector
Page 6
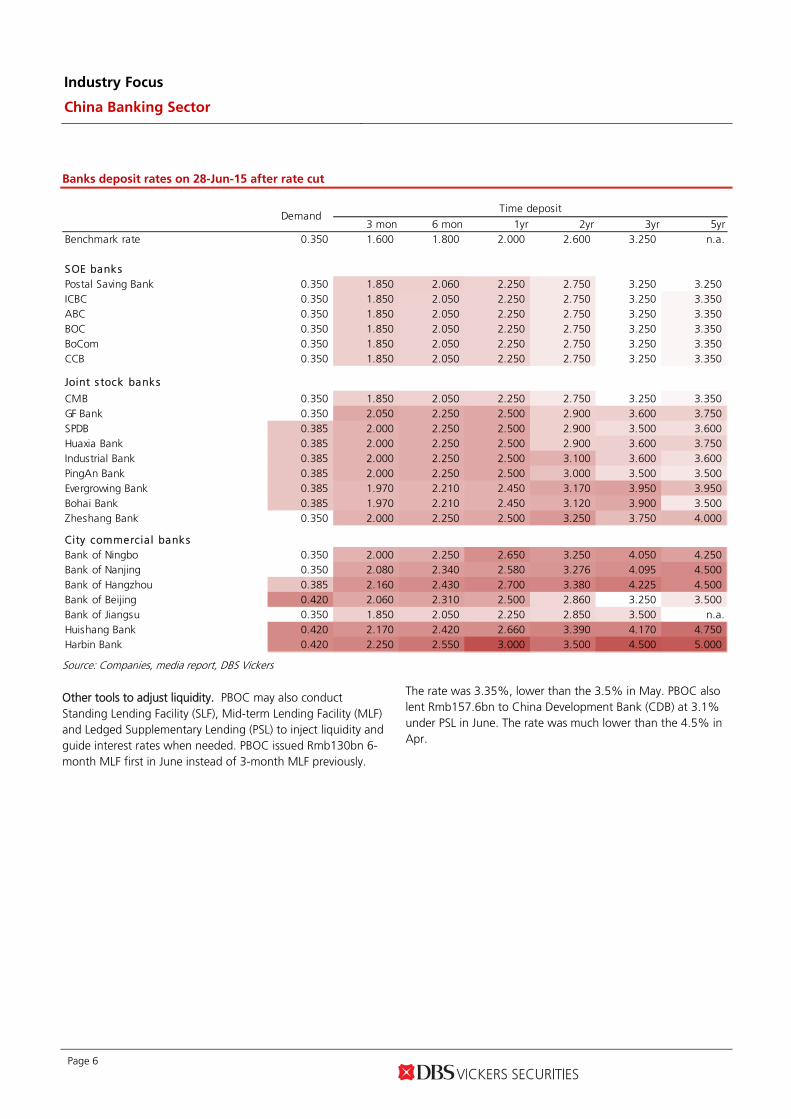
Banks deposit rates on 28-Jun-15 after rate cut
3 mon 6 mon 1yr 2yr 3yr 5yrBenchmark rate 0.350 1.600 1.800 2.000 2.600 3.250 n.a.
SOE banksPostal Saving Bank 0.350 1.850 2.060 2.250 2.750 3.250 3.250ICBC 0.350 1.850 2.050 2.250 2.750 3.250 3.350ABC 0.350 1.850 2.050 2.250 2.750 3.250 3.350BOC 0.350 1.850 2.050 2.250 2.750 3.250 3.350BoCom 0.350 1.850 2.050 2.250 2.750 3.250 3.350CCB 0.350 1.850 2.050 2.250 2.750 3.250 3.350
Joint s tock banks
CMB 0.350 1.850 2.050 2.250 2.750 3.250 3.350GF Bank 0.350 2.050 2.250 2.500 2.900 3.600 3.750SPDB 0.385 2.000 2.250 2.500 2.900 3.500 3.600Huaxia Bank 0.385 2.000 2.250 2.500 2.900 3.600 3.750Industrial Bank 0.385 2.000 2.250 2.500 3.100 3.600 3.600PingAn Bank 0.385 2.000 2.250 2.500 3.000 3.500 3.500Evergrowing Bank 0.385 1.970 2.210 2.450 3.170 3.950 3.950Bohai Bank 0.385 1.970 2.210 2.450 3.120 3.900 3.500Zheshang Bank 0.350 2.000 2.250 2.500 3.250 3.750 4.000
City commercia l banksBank of Ningbo 0.350 2.000 2.250 2.650 3.250 4.050 4.250Bank of Nanjing 0.350 2.080 2.340 2.580 3.276 4.095 4.500Bank of Hangzhou 0.385 2.160 2.430 2.700 3.380 4.225 4.500Bank of Beijing 0.420 2.060 2.310 2.500 2.860 3.250 3.500Bank of Jiangsu 0.350 1.850 2.050 2.250 2.850 3.500 n.a.Huishang Bank 0.420 2.170 2.420 2.660 3.390 4.170 4.750Harbin Bank 0.420 2.250 2.550 3.000 3.500 4.500 5.000
Time depositDemand
Source: Companies, media report, DBS Vickers
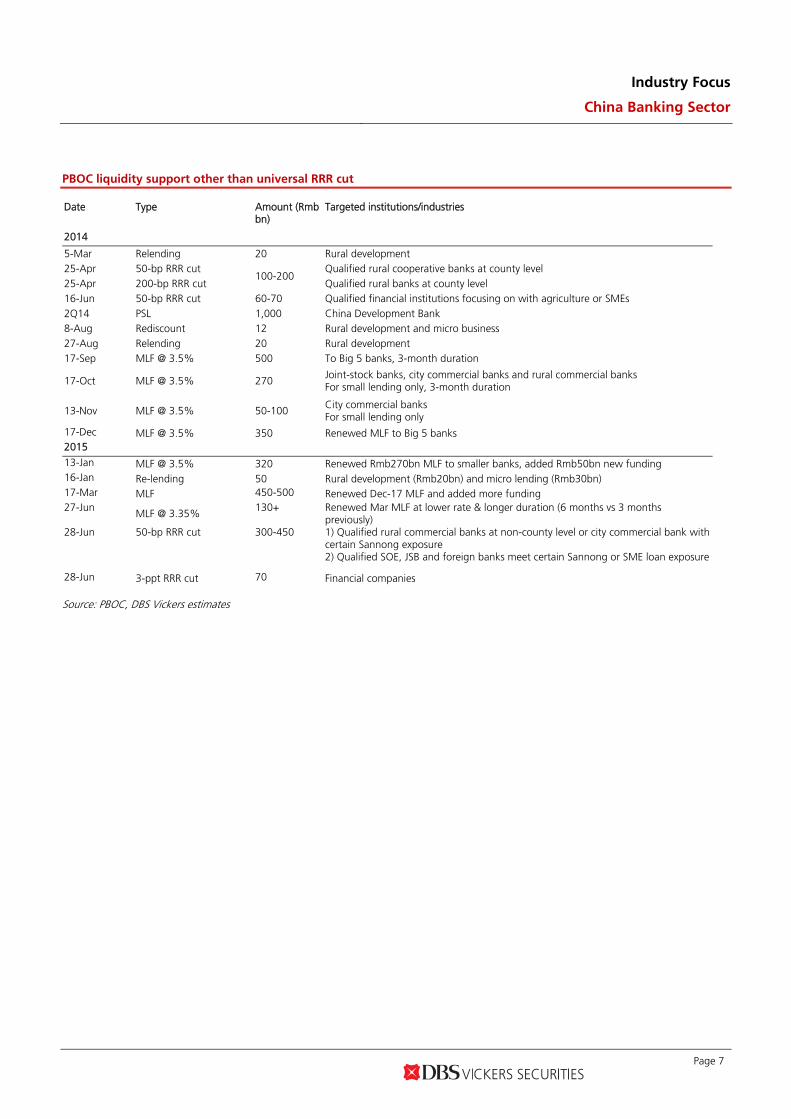
Other tools to adjust liquidity. PBOC may also conduct Standing Lending Facility (SLF), Mid-term Lending Facility (MLF) and Ledged Supplementary Lending (PSL) to inject liquidity and guide interest rates when needed. PBOC issued Rmb130bn 6-month MLF first in June instead of 3-month MLF previously.
The rate was 3.35%, lower than the 3.5% in May. PBOC also lent Rmb157.6bn to China Development Bank (CDB) at 3.1% under PSL in June. The rate was much lower than the 4.5% in Apr.
Industry Focus
China Banking Sector
Page 7
PBOC liquidity support other than universal RRR cut
Date Type Amount (Rmb
bn) Targeted institutions/industries
2014
5-Mar Relending 20 Rural development 25-Apr 50-bp RRR cut
100-200 Qualified rural cooperative banks at county level
25-Apr 200-bp RRR cut Qualified rural banks at county level 16-Jun 50-bp RRR cut 60-70 Qualified financial institutions focusing on with agriculture or SMEs 2Q14 PSL 1,000 China Development Bank 8-Aug Rediscount 12 Rural development and micro business 27-Aug Relending 20 Rural development 17-Sep MLF @ 3.5% 500 To Big 5 banks, 3-month duration
17-Oct MLF @ 3.5% 270 Joint-stock banks, city commercial banks and rural commercial banks For small lending only, 3-month duration
13-Nov MLF @ 3.5% 50-100 City commercial banks For small lending only
17-Dec MLF @ 3.5% 350 Renewed MLF to Big 5 banks 2015 13-Jan MLF @ 3.5% 320 Renewed Rmb270bn MLF to smaller banks, added Rmb50bn new funding 16-Jan Re-lending 50 Rural development (Rmb20bn) and micro lending (Rmb30bn) 17-Mar MLF 450-500 Renewed Dec-17 MLF and added more funding 27-Jun
MLF @ 3.35% 130+ Renewed Mar MLF at lower rate & longer duration (6 months vs 3 months
previously) 28-Jun 50-bp RRR cut 300-450 1) Qualified rural commercial banks at non-county level or city commercial bank with
certain Sannong exposure 2) Qualified SOE, JSB and foreign banks meet certain Sannong or SME loan exposure
28-Jun 3-ppt RRR cut 70 Financial companies
Source: PBOC, DBS Vickers estimates
Industry Focus
China Banking Sector
Page 8
Local government's debt concerns now eased by debt
swap programme
What is local government's debt swap programme?
- Following the announcement of Circular 43, MOF granted Rmb1tn quota for local governments to convert local government financing vehicles (LGFV) debts into municipal bonds in Mar-15 and another Rmb1tn in Jun. In total, local governments are allowed to issue Rmb2tn bonds to replace their current debts scheduled to expire by end-2015 that are mainly bank loans.
Why did the central government and regulators launch the programme?
- It will be hard to control local government budget if local governments keep increasing borrowings from banks and financial institutions, which will cause long-term risks. LGFVs has been mushrooming since 2008 when the central government launched a Rmb4tn stimulus package under the GFC, becoming a big concern for the central government. In 2013, the National Audit Office conducted the first national audit on local government borrowings and found Rmb17.9tn debt, of which Rmb10tn are bank loans. The State Council issued Circular 43 in Sep-14 to regulate local government borrowing.
- According to Circular 43, from 2016 onwards, all government-funded projects will need to be financed by municipal bonds issued by local governments at provincial level, and no longer through LGFVs. Local governments have to provide details for bond issuance, which will increase the transparency. Local government debts cannot exceed the approved quota and will be included in fiscal budget planning, according to the rule.
- Banks have lent too much to the local government, while they are expected to support the new economy and economic restructuring.
Why do local governments want to swap?
- Current local government borrowings usually bear a high borrowing cost (5-8%) with relatively short maturity (2-3 years).
- Debt: low cost (2.8-3.5%) & long-term (3-10yrs).
Why do banks want to swap?
- Local government bonds are less risky given more transparent project disclosure and detailed cash flow coverage plan.
- The weight of local government bond is 25% when calculating risk-weighted assets while the weight of loan is 100%. Banks can increase their RORWA by local government bond purchase instead of local government lending.
- Local government bond can be used as collateral for cash borrowing from the central bank under the PSL framework.
- Banks want to get fiscal deposits from local governments. Whether a bank has bought local government bonds is a key prerequisite when the local government is considering deposit saving.
- Theoretically, banks can save provision charge as local government bonds are deemed as low risk investment while they have to book at least 1% provision charge for loans made to local governments. However, we did not factor in credit cost savings in our assumptions as existing LGFV loans carry extremely low NPL ratio.
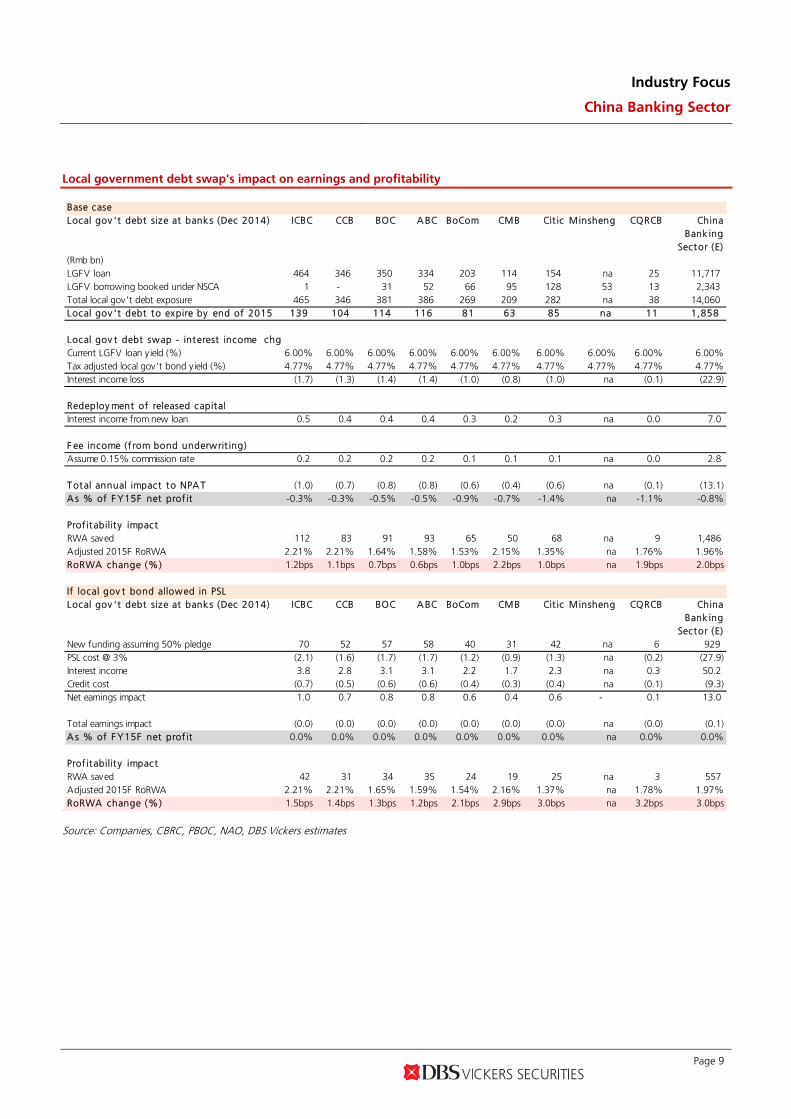
Earnings and profitability impacts to banks under the debt swap programme – Big 4 and CMB best positioned
Our estimates shows that even without considering local government bond pledges under the PSL programme, the debt swap would only be slightly negative to banks’ FY15 earnings, contrary to prevailing concerns that banks will take sizeable losses from such a swap. The banking sector may improve its RoRWA by 2bps as local government bonds carry a much lower risk weighting. Earnings impacts to Big 4 banks are marginal, given they have limited non-standard credit asset exposure and thus are less susceptible. In terms of profitability improvement, we find that CMB will see more RoRWA improvement.
If municipal bonds are qualified collateral under PSL programme (assume 50% pledge rate), earnings impact to the sector will be nil and RoRWA improvement will expand slightly to 3bps.
Industry Focus
China Banking Sector
Page 9
Local government debt swap's impact on earnings and profitability
aud
Base caseLocal gov 't debt size at bank s (Dec 2014) ICBC CCB BOC A BC BoCom CMB Cit ic Minsheng CQRCB China
Bank ingSector (E)
(Rmb bn)LGFV loan 464 346 350 334 203 114 154 na 25 11,717 LGFV borrowing booked under NSCA 1 - 31 52 66 95 128 53 13 2,343 Total local gov't debt exposure 465 346 381 386 269 209 282 na 38 14,060 Local gov 't debt to expire by end of 2015 139 104 114 116 81 63 85 na 11 1,858
Local gov t debt swap - interest income chgCurrent LGFV loan y ield (%) 6.00% 6.00% 6.00% 6.00% 6.00% 6.00% 6.00% 6.00% 6.00% 6.00%Tax adjusted local gov't bond y ield (%) 4.77% 4.77% 4.77% 4.77% 4.77% 4.77% 4.77% 4.77% 4.77% 4.77%Interest income loss (1.7) (1.3) (1.4) (1.4) (1.0) (0.8) (1.0) na (0.1) (22.9)
Redeploy ment of released capital Interest income from new loan 0.5 0.4 0.4 0.4 0.3 0.2 0.3 na 0.0 7.0
F ee income (f rom bond underwrit ing)Assume 0.15% commission rate 0.2 0.2 0.2 0.2 0.1 0.1 0.1 na 0.0 2.8
T otal annual impact to NPA T (1.0) (0.7) (0.8) (0.8) (0.6) (0.4) (0.6) na (0.1) (13.1) A s % of F Y15F net prof it -0.3% -0.3% -0.5% -0.5% -0.9% -0.7% -1.4% na -1.1% -0.8%
Prof it abilit y impactRWA saved 112 83 91 93 65 50 68 na 9 1,486 Adjusted 2015F RoRWA 2.21% 2.21% 1.64% 1.58% 1.53% 2.15% 1.35% na 1.76% 1.96%RoRWA change (%) 1.2bps 1.1bps 0.7bps 0.6bps 1.0bps 2.2bps 1.0bps na 1.9bps 2.0bps
If local gov t bond allowed in PSLLocal gov 't debt size at bank s (Dec 2014) ICBC CCB BOC A BC BoCom CMB Cit ic Minsheng CQRCB China
Bank ingSector (E)
New funding assuming 50% pledge 70 52 57 58 40 31 42 na 6 929 PSL cost @ 3% (2.1) (1.6) (1.7) (1.7) (1.2) (0.9) (1.3) na (0.2) (27.9) Interest income 3.8 2.8 3.1 3.1 2.2 1.7 2.3 na 0.3 50.2 Credit cost (0.7) (0.5) (0.6) (0.6) (0.4) (0.3) (0.4) na (0.1) (9.3) Net earnings impact 1.0 0.7 0.8 0.8 0.6 0.4 0.6 - 0.1 13.0
Total earnings impact (0.0) (0.0) (0.0) (0.0) (0.0) (0.0) (0.0) na (0.0) (0.1) A s % of F Y15F net prof it 0.0% 0.0% 0.0% 0.0% 0.0% 0.0% 0.0% na 0.0% 0.0%
Prof it abilit y impactRWA saved 42 31 34 35 24 19 25 na 3 557 Adjusted 2015F RoRWA 2.21% 2.21% 1.65% 1.59% 1.54% 2.16% 1.37% na 1.78% 1.97%RoRWA change (%) 1.5bps 1.4bps 1.3bps 1.2bps 2.1bps 2.9bps 3.0bps na 3.2bps 3.0bps
Source: Companies, CBRC, PBOC, NAO, DBS Vickers estimates
Industry Focus
China Banking Sector
Page 10
NPL trends up but to stabilise at 2% in 2016-2017
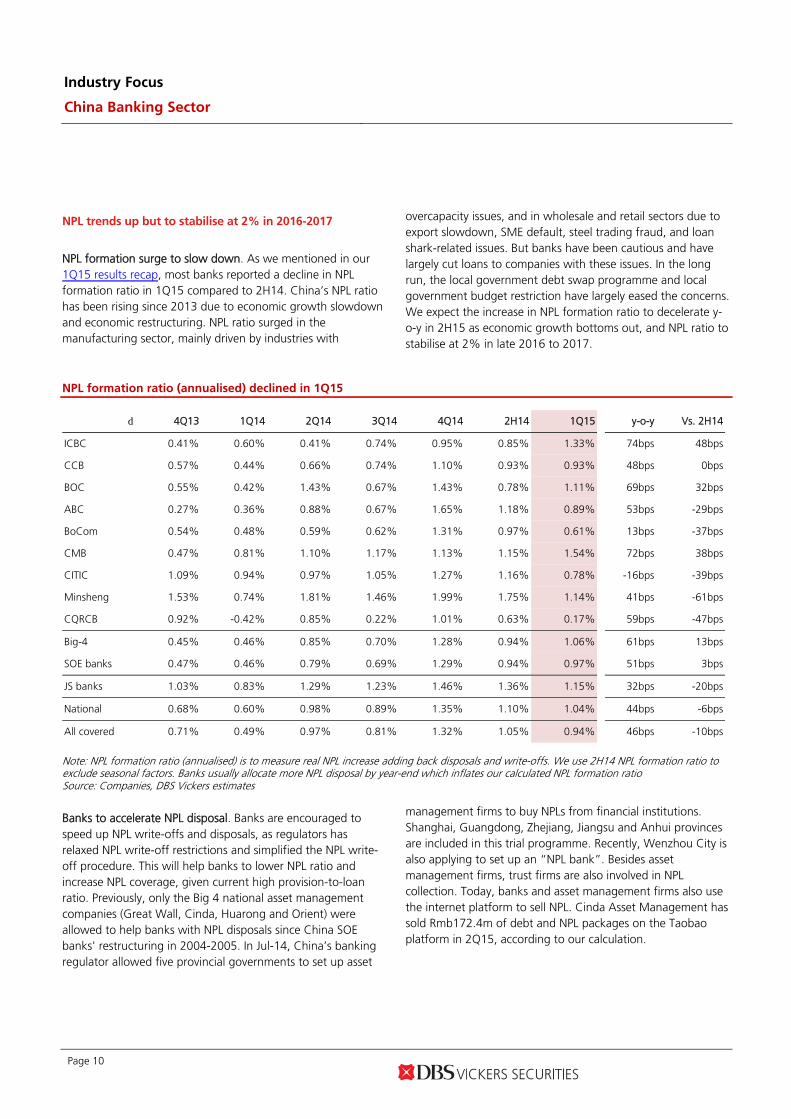
NPL formation surge to slow down. As we mentioned in our 1Q15 results recap, most banks reported a decline in NPL formation ratio in 1Q15 compared to 2H14. China’s NPL ratio has been rising since 2013 due to economic growth slowdown and economic restructuring. NPL ratio surged in the manufacturing sector, mainly driven by industries with
overcapacity issues, and in wholesale and retail sectors due to export slowdown, SME default, steel trading fraud, and loan shark-related issues. But banks have been cautious and have largely cut loans to companies with these issues. In the long run, the local government debt swap programme and local government budget restriction have largely eased the concerns. We expect the increase in NPL formation ratio to decelerate y-o-y in 2H15 as economic growth bottoms out, and NPL ratio to stabilise at 2% in late 2016 to 2017.
NPL formation ratio (annualised) declined in 1Q15
d 4Q13 1Q14 2Q14 3Q14 4Q14 2H14 1Q15 y-o-y Vs. 2H14
ICBC 0.41% 0.60% 0.41% 0.74% 0.95% 0.85% 1.33% 74bps 48bps
CCB 0.57% 0.44% 0.66% 0.74% 1.10% 0.93% 0.93% 48bps 0bps
BOC 0.55% 0.42% 1.43% 0.67% 1.43% 0.78% 1.11% 69bps 32bps
ABC 0.27% 0.36% 0.88% 0.67% 1.65% 1.18% 0.89% 53bps -29bps
BoCom 0.54% 0.48% 0.59% 0.62% 1.31% 0.97% 0.61% 13bps -37bps
CMB 0.47% 0.81% 1.10% 1.17% 1.13% 1.15% 1.54% 72bps 38bps
CITIC 1.09% 0.94% 0.97% 1.05% 1.27% 1.16% 0.78% -16bps -39bps
Minsheng 1.53% 0.74% 1.81% 1.46% 1.99% 1.75% 1.14% 41bps -61bps
CQRCB 0.92% -0.42% 0.85% 0.22% 1.01% 0.63% 0.17% 59bps -47bps
Big-4 0.45% 0.46% 0.85% 0.70% 1.28% 0.94% 1.06% 61bps 13bps
SOE banks 0.47% 0.46% 0.79% 0.69% 1.29% 0.94% 0.97% 51bps 3bps
JS banks 1.03% 0.83% 1.29% 1.23% 1.46% 1.36% 1.15% 32bps -20bps
National 0.68% 0.60% 0.98% 0.89% 1.35% 1.10% 1.04% 44bps -6bps
All covered 0.71% 0.49% 0.97% 0.81% 1.32% 1.05% 0.94% 46bps -10bps
Note: NPL formation ratio (annualised) is to measure real NPL increase adding back disposals and write-offs. We use 2H14 NPL formation ratio to exclude seasonal factors. Banks usually allocate more NPL disposal by year-end which inflates our calculated NPL formation ratio Source: Companies, DBS Vickers estimates
Banks to accelerate NPL disposal. Banks are encouraged to speed up NPL write-offs and disposals, as regulators has relaxed NPL write-off restrictions and simplified the NPL write-off procedure. This will help banks to lower NPL ratio and increase NPL coverage, given current high provision-to-loan ratio. Previously, only the Big 4 national asset management companies (Great Wall, Cinda, Huarong and Orient) were allowed to help banks with NPL disposals since China SOE banks' restructuring in 2004-2005. In Jul-14, China’s banking regulator allowed five provincial governments to set up asset
management firms to buy NPLs from financial institutions. Shanghai, Guangdong, Zhejiang, Jiangsu and Anhui provinces are included in this trial programme. Recently, Wenzhou City is also applying to set up an “NPL bank”. Besides asset management firms, trust firms are also involved in NPL collection. Today, banks and asset management firms also use the internet platform to sell NPL. Cinda Asset Management has sold Rmb172.4m of debt and NPL packages on the Taobao platform in 2Q15, according to our calculation.
Industry Focus
China Banking Sector
Page 11
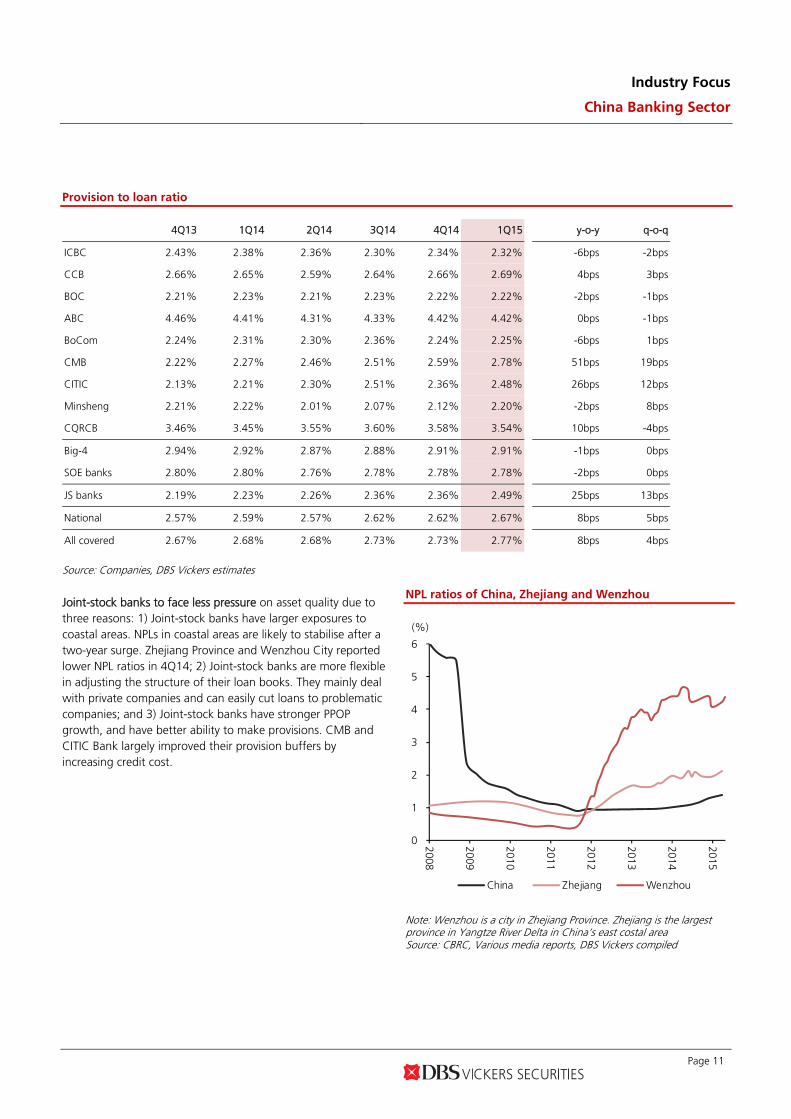
Provision to loan ratio
4Q13 1Q14 2Q14 3Q14 4Q14 1Q15 y-o-y q-o-q
ICBC 2.43% 2.38% 2.36% 2.30% 2.34% 2.32% -6bps -2bps
CCB 2.66% 2.65% 2.59% 2.64% 2.66% 2.69% 4bps 3bps
BOC 2.21% 2.23% 2.21% 2.23% 2.22% 2.22% -2bps -1bps
ABC 4.46% 4.41% 4.31% 4.33% 4.42% 4.42% 0bps -1bps
BoCom 2.24% 2.31% 2.30% 2.36% 2.24% 2.25% -6bps 1bps
CMB 2.22% 2.27% 2.46% 2.51% 2.59% 2.78% 51bps 19bps
CITIC 2.13% 2.21% 2.30% 2.51% 2.36% 2.48% 26bps 12bps
Minsheng 2.21% 2.22% 2.01% 2.07% 2.12% 2.20% -2bps 8bps
CQRCB 3.46% 3.45% 3.55% 3.60% 3.58% 3.54% 10bps -4bps
Big-4 2.94% 2.92% 2.87% 2.88% 2.91% 2.91% -1bps 0bps
SOE banks 2.80% 2.80% 2.76% 2.78% 2.78% 2.78% -2bps 0bps
JS banks 2.19% 2.23% 2.26% 2.36% 2.36% 2.49% 25bps 13bps
National 2.57% 2.59% 2.57% 2.62% 2.62% 2.67% 8bps 5bps
All covered 2.67% 2.68% 2.68% 2.73% 2.73% 2.77% 8bps 4bps
Source: Companies, DBS Vickers estimates
Joint-stock banks to face less pressure on asset quality due to three reasons: 1) Joint-stock banks have larger exposures to coastal areas. NPLs in coastal areas are likely to stabilise after a two-year surge. Zhejiang Province and Wenzhou City reported lower NPL ratios in 4Q14; 2) Joint-stock banks are more flexible in adjusting the structure of their loan books. They mainly deal with private companies and can easily cut loans to problematic companies; and 3) Joint-stock banks have stronger PPOP growth, and have better ability to make provisions. CMB and CITIC Bank largely improved their provision buffers by increasing credit cost.
NPL ratios of China, Zhejiang and Wenzhou
0
1
2
3
4
5
6
2008
2009
2010
2011
2012
2013
2014
2015
(%)
China Zhejiang Wenzhou
Note: Wenzhou is a city in Zhejiang Province. Zhejiang is the largest province in Yangtze River Delta in China’s east costal area Source: CBRC, Various media reports, DBS Vickers compiled

Industry Focus
China Banking Sector
Page 12
Long-term driver: Mixed-ownership reforms
BoCom was the first commercial bank to start the mixed ownership reform following the approval by State Council of its reform plan on 16-Jun-15. BoCom already has diversified ownership as it first introduced foreign capital between 2003 and 2004. Besides BoCom, more than 20 China banks also introduced foreign banks as strategic partners from 1996-2008. BoCom has learnt credit card management, risk management,
and internal auditing from HSBC. However, HSBC only held 19% of BoCom’s total shares, and 40.41% of BoCom was state-owned as at end of Mar-15. This results in restrictions in management appointment, employee stock ownership plan (ESOP), decision-making autonomy, and internal structure. HSBC may be allowed to increase shareholding after the reform, and BoCom is also considering introducing private capital.
Foreign investors’ investments in China banks
Domestic Bank Foreign Investors Amount Shareholding Year CEB Asian Development Bank US$19m 3.59% 01-Jan-96
Bank of Shanghai IFC US$55.1m 7% 01-Dec-99 HSBC Holdings US$63m 8% 01-Dec-01 Shanghai Commercial Bank US$23.6m 3% 01-Dec-01
Bank of Nanjing IFC US$27m 15% 01-Nov-01 BNP Paribas US$87m 19.20% 13-Oct-05
SPDB Citigroup US$67m 4.62% 01-Dec-02
Industrial Bank Hang Seng Bank Rmb1,725m 15.98% 01-Dec-03 Government of Singapore Rmb540m 5% 01-Dec-03 IFC Rmb432m 4% 01-Dec-03
BoCom HSBC Holdings US$174.7bn 19.90% 01-Aug-04
Bank of Xi'an IFC n.a. 2.50% 01-Oct-04 Scotiabank n.a. 2.50% 01-Oct-04 Scotiabank US$155m 14.77% 01-Jan-10
Qilu Bank CBA n.a. 11% 01-Nov-04 Minsheng IFC US$25m 1.08% 01-Nov-04
Tamesek Rmb1.2bn 4.55% 01-Nov-04 Pingan Bank New Bridge Capital Rmb1.5bn 17.89% 01-Dec-04 Bohai Bank Standard Chartered Bank US$123m 19.99% 01-Dec-04 Bank of Beijing IFC Rmb420m 5% 25-Mar-05
ING Bank Rmb1.78bn 19.90% 25-Mar-05 Bank of Hangzhou CBA Rmb625m 19.90% 01-Apr-05 CCB Bank of America US$2.5bn 9.10% 01-Jun-05
Tamesek US$1.4bn 5.10% 01-Jul-05 Nanchong City Commercial Bank DEG EUR3m 10.00% 08-Jul-05
SIDT EUR1m 3.30% 08-Jul-05 BOC RBS China US$3.048bn 9.61% 20-Aug-05
Singapore's Temasek Holdings US$1.52bn 4.8% 20-Aug-05
Asian Development Bank US$73.74m 0.23% 01-Oct-05
UBS AG US$491.57m 1.55% 01-Sep-05 Bank of Ningbo UOB Rmb570m 12.20% 01-Jan-06 ICBC Goldman Sachs US$2.58bn 5.75% 28-Apr-06
Allianz EUR824.7m 2.25% 28-Apr-06
American Express US$200m 0.45% 28-Apr-06 Huaxia Bank Deutsche Bank US$330m 13.98% 01-May-06 Guangfa Bank Citigroup Rmb5.67bn 19.99% 18-Nov-06
IBM Credit n.a. 4.74% 18-Nov-06 Yantai Bank Heng Sang Bank Rmb800m 19.99% 31-Jan-08
Wing Lung Bank Rmb200m 4.99% 31-Jan-08 Bank of Yingkou CIMB Bank Rmb350m 19.99% 21-Mar-08
Source: Various media reports, DBS Vickers compiled
Industry Focus
China Banking Sector
Page 13
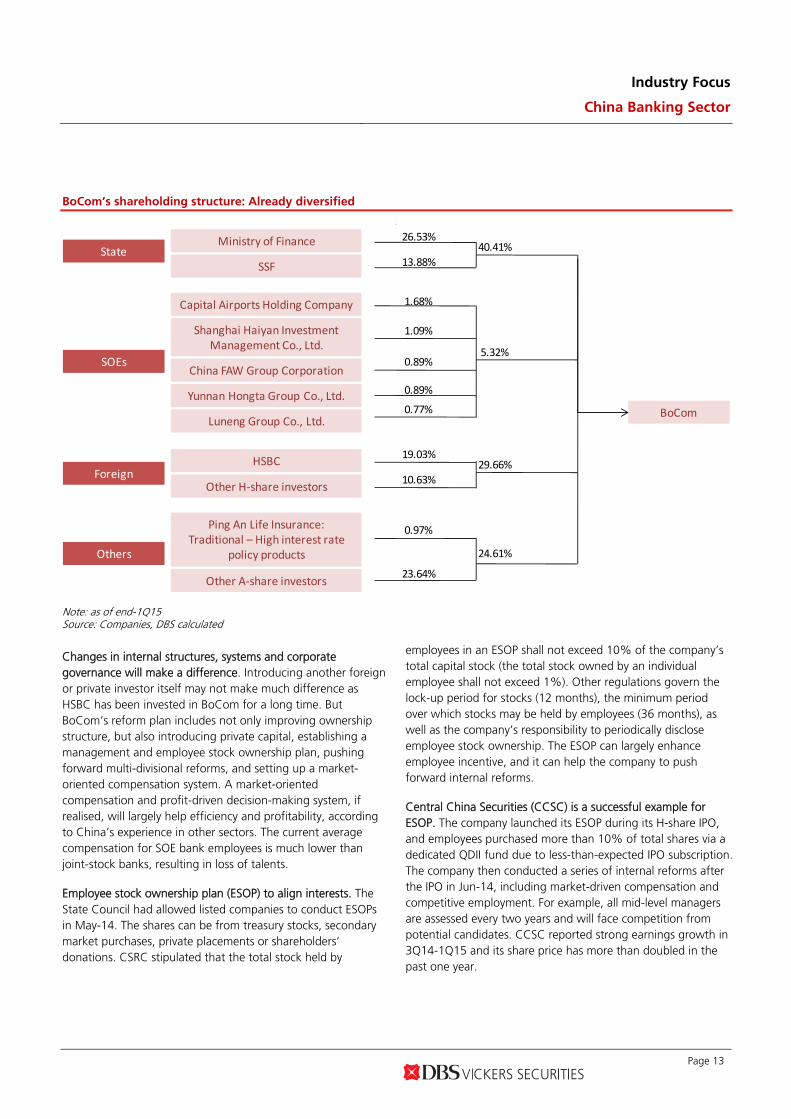
BoCom’s shareholding structure: Already diversified
aud
5.32%
29.66%
40.41%
24.61%
Ministry of Finance
HSBC
SSF
Capital Airports Holding Company
Shanghai Haiyan Investment Management Co., Ltd.
Ping An Life Insurance:Traditional – High interest rate
policy products
China FAW Group Corporation
Yunnan Hongta Group Co., Ltd.
Luneng Group Co., Ltd.
State
Foreign
Others
BoCom
26.53%
13.88%
0.89%
0.89%
0.77%
1.09%
1.68%
10.63%
19.03%
0.97%
Other A‐share investors23.64%
Other H‐share investors
SOEs
Note: as of end-1Q15 Source: Companies, DBS calculated
Changes in internal structures, systems and corporate governance will make a difference. Introducing another foreign or private investor itself may not make much difference as HSBC has been invested in BoCom for a long time. But BoCom’s reform plan includes not only improving ownership structure, but also introducing private capital, establishing a management and employee stock ownership plan, pushing forward multi-divisional reforms, and setting up a market-oriented compensation system. A market-oriented compensation and profit-driven decision-making system, if realised, will largely help efficiency and profitability, according to China’s experience in other sectors. The current average compensation for SOE bank employees is much lower than joint-stock banks, resulting in loss of talents.
Employee stock ownership plan (ESOP) to align interests. The State Council had allowed listed companies to conduct ESOPs in May-14. The shares can be from treasury stocks, secondary market purchases, private placements or shareholders’ donations. CSRC stipulated that the total stock held by
employees in an ESOP shall not exceed 10% of the company’s total capital stock (the total stock owned by an individual employee shall not exceed 1%). Other regulations govern the lock-up period for stocks (12 months), the minimum period over which stocks may be held by employees (36 months), as well as the company’s responsibility to periodically disclose employee stock ownership. The ESOP can largely enhance employee incentive, and it can help the company to push forward internal reforms.
Central China Securities (CCSC) is a successful example for ESOP. The company launched its ESOP during its H-share IPO, and employees purchased more than 10% of total shares via a dedicated QDII fund due to less-than-expected IPO subscription. The company then conducted a series of internal reforms after the IPO in Jun-14, including market-driven compensation and competitive employment. For example, all mid-level managers are assessed every two years and will face competition from potential candidates. CCSC reported strong earnings growth in 3Q14-1Q15 and its share price has more than doubled in the past one year.
Industry Focus
China Banking Sector
Page 14
Minsheng, CMB, and Bank of Beijing have announced their ESOPs; BoCom, CCB, BOC and ABC have indicated their interest in introducing similar plans. Minsheng announced its ESOP in Nov-14, but this is still under discussion. Meanwhile, CMB launched its ESOP on 19-Jun-15. Employees are allowed to purchase Rmb6bn shares in 2015, and another Rmb4bn in the next four years. CMB has been more aggressive since the new president Tian Huiyu came on board. The more profit-driven performance evaluation system brought about investors’ concerns on employees’ potential short-sighted behaviour. This employee stock incentive programme, covering 8,500 mid- to high-level management with a 3-year lock-up period, will largely align employees’ interest with shareholders', and improve the company’s mid- to long-term incentives.
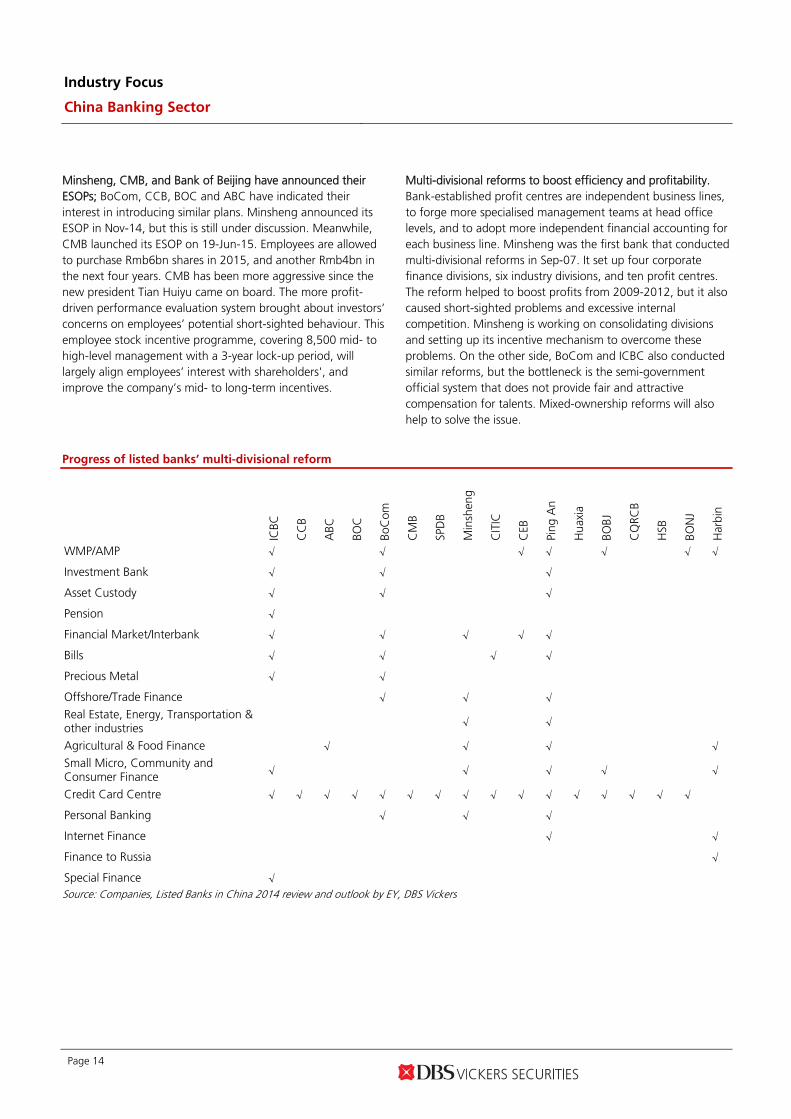
Multi-divisional reforms to boost efficiency and profitability. Bank-established profit centres are independent business lines, to forge more specialised management teams at head office levels, and to adopt more independent financial accounting for each business line. Minsheng was the first bank that conducted multi-divisional reforms in Sep-07. It set up four corporate finance divisions, six industry divisions, and ten profit centres. The reform helped to boost profits from 2009-2012, but it also caused short-sighted problems and excessive internal competition. Minsheng is working on consolidating divisions and setting up its incentive mechanism to overcome these problems. On the other side, BoCom and ICBC also conducted similar reforms, but the bottleneck is the semi-government official system that does not provide fair and attractive compensation for talents. Mixed-ownership reforms will also help to solve the issue.
Progress of listed banks’ multi-divisional reform
ICBC
CC
B
ABC
BOC
BoC
om
CM
B
SPD
B
Min
shen
g
CIT
IC
CEB
Ping
An
Hua
xia
BOBJ
CQ
RCB
HSB
BON
J
Har
bin
WMP/AMP √ √ √ √ √ √ √
Investment Bank √ √ √ Asset Custody √ √ √ Pension √ Financial Market/Interbank √ √ √ √ √ Bills √ √ √ √ Precious Metal √ √ Offshore/Trade Finance √ √ √ Real Estate, Energy, Transportation & other industries √ √
Agricultural & Food Finance √ √ √ √ Small Micro, Community and Consumer Finance √ √ √ √ √
Credit Card Centre √ √ √ √ √ √ √ √ √ √ √ √ √ √ √ √ Personal Banking √ √ √ Internet Finance √ √
Finance to Russia √
Special Finance √
Source: Companies, Listed Banks in China 2014 review and outlook by EY, DBS Vickers

Industry Focus
China Banking Sector
Page 15
Long-term driver: Potential overseas expansion boosted
by One-Belt-One-Road Plan
Huge capital demand. The proposed One-Belt-One-Road Plan is mainly supporting infrastructure networks in Asia, Europe and North Africa. The Asian Development Bank estimates infrastructure investment demand in the region at US$730bn annually for the next 10 years. China has proposed initial registered capital of US$100bn, US$40bn and US$100n for AIIB, Silk Road Fund and BRICS Development Bank respectively to support regional funding needs. China’s commercial banks should also expand in the region and cooperate closely with these international institutions.
Lower-than-global-peers coverage in the region. China banks’ coverage in the region of the One-Belt-One-Road Plan is much lower than global banks. As China’s foreign trade with 64 countries is expected to top US$2.5tn in the next 10 years, up from less than US$1tn in 2014, China banks will likely expand overseas together with their clients.
No. of countries covered by banks
14
0
4
14
0
2
21
1
10
21
12
23
1
3
0
5
10
15
20
25
Asia Africa EuropeBOC ICBC Citi STAN HSBC
Source: Company, DBS Vickers
To fasten banks’ loan growth and fee income. China banks will benefit from the One-Belt-One-Road Plan in four areas: 1) Increasing new loan demand: China banks are expected to provide credit support (e.g. syndicated loan, trading finance) together with international financial institutions for infrastructure projects, direct investments, cross-border ordering and trading, forfeiting, and commodity financing; 2) Financial advisory and investment banking opportunities; there should be increasing M&A and equity-raising deals; 3) Cross-border cash management and financial solutions; as banks’ clients are expanding their overseas businesses, China banks will see increasing demand for cross-border cash management, financing guarantees, and foreign exchange hedging.
Challenges for China banks. Considerable time is needed to finally construct project after the conclusion of successful negotiations with governments and related parties. It will take even more time for banks to enjoy the returns from their investments as the maturity periods of most infrastructure projects are quite long. The potential investment return will be hard to determine due to the free rider problem prevalent in infrastructure projects. Payment methods can vary as some projects may be paid for with commodities.

Industry Focus
China Banking Sector
Page 16
Banks are well prepared for trend towards Internet
financing
Banks are embracing the digital era. Common belief is that new internet players may increase challenges faced by banks in three key areas - third party payments/payment habits, online mutual market funds, and online lending. However, we find that the disruption may be much milder than expected given that banks are already embracing the internet trend. However, banks with unique branch network advantages such as ABC, and rural banks may see their advantages erode. Small city commercial banks are also potential losers given their limited IT capacity and investment in infrastructure. We will compare banks’ internet strategy and development, focusing on organisational structure, mobile apps, direct banking, E-commerce, online lending vs private banks that have been set up by internet giants to determine which banks are better positioned for the internet era. In summary, we believe ICBC and CMB are ahead in the digital race. ICBC: In Mar 2015, ICBC launched its Internet finance brand “e-ICBC” that combines the bank's existing e-commerce business, product direct-selling units, and instant communications, to become the first commercial bank to promote an internet finance brand in China. ICBC’s Internet financial strategy is made up of 3 platforms, namely e-commerce "Rong-e-gou", instant messaging "Rong-e-lian" and direct bank "Rong-e-hang", and 3 major product lines, including payment, financing and investment. We believe ICBC will stand out in the longer term given its advantages in its vast user base and strong war chest for technology investment. ICBC still dominates in the mobile segment with a higher
percentage of frequent users among all commercial banks according to Iresearch in 2013. CMB has been a pioneer in the use of technical innovation and IT to compete in the rapidly changing banking environment. Backed by more advanced IT technology and unified platform, the bank introduced an "all-in-one" card in 1995, which integrates its financial products. This laid a solid foundation for CMB’s retail banking business and enabled CMB to be ranked first among China’s joint stock banks and sixth among all China's commercial banks today. In 2012, the bank started to build its own Big Data platform based on cloud computing systems at a time when Big Data was a relatively new concept. Now, the bank is striving to establish an overall structure for Internet finance featuring “platform, flow and big data” to promote the transformation of its business model to be more network-oriented. We believe CMB is well positioned in terms of online platform construction, with mobile finance platform, the Small Business E Home platform, the smart supply chain platform and the Banking E-Tong platform covering retail finance, corporate finance and financial institutions. CMB is also the most frequently used bank in WeChat. Organisational structure: Most of the listed banks have set up or upgraded their internet finance department. The Big 4 banks have all set up or upgraded their e-banking departments to include internet finance in 2014. Some JSBs were more farsighted by doing the same in 2H13, like Ping An Bank and Guangfa Bank.
Mobile apps: Mobile migration already gaining traction for some banks. Most of the listed SOE banks and JSBs have launched mobile apps with comprehensive functions. Leading banks have 30-45% of customers that have already tried mobile banking and frequent user proportion is ~20% for ICBC and 17-18% each for CCB and CMB. This ratio should continue to increase in the future given more updated versions and functions in mobile apps.
Industry Focus
China Banking Sector
Page 17
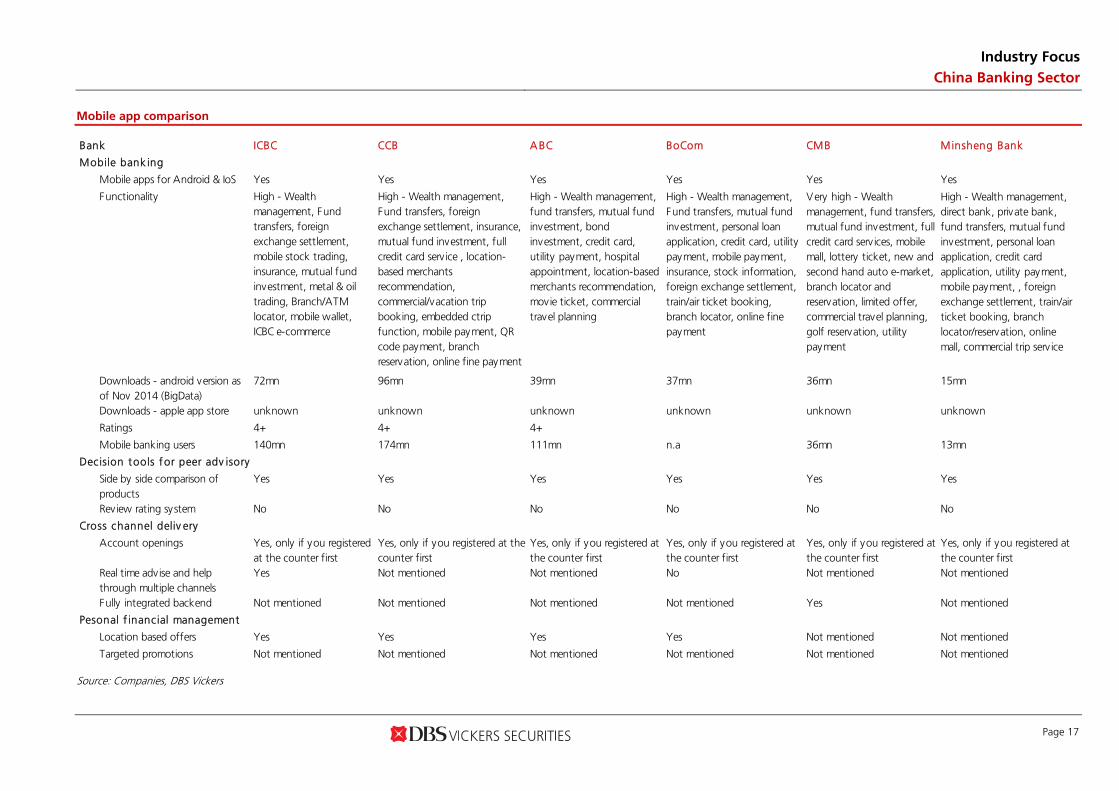
Mobile app comparison Bank ICBC CCB A BC BoCom CMB Minsheng Bank
Mobile bank ing
Mobile apps for Android & IoS Yes Yes Yes Yes Yes Yes
Functionality High - Wealthmanagement, Fundtransfers, foreignexchange settlement,mobile stock trading,insurance, mutual fundinvestment, metal & oiltrading, Branch/ATMlocator, mobile wallet,ICBC e-commerce
High - Wealth management,Fund transfers, foreignexchange settlement, insurance,mutual fund investment, fullcredit card serv ice , location-based merchantsrecommendation,commercial/vacation tripbooking, embedded ctripfunction, mobile payment, QRcode payment, branchreservation, online fine payment
High - Wealth management,fund transfers, mutual fundinvestment, bondinvestment, credit card,utility payment, hospitalappointment, location-basedmerchants recommendation,movie ticket, commercialtravel planning
High - Wealth management,Fund transfers, mutual fundinvestment, personal loanapplication, credit card, utilitypayment, mobile payment,insurance, stock information,foreign exchange settlement,train/air ticket booking,branch locator, online finepayment
Very high - Wealthmanagement, fund transfers,mutual fund investment, fullcredit card serv ices, mobilemall, lottery ticket, new andsecond hand auto e-market,branch locator andreservation, limited offer,commercial travel planning,golf reservation, utilitypayment
High - Wealth management,direct bank, private bank,fund transfers, mutual fundinvestment, personal loanapplication, credit cardapplication, utility payment,mobile payment, , foreignexchange settlement, train/airticket booking, branchlocator/reservation, onlinemall, commercial trip serv ice
Downloads - android version asof Nov 2014 (BigData)
72mn 96mn 39mn 37mn 36mn 15mn
Downloads - apple app store unknown unknown unknown unknown unknown unknown
Ratings 4+ 4+ 4+
Mobile banking users 140mn 174mn 111mn n.a 36mn 13mn
Decision tools for peer adv isory
Side by side comparison ofproducts
Yes Yes Yes Yes Yes Yes
Review rating system No No No No No No
Cross channel deliv ery
Account openings Yes, only if you registeredat the counter first
Yes, only if you registered at thecounter first
Yes, only if you registered atthe counter first
Yes, only if you registered atthe counter first
Yes, only if you registered atthe counter first
Yes, only if you registered atthe counter first
Real time advise and helpthrough multiple channels
Yes Not mentioned Not mentioned No Not mentioned Not mentioned
Fully integrated backend Not mentioned Not mentioned Not mentioned Not mentioned Yes Not mentioned
Pesonal f inancial management
Location based offers Yes Yes Yes Yes Not mentioned Not mentioned
Targeted promotions Not mentioned Not mentioned Not mentioned Not mentioned Not mentioned Not mentioned
Source: Companies, DBS Vickers
Industry Focus
China Banking Sector
Page 18
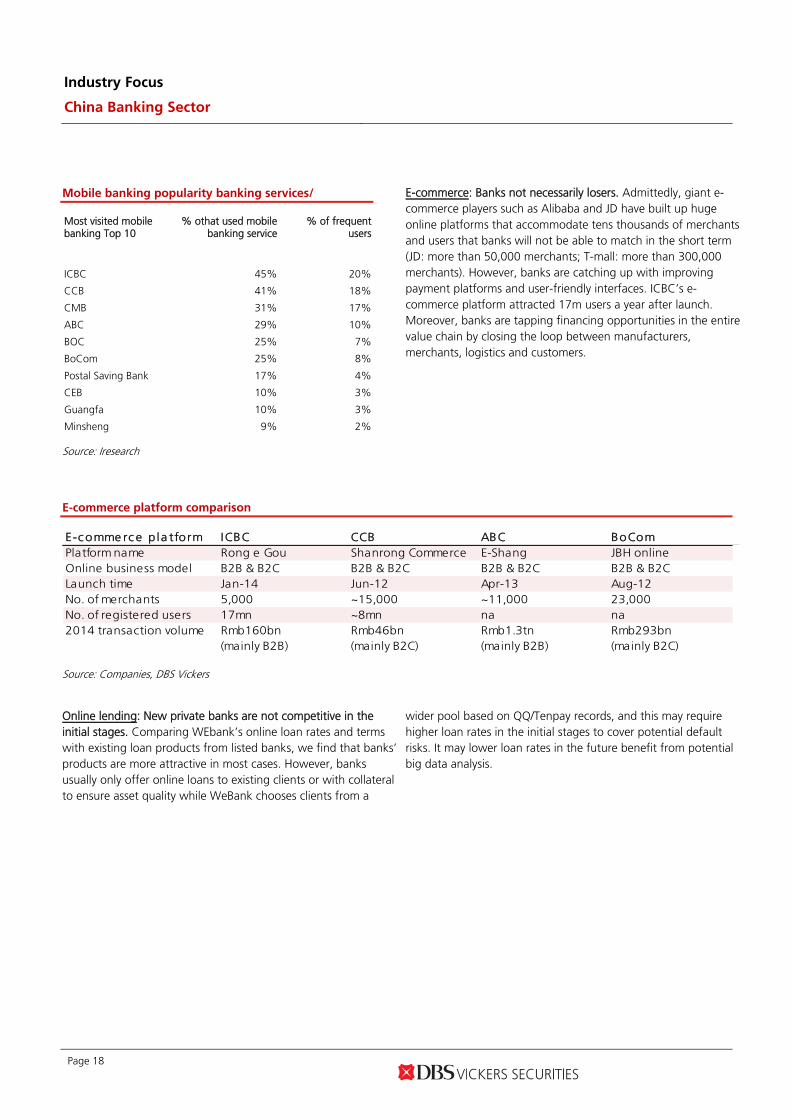
Mobile banking popularity banking services/
Most visited mobile banking Top 10
% othat used mobile banking service
% of frequent users
ICBC 45% 20%
CCB 41% 18%
CMB 31% 17%
ABC 29% 10%
BOC 25% 7%
BoCom 25% 8%
Postal Saving Bank 17% 4%
CEB 10% 3%
Guangfa 10% 3%
Minsheng 9% 2%
Source: Iresearch
E-commerce: Banks not necessarily losers. Admittedly, giant e-commerce players such as Alibaba and JD have built up huge online platforms that accommodate tens thousands of merchants and users that banks will not be able to match in the short term (JD: more than 50,000 merchants; T-mall: more than 300,000 merchants). However, banks are catching up with improving payment platforms and user-friendly interfaces. ICBC’s e-commerce platform attracted 17m users a year after launch. Moreover, banks are tapping financing opportunities in the entire value chain by closing the loop between manufacturers, merchants, logistics and customers.
E-commerce platform comparison
E-c omme rc e p la tform ICBC CCB ABC BoComPlatform name Rong e Gou Shanrong Commerce E-Shang JBH onlineOnline business model B2B & B2C B2B & B2C B2B & B2C B2B & B2CLaunch time Jan-14 Jun-12 Apr-13 Aug-12No. of merchants 5,000 ~15,000 ~11,000 23,000No. of registered users 17mn ~8mn na na2014 transaction volume Rmb160bn
(mainly B2B)Rmb46bn(mainly B2C)
Rmb1.3tn(mainly B2B)
Rmb293bn(mainly B2C)
Source: Companies, DBS Vickers
Online lending: New private banks are not competitive in the initial stages. Comparing WEbank’s online loan rates and terms with existing loan products from listed banks, we find that banks’ products are more attractive in most cases. However, banks usually only offer online loans to existing clients or with collateral to ensure asset quality while WeBank chooses clients from a
wider pool based on QQ/Tenpay records, and this may require higher loan rates in the initial stages to cover potential default risks. It may lower loan rates in the future benefit from potential big data analysis.
Industry Focus
China Banking Sector
Page 19
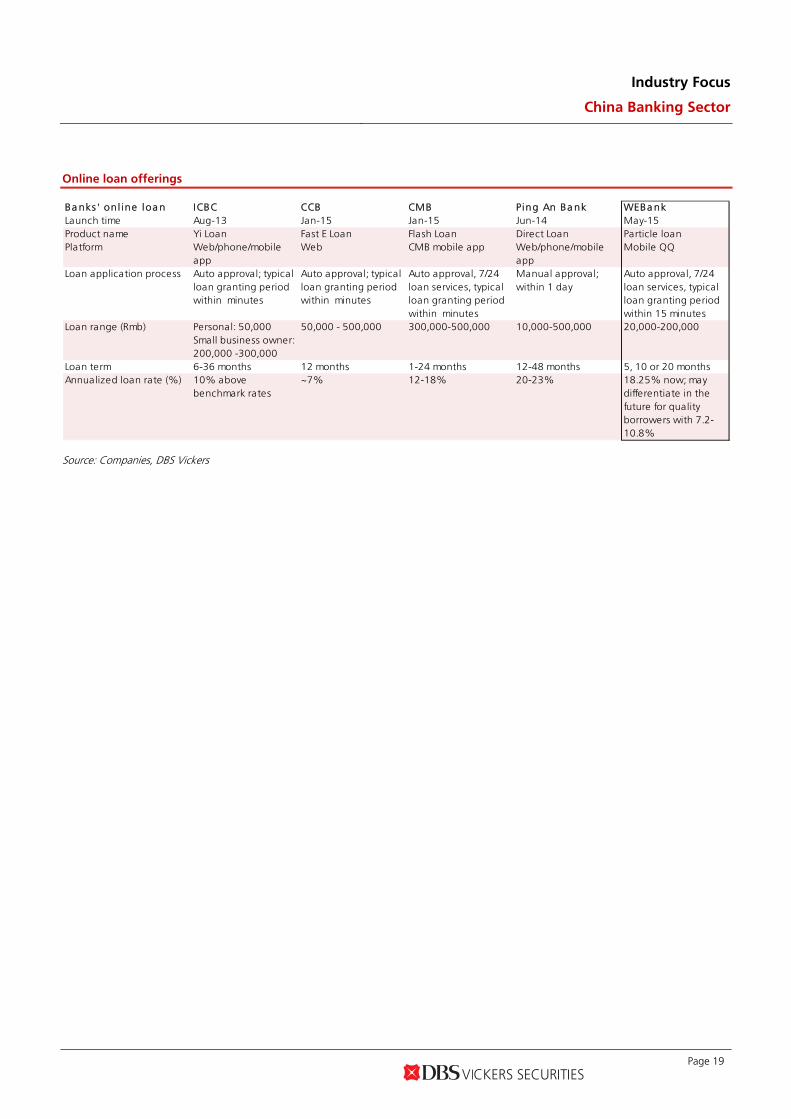
Online loan offerings
Ba nks ' on l ine loa n ICBC CCB CMB Ping An Ba nk WEBa nkLaunch time Aug-13 Jan-15 Jan-15 Jun-14 May-15Product name Yi Loan Fast E Loan Flash Loan Direct Loan Particle loanPlatform Web/phone/mobile
appWeb CMB mobile app Web/phone/mobile
appMobile QQ
Loan application process Auto approval; typicalloan granting periodwithin minutes
Auto approval; typicalloan granting periodwithin minutes
Auto approval, 7/24loan services, typicalloan granting periodwithin minutes
Manual approval;within 1 day
Auto approval, 7/24loan services, typicalloan granting periodwithin 15 minutes
Loan range (Rmb) Personal: 50,000Small business owner:200,000 -300,000
50,000 - 500,000 300,000-500,000 10,000-500,000 20,000-200,000
Loan term 6-36 months 12 months 1-24 months 12-48 months 5, 10 or 20 monthsAnnualized loan rate (%) 10% above
benchmark rates~7% 12-18% 20-23% 18.25% now; may
differentiate in thefuture for qualityborrowers with 7.2-10.8%
Source: Companies, DBS Vickers
Industry Focus
China Banking Sector
Page 20
Concern on government’s bailout creates entry point for
H-share China banks
China outlined a series of actions in the past week to stabilise the stock market and maintain financial stability.
- PBOC liquidity assistance for brokers. PBOC will offer China Securities Finance Corp. (CSFC) liquidity support via multiple ways. China Securities Regulatory Commission (CSRC) will make full use of CSFC, raise money via multiple ways, expand its business scale and strengthen its capability in maintaining market stability. CSFC, which manages the nation’s short selling and margin trading activities, increased its capital from Rmb24bn to maintain financial market stability and expand its business.
- Pace of A-share IPOs and re-financing is slowing. IPO approvals would not be suspended, but the number of new shares hitting the stock market would be cut, according to CSRC. 28 companies planning to list on the country's stock exchanges said on 4-Jul-15 that they would suspend their IPO plans. Caixin reported that equity re-financing projects (e.g. private placement) over Rmb5bn have also been suspended.
- Relaxed margin financing rule. The collateral requirement for margin financing has been relaxed and terms for margin loans have been extended to avoid forced selling and deleveraging. CSRC will no longer require brokerages to force liquidation of stocks held by clients with insufficient collateral.
- Lowered stock trading costs. China’s two bourses will reduce the fees by 30% starting Aug. 1. China Securities Depository & Clearing Co. also announced that it will cut transaction fees by 33% on Aug 1.
- Restriction in futures short-selling. CSRC announced that it will investigate any short-selling in the futures market and punish those involved in market manipulation. The China Financial Futures Exchange suspended 19 accounts for a month due to short selling activities. Some brokers also have restricted some clients from selling futures started from 6-Jul-15.
- Brokers increase shareholding. China's top 21 securities brokerages said on 4-July that they would collectively invest at least Rmb120bn in blue-chips ETF. They pledged not to reduce any proprietary investments in the equity market as long as the Shanghai Composite Index stays below 4,500. Listed brokers will buy back shares, and encourage large shareholders and parent companies to increase their shareholdings.
- Sovereign fund and mutual funds also help. Central Huijin Investment, a unit of China’s sovereign wealth fund, said on 5-Julythat it had bought exchange-traded funds on the secondary market recently. Twenty five public funds announced that they will invest more funds in equities and hold these for more than one year, and 69 funds announced that they would follow. CSRC will implement different channels to guide investors with long time horizons into the equity markets. One action taken includes allowing the National Social Security Fund (NSSF) to buy equities. Further policies include expanding QFII, RQFII, QDII, and Hong Kong mutual fund recognition programs.
Banks are still safe during deleveraging. Market estimates suggest that China banks have c.Rmb2tn of assets involved in capital markets. Most of these funds have been lent to brokers and trust companies, who have then given loans to their clients through margin financing and umbrella trusts. Banks are quite safe as we do not expect any defaults by brokers and trust firms. Brokers and trust firms’ risks are still low due to the low leverage ratio (margin financing <1.5, umbrella trust <3) and more flexible margin call mechanisms in place. Investors with collateral of less than 150% of their loans on margins are required to replenish within 2 trading days, and collateral stocks will be forced into liquidation if the ratio falls to 130%. Regulators have announced that they will give brokers more flexibility on forced liquidation ratio and investors’ replenish methods, but brokers are expected to maintain the ratio at least above 100%. Of the Rmb2tn bank funds, an estimated Rmb40bn have been lent to shareholders as equity pledged lending. Risk should be relatively low given <50% LTV ratio.
Positive for banks; H-share slump provides entry point.
1) Arresting a major selloff helps to avoid financial sector risks. Brokers issued margin calls to c.15-20% of margin financing accounts last Friday, according to a market survey. Banks and brokers believe there would be a forced liquidation wave if the Shanghai Composite Index declines to 3,300 (Friday’s close: 3,686.92).
2) A-share national banks would be the first to benefit. The Rmb120bn fund invested by 21 brokers will be mainly invested into SSE50, SSE180, and CSI300 index stocks. National banks and large brokers are constituents for all these indexes. 3) H-share investors may be concerned about the impact of China’s government bailout. We believe the Chinese government and regulators are able to protect the financial sector from systemic risk given multiple tools at their disposal and strong financial capability. The H-share financial sector should also benefit from ample liquidity and decent discounts to A-share prices.

Industry Focus
China Banking Sector
Page 21
Valuation and recommendation
Banks’ comparison (score 1-5 for each, 1 is the best)
ICBC CCB BOC A BC BoCom CM B CIT IC M insheng CQRCB
NIM 2 2 2 3 2 1 3 4 2
Fee income 4 3 4 5 2 1 1 1 2
NPL formation 3 2 3 3 1 3 1 4 2
Loan risk 2 1 3 4 2 3 3 4 3
Prov ision 2 1 2 1 3 1 2 4 1
Capital 1 1 2 3 2 1 3 4 1
Overall 4 3 4 5 3 3 3 5 3
H-share P/B 1.13 1.10 1.04 0.97 0.97 1.39 0.86 1.08 1.09 A-share P/B 1.34 1.37 1.32 1.22 1.37 1.51 1.49 1.40 n.a.
aud
Note: 6 Jul-2015 Source: DBS Vickers estimated
Our stock picks are BoCom-H & CITIC-H; ICBC-A & CMB-A. We have not changed our FY15-FY17F earnings forecast. But we have increased the mid-term (2nd stage) growth rate for BoCom to factor in the positive impact from the mixed-ownership reform and potential mixed-operation reform that allows banks to conduct brokerage and diversified financial service. Our stock picks are CITIC-H, BoCom-H; CMB-A & ICBC A. We continue to like CMB-A and CITIC-H. We like CMB for its prudent risk management, better-than-peers PPOP growth, strong provisions and capital levels, and leading internet platform. CITIC Bank has largely improved its provision buffer in the past three quarters, and we expect a turn-around effect in asset quality and earnings in 2H15-2016. It’s H-share valuation is very attractive.
BoCom-H
We started to recommend BoCom-A as our top pick among A-share SOE banks after 1Q15 results. BoCom-A has risen 25.6%, but BoCom-H is largely unchanged. We believe H-share investors will recover confidence once more details about reform and asset quality are released. We see potential upside for BoCom-H due to reasons stated below.
- To be a universal bank. BoCom Intl., the wholly-owned subsidiary of BoCom, has just received approval from Jiangsu CSRC to acquire Huaying Securities. BoCom has acquired all financial sector licenses in mainland China and is on track to become a universal bank. We expect BoCom to extract synergies among its banking, brokerage, asset management, insurance, trust and financial leasing arms, which should accelerate fee income growth.
- Mixed-ownership reform and internal restructuring. BoCom has obtained approval from State Council for mixed-ownership reform, the first among SOE banks. It will likely make a start on the reform this year, according to Chairman NIU Ximing. The bank may launch an employee stock incentive plan and build a more performance-driven compensation system, which will align various interests and increase efficiency. BoCom was the first SOE bank to start a multi-divisional reform, and mixed-ownership reform will help it to complete the whole reform process, paving the road for potential asset spin-offs (e.g. credit card, interbank, asset management). This will further boost efficiency.
- Better NPL trends. BoCom reported the fastest increase in NPL ratio among SOE banks in the past two years due to its higher exposure to steel trading businesses and SMEs in Yangtze River Delta. But the NPL ratio for east China has been stabilising since 2H14, but it is increasing rapidly in central and west China, where BoCom has less exposure than peers. BoCom should be the first SOE bank to see a decline in credit cost, and we expect a turn-around effect in profit growth in 2H15-2016.
- Market-driven pricing. BoCom is less impacted by the continuing interest rate liberalisation as it is less reliant on deposits, and the pricing of its wealth management products is already market driven. BoCom reported a q-o-q increase in NIM in 1Q15 driven by better lending-borrowing spreads of its interbank business.
- Benefit from removal of LDR cap. BoCom has the highest loan-to-deposit ratio among SOE banks, and it will benefit most from the removal of the LDR cap.

Industry Focus
China Banking Sector
Page 22
ICBC-A
ICBC has been a stable, albeit unexciting Chinese bank for a long time. But this image could change as we understand that the bank has expanded the most overseas in the past several years and its coverage is now closed to BOC; we listened to the TED-style speech made by ICBC’s president as the bank became a pioneer in internet financing and has the most
comprehensive internet platform among banks. We like ICBC’s innovation capability and global vision, as well as its solid capital position and prudent risk management. A-share retail investors had ignored the bank in the past due to its large cap, but as a heavy-weight index constituent, ICBC-A will benefit from China’s bailout plan to save the A-share market in the short-term.
Valuation comparison -H
B loombe rg Clos ing Stoc k Ta rge t Ups ide / EPS CAGR
Tic ke r pri c e ra ting Pric e Dwns ide FY14 FY15F 14-16 FY14 FY15F FY14 FY15F FY14 FY15F(HK$) (HK$) (%) (X) (X) (%) (%) (%) (X) (X) (%) (%)
PRC ba nks (H-sha re )ICBC - H 1398 HK 6.11 Buy 7.30 19 6.2 6.1 2.0 19.7 17.4 1.13 1.01 5.3 5.4 CCB - H 0939 HK 6.85 Buy 8.47 24 6.0 6.0 1.6 19.7 17.3 1.10 0.97 5.5 5.5 BOC - H 3988 HK 4.80 Buy 5.86 22 6.3 6.5 0.4 17.0 15.0 1.04 0.92 4.9 5.0 ABC - H 1288 HK 3.86 Hold 4.63 20 5.6 5.6 1.0 19.2 16.7 0.97 0.89 5.9 6.0 BoCom - H 3328 HK 7.68 Buy 9.34 22 6.9 6.8 1.3 14.8 13.4 0.97 0.87 4.4 4.6 CMB - H 3968 HK 21.60 Buy 26.82 24 7.8 6.9 11.2 19.3 18.3 1.39 1.18 3.9 4.4 CNCB - H 0998 HK 5.97 Buy 8.31 39 5.5 5.4 3.2 16.8 14.6 0.86 0.74 - 5.5 CMBC - H* 1988 HK 9.46 Hold 12.19 29 5.8 5.4 6.4 20.3 17.9 1.08 0.89 2.4 2.8 CQRCB 3618 HK 6.04 Buy 7.50 24 6.6 5.9 8.0 17.6 17.1 1.09 0.94 4.1 4.6 CEB - H* 6818 HK 4.27 NR NA NA 5.5 5.2 n.a. 14.7 15.8 0.85 0.78 6.1 5.7 Huishang* 3698 HK 3.84 NR NA NA 6.0 5.7 n.a. 14.5 15.3 0.93 0.83 5.8 5.3 BoCQ* 1963 HK 6.91 NR NA NA 5.3 4.8 5.8 17.8 18.5 0.94 0.81 5.8 5.2 Harbin* 6138 HK 2.71 NR NA NA 5.9 5.4 5.9 14.2 14.3 0.81 0.70 5.5 5.1 Shengjing* 2066 HK 8.15 NR NA NA 5.2 5.8 6.9 17.1 16.3 1.03 0.92 3.8 3.2 Simple a ve ra ge 6.0 5 .8 4 .5 17.3 16.3 1.01 0.89 4 .5 4 .9
Div yie ldPBVROEPER
Note: close price on 6 Jul 2015. Source: Bloomberg Finance L.P., DBS Vickers estimates
Valuation comparison -A
Bloombe rg Clos ing Stoc k Ta rge t Ups ide / EPS CAGR
Ticke r pri c e ra ting Pric e Dwns ide FY14 FY15F 14-16 FY14 FY15F FY14 FY15F FY14 FY15F(Rmb) (Rmb) (%) (X) (X) (%) (%) (%) (X) (X) (%) (%)
PRC ba nks (A-sha re )ICBC - A 601398 CH 5.79 Buy 6.37 10 7.4 7.3 2.0 19.7 17.4 1.34 1.21 4.4 4.6 CCB - A 601939 CH 6.79 Hold 7.39 9 7.5 7.4 1.6 19.7 17.3 1.37 1.21 4.4 4.4 BOC - A 601988 CH 4.90 Hold 5.11 4 8.1 8.3 0.4 17.0 15.0 1.32 1.19 3.9 3.9 ABC - A 601288 CH 3.86 Hold 4.04 5 7.0 7.0 1.0 19.2 16.7 1.22 1.13 4.7 4.8 BoCom - A 601328 CH 8.69 Buy 8.16 (6) 9.8 9.7 1.3 14.8 13.4 1.37 1.24 3.1 3.2 CMB - A 600036 CH 18.82 Buy 23.42 24 8.5 7.6 11.2 19.3 18.3 1.51 1.29 3.6 4.0 CNCB - A 601998 CH 8.27 Sell 7.26 (12) 9.5 9.5 3.2 16.8 14.6 1.49 1.29 - 3.2 CMBC - A 600016 CH 9.86 FV 10.64 8 7.5 7.1 6.4 20.3 17.9 1.40 1.17 1.9 2.1 CEB - A* 601818 CH 4.84 NR NA NA 8.4 8.1 na 15.2 15.7 1.30 1.19 3.9 3.7 CIB* 601166 CH 16.95 NR NA NA 6.9 6.3 9.9 17.9 18.9 1.24 1.10 3.7 3.4 SPDB* 600000 CH 17.22 NR NA NA 6.8 6.5 11.0 17.5 18.5 1.13 1.10 5.1 4.6 Huaxia* 600015 CH 15.58 NR NA NA 7.7 7.3 5.7 16.9 17.8 1.32 1.19 3.5 3.2 PAB* 000001 CH 13.88 NR NA NA 9.2 8.1 n.a 15.4 16.1 1.39 1.17 1.3 1.3 BOBJ* 601169 CH 12.39 NR NA NA 8.4 8.0 8.8 16.0 15.9 1.31 1.24 3.0 2.7 BONJ* 601009 CH 17.72 NR NA NA 9.4 9.0 10.0 17.1 17.5 1.55 1.49 2.9 2.6 BONB* 002142 CH 18.62 NR NA NA 9.9 9.3 9.6 17.4 17.7 1.69 1.55 2.6 2.3 Simple a ve ra ge 8.2 7 .9 5 .9 17.5 16.8 1.37 1.24 3 .3 3 .4
PER Div yie ldROE PBV
Note: close price on 6 Jul 2015. Source: Bloomberg Finance L.P., DBS Vickers estimates
Industry Focus
China Banking Sector
Page 23
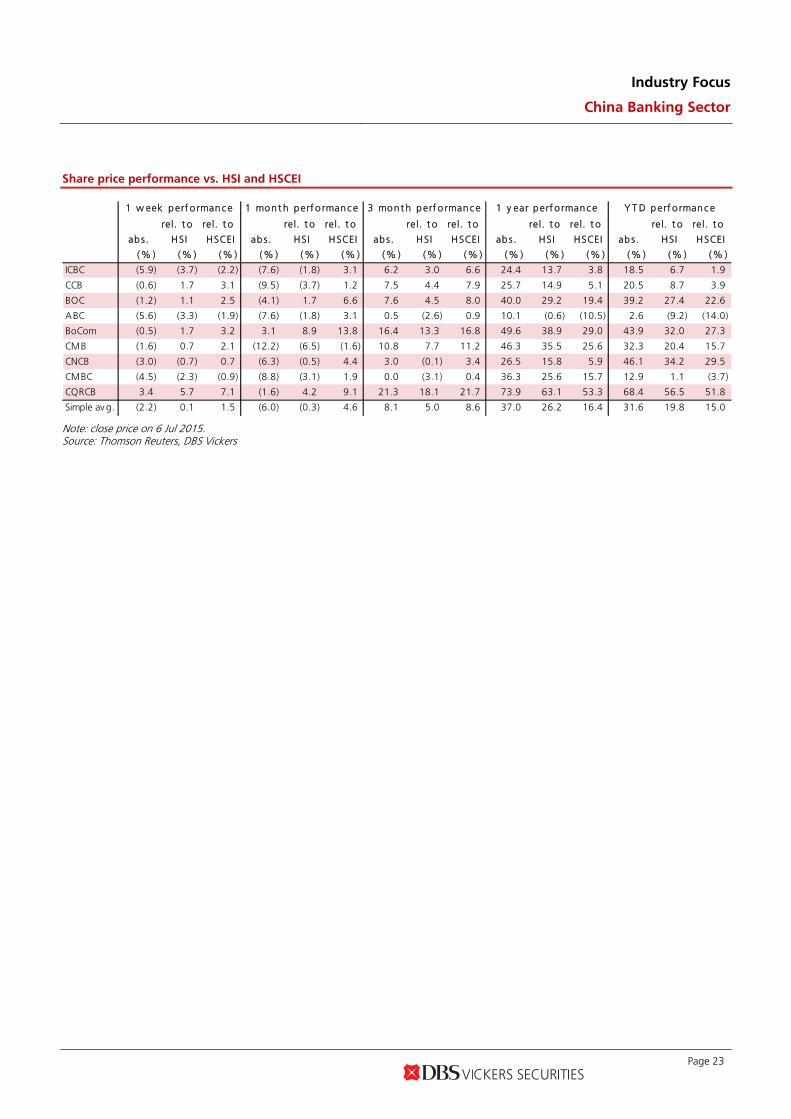
Share price performance vs. HSI and HSCEI
rel. t o rel. t o rel. t o re l. t o rel. t o rel. t o rel. t o rel. t o re l. t o rel. t o
abs. HSI HSCEI abs. HSI HSCEI abs. HSI HSCEI abs. HSI HSCEI ab s. HSI HSCEI
(% ) (% ) (% ) (% ) (% ) (% ) (% ) (% ) (% ) (% ) (% ) (% ) (% ) (% ) (% )
ICBC (5.9) (3.7) (2.2) (7.6) (1.8) 3.1 6.2 3.0 6.6 24.4 13.7 3.8 18.5 6.7 1.9
CCB (0.6) 1.7 3.1 (9.5) (3.7) 1.2 7.5 4.4 7.9 25.7 14.9 5.1 20.5 8.7 3.9
BOC (1.2) 1.1 2.5 (4.1) 1.7 6.6 7.6 4.5 8.0 40.0 29.2 19.4 39.2 27.4 22.6
ABC (5.6) (3.3) (1.9) (7.6) (1.8) 3.1 0.5 (2.6) 0.9 10.1 (0.6) (10.5) 2.6 (9.2) (14.0)
BoCom (0.5) 1.7 3.2 3.1 8.9 13.8 16.4 13.3 16.8 49.6 38.9 29.0 43.9 32.0 27.3
CMB (1.6) 0.7 2.1 (12.2) (6.5) (1.6) 10.8 7.7 11.2 46.3 35.5 25.6 32.3 20.4 15.7
CNCB (3.0) (0.7) 0.7 (6.3) (0.5) 4.4 3.0 (0.1) 3.4 26.5 15.8 5.9 46.1 34.2 29.5
CMBC (4.5) (2.3) (0.9) (8.8) (3.1) 1.9 0.0 (3.1) 0.4 36.3 25.6 15.7 12.9 1.1 (3.7)
CQRCB 3.4 5.7 7.1 (1.6) 4.2 9.1 21.3 18.1 21.7 73.9 63.1 53.3 68.4 56.5 51.8
Simple av g. (2.2) 0.1 1.5 (6.0) (0.3) 4.6 8.1 5.0 8.6 37.0 26.2 16.4 31.6 19.8 15.0
1 w eek p erf o rman c e 1 mon t h perf o rmanc e 3 mont h p erf o rman c e 1 y ear perf o rmanc e Y T D p erf o rman c e
Note: close price on 6 Jul 2015. Source: Thomson Reuters, DBS Vickers
Industry Focus
China Banking Sector
Page 24
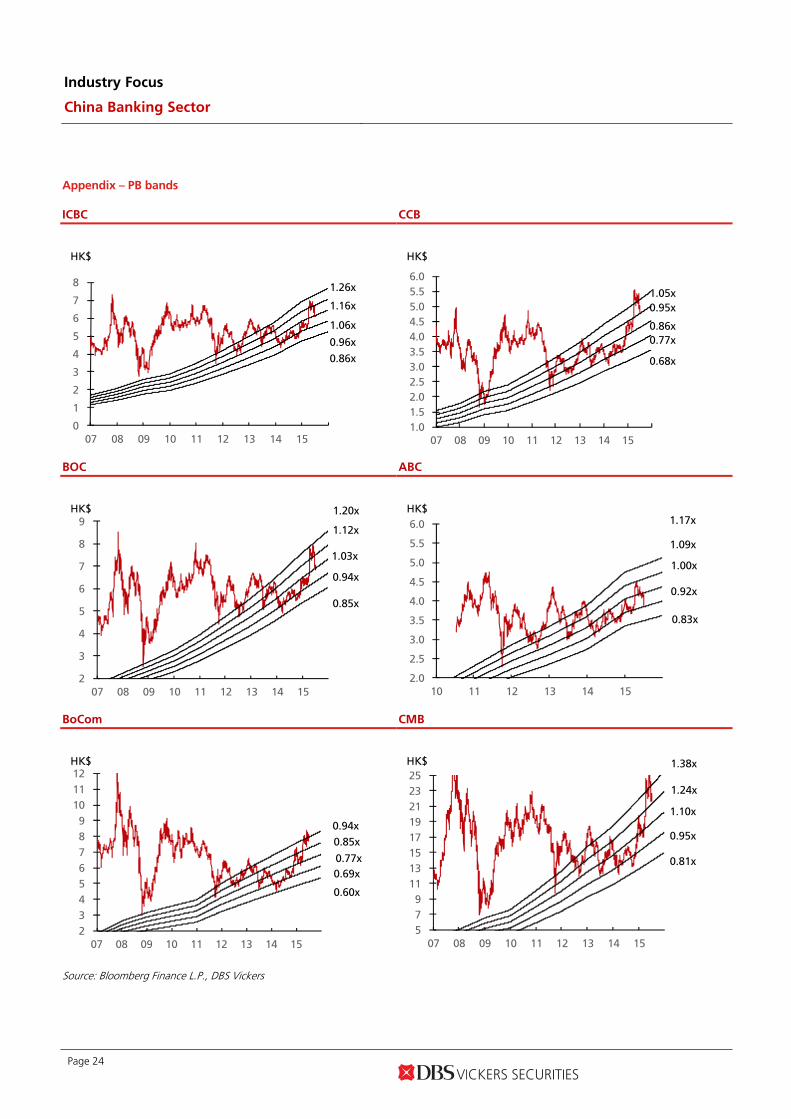
Appendix – PB bands
ICBC CCB
0
1
2
3
4
5
6
7
8
07 08 09 10 11 12 13 14 15
HK$
0.86x
0.96x
1.06x
1.16x
1.26x
1.0
1.5
2.0
2.5
3.0
3.5
4.0
4.5
5.0
5.5
6.0
07 08 09 10 11 12 13 14 15
HK$
0.68x
0.77x
0.86x
0.95x
1.05x
BOC
ABC
2
3
4
5
6
7
8
9
07 08 09 10 11 12 13 14 15
HK$
0.85x
0.94x
1.03x
1.12x
1.20x
2.0
2.5
3.0
3.5
4.0
4.5
5.0
5.5
6.0
10 11 12 13 14 15
HK$
0.83x
0.92x
1.00x
1.09x
1.17x
BoCom
CMB
2
3
4
5
6
7
8
9
10
11
12
07 08 09 10 11 12 13 14 15
HK$
0.60x
0.69x
0.77x
0.85x
0.94x
5
7
9
11
13
15
17
19
21
23
25
07 08 09 10 11 12 13 14 15
HK$
0.81x
0.95x
1.10x
1.24x
1.38x
Source: Bloomberg Finance L.P., DBS Vickers
Industry Focus
China Banking Sector
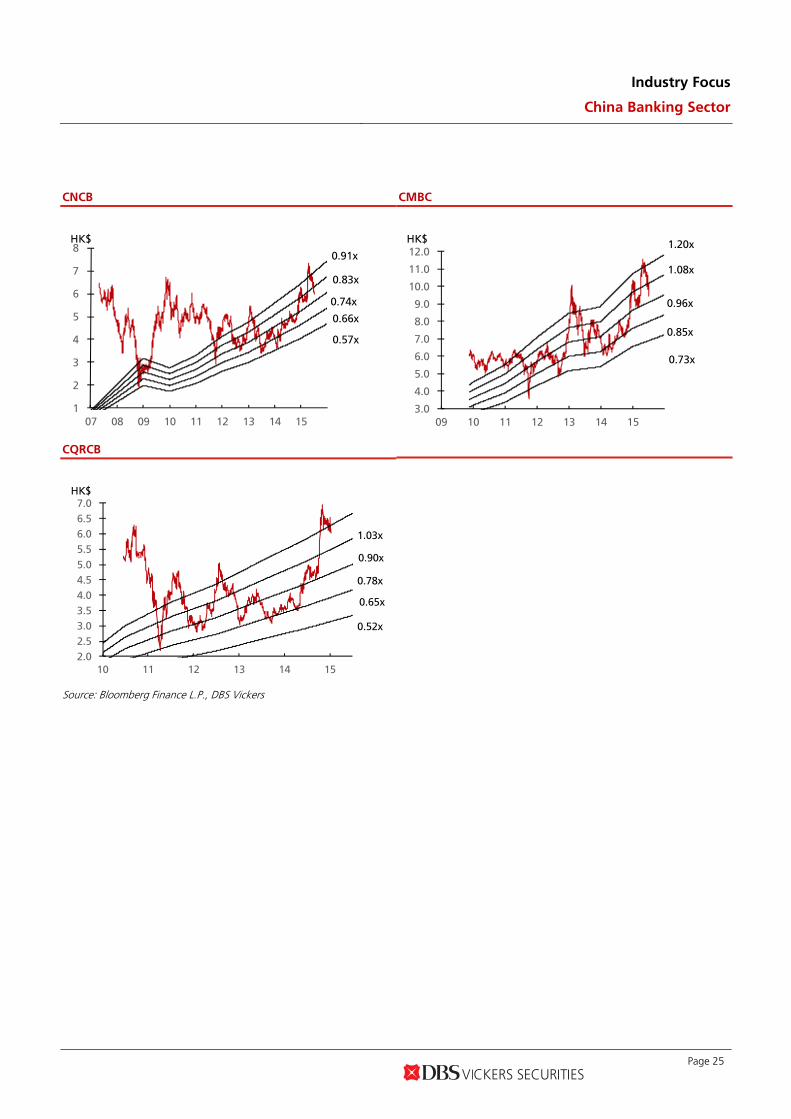
Page 25
CNCB
CMBC
1
2
3
4
5
6
7
8
07 08 09 10 11 12 13 14 15
HK$
0.57x
0.66x
0.74x
0.83x
0.91x
3.0
4.0
5.0
6.0
7.0
8.0
9.0
10.0
11.0
12.0
09 10 11 12 13 14 15
HK$
0.73x
0.85x
0.96x
1.08x
1.20x
CQRCB
2.0
2.5
3.0
3.5
4.0
4.5
5.0
5.5
6.0
6.5
7.0
10 11 12 13 14 15
HK$
0.52x
0.65x
0.78x
0.90x
1.03x
Source: Bloomberg Finance L.P., DBS Vickers
Industry Focus
China Banking Sector
Page 26
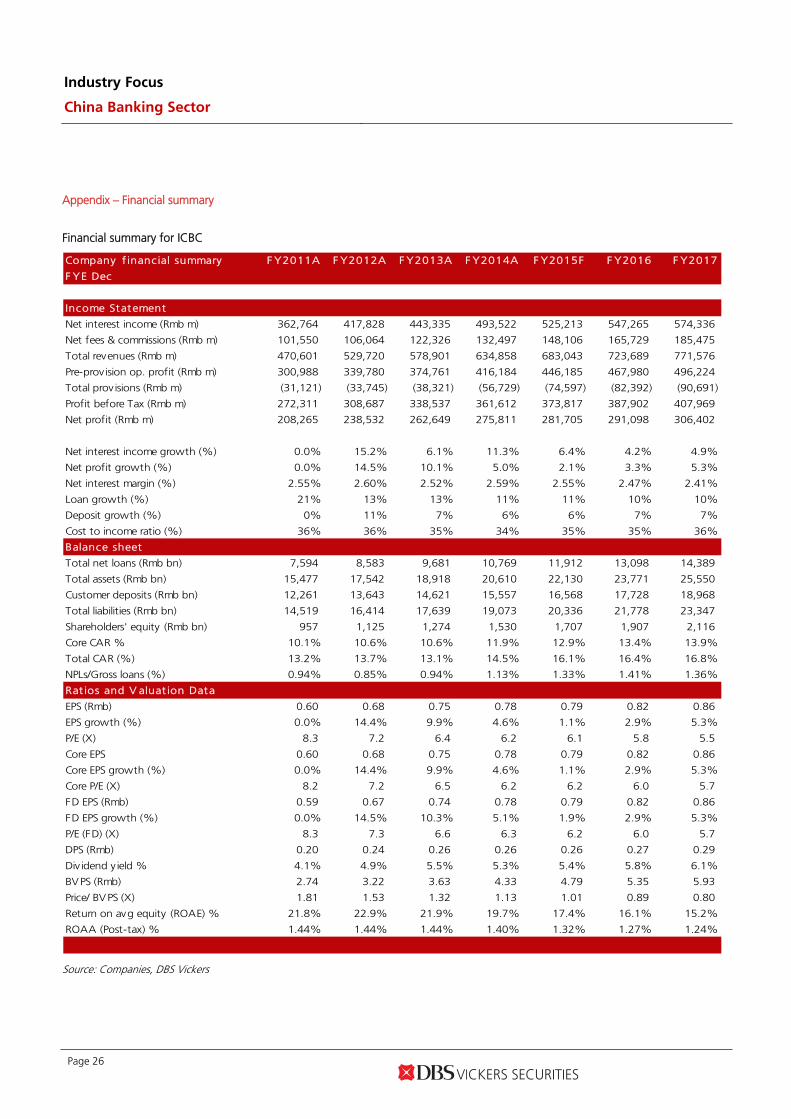
Appendix – Financial summary
Financial summary for ICBC
Company f inancial summary F Y2011A F Y2012A F Y2013A F Y2014A F Y2015F F Y2016 F Y2017
F YE Dec
Income Statement
Net interest income (Rmb m) 362,764 417,828 443,335 493,522 525,213 547,265 574,336
Net fees & commissions (Rmb m) 101,550 106,064 122,326 132,497 148,106 165,729 185,475
Total revenues (Rmb m) 470,601 529,720 578,901 634,858 683,043 723,689 771,576
Pre-prov ision op. profit (Rmb m) 300,988 339,780 374,761 416,184 446,185 467,980 496,224
Total prov isions (Rmb m) (31,121) (33,745) (38,321) (56,729) (74,597) (82,392) (90,691)
Profit before Tax (Rmb m) 272,311 308,687 338,537 361,612 373,817 387,902 407,969
Net profit (Rmb m) 208,265 238,532 262,649 275,811 281,705 291,098 306,402
Net interest income growth (%) 0.0% 15.2% 6.1% 11.3% 6.4% 4.2% 4.9%
Net profit growth (%) 0.0% 14.5% 10.1% 5.0% 2.1% 3.3% 5.3%
Net interest margin (%) 2.55% 2.60% 2.52% 2.59% 2.55% 2.47% 2.41%
Loan growth (%) 21% 13% 13% 11% 11% 10% 10%
Deposit growth (%) 0% 11% 7% 6% 6% 7% 7%
Cost to income ratio (%) 36% 36% 35% 34% 35% 35% 36%
Balance sheet
Total net loans (Rmb bn) 7,594 8,583 9,681 10,769 11,912 13,098 14,389
Total assets (Rmb bn) 15,477 17,542 18,918 20,610 22,130 23,771 25,550
Customer deposits (Rmb bn) 12,261 13,643 14,621 15,557 16,568 17,728 18,968
Total liabilities (Rmb bn) 14,519 16,414 17,639 19,073 20,336 21,778 23,347
Shareholders' equity (Rmb bn) 957 1,125 1,274 1,530 1,707 1,907 2,116
Core CAR % 10.1% 10.6% 10.6% 11.9% 12.9% 13.4% 13.9%
Total CAR (%) 13.2% 13.7% 13.1% 14.5% 16.1% 16.4% 16.8%
NPLs/Gross loans (%) 0.94% 0.85% 0.94% 1.13% 1.33% 1.41% 1.36%
Rat ios and V aluat ion Data
EPS (Rmb) 0.60 0.68 0.75 0.78 0.79 0.82 0.86
EPS growth (%) 0.0% 14.4% 9.9% 4.6% 1.1% 2.9% 5.3%
P/E (X) 8.3 7.2 6.4 6.2 6.1 5.8 5.5
Core EPS 0.60 0.68 0.75 0.78 0.79 0.82 0.86
Core EPS growth (%) 0.0% 14.4% 9.9% 4.6% 1.1% 2.9% 5.3%
Core P/E (X) 8.2 7.2 6.5 6.2 6.2 6.0 5.7
FD EPS (Rmb) 0.59 0.67 0.74 0.78 0.79 0.82 0.86
FD EPS growth (%) 0.0% 14.5% 10.3% 5.1% 1.9% 2.9% 5.3%
P/E (FD) (X) 8.3 7.3 6.6 6.3 6.2 6.0 5.7
DPS (Rmb) 0.20 0.24 0.26 0.26 0.26 0.27 0.29
Div idend y ield % 4.1% 4.9% 5.5% 5.3% 5.4% 5.8% 6.1%
BVPS (Rmb) 2.74 3.22 3.63 4.33 4.79 5.35 5.93
Price/ BVPS (X) 1.81 1.53 1.32 1.13 1.01 0.89 0.80
Return on avg equity (ROAE) % 21.8% 22.9% 21.9% 19.7% 17.4% 16.1% 15.2%
ROAA (Post-tax) % 1.44% 1.44% 1.44% 1.40% 1.32% 1.27% 1.24%
Source: Companies, DBS Vickers

Industry Focus
China Banking Sector
Page 27
Financial summary for CCB Company f inancial summary F Y2011A F Y2012A F Y2013A F Y2014A F Y2015F F Y2016 F Y2017
F YE Dec
Income Statement
Net interest income (Rmb m) 304,572 353,202 389,544 437,398 451,167 467,982 492,849
Net fees & commissions (Rmb m) 86,994 93,507 104,283 108,517 116,943 126,844 138,146
Total revenues (Rmb m) 399,403 462,533 511,140 556,740 578,935 605,651 641,820
Pre-provision op. profit (Rmb m) 254,866 291,452 322,955 360,752 368,074 379,381 399,550
Total prov isions (Rmb m) (35,783) (40,041) (43,209) (61,911) (68,799) (70,969) (72,700)
Profit before Tax (Rmb m) 219,107 251,439 279,806 299,086 299,520 308,665 327,120
Net profit (Rmb m) 169,258 193,179 214,657 227,830 228,160 235,127 249,183
Net interest income growth (%) 0.0% 16.0% 10.3% 12.3% 3.1% 3.7% 5.3%
Net profit growth (%) 0.0% 14.1% 11.1% 6.1% 0.1% 3.1% 6.0%
Net interest margin (%) 2.66% 2.71% 2.71% 2.81% 2.68% 2.58% 2.53%
Loan growth (%) 15% 16% 14% 10% 10% 10% 9%
Deposit growth (%) 0% 14% 8% 6% 8% 7% 7%
Cost to income ratio (%) 36% 37% 37% 35% 36% 37% 38%
Balance sheet
Total net loans (Rmb bn) 6,325 7,310 8,361 9,223 10,183 11,188 12,262
Total assets (Rmb bn) 12,282 13,973 15,363 16,744 18,371 19,826 21,388
Customer deposits (Rmb bn) 9,987 11,343 12,223 12,899 13,931 14,906 15,949
Total liabilities (Rmb bn) 11,465 13,023 14,289 15,492 16,963 18,257 19,646
Shareholders' equity (Rmb bn) 811 942 1,066 1,242 1,400 1,560 1,732
Core CAR % 0.0% 0.0% 10.8% 12.1% 13.3% 13.8% 14.2%
Total CAR (%) 0.0% 0.0% 13.3% 14.9% 16.0% 16.5% 16.8%
NPLs/Gross loans (%) 1.09% 0.99% 0.99% 1.19% 1.43% 1.56% 1.55%
Rat ios and V aluat ion Data
EPS (Rmb) 0.68 0.77 0.86 0.91 0.91 0.94 1.00
EPS growth (%) 0.0% 14.1% 11.1% 6.1% 0.1% 3.1% 6.0%
P/E (X) 8.2 7.1 6.2 6.0 6.0 5.7 5.3
Core EPS 0.68 0.77 0.86 0.91 0.91 0.94 1.00
Core EPS growth (%) 0.0% 14.1% 11.1% 6.1% 0.1% 3.1% 6.0%
Core P/E (X) 8.1 7.1 6.4 6.0 6.0 5.8 5.5
FD EPS (Rmb) 0.68 0.77 0.86 0.91 0.91 0.94 1.00
FD EPS growth (%) 0.0% 14.1% 11.1% 6.1% 0.1% 3.1% 6.0%
P/E (FD) (X) 8.1 7.1 6.4 6.0 6.0 5.8 5.5
DPS (Rmb) 0.24 0.27 0.30 0.30 0.30 0.31 0.33
Div idend y ield % 4.3% 4.9% 5.6% 5.5% 5.5% 5.8% 6.2%
BVPS (Rmb) 3.24 3.77 4.26 4.97 5.60 6.24 6.93
Price/ BVPS (X) 1.71 1.46 1.26 1.10 0.97 0.85 0.77
Return on avg equity (ROAE) % 20.9% 22.0% 21.4% 19.7% 17.3% 15.9% 15.1%
ROAA (Post-tax) % 1.47% 1.47% 1.46% 1.42% 1.30% 1.23% 1.21%
Source: Companies, DBS Vickers

Industry Focus
China Banking Sector
Page 28
Financial summary for BOC Company f inancial summary F Y2011A F Y2012A F Y2013A F Y2014A F Y2015F F Y2016 F Y2017
F YE Dec
Income Statement
Net interest income (Rmb m) 228,064 256,964 283,585 321,102 340,330 353,018 370,860
Net fees & commissions (Rmb m) 64,662 69,923 82,092 91,240 100,777 113,078 126,761
Total revenues (Rmb m) 328,298 366,176 407,509 456,328 487,358 514,728 548,757
Pre-provision op. profit (Rmb m) 187,483 206,447 235,195 278,540 294,627 305,952 323,620
Total prov isions (Rmb m) (19,355) (19,387) (23,510) (48,381) (58,507) (61,377) (63,798)
Profit before Tax (Rmb m) 168,644 187,673 212,777 231,478 237,473 245,977 261,313
Net profit (Rmb m) 124,276 139,656 156,911 169,595 170,137 176,384 187,648
Net interest income growth (%) 0.0% 12.7% 10.4% 13.2% 6.0% 3.7% 5.1%
Net profit growth (%) 0.0% 12.4% 12.4% 8.1% 0.3% 3.7% 6.4%
Net interest margin (%) 2.00% 2.18% 2.23% 2.30% 2.22% 2.09% 2.00%
Loan growth (%) 0% 15% 19% 21% 19% 17% 15%
Deposit growth (%) 0% 3% 10% 8% 10% 10% 10%
Cost to income ratio (%) 0% 0% 0% 0% 0% 0% 0%
Balance sheet
Total net loans (Rmb bn) 6,203 6,710 7,440 8,295 9,392 10,591 11,895
Total assets (Rmb bn) 11,830 12,681 13,874 15,251 16,744 18,388 20,191
Customer deposits (Rmb bn) 8,679 8,947 9,860 10,607 11,689 12,881 14,195
Total liabilities (Rmb bn) 11,073 11,819 12,913 14,068 15,432 16,946 18,610
Shareholders' equity (Rmb bn) 724 825 924 1,069 1,193 1,318 1,452
Core CAR % 0.0% 0.0% 9.7% 10.6% 11.1% 11.4% 11.4%
Total CAR (%) 0.0% 0.0% 12.5% 13.9% 12.8% 13.0% 13.0%
NPLs/Gross loans (%) 1.00% 0.95% 0.96% 1.18% 1.36% 1.44% 1.45%
Rat ios and V aluat ion Data
EPS (Rmb) 0.45 0.50 0.56 0.61 0.59 0.61 0.65
EPS growth (%) 0.0% 12.4% 12.3% 7.8% -2.7% 3.7% 6.4%
P/E (X) 8.7 7.7 6.7 6.3 6.5 6.1 5.7
Core EPS 0.45 0.50 0.56 0.61 0.59 0.61 0.65
Core EPS growth (%) 0.0% 12.4% 12.3% 7.8% -2.7% 3.7% 6.4%
Core P/E (X) 8.6 7.7 6.8 6.3 6.5 6.3 5.9
FD EPS (Rmb) 0.43 0.48 0.54 0.58 0.59 0.61 0.65
FD EPS growth (%) 0.0% 12.2% 11.5% 7.7% 2.1% 3.7% 6.4%
P/E (FD) (X) 9.0 8.0 7.2 6.7 6.5 6.3 5.9
DPS (Rmb) 0.16 0.18 0.20 0.19 0.19 0.20 0.21
Div idend y ield % 4.0% 4.5% 5.2% 4.9% 5.0% 5.3% 5.6%
BVPS (Rmb) 2.59 2.95 3.31 3.70 4.13 4.57 5.03
Price/ BVPS (X) 1.50 1.31 1.14 1.04 0.92 0.82 0.74
Return on avg equity (ROAE) % 17.2% 18.0% 17.9% 17.0% 15.0% 14.0% 13.6%
ROAA (Post-tax) % 1.05% 1.14% 1.18% 1.16% 1.06% 1.00% 0.97%
Source: Companies, DBS Vickers
Industry Focus
China Banking Sector
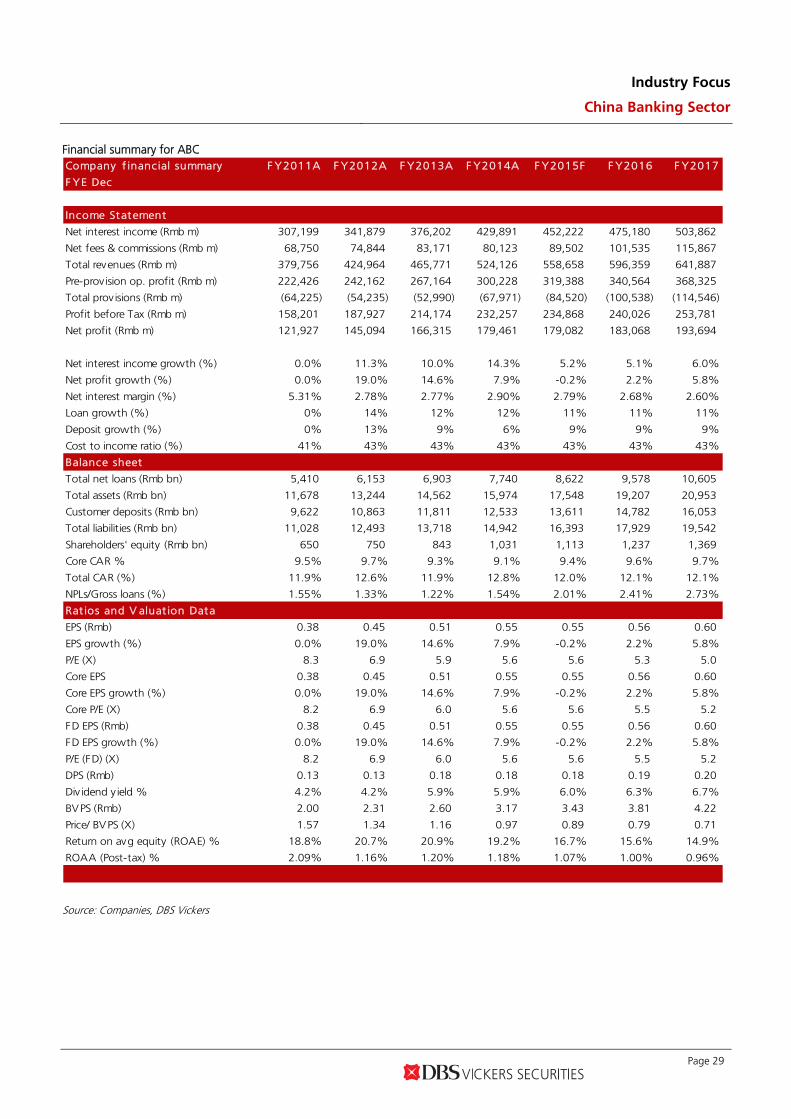
Page 29
Financial summary for ABC Company f inancial summary F Y2011A F Y2012A F Y2013A F Y2014A F Y2015F F Y2016 F Y2017
F YE Dec
Income Statement
Net interest income (Rmb m) 307,199 341,879 376,202 429,891 452,222 475,180 503,862
Net fees & commissions (Rmb m) 68,750 74,844 83,171 80,123 89,502 101,535 115,867
Total revenues (Rmb m) 379,756 424,964 465,771 524,126 558,658 596,359 641,887
Pre-provision op. profit (Rmb m) 222,426 242,162 267,164 300,228 319,388 340,564 368,325
Total prov isions (Rmb m) (64,225) (54,235) (52,990) (67,971) (84,520) (100,538) (114,546)
Profit before Tax (Rmb m) 158,201 187,927 214,174 232,257 234,868 240,026 253,781
Net profit (Rmb m) 121,927 145,094 166,315 179,461 179,082 183,068 193,694
Net interest income growth (%) 0.0% 11.3% 10.0% 14.3% 5.2% 5.1% 6.0%
Net profit growth (%) 0.0% 19.0% 14.6% 7.9% -0.2% 2.2% 5.8%
Net interest margin (%) 5.31% 2.78% 2.77% 2.90% 2.79% 2.68% 2.60%
Loan growth (%) 0% 14% 12% 12% 11% 11% 11%
Deposit growth (%) 0% 13% 9% 6% 9% 9% 9%
Cost to income ratio (%) 41% 43% 43% 43% 43% 43% 43%
Balance sheet
Total net loans (Rmb bn) 5,410 6,153 6,903 7,740 8,622 9,578 10,605
Total assets (Rmb bn) 11,678 13,244 14,562 15,974 17,548 19,207 20,953
Customer deposits (Rmb bn) 9,622 10,863 11,811 12,533 13,611 14,782 16,053
Total liabilities (Rmb bn) 11,028 12,493 13,718 14,942 16,393 17,929 19,542
Shareholders' equity (Rmb bn) 650 750 843 1,031 1,113 1,237 1,369
Core CAR % 9.5% 9.7% 9.3% 9.1% 9.4% 9.6% 9.7%
Total CAR (%) 11.9% 12.6% 11.9% 12.8% 12.0% 12.1% 12.1%
NPLs/Gross loans (%) 1.55% 1.33% 1.22% 1.54% 2.01% 2.41% 2.73%
Rat ios and V aluat ion Data
EPS (Rmb) 0.38 0.45 0.51 0.55 0.55 0.56 0.60
EPS growth (%) 0.0% 19.0% 14.6% 7.9% -0.2% 2.2% 5.8%
P/E (X) 8.3 6.9 5.9 5.6 5.6 5.3 5.0
Core EPS 0.38 0.45 0.51 0.55 0.55 0.56 0.60
Core EPS growth (%) 0.0% 19.0% 14.6% 7.9% -0.2% 2.2% 5.8%
Core P/E (X) 8.2 6.9 6.0 5.6 5.6 5.5 5.2
FD EPS (Rmb) 0.38 0.45 0.51 0.55 0.55 0.56 0.60
FD EPS growth (%) 0.0% 19.0% 14.6% 7.9% -0.2% 2.2% 5.8%
P/E (FD) (X) 8.2 6.9 6.0 5.6 5.6 5.5 5.2
DPS (Rmb) 0.13 0.13 0.18 0.18 0.18 0.19 0.20
Div idend y ield % 4.2% 4.2% 5.9% 5.9% 6.0% 6.3% 6.7%
BVPS (Rmb) 2.00 2.31 2.60 3.17 3.43 3.81 4.22
Price/ BVPS (X) 1.57 1.34 1.16 0.97 0.89 0.79 0.71
Return on avg equity (ROAE) % 18.8% 20.7% 20.9% 19.2% 16.7% 15.6% 14.9%
ROAA (Post-tax) % 2.09% 1.16% 1.20% 1.18% 1.07% 1.00% 0.96%
Source: Companies, DBS Vickers
Industry Focus
China Banking Sector
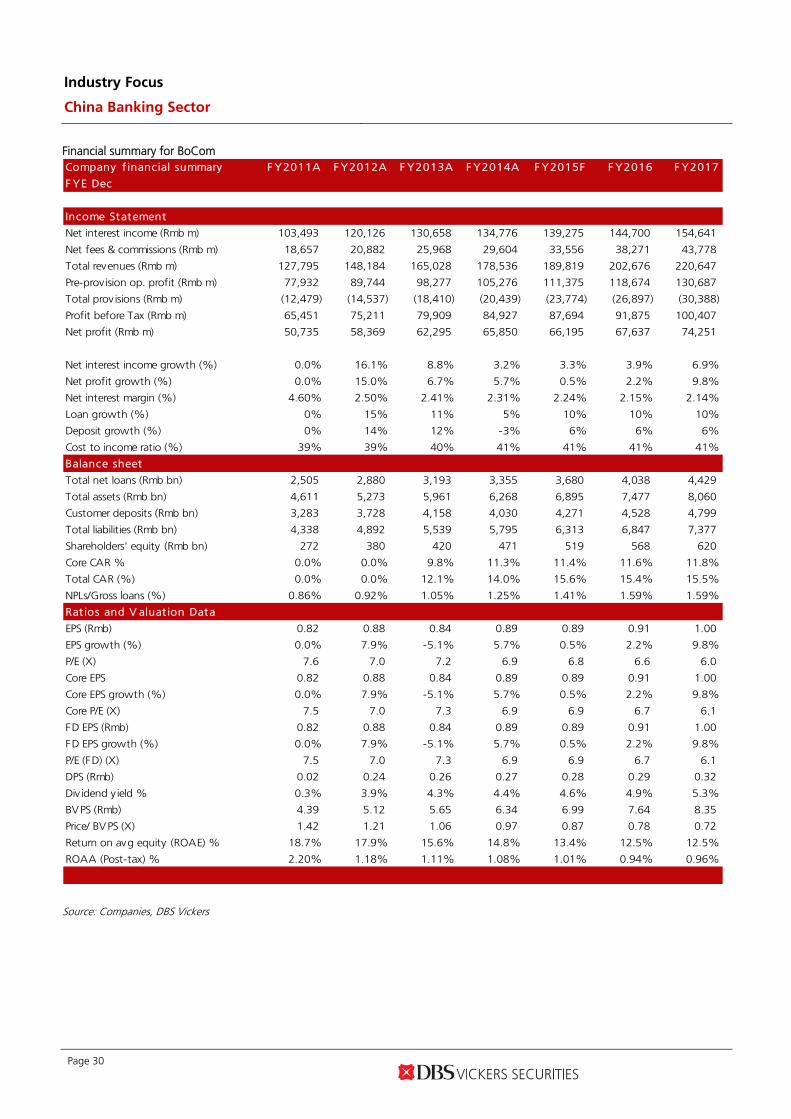
Page 30
Financial summary for BoCom Company f inancial summary F Y2011A F Y2012A F Y2013A F Y2014A F Y2015F F Y2016 F Y2017
F YE Dec
Income Statement
Net interest income (Rmb m) 103,493 120,126 130,658 134,776 139,275 144,700 154,641
Net fees & commissions (Rmb m) 18,657 20,882 25,968 29,604 33,556 38,271 43,778
Total revenues (Rmb m) 127,795 148,184 165,028 178,536 189,819 202,676 220,647
Pre-provision op. profit (Rmb m) 77,932 89,744 98,277 105,276 111,375 118,674 130,687
Total prov isions (Rmb m) (12,479) (14,537) (18,410) (20,439) (23,774) (26,897) (30,388)
Profit before Tax (Rmb m) 65,451 75,211 79,909 84,927 87,694 91,875 100,407
Net profit (Rmb m) 50,735 58,369 62,295 65,850 66,195 67,637 74,251
Net interest income growth (%) 0.0% 16.1% 8.8% 3.2% 3.3% 3.9% 6.9%
Net profit growth (%) 0.0% 15.0% 6.7% 5.7% 0.5% 2.2% 9.8%
Net interest margin (%) 4.60% 2.50% 2.41% 2.31% 2.24% 2.15% 2.14%
Loan growth (%) 0% 15% 11% 5% 10% 10% 10%
Deposit growth (%) 0% 14% 12% -3% 6% 6% 6%
Cost to income ratio (%) 39% 39% 40% 41% 41% 41% 41%
Balance sheet
Total net loans (Rmb bn) 2,505 2,880 3,193 3,355 3,680 4,038 4,429
Total assets (Rmb bn) 4,611 5,273 5,961 6,268 6,895 7,477 8,060
Customer deposits (Rmb bn) 3,283 3,728 4,158 4,030 4,271 4,528 4,799
Total liabilities (Rmb bn) 4,338 4,892 5,539 5,795 6,313 6,847 7,377
Shareholders' equity (Rmb bn) 272 380 420 471 519 568 620
Core CAR % 0.0% 0.0% 9.8% 11.3% 11.4% 11.6% 11.8%
Total CAR (%) 0.0% 0.0% 12.1% 14.0% 15.6% 15.4% 15.5%
NPLs/Gross loans (%) 0.86% 0.92% 1.05% 1.25% 1.41% 1.59% 1.59%
Rat ios and V aluat ion Data
EPS (Rmb) 0.82 0.88 0.84 0.89 0.89 0.91 1.00
EPS growth (%) 0.0% 7.9% -5.1% 5.7% 0.5% 2.2% 9.8%
P/E (X) 7.6 7.0 7.2 6.9 6.8 6.6 6.0
Core EPS 0.82 0.88 0.84 0.89 0.89 0.91 1.00
Core EPS growth (%) 0.0% 7.9% -5.1% 5.7% 0.5% 2.2% 9.8%
Core P/E (X) 7.5 7.0 7.3 6.9 6.9 6.7 6.1
FD EPS (Rmb) 0.82 0.88 0.84 0.89 0.89 0.91 1.00
FD EPS growth (%) 0.0% 7.9% -5.1% 5.7% 0.5% 2.2% 9.8%
P/E (FD) (X) 7.5 7.0 7.3 6.9 6.9 6.7 6.1
DPS (Rmb) 0.02 0.24 0.26 0.27 0.28 0.29 0.32
Div idend y ield % 0.3% 3.9% 4.3% 4.4% 4.6% 4.9% 5.3%
BVPS (Rmb) 4.39 5.12 5.65 6.34 6.99 7.64 8.35
Price/ BVPS (X) 1.42 1.21 1.06 0.97 0.87 0.78 0.72
Return on avg equity (ROAE) % 18.7% 17.9% 15.6% 14.8% 13.4% 12.5% 12.5%
ROAA (Post-tax) % 2.20% 1.18% 1.11% 1.08% 1.01% 0.94% 0.96%
Source: Companies, DBS Vickers
Industry Focus
China Banking Sector
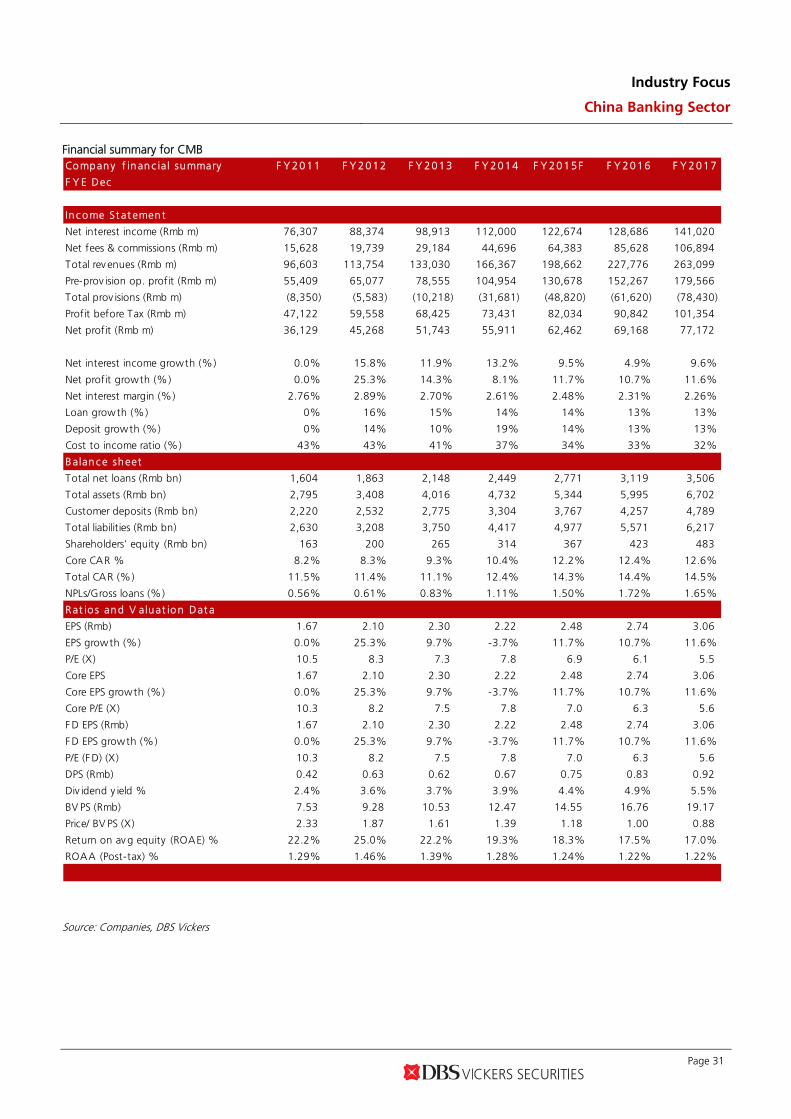
Page 31
Financial summary for CMB Co mpany f inanc ial summary F Y 2011 F Y 2012 F Y 2013 F Y 2014 F Y 2015F F Y 2016 F Y 2 017
F Y E Dec
Inc ome St at ement
Net interest income (Rmb m) 76,307 88,374 98,913 112,000 122,674 128,686 141,020
Net fees & commissions (Rmb m) 15,628 19,739 29,184 44,696 64,383 85,628 106,894
Total rev enues (Rmb m) 96,603 113,754 133,030 166,367 198,662 227,776 263,099
Pre-prov ision op. profit (Rmb m) 55,409 65,077 78,555 104,954 130,678 152,267 179,566
Total prov isions (Rmb m) (8,350) (5,583) (10,218) (31,681) (48,820) (61,620) (78,430)
Profit before Tax (Rmb m) 47,122 59,558 68,425 73,431 82,034 90,842 101,354
Net profit (Rmb m) 36,129 45,268 51,743 55,911 62,462 69,168 77,172
Net interest income growth (%) 0.0% 15.8% 11.9% 13.2% 9.5% 4.9% 9.6%
Net profit growth (%) 0.0% 25.3% 14.3% 8.1% 11.7% 10.7% 11.6%
Net interest margin (%) 2.76% 2.89% 2.70% 2.61% 2.48% 2.31% 2.26%
Loan growth (%) 0% 16% 15% 14% 14% 13% 13%
Deposit growth (%) 0% 14% 10% 19% 14% 13% 13%
Cost to income ratio (%) 43% 43% 41% 37% 34% 33% 32%
Balanc e sheet
Total net loans (Rmb bn) 1,604 1,863 2,148 2,449 2,771 3,119 3,506
Total assets (Rmb bn) 2,795 3,408 4,016 4,732 5,344 5,995 6,702
Customer deposits (Rmb bn) 2,220 2,532 2,775 3,304 3,767 4,257 4,789
Total liabilities (Rmb bn) 2,630 3,208 3,750 4,417 4,977 5,571 6,217
Shareholders' equity (Rmb bn) 163 200 265 314 367 423 483
Core CAR % 8.2% 8.3% 9.3% 10.4% 12.2% 12.4% 12.6%
Total CAR (%) 11.5% 11.4% 11.1% 12.4% 14.3% 14.4% 14.5%
NPLs/Gross loans (%) 0.56% 0.61% 0.83% 1.11% 1.50% 1.72% 1.65%
Rat io s and V aluat ion Dat a
EPS (Rmb) 1.67 2.10 2.30 2.22 2.48 2.74 3.06
EPS growth (%) 0.0% 25.3% 9.7% -3.7% 11.7% 10.7% 11.6%
P/E (X) 10.5 8.3 7.3 7.8 6.9 6.1 5.5
Core EPS 1.67 2.10 2.30 2.22 2.48 2.74 3.06
Core EPS growth (%) 0.0% 25.3% 9.7% -3.7% 11.7% 10.7% 11.6%
Core P/E (X) 10.3 8.2 7.5 7.8 7.0 6.3 5.6
F D EPS (Rmb) 1.67 2.10 2.30 2.22 2.48 2.74 3.06
F D EPS growth (%) 0.0% 25.3% 9.7% -3.7% 11.7% 10.7% 11.6%
P/E (F D) (X) 10.3 8.2 7.5 7.8 7.0 6.3 5.6
DPS (Rmb) 0.42 0.63 0.62 0.67 0.75 0.83 0.92
Div idend y ield % 2.4% 3.6% 3.7% 3.9% 4.4% 4.9% 5.5%
BV PS (Rmb) 7.53 9.28 10.53 12.47 14.55 16.76 19.17
Price/ BV PS (X) 2.33 1.87 1.61 1.39 1.18 1.00 0.88
Return on av g equity (ROAE) % 22.2% 25.0% 22.2% 19.3% 18.3% 17.5% 17.0%
ROAA (Post-tax) % 1.29% 1.46% 1.39% 1.28% 1.24% 1.22% 1.22%
Source: Companies, DBS Vickers

Industry Focus
China Banking Sector
Page 32
Financial summary for Citic Company f inancial summary F Y2011A F Y2012A F Y2013A F Y2014A F Y2015F F Y2016 F Y2017
F YE Dec
Income Statement
Net interest income (Rmb m) 65,106 75,486 85,688 94,741 100,884 108,709 118,436
Net fees & commissions (Rmb m) 8,837 11,210 16,811 25,313 35,553 47,933 62,515
Total revenues (Rmb m) 77,092 89,711 104,813 124,839 142,179 163,302 188,464
Pre-provision op. profit (Rmb m) 48,711 54,732 64,378 78,043 87,688 100,178 115,592
Total prov isions (Rmb m) (7,207) (13,104) (11,940) (23,673) (30,133) (36,266) (42,838)
Profit before Tax (Rmb m) 41,590 41,609 52,549 54,574 57,769 64,149 73,025
Net profit (Rmb m) 30,819 31,032 39,175 40,692 41,923 45,630 52,248
Net interest income growth (%) 0.0% 15.9% 13.5% 10.6% 6.5% 7.8% 8.9%
Net profit growth (%) 0.0% 0.7% 26.2% 3.9% 3.0% 8.8% 14.5%
Net interest margin (%) 2.71% 2.66% 2.62% 2.47% 2.33% 2.21% 2.14%
Loan growth (%) 13% 16% 17% 13% 13% 12% 12%
Deposit growth (%) 0% 15% 18% 7% 10% 13% 13%
Cost to income ratio (%) 37% 39% 39% 37% 38% 39% 39%
Balance sheet
Total net loans (Rmb bn) 1,411 1,628 1,900 2,136 2,400 2,682 3,000
Total assets (Rmb bn) 2,766 2,960 3,641 4,139 4,696 5,306 5,946
Customer deposits (Rmb bn) 1,968 2,255 2,652 2,850 3,135 3,542 3,985
Total liabilities (Rmb bn) 2,587 2,757 3,410 3,871 4,337 4,912 5,512
Shareholders' equity (Rmb bn) 174 198 226 260 315 350 389
Core CAR % 0.0% 9.3% 8.8% 8.9% 9.7% 9.6% 9.5%
Total CAR (%) 0.0% 12.4% 11.2% 12.3% 13.1% 12.6% 12.3%
NPLs/Gross loans (%) 0.60% 0.74% 1.03% 1.30% 1.50% 1.62% 1.63%
Rat ios and V aluat ion Data
EPS (Rmb) 0.71 0.66 0.84 0.87 0.87 0.93 1.06
EPS growth (%) 0.0% -6.7% 26.2% 3.9% 0.4% 6.1% 14.5%
P/E (X) 6.8 7.2 5.6 5.5 5.4 5.0 4.4
Core EPS 0.71 0.66 0.84 0.87 0.87 0.93 1.06
Core EPS growth (%) 0.0% -6.7% 26.2% 3.9% 0.4% 6.1% 14.5%
Core P/E (X) 6.7 7.2 5.7 5.5 5.5 5.2 4.5
FD EPS (Rmb) 0.71 0.66 0.84 0.87 0.87 0.93 1.06
FD EPS growth (%) 0.0% -6.7% 26.2% 3.9% 0.4% 6.1% 14.5%
P/E (FD) (X) 6.7 7.2 5.7 5.5 5.5 5.2 4.5
DPS (Rmb) 0.14 0.15 0.25 - 0.26 0.29 0.33
Div idend y ield % 3.0% 3.1% 5.4% 0.0% 5.5% 6.3% 7.2%
BVPS (Rmb) 3.73 4.24 4.82 5.55 6.41 7.11 7.89
Price/ BVPS (X) 1.30 1.13 0.97 0.86 0.74 0.65 0.59
Return on avg equity (ROAE) % 17.7% 16.6% 18.5% 16.8% 14.6% 13.7% 14.1%
ROAA (Post-tax) % 1.27% 1.08% 1.19% 1.05% 0.95% 0.91% 0.93%
Source: Companies, DBS Vickers
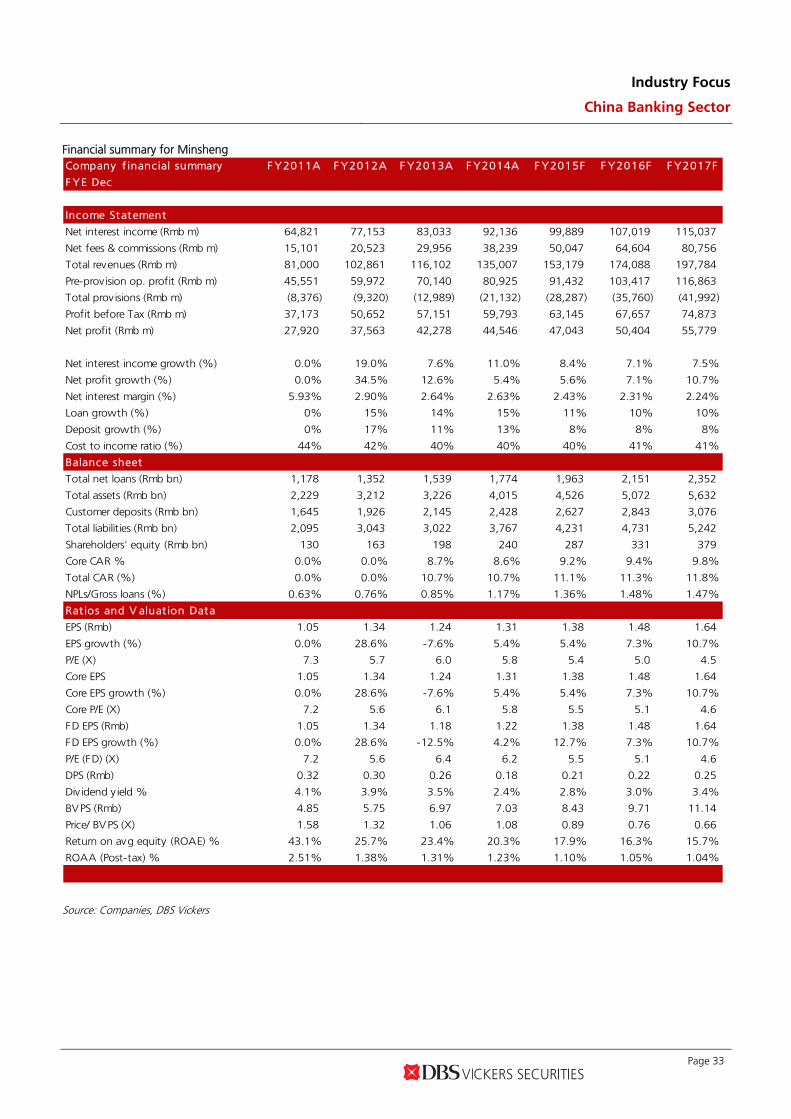
Industry Focus
China Banking Sector
Page 33
Financial summary for Minsheng Company f inancial summary F Y2011A F Y2012A F Y2013A F Y2014A F Y2015F F Y2016F F Y2017F
F YE Dec
Income Statement
Net interest income (Rmb m) 64,821 77,153 83,033 92,136 99,889 107,019 115,037
Net fees & commissions (Rmb m) 15,101 20,523 29,956 38,239 50,047 64,604 80,756
Total revenues (Rmb m) 81,000 102,861 116,102 135,007 153,179 174,088 197,784
Pre-provision op. profit (Rmb m) 45,551 59,972 70,140 80,925 91,432 103,417 116,863
Total prov isions (Rmb m) (8,376) (9,320) (12,989) (21,132) (28,287) (35,760) (41,992)
Profit before Tax (Rmb m) 37,173 50,652 57,151 59,793 63,145 67,657 74,873
Net profit (Rmb m) 27,920 37,563 42,278 44,546 47,043 50,404 55,779
Net interest income growth (%) 0.0% 19.0% 7.6% 11.0% 8.4% 7.1% 7.5%
Net profit growth (%) 0.0% 34.5% 12.6% 5.4% 5.6% 7.1% 10.7%
Net interest margin (%) 5.93% 2.90% 2.64% 2.63% 2.43% 2.31% 2.24%
Loan growth (%) 0% 15% 14% 15% 11% 10% 10%
Deposit growth (%) 0% 17% 11% 13% 8% 8% 8%
Cost to income ratio (%) 44% 42% 40% 40% 40% 41% 41%
Balance sheet
Total net loans (Rmb bn) 1,178 1,352 1,539 1,774 1,963 2,151 2,352
Total assets (Rmb bn) 2,229 3,212 3,226 4,015 4,526 5,072 5,632
Customer deposits (Rmb bn) 1,645 1,926 2,145 2,428 2,627 2,843 3,076
Total liabilities (Rmb bn) 2,095 3,043 3,022 3,767 4,231 4,731 5,242
Shareholders' equity (Rmb bn) 130 163 198 240 287 331 379
Core CAR % 0.0% 0.0% 8.7% 8.6% 9.2% 9.4% 9.8%
Total CAR (%) 0.0% 0.0% 10.7% 10.7% 11.1% 11.3% 11.8%
NPLs/Gross loans (%) 0.63% 0.76% 0.85% 1.17% 1.36% 1.48% 1.47%
Rat ios and V aluat ion Data
EPS (Rmb) 1.05 1.34 1.24 1.31 1.38 1.48 1.64
EPS growth (%) 0.0% 28.6% -7.6% 5.4% 5.4% 7.3% 10.7%
P/E (X) 7.3 5.7 6.0 5.8 5.4 5.0 4.5
Core EPS 1.05 1.34 1.24 1.31 1.38 1.48 1.64
Core EPS growth (%) 0.0% 28.6% -7.6% 5.4% 5.4% 7.3% 10.7%
Core P/E (X) 7.2 5.6 6.1 5.8 5.5 5.1 4.6
FD EPS (Rmb) 1.05 1.34 1.18 1.22 1.38 1.48 1.64
FD EPS growth (%) 0.0% 28.6% -12.5% 4.2% 12.7% 7.3% 10.7%
P/E (FD) (X) 7.2 5.6 6.4 6.2 5.5 5.1 4.6
DPS (Rmb) 0.32 0.30 0.26 0.18 0.21 0.22 0.25
Div idend y ield % 4.1% 3.9% 3.5% 2.4% 2.8% 3.0% 3.4%
BVPS (Rmb) 4.85 5.75 6.97 7.03 8.43 9.71 11.14
Price/ BVPS (X) 1.58 1.32 1.06 1.08 0.89 0.76 0.66
Return on avg equity (ROAE) % 43.1% 25.7% 23.4% 20.3% 17.9% 16.3% 15.7%
ROAA (Post-tax) % 2.51% 1.38% 1.31% 1.23% 1.10% 1.05% 1.04%
Source: Companies, DBS Vickers
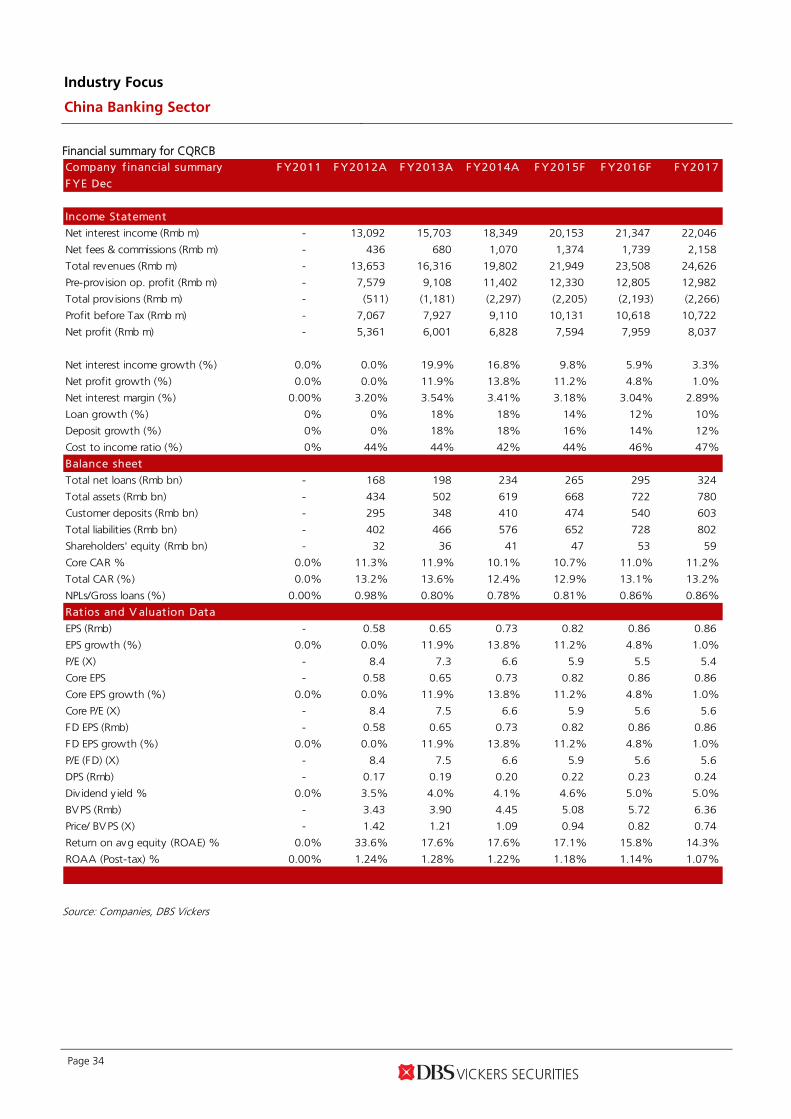
Industry Focus
China Banking Sector
Page 34
Financial summary for CQRCB Company f inancial summary F Y2011 F Y2012A F Y2013A F Y2014A F Y2015F F Y2016F F Y2017
F YE Dec
Income Statement
Net interest income (Rmb m) - 13,092 15,703 18,349 20,153 21,347 22,046
Net fees & commissions (Rmb m) - 436 680 1,070 1,374 1,739 2,158
Total revenues (Rmb m) - 13,653 16,316 19,802 21,949 23,508 24,626
Pre-provision op. profit (Rmb m) - 7,579 9,108 11,402 12,330 12,805 12,982
Total prov isions (Rmb m) - (511) (1,181) (2,297) (2,205) (2,193) (2,266)
Profit before Tax (Rmb m) - 7,067 7,927 9,110 10,131 10,618 10,722
Net profit (Rmb m) - 5,361 6,001 6,828 7,594 7,959 8,037
Net interest income growth (%) 0.0% 0.0% 19.9% 16.8% 9.8% 5.9% 3.3%
Net profit growth (%) 0.0% 0.0% 11.9% 13.8% 11.2% 4.8% 1.0%
Net interest margin (%) 0.00% 3.20% 3.54% 3.41% 3.18% 3.04% 2.89%
Loan growth (%) 0% 0% 18% 18% 14% 12% 10%
Deposit growth (%) 0% 0% 18% 18% 16% 14% 12%
Cost to income ratio (%) 0% 44% 44% 42% 44% 46% 47%
Balance sheet
Total net loans (Rmb bn) - 168 198 234 265 295 324
Total assets (Rmb bn) - 434 502 619 668 722 780
Customer deposits (Rmb bn) - 295 348 410 474 540 603
Total liabilities (Rmb bn) - 402 466 576 652 728 802
Shareholders' equity (Rmb bn) - 32 36 41 47 53 59
Core CAR % 0.0% 11.3% 11.9% 10.1% 10.7% 11.0% 11.2%
Total CAR (%) 0.0% 13.2% 13.6% 12.4% 12.9% 13.1% 13.2%
NPLs/Gross loans (%) 0.00% 0.98% 0.80% 0.78% 0.81% 0.86% 0.86%
Rat ios and V aluat ion Data
EPS (Rmb) - 0.58 0.65 0.73 0.82 0.86 0.86
EPS growth (%) 0.0% 0.0% 11.9% 13.8% 11.2% 4.8% 1.0%
P/E (X) - 8.4 7.3 6.6 5.9 5.5 5.4
Core EPS - 0.58 0.65 0.73 0.82 0.86 0.86
Core EPS growth (%) 0.0% 0.0% 11.9% 13.8% 11.2% 4.8% 1.0%
Core P/E (X) - 8.4 7.5 6.6 5.9 5.6 5.6
FD EPS (Rmb) - 0.58 0.65 0.73 0.82 0.86 0.86
FD EPS growth (%) 0.0% 0.0% 11.9% 13.8% 11.2% 4.8% 1.0%
P/E (FD) (X) - 8.4 7.5 6.6 5.9 5.6 5.6
DPS (Rmb) - 0.17 0.19 0.20 0.22 0.23 0.24
Div idend y ield % 0.0% 3.5% 4.0% 4.1% 4.6% 5.0% 5.0%
BVPS (Rmb) - 3.43 3.90 4.45 5.08 5.72 6.36
Price/ BVPS (X) - 1.42 1.21 1.09 0.94 0.82 0.74
Return on avg equity (ROAE) % 0.0% 33.6% 17.6% 17.6% 17.1% 15.8% 14.3%
ROAA (Post-tax) % 0.00% 1.24% 1.28% 1.22% 1.18% 1.14% 1.07%
Source: Companies, DBS Vickers
Industry Focus
China Banking Sector
Page 35
DBSV recommendations are based an Absolute Total Return* Rating system, defined as follows:
STRONG BUY (>20% total return over the next 3 months, with identifiable share price catalysts within this time frame)
BUY (>15% total return over the next 12 months for small caps, >10% for large caps)
HOLD (-10% to +15% total return over the next 12 months for small caps, -10% to +10% for large caps)
FULLY VALUED (negative total return i.e. > -10% over the next 12 months)
SELL (negative total return of > -20% over the next 3 months, with identifiable catalysts within this time frame)
Share price appreciation + dividends GENERAL DISCLOSURE/DISCLAIMER This report is prepared by DBS Vickers (Hong Kong) Limited (“DBSVHK”), a direct wholly-owned subsidiary of DBS Vickers Securities Holdings Pte Ltd ("DBSVH"). This report is intended for clients of DBSV Group only and no part of this document may be (i) copied, photocopied or duplicated in any form or by any means or (ii) redistributed without the prior written consent of DBSVHK. The research set out in this report is based on information obtained from sources believed to be reliable, but we (which collectively refers to DBSVHK and/or DBSVH) do not make any representation or warranty as to its accuracy, completeness or correctness. Opinions expressed are subject to change without notice. This document is prepared for general circulation. Any recommendation contained in this document does not have regard to the specific investment objectives, financial situation and the particular needs of any specific addressee. This document is for the information of addressees only and is not to be taken in substitution for the exercise of judgement by addressees, who should obtain separate independent legal or financial advice. DBSVHK accepts no liability whatsoever for any direct, indirect and/or consequential loss (including any claims for loss of profit) arising from any use of and/or reliance upon this document and/or further communication given in relation to this document. This document is not to be construed as an offer or a solicitation of an offer to buy or sell any securities. DBSVH is a wholly-owned subsidiary of DBS Bank Ltd. DBS Bank Ltd along with its affiliates and/or persons associated with any of them may from time to time have interests in the securities mentioned in this document. DBSVHK, DBS Bank Ltd and their associates, their directors, and/or employees may have positions in, and may effect transactions in securities mentioned herein and may also perform or seek to perform broking, investment banking and other banking services for these companies. Any valuations, opinions, estimates, forecasts, ratings or risk assessments herein constitutes a judgment as of the date of this report, and there can be no assurance that future results or events will be consistent with any such valuations, opinions, estimates, forecasts, ratings or risk assessments. The information in this document is subject to change without notice, its accuracy is not guaranteed, it may be incomplete or condensed and it may not contain all material information concerning the company (or companies) referred to in this report. The valuations, opinions, estimates, forecasts, ratings or risk assessments described in this report were based upon a number of estimates and assumptions and are inherently subject to significant uncertainties and contingencies. It can be expected that one or more of the estimates on which the valuations, opinions, estimates, forecasts, ratings or risk assessments were based will not materialize or will vary significantly from actual results. Therefore, the inclusion of the valuations, opinions, estimates, forecasts, ratings or risk assessments described herein IS NOT TO BE RELIED UPON as a representation and/or warranty by DBSVHK and/or DBSVH (and/or any persons associated with the aforesaid entities), that:
a. such valuations, opinions, estimates, forecasts, ratings or risk assessments or their underlying assumptions will be achieved, and
b. there is any assurance that future results or events will be consistent with any such valuations, opinions, estimates, forecasts, ratings or risk assessments stated therein.
Any assumptions made in this report that refers to commodities, are for the purposes of making forecasts for the company (or companies) mentioned herein. They are not to be construed as recommendations to trade in the physical commodity or in the futures contract relating to the commodity referred to in this report. DBS Vickers Securities (USA) Inc ("DBSVUSA"), a U.S.-registered broker-dealer, does not have its own investment banking or research department, nor has it participated in any investment banking transaction as a manager or co-manager in the past twelve months. ANALYST CERTIFICATION The research analyst primarily responsible for the content of this research report, in part or in whole, certifies that the views about the companies and their securities expressed in this report accurately reflect his/her personal views. The analyst also certifies that no part of his/her compensation was, is, or will be, directly, or indirectly, related to specific recommendations or views expressed in this report. As of the date the report is published, the analyst and his / her spouse and/or relatives and/or associate who are financially dependent on the analyst, do not hold interests in the securities recommended in this report (“interest” includes direct or indirect ownership of securities, directorships and trustee positions).
Industry Focus
China Banking Sector
Page 36
COMPANY-SPECIFIC / REGULATORY DISCLOSURES 1. DBSVHK and its subsidiaries do not have a proprietary position in the securities recommended in this report as of the date the report is
published. 2. DBSVHK, DBSVUSA, DBS Bank Ltd and/or other affiliates may beneficially own a total of 1% or more of any class of common equity
securities of the subject companies mentioned in this document as of the latest available date of the updated information. 3. Compensation for investment banking services:
DBSVHK, DBSVUSA, DBS Bank Ltd and/or other affiliates may have received compensation, within the past 12 months, and within the next 3 months may receive or intends to seek compensation for investment banking services from the subject companies mentioned in this document.
DBSVUSA does not have its own investment banking or research department, nor has it participated in any investment banking transaction as a manager or co-manager in the past twelve months. Any US persons wishing to obtain further information, including any clarification on disclosures in this disclaimer, or to effect a transaction in any security discussed in this document should contact DBSVUSA exclusively.
RESTRICTIONS ON DISTRIBUTION General This report is not directed to, or intended for distribution to or use by, any person or entity who is a citizen or resident of or
located in any locality, state, country or other jurisdiction where such distribution, publication, availability or use would be contrary to law or regulation.
Australia This document is being distributed in Australia by DBSVHK, which is exempted from the requirement to hold an Australian Financial Services Licence under the Corporation Act 2001 [“CA”] in respect of financial services provided to the recipients. DBSVHK is regulated by the Securities and Futures Commission under the laws of Hong KONG, which differ from Australian laws. Distribution of this report is intended only for “wholesale investors” within the meaning of the CA.
Hong Kong This report is being distributed in Hong Kong by DBS Vickers (Hong Kong) Limited which is licensed and regulated by the Hong Kong Securities and Futures Commission.
Indonesia This report is being distributed in Indonesia by PT DBS Vickers Securities Indonesia.
Malaysia This report is distributed in Malaysia by AllianceDBS Research Sdn Bhd ("ADBSR"). Recipients of this report, received from ADBSR are to contact the undersigned at 603-2604 3333 in respect of any matters arising from or in connection with this report. In addition to the General Disclosure/Disclaimer found at the preceding page, recipients of this report are advised that ADBSR (the preparer of this report), its holding company Alliance Investment Bank Berhad, their respective connected and associated corporations, affiliates, their directors, officers, employees, agents and parties related or associated with any of them may have positions in, and may effect transactions in the securities mentioned herein and may also perform or seek to perform broking, investment banking/corporate advisory and other services for the subject companies. They may also have received compensation and/or seek to obtain compensation for broking, investment banking/corporate advisory and other services from the subject companies.
Wong Ming Tek, Executive Director, ADBSR
Singapore This report is distributed in Singapore by DBS Bank Ltd (Company Regn. No. 196800306E) or DBSVS (Company Regn No. 198600294G), both of which are Exempt Financial Advisers as defined in the Financial Advisers Act and regulated by the Monetary Authority of Singapore. DBS Bank Ltd and/or DBSVS, may distribute reports produced by its respective foreign entities, affiliates or other foreign research houses pursuant to an arrangement under Regulation 32C of the Financial Advisers Regulations. Where the report is distributed in Singapore to a person who is not an Accredited Investor, Expert Investor or an Institutional Investor, DBS Bank Ltd accepts legal responsibility for the contents of the report to such persons only to the extent required by law. Singapore recipients should contact DBS Bank Ltd at 6327 2288 for matters arising from, or in connection with the report.
Thailand This report is being distributed in Thailand by DBS Vickers Securities (Thailand) Co Ltd. Research reports distributed are only intended for institutional clients only and no other person may act upon it.
United Kingdom
This report is being distributed in the UK by DBS Vickers Securities (UK) Ltd, who is an authorised person in the meaning of the Financial Services and Markets Act and is regulated by The Financial Conduct Authority. Research distributed in the UK is intended only for institutional clients.
Dubai
This research report is being distributed in The Dubai International Financial Centre (“DIFC”) by DBS Bank Ltd., (DIFC Branch) having its office at PO Box 506538, 3rd Floor, Building 3, East Wing, Gate Precinct, Dubai International Financial Centre (DIFC), Dubai, United Arab Emirates. DBS Bank Ltd., (DIFC Branch) is regulated by The Dubai Financial Services Authority. This research report is intended only for professional clients (as defined in the DFSA rulebook) and no other person may act upon it.
United States Neither this report nor any copy hereof may be taken or distributed into the United States or to any U.S. person except in compliance with any applicable U.S. laws and regulations. It is being distributed in the United States by DBSV US, which accepts responsibility for its contents. Any U.S. person receiving this report who wishes to effect transactions in any securities referred to herein should contact DBS Vickers Securities (USA) Inc (“DBSVUSA”) directly and not its affiliate.
Other jurisdictions
In any other jurisdictions, except if otherwise restricted by laws or regulations, this report is intended only for qualified, professional, institutional or sophisticated investors as defined in the laws and regulations of such jurisdictions.
DBS Vickers (Hong Kong) Limited
18th Floor Man Yee building, 68 Des Voeux Road Central, Central, Hong Kong
Tel: (852) 2820-4888, Fax: (852) 2868-1523