china harbour engineering co. ltd. - epd.gov.hk · china harbour engineering co. ltd. improvement...
TRANSCRIPT

China Harbour Engineering Co. Ltd.
IMPROVEMENT WORKS
TO TUNG PING CHAU PUBLIC PIER
(CONTRACT NO.: CV/2004/04)
MONTHLY EM&A MONITORING REPORT
(JANUARY 2006)
Report No.: ENA60034
Checked by: C. L. Lau Environmental Team Leader
Prepared by: Linda Law Environmental Officer
Approved by: Tony Wong Operations Manager

Improvement Works to Tung Ping Chau Public Pier ENA60034 Contract No.: CV/2004/04 Monthly EM&A Monitoring Report No.3
INDEPENDENT ENVIRONMENTAL CHECKER
CHECK CERTIFICATE
Signed : ______________________________________ Independent Checker (Environmental)
Name : Dr. Roger W K Sze
Roger Sze & Associates Ltd.

Improvement Works to Tung Ping Chau Public Pier ENA60034 Contract No.: CV/2004/04 Monthly EM&A Monitoring Report No.3
TABLE OF CONTENTS Page
EXECUTIVE SUMMARY
1. INTRODUCTION 12. PROJECT INFORMATION 2.1 Background 1 2.2 Site Description 1 2.3 Construction Programme 1 2.4 Project Organization 1 2.5 Contact Details of Key Personnel 13. CONTRUCTION PROGRESS IN THIS REPORTING MONTH 24. IMPACT MARINE WATER QUALITY MONITORING 4.1 Monitoring Locations 2 4.2 Monitoring Parameters 2 4.3 Monitoring Frequency 2 4.4 Monitoring Methodology and Equipment Used 2 – 3 4.5 In-situ Measurement 3 – 4 4.6 Water Sampling and Sample Analysis 4 4.7 Action and Limit Level 4 4.8 Event and Action Plan 5 – 6 4.9 Monitoring Duration and Period 6 4.10 Marine Water Monitoring Results 6 – 75. ENVIRONMENTAL NON-CONFORMANCE 5.1 Summary of Marine Water Quality Monitoring 7 5.2 Summary of Environmental Complaints 7 5.3 Summary of Notification of Summons and Prosecution6. STATUS OF ENVIRONMENTAL LICENSING AND PERMITTING 77. WASTE MANAGEMENT 78. SITE INSPECTION 7 8.1 Summary of site inspection findings 7 – 8 8.2 Recommendations on site inspection findings 89. IMPLEMENTATION STATUS 9.1 Implementation Status of Environmental Mitigation Measures 8 9.2 Implementation Status of Event and Action Plan 8 9.3 Implementation Status of Environmental Complaint Handling 810. CONCLUSION 811. FUTURE KEY ISSUES 11.1 Upcoming EM&A program in reporting month 8 11.2 Upcoming construction works schedule in report month 9 APPENDIX A Organization Chart B Calibration Certificates of Water Quality Monitoring Equipment C Water Quality Monitoring Results D Graphical Plots of Impact Monitoring Data E QA/QC Results of Laboratory Analysis

Improvement Works to Tung Ping Chau Public Pier ENA60034 Contract No.: CV/2004/04 Monthly EM&A Monitoring Report No.3 F Site Inspection Record Sheets FIGURE PW-TPC-006 Improvement Works to Tung Ping Chau Public Pier – Environmental Monitoring TABLES 2.1 Contact Details of Key Personnel 3.1 Major Construction Activities in this reporting month 3.2 Implementation of Environmental Mitigation Measures 4.1 Water Quality Monitoring Stations 4.2 Water Quality Monitoring Parameters 4.3 Monitoring Frequency of Impact Monitoring 4.4 Details of Impact Monitoring Equipment (In-situ measurement) 4.5 Action and Limit Levels for Marine Water Quality 4.6 Event and Action Plan for Water Quality Monitoring 4.7 Schedule for Impact Monitoring 6.1 Summary of Environmental Licensing and Permit Status 7.1 Summary of Quantities of Waste for Disposal in this reporting month 8.1 The summary of site inspection findings 11.1 Upcoming EM&A Schedule in coming month 11.2 Construction Plan in the coming month

Improvement Works to Tung Ping Chau Public Pier ENA60034 Contract No.: CV/2004/04 Monthly EM&A Monitoring Report No.3
EXECUTIVE SUMMARY This monthly EM&A report (No.3) has been prepared by the Environmental Team (ET) of ETS-Testconsult Ltd for impact monitoring under “the Contract No. CV/2004/04 Improvement Works to Tung Ping Chau Public Pier (The Project) during the reporting period from 01 to 31 January 2006. Under the requirements of Environmental Monitoring and Audit Programme of the Contract No. CV/2004/04 “Improvement Works to Tung Ping Chau Public Pier”, EM&A requirement as set out in the PS is required to be implemented. In accordance with the PS, impact environmental monitoring of water quality and site audit is required for the Project. Construction Progress
The major construction works in this reporting month included construction the half of Causeway (West Side). Environmental Monitoring Progress
The summary of the monitoring activities in this monitoring month is listed below: • Marine Water Quality Monitoring: 4 Occasions at 4 designated locations; • Site Inspection: 4 Occasions. Marine Water Quality Monitoring
No exceedances of Action and Limit Levels were recorded for water quality monitoring parameters in this reporting month. Environmental Complaints
No complaints were received in this reporting month Notification of summons and successful prosecutions
There were no notification of summons and prosecutions with respect to environmental issues in this month. Future Key Issues
Base on the site inspections and forecast of engineering works in the coming month, key issues to be considered are as follows: • Maintain good site practice to avoid the environmental impact to the environment; • Maintain good waste management to minimize environmental impacts at the site; • Follow-up improvements on environmental and waste management issues.

Improvement Works to Tung Ping Chau Public Pier ENA60034 Contract No.: CV/2004/04 Monthly EM&A Monitoring Report No.3
________________________________________________________________________________________________________ January 2006 Page 1 of 9
1. INTRODUCTION
China Harbour Engineering Co. Ltd. (CHEC) was awarded the contract, Improvement Works to Tung Ping Chau Public Pier (Contact No.: CV/2004/04). Baseline monitoring and impact monitoring will be carried out at Tung Ping Chau Public Pier by Environmental Team (ET) of ETS-Testconsult Ltd (ETL). Roger Sze & Associates Ltd. was appointed by CHEC as Independent Checker (Environmental). The purpose of this Impact report is to monitor marine water quality during the construction works at the Project in January 2006 in order to control or avoid the environmental impacts to the environment nearby.
2. PROJECT INFORMATION
2.1 Background
The project will be planned and designed in-house by Port Works Division, Civil Engineering and Development Department. It is expected that the construction will be executed by China Harbour Engineering Co. Ltd to be appointed through tendering exercise.
2.2 Site Description
Figure PW-TPC-006 shows the monitoring locations of the site at Tung Ping Chau Public Pier.
2.3 Construction Programme
The project comprises the reconstruction of the Tung Ping Chau Public Pier and the proposed scope includes:
Setting up of a temporary site office; Demolition of the existing catwalk; Construction of a new catwalk of about 33m long and 5.5m wide with two supporting column; Widening of the existing rubble causeway from 3m to 5.5m; and Construction of a new roof.
2.4 Project Organization
The organization chart with respect to the on-site environmental management and monitoring program are shown in Appendix A.
2.5 Contact Details of Key Personnel The key personnel contact names and telephone numbers, and construction programme are shown in table 2.1. Table 2.1 Contact Details of Key Personnel
Organization Project Role Name of Key Staff Tel. No. Fax No. CEDD Employer Mr. David C S Leung 2762 5546 2714 2054Roger Sze & Associates Ltd.
Independent Checker (Environmental)
Ir. Dr. Roger W K Sze 2687 5681 2687 5826
CHEC Main Contractor Mr. Daniel Cheung 6012 2279 2952 9068ETL Contractor’s Environmental
Team Mr C L Lau 2946 7792 2695 3944

Improvement Works to Tung Ping Chau Public Pier ENA60034 Contract No.: CV/2004/04 Monthly EM&A Monitoring Report No.3
________________________________________________________________________________________________________ January 2006 Page 2 of 9
3. CONSTRUCTION PROGRESS IN THIS REPORTING MONTH
A summary of the major construction activities undertaken in this reporting month is shown in Table 3.1. Table 3.1 Major Construction Activities in this reporting month Item Construction Activities 1. Construction the half of Causeway (West Side)
4. IMPACT MARINE WATER QUALITY MONITORING 4.1 Monitoring Locations
The Impact water quality monitoring and control locations are shown in Table 4.1.
Table 4.1 Impact Water Quality Monitoring Stations Station EASTING (m) NORTHING (m)
C1 862 465.831 845 178.516 C2 862 771.171 845 012.179 M1 862 628.165 845 052.670 M2 862 663.052 845 031.017
During the impact monitoring, C2 was the upstream control station for all monitoring stations at mid-flood and C1 was the upstream control station for all monitoring stations at mid-ebb.
4.2 Monitoring Parameters
Monitoring of the marine water quality parameters listed in Table 4.2 shall be carried out by the ES to ensure that any deteriorating water quality could be readily detected and timely action be taken to rectify the situation.
Table 4.2 Water Quality Monitoring Parameters In-situ measurement Laboratory analysis
Dissolved Oxygen (mg/L) Dissolved Oxygen (%)
Temperature (°C) Turbidity (NTU) (Depth-averaged)
Salinity (ppt)
Suspended solids (mg/L) (Depth-average)
4.3 Monitoring Frequency
The frequency of the Impact water quality monitoring is summarized in Table 4.3.
Table 4.3 Monitoring frequency of Impact Monitoring Parameter Frequency Monitoring Depth Temperate Salinity Dissolved Oxygen Dissolved Oxygen saturation Turbidity Suspended solids
2 tides/day (Mid-flood and Mid-ebb): 3days/week during the pilling and demolition works.
1day/week during the marine works (not involving pilling and demolition works).
Surface, middle and bottom
4.4 Monitoring Methodology and Equipment Used
Positioning of the monitoring stations A hand-held digital Global Positioning System (GPS) was used to identify the designated monitoring stations prior to water sampling.
Improvement Works to Tung Ping Chau Public Pier ENA60034 Contract No.: CV/2004/04 Monthly EM&A Monitoring Report No.3
________________________________________________________________________________________________________ January 2006 Page 3 of 9
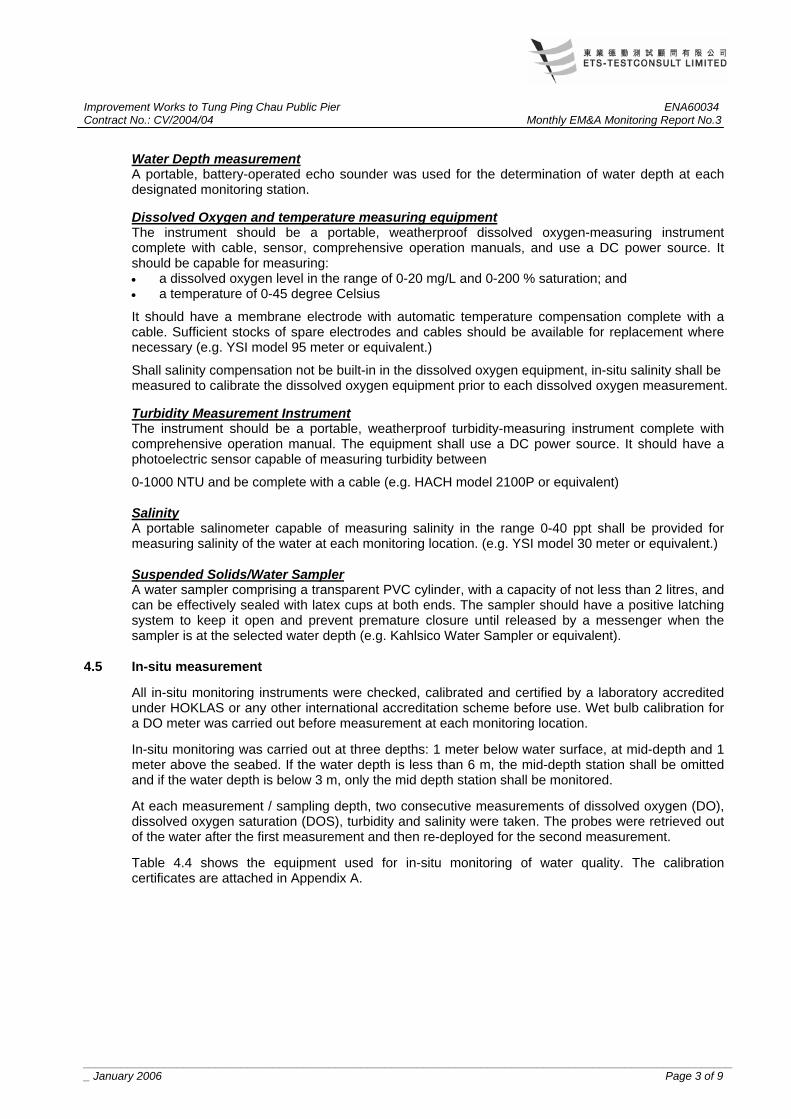
Water Depth measurement A portable, battery-operated echo sounder was used for the determination of water depth at each designated monitoring station. Dissolved Oxygen and temperature measuring equipment The instrument should be a portable, weatherproof dissolved oxygen-measuring instrument complete with cable, sensor, comprehensive operation manuals, and use a DC power source. It should be capable for measuring: • a dissolved oxygen level in the range of 0-20 mg/L and 0-200 % saturation; and • a temperature of 0-45 degree Celsius
It should have a membrane electrode with automatic temperature compensation complete with a cable. Sufficient stocks of spare electrodes and cables should be available for replacement where necessary (e.g. YSI model 95 meter or equivalent.)
Shall salinity compensation not be built-in in the dissolved oxygen equipment, in-situ salinity shall be measured to calibrate the dissolved oxygen equipment prior to each dissolved oxygen measurement. Turbidity Measurement Instrument The instrument should be a portable, weatherproof turbidity-measuring instrument complete with comprehensive operation manual. The equipment shall use a DC power source. It should have a photoelectric sensor capable of measuring turbidity between
0-1000 NTU and be complete with a cable (e.g. HACH model 2100P or equivalent) Salinity A portable salinometer capable of measuring salinity in the range 0-40 ppt shall be provided for measuring salinity of the water at each monitoring location. (e.g. YSI model 30 meter or equivalent.) Suspended Solids/Water Sampler A water sampler comprising a transparent PVC cylinder, with a capacity of not less than 2 litres, and can be effectively sealed with latex cups at both ends. The sampler should have a positive latching system to keep it open and prevent premature closure until released by a messenger when the sampler is at the selected water depth (e.g. Kahlsico Water Sampler or equivalent).
4.5 In-situ measurement
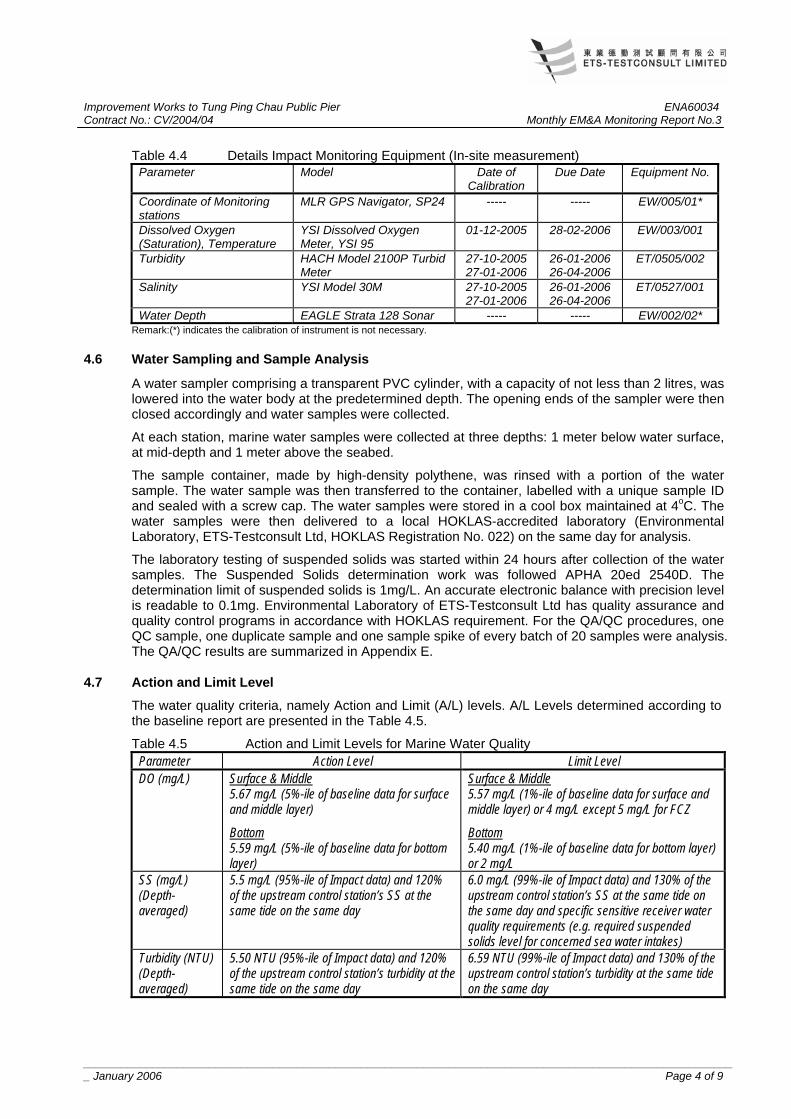
All in-situ monitoring instruments were checked, calibrated and certified by a laboratory accredited under HOKLAS or any other international accreditation scheme before use. Wet bulb calibration for a DO meter was carried out before measurement at each monitoring location. In-situ monitoring was carried out at three depths: 1 meter below water surface, at mid-depth and 1 meter above the seabed. If the water depth is less than 6 m, the mid-depth station shall be omitted and if the water depth is below 3 m, only the mid depth station shall be monitored. At each measurement / sampling depth, two consecutive measurements of dissolved oxygen (DO), dissolved oxygen saturation (DOS), turbidity and salinity were taken. The probes were retrieved out of the water after the first measurement and then re-deployed for the second measurement. Table 4.4 shows the equipment used for in-situ monitoring of water quality. The calibration certificates are attached in Appendix A.
Improvement Works to Tung Ping Chau Public Pier ENA60034 Contract No.: CV/2004/04 Monthly EM&A Monitoring Report No.3
________________________________________________________________________________________________________ January 2006 Page 4 of 9
Table 4.4 Details Impact Monitoring Equipment (In-site measurement) Parameter Model Date of
Calibration Due Date Equipment No.
Coordinate of Monitoring stations
MLR GPS Navigator, SP24 ----- ----- EW/005/01*
Dissolved Oxygen (Saturation), Temperature
YSI Dissolved Oxygen Meter, YSI 95
01-12-2005 28-02-2006 EW/003/001
Turbidity HACH Model 2100P Turbid Meter
27-10-200527-01-2006
26-01-2006 26-04-2006
ET/0505/002
Salinity YSI Model 30M 27-10-200527-01-2006
26-01-2006 26-04-2006
ET/0527/001
Water Depth EAGLE Strata 128 Sonar ----- ----- EW/002/02* Remark:(*) indicates the calibration of instrument is not necessary.
4.6 Water Sampling and Sample Analysis
A water sampler comprising a transparent PVC cylinder, with a capacity of not less than 2 litres, was lowered into the water body at the predetermined depth. The opening ends of the sampler were then closed accordingly and water samples were collected.
At each station, marine water samples were collected at three depths: 1 meter below water surface, at mid-depth and 1 meter above the seabed.
The sample container, made by high-density polythene, was rinsed with a portion of the water sample. The water sample was then transferred to the container, labelled with a unique sample ID and sealed with a screw cap. The water samples were stored in a cool box maintained at 4oC. The water samples were then delivered to a local HOKLAS-accredited laboratory (Environmental Laboratory, ETS-Testconsult Ltd, HOKLAS Registration No. 022) on the same day for analysis.
The laboratory testing of suspended solids was started within 24 hours after collection of the water samples. The Suspended Solids determination work was followed APHA 20ed 2540D. The determination limit of suspended solids is 1mg/L. An accurate electronic balance with precision level is readable to 0.1mg. Environmental Laboratory of ETS-Testconsult Ltd has quality assurance and quality control programs in accordance with HOKLAS requirement. For the QA/QC procedures, one QC sample, one duplicate sample and one sample spike of every batch of 20 samples were analysis. The QA/QC results are summarized in Appendix E.
4.7 Action and Limit Level
The water quality criteria, namely Action and Limit (A/L) levels. A/L Levels determined according to the baseline report are presented in the Table 4.5.
Table 4.5 Action and Limit Levels for Marine Water Quality Parameter Action Level Limit Level DO (mg/L) Surface & Middle
5.67 mg/L (5%-ile of baseline data for surface and middle layer)
Bottom 5.59 mg/L (5%-ile of baseline data for bottom layer)
Surface & Middle 5.57 mg/L (1%-ile of baseline data for surface and middle layer) or 4 mg/L except 5 mg/L for FCZ
Bottom 5.40 mg/L (1%-ile of baseline data for bottom layer) or 2 mg/L
SS (mg/L) (Depth-averaged)
5.5 mg/L (95%-ile of Impact data) and 120% of the upstream control station’s SS at the same tide on the same day
6.0 mg/L (99%-ile of Impact data) and 130% of the upstream control station’s SS at the same tide on the same day and specific sensitive receiver water quality requirements (e.g. required suspended solids level for concerned sea water intakes)
Turbidity (NTU) (Depth-averaged)
5.50 NTU (95%-ile of Impact data) and 120% of the upstream control station’s turbidity at the same tide on the same day
6.59 NTU (99%-ile of Impact data) and 130% of the upstream control station’s turbidity at the same tide on the same day

Improvement Works to Tung Ping Chau Public Pier ENA60034 Contract No.: CV/2004/04 Monthly EM&A Monitoring Report No.3
________________________________________________________________________________________________________ January 2006 Page 5 of 9
4.8 Event and Action Plan
Should the monitoring results of the water quality parameters at any designated monitoring stations indicate that the water quality criteria are exceeded, the actions in accordance with the Event and Action Plan that summarized in Table 4.6 should be carried out. Table 4.6 Event and Action Plan for Water Quality Monitoring
Event Action by Environmental Team (ET) Leader
Action by Independent Checker (Environmental), IC(E)
Action by Engineer Action by Contractor
Action Level being exceed for one sampling day
1. Repeat in-situ measurement to confirm findings;
2. Identify source(s) of impact;3. Inform IC(E) and
Contractor; 4. Check monitoring data, all
plant, equipment and Contractor’s working method;
5. Discuss mitigation measures with IC(E) and the Contractor;
6. Repeat measurement on next day of exceedance.
1. Discuss with ET and the Contractor on the mitigation measures;
2. Review proposals on mitigation measures submitted by the Contractor and advise the Engineer accordingly;
3. Assess the effectiveness of the implemented mitigation measures.
1. Discuss with IC(E) on the proposed mitigation measures;
2. Make agreement on the mitigation measures to be implemented.
1. Inform Engineer and confirm notification of the non-compliance in writing;
2. Rectify unacceptable practice;
3. Check all plant and equipment;
4. Consider changes of working methods;
5. Discuss with ET, IC(E) and the Engineer and the propose mitigation measures to IC(E) and the Engineer within 3 working days;
6. Implement the agreed mitigation measures.
Action Level being exceeded by more than one consecutive sampling days
1. Repeat in-situ measurement to confirm findings;
2. Identify source(s) of impact;3. Inform IC(E) and
Contractor; 4. Check monitoring data, all
plant, equipment and Contractor’s working method;
5. Discuss mitigation measures with IC(E) and the Contractor;
6. Ensure mitigation measures are implemented;
7. Prepare to increase the monitoring frequency to daily;
8. Repeat measurement on next day of exceedance.
1. Discuss with ET and the Contractor on the mitigation measures;
2. Review proposals on mitigation measures submitted by the Contractor and advise the Engineer accordingly;
3. Assess the effectiveness of the implemented mitigation measures.
1. Discuss with IC(E) on the proposed mitigation measures;
2. Make agreement on the mitigation measures to be implemented;
3. Assess the effectiveness of the implemented mitigation measures.
1. Inform Engineer and confirm notification of the non-compliance in writing;
2. Rectify unacceptable practice;
3. Check all plant and equipment;
4. Consider changes of working methods;
5. Discuss with ET, IC(E) and the Engineer and the propose mitigation measures to IC(E) and the Engineer within 3 working days;
6. Implement the agreed mitigation measures.
Limit level being exceeded by on sampling day
1. Repeat in-situ measurement to confirm findings;
2. Identify source(s) of impact;
3. Inform IC(E) and Contractor;
4. Check monitoring data, all plant, equipment and Contractor’s working method;
5. Discuss mitigation measures with IC(E) and the Contractor;
6. Ensure mitigation measures are implemented;
7. Increase the monitoring frequency to daily until no exceedance of Limit Level.
1. Discuss with ET and the Contractor on the mitigation measures;
2. Review proposals on mitigation measures submitted by the Contractor and advise the Engineer accordingly;
3. Assess the effectiveness of the implemented mitigation measures.
1. Discuss with IC(E), ET and the Contractor on the mitigation measures;
2. Request the Contractor to critically review the working method;
3. Make agreement on the mitigation measures to be implemented;
4. Assess the effectiveness of the implemented mitigation measures.
1. Inform Engineer and confirm notification of the non-compliance in writing;
2. Rectify unacceptable practice;
3. Check all plant and equipment;
4. Consider changes of working methods;
5. Discuss with ET, IC(E) and the Engineer and the propose mitigation measures to IC(E) and the Engineer within 3 working days;
6. Implement the agreed mitigation measures.

Improvement Works to Tung Ping Chau Public Pier ENA60034 Contract No.: CV/2004/04 Monthly EM&A Monitoring Report No.3
________________________________________________________________________________________________________ January 2006 Page 6 of 9
Event Action by Environmental Team (ET) Leader
Action by Independent Checker (Environmental), IC(E)
Action by Engineer Action by Contractor
Limit level being exceeded by more than two consecutive sampling days
1. Repeat in-situ measurement to confirm findings;
2. Identify source(s) of impact;
3. Inform IC(E) and Contractor;
4. Check monitoring data, all plant, equipment and Contractor’s working method;
5. Discuss mitigation measures with IC(E) and the Contractor;
6. Ensure mitigation measures are implemented;
7. Increase the monitoring frequency to daily until no exceedance of Limit Level
1. Discuss with ET and the Contractor on the mitigation measures;
2. Review proposals on mitigation measures submitted by the Contractor and advise the Engineer accordingly;
3. Assess the effectiveness of the implemented mitigation measures.
1. Discuss with IC(E), ET and the Contractor on the mitigation measures;
2. Request the Contractor to critically review the working method;
3. Make agreement on the mitigation measures to be implemented;
4. Assess the effectiveness of the implemented mitigation measures;
5. Consider and instruct, if necessary, the Contractor to slow down or to stop all or part of the marine work until no exceedance of Limit Level.
1. Inform Engineer and confirm notification of the non-compliance in writing;
2. Rectify unacceptable practice;
3. Check all plant and equipment;
4. Consider changes of working methods;
5. Discuss with ET, IC(E) and the Engineer and the propose mitigation measures to IC(E) and the Engineer within 3 working days;
6. Implement the agreed mitigation measures;
7. As directed by the Engineer, to slow down or to stop all or part of the marine work or construction activities.
4.9 Monitoring Duration and Period
In-situ measurement was carried out at both mid-flood and mid-ebb at each location on a sampling day. Table 4.7 shows the schedule for Impact water quality monitoring.
Table 4.7 Schedule for Impact Monitoring
Sun Mon Tue Wed Thu Fri Sat 1 2 3 4 5 6 7
Public Holiday
Mid-flood (09:00-11:00) Mid-ebb (14:30-16:30)
8 9 10 11 12 13 14
Mid-ebb (10:00-12:00) Mid-flood (15:00-17:00)
15 16 17 18 19 20 21
Mid-flood (09:00-11:00) Mid-ebb (14:00-16:00)
22 23 24 25 26 27 28
Mid-ebb (09:00-11:00) Mid-flood (13:00-15:00)
Public Holiday
29 * 30 31
Public Holiday
Public Holiday
4.10 Impact Monitoring Results No exceedances of Action and Limit Level of water quality monitoring parameters were recorded in this reporting month. All monitoring results are provided in Appendix B2. Graphical presentation of the monitoring results for the reporting month are shown in Appendix B3.

Improvement Works to Tung Ping Chau Public Pier ENA60034 Contract No.: CV/2004/04 Monthly EM&A Monitoring Report No.3
________________________________________________________________________________________________________ January 2006 Page 7 of 9
5. ENVIRONMENTAL NON-CONFORMANCE 5.1 Summary of water quality monitoring
No exceedances of Action and Limit Level of marine water quality monitoring parameter were recorded in this reporting month.
5.2 Summary of Environmental Complaints
No complaints were received during the reporting month.
5.3 Summary of Notification of Summons and Prosecution There were no notification of summons respect to environmental issues registered in this month.
6. STATUS OF ENVIRONMENTAL LICENSING AND PERMITTING All permits/licenses valid in this reporting month are summarized in Table 6.1. Table 6.1 Summary of Environmental Licensing and Permit Status
Valid PeriodDescription Permit No. From To
Section
Environmental Permit
EP-222/2005 07/09/04 --- Setting up of a temporary site office; Demolition of the existing catwalk; Construction of a new catwalk of about 33m long and 5.5m wide with two supporting column;
Widening of the existing rubble causeway from 3m to 5.5m; and
Construction of a new roof.
7. WASTE MANAGEMENT
The quantities of waste for disposal in this month are summarized in Table 7.1.
Table 7.1 Summary of Quantities of Waste for Disposal in this reporting month Type of Waste Quantity Disposal Location Project Cumulative Quantity
C&D Materials (Inert) (m3) 0 Nil 0 C&D Materials (Non-inert) (m3) 0 Nil 0
General Refuse (m3) 0 Nil 0 Chemical Waste (m3) 0 Nil 0
8. SITE INSPECTION Weekly site inspection was carried out by the ET. Four site inspections were undertaken in
monitoring period. Details of the site inspection findings are attached in Appendix F. 8.1 Summary of site inspection findings
The summary of site inspection findings are shown in Table 8.1.

Improvement Works to Tung Ping Chau Public Pier ENA60034 Contract No.: CV/2004/04 Monthly EM&A Monitoring Report No.3
________________________________________________________________________________________________________ January 2006 Page 8 of 9
Table 8.1 The summary of site inspection findings
Inspection Parameter Finding Water Quality Water quality was found satisfactory during the site inspection period. No
visible foam, oil, grease, litter or other objectionable matter was present on the water within the site.
Air Quality Air quality was found satisfactory during the site inspection period. No noticeable dust was generated at the site.
Noise Quality Noise quality was found satisfactory during the site inspection period. 8.2 Recommendations on site inspection findings
Based on the site inspection findings, the recommendations are as below: • Maintain good site practices to avoid environmental impacts to the environment; • Maintain good waste management at the site; • Remove the construction wastes accumulated inside and outside the construction site
periodically. 9. IMPLEMENTATION STATUS 9.1 Implementation Status of Environmental Mitigation Measures
Most of the necessary mitigation measures were implemented properly.
9.2 Implementation Status of Event and Action Plan
There were no exceedances of Action and Limited Level in this reporting month. Hence, no further mitigation measures were required.
9.3 Implementation Status of Environmental Complaint Handling No complaints had been received during this monitoring month. 10. CONCLUSION
According to the marine water monitoring results, all monitoring results were found within the Action and Limit Level in this reporting month. Hence, no further mitigation measures were required. According to the weekly site inspections carried out by the ET, it was found that air, noise and water quality were found satisfactory in this monitoring period. Finally, ES recommended the Contractor to maintain good waste management and good site practice in order to minimize the environmental impacts at the site.
11. FUTURE KEY ISSUES 11.1 Upcoming EM&A Schedule
The Proposed EM&A program in coming month is presented as following Table 11.1. Table 11.1 Upcoming EM&A Schedule in coming month
Monitoring Location February 2006 Marine Water Quality Monitoring 04, 09, 16, 23 Site Inspection 04, 09, 16, 23
Improvement Works to Tung Ping Chau Public Pier ENA60034 Contract No.: CV/2004/04 Monthly EM&A Monitoring Report No.3
________________________________________________________________________________________________________ January 2006 Page 9 of 9
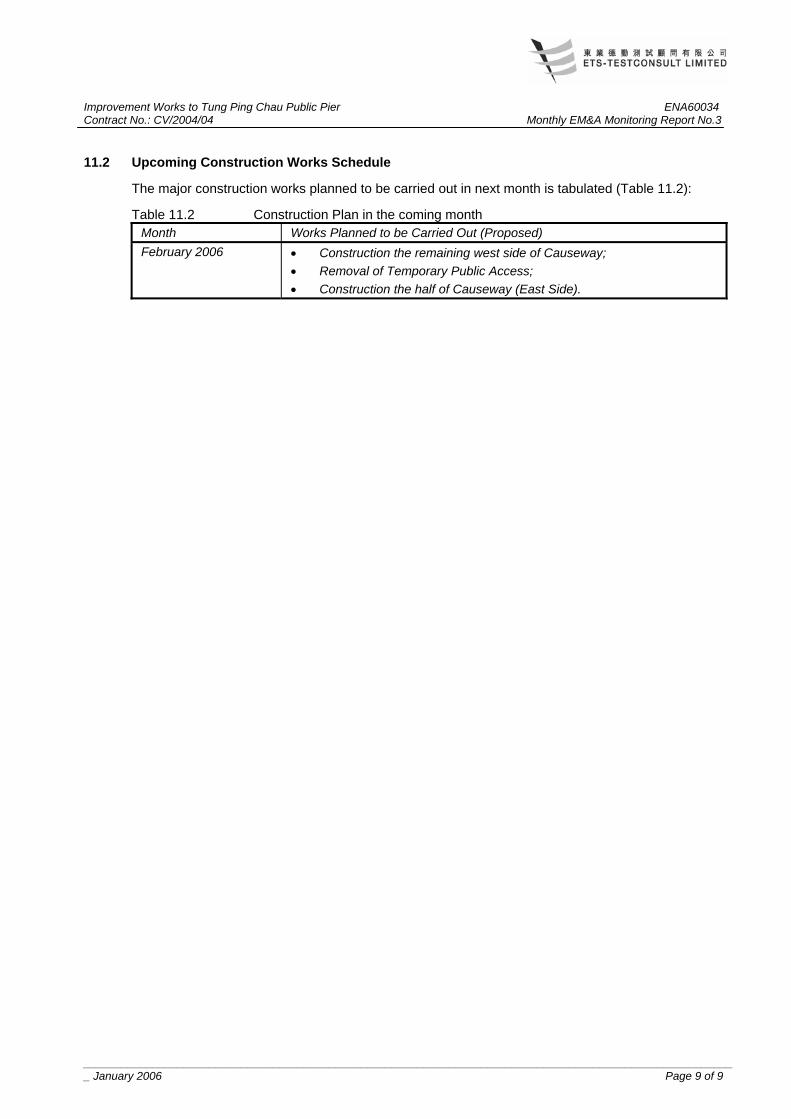
11.2 Upcoming Construction Works Schedule
The major construction works planned to be carried out in next month is tabulated (Table 11.2):
Table 11.2 Construction Plan in the coming month Month Works Planned to be Carried Out (Proposed) February 2006 • Construction the remaining west side of Causeway;
• Removal of Temporary Public Access; • Construction the half of Causeway (East Side).

Appendix A
Organization Chart

Environmental Spectialist
ETS-Testconsult Ltd.
Site Agent
Mr. Daniel Cheung
Construction Engineer
Mr. M B He
General Forman
Mr. C M Yu
Independent Checker
(Environmental)

Appendix B
Calibration Certificates for Marine Water Quality Monitoring Equipments

Appendix C
Marine Water Monitoring Results

Appendix D
Graphical Plots of Marine Water Monitoring Data

Appendix E
QA/QC Results of Laboratory Analysis

QA/QC Results of Laboratory Analysis of Total Suspended Solids
QC Sample Analysis Sample Duplicate Sample Spike
Sampling Date % Recovery * Sample ID % Error # Sample ID % Recovery @
95.1 C1F-M 0.0 M1F-M 98.3
94.4 M2F-M 0.0 C2E-S 105.8 04/01/06
97.6 C2E-B 0.0 M2E-M 106.9
103.8 C1F-S 0.0 M1F-M 98.1
100.4 M1F-B 0.0 C2E-S 106.6 12/01/06
97.8 C2E-B 0.0 M2E-B 100.0
101.0 C1F-M 0.0 M1F-M 101.6
107.2 M2F-M 0.0 C2E-S 105.5 19/01/06
95.0 C2E-B 0.0 M2E-M 100.0
99.3 C1F-S 0.0 M1F-M 106.7
106.5 M2F-S 0.0 C2E-S 94.6 26/01/06
99.8 C2E-B 0.0 M2E-B 107.4 Note: (*) % Recovery of QC sample should be between 80% to 120%. (#) % Error of Sample Duplicate should be between –10% to 10%. (@) % Recovery of Sample Spike should be between 80% to 120%.

Appendix F
Site Inspection Record Sheets

Figures

Environmental Marine Water Monitoring Data at Tung Ping Chau Public Pier 1. Impact Monitoring Time and Water Depth
Monitoring Location C1 M1 M2 C2 Date Monitoring Time
and Water Depth Flood Ebb Flood Ebb Flood Ebb Flood Ebb
Monitoring Time 09:25 – 09:35 15:13 – 15:23 09:45 – 09:55 14:58 – 15:08 10:00 – 10:10 14:45 – 14:55 10:15 – 10:25 14:30 – 14:40 4/1/06
Water Depth (m) 2.4 2.4 2.6 2.2 2.8 2.4 5.0 4.6
Monitoring Time 15:00 – 15:10 10:00 – 10:11 15:13 – 15:24 10:16 – 10:27 15:28 – 15:38 10:32 – 10:42 15:42 – 15:52 10:47 – 10:58 12/1/06
Water Depth (m) 3.8 4.2 3.4 2.8 3.8 3.6 5.8 5.8
Monitoring Time 10:00 – 10:10 14:40 – 14:50 10:13 – 10:23 14:27 – 14:37 10:25 – 10:35 14:15 – 14:25 10:40 – 10:50 14:00 – 14:10 19/1/06
Water Depth (m) 2.4 2.6 2.2 2.4 3.6 2.6 4.8 5.0
Monitoring Time 13:00 – 13:10 10:00 – 10:10 13:15 – 13:23 10:15 – 10:25 13:27 – 13:37 10:30 – 10:40 13:42 – 13:52 10:45 – 10:55 26/1/06
Water Depth (m) 5.4 4.8 2.8 2.8 3.4 2.8 5.8 5.0
2. Weather Condition and Ambient Temperature
Weather C1 M1 M2 C2
Flood Ebb Flood Ebb Flood Ebb Flood Ebb Date
WeatherAmbient
Temperature(oC)
Weather Ambient
Temperature (oC)
WeatherAmbient
Temperature(oC)
WeatherAmbient
Temperature(oC)
Weather Ambient
Temperature(oC)
WeatherAmbient
Temperature (oC)
WeatherAmbient
Temperature(oC)
Weather Ambient
Temperature(oC)
4/1/06 Cloudy 18 Cloudy 18 Cloudy 18 Cloudy 18 Cloudy 18 Cloudy 18 Cloudy 18 Cloudy 18 12/1/06 Sunny 15 Cloudy 15 Sunny 15 Cloudy 15 Sunny 15 Cloudy 15 Sunny 15 Cloudy 15 19/1/06 Cloudy 21 Cloudy 21 Cloudy 21 Cloudy 21 Cloudy 21 Cloudy 21 Cloudy 21 Cloudy 21 26/1/06 Cloudy 13 Cloudy 13 Cloudy 13 Cloudy 13 Cloudy 13 Cloudy 13 Cloudy 13 Cloudy 13
3. Water Temperature (oC)
Temperature (oC) C1 M1 M2 C2
Flood Ebb Flood Ebb Flood Ebb Flood Ebb Date
S M B S M B S M B S M B S M B S M B S M B S M B 4/1/06 - 18.0 - - 18.4 - - 17.9 - - 18.5 - - 18.0 - - 18.5 - 17.9 - 18.0 18.9 - 18.2 12/1/06 17.6 - 16.9 16.7 - 16.7 17.3 - 17.1 - 16.6 - 17.7 - 17.5 16.6 - 16.6 17.2 - 17.0 16.7 - 16.6 19/1/06 - 18.2 - - 18.2 - - 18.2 - - 18.2 - - 18.1 - - 18.1 - 18.2 - 18.0 18.2 - 17.9 26/1/06 15.9 - 16.1 16.1 - 16.4 - 16.0 - - 16.3 - 16.0 - 16.1 - 16.4 - 15.8 - 16.0 16.4 - 16.1

Environmental Marine Water Monitoring Data at Tung Ping Chau Public Pier 4. Dissolved Oxygen (DO, mg/L)
Dissolved Oxygen (DO, mg/L) C1 M1 M2 C2
Flood Ebb Flood Ebb Flood Ebb Flood Ebb Date
S M B S M B S M B S M B S M B S M B S M B S M B 4/1/06 - 8.34 - - 7.87 - - 8.14 - - 7.92 - - 8.01 - - 7.85 - 7.97 - 7.89 7.97 - 7.89 12/1/06 7.02 - 6.78 6.63 - 6.34 6.98 - 7.57 - 5.75 - 7.86 - 7.38 6.12 - 5.80 7.35 - 7.16 6.26 - 5.99 19/1/06 - 7.72 - - 7.75 - - 7.43 - - 7.72 - - 7.45 - - 7.77 - 7.62 - 7.81 7.80 - 8.03 26/1/06 6.56 - 6.67 6.67 - 6.94 - 6.26 - - 6.36 - 6.44 - 6.18 - 6.17 - 6.85 - 6.54 7.05 - 6.80
5. Dissolved Oxygen Saturation (DOS, %)
Dissolved Oxygen Saturation (DOS, %) C1 M1 M2 C2
Flood Ebb Flood Ebb Flood Ebb Flood Ebb Date
S M B S M B S M B S M B S M B S M B S M B S M B 4/1/06 - 106.5 - - 100.8 - - 104.0 - - 101.4 - - 102.5 - - 100.5 - 101.9 - 100.5 102.2 - 101.2 12/1/06 90.2 - 86.4 84.4 - 80.4 89.0 - 96.1 - 72.5 - 102.9 - 95.3 77.1 - 73.0 93.5 - 90.8 78.7 - 75.4 19/1/06 - 100.4 - - 100.6 - - 96.4 - - 100.1 - - 96.5 - - 100.7 - 98.7 - 101.1 101.2 - 103.9 26/1/06 85.7 - 85.5 83.9 - 85.9 - 77.7 - - 79.4 - 80.3 - 78.6 - 77.3 - 87.4 - 78.5 86.4 - 85.9
6. Salinity
Salinity (ppt) C1 M1 M2 C2
Flood Ebb Flood Ebb Flood Ebb Flood Ebb Date
S M B S M B S M B S M B S M B S M B S M B S M B 4/1/06 - 31.3 - - 32.9 - - 32.0 - - 32.8 - - 32.4 - - 32.8 - 32.6 - 32.7 32.9 - 32.7 12/1/06 33.0 - 33.1 33.4 - 33.3 33.0 - 33.2 - 33.3 - 33.2 - 33.0 33.3 - 33.3 33.3 - 33.0 33.1 - 33.2 19/1/06 - 33.6 - - 33.4 - - 33.5 - - 33.4 - - 33.5 - - 33.5 - 33.5 - 33.4 33.4 - 33.6 26/1/06 33.0 - 33.2 33.5 - 33.5 - 33.1 - - 33.7 - 33.4 - 33.4 - 33.5 - 33.4 - 33.6 33.6 - 33.6

Environmental Marine Water Monitoring Data at Tung Ping Chau Public Pier
7. Suspended Solids
Suspended Solids (mg/L) C1 M1 M2 C2
Flood Ebb Flood Ebb Flood Ebb Flood Ebb Date
S M B Ave S M B Ave S M B Ave S M B Ave S M B Ave S M B Ave S M B Ave S M B Ave 4/01/06 - 4.5 - 4.5 - 3 - 3.0 - 3 - 3.0 - 2.5 - 2.5 - 3 - 3.0 - 3.2 - 3.2 3.5 - 4 3.8 3.4 - 4 3.7 12/01/06 2.4 - 2 2.2 1.5 - 2 1.8 3 - 2 2.5 - 2.5 - 2.5 2.3 - 1.5 1.9 2.2 - 2 2.1 2.3 - 2.3 2.3 2.1 - 1.8 2.0 19/01/06 - 2.3 - 2.3 - 3.5 - 3.5 - 3.2 - 3.2 - 2.3 - 2.3 - 2.5 - 2.5 - 2.5 - 2.5 2.3 - 2 2.2 2.5 - 2.5 2.5 26/01/06 2.4 - 2.5 2.5 3.3 - 2.3 2.8 - 2.4 - 2.4 - 2.5 - 2.5 2.5 - 2.3 2.4 - 2.8 - 2.8 2.5 - 2.5 2.5 2.5 - 2.3 2.4
8. Turbidity
Turbidity (NTU) C1 M1 M2 C2
Flood Ebb Flood Ebb Flood Ebb Flood Ebb Date
S M B Ave S M B Ave S M B Ave S M B Ave S M B Ave S M B Ave S M B Ave S M B Ave 4/01/06 - 2.18 - 2.18 - 2.11 - 2.11 - 2.44 - 2.44 - 2.22 - 2.22 - 2.72 - 2.72 - 2.22 - 2.22 2.78 - 2.48 2.63 2.84 - 3.07 2.96
12/01/06 1.74 - 0.84 1.29 1.11 - 1.43 1.27 2 - 0.91 1.46 - 1.74 - 1.74 1.05 - 0.94 1.00 1.66 - 0.74 1.20 1.55 - 0.96 1.26 1.41 - 0.78 1.10 19/01/06 - 2.14 - 2.14 - 2.96 - 2.96 - 2.82 - 2.82 - 1.71 - 1.71 - 2.15 - 2.15 - 2.25 - 2.25 1.84 - 1.68 1.76 2.37 - 2.19 2.28 26/01/06 1.97 - 2.36 2.17 2.83 - 2.07 2.45 - 2.16 - 2.16 - 2.15 - 2.15 2.26 - 2.04 2.15 - 2.83 - 2.83 2.07 - 2.29 2.18 1.93 - 1.54 1.74

DO content (Surface) at mid-flood tide
3
4
5
6
7
8
9
10
27/11/0528/11/0529/11/0530/11/0501/12/0502/12/0503/12/0504/12/0505/12/0506/12/0507/12/0508/12/0509/12/0510/12/0511/12/0512/12/0513/12/0514/12/0515/12/0516/12/0517/12/0518/12/0519/12/0520/12/0521/12/0522/12/0523/12/0524/12/0525/12/0526/12/0527/12/0528/12/0529/12/0530/12/0531/12/0501/01/0602/01/0603/01/0604/01/0605/01/0606/01/0607/01/0608/01/0609/01/0610/01/0611/01/0612/01/0613/01/0614/01/0615/01/0616/01/0617/01/0618/01/0619/01/0620/01/0621/01/0622/01/0623/01/0624/01/0625/01/0626/01/0627/01/0628/01/0629/01/0630/01/0631/01/06
Date
DO
(mg/
L)
C1 M1 M2 C2 Action Level Limit Level
DO content (Middle) at mid-flood tide
3
4
5
6
7
8
9
10
27/11/0528/11/0529/11/0530/11/0501/12/0502/12/0503/12/0504/12/0505/12/0506/12/0507/12/0508/12/0509/12/0510/12/0511/12/0512/12/0513/12/0514/12/0515/12/0516/12/0517/12/0518/12/0519/12/0520/12/0521/12/0522/12/0523/12/0524/12/0525/12/0526/12/0527/12/0528/12/0529/12/0530/12/0531/12/0501/01/0602/01/0603/01/0604/01/0605/01/0606/01/0607/01/0608/01/0609/01/0610/01/0611/01/0612/01/0613/01/0614/01/0615/01/0616/01/0617/01/0618/01/0619/01/0620/01/0621/01/0622/01/0623/01/0624/01/0625/01/0626/01/0627/01/0628/01/0629/01/0630/01/0631/01/06
Date
DO
(mg/
L)
C1 M1 M2 C2 Action Level Limit Level
DO content (Bottom) at mid-flood tide
3
4
5
6
7
8
9
10
27/11/0528/11/0529/11/0530/11/0501/12/0502/12/0503/12/0504/12/0505/12/0506/12/0507/12/0508/12/0509/12/0510/12/0511/12/0512/12/0513/12/0514/12/0515/12/0516/12/0517/12/0518/12/0519/12/0520/12/0521/12/0522/12/0523/12/0524/12/0525/12/0526/12/0527/12/0528/12/0529/12/0530/12/0531/12/0501/01/0602/01/0603/01/0604/01/0605/01/0606/01/0607/01/0608/01/0609/01/0610/01/0611/01/0612/01/0613/01/0614/01/0615/01/0616/01/0617/01/0618/01/0619/01/0620/01/0621/01/0622/01/0623/01/0624/01/0625/01/0626/01/0627/01/0628/01/0629/01/0630/01/0631/01/06
Date
DO
(mg/
L)
C1 M1 M2 C2 Action Level Limit Level

DO content (Surface) at mid-ebb tide
3
4
5
6
7
8
9
10
27/11/0528/11/0529/11/0530/11/0501/12/0502/12/0503/12/0504/12/0505/12/0506/12/0507/12/0508/12/0509/12/0510/12/0511/12/0512/12/0513/12/0514/12/0515/12/0516/12/0517/12/0518/12/0519/12/0520/12/0521/12/0522/12/0523/12/0524/12/0525/12/0526/12/0527/12/0528/12/0529/12/0530/12/0531/12/0501/01/0602/01/0603/01/0604/01/0605/01/0606/01/0607/01/0608/01/0609/01/0610/01/0611/01/0612/01/0613/01/0614/01/0615/01/0616/01/0617/01/0618/01/0619/01/0620/01/0621/01/0622/01/0623/01/0624/01/0625/01/0626/01/0627/01/0628/01/0629/01/0630/01/0631/01/06
Date
DO
(mg/
L)
C1 M1 M2 C2 Action Level Limit Level
DO content (Middle) at mid-ebb tide
3
4
5
6
7
8
9
10
27/11/0528/11/0529/11/0530/11/0501/12/0502/12/0503/12/0504/12/0505/12/0506/12/0507/12/0508/12/0509/12/0510/12/0511/12/0512/12/0513/12/0514/12/0515/12/0516/12/0517/12/0518/12/0519/12/0520/12/0521/12/0522/12/0523/12/0524/12/0525/12/0526/12/0527/12/0528/12/0529/12/0530/12/0531/12/0501/01/0602/01/0603/01/0604/01/0605/01/0606/01/0607/01/0608/01/0609/01/0610/01/0611/01/0612/01/0613/01/0614/01/0615/01/0616/01/0617/01/0618/01/0619/01/0620/01/0621/01/0622/01/0623/01/0624/01/0625/01/0626/01/0627/01/0628/01/0629/01/0630/01/0631/01/06
Date
DO
(mg/
L)
C1 M1 M2 C2 Action Level Limit Level
DO content (Bottom) at mid-ebb tide
3
4
5
6
7
8
9
10
27/11/0528/11/0529/11/0530/11/0501/12/0502/12/0503/12/0504/12/0505/12/0506/12/0507/12/0508/12/0509/12/0510/12/0511/12/0512/12/0513/12/0514/12/0515/12/0516/12/0517/12/0518/12/0519/12/0520/12/0521/12/0522/12/0523/12/0524/12/0525/12/0526/12/0527/12/0528/12/0529/12/0530/12/0531/12/0501/01/0602/01/0603/01/0604/01/0605/01/0606/01/0607/01/0608/01/0609/01/0610/01/0611/01/0612/01/0613/01/0614/01/0615/01/0616/01/0617/01/0618/01/0619/01/0620/01/0621/01/0622/01/0623/01/0624/01/0625/01/0626/01/0627/01/0628/01/0629/01/0630/01/0631/01/06
Date
DO
(mg/
L)
C1 M1 M2 C2 Action Level Limit Level