china distribution & trading - fung group issue 22 january 2005 china distribution & trading...
TRANSCRIPT

1Issue 22 January 2005
China Distribution & Trading Issue 22 January 2005
IN THIS ISSUE :
Li & Fung Research Centre
13/F, LiFung Centre
2 On Ping Street
Shatin, Hong Kong
Tel: (852) 2635 5563
Fax: (852) 2635 1598
E-mail: [email protected]
China’s Consumer Market and
The Market Profile on
Three Major City Clusters:
The Pearl River Delta,
the Yangtze River Delta, and
the “Beijing-Tianjin-Hebei” Region
China – a Huge but Not a Single UnifiedMarket
Given a population of 1.3 billion people, no doubt, China has a huge consumer market
with great potential. Over 1978 – 2003, GDP and total retail sales of consumer goods
rose at an average annual rate of 14.92% and 14.48% respectively. Such an expanding
consumer market, however, presents a fragmented picture. Incomes vary enormously
from region to region, and from urban to rural areas. Different regions are developing
at their own pace due to vast differences among cities and regions in terms of
geographical location, economic development, etc. Each provincial/city government
also wants to protect their local businesses, hence leading to barriers to enter the
markets. Overall, China is not a single unified market; instead, it is composed of many
fragmented, localized markets.
I. The Market Profile on Three Major CityClusters: The Pearl River Delta, the YangtzeRiver Delta, and the Beijing-Tianjin-HebeiRegion
1. The Pearl River Delta
The Pearl River Delta (PRD) Economic Zone locates in the central and southern part
of Guangdong province, an area immediately north of Hong Kong and Macao and
surrounding the Pearl River. The PRD Economic Zone covers 13 cities and counties
(districts), including 2 sub-provincial-level cities: Guangzhou and Shenzhen; 5
prefecture-level cities: Dongguan, Foshan, Zhuhai, Zhongshan, Jiangmen; urban
districts of Huizhou, Huidong County, Boluo County, urban districts of Zhaoqing,
Gaoyao County-level City and Sihui County-level City (See Exhibit 1). It has an area
of 41,698 square kilometers, about 0.43% of the total area of the whole country. Its
size of population is 23.99 million, 1.86% of the national total.
China – a Huge but Not
a Single Unified Market
I. The Market Profile on
Three Major City Clusters:
The Pearl River Delta, the
Yangtze River Delta, and the
“Beijing-Tianjin-Hebei” Region 1
1. The Pearl River Delta 1
2. The Yangtze River Delta 5
3. The “Beijing-Tianjin-Hebei”
Region 12
II. General Background on
China’s Consumer Market 15
1. The Two-tier Market:
Urban and Rural 15
2. Regional Disparity in
Wealth and Consumption 18
3. The Upgrading of
Consumption Structure 20
4. Fragmented Market:
Local Protectionism 23

2Issue 22 January 2005
China Distribution & TradingLi & Fung Research Centre
Exhibit 1: Map of the Pearl River Delta Region
Zhanjiang
Maoming Yangjiang
Yunfu
Jiangmen
Zhaoqing
Qingyuan
Shaoguan
HeyuanMeizhou
Zhongshan
Guangzhou
Chaozhou
ShantouJieyang
ShanweiHuizhou
Zhuhai
Shenzhen
DongguanFoshan
Hong Kong
Gaoyao
Zhaoqing
Sihui
Guangzhou
Foshan Dongguan
Jiangmen
Zhongshan
Zhuhai
Shenzhen
Boluo
Huizhou
Huidong
Hong Kong
The PRD has been China’s most economically dynamic
region since the onset of China’s reform and opening up in
1978. The GDP of the PRD grew from below 12 billion yuan
in 1980 to over 1,134 billion yuan in 2003. During the period,
the average annual growth rate of GDP in the PRD was
21.87%, well above that of Guangdong Province (13.6%)
and the country as a whole (9.6%). The per capita GDP of
the PRD amounted to USD 4,800 in 2003, which is 2.3
times that of Guangdong Province and 4.36 times that of
the whole country. The PRD has also been the economic
hub of Guangdong Province. The PRD region accounted
for 25% of Guangdong’s land area but contributed over 84%
of the province’s GDP in 2003. Within the PRD region,
Guangzhou, Shenzhen, Foshan and Dongguan are the
most prosperous cities, and the per capita GDP of each of
them was over 40,000 yuan (USD 4,830) in 2003.
The PRD has also increasingly become an attractive
consumer marketplace. Over the past two decades, the
retail sales of consumer goods in the PRD increased
dramatically from 7.07 billion yuan in 1980 to 397.66 billion
yuan in 2003. In 2003, the retail sales of consumer goods
grew by 11.81% year-on-year (yoy), and accounted for over
70% of the provincial total.

3Issue 22 January 2005
China Distribution & TradingLi & Fung Research Centre
(1) Guangdong Province
Guangdong Province, where the PRD is located, is one of
the most economically developed provinces of China. In
2003, Guangdong’s GDP reached 1,345 billion yuan, up
by 13.6% yoy, which is the highest growth rate since 1996.
The value-added of the primary industry, the secondary
industry and the tertiary industry were 105.16 billion yuan
(up by 1.2% yoy), 704.81 billion yuan (up by 18.1% yoy)
and 535.03 billion yuan (up by 10.8% yoy), respectively.
a. Retail sales
Guangdong Province has been the largest consumer market
among all provinces in the country though its population
only ranks the fourth. The total retail sales of consumer
goods in Guangdong increased by 11.4% yoy to reach
501.36 billion yuan in 2003, accounting for 12.26% of the
national total. Of which, the retail sales of consumer goods
in urban areas grew by 11.6% yoy to reach 398.77 billion
yuan, and the retail sales of consumer goods in rural areas
grew by 12.35% yoy to reach 161.833 billion yuan. As shown
in Exhibit 2, the retail sales of consumer goods in
Guangdong mainly concentrated in the PRD (See Exhibit
2). Guangzhou, in particular, is the city with the biggest
consumer market in Guangzhou, with its retail sales of
consumer goods hitting 149.43 billion yuan in 2003.
Shenzhen ranked the second, with retail sales of consumer
goods amounting to 80.18 billion yuan (See Exhibit 3).
Exhibit 2: Retail sales of consumer goods in Guangdong Province in 2003
Zhanjiang
Maoming Yangjiang
Yunfu
Jiangmen
Zhaoqing
Qingyuan
Shaoguan
HeyuanMeizhou
Zhongshan
Guangzhou
Chaozhou
ShantouJieyang
ShanweiHuizhou
Zhuhai
Shenzhen
DongguanFoshan
Hong Kong
80 - 15040 - 7920 - 3910 - 19< 9
Retail sales of consumer goods (billion yuan)
Source: Guangdong Statistical Yearbook, 2004

4Issue 22 January 2005
China Distribution & TradingLi & Fung Research Centre
Exhibit 3: Living Standard of Local Residents in Major Cities of the PRD in 2003
(Year-on-year growth %)
Total Retail
Major City GDP Per Capita GDP Sales of Consumer Goods
(million yuan) (%) (yuan) (%) (million yuan) (%)
Guangzhou 349,687.87 (15.2%) 48,372 (14.2%) 149,427 (9.02%)
Shenzhen 289,540.70 (19.2%) 54,545 (9.3%) 80,177 (16.27%)
Zhuhai 47,327.42 (17.5%) 37,675 (16.3%) 15,918 (10.95%)
Foshan 138,159.51 (16.1%) 40,444 (14.7%) 47,319 (12.72%)
Jiangmen 73,008.25 (11.1%) 19,131 (10.9%) 27,784 (11.86%)
Dongguan 94,796.54 (19.5%) 60,158 (17.6%) 33,800 (50.26%)
Zhongshan 50,140.43 (18.6%) 28,645 (16.4%) 15,361 (14.35%)
Huizhou 59,097.72 (13.9%) 20,759 (12.7%) 18,167(12.84%)
Zhaoqing 46,639.14 (11.4%) 11,907 (10.9%) 17,120 (10.72%)
Source: Guangdong Statistical Yearbook, 2004
Looking at retail sales of consumer goods by sector, the retail sales of the Wholesale and Retail Trade Sector in Guangdong
reached 468.108 billion yuan in 2003, up by 28.65% over the previous year. The retail sales of Catering Services were 87.729
billion yuan in 2003, up by 5.74% yoy (See Exhibit 4).
Exhibit 4: Retail Sales of Consumer Goods in Guangdong, 2002-2003
2003 2002 2002-2003 Growth (%)
(billion yuan) (billion yuan)
Total retail sales of consumer goods 560.602 501.359 11.82%
By Location of Retailers:
City 398.77 357.31 11.6%
County and Under County Level 161.833 144.049 12.35%
By Sectors:
Wholesale and Retail Trade 468.108 363.851 28.65%
Catering Services 87.729 82.964 5.74%
Others 4.765 54.544 -91.26%
Source: Guangdong Statistical Yearbook, 2004
b. Income level
Incomes of both urban and rural residents in Guangdong Province increased steadily in 2003. The per capita annual disposable
income of urban residents in Guangdong in 2003 was 12,380.43 yuan, up by a real growth of 10.4% yoy. The per capita net
income of rural residents in Guangdong in 2003 was 4,054.58 yuan, up by a real growth of 3.4% yoy.

5Issue 22 January 2005
China Distribution & TradingLi & Fung Research Centre
c. Price level
The general price level in Guangdong Province in 2003
increased by small margin in 2003. The Consumer Price
Index (CPI) of Guangdong recorded an annual growth of
0.6% in 2003. Of which, “Residence” grew by 3.1%; “Food”
by 2.3%; and “Health Cares and Personal Articles” by 0.4%.
The CPI of “Clothing”, “Household Facilities, Articles and
Services”, “Transportation and Communication”, and
“Recreation, Education and Cultural Articles” decreased
(See Exhibit 5).
Exhibit 5: Consumer Price Indices ofGuangzhou Province in 2003
Year-on-year
Item growth rate (%)
Consumer Price Index 0.6
Urban Areas 0.7
Rural Areas 0.4
Food 2.3
Of which: Grain 1.9
Clothing -2.3
Household Facilities, Articles
and Services -2.0
Health Cares & Personal Articles 0.4
Transportation and Communication -2.1
Recreation, Education and Cultural
Articles -2.0
Residence 3.1
Services 0.1
Source: National Bureau of Statistics, PRC
d. The development of the retail sector
Guangdong has one of the most developed retail sectors
in China. In addition to traditional department stores, various
forms of modern retail operations such as chain stores,
supermarkets, hypermarkets and convenience stores
flourish in the market. As a result of the shift of consumers
preference towards those new modes of retail operations,
the number of traditional department stores dropped by an
averaged rate of nearly 10% from 10,073 in 2000 to 7,511
in 2003 (See Exhibit 6).
Major foreign retail enterprises in Guangdong include Wal-
Mart from the U.S., Carrefour from France, Jusco from
Japan, Park’N shop from Hong Kong, and Trust-Mart from
Taiwan. It was reported that the four European giants, OBI,
Ikea, Metro and Decathlon, have also planned to open retail
outlets in Shenzhen. A host of franchised chain stores such
as U2, G2000, Baleno, Bossini, Fortei etc., and convenience
stores such as Circle K and 7-Eleven from Hong Kong have
also entered Guangdong. Many Hong Kong brands such
as A-Fontane, Airland, Saint Honore and Lion & Globe are
also on the list of famous brands existing in Guangdong.
Exhibit 6: Number of Retail Outlets inGuangdong Province in 2000and 2003
average
annual
growth
2003 2000 rate (%)
Total number of
outlets 66,086 49,897 9.82
By operating system
Detached Stores 41,083 36,315 4.20
General Chain stores 1,266 1,102 4.73
Branch Chain Stores 6,827 1,512 65.28
Others 16,910 10,968 15.52
By operating form
Department stores 7,511 10,073 -9.32
Supermarkets 1,287 1,135 4.28
Monopoly Stores 21,964 12,902 19.40
Others 35,324 25,787 11.06
Source: Guangdong statistical yearbook, 2001, 2004.
2. The Yangtze River Delta
The Yangtze River Delta (YRD) spans across 1 municipality
and 2 provinces. It has 16 cities, including 1 centrally-
administered municipality: Shanghai; 3 sub-provincial-level
cities: Nanjing, Hangzhou, Ningbo; 12 prefecture-level cities:
Suzhou, Wuxi, Changzhou, Zhenjiang, Nantong, Yangzhou,
6Issue 22 January 2005
China Distribution & TradingLi & Fung Research Centre
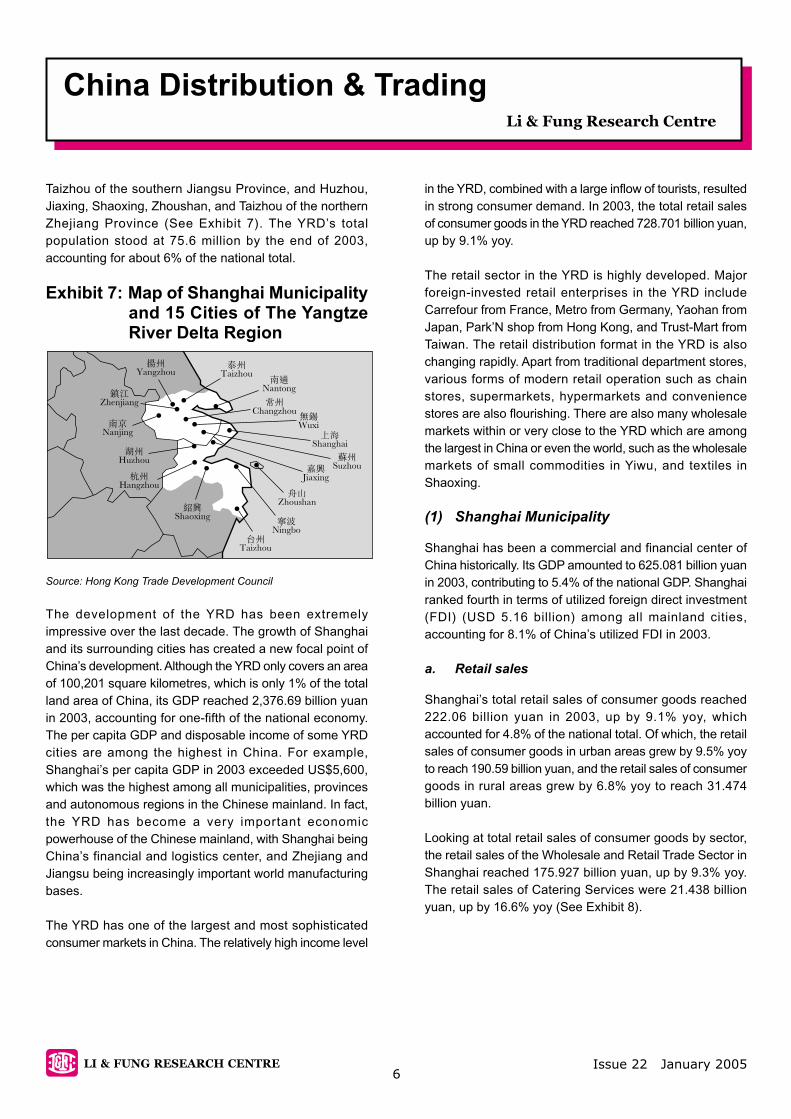
Taizhou of the southern Jiangsu Province, and Huzhou,
Jiaxing, Shaoxing, Zhoushan, and Taizhou of the northern
Zhejiang Province (See Exhibit 7). The YRD’s total
population stood at 75.6 million by the end of 2003,
accounting for about 6% of the national total.
Exhibit 7: Map of Shanghai Municipalityand 15 Cities of The YangtzeRiver Delta Region
Source: Hong Kong Trade Development Council
The development of the YRD has been extremely
impressive over the last decade. The growth of Shanghai
and its surrounding cities has created a new focal point of
China’s development. Although the YRD only covers an area
of 100,201 square kilometres, which is only 1% of the total
land area of China, its GDP reached 2,376.69 billion yuan
in 2003, accounting for one-fifth of the national economy.
The per capita GDP and disposable income of some YRD
cities are among the highest in China. For example,
Shanghai’s per capita GDP in 2003 exceeded US$5,600,
which was the highest among all municipalities, provinces
and autonomous regions in the Chinese mainland. In fact,
the YRD has become a very important economic
powerhouse of the Chinese mainland, with Shanghai being
China’s financial and logistics center, and Zhejiang and
Jiangsu being increasingly important world manufacturing
bases.
The YRD has one of the largest and most sophisticated
consumer markets in China. The relatively high income level
in the YRD, combined with a large inflow of tourists, resulted
in strong consumer demand. In 2003, the total retail sales
of consumer goods in the YRD reached 728.701 billion yuan,
up by 9.1% yoy.
The retail sector in the YRD is highly developed. Major
foreign-invested retail enterprises in the YRD include
Carrefour from France, Metro from Germany, Yaohan from
Japan, Park’N shop from Hong Kong, and Trust-Mart from
Taiwan. The retail distribution format in the YRD is also
changing rapidly. Apart from traditional department stores,
various forms of modern retail operation such as chain
stores, supermarkets, hypermarkets and convenience
stores are also flourishing. There are also many wholesale
markets within or very close to the YRD which are among
the largest in China or even the world, such as the wholesale
markets of small commodities in Yiwu, and textiles in
Shaoxing.
(1) Shanghai Municipality
Shanghai has been a commercial and financial center of
China historically. Its GDP amounted to 625.081 billion yuan
in 2003, contributing to 5.4% of the national GDP. Shanghai
ranked fourth in terms of utilized foreign direct investment
(FDI) (USD 5.16 billion) among all mainland cities,
accounting for 8.1% of China’s utilized FDI in 2003.
a. Retail sales
Shanghai’s total retail sales of consumer goods reached
222.06 billion yuan in 2003, up by 9.1% yoy, which
accounted for 4.8% of the national total. Of which, the retail
sales of consumer goods in urban areas grew by 9.5% yoy
to reach 190.59 billion yuan, and the retail sales of consumer
goods in rural areas grew by 6.8% yoy to reach 31.474
billion yuan.
Looking at total retail sales of consumer goods by sector,
the retail sales of the Wholesale and Retail Trade Sector in
Shanghai reached 175.927 billion yuan, up by 9.3% yoy.
The retail sales of Catering Services were 21.438 billion
yuan, up by 16.6% yoy (See Exhibit 8).

7Issue 22 January 2005
China Distribution & TradingLi & Fung Research Centre
Exhibit 8: Total Retail Sales of ConsumerGoods in Shanghai Provincein 2003
2003 2003-2003
(billion yuan) Growth (%)
Total retail sales of
consumer goods 222.064 9.1%
By Location of Retailers:
Urban 190.59 9.5%
Counties 31.474 6.8%
By Sectors:
Wholesale and Retail
Trade 175.927 9.3%
Catering Services 21.483 16.6%
Manufacturing 4.978 2.3%
Others 19.676 2.1%
Source: National Bureau of Statistics, PRC.
b. Income level
According to the National Bureau of Statistics, the per capita
disposable income of urban residents in Shanghai was
14,867 yuan in 2003, up by 12.2% yoy. The per capita net
income of rural residents in Shanghai was 6,658 yuan, up
by 7.2% yoy. With the rise in income and the upgrading of
consumption structure, the increase in demand for cars and
durable consumer goods among consumers in Shanghai
accelerated. In 2003, 78.4 thousand motor vehicles were
sold, up by 22.5%. Of which 71.1 thousand cars were sold,
up by 30%; 1.3 million mobile telephones, up by 110%; 41
thousand pick-up cameras , up by 35.4%; 5.77 million video
disc players , up by 32.3%; 8.07 million air conditioners,
up by 46.9%; and 2.89 million auto washing machine, up
by 28.1%.
c. Price level
The Consumer Price Index of Shanghai increased by 0.1%
yoy in 2003. Of which, the consumer prices of “Food”,
“Recreation, Education and Cultural Articles”, and
“Residence” increased. Consumer Price Index of “Health
Cares & Personal Articles” was the same as the previous
year. “Clothing”, “Household Facilities”, “Articles and
Services”, and “Transportation and Communication”
decreased (See Exhibit 9).
Exhibit 9: Consumer Price Indices ofShanghai in 2003
Year-on-year
Item growth rate (%)
Consumer Price Index 0.1
Food 1.3
Clothing -2.5
Household Facilities, Articles
and Services -1.6
Health Cares & Personal Articles 0.0
Transportation and Communication -3.7
Recreation, Education and
Cultural Articles 0.3
Residence 1.1
Source: National Bureau of Statistics, PRC.
d. Retail sector
Shanghai’s retail sector is one of the most developed in
China. Besides the traditional department stores, various
forms of modern operations flourish. The Shanghai
Chamber of Commerce has published the city’s first White
Paper, “White Paper — Shanghai’s Retail Development in
2003”. The White Paper identified 8 trends in Shanghai’s
retail business in the coming 3 to 5 years: (i) department
stores will be further reshuffled; (ii) the food and grocery
sector will continue its modernization process; (iii) industries
such as garment and accessories, and office equipments,
etc. will emerge as the major industries of the new retail
formats; (iv) the market will open further, drawing more retail
companies into the city; (v) a few large retailers will dominate
the market share; (vi) shopping malls will put greater
emphasis on innovation, management and optimization; (vii)
innovation, the application of managerial technology and
breakthroughs in supply chains will bring a new competitive
edge; (viii) and the growth of non-store retail, such as
automat, e-commerce and mail orders, will accelerate.
By the end of 2003, the number of chain stores which are
above designated size in Shanghai was 7,014. Of which
chain supermarkets reached 3,376, convenience stores
2,240. The retail sales of chain stores reached 80.04 billion
yuan in 2003, up by 27% yoy. Major foreign-invested retail

8Issue 22 January 2005
China Distribution & TradingLi & Fung Research Centre
enterprises in Shanghai include Carrefour from France,
Metro from Germany, Isetan from Japan, Park’n Shop from
Hong Kong, and Pacific department store from Taiwan.
Dozens of franchised chain stores such as U2, G2000,
Baleno, Bossini, Giordano etc. from Hong Kong have also
entered Shanghai.
In addition, Shanghai consumers are also widely recognized
as trend-setters for fashion and other lifestyle products of
China. For example, lots of domestic merchandisers visit
Nanjing Road, one of Shanghai’s major shopping districts,
to take a look at the latest fashion trends in China. Likewise,
distributors from across the country visit Shanghai to
preview the latest fashion styles and designs, which are
expected to become popular in their own cities.
e. Major commercial districts
There are eight major commercial districts in Shanghai.
i. Nanjing East Road
It is a mid- to high-end commercial district where a number
of large department stores are located. Shanghai No. 1,
Hualian and New World together account for almost 50%
of the total sales on this road.
ii. Nanjing West Road
It is where the most prestigious shopping malls are located,
including CITIC Square, Plaza 66 and Westgate Mall.
According to statistics, about 80% of visitors at Plaza 66
would make purchases, with an average spending in the
range of 8,000 – 20,000 yuan. In 2001, the combined retail
sales of CITIC Square, Plaza 66 and Westgate Mall reached
1.35 billion yuan, up by 20% year-on-year.
iii. Huaihai Central Road
It is a mid- to high-end commercial district where a number
of department stores are located, including Shanghai
Department Store No. 2, Novel and New Hualian (clothing),
Parkson and Pacific (trendy merchandise), Orient Meisha
and Lady Fashion (Ladies’ clothing and accessories), and
Hongxing Optical (branded spectacles).
iv. Sichuan North Road
It is a low-end, mass-market commercial district. Large
department stores include Spring, Yuandong Electrical
Appliances Commercial Building, Shanghai No. 7, Hongji
Jiakou Plaza and Dongtai Plaza.
v. Xujiahui Commercial City
It is a mid- to high-end commercial district targeted at
young consumers. It covers Huashan Road, Hengshan
Road, Zhaojiabin Road and Tianyaoqiao Road. There are
nine large department stores and shopping malls,
including Shanghai Orient, Pacific, Shanghai Department
Store No. 6, Huijin, Huilian, Grand Gateway, Metro City
and Buynow.
vi. Yuyuan Tourist Mart
It is a low- to middle-end commercial district. It has been
traditionally a distribution hub for small commodities.
Nowadays gold jewellery, tourist souvenirs and antiques
dominate the district. “Gold jewellery” is the theme of all
major jewellers there, including Yayi, Yongsheng, Laomiao,
Pearl and jade Mart, Laofendxiang and Chenghuang.
vii. New Shanghai Square and Buyecheng
Centred around Zhangyang Road and a number of adjoining
streets, New Shanghai Square is a large shopping district
in Pudong. Shanghai No. 1 Yaohan Department Store
features the premier shopping centre in the district.
Buyecheng is a comprehensive commercial district featuring
shopping, commerce, dining and entertainment facilities.
viii. Xintiandi
It is a newly developed mid- to high-end commercial district
offering personal products and home decoration items with
an emphasis on lifestyle. Dining is still the main theme of
the district at the moment, but it is expected that Xintiandi
will become a posh shopping district selling upmarket, trendy
and personalised products in the near future. Foreigners
make up 80% of the consumers at Xintiandi.

9Issue 22 January 2005
China Distribution & TradingLi & Fung Research Centre
Exhibit 10: Major Economic Indicators of the Yangtze River Delta in 2003
Urban Per Capita Total Retail sales
Per Capita GDP Primary industry: Disposable Income of Consumer Goods
Municipality/ GDP (bn yuan) (yuan) (growth Secondary industry: (yuan) (growth (bn yuan) (growth
Tier Cities (growth rate % yoy) rate % yoy) Tertiary industry rate % yoy) rate % yoy)
1st-tier city Shanghai 625.1 (11.8%) 46,614 (14.5%) 1.5:50.1:48.4 14,867 (12.2%) 222.064 (9.1%)
2nd-tier cities Hangzhou 209.2 (15.0%) 32,700 (16.2%) 6.1:51.6:42.3 12,898 (9.5%) 58.752 (12.4%)
Ningbo 176.99 (15.3%) 28,220 (12.07%) 6.3:56.9:36.8 14,277 (10.1%) 52.15 (12.7%)
Suzhou 280.2 (18%) 47,700 (17%) 2.8%, 63.1%, 34.1% 12,350 (16.3%) 52.605 (16.5%)
Nanjing 157.62 (15.1%) 27,283 (13.1%) 4.1:51.1:44.8 10,195.56 (11.3%) 60.24 (14.4%)
Wuxi 190.1 (15.4%) 43,160 (14.5%) 3%, 57%, 40% 11,647 (16.6%) 48.71 (15.4%)
3rd-tier cities Shaoxing 108.8 (15%) 25,094 (14.9%) 7.8%, 59.2%, 33% 13,535 (11.6%) 29.2 (12.6%)
Jiaxing 85.563 (16.9%) 25,720 (16.7%) 7.72:59.31:32.97 12,954 (12.6%) 27.939 (12.1%)
Bantong 100.665 (13.4%) 12,923 (12.66%) 14:51.2:34.8 9,598 (11.1%) 33.128 (12.7%)
Changzhou 90.02 (18.4) 26,145 (19.5%) 5.2:57.2:37.1 11,307 (13.8%) 28.07 (12.8%)
Taizhou 99.278 (14.9%) 18,000 (14.5%) 9.3:58.2:32.5 13,609 (15.2%) 26.233 (13%)
4th-tier cities Zhoushan 17.18 (15.5%) 17,695.6 (36%) 19.1:40.3:40.6 12,213 (11.2%) 7.5 (12.1%)
Huzhou 48.897 (14.8%) 19,032 (14.8%) 11.3%, 33.9%, 54.8% 12607 (10.7%) 18.234 (11.7%)
Yangzhou 64.722 (13.4%) 14,300 (15.6%) 21:9:70 8,705 (11.1%) 19.796 (12.5%)
Zhenjiang 64.356 (14.1%) 24,089 (14%) 5.1:57.2:37.9 9,451 (15.2%) 16.82 (12.6%)
Taizhou 58.0 (13.4%) 11,492 (13.2%) 33.3:33.3:33.3 8,500 (9.1%) 17.26 (11.7%)
Source: Guide of 16 Major Cities in the YRD Region, Hong Kong Trade Development Council.
Key: Shanghai Municipality Jiangsu Province Zhejiang Province
a. Retail sales
Retail sales of the consumer market also witnessed a
relatively fast growth. In 2003, the retail sales of consumer
goods in Jiangsu reached 356.65 billion yuan, up by 13.7%,
1.6 percentage points higher than the previous year. The
retail sales of consumer goods in urban areas was 251.62
billion yuan, up by 14.6% yoy. The retail sales of consumer
goods in rural areas was 105.02 billion yuan, up by 11.5%
yoy (See Exhibit 11).
(2) Jiangsu Province
Jiangsu economy grew fast in 2003. The GDP reached
1,245.18 billion yuan in 2003, up by 13.5% yoy, 1.9
percentage point higher than the previous year. The value-
added of the primary industry was 110.66 billion yuan, which
was the same as last year. The value-added of the
secondary industry and the tertiary industry were 678.23
billion yuan (up by 17.2% yoy) and 456.27 billion yuan (up
by 11.7% yoy) respectively. The ratios of primary industry,
secondary industry and tertiary industry in 2003 was 8.9:
54.5: 36.6.

10Issue 22 January 2005
China Distribution & TradingLi & Fung Research Centre
Looking at total retail sales of consumer goods by sector,
the retail sales of the Wholesale and Retail Trade Sector in
Jiangsu reached 307.26 billion yuan in 2003, up by 13.0%
yoy. The retail sales of Catering Services were 43.45 billion
yuan, up by 20.2% yoy (See Exhibit 11).
Exhibit 11: To t a l R e t a i l S a l e s o fConsumer goods in JiangsuProvince in 2003
2003 2003-2003
(billion yuan) Growth (%)
Total retail sales
of consumer goods 356.65 13.7%
By Location of Retailers:
Urban 251.62 14.6%
Rural 105.02 11.5%
By Sectors:
Wholesale and Retail
Trade 307.26 13.0%
Catering Services 43.45 20.2%
Others 5.94 1.6%
Source: National Bureau of Statistics, PRC.
b. Income level
The per capita disposable income of urban residents in
Jiangsu was 9,262 yuan in 2003, up by 13.2% yoy. The per
capita living expenditure of urban residents was 6,708 yuan,
up by 11.0% yoy. The per capita net income of rural residents
in Jiangsu in 2003 was 4,239 yuan, up by 6.1% yoy. The
per capita living expenditure of rural residents was 2,704
yuan, up by 3.0% yoy.
c. Price level
The Consumer Price Index in Jiangsu in 2003 increased
by 1.0% yoy. Of which, the consumer prices of “Food”,
“Health Cares & Personal Articles”, “Recreation, Education
and Cultural Articles”, and “Residence” increased.
Consumer Price Indices of “Clothing”, “Household Facilities,
Articles and Services”, and “Transportation and
Communication” decreased (See Exhibit 12).
Exhibit 12: Consumer Price Indices ofJiangsu Province in 2003,Year-on-year growth rate (%)
Item Province
Urban Rural
Consumer Price Index 1.0 0.9 1.2
Food 3.3 3.7 2.6
Of which: Grain 2.1 2.7 1.2
Clothing -1.0 -1.1 -0.5
Household Facilities,
Articles and Services -3.4 -4.4 -1.7
Health Cares &
Personal Articles 0.3 -0.1 0.7
Transportation and
Communication -2.6 -4.6 -0.1
Recreation, Education
and Cultural Articles 2.5 1.6 3.6
Residence 1.0 1.4 0.6
Source: National Bureau of Statistics, PRC.
(3) Zhejiang Province
Zhejiang Province’s economy grew fast in 2003. The GDP
reached 939.5 billion yuan in 2003, up by 14% yoy. The
value-added of the primary industry, the secondary industry
and the tertiary industry were 72.2 billion yuan (up by 2.7%
yoy), 483.0 billion yuan (up by 16.6% yoy), and 364.8 billion
yuan (up by 13.2% yoy), respectively. The ratios of primary
industry, secondary industry and tertiary industry was
changed from 8.9 : 51.1 : 40.0 in 2002 to 7.8 : 52.5 : 39.7 in
2003.
a. Retail sales
Zhejiang Province is the fourth largest market of consumer
goods after Guangdong, Shandong, and Jiangsu. The total
retail sales of consumer goods in Zhejiang reached 315.71
billion yuan in 2003, up by a real growth of 11.5% yoy over
the previous year. Of which, the retail sales of consumer
goods in urban areas was 200.0 billion yuan, up by 11.5%
yoy. The retail sales of consumer goods in rural areas was
115.7 billion yuan, up by 9.8% yoy (See Exhibit 13). Looking

11Issue 22 January 2005
China Distribution & TradingLi & Fung Research Centre
at the retail sales of consumer goods by sector, the retail
sales of the Wholesale and Retail Trade Sector in Zhejiang
reached 269.6 billion yuan in 2003, up by 10.1% yoy. The
retail sales of Catering Services were 35.89 billion yuan in
2003, up by 16.0% yoy.
Exhibit 13: To t a l R e t a i l S a l e s o fC o n s u m e r g o o d s i nZhejiang Province in 2003
2003 2003-2003
(billion yuan) Growth (%)
Total retail sales of
consumer goods 315.7 11.5%
By Location of Retailers:
Urban 200.0 11.5%
Rural 115.7 9.8%
By Sectors:
Wholesale and Retail
Trade 269.6 10.1%
Catering Services 35.89 16.0%
Others 10.18 14.4%
Source: National Bureau of Statistics, PRC.
b. Income level
The living standard of the residents in Zhejiang Province
has been improving considerably. The per capita disposable
income of urban residents in Zhejiang Province was 13,180
yuan in 2003, up by a real growth of 11.9% yoy. The per
capita net income of rural residents was 5,431 yuan, up by
a real growth of 7.8% yoy. The Engel Coefficient, a measure
of the proportion of food expenditure to the total living
expenditure, of urban households and rural households was
36.6% and 38.2%, dropped by 1.3 percentage point and
2.6 percentage points, respectively.
c. Price level
The Consumer Price Index in Zhejiang in 2003 increased
by 1.9% yoy. Of which, the growth figures were 0.5% for
Urban CPI and 2.9% for Rural CPI (See Exhibit 14).
Exhibit 14: Consumer Price Indices ofZhejiang Province in 2003,Year-on-year growth rate (%)
Item Province Urban Rural
Consumer Price Index 1.9 0.5 2.9
Food 2.8 2.2 3.4
Of which: Grain 3.2 3.3 3.1
Clothing -3.3 -3.4 -3.3
Household Facilities,
Articles and Services -3.1 -4.1 -1.8
Health Cares & Personal
Articles 0.1 -1.4 1.1
Transportation and
Communication -4.9 -3.4 -4.5
Recreation, Education
and Cultural Articles 11.2 3.7 17.4
Residence 12 2.0 0.4
Source: National Bureau of Statistics, PRC.
d. Retail sector
Hangzhou is the city with the largest economy, in terms of
GDP, in Zhejiang (See Exhibit 10). It has a robust retail
market. In 2003, Hangzhou’s retail sales of consumer goods
increased by 12.4% yoy to reach 58.75 billion yuan, ranking
the first among all cities in Zhejiang. Among various types
of retail outlets, chain stores have developed most quickly
in recent years. In 2002, sales at chain stores amounted to
6.1 billion yuan, an increase of 57% over the previous year,
and accounted for some 11% of Hangzhou’s total retail
sales. In the first half of 2003, sales of chain stores grew
further by 57.7% yoy. Major chain stores in Hangzhou
include Lianhua , Hualian , Hymart ,
Metro , and Lotus etc. Hangzhou is
also a key distribution center of consumer goods in the
region.
Ningbo has the second highest GDP among all cities in
Zhejiang (See Exhibit 10), and is also the second largest
retail market in the province. Ningbo’s retail sales of
consumer goods increased by 12.7% yoy to reach 52.15
billion yuan in 2003. The retail format in Ningbo is also
changing. Apart from traditional department stores, various
forms of modern operation such as chain stores,
supermarkets and specialty stores are developing fast.

12Issue 22 January 2005
China Distribution & TradingLi & Fung Research Centre
3. The “Beijing-Tianjin-Hebei” Region
The “Beijing-Tianjin-Hebei” Region spans across 2
municipalities and 1 province. It includes 2 centrally-
administered municipalities: Beijing and Tianjin; and
prefecture-level cities such as Tangshan, Baoding, Langfang
Qinhuangdao, Zhangjiakou, Shijiazhuang, Chengde,
Cangzhou, Handan, etc. of Heibei province. It has an area
of 32,600 square kilometers, about 0.34% of the total area
of the whole country. Its size of population is 27.62 million,
2.15% of the national total. The “Beijing-Tianjin-Hebei”, with
a consumer group of around 100 million people, is one of
the largest consumer markets in China. Its GDP reached
1,309.42 billion yuan and retail sales of consumer goods
amounted to 516.87 billion yuan in 2003.
(1) Beijing Municipality
The GDP of Beijing reached 361.19 billion yuan in 2003,
up by 10.5%. The GDP has been at double-digit growth in
the past five years. The per capita GDP in Beijing was
31,613 yuan (USD 3,818) in 2003, up by 9.2% yoy.
a. Retail sales
The retail sales of consumer goods in Beijing increased by
a real growth of 16.6% yoy to 191.67 billion yuan in 2003,
accounting for 4.18% of the national total and ranked the
second among the four central ly administered
municipalities. The upgrading of consumption structure has
been the major factor driving up the consumption growth.
Real estate, automobiles and telecommunications services
remained the hot spots of consumption.
b. Income level
The per capita disposable income of urban residents in
Beijing in 2003 was 13,882.6 yuan, up by a real growth of
11.2% yoy. The Engel Coefficient of urban residents was
31.7%, down by 2.1 percentage points from the previous
year.
The per capita net income of rural households in Beijing in
2003 was 6,496.3 yuan, up by a real growth of 11.5% yoy.
The Engel Coefficient of rural residents was 31.7%, down
by 1.3 percentage point from the previous year.
c. Price level
The Consumer Price Index in Beijing in 2003 was mainly
driven up by the price of “Food” which was up by 3.2% yoy.
The Consumer Price Indices of “Health Cares & Personal
Articles” and “Residence” also increased, whereas the
Consumer Price Indices of “Clothing”, “Household Facilities,
A r t i c l es and Se rv i ces ” , “Transpo r ta t i on and
Communication”, and “Recreation, Education and Cultural
Articles” decreased (See Exhibit 15).
Exhibit 15: Consumer Price Indices ofBeijing in 2003
Year-on-year
Item growth rate (%)
Consumer Price Index 0.2
Food 3.2
Clothing -2.9
Household Facilities, Articles and
Services -2.3
Health Cares & Personal Articles 0.1
Transportation and Communication -2.2
Recreation, Education and Cultural
Articles -1.7
Residence 1.6
Source: National Bureau of Statistics, PRC.
d. Retail sector
Thanks to the huge size and potential of the consumer
market in Beijing, new department stores and shopping
centers developed rapidly in the past few years. There
are three well-known traditional shopping districts in
Beijing, namely Wangfujing ( ), Xidan ( ) and
Qianmen ( ). Many department stores such as Xidan
Shopp ing A rcade ( ) , Wang fu j i ng
Department Store ( ), Longfu Building (
), New Dong An Market ( ) and the
Friendship Store ( ) etc. have strong customer
f lows. In addi t ion, other reta i l out lets such as
supermarkets, convenient stores have also been growing
rapidly.

13Issue 22 January 2005
China Distribution & TradingLi & Fung Research Centre
Beijing was one of the first 11 pilot cities chosen by the
State Council to form Sino-foreign joint retail enterprises
with import-export rights. The first batch of Sino-foreign
joint retail enterprises formed in Beijing included the Beijing
Lufthansa Shopping Center ( ) and the
Scitech Plaza ( ). By end-2002, there were
already 15 Sino-foreign joint retail enterprises in Beijing.
In addition, a group of Sino-foreign chain stores such as
Carrefour, Makro and Ito Yokado have emerged in the
market in recent years. The growth of Sino-foreign joint
retail enterprises has also stimulated the development of
some local chain stores and supermarkets such as
Hualian, Wumei and Guomei.
(2) Tianjin Municipality
a. Retail sales
The retail sales of consumer goods in Tianjin reached
107.41 billion yuan in 2003, up by 14.1% yoy. Of which, the
retail sales of Wholesale and Retail Trade Sector reached
72.71 billion yuan, up by 12.5% yoy; and the retail sales of
Catering Service reached 10.991 billion yuan, up by 7.2%
yoy.
b. Income level
In 2003, the per capita disposable income of urban residents
in Tianjin was 10,312.91 yuan, up by 10.45% yoy. The Engel
Coefficient of urban residents was 38%, down by 2
percentage points from the previous year. The per capita
net income of rural households in Tianjin was 4,566.01 yuan,
up by a real growth of 6.71% yoy. The Engel Coefficient of
rural residents was 38%, which was the same as the
previous year.
c. Price level
Urban CPI of Tianjin increased by 1.0% yoy in 2003. The
growth was mainly driven by “Food” (which went up by 3.3%
yoy). The Urban CPI of “Clothing”, “Household Facilities,
Art icles and Services” and “Transportat ion and
Communication” went down by 11.9% yoy, 3.5% yoy, and
3.0% yoy respectively.
d. Retail sector
There has been fierce competition between foreign and local
retail enterprises in the retail sector in Tianjin. Famous
market players include Walmart ( ), Wankelong (
), Carrefour ( ), Daiei ( ), Family World
( ) and Quanye ( ).
(3) Hebei Province
a. Retail sales
The total retail sales of consumer goods in Hebei rose by
10.64% yoy to reach 217.79 billion yuan in 2003, ranking
the ninth among all provinces, municipalities and
autonomous regions in China (See Exhibit 16).
Exhibit 16: To t a l R e t a i l S a l e s o fConsumer goods in HebeiProvince in 2003
2003
(billion yuan)
Total retail sales of consumer goods 217.79
By Location of Retailers:
Urban 106.44
County 42.11
Under County Level 69.24
By Sectors:
Wholesale and Retail Trade 155.85
Catering Services 23.35
Manufacturing 16.99
Others 21.59
Source: National Bureau of Statistics, PRC.
b. Price level
The Consumer Price Index in Hebei in 2003 increased by
2.2% yoy in 2003 which was mainly driven by the price of
“Food” (up by 4.5% yoy). The Consumer Price Indices of
“Food”, “Health Cares & Personal Articles” and “Recreation,
Education and Cultural Articles”, “Residence” and “Services”
also increased, whereas the Consumer Price Indices of
“Clothing”, “Household Facilities, Articles and Services”, and
“Transportation and Communication”, decreased (See
Exhibit 17).

14Issue 22 January 2005
China Distribution & TradingLi & Fung Research Centre
Exhibit 17: Consumer Price Indices ofHebei Province in 2003 (yoygrowth rate %)
Item Province Urban Rural
Consumer Price Index 2.2 2.3 2.0
Food 4.5 4.8 4.1
Clothing -2.2 -2.9 -1.5
Household Facilities,
Articles and Services -3.0 -3.5 -2.1
Health Cares & Personal
Articles 6.0 2.9 8.7
Transportation and
Communication -1.9 -2.3 -1.5
Recreation, Education
and Cultural Articles 0.7 2.4 -0.8
Residence 4.5 7.2 2.6
Services 4.8 5.2 4.5
Source: National Bureau of Statistics, PRC.
c. Retail sector
Retail centres of the province are mainly located in
Shijiazhuang, Tangshan, Handan and Baoding. The
combined retail sales of these four cities amounted to 131.48
billion yuan in 2003, which accounted for 60.37% of the
provincial total (See Exhibit 18). Major department stores
and shopping centers in Hebei include Shijiazhuang Beiguo
Commercial City ( ), Shijiazhuang Renmin
Department Store ( ), Shijiazhuang
Dongfeng City Plaza ( ), Shijiazhuang
Ximei Department Store ( ), Tangshan
Department Store ( ), Qinhuangdao Hualian
Commercial Ci ty ( ) and Baoding
Department Store ( ), etc..
Exhibit 18 : Major Economic Indicators of Hebei, 2003 (yoy growth rate %)
Total Retail Sales of Per Capita Urban Per Capita Rural
GDP Consumer Goods Disposable Income Net Income
Region (billion yuan) (billion yuan) (yuan) (yuan)
Tangshan 1,295 (13.2%) 30.738 (10.8%) 8,068 (8.1%) 3,790 (4.5%)
Baoding 92.86 (12.6%) 31.62 (11.7%) 7,139 (7.1%) 2,921 (4.1%)
Langfang 52.85 (12.1%) 12.06 (11.7%) 8,404 (8.2%) 4,000 (4.0%)
Qinhuangdao 38.703(12.1%) 11.773 (11.2%) 7,870 (9.4%) 2,891 (5.4%)
Zhangjiakou 8.25 (10.3%) 2.835 (8.9%) 6,430 (6.8%) 1,863 (1.4%)
Shijiazhuang 137.79 (12.5%) 45.66 (11.0%) 7,741 (6.9%) 3,394 (4.6%)
Chengde 23.552 (12.1%) 9.17 (6.0%) 6,306.96 (9.1%) 1,696 (8.6%)
Cangzhou 62.886 (12.1%) 16.537 (9.8%) 6,728 (9.3%) 2,691 (5.6%)
Handan 76.26 (12.1%) 23.46 (11.3%) 6,842 910.1%) 2,900 (5.1%)
Source: National Bureau of Statistics, PRC.
15Issue 22 January 2005
China Distribution & TradingLi & Fung Research Centre
II. General Background on China’s Consumer Market
1. The Two-tier Market: Urban and Rural
(1) Growth of the Consumer Market was Mainly Driven by Urban Consumption
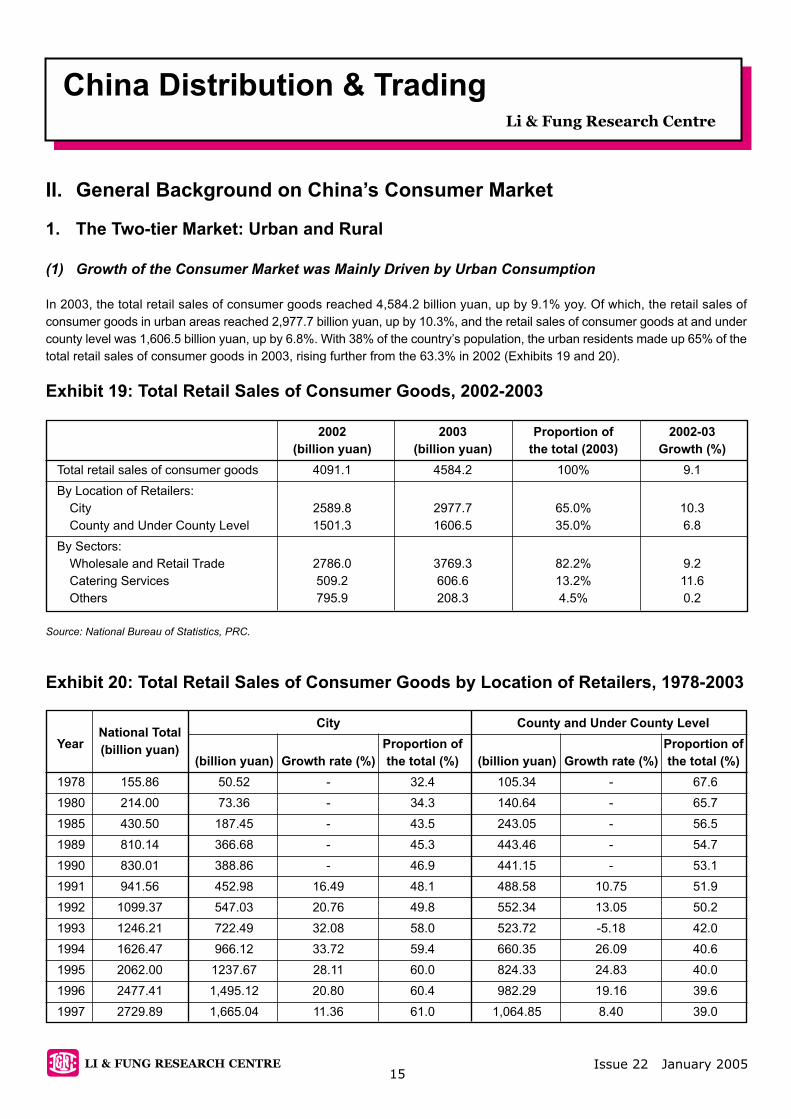
In 2003, the total retail sales of consumer goods reached 4,584.2 billion yuan, up by 9.1% yoy. Of which, the retail sales of
consumer goods in urban areas reached 2,977.7 billion yuan, up by 10.3%, and the retail sales of consumer goods at and under
county level was 1,606.5 billion yuan, up by 6.8%. With 38% of the country’s population, the urban residents made up 65% of the
total retail sales of consumer goods in 2003, rising further from the 63.3% in 2002 (Exhibits 19 and 20).
Exhibit 19: Total Retail Sales of Consumer Goods, 2002-2003
2002 2003 Proportion of 2002-03
(billion yuan) (billion yuan) the total (2003) Growth (%)
Total retail sales of consumer goods 4091.1 4584.2 100% 9.1
By Location of Retailers:
City 2589.8 2977.7 65.0% 10.3
County and Under County Level 1501.3 1606.5 35.0% 6.8
By Sectors:
Wholesale and Retail Trade 2786.0 3769.3 82.2% 9.2
Catering Services 509.2 606.6 13.2% 11.6
Others 795.9 208.3 4.5% 0.2
Source: National Bureau of Statistics, PRC.
Exhibit 20: Total Retail Sales of Consumer Goods by Location of Retailers, 1978-2003
National TotalCity County and Under County Level
Year Proportion of Proportion of(billion yuan)
(billion yuan) Growth rate (%) the total (%) (billion yuan) Growth rate (%) the total (%)
1978 155.86 50.52 - 32.4 105.34 - 67.6
1980 214.00 73.36 - 34.3 140.64 - 65.7
1985 430.50 187.45 - 43.5 243.05 - 56.5
1989 810.14 366.68 - 45.3 443.46 - 54.7
1990 830.01 388.86 - 46.9 441.15 - 53.1
1991 941.56 452.98 16.49 48.1 488.58 10.75 51.9
1992 1099.37 547.03 20.76 49.8 552.34 13.05 50.2
1993 1246.21 722.49 32.08 58.0 523.72 -5.18 42.0
1994 1626.47 966.12 33.72 59.4 660.35 26.09 40.6
1995 2062.00 1237.67 28.11 60.0 824.33 24.83 40.0
1996 2477.41 1,495.12 20.80 60.4 982.29 19.16 39.6
1997 2729.89 1,665.04 11.36 61.0 1,064.85 8.40 39.0

16Issue 22 January 2005
China Distribution & TradingLi & Fung Research Centre
National TotalCity County and Under County Level
Year Proportion of Proportion of(billion yuan)
(billion yuan) Growth rate (%) the total (%) (billion yuan) Growth rate (%) the total (%)
1998 2,915.25 1,782.52 7.06 61.1 1,132.73 6.37 38.9
1999 3,113.47 1,909.16 7.10 61.3 1,204.31 6.32 38.7
2000 3,415.26 2,111.03 10.57 61.8 1,304.23 8.30 38.2
2001 3,759.52 2,354.34 11.53 62.6 1,405.18 7.74 37.4
2002 4,091.05 2,589.76 10.00 63.3 1,501.29 6.84 36.7
2003 4,584.20 2,977.70 14.98 65.0 1,606.50 7.01 35.0
Source: National Bureau of Statistics, PRC.
Looking at the total retail sales of consumer goods by
location of retailers, since the growth rate of the retail sales
of consumer goods was higher in urban areas, the
proportion of urban retail sales of consumer goods to the
national total had been increasing. This results in the growth
of the consumer market mainly driven by urban consumption
(See Exhibit 20). This trend is expected to continue between
urban and rural areas.
(2) Income Disparity between Urban and Rural
Areas
Since the 1978 reform, both urban and different rural
incomes have witnessed impressive growth. Due to different
degrees of economic development between urban and rural
areas, however, income growth in the rural areas has been
lagging behind that in the urban areas (See Exhibit 21).
The result is a widening income gap between urban
households and rural households, as shown by the rising
“urban-to-rural” income ratio from 2.50 in 1980 to 3.23 in
2003 (See Exhibit 22). For example, in 2003, the per capita
annual disposable income of urban residents in Guangdong
was 12,380.43 yuan which was about three times the per
capita net income of rural households in Guangdong
(4,054.58) (See Exhibit 23).
Exhibit 21: Income Growth Rate ofUrban and Rural Residents,1990 - 2003
14 1311
3
19 18
36
29
23 22
13
95
8 7 912
610
0
5
10
15
20
25
30
35
40
grow
thra
te(%
)
year
1990
1991
1992
1993
1994
1995
1996
1997
1998
1999
2000
2001
2002
2003
growth rate of urban disposable income growth rate of rural net income
10
32
73 2 2
5 5
27
Source: National Bureau of Statistics, PRC.
Exhibit 22: Ratio of Per Capita Annual Disposable Income between Urban and RuralHouseholds, 1978 - 2003
2.57 2.5
1.84 1.86
2.282.2
2.42.58
2.8 2.862.71
2.51 2.47 2.512.65
2.792.9
3.113.23
3.5
3
2.5
2
1.5
1
0.5
01978 1980 1984 1985 1989 1990 1991 1992 1993 1994 1995 1996 1997 1998 1999 2000 2001 2002 2003
urba
n-to
-rur
alra
tio
Source: National Bureau of Statistics, PRC.

17Issue 22 January 2005
China Distribution & TradingLi & Fung Research Centre
Exhibit 23: Annual Income and Engel Coefficient in Urban and Rural Areas by Region,2003
Urban Per Capita Rural Per
Annual Disposable Engel Capita Net Engel
Rank Region Income (yuan) Coefficient Rank Region Income (yuan) Coefficient
1 Shanghai 14,867.49 0.37 1 Shanghai 6,653.92 0.35
2 Beijing 13,882.62 0.32 2 Beijing 5,601.55 0.32
3 Zhejiang 13,179.53 0.37 3 Zhejiang 5,389.04 0.38
4 Guangdong 12,380.43 0.37 4 Tianjin 4,566.01 0.38
5 Tianjin 10,312.91 0.38 5 Jiangsu 4,239.26 0.41
6 Fujian 9,999.54 0.29 6 Guangdong 4,054.58 0.48
7 Jiangsu 9,262.46 0.38 7 Fujian 3,733.89 0.45
8 Tibet 8,765.45 4.42 8 Shangdong 3,150.49 0.42
9 Shandong 8,399.91 0.34 9 Liaoning 2,934.44 0.43
10 Chongqing 8,093.67 0.38 10 Hebei 2,853.38 0.40
11 Guangxi 7,785.04 0.40 11 Hainan 2,588.06 0.58
12 Hunan 7,674.20 0.36 12 Hubei 2,566.76 0.52
13 Yunnan 7,643.57 0.42 13 Hunan 2,532.87 0.52
14 Hubei 7,321.98 0.38 14 Jilin 2,530.41 0.44
15 Hainan 7,259.25 0.45 15 Heilongjiang 2,508.94 0.41
16 Liaoning 7,240.58 0.39 16 Jiangxi 2,457.53 0.52
17 Hebei 7,239.06 0.35 17 Shanxi 2,299.17 0.43
18 Xinjiang 7,173.54 0.36 18 Inner Mongolia 2,267.65 0.41
19 Sichuan 7,041.87 0.39 19 Henan 2,235.68 0.48
20 Inner Mongolia 7,012.90 0.31 20 Sichuan 2,229.86 0.54
21 Jilin 7,005.17 0.36 21 Chongqing 2,214.55 0.53
22 Shanxi 7,005.03 0.34 22 Anhui 2,127.48 0.46
23 Henan 6,926.12 0.34 23 Xinjiang 2,106.19 0.46
24 Jiangxi 6,901.42 0.40 24 Guangxi 2,094.51 0.51
25 Shaanxi 6,806.35 0.35 25 Ningxia 2,043.30 0.42
26 Anhui 6,778.03 0.44 26 Qinghai 1,794.13 0.50
27 Qinghai 6,745.32 0.37 27 Yunnan 1,697.12 0.53
28 Heilongjiang 6,678.90 0.36 28 Tibet 1,690.76 0.65
29 Gansu 6,657.24 0.36 29 Shaanxi 1,675.66 0.39
30 Guizhou 6,569.23 0.40 30 Gansu 1,673.05 0.44
31 Ningxia 6,530.48 0.36 31 Guizhou 1,564.66 0.57
Source: National Bureau of Statistics, PRC.

18Issue 22 January 2005
China Distribution & TradingLi & Fung Research Centre
2. Regional Disparity in Wealth andConsumption
The widening income gap among different regions in China
is another major factor that explains the unbalanced
consumption levels in the country. Looking at the annual
income of urban and rural households by region on Exhibit
22, the 7 richest provincial-level administrative regions are
all located in the eastern, coastal areas. The lower ranking
regions tend to be those central and western regions. For
example, in 2003, the urban per capita disposable income
in Shanghai was 14,867.5 yuan, 2.28-times that in Ningxia
(6,530.5 yuan) (See Exhibit 23).
In fact, the eastern region, central region and western region
accounted for 60.57%, 26.33% and 16.9% respectively of
the total retail sales of consumer goods in 2003. The retail
sales of consumer goods were largely concentrated in the
six most prosperous cities/provinces, namely, Shanghai,
Beijing, Jiangsu, Guangdong, Shangdong and Zhejiang,
each with retail sales of consumer goods over 200 billion
yuan, altogether contributing more than 5 percentage points
to the growth rate of total retail sales of consumer goods in
2003. For example, Guangdong alone accounted for 12.2%
of the total retail sales of consumer goods, similar in size to
that of the whole western China (See Exhibit 24).
The combined retail sales of consumer goods of the first
10 rankings in 2003 accounted for 65.2% of the national
total, 0.3 percentage point higher than that in 2002. The
combined retail sales of consumer goods of the last 10
rankings in 2003 accounted for 8.87% of the national total,
0.43 percentage point lower than that in 2002. The growth
rate of the retail sales of consumer goods of the first 10
rankings and that of the last 10 rankings were 11.5% and
6.68% respectively. This implies that there is still an
enormous gap in terms of the size of the consumer market
in different regions of China. (For the rankings of the retail
sales of consumer goods and the growth rates by region,
see Exhibit 25)
Exhibit 24: Retail Sales of Consumer Goods by Region, 2003
Total Retail Per Capita
Sales of Retail Sales
Consumer Goods of Consumer Under Provincial
Region (billion yuan) Goods (yuan) City County County Level Growth (%)
National 4,584.2 3,547.40 2,977.73 524.78 1,081.69 9.1
Eastern Region
Beijing 191.67 1316.41 153.58 8.88 29.22 14.5
Tianjin 92.23 912.27 85.92 3.53 2.78 10.9
Hebei 217.79 321.75 106.44 42.11 69.24 10.6
Liaoning 233.08 553.66 196.37 11.2 25.52 12.3
Shanghai 222.06 1,297.84 190.59 1.76 29.71 9.1
Jiangsu 356.65 481.57 251.63 21.78 83.23 13.7
Zhejiang 315.71 674.59 199.99 32.95 82.77 10.9
Fujian 174.04 498.97 105.75 21.83 46.46 13.1
Shangdong 393.65 431.40 252.56 39.64 101.45 22.2
Guangdong 560.60 704.80 371.83 26.94 161.83 11.8
Hainan 19.16 236.25 12.81 1.66 4.69 10.9

19Issue 22 January 2005
China Distribution & TradingLi & Fung Research Centre
Total Retail Per Capita
Sales of Retail Sales
Consumer Goods of Consumer Under Provincial
Region (billion yuan) Goods (yuan) City County County Level Growth (%)
Central Region
Shanxi 72.93 220.07 47.13 13.52 12.28 13.7
Jilin 111.03 410.61 85.77 7.68 17.58 10.1
Heilongjiang 137.65 360.81 101.94 18.66 17.04 10.1
Anhui 133.12 207.68 66.66 28.56 37.9 9.8
Jiangxi 92.32 217.02 45.53 20.66 26.13 11.7
Henan 242.64 251.00 123.48 49.42 69.74 10.8
Hubei 235.87 392.99 160.33 22.29 53.25 10.8
Hunan 181.63 272.59 99.71 33.25 48.67 10.8
Western Region
Inner Mongolia 72.68 305.38 44.95 16.65 11.08 21.3
Chongqing 83.55 266.93 48.23 11.27 24.05 9.5
Sichuan 209.11 240.36 100.42 35.73 72.96 13
Guizhou 45.88 118.55 27.2 8.58 10.1 10.2
Yunnan 78.25 178.82 42.53 18.05 17.67 10
Tibet 5.83 215.93 2.61 0.25 0.72 9.2
Shaanxi 85.32 231.22 56.56 14.91 13.85 17.2
Gansu 47.46 182.33 30.8 7.62 9.04 9.5
Qinghai 10.27 192.32 6.61 2.47 1.18 11.5
Ningxia 12.08 208.28 8.15 2.08 1.85 15.1
Xinjiang 42.12 217.79 31.13 4.92 6.06 11.1
Guangxi 85.77 176.59 45.85 16.97 22.95 12.2
Source: National Bureau of Statistics, PRC.
Exhibit 25: Rankings of the Retail Sales of Consumer Goods and Growth by Region,2001 – 2003
Rank (Growth) Rank (Retail Sales)
Region 2003 2002 2001 2003 2002 2001
Beijing 5 22 11 11 11 11
Tianjin 16 1 2 18 17 18
Hebei 22 14 14 9 9 9
Shanxi 6 8 30 23 23 21
Inner Mongolia 2 2 7 24 24 24
Liaoning 10 10 16 7 7 5
Jilin 24 12 4 16 16 17
Heilongjiang 25 16 19 14 14 14
Shanghai 31 24 31 8 8 8

20Issue 22 January 2005
China Distribution & TradingLi & Fung Research Centre
Rank (Growth) Rank (Retail Sales)
Region 2003 2002 2001 2003 2002 2001
Jiangsu 7 5 15 3 3 2
Zhejiang 17 3 6 4 4 4
Anhui 27 31 28 15 15 15
Fujian 8 13 22 13 13 13
Jiangxi 13 25 29 17 18 19
Shangdong 1 4 5 2 2 3
Henan 19 15 9 5 5 6
Hubei 20 7 12 6 6 7
Hunan 21 9 10 12 12 12
Guangdong 12 11 8 1 1 1
Gansu 11 20 24 19 19 16
Hainan 18 27 26 28 28 28
Chongqing 28 26 25 21 20 20
Sichuan 9 17 13 10 10 10
Guizhou 23 18 18 26 26 27
Yunnan 26 29 3 22 22 23
Tibet 30 30 1 31 31 31
Shaanxi 3 23 21 20 21 22
Gansu 29 21 23 25 25 26
Qinghai 14 6 17 30 30 30
Ningxia 4 19 20 29 29 29
Xinjiang 15 28 27 27 27 25
Source: National Bureau of Statistics, PRC.
3. The Upgrading ofConsumption Structure
Accompanying the income growth is the upgrading of
consumption structures of both urban households and rural
households – the Engel Coefficient, a measure of the
proportion of food expenditure to the total living expenditure,
has dropped remarkably over the past two decades (See
Exhibits 26 and 27).
(1) The Urban Households
Consumption of traditional items such as “Food”, “Clothing”,
and “Household Facilities, Articles and Service” went down
from 76% of total consumption expenditure in 1985 to a
53.21% in 2003. The consumption of other items went up
considerably for urban households. The percentage share
of consumption of “Medicine and Medical Service”, and
“Transport, Post and Communication Services” in 2003 was
almost four times that in 1985. The consumption of
“Education, Cultural and Recreation Services” and
“Residence” in 2003 almost doubled that in 1985. “Clothing”
had long been the second largest item of expenditure of
urban residents after “Food”. However, in 2000, “Education,
Cultural and Recreation Services” had already surpassed
“Clothing” and became the second largest item of
expenditure (See Exhibit 26).
(2) The Rural Households
The importance of “Food”, “Clothing” and “Home Equipment
Articles for Use and Services” decreased lightly although
together they sti l l accounted for 55.46% in total
consumption, and the single “Food” item still took up 46%
of total consumption in 2003. In addition, the share of
“Medicine and Medical Service”, “Transport, Post and
Communication Services” and “Education, Cultural and
Recreation Services” has been growing considerably (See
Exhibit 27).

21Issue 22 January 2005
China Distribution & TradingLi & Fung Research Centre
Exhibit 26: Consumption Structure of Urban Households, 1985 - 2003
Per Capita Annual Living Composition of Per Capita Annual
Expenditures for Consumption (yuan) Living Expenditure for Consumption (%)
Items of Consumption 1985 1990 1995 2000 2003 1985 1990 1995 2000 2003
Per Capita Living
Expenditure 673.20 1278.89 3537.57 4998.00 6510.94 100 100 100 100 100
Food 351.72 693.77 1766.02 1958.31 2416.92 52.25 54.25 50.09 39.44 37.12
Clothing 98.04 170.90 479.2 500.46 637.72 14.56 13.36 13.55 10.01 9.79
Household Facilities,
Articles and Service 57.87 108.45 296.94 439.29 410.34 8.60 10.14 7.44 7.49 6.3
Medicine and
Medical Service 16.71 25.67 110.11 318.07 475.98 2.48 2.01 3.11 6.36 7.31
Transport, Post and
Communication Services 14.39 40.51 171.01 395.01 721.12 2.14 1.20 5.18 8.54 11.08
Education, Cultural and
Recreation Services 55.01 112.26 312.71 627.82 934.38 8.17 11.12 9.36 13.40 14.35
Residence 32.23 60.86 250.18 500.49 699.38 4.79 6.98 8.02 11.31 10.74
Miscellaneous Commodities
and Services 47.23 66.57 151.39 258.54 215.10 7.01 0.94 3.25 3.44 3.30
Source: National Bureau of Statistics, PRC.
Exhibit 27: Consumption Structure of Rural Households, 1985 - 2003
Annual Per Capita Composition of
Consumption Expenditures (yuan) Consumption Expenditure (%)
Items of Consumption 1985 1990 1995 2000 2003 1985 1990 1995 2000 2003
Per Capita Living
Expenditure 317.42 584.63 1310.36 1670.13 1943.3 100 100 100 100 100
Food 183.43 343.76 768.19 820.52 885.95 57.79 58.8 58.62 49.13 45.59
Clothing 30.86 45.44 89.79 95.95 110.09 9.72 7.77 6.85 5.75 5.67
Home Equipment Articles
for Use and Services 16.25 30.9 68.48 75.45 81.62 5.12 5.29 5.23 4.52 4.2
Medical Treatment and
Health Care 7.65 19.02 42.48 87.57 115.82 2.41 3.25 3.24 5.24 5.96
Transport and
Communication 5.48 8.42 33.76 93.13 162.46 1.72 1.44 2.58 5.58 8.36
Recreation, Education
and Cultural Services 12.45 31.38 102.39 186.72 235.72 3.92 5.37 7.81 11.18 12.13
Housing 57.9 101.37 182.21 258.34 308.4 18.24 17.34 13.91 15.47 15.87
Miscellaneous Commodities
and Services 3.4 4.34 23.06 52.46 42.95 1.07 0.74 1.76 3.14 2.21
Source: National Bureau of Statistics, PRC.

22Issue 22 January 2005
China Distribution & TradingLi & Fung Research Centre
(3) Consumption structures of differentincome groups
Exhibits 28 and 29 display the composition of living
expenditures of urban households and rural households in
different income groups. It is found that urban households,
in general, spend proportionately less on food than rural
households. Households with higher income levels in both
urban areas and rural areas also tend to spend
proportionately less on food. On the other hand, urban
households in general, as well as the higher income groups,
spend more on items such as “Clothing”, “Transport and
Communications“, “Education, Cultural and Recreation
Services”, etc.
Exhibit 28: Composition of Living Expenditure of Urban Households by Income Groups,2003 (%)
Lower Upper
Low Middle Middle Middle High Highest
Lowest Income Income Income Income Income Income
Income Poor Households Households Households Households Households Households
Households Households (second (second (third (fourth (ninth (tenth
Item Average (first decile) (first 5%) decile) quintile) quintile) quintile) decile) decile)
Total Living
Expenditures
(%) 100.00 100.00 100.00 100.00 100.00 100.00 100.00 100.00 100.00
Food 37.12 47.72 48.59 44.93 42.26 39.23 36.61 34.67 29.85
Clothing 9.79 7.75 7.02 9.27 10.01 10.56 10.49 9.82 8.79
Household
Facilities,
Articles and
Services 6.30 3.59 3.43 4.4 5.01 5.87 6.26 7.14 8.08
Medicine and
Medical
Services 7.31 6.86 6.48 6.67 7.13 7.10 7.43 7.87 7.37
Transport,
Post and
Communication
Services 11.08 6.80 6.15 8.47 9.39 10.23 10.95 11.49 14.34
Education –
Cultural and
Recreation
Services 14.35 12.79 13.10 12.81 13.29 13.88 14.61 15.40 15.22
Residence 10.74 12.06 12.83 10.93 10.08 10.07 10.33 10.03 12.36
Miscellaneous
Commodities
and Services 3.30 2.43 2.40 2.52 2.83 3.07 3.32 3.59 3.99
Source: National Bureau of Statistics, PRC.

23Issue 22 January 2005
China Distribution & TradingLi & Fung Research Centre
Exhibit 29: Composition of Living Expenditure of Rural Households by Income Groups,2003 (%)
Lower Lower Middle Middle Upper Middle High
Income Income Income Income Income
Item Households Households Households Households Households
Living Expenditure 100.00 100.00 100.00 100.00 100.00
Food 54.06 51.84 48.53 45.64 38.05
Clothing 5.59 5.64 5.64 5.74 5.70
Residence 13.30 13.13 13.90 15.50 19.34
Household Facilities, Articles and
Services 3.70 3.74 3.83 4.14 4.84
Medicines and Medical Services 5.99 5.93 6.02 5.70 6.08
Transport, Post and
Telecommunications 5.34 6.10 7.44 8.37 10.99
Cultural, Educational and Recreational
Articles and Services 10.33 11.71 12.60 12.64 12.39
Other Commodities and Services 1.69 1.90 2.05 2.26 2.60
Source: National Bureau of Statistics, PRC.
4 . F r a g m e n t e d M a r k e t : L o c a lProtectionism
(1) Background
A very successful retail strategy in one region may not be
able to apply in other regions – an obstacle for retailers to
enter the fragmented market in China. One key reason for
this is local protectionism, which refers to the illicit and
irregular use of administrative controls by local governments
to interfere the inward trade of goods and services from
other parts of the country.
With the introduction of fiscal decentralization since the
economic reform in 1978, the central government has
allowed more management decisions to be made at lower
levels. This decentralization process has given cities and
counties authorities significant decision-making power, and
many state-owned enterprises have been mandated to local
governments.
Since the local governments are obsessed with local
economic growth and local GDP growth rate has become
the leading criteria for evaluating the performance of the
officials, local governments have been making full use of
their administrative rights to assist and protect local
enterprises. They rely on the businesses in their jurisdictions
for tax revenue and also care about local employment, which
is important for maintaining social stability. Local
governments thus often take administrative controls to
protect local businesses from competition from other parts
of China.
In general, local protectionism is caused by the following
reasons: a) protection of local industries and enterprises
by local government; b) the necessity for local government
to maintain the quality and security of products within its
territory; c) the maximization of local fiscal revenue due to
rising local fiscal expenditure; d) the necessity for local
government officials to show their performance; e) the close
relationship between the local government officials and the
local enterprises.

24Issue 22 January 2005
China Distribution & TradingLi & Fung Research Centre
(2) Government Policies in Regulating Local
Protectionism
The central government is taking a series of measures to
tackle the problem of local protectionism. It aims to break
through regional blockage that is obstructing the formation
of a nationally unified market.
Working teams formed jointly by the Ministry of Commerce,
the Ministry of Finance, the Ministry of Supervision, and
four other departments, are urging the local governments
to remove protective regulations. For example, on 12 and
15 September 2003, nine provinces around the Pearl River
Delta, namely, Fujian, Jiangxi, Hunan, Guangdong,
Guangxi, Hainan, Sichuan, Guizhou and Yunnan, signed
an agreement to remove protective regulations in the region.
© Copyright 2005 Li & Fung Research Centre. All rights reserved.
Though Li & Fung Research Centre endeavours to ensure the information discussed in this material is accurate and updated, no legal liability can be
attached as to the contents hereof. Reproduction or redistribution of this material without Li & Fung Research Centre’s prior written consent is prohibited.