china airlines 2021 investor conference
TRANSCRIPT

China Airlines
2021 Investor Conference
Nov 16, 2021
TSE:2610

2
Legal
Disclaimer
• The information contained in this presentation,
including all forward-looking information, is
subject to change without notice, whether as a
result of new information, further events or
otherwise, and China Airlines(the “Company”)
undertakes no obligation to publicly update or
revise the information contained in this
presentation.
• No guarantees regarding the completeness,
accuracy, and reliability of information contained
are made explicitly or implicitly. They are not
intended to represent complete statement of the
Company, industryor futuredevelopment.

3
Agenda 1. Financial Results for First Three
Quarters of 2021
1) Operating Performance
2) Composition of Op. Revenue & Cost
3) Financial Risk Management
2. Impact of COVID-19 Pandemic
1) Operational Performance Update
2) Industry Environment Update
3) Response to COVID-19 and outlook
for post COVID

Financial Results for First Three Quarters
of 2021
4

5
Consolidated Financial Statistics
2020Q3 2021Q3 YoY %
Operating Revenue 26,612 34,474 29.54%
Net Operating Income (Loss) -358 3,985 -
Non-Operating Income (Loss) -817 2,801 -
Net Income (Loss) After Tax -708 2,917 -
Earnings (Loss) Per Share (TWD) -0.13 0.51 -
Group Revenue
2020Q3 2021Q3 YoY %
Passenger Revenue 3,241 1,189 -63.31%
Cargo Revenue 21,509 31,247 45.27%
Other Operating Revenue 1,862 2,038 9.45%
Total Operating Revenue 26,612 34,474 29.54%
Operating Performance – 2021Q3TWD 100 Million
TWD 100 Million
6
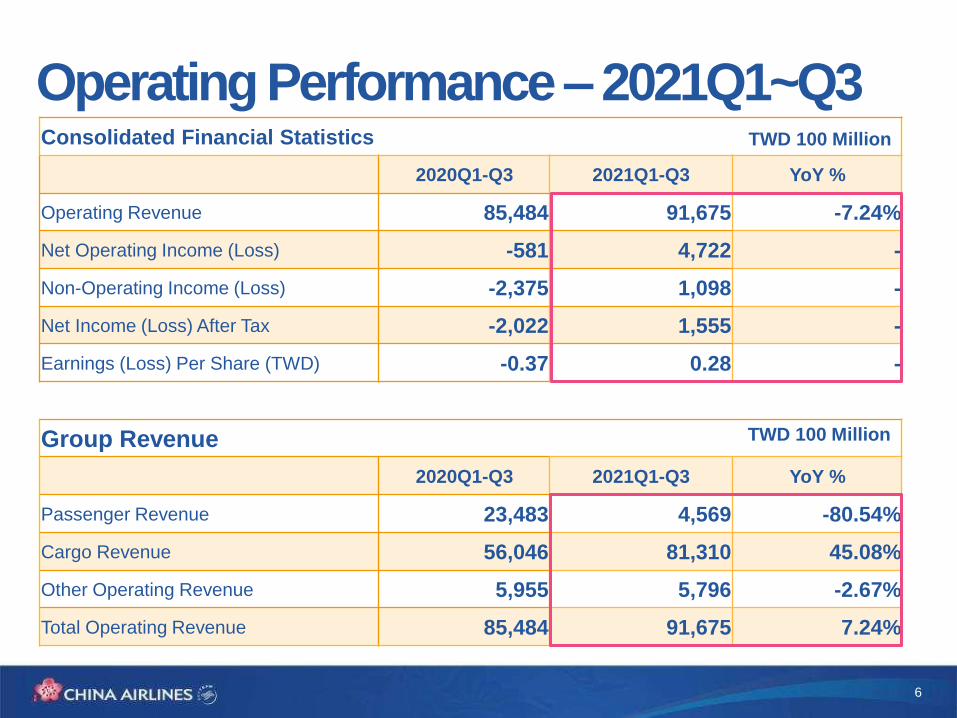
Consolidated Financial Statistics
2020Q1-Q3 2021Q1-Q3 YoY %
Operating Revenue 85,484 91,675 -7.24%
Net Operating Income (Loss) -581 4,722 -
Non-Operating Income (Loss) -2,375 1,098 -
Net Income (Loss) After Tax -2,022 1,555 -
Earnings (Loss) Per Share (TWD) -0.37 0.28 -
Group Revenue
2020Q1-Q3 2021Q1-Q3 YoY %
Passenger Revenue 23,483 4,569 -80.54%
Cargo Revenue 56,046 81,310 45.08%
Other Operating Revenue 5,955 5,796 -2.67%
Total Operating Revenue 85,484 91,675 7.24%
Operating Performance – 2021Q1~Q3TWD 100 Million
TWD 100 Million

7
Composition of Op. Revenue - CI
Cargo revenue accounted for 93%, and Passenger and other operating
revenue accounted for 3% and 4% respectively in 2021Q1-Q3.
24%
67%
4%
19%
66%
4%
2020Q1-Q3 2021Q1-Q3
Passenger Rev 3%
Cargo Rev93%
Other Op. Rev 4%
Passenger Rev 24%
Cargo Rev72%
Other Op. Rev 4%

8
Fuel cost accounted for 28% of operating expenses due to the increase in
fuel price during 2021.
Composition of Op. Expenses - CI
22.2%
30.7%3.8%
2020Q1-Q3 2021Q1-Q3
Fuel 22%
Airport &
Ground
Handling
Charge 12%Labor Cost
17%
Rental &
Depreciation
&
Amortization
23%
Maitenance
19%
Sales &
General
Adm. 2%
Pax Service
2%
Others 3%
Fuel 28%
Airport &
Ground
Handling
Charge 11%
Labor Cost
16%
Rental &
Depreciation
&
Amortization
22%
Maitenance
17%Sales &
General Adm.
1%
Pax Service
1%
Others 4%

9
Financial Risk Management (CI)
2020 Q1-Q3 2021 Q1-Q3 YoY%
Jet Fuel (MOPS) USD/BBL 44.04 70.75 60.65%
Fuel Consumption 10KBBL 1,026.71 1,059.95 3.24%
Fuel Expend TWD/100Million 167.38 223.27 33.39%
Hedging Loss (Gain) TWD/100Million 0.34 -0.02 -
Total Fuel Cost TWD/100Million 167.72 223.25 33.11%
1.Fuel Cost:Hedging ratio is 4.5% during next six months
2. Exchange rate hedging
3. Interest rate hedging
The current cash position of US Dollars well manages to offset the unrealized
gains(losses) of the US Dollars liabilities caused by the exchange rate, as the effect
of natural hedging.
As of Sep 30 2021, The portion of Fixed-rate borrowing positions was approximate
18%.
Keeping a close watch on the monetary policy trends of major economies and
formulate hedging strategies based on market dynamics.

10
Impact of COVID-19 Pandemic-
Operational Performance Update

11
16,295
972 1,808 1,433 1,287
612 680
Q1 Q2 Q3 Q4 Q1 Q2 Q3
2020 2021
Revenue
• Passenger revenue decreased by 86% to TWD 2,579 million in 2021Q1-Q3.
• Trans Pacific Ocean accounted for the largest share (31%) of revenue, followed by
South East Asia and Mainland China with revenue share of 27% and 23%
respectively.
Passenger PerformanceComposition by Region
19,075million in 2020Q1-Q3
2,579 million in 2021Q1-Q3
▼86%
Australia/
New Zealand
5%
Europe 9%Hong Kong
3%
North East
Asia 2%
Mainland
China 23%South East
Asia 27%
Trans Pacific
Ocean 31%

12
ASK and load factor decreased by 77% and 43.8ppt respectively while yield
was 5.0 which increased by 110% in 2021Q1-Q3.
Passenger Performance Index
Load Factor、 ASK (MN) Yield (TWD)
2.3
5.5 5.2
4.5
5.7
4.5 5.0
Q1 Q2 Q3 Q4 Q1 Q2 Q3
2020 2021
10,731
496 1,342 1,977 1,348
669 811
67%
36%
26%16% 17% 20% 17%
Q1 Q2 Q3 Q4 Q1 Q2 Q3
2020 2021
ASK Pax LF

13
Impact on Passenger Traffic• Our frequencies between 2020 and 2021 plunged more than 90% compared to the same period
during 2019.
• There was no rebound tendency in demand for passenger transport capacity from 2021 to the
third quarter due to the worldwide Alpha and Delta variant, domestic outbreak of epidemics
and low vaccinated population in Asia-Pacific.
3,128 2,984
3,253 3,229 3,271 3,194 3,331 3,315
3,157 3,247 3,091
3,214 3,240
2,309
1,150
89 53 86
156 187 232 286 346 325 336 160 216 231
132 32 75 149 129 134
-89%-95% -93%
-93%-96%
-99% -98% -96% -96% -96%
-120%
-80%
-40%
0%
0
1000
2000
3000
4000
5000
Jan Feb Mar Apr May Jun Jul Aug Sep Oct Nov DecRound Trips
2019 2020 2021 2021 v.s 2019 Diff%

14
11,046
23,400 21,448
25,798 23,958
25,978
31,170
Q1 Q2 Q3 Q4 Q1 Q2 Q3
2020 2021
• Cargo revenue totaled TWD 81,106 million, a 45% increase, in 2021Q1-Q3.
• Trans Pacific Ocean accounted for the largest share(61%) of revenue, followed by
Southeast Asia and Europe with revenue share of 13% and 8% respectively.
Cargo PerformanceRevenue Composition by Region
55,894million in 2020Q1-Q3
81,106million in 2021Q1-Q3▲45%Australia/
New
Zealand
3%Europe
8%Hong Kong
4%
North East
Asia
5%
Mainland
China
6%South
East Asia
13%
Trans
Pacific
Ocean
61%

15
FATK increased by 17% and load factor grew 4.03 ppt. Yield was 15.6 which
increased by 18% in 2021Q1-Q3.
Cargo Performance Index
Load Factor、 FATK (MN) Yield (TWD)
1,802 2,092
2,392 2,542
2,329 2,328 2,669
69% 72% 73% 74% 76% 76% 75%
Q1 Q2 Q3 Q4 Q1 Q2 Q3
2020 2021
FATK CGO LF
8.8
15.6
12.3
13.8 13.5 14.7
15.6
Q1 Q2 Q3 Q4 Q1 Q2 Q3
2020 2021

Impact of COVID-19 Pandemic-
Industry Environment Update
16

17
2020-2021 Air Passenger/Freight Demand
-98.4%
-29.5%
1.2%
-100%
-80%
-60%
-40%
-20%
0%
20%
International Air Passenger(RPK)/Freight(CTK)(%YoY, vs 2019)
APR 2020low point
2020 RPK ↓ 75.6%CTK ↓ 11.8%
2021(til Sep)
RPK ↓ 80.2%CTK ↑ 8.7%
2021/11st positive growth
vs. pre-pandemic level
Source:IATA
Passenger
Freight

18
Demand of PaxMarket is far below the pre-crisis levels
Source:IATA
International Pax Traffic decreased by 69.2% in Sep,2021. and decreased by 80.2% from Jan to Sep, which is still far lower than the pre epidemic level.
The recovery of international pax market of airlines in the Asia lags behind other regions, because delta variant virus epidemic and strict border control measures.
0%
20%
40%
60%
80%
100%
-120%
-100%
-80%
-60%
-40%
-20%
0%
20%
2019 2020 2021
YoY% International Pax capacity/traffic/LF
Traffic
Capacity
LF
2020 (vs 19)
Capacity -68.1%
Traffic -75.6%
LF 62.8%
2021YTD (vs 19)
Capacity -69.9%
Traffic -80.2%
LF 54.2%
Year 202101 202102 202103 202104 202105 202106 202107 202108 202109
CapacityYoy%
-74.4% -77.9% -77.4% -76.0% -74.6% -71.0% -63.8% -59.0% -59.1%
Traffic Yoy%
-85.6% -88.7% -87.8% -87.3% -85.1% -80.9% -73.6% -68.8% -69.2%
LF % 44.9% 40.8% 43.7% 43.8% 47.3% 55.2% 62.1% 65.3% 61.6%
-56.7%
-67.3%
-65.1%
-61.5%
-86.5%
-71.0%
-73.3%
-74.7%
-76.7%
-94.5%
-100%-50%0%
NorthAmerica
LatinAmerica
Europe
MiddleEast
Asia
International Capacity/Traffic
2021/01~09 (international capacity)
2021/01~09 (international traffic)
※ 2021 (vs the same month in 2019)※ 2021 (vs the same month in 2019)

19
Impact of COVID-19 Pandemic-
Response to COVID-19 and
outlook for post COVID

Source:IATA;DHL
Demand surge still spread across various sectors from hi-tech, automotive to pharma.
E-commerce contributed to robust air demand.
Cargo demand remains strong amidst the upcoming e-commerce heavy events(Black Friday, Singles Day) and holiday shopping along with new tech product launched.
Healthy PMI index, historically low I/S ratio & peak season indicate strong air cargo demand.
Continued conversion of ocean freight to air as US port congestion worsens.
Air cargo continue to rise, trend above goods
trade
Air cargo continue to rise
Yields elevated, load factors close to historical
highs

21
Ease travel restrictions for vaccinated tourists
Ssource:travelweekly;UNWTO
2021/11/01 Countries for Taiwan vaccinated travelers can visit
Government policies will play a huge role in air traffic recovery, with travel restrictions mostly
impacting cross-border flights.
More and more countries beginning to reopen was not only welcome news to airlines but also
represents a structural improvement in the international travel landscape.
The travel status of individual
countries can change suddenly.
29%
34%
36%
2021 JUL travel restriction
completely closed
partially closures
testing or quarantine
17%
57%
26%
2021 NOVtravel restriction
Entry is restricted
testing or quarantine
travel is open

22
Passenger volume recovery projection
Source:Bain & Company, Inc. ;PaxIS;McKinsey analysis of global airline demand
Baseline scenario projection of G20 countries’ total
airline passenger volume in July 2022, as percentage of
July 2019 numbers.
Looking ahead to projected air traffic into July
2022
Most major flows are expected to
recover by 2023 or 2024Projected recovery by region, index(2019=100)
For intraregional flights, we expect close to full
recovery as early as 2022.
Overall air traffic demand will still be hampered by the
low level of interregional flights, which is currently at 20
percent of pre-COVID-19 levels.

23
Operational strategies during pandemic
Mainly rely on air cargo supplemented by passenger service, during pandemic air cargo is our core source of revenue.
Cargo:Differentiation pricing strategy, maximize cargo capacity, consolidate source of goods, optimize rate structure, hold on to cargo business opportunities.
Passenger:Stay ahead of market trends, maintain schedule stability, consolidate rigid demand and pay a close attention to border & quarantine-free policy.
Fleet modernizationExpand cargo fleet
Fly SafeFlexible
ScheduleCargo
BizFleet
PlanningFinancialStability
Max capacity Belly hold 21 Freighter Market opportunity Sea-to-Air conversions Charter Board package Valuable cargo
Passenger aircraft for cargo demand
Schedule stability(core routes)
“IATA Travel Pass” trialDisinfection & deep cleaningFly safe information & ServiceTouchless servicesAircrew Safety and Health
Stable cash-flowAdequate liquidityMinimize costs

24
• Fully utilize CAL 18 747-400 freighters
• Leverage belly space to support cargo demand
• Maintain high efficiency with 3 777F operation
CAL Expands Cargo Service CAL leverages Taiwan’s strategic position and cargo capacity during the pandemic,
increasing by 23% of schedule flights per week . The overall weekly capacity will be up
to 130 flights including charter flights in 2021.
• Monthly route review and flexible route
adjustment
• Prioritize high-yield goods and regular
project shipment for route profit boost
• Pursue high yield charter to uplift load
factor and revenue

The fifth cargo capacity in the world
資料來源: IATA WATS 25
• IATA ranked China Airlines the fifth in the world in terms of cargo capacity, three
places higher than 2019, ranking first among Asian airlines. It also ranked ninth in
the world in terms of CTK.
2020 Top 10 Airlines: Ranked by Cargo Traffic

26
Flight Schedule Adjusted in Line with Market Demand
Operations remain active in adapting to the dynamic changes of the market
landscape and governments regulations.
Operate selected routes to maintain network connectivity,
and enhance revenue management .
Gradually resume flights to align with boarder reopening,
regional business travel needs and travel bubbles.
Operate charter flights to generate revenue.

27
Resume Passenger flights as borders progressively reopen• Asia-Pacific :
Indonesia:CECChas removed Indonesia from list of high-risk countries. flight services to Jakarta
have resumed since 20th Oct.
Myanmar:having been removed from list of high-risk countries because of the Delta variant by
CECC since 6th Nov. Flight services will resume according to market demand.
Singapore:It is going to the scheme of “ Vaccinated TravellersLane “ to welcome the reopen to
foreign visitors. Flight frequency tends toward stability.
• Oceania:
Australia:Australia’s international borders have progressively reopened since 1st Nov.
New Zealand:Non-New Zealand citizens as fully vaccinated are permitted to travel to New Zealand
from 1st Nov. Bookings on our current ANZ flights will increase after travellrestrictions were lifted.
• USA:From 8th Nov, borders reopen to Non US citizens who must be fully vaccinated. We have
responded to maintain stable flight operations to and from several gateways in US.
UK:having been removed from list of high-risk countries because of the Delta variant by CECC
since 6thNov. Flight services to and from London will resume in Dec.

28
Increasing vaccination coverage, reopening of
international travel , new international travel vaccine
rules, herd immunity is the key to lead the way in
travel recovery.
Introduce Airbus A321neo, featuring the new
touchless Audio and Video On Demand (AVOD)
system to meet post Covid-19 passenger demand.
Economic recovery , strong cargo demand, sea-
to-air conversions, supply chain disruption, low
inventory, air cargo becomes a sellers' market,
freight rates at a higher level and outlook for
cargo stays positive.
Stay ahead of market trends, seize the chance to
manage rate, ship high-value goods as priority,
schedule flexible cargo operation, optimize
revenue.
Cargo opportunity | Passenger recovery
Schedule Stability
Demand, Border & Quarantine
Epidemic Prevention
& Manpower Demand
A321neo Delivery Strengthen Revenue
management system
Market Dynamics & Demand
Restock Inventory(Low inventory)
Sea-to-Air
Conversions
Flexible Pricing
Strategy
Source of Goods(Bulk、Heavy、Value)
10,0
00,0
00 to
nn
e
100,0
00,0
00 R
P
International cargo Traffic (thousand tonne)
International pax Traffic(100 million RP)

Conserve cash-
flow & lower the
costIntegrate sales
and marketing
strategy
Maintain business
continuity and
stability
Proactive COVID-19 Response Strategies
Rebuild
passenger
confidence in
air travel
Comply with regulations to
promote safe travel

30
Fleet status
2021Oct
2022Dec
Narrow
Body
15 12
0 10
Wide
Body
14 14
10 10
23 21
sold 0
Passengers 62 67
Boeing 737-800
Airbus 321neo
Airbus 350-900
Boeing 777-300ER
Airbus 330-300
Boeing 747-400
(-3)
(+10)
(-2)
2021Oct
2022
Freighters
18 18
3 5
Freighters 21 23
Boeing 747-400F
Boeing 777F(+2)
67
23
902021 OCT
Total 83 aircraft
2022年
Airline industry will recover,
especially start from
regional market
Due to port congestion ,Lack
of cargo capacity remains
a key obstacle for the rising
demand,.

31
S&P revised rating outlook to stable
Rating Organization
Long-Term Rating
Outlook Rating Date
Taiwan Ratings
twBBB+ Stable 2021/10/28
Taiwan Ratings
twBBB+ Negative 2020/3/16
Taiwan Ratings
twBBB+ Stable 2019/10/30
CAL is the first airline that received revised
rating outlook to stable in Asia

32
Sustainability We Care
Establish Happy Workplace
5 consecutive years
Taiwan High Compensation
100 Index (HC 100)
Taiwan Employment Creation
99 Index (EMP 99)
2017-2021
Pioneer in Environmental Protection
9 consecutive years
Achieved great CDP
score on climate
change
2012-2020
Excellent Corporate Governance
7 consecutive years
Top 6%-20% TWSE/TPEx
listed companies in the
seventh corporate
governance review.
2014-2021• The only Taiwanese airline selected for DJSI
Emerging Markets for six consecutive years.
• China Airlines ranked in 2nd place among the world's airlines(DJSI ).

2021.11
China Airlines│No.1, Hangzhan S. Rd., Dayuan Dist., Taoyuan City, Taiwan
TEL│03.399.8888
Thank you
# We fly We fight
# We will all be fine