chile japan business committee
TRANSCRIPT

CHILE‐JAPAN BUSINESS COMMITTEECHILE JAPAN BUSINESS COMMITTEECHILEAN COPPER MINING AND CODELCO CHALLENGES
Nelson Pizarro C
December 2nd, 2014
Nelson Pizarro C.CEO
Copyrights © 2014 CODELCO‐CHILE. Todos los Derechos Reservados. | Copyrights © 2014 by CODELCO‐CHILE. All Rights Reserved.

Chile: An attractive mining districtYear 2013
SHARE IN GLOBAL PRODUCTION SHARE IN GLOBAL RESERVES
32%Chile
28%Chile
Global Ranking: 1
Copper32%
68%Others
28%
72%Others
Molybdenum15%
85%
Chile
Others
21%
79%
Chile
OthersGlobal Ranking: 3
85% 79%
Natural Nitrates100%
Chile
100%
Chile
Global Ranking: 1
Lithium Carbonate39%
61%
Chile
Others
Chile
OthersGlobal Ranking: 158%
42%
Copyrights © 2014 CODELCO‐CHILE. Todos los Derechos Reservados. | Copyrights © 2014 by CODELCO‐CHILE. All Rights Reserved.
Source: Cochilco, Codelco, USGS.
58%

Codelco has a great future
CODELCO: WORLD LEADER IN COPPER RESERVES
Leadership in copper reserves Estimated mineral resources
Our mineral resources let us expect more than 70 years of exploitationCodelco
9%
Others
Others29%
Our mineral resources let us expect more than 70 years of exploitation
Mineral(million tonnes)
Copper grade
(%)
Copper content(million tonnes)
Share(%)
Chuquicamata 2,147 0.70 15.1 11.6Chile19%
AustraliaPeruRussia
4%
China4%
q
Radomiro Tomic 3,671 0.46 16.8 12.9
MH 936 0.95 8.9 6.8
Salvador 1,678 0.46 7.7 5.9
Andina 6,017 0.75 45.1 34.7Australia
13%Peru10%USA
6%Mexico
6%
4%
Source: U.S. Geological Survey, January 2014.
El Teniente 4,195 0.83 34.8 26.7
Gabriela Mistral 491 0.36 1.8 1.4
Codelco 19,136 0.68 130.2 100.0
*: Mineral resources include mineral stocks and broken material.
Copyrights © 2014 CODELCO‐CHILE. Todos los Derechos Reservados. | Copyrights © 2014 by CODELCO‐CHILE. All Rights Reserved.

Although, copper prices has shown a downward trend since 2011 …
475
500
900
1.000
Copper Pricec/lb
Stocks in Metal Exchanges ** ‘000 tonnes
425
450
700
800
350
375
400
400
500
600
C P i
275
300
325
100
200
300
Stocks in Metal
Copper Price
250
275
0
100
ene 2011 jul 2011 ene 2012 jul 2012 ene 2013 jul 2013 ene 2014 jul 2014
Stocks in Metal Exchanges
Copyrights © 2014 CODELCO‐CHILE. Todos los Derechos Reservados. | Copyrights © 2014 by CODELCO‐CHILE. All Rights Reserved.
*: Year 2014: copper price and stocks until November 19th. **: LME, COMEX and SHFE.

Price prospects remain auspicious in the long‐termLong‐term copper price forecasts, c/lb, 2015 currency
400
FORECASTS EVOLUTION: BANKS AND ANALYSTS LATEST PROJECTIONS
334355
CRUWood Mackenzie
250
300
350
318320328339345345334
CIMB GroupBarclays Capital
BoA Merrill LynchIHS Economics
J.P. MorganAnalysts average
CRU
150
200
250
299299304304305317
UBSMacquarie
Credit SuisseGoldman Sachs
Commonwealth BankMorgan Stanley
p
1002002 2006 2009 2011 2013CRU Wood Mackenzie (Brook Hunt)Structural Fiscal Budget BarclaysMacquarie
301253269269279281285
B k & OthNumis
Wilson HTMInvestec
RBC Capital MarketsDeutsche Bank
Citigroup
q
305305301
0 100 200 300 400
Average without extremesAnalysts, Banks & Others average
Banks & Others average
Correlation between spot and long term forecast: 0.67
Copyrights © 2014 CODELCO‐CHILE. Todos los Derechos Reservados. | Copyrights © 2014 by CODELCO‐CHILE. All Rights Reserved.
Note: Structural Budget price is the average in the next ten years after the year of forecast.

Despite the trend towards more discipline in capital use and delays in projects, important investments are projected in the coming years
US$ billi 2014
Total Latin America: US$ 165 billion Total Rest of the World: US$ 127 billion
EXPECTED INVESTMENT IN COPPER PROJECTS* WITH STARTUP DURING THE PERIOD 2014‐2023
21
60
70
WORLD TOTAL: US$ 292 billion
US$ billion, 2014 currency
65
49
29 30
40
50
272
44
2024 16
7 6 11
15
10
20
30
22
1412 12 11 11
8 8 7 7
13
27
26 5 6 8 8
1 31214 7 6
11 11 6 6 11
-
PossibleMore probable
7 7
Copyrights © 2014 CODELCO‐CHILE. Todos los Derechos Reservados. | Copyrights © 2014 by CODELCO‐CHILE. All Rights Reserved.
PossibleMore probable
Sources: Codelco and Wood Mackenzie (September 2014).*: Includes CAPEX of projects under construction, highly probable, probable and possible.

Major copper projects in Chile* with startup between 2014 and 2023(without Codelco)
Name Owner Status Startup year Production‘000 tonnes
Investment**US$ million
Caserones Pan Pacific Copper On commissioning 2014 174 4,080
Sierra Gorda KGHM On commissioning 2014 190 4,240
Antucoya Antofagasta Under construction 2015 76 1,900
Escondida OGP1 (Organic Growth Project 1)
BHP Billiton/ Rio Tinto Under construction 2015 107 4,199
REVISAR(Organic Growth Project 1) Rio Tinto
Encuentro Oxides Antofagasta On feasibility 2016 45 760
Los Pelambres Expansion Antofagasta On prefeasibility 2020 95 7,000
Lomas Bayas Sulphides Glencore On prefeasibility 2020 97 1,600
El Morro Goldcorp On prefeasibility 2021 127 3,900***
Quebrada Blanca Hypogene Teck Resources On feasibility 2021 205 5,590
Santo Domingo Sur Iris Capstone Mining On feasibility 2021 87 1,700
El Abra Mill Freeport On feasibility 2022 198 5,000
Relincho Teck Resources On feasibility 2022 174 4,500
Collahuasi Phase 3 Anglo American/ Glencore On prefeasibility 2023 294 6,500
Copyrights © 2014 CODELCO‐CHILE. Todos los Derechos Reservados. | Copyrights © 2014 by CODELCO‐CHILE. All Rights Reserved.
Sources: Codelco, SNL and Wood Mackenzie (3rd quarter 2014), companies’ reports and press releases.*: The list includes highly probable and probable projects. Average production of copper content in the first 10 years operating at capacity. **: CAPEX according to companies’ reports orother sources. ***: Currently under revision, as the company withdrew its EIA's in November 7, 2014.

Codelco’s target: around 2.5 million tonnes of annual copper production by 2025
MINING STRUCTURAL PROJECTS
2019 202320192018‐20192014 2019 2019
Feasibility completed and early worksUnder construction On feasibilityOn commissioning On prefeasibility
El Teniente New Mine Level432,000 tpy
AndinaExpansion343,000 tpy
ChuquicamataUnderground367,000 tpy
Radomiro Tomic Sulphides Phase II354,000 tpy
Ministro Hales176,000 tpy
Salvador Inca Open Pit196,000 tpy
AndinaTransfer161,000 tpy
Note: Projects production corresponds to the average of the first 10 years operating at design capacity.
US$ million, 2014 currency
Codelco faces an unprecedented investment challenge
Investment Program: history and future (PND* 2014)
Copyrights © 2014 CODELCO‐CHILE. Todos los Derechos Reservados. | Copyrights © 2014 by CODELCO‐CHILE. All Rights Reserved.
*: PND: Business and Development Plan.

Production contribution of all the Structural Projects, PND 2014 (under construction and pending approval)
3,000
Ministro Hales, Radomiro Tomic Sulphides Phase II, Chuquicamata Underground, El Teniente New Mine Level,
Salvador Inca Open Pit, Andina Transfer, Andina Expansion
per
2,500
2,000
‘000
tonn
es of cop
p
1,500
1,000
500
New Mine Level Teniente Chuquicamata Underground Inca Pit El Salvador
New Andina Phase II Other Projects Andina Plan with Projects Plan without Projects
Ministro Hales Sulphides R. Tomic – P. II
Primary Crushing System Andina
Copyrights © 2014 CODELCO‐CHILE. Todos los Derechos Reservados. | Copyrights © 2014 by CODELCO‐CHILE. All Rights Reserved.
Note: Ministro Hales project commissioned included in production of Codelco with and without Projects. PND: Business and Development Plan of Codelco (with projects)

Codelco: the challenge of maintaining production in the short and medium term, despite the sharp drop in ore grades
GRADE AND TREATED MINERAL**
(‘000 fmt)
COPPER PRODUCTION*
Treated mineral Copper ore grade
1.600
1.800
2.000
1 00
1,05
1,10
270 000
315.000
360.000
(‘000 fmt) ‘000 dmtpp g
%
800
1.000
1.200
1.400
0,90
0,95
1,00
180.000
225.000
270.000
200
400
600
800
0,75
0,80
0,85
45.000
90.000
135.000
* I d ’ i l d C d l ’ k i El Ab d A l A i S
0
2000
2001
2002
2003
2004
2005
2006
2007
2008
2009
2010
2011
2012
2013
0,700
2000
2001
2002
2003
2004
2005
2006
2007
2008
2009
2010
2011
2012
2013
** U il 2010 d d F 2010 d i d
Copyrights © 2014 CODELCO‐CHILE. Todos los Derechos Reservados. | Copyrights © 2014 by CODELCO‐CHILE. All Rights Reserved.
*: It doesn’t include Codelco’s stake in El Abra and Anglo American Sur. **: Until year 2010, treated ore grade. From year 2010 to date, mined ore grade.

Projected production PND* 2014 and critical success factors
• Robust mine plans.
Production‘000 fmt
Treated ore grade (%)
1,02.000
• Optimize the use of treatment capacity,reaching design capabilities.
• Increase concentrator recovery andsmelter yield.
0,7
0,8
0,9
1.400
1.600
1.800
y
• Higher rates of operational continuity.
• Increased own and third partiesproductivity.0,4
0,5
0,6
800
1.000
1.200
• Management alignment and leadershipin the administration of assets andproduction processes.
0,1
0,2
0,3
200
400
600
• Commitment of employees and theentire organization.0,00
2014 2015 2016 2017 2018
Copyrights © 2014 CODELCO‐CHILE. Todos los Derechos Reservados. | Copyrights © 2014 by CODELCO‐CHILE. All Rights Reserved.
Note: It doesn’t include Codelco’s stake in El Abra and Anglo American Sur. *: PND stands for Business and Development Plan.
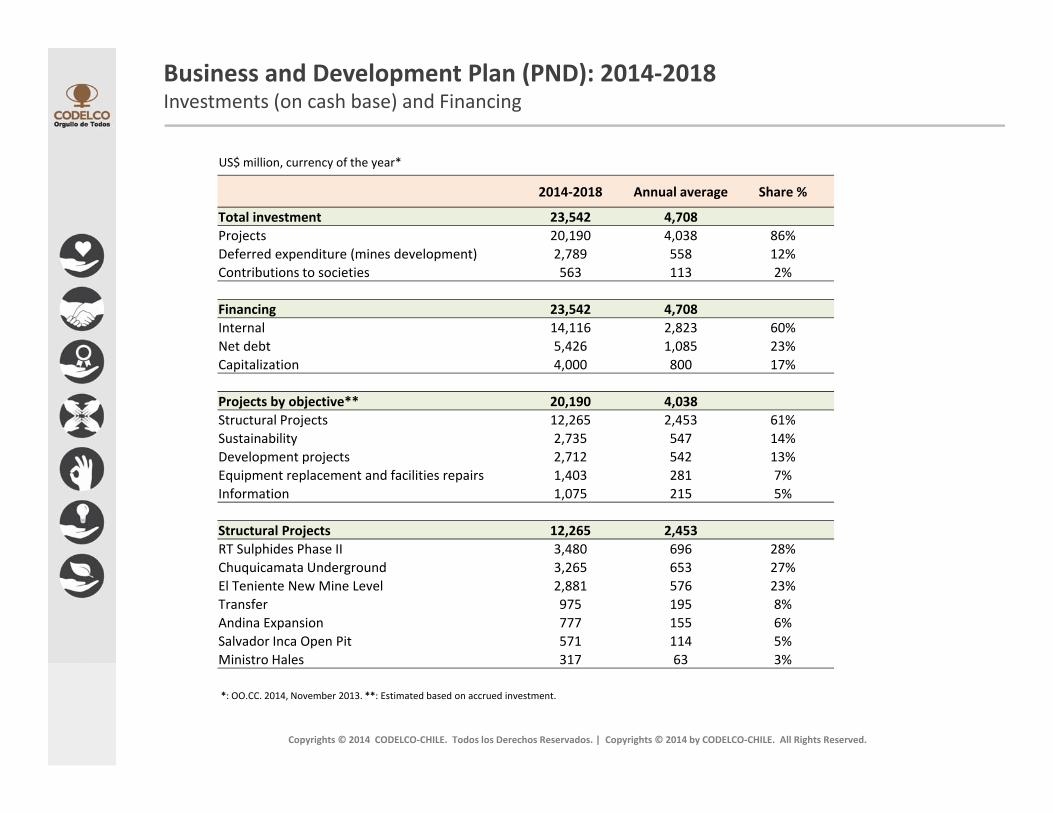
Business and Development Plan (PND): 2014‐2018Investments (on cash base) and Financing
2014‐2018 Annual average Share %
Total investment 23,542 4,708Projects 20,190 4,038 86%Deferred expenditure (mines development) 2 789 558 12%
US$ million, currency of the year*
Deferred expenditure (mines development) 2,789 558 12%Contributions to societies 563 113 2%
Financing 23,542 4,708Internal 14,116 2,823 60%Net debt 5,426 1,085 23%Capitalization 4,000 800 17%
Projects by objective** 20,190 4,038Structural Projects 12,265 2,453 61%Sustainability 2,735 547 14%Development projects 2 712 542 13%Development projects 2,712 542 13%Equipment replacement and facilities repairs 1,403 281 7%Information 1,075 215 5%
Structural Projects 12,265 2,453RT Sulphides Phase II 3,480 696 28%Chuquicamata Underground 3,265 653 27%El Teniente New Mine Level 2,881 576 23%Transfer 975 195 8%Andina Expansion 777 155 6%Salvador Inca Open Pit 571 114 5%Ministro Hales 317 63 3%
Copyrights © 2014 CODELCO‐CHILE. Todos los Derechos Reservados. | Copyrights © 2014 by CODELCO‐CHILE. All Rights Reserved.
Ministro Hales 317 63 3%
*: OO.CC. 2014, November 2013. **: Estimated based on accrued investment.

Codelco’s Investment: 2015PRELIMINARY FIGURES*
$ ll
INVESTMENTS BY DISTRICT PROJECTS INVESTMENT BY OBJECTIVES
US$ illiUS$ million
NORTH DISTRICT 1,707
CENTER SOUTH DISTRICT 1,782
STRUCTURAL PROJECTS 1,364
SUSTAINABILITY 847
US$ million
PROJECTS INVESTMENT 3,489
MINE DEVELOPMENT AND DEFERRED EXPENSES 800
SUSTAINABILITY 847
OTHER DEVELOPMENT PROJECTS 684
ENGINEERING STUDIES, DEFERRED EXPENSES
CONTRIBUTIONS TO SOCIETIES 113
GEOLOGICAL EXPLORATION AND RESEARCH
362
EQUIPMENT REPLACEMENT AND FACILITY REFURBISHMENT 233
GRAND TOTAL ACCRUED 4,402 PROJECTS INVESTMENT 3,489
Copyrights © 2014 CODELCO‐CHILE. Todos los Derechos Reservados. | Copyrights © 2014 by CODELCO‐CHILE. All Rights Reserved.
*: 2015, preliminary budget.

Structural mining projects: major milestones 2014 ‐ 2015
• Chuquicamata Underground:– Taking investment decision and start construction, beyond the early works.
• Chuquicamata Underground:– Taking investment decision and start construction, beyond the early works.
• El Teniente NewMine Level:– Further progress in the development and construction of mining works.
• El Teniente NewMine Level:– Further progress in the development and construction of mining works.
• RT Sulphides Phase II:– Environmental approval.– Submit the First Stage of investment request.
• RT Sulphides Phase II:– Environmental approval.– Submit the First Stage of investment request.
• Andina Expansion:– Continue advancing for environmental approval in 2015.
• Andina Expansion:– Continue advancing for environmental approval in 2015.
• Salvador Inca Open Pit:– Completion of pre‐feasibility study.
Copyrights © 2014 CODELCO‐CHILE. Todos los Derechos Reservados. | Copyrights © 2014 by CODELCO‐CHILE. All Rights Reserved.
Cross challenge: detailed engineering of change in management models of the projects

The increase in costs has been a widespread trend in the industry
300
INDUSTRY AVERAGE COSTS
c/lb, currency of the year
240
260
280
300
Total Cathode Cost
160
180
200
220
Net Cathode Cost
80
100
120
140Cash Cost (C1)
0
20
40
60
1985 1988 1991 1994 1997 2000 2003 2006 2009 2012
Copyrights © 2014 CODELCO‐CHILE. Todos los Derechos Reservados. | Copyrights © 2014 by CODELCO‐CHILE. All Rights Reserved.
1985 1988 1991 1994 1997 2000 2003 2006 2009 2012
Source: Wood Mackenzie and Codelco.

After several years, during 2013, Codelco broke the upward trend in costs standing at the second quartile cut of the industry cost
200
DIRECT CASH COST (C1), CODELCO AND INDUSTRY QUARTILES
c/lb, currency of the year
160
180
200
3rd quartile cut
100
120
1402nd quartile cut
1st quartile cut
40
60
80
0
20
40
1985 1988 1991 1994 1997 2000 2003 2006 2009 2012
CODELCO
Copyrights © 2014 CODELCO‐CHILE. Todos los Derechos Reservados. | Copyrights © 2014 by CODELCO‐CHILE. All Rights Reserved.
Source: Wood Mackenzie and Codelco.

Since 2013, Codelco is engaged in a systematic effort to increase productivity and reduce costs
Maximize copper production through: • Identify opportunities that provide fine copper other than those defined in budgetOptimize
PRODUCTIVITYPRODUCTIVITY
STRUCTURAL PROJECT OF PRODUCTIVITY AND COSTS (PEPC) MODEL:DETAIL BY LEVER
• Identify opportunities that provide fine copper, other than those defined in budget • Visibility and closing the gaps of bottlenecks • Project of Breaks in Management
Promote initiatives to improve productivity:• Project of Third Party Service Productivity (PPST)
Communica
performance in critical path
Services • FTE and Productivity Measurement • Relationship with APRIMIN, CCHC, AGEMA and Mining Council • Management model based on KPI and Back Office (PGST)
Optimize budget management corporately:• Salaries
ation plan and tr
productivity
• Energy, supplies, materials and equipment • Energy efficiency • Contracts, services and strategic supplies• Third Party Services
Through savings on discretionary items, install a transverse message of cost
ransfer of good
Budget Optimization
g g y , gcontainment, including:• Vehicles• Consultancies • Service commissions• Cellphones
practices
Hygienic Factors
COSTSCOSTS
Copyrights © 2014 CODELCO‐CHILE. Todos los Derechos Reservados. | Copyrights © 2014 by CODELCO‐CHILE. All Rights Reserved.

Our challenge: to eradicate fatalitiesNumber of Fatalities and Rate, 2000 – 2014*
Number of fatalities Fatalities per million of hours‐worked0,1212
0,079
0,104
0,084 0,0850 08
0,10
8
10
0,076
0,054 0,053
0,06
0,08
6
8
0,038
0,0390,042
0,023
0,033
0,024
0 0170,02
0,04
2
4
0,0130,017
0,0002000 2001 2002 2003 2004 2005 2006 2007 2008 2009 2010 2011 2012 2013 2014
FAT k FAT t t FAT t t l t
Copyrights © 2014 CODELCO‐CHILE. Todos los Derechos Reservados. | Copyrights © 2014 by CODELCO‐CHILE. All Rights Reserved.
*: Year 2014 up to November 7.
FAT own workers FAT contractors FAT total rate

Environment and communities: PND 2014 goals and key success factors
50
SERIOUS AND VERY SERIOUS ENVIRONMENTAL INCIDENTS
GOALS
• Zero serious and very serious environmental incidents.
• Zero serious or very serious sanctions of EnvironmentSuperintendence.
• Zero community conflicts with impact on business continuity ori j t ti
20
30
40
50
in projects execution.
• Environmental and social approval of the Structural Projects.0
10
2008 2009 2010 2011 2012 2013 2014*
KEY SUCCESS FACTORS*: Year 2014 up to November 12.
2011 2014
ENVIRONMENTAL VULNERABILITIES • Closing gaps associated with the most critical environmentalvulnerabilities.
• Ensuring RCAs commitments.2011 2014
Total 92 40
More critical 55 14
• Environmental Risk System integrated to the operation.
• Application of standards and tools for community management:close linkage with more critical localities.
• Commitment of employees and the entire organization.
Copyrights © 2014 CODELCO‐CHILE. Todos los Derechos Reservados. | Copyrights © 2014 by CODELCO‐CHILE. All Rights Reserved.

CHILE‐JAPAN BUSINESS COMMITTEECHILE JAPAN BUSINESS COMMITTEECHILEAN COPPER MINING AND CODELCO CHALLENGES
Nelson Pizarro C
December 2nd, 2014
Nelson Pizarro C.CEO
Copyrights © 2014 CODELCO‐CHILE. Todos los Derechos Reservados. | Copyrights © 2014 by CODELCO‐CHILE. All Rights Reserved.