children ,-- redacted for privacy
TRANSCRIPT

AN ABSTRACT OF THE THESIS OF
NANCY JOSEPHINE WINSTON for the MASTER OF SCIENCE(Name) (Degree)
in Family Life (Child Development) presented on Ane)13J,1 11, 1971(Major) (Date)
Title: PEER ACCEPTANCE AND INTERACTION OF PRESCHOOL
,-- /72 ( ,707
Redacted for PrivacyCHILDREN
Abstract approved:jMary Massey
The purpose of this study was to explore the relationship
between social acceptance and observed peer interaction in a select
group of preschool children. The subjects were 30 children enrolled
in two sessions of a child development laboratory sponsored by the
Department of Family Life at Oregon State University. The 15 children
in the morning session, eight boys and seven girls, ranged in age from
three years-eight months to four years-three months. The 15 children
in the afternoon session, seven boys and eight girls, ranged in age
from three years-six months to four years-five months.
The data consisted of a social acceptance score taken from a
picture sociometric interview and observed behavior frequencies
recorded on the Social Interaction Scale (SIS). Peer interactions
observed include aggresive-hostile peer interaction and cooperative-
friendly peer interaction. The statistical analysis employed was the
Spearman Rank Correlation Coefficient (rs) method. The specific
null hypothesis explored was:
There will be no relationship between social acceptance and
a) aggressive-hostile peer interaction
b) cooperative-friendly peer interaction
c) total frequency of peer interaction
The correlation coefficients found between social acceptance
and aggressive-hostile peer interaction in the morning session were
positive and significant when analyzed for the sexes combined. A
negligible correlation coefficient (rs .035) was indicated for boys and
data revealed a tendency toward an inverse relationship (rs -. 471) for
morning girls. Negative, nonsignificant correlation coefficients were
found for the afternoon session when the variables of social accep-
tance and aggressive-hostile peer interation were analyzed for sexes
combined and for boys and girls separately.
An rs of .686 indicated a positive significant correlation coef-
ficient existing for the afternoon session when the variables of social
acceptance and cooperative-friendly peer interaction were analyzed
for sexes combined. No further significant correlation coefficients
were shown for the afternoon session when analyzed by sex groupings.
The correlation coefficients found for the morning session although
negligible were in a negative direction.
The Spearman Rank Correlation Coefficients calculated for the

variables of social acceptance and total frequency of peer interaction
were found to be significant only for the afternoon session. A positive
significant correlation coefficient, rs . 454, was found in the analysis
for the sexes combined and a negative significant relationship, rs
-.789, was found for boys. The correlation coefficient for the girls
was negligible. No significant correlation coefficients were indicated
for the morning session although there was a tendency toward a nega-
tive relationship when the session was analyzed for sexes combined
and for girls.
These findings indicate a need for further study of the relation-
ship between social acceptance and observed peer interactions. The
nature of the data collected in the present study provides avenues for
further research.
Peer Acceptance and Interactionof Preschool Children
by
Nancy Josephine Winston
A THESIS
submitted to
Oregon State University
in partial fulfillment ofthe requirements for the
degree of
Master of Science
June 1972

APPROVED:
Redacted for PrivacyAssistant Professor of Family Life /7
in charge of mar
Head of Department
Redacted for Privacy
Family Life
Redacted for Privacy
Dean of Graduate School
Date thesis is presented 11, '1971
Typed by Mary Jo Stratton for Nancy Josephine Winston

ACKNOWLEDGEMENT
The author wishes to extend her gratitude and appreciation to
each of the persons whose time and effort went into making this study
possible. Great appreciation goes to:
The students and preschool instructors who helped in the
collection of data: Miss Pam Jensen, Mrs. Ailene Dean, Mrs. Carol
O'Neill, Miss Marilyn Kidder;
The committee who participated in the Master's orals: Dr.
Mary Massey, major professor, Dr. J. P. O'Neill, and Dr. Alan
Sugawara.
Mr. Ken McCrae, Dr. J. P. O'Neill, Dr. Alan Sugawara and
Mr. Leonard Volenski for their time and effort with the data analyses
and the writing of the results.
Special thanks and appreciation are extended to Miss Ann
Burrows for her warm friendship, understanding and guidance through-
out my graduate study. To Dr. Mary Massey whose valuable time,
guidance and personal interest have made this study worthwhile and
enjoyable.
This study is dedicated to my parents who through their never
ending support on all levels have given me a love for learning and the
opportunity to complete my graduate study.

TABLE OF CONTENTS
2221
INTRODUCTION 1
Purpose of the StudyHypothesis 6
Definition of Terms 6
Assumptions 6
REVIEW OF LITERATURE 8
Sociometric Techniques Used withPreschool Children 8
Social Acceptance and AggressivePeer Interaction 12
Social Acceptance and CooperativePeer Interaction 15
Social Acceptance and Total Frequencyof Peer Interaction 17
Summary 18
METHODS 20
Subjects 20
Instruments 21
The Picture Sociometric Interview 22The Social Interaction Scale 26
RESULTS 33
Social Acceptance and Aggressive-Hostile Peer Interaction 34
Social Acceptance and Cooperative-Friendly Peer Interaction 35
Social Acceptance and Total Frequencyof Peer Interaction 37
Summary 41
SUMMARY AND DISCUSSION 43
Summary 43
Discussion 45

Limitations of the StudySuggestions for Further Research
BIBLIOGRAPHY
APPENDICES
Page
4950
53
58

LIST OF TABLES
Table Page
1 Description of subjects in the morningand afternoon session by age and sex. 20
2
3
4
5
6
7
8
9
Description of subjects in the morningand afternoon sessions by socioeconomicclass. 21
Behavior categories. 27
Correlation coefficients of socialacceptance and aggressive-hostilepeer interactions.
Frequencies, averages, and weightedaverages of aggressive-hostile peerinteractions.
Correlation coefficients of socialacceptance and cooperative-friendlypeer interaction.
Frequencies, averages, and weightedaverages of cooperative-friendlypeer interactions.
Correlation coefficients of socialacceptance and total frequency ofpeer interaction.
Frequencies, averages, and weightedaverages of total frequency of peerinteractions.
34
36
37
38
39
40

PEER ACCEPTANCE AND INTERACTIONOF PRESCHOOL CHILDREN
INTRODUCTION
According to Potashin (1946), for optimum mental health, it
is essential that every individual have or be capable of having inter-
personal relationships with peers. Since a high level of mental health
is the desired state of being for individuals, personality theorists as
well as social scientists have searched for the components of success-
ful interpersonal relations. This research has been done in hopes of
helping individuals to become well rounded, emotionally stable persons
who are capable of sound intergroup relationships (Justman and
Wrightstone, 1951). When studying interpersonal relationships,
researchers have turned to the origin of social groupings to determine
the variables involved in these relationships.
The investigation of peer relationships among young children
provides one approach to the study of interpersonal relationships. At
the age of three, the child is already developing likes and dislikes for
members of his peer group. Such an early social group can be seen in
the nursery school, where opportunities for both group and solitary
activities exist. Why some children are accepted by their peer group
and others are rejected or simply overlooked has plagued not only the
teacher, but researchers and parents as well.

2
Attempts to study children's actual feelings toward each other
have been done through sociometric research. Among these studies
are the following: Koch (1933); Hagman (1933); Lippitt (1941);
Moreno (1942); Frankel (1946); Marshall (1957); Marshall and
McCandless (1957a, b); McCandless and Marshall (1957a, b); and
Horowitz (1961). These studies attempted to determine not only what
a child's position was within his peer group, but also why this was so.
School-aged children served as subjects of early sociometric
research (Swift, 1964; Moore, 1967). The children responded to a
paper-and-pencil test which called for the child to "nominate"
members of their group for positions of prestige or favor. As the
early preschool years were found to be more appropriate for observa-
tion of group formation, the techniques of sociometric research took
on a new design. No longer would the paper-and-pencil technique
suffice, for the preschool child neither reads nor writes. New tech-
niques for testing social acceptance emerged. Direct observation of
the child's social participation was one technique explored (Frankel,
1946). The number and the types of social interactions elicited and
received by each child are tabulated. Another method developed was
the use of a brief individual interview. Several varieties were
designed: Koch (1933); Moreno (1942); Dunnington (1957a); McCandless
and Marshall (1957a). Usually the child is asked to name the peer or
peers with whom he would most like to play or participate in an

3
activity. The number of choices a child received from his peers is
recorded and the scores of the children then ranked from most fre-
quently chosen down to least chosen. This method did not, however,
differentiate between the child who is actually rejected by the group
and the child who is overlooked. To help in this differentiation,
methodology was expanded so that the child is asked also to name the
child or children with whom he does not want to play. These negative
points are then subtracted from the positive to give a sociometric
score which is then ranked.
To increase the effectiveness of sociometric interviews with the
preschool-aged child, two techniques are often used as aids to the
interview. The picture sociometric interview uses pictures of each of
the children in the group studied to help the child recall all of the
members of the group. The second technique often employed in an
interview is the paired comparison technique. A pair of children's
names are presented to the child and he is asked to choose his favorite
of the two children. These aids help the young child in his recall and
also make the activity of the interview itself fun for them (Koch, 1933;
Lippitt, 1941; Dunnington, 1957a).
Later studies became involved in relating other variables with
social acceptance. Variables studied have been: aggressive, imagina-
tive, and verbal behavior (Dunnington, 1957b; Marshall, 1961), social
participation and play preference (McCandless and Marshall, 1957b),

4
social behavior in the classroom situation (Booney and Powell, 1953),
dependence upon adults (Marshall and McCandless, 1957b), sex
differences (Marshall and McCandless, 1957b; Walters, Pearce and
Dahms, 1957).
Results from studies which investigated the relationship between
hostility and/or aggressive behavior and social acceptance have been
inconsistent. Lippitt (1941), Marshall and McCandless (1957a), and
Marshall (1961) concluded that hostile, aggressive interaction with
peers is not related to social acceptance. Koch (1933), Dunnington
(1957a), and Moore and Updegraff (1964), however, found indication
of low-status children displaying highly aggressive acts. Children of
high-status showed a greater proportion of positive, cooperative
affects than did the low-status children, and their aggressions tended
to be expressed within the context of dramatic play (Dunnington,
1957b). Positive, cooperative behavior has been found to be an
accompaniment and possible determinant of peer acceptance. The low
magnitude of correlations found in research, however, suggest that
other variables or factors must be important in predicting social
acceptance (Moore, 1967).
Although Dunnington's research (1967a, b) spurred the initial
emphasis on experimental, controlled investigation of specified
observed behaviors of preschool children as the dependent variable,
most of the studies since that time have been unpublished papers.

5
This indicates the need for further controlled investigation of social
acceptance and the variables affecting it. Since no "one" variable has
been found to be the only factor of peer acceptance, the question of
what constitutes social acceptance still remains. The inconsistent
results indicated by the research on aggressive behavior also is
indicative of the need for further examination of this variable to sub-
stantiate past research. Furthermore as the frequency of cooperative-
friendly behavior has tended to accompany social acceptance an inter-
relationship of cooperative-friendly peer interaction and aggressive-
hostile peer interaction may be operating in determining social
acceptance. This study focused upon the variables of aggressive-
hostile and cooperative-friendly peer interaction and their relationship
to peer acceptance.
Purpose of the Study
The purpose of this study was to explore the relationship
between social acceptance and observed peer interactions in a select
group of preschool children. Peer interactions observed include:
aggressive-hostile interaction with peers, and cooperative-friendly
peer interaction. These interactions were measured by the Social
Interaction Scale (SIS) (Volenski, 1971). Social acceptance was
derived from a picture sociometric interview developed originally by
McCandless and Marshall (1957a).

6
Hypothesis
Specifically, the hypothesis investigated was:
There will be no relationship between social acceptance and
a) aggressive-hostile peer interactions
b) cooperative-friendly peer interactions
c) total frequency of peer interaction
Definition of Terms
Operational definitions of terms in this thesis include:
Sociometric interview - a means for determining the degree to which
individuals are accepted within a group (Moreno, 1942)
Social acceptance - the degree of acceptance of a child in a group
formed by children of about the same age
Total frequency of peer interaction - the total composite score of
frequencies, for each individual child, of the peer interactions
measured by the SIS
Aggressive-hostile peer interaction - refers to contact with peer in a
negative verbal or nonverbal interaction (Volenski, 1971)
Cooperative-friendly peer interaction - refers to contact with peer in
a positive verbal or nonverbal interaction (Volenski, 1971)
Assumptions
1. The picture sociometric interview can be used to measure social

7
acceptance of preschool children (Dunnington, 1957a, b; Marshall,
1957; McCandless and Marshall, 1957a, b).
2. The Social Interaction Scale (SIS) can be used as a valid measure
of frequencies of certain observed peer interactions of preschool
children (Volenski, 1971).

8
REVIEW OF LITERATURE
Although sociometric techniques have evolved to a state of
complexity and diversity researchers must search out each technique
individually. A conceptualization is then devised for the particular
research project on the basis of sample and variables under study.
The focus of this study was preschool-aged children. There-
fore this review of the literature is limited to relevant research
regarding sociometric techniques used with preschool children. The
review of the literature then explores the research findings regarding
the relationship between social acceptance and the variables of
aggressive-hostile peer interaction, cooperative-friendly peer inter-
action, and total frequency of peer interaction.
Sociometric Techniques Usedwith Preschool Children
The analyses of social acceptance in groups have utilized a
variety of methods. Early studies focused primarily upon the school-
aged child. Investigators typically administered paper-and-pencil
tests, which called for the child to "nominate" members of his peer
group for positions of prestige or favor (Moore, 1967). Paper-and-
pencil techniques often called for the child to rate his peers on their
social ability or adequacy (Hollander, 1965). In studying the preschool
child, it became evident that they could not respond to this form of

9
sociometric test, for they did not have the ability to either read or
write. Experimenters working with young children began exploring
other techniques for eliciting sociometric choices.
The establishment of a method for studying preschool friend-
ships in a reliable fashion was needed to contribute to the behavioral
sciences. Many methods have been explored since the early studies
of the 1930's. These studies sought a better method for inferring
social acceptance in a preschool group. One method explored was to
observe the child's social participation directly, tabulating the number
and types of social movements the child both makes and receives from
his peers (Challman, 1932; Frankel, 1946; Jennings, 1950; Lippitt
and Gold, 1959). Observers using this technique first had to identify
the relevant behaviors to be observed and define the categories of
behavior well enough to assure agreement between independent
observers. Observing for the most part used a time-sampling tech-
nique in which the child is observed for a specific interval of time,
usually two to five minutes. A code is set up to record the relevant
behaviors studied. The observations often included such aspects of
peer interaction as teacher dependence, hitting, and whining (Frankel,
1946). The observations are repeated as a reliability test. This
method although time consuming and expensive, has proven to be a
valuable instrument for studying the young child (Moore, 1967).
Brief individual interviews have also been used as an

10
experimental approach to the study of social status. Sociometric
interviews usually ask the child to name a particular child or children
with whom they would most like to play in a specified activity: "Who
would you like to play with outside ?". The situations are chosen to
be relevant to the peer group studied (Dunnington, 1957a, b;
McCandless and Marshall, 1957a; Moore, 1967). In Moore's (1967)
review of the literature, validity and reliability have been found to be
dependent upon the child's ability to focus his attention on the entire
group at one time, and his ability to recall his impression of each
member in the group.
The paired comparison technique is another of the methods
developed to aid researchers in interviewing young children. This
method asks the child to select his favdrite child from a given pair of
children's names from the group. Each child's name is paired once
or twice with the name of every other child in the group. The pairs
of names are given in quick but not fast succession (Koch, 1933;
Lippitt, 1941; Dunnington, 1957a). The question to the child is usually
stated: "Which do you like better, Mary or Ann?". The wording is
often rearranged slightly to hold the young child's interest. This
method was found to work best with no more than 20 name pairs a
session and under 15 children per group.
Still another form of sociometric interview has been used with
the young child, the picture sociometric interview developed by

11
McCandless and Marshall (1957a). The examiner uses a board con-
taining pictures, head and shoulders only, of each child within the
peer group being studied as an aid. The child is taken individually
into an isolated room and seated beside the interviewer in front of the
picture board. First the child is asked to find his picture on the board,
then to identify the other children in his group. This is done so the
child becomes personally interested in the activity and also to help the
child recall the members of his group (McCandless and Marshall,
1957a; Moore, 1967). Next the child is presented with a series of
select criteria questions and asked to choose a child or children he
would most like to participate in the activity presented: "Who would
you like to play with outside ?". The child chooses from the board by
either naming the child or children or pointing to their photographs.
This method seems to be of interest to the child and is felt to supply
worthwhile information on sociometric status (McCandless and
Marshall, 1957a, b; Marshall and McCandless, 1957a; Moore and
Updegraff, 1964). Miller (1960) indicated in his review of the litera-
ture that preschool children could not be depended on to recall all of
the members of their social group, thus pictures would help the young
child in their ability to recall and to select peers.
In a study by Hagman (1933), the child made a decision about
whom in his group he would give the prize of a toy fish. This tech-
nique is based on the notion that actions speak louder than words.

12
After playing the "fishing game" in an isolated experimental room, the
child is allowed to keep one of the five fish won for himself and then
is asked to choose four children to receive the other four fish. The
four children chosen are considered to be his personal preferences.
In Moore's (1967) review of the literature, she felt there was one draw-
back to this method, determining if the choices were made for reasons
other than personal preference; for instance, to pacify an aggressor.
The variety of sociometric techniques available indicate the
need for the person doing sociometric research to explore the
methods more in depth so they might choose one appropriate to their
individual project and group. Each researcher must decide for him-
self which of the methods available would suit his particular study and
sample (Northway and Weld, 1957).
Social Acceptance and AggressivePeer Interaction
Studies of aggressive behavior in children have been conducted
by a number of investigators with inconsistent results. Researchers
(Lippitt, 1941; Marshall and McCandless, 1957a) concluded there was
no relationship between observed hostility, aggression in the nursery
school and social acceptance. Three other investigators have shown
negative correlations between aggression and social acceptance. This
indicates for these particular studies that children with low social

13
acceptance displayed highly aggressive behavior (Koch, 1933;
Dunnington, 1957a; Moore and Updegraff, 1964). Two of the three
studies (Koch excluded) elicited both positive and negative choices to
the criteria questions. Moore (1967) suggested that the differences in
method of these studies and those of Lippitt (1941) and Marshall and
McCandless (1957a) might account for the difference in findings as
. . . there is some evidence to suggest that aggression ismore closely related to the number of times a child isselected as a disliked peer than to the number of timeshe is selected as a liked peer (Moore, 1967, p. 290).
In the study by Dunnington (1957a), the degree of social
acceptance was obtained in a verbal interview in which 15 preschool
children were asked to name peers with whom they did or did not like
to play at school. In order to secure responses of accumulative rather
than temporary nature, subjects were interviewed immediately upon
their arrival at nursery school before they had become active in the
group situation. Aggression was measured by each child's participa-
tion in two 20-minute doll play sessions. The child's projective
storytelling themes as well as his handling of the toys were scored on
a number of dimensions, one of which was aggression. Findings
indicated that highly accepted children when compared to those with
low acceptance showed a greater degree of positive nonaggressive
behavior relative to negative behavior in their doll play themes and
actions (Swift, 1964). Aggression shown by the highly accepted

14
children was in general "specific to its origin, " indicating the aggres-
sions displayed in doll play were more often directed at appropriate
objects rather than displaced to innocent victims or other inappropriate
objects (Dunnington, 1957a).
Dunnington also found that the aggressions of high popularchildren, compared with low popular children, was morelikely to be "thematic" in type; that is it was more likely tofollow reasonable provocation or in some other way appearsensible within the context of the doll play (Moore, 1967,p. 291).
This research indicated a need for considering the quality and quantity
of aggression that is shown by a nursery school child when relating
aggression to social acceptance. The tendency to aggressively attack
was found to be negatively correlated with social acceptance, as
measured by a paired-comparison technique (Koch, 1933). To
aggressively attack was defined as hostile behaviors such as "strikes
and pushes and pulls others" exhibited during free play situations.
Moore and Updegraff (1946) found results consistent with Koch although
their measure of aggression involved peer-rating rather than observa-
tion. The children were asked to select members of their nursery
school class they judged as showing aggressive acts which include the
behaviors involved in hitting, hurting, and saying angry things.
Scores were computed into an Aggressiveness Scale and correlated
with social acceptance. In six nursery school groups, the relation
was consistently negative; correlations ranging from -. 21 to -.78 with
three of the groups being over -.50.

15
When determining the degree to which aggressive acts contribute
to a child's social acceptance the intensity of the aggression as well as
the degree of physical threat to the victim is also in need of study.
Two assumptions given in studies of aggression which have not been
systematically studied area The more violent the aggressive act, and
the more the promise of physical pain, the more this would detract
from a child's social acceptance. Aggression aimed at easily
frightened children would appear to detract more from a child's social
acceptance than aggression at a less frightened child. "Both variables
take into account the amount of pain or distress caused by a given
aggressive act" (Moore, 1967, p. 291).
Aggression, like cooperation or friendliness, is not a perfect
predictor of social acceptance. Studies reviewed indicate highly
accepted children also display aggression, although their aggression
tended to be more directed and purposeful and low to moderate in
amount when compared to their positive interaction with peers.
Campbell and Yarrow (1961) felt from their research the hypothesis
could be offered that a "child's aggressive interaction in the context of
accompanying friendly behavior is in fact socially valued within the
peer culture" (p. 18).
Social Acceptance and CooperativePeer Interaction
Social behavior has been studied by means of variables relating

16
directly to the status of the individual in the group and also by means of
variables relating to social-interactions (Swift, 1964). Few early
studies attempting to relate special behavior to social acceptance found
many social variables to predict group status (Koch, 1933; Lippitt,
1941). More promising and informative results have been found in
recent studies which have improved techniques for gathering observa-
tional data as well as techniques for assessing social acceptance. In
Moore and Updegraff's study (1964) of sociometric status of pre-
schoolers, the children were asked to respond to 30 statements, spread
throughout the interview, which described various aspects of a child's
social behavior. To assess friendly approach, the children were asked
to select someone who a) is very friendly to the other children, b) likes
to play near the other children, c) helps peers when they are hurt or
sad, and d) talks with the other children a lot. The same or different
person could be chosen for each item (Moore, 1967). After the items
were combined into a Friendly Approach Scale, the scores were
correlated with the children's sociometric scores. The correlations
for six different groups of children ranged from . 24 to .48 (Moore and
Updegraff, 1964).
The consistency of this relation from group to groupsuggests that friendliness (in this case "perceived friend-liness") is one of the accompaniments of popularity andmay be one of its determinants, but the low magnitude of thecorrelation suggests that other factors must also be importantin predicting popularity (Moore, 1967, p. 286).

17
Using the picture-board sociometric technique and recording
social behavior of children in a nursery school free play period,
McCandless and Marshall (1957a) attempted to determine what variables
contributed to social acceptance. Children's social overtures were
observed and recorded for four categories of behavior: Friendly
approach, associative play, conversation, and hostility. The
researchers found no relation between social acceptance, measured
by positive choices given during the sociometric interview, and the
amount of conversation or amount of hostility displayed during the
free play observation. Significant correlations were found between
social acceptance and friendly approach and associative play. These
correlations were positive indicating that the children who frequently
showed friendly approach, and participated in associative play, also
had high popularity scores (Moore, 1967).
From the research reviewed, social acceptance seems to be
related to friendly, cooperative behavior. The correlations of these
studies are, however, relatively low, indicating other variables are
present in the acquisition of peer acceptance.
Social Acceptance and Total Frequencyof Peer Interaction
From the studies reviewed, it has become evident that the more
actively a child participates within his peer group, the more he will
be recognized by his peers (Gregory, 1943; Campbell and Yarrow,

18
1961; Moore, 1967). Research has indicated that a child's social
acceptance is related to the degree and direction of the outgrowing
energy. Preschool children with this outward energy and initiative are
found to be more highly chosen when these qualities are present in such
a degree that they stimulate rather than overpower the person doing
the choosing (Gregory, 1943).
The more popular, socially acceptable child has been described
to be the least distracted from peer activity, to be an active participant
in associative play with his peers. The negatively valued child on the
other hand usually shows much less total initiated or disruptive
activity. The results on aggressive behavior indicates not only the
frequency of the negative or hostile interaction, but the quality or
direction to do physical harm or to give a command, is also important
to understanding aggression's role in the acquisition of social
acceptance (Campbell and Yarrow, 1961).
Summary
Discovery of the characteristics making up interpersonal skill
has been the goal of many researchers. The studies reviewed have
explored some of the behaviors believed to be, in part, responsible
for a child's effectiveness in social interactions. The fact that no
"one" factor can be now determined as the "cause" of a child's
acceptance or rejection by his peer group has been established,

19
leaving many areas and variables open for further research and
investigation. All of the studies have indicated the extreme importance
of studying a variety of interpersonal relations for determining a child's
status within his peer group.

20
METHODS
Subjects
The data analyzed in this study were collected from 40 pre-
school children enrolled in two sessions of a child development
laboratory sponsored by the Family Life Department at Oregon State
University. The total enrollment of 40 students was available for
study but due to absences the sample size was reduced. Fifteen
children, eight boys and seven girls, in the morning session and 15
children, seven boys and eight girls, in the afternoon session com-
prised the total sample. Table 1 gives the description of the morning
and afternoon sessions by age and sex.
Table 1. Description of subjects in the morning andafternoon session by age and sex.
Characteristic NMean age
(year /months)
Morning session
Total 15 3-8Boys 8 3-8Girls 7 3-8
Afternoon session
Total 15 3-9Boys 7 3-9Girls 8 4-0

21
The families from which the subjects of this study came were
predominately middle class as measured by Hollingshead's (1957)
"Two Factor Index of Social Position. " Information for this index was
taken from the home information sheets filled out by the parents upon
their child's acceptance into the child development program. The
subjects in this study were distributed among the following socio-
economic class positions as indicated in Table 2.
Table 2. Description of subjects in the morning andafternoon sessions by socioeconomic class.
Socioeconomicclass morning afternoon
I (upper) 7 8
II 4 6
III 2 1
IV 2 0
V (lower) 0 0
Total 15 15
Instruments
Two instruments were used to collect the data for the present
study: A picture sociometric interview (McCandless and Marshall,
1957a), and The Social Interaction Scale (SIS) developed by Volenski
(1971). The data from the SIS was collected as part of a larger
research project in the Department of Family Life at Oregon State
University.

22
The Picture Sociometric Interview
The picture sociometric interview was first developed by
McCandless and Marshall (1957a) as a means for measuring social
acceptance. Sociometry is concerned with discovering the preferred
relationships which exist within a group at a point in time. In the
picture sociometric interview, each child is asked to select preferred
playmates by either naming or pointing to their picture. The selection
is made during an individual interview. Three choices are encouraged
for each criteria question asked; these questions pertain to activities
the child actually experiences within the preschool program and which
serve as criteria for choice. The activities included in the question-
ing are: outside play, inside play, and juice time. Specific wording of
each question appears in Appendix A.
Positive as well as negative choices are elicited for each question
in order to better differentiate between those children who are actively
rejected by their peers and those that are simply overlooked. The
disliked child will receive more of the negative choices and therefore
appear at the end of the acceptance continuum while the passed over
child will remain in the middle, neither rejected nor accepted by
their group.
Reliability of the Test. With sociometry, only the criterion of
choice is held constant while the interpersonal relationship or

23
behavior, on the basis of which choice is made, varies with each
judge and the judges are expected to vary in their ratings. Therefore,
no standard measure of reliability is available for the sociometric
technique. The reliability of the interpersonal variable or behavior
must be studied rather than the reliability of the test (Pepinsky, 1949).
Validity of the Test. There is no measure of validity available
for the sociometric interview. Since the technique is concerned with
discovering preferred choice or relationship existing in a group at a
point in time, and each individual tested discloses his own and honest
preference, the technique is held to be valid (Moreno, 1942; Jennings,
1950; Marshall, 1957; Northway and Weld, 1957).
The Testing Room. A small room adjacent to the main class-
room of the nursery school was used as the interviewing room. All of
the subjects were photographed and interviewed individually in this
room. The room had windows on two sides, shoulder height to the
interviewer, and was well lit. A low bench and two child-size chairs
were placed in the room. Only one subject and the interviewer were
present in the room during the testing period. The child was seated
in one of the small chairs facing the bench which supported the picture
board at the child's eye level.
Photographing of the Children. The children were approached
individually and asked if they would like to have their picture taken so
the investigator may use it later with them to play a game. Specifically,

24
the investigator approached each child and said:
(Child's name), I brought my camera with me today, would you
like me to take your picture? I will play a game with you later
using the pictures of all of the children in the nursery school.
Most of the children responded willingly the first time they were
approached. The children that were involved with an activity were
asked again at a more appropriate time. The subjects were approached
three times before assistance from the head teacher was sought.
The investigator photographed each of the children individually,
in color using a Polaroid 100 Land Camera, with flash. No attempt
was made to encourage the children to smile in order to have as
normal a facial expression as possible. The photographs were taken
from the waist up and measured 3-1/4" x 4- 1 /4 ". They were mounted
in rows of four on a piece of white tag-board, 22" x 28". Photograph
placement was assigned by randomization with replacement process.
One board was constructed for the morning session and one for the
afternoon.
Presentation of the Picture Sociometric Interview. In this study,
the interview was administered individually by the researcher to each
child. All of the children were asked to participate:
(Child's name), I have the pictures I took of all of the
children, would you like to come see them and play a game
with me?

25
All of the children were asked individually to participate in the "game"
and were not forced to do so. One subject and the interviewer were
present in the testing room at one time.
The child was seated in front of the picture board, and the inter-
viewer to his right holding a tally sheet on which she indicated each
child's choices (Appendix A). First, the child was asked to identify
his own picture from those on the board then to identify the pictures of
the other children shown. This was done to help the child become
personally involved in the task and also to help him to recall and place
his attention on each child in his peer group.
The child was next presented with three criteria questions.
Presentation order was determined by randomization with replacement
technique, which elicited the child's choice of playmate for three
different activities: outside play, inside play, juice time. The specific
wording of each question appears in Appendix A. Both positive and
negative choices were elicited for each of the three situations pre-
sented. These choices were made from the picture board by either
naming or pointing to the child selected. The choices were taken down
by the interviewer and later the score for each child was calculated
from the positive and negative votes given by the other children.
Collection of the data was done over a four-day period, allowing
for absences. Initial rapport was established the week prior to the
photographing and interviewing by the interviewer taking an active part

26
in the preschool program. The interview time per child was approxi-
mately seven minutes, and took place during the preschool program's
free play session.
Scoring Procedure. The scoring procedure for a positive-
negative sociometric technique was calculated by subtracting the child's
negative votes from his positive votes, yielding a composite score that
ranged from high positive (liked) to high negative (disliked). Composite
scores were then arranged in a continuum from most liked to most
disliked, highest positive score to highest negative score. The con-
tinuum was calculated separately for the morning and the afternoon
sessions.
The Social Interaction Scale
The Social Interaction Scale was developed by Volenski (1971) to
provide a measure of children's social behavior, specifically, peer
interaction. Since peer interaction, aspects of aggressive and
cooperative behavior toward peers specifically, was the focus of this
study, it is important to operationally define these behaviors. Table 3
lists the categories of behavior used by Volenski to classify cooperative
and aggressive behaviors.
The criteria utilized by Volenski (1971) for the selection of the
categories were: that they be easily recognizable in the process of
social interaction and that they must be comprehensive enough to

27
Table 3. Behavior categories.
Categories Description
Cooperative contact with peers: refers to contact with peers in a positive verbal or nonverbal interaction
(CP) Cooperative play: play or activity with peers; compliance with peer request; attentive to peer.(PP) Positive Ihysical Contact: Child touches another child in a friendly or affectionate manner,
e. g. , hug, pat, kiss, arm around shoulder, holding hands, ruffling hair, etc.(TP) Talking with Peer: Child talks, asks questions, gives directions, approval, praise, in general
any verbal exchange including giving commands or answering.(HP) Helging Peer: Helping, offering help, or actually assisting a peer, also sharing, cleaning up
after peer or doing things for peer.(CC) Compliant Behavior: In general, any friendly behavior toward peer, including following peer,
mimicing, or following directions, complying with peer requests (mere compliance withoutbeing involved in cooperative play, activity).
Aggressive contact with peer (instigation): refers to contact with peer in a negative verbal or nonverbalinteraction
(BA) Bodily Attack: Hits, punches, kicking, biting, punching, pushing, choking and grabbing.(NP) Attack with an Object: Hits with stick, throws block, runs into with bike, etc.(NV) Verbal or Symbolic: Verbally threatens; also include derogations, assertive demands, or
threatening gestures.(IN) Infringement of Property or Invasion of Territory: Takes toy, disrupts play, etc.
Victim of Aggression (response consequence)
(PA) Passive: Does not respond to aggression, or withdraw, gives up toy, etc.(CR) Cries: Includes whining, etc.(DP) Defensive Posture: Covers head; also includes verbal protest; child does not give up property,
moves away.(TE) Telling Teacher(RP) Recover Property: Grabs truck back from aggressor, etc.
Noncooperative Interaction: Child disengages himself from cooperative interaction with peer.
(IG) Ignores: Not attending, ignores or generally disinterested.(WD) Withdrawal: Moves away when approached by peer; leaves peer group taking play material with
him, for solitary activity; refuses to join in peer activity (solitary).(NC) Noncompliant: refuses to follow peer's direction, unfriendly or rejects peer's attempt at
interaction; refuses to join in cooperative play.
Independent Activity (ID): any activity which does not involved interaction with peer or teacher, mostgenerally solitary play.
Teacher Interaction (TI): activity which involves interaction with teacher, for example, group time,attending to teacher.

28
cover the behaviors that would ordinarily occur during the daily
activities of a nursery school program.
The cooperative and noncooperative behavioral categories were
defined after observations by a trained psychologist at the Oregon State
University Child Development Laboratory. The observation of peer
interactions were recorded and classified into the categories of non-
cooperative and cooperative behavior described in Table 3.
The aggressive behavioral categories were based upon a study
done by Patterson, Littman and Bricker (1967) which recorded 2, 583
aggressive acts and their consequences, in the natural setting of two
nursery schools. When the child acted as the instigator of an aggres-
sive act, the peer interaction was labeled aggressive and when the
child felt the response to an aggressive act, he was labeled the victim
of aggression.
Validity. Examination of the behavioral categories for content,
by three Child Development Specialists all experienced in preschool
education and holding the Ph. D. degree, and three full time nursery
school teachers, with the M, A. degree, were used to further deter-
mine whether the SIS covered a representative sample of the behaviors
to be measured. In addition to this examination, the instrument was
used during a series of "trial" observations to establish whether peer
interactions were being properly sampled by the categories listed.
These procedures provided sufficient evidence for the content and

29
construct validity of the SIS, and also established its usefulness for
measuring peer interaction in a nursery school setting (Volenski,
1971).
Training of Observers. Six advance undergraduate students who
had courses in Child Development and practical experience at the child
development laboratory were trained as observers. During three 2-
hour sessions, the trainees were oriented to the observational sched-
ule (SIS) and assisted in differentiating the various interactions
observed among preschool children. They also practiced the recording
of behavior in 15-second time intervals, using video tapes of pre-
school children from an earlier observational study at Florida State
University. The six observers were able to record during the same
time interval with the aid of an electronic device. The device emitted
a light and a sound every 15 seconds.
After the initial training sessions, the observers were randomly
assigned into two groups. Each group visited, for a two-week period,
a laboratory setting in which they would not be collecting data. There
they simultaneously observed children's behaviors and classified
those behaviors at 15-second time intervals. The electronic device
was used to insure consistency of the time intervals. Questions and
clarification continued in meetings with the researcher until he was
confident of their knowledge of the categories and recording system.
Observer Reliability. The data for observer reliability were

30
collected by the observers returning to the same laboratory settings
in the same two groups of three. They collected data, one 5-minute
observation, on each of two children again using the electronic device.
The percentage of agreement method (Walters, 1965) was the statistic
used to analyze these data as a measure of reliability.
The computation entailed comparisons of each observer's obser-
vational record with the observational record of each other observers
so that all possible combinations were considered. The reliabilities
for the two groups of three observers simultaneously viewing and
independently recording behaviors ranged from .85 to 1.00 with a
mean of . 90.
Collection of Data (SIS). The observational data were collected
at the Orchard Street Child Development Laboratory on the Oregon
State University campus. The observers were stationed so as to
permit maximum coverage of the play area without blocking the normal
flow of school activities. All observers were carefully instructed to
avoid eye contact and interaction with the children, hopefully dis-
couraging the children from directing their activity toward the
observer. Before the actual recording sessions, the observers spent
six to eight hours over a two-week period in the child development
laboratory so that the children became accustomed to their presence
at the school.
Each of the observers was equipped with a battery run

31
tape recorder which emitted a sound audible only to the observer
every 15 seconds, and a writing board with forms of The Social
Interaction Scale (SIS) for listing the coded social behavior (Appendix
B). Recording was divided into six 5-minute intervals, during which
time the social interactions of one subject were recorded under the
appropriate coded behavior. A limit of two behavioral frequencies
were recorded at each interval; therefore, the total frequency during a
five -minute sample ranged from 20-40. For 30 minutes of observa-
tion the frequency yielded between 120-240 behavior frequencies.
Sampling periods included three free play activities and three
group activities. Free play time allowed the child to choose his
activity, group activities were designated as music, story time and
lunch. All data were collected within a two-week period after maxi-
mum interobserver reliability had been established to minimize
observer bias. Each observer focused on one preassigned subject and
began recording when the subject was near or began to interact with a
peer. The recording was continuous for the time interval even though
the child might have changed activity or remained at the same activity
throughout the observational period.
Scoring. The frequencies were totaled under each behavior
classification for the six 5-minute observations revealing a behavior
profile which was expressed as relative frequencies of response under,'
each classification. Then a total was computed for each category.

32
The cooperative was comprised of cooperative play (CP), positive
physical contact (PP), talking with peer (TP), helping peer (HP), and
compliant behavior (CC). Bodily attack (BA), attack with an object
(NP), verbal or symbolic attack (NV), and infringement of property or
invasion of territory (IN) were totaled to yield the aggressive inter-
action category. Victim of aggression (response consequence)
included the behaviors of being passive (PA), crying (CR), holding a
defensive posture (DP), telling the teacher (TE), and recovering
property (RP). The category of noncooperative interaction included
ignoring (IG), withdrawing (WD), and noncompliant behavior (NC).
These relative frequencies were used in comparison with social
acceptance rank of each child within the group as determined by a
sociometric interview technique. This study did not use the data
concerning independent activity and teacher interaction. These
categories were deleted due to the focus upon peer interactions.

33
RESULTS
Analysis of data was accomplished by use of the Spearman Rank
Correlation Coefficient (rs) method. Analysis was carried out by
session and sex groupings for the three sets of variables indicated in
the hypothesis. The .05 level of significance was chosen as the
criterion for the statistical analysis employed.
Peer interaction frequencies were measured by the Social Inter-
action Scale (SIS). The aggressive-hostile peer interaction category
referred to contact with peers in a negative verbal or nonverbal
interaction. The category of cooperative-friendly peer interaction
encompassed contact with peers in a positive verbal or nonverbal
interaction. To obtain a total frequency of peer interaction, the
frequencies recorded in the aggressive-hostile peer interaction cate-
gory and those recorded in the cooperative-friendly interaction cate-
gory were added. The frequencies recorded by the SIS for the cate-
gories of noncooperative peer interaction and victim of aggression
were not used in the data analysis due to the low frequencies and dis-
persion of the data. Raw data for each individual behavior frequency
by category appears in Appendix C.
A further breakdown of the data was indicated on the basis of
the obtained correlation coefficients. Therefore, frequency totals,
averages and weighted averages for the peer interaction categories by
session and sex groupings were computed. The average frequencies

34
reflect group size and the weighted averages refer to the number of
children who account for the frequency totals in each breakdown. The
frequencies were also separated into free play and group time, as
several earlier studies only utilized free play observations of peer
interactions (Koch, 1933; McCandless and Marshall, 1957a). Fre-
quencies for the noncooperative peer interaction and the victim of
aggression categories appear in Appendix D and E, respectively.
Social Acceptance and Aggressive-Hostile Peer Interaction
Spearman Rank Correlation Coefficients for the variables of
social acceptance and aggressive-hostile peer interaction analyzed by
session are reported in Table 4.
Table 4. Correlation coefficients of social acceptance andaggressive-hostile peer interactions.
Session Sexescombined Boys Girls
Morning
Afternoon
.435*(N=15)
-.081(N=15)
.035(N=8)
-.035(N=7)
-.471(N=7)
-.019(N=8)
*P < .05
A significant positive correlation coefficient was found for the
morning session with the sexes combined, indicating for this particular
group a positive relationship (rs . 435) existing between the degree of

35
social acceptance and the frequency of aggressive-hostile peer inter-
action. The correlation coefficient for the afternoon session, although
negligible, was in a negative direction (rs -.081). Data on girls in
the morning session show a tendency toward an inverse relationship
between social acceptance and aggressive-hostile peer interaction
(r -.471). Correlation coefficients for sex groupings were not
statistically significant for either session.
When frequencies of aggressive-hostile peer interaction were
broken down and averages and weighted averages calculated (Table 5),
it appeared that boys in the morning session were responsible for a
larger proportion of the aggressive-hostile peer interactions than
were girls. This also held true for the afternoon session. The
aggressive-hostile interactions for boys appeared predominantly during
the free play time for the morning session and during group time for
the afternoon session.
Social Acceptance and Cooperative-Friendly Peer Interaction
Spearman Rank Correlation Coefficients relating the variables of
social acceptance and cooperative-friendly peer interaction appear in
Table 6.
The significant positive correlation coefficient (rs .686) found
for the afternoon session with sexes combined indicated a significant
positive relationship between social acceptance and cooperative-

Table 5. Frequencies, averages, and weighted averages of aggressive-hostile peer interactions.
Sexes combined Boys GirlsGrouping Free Group
play timeTotal Free
playGrouptime Total
Freeplay
Grouptime
Total
Morning session
Frequency 18.000 8.000 26.000 12.000 5.000 17.000 6.000 3.000 9.000
Average 1.200 .533 1.767 1.714 .62S 2.125 .857 .429 1.286(N=15) (N=15) (N=15) (N=8) (N=8) (N=8) (N=7) (N=7) (N=7)
Weighted 2.000 2. 000 2. 600 2. 400 1. 667 2.833 1.500 3.000 2. 250average (N=9) (N=4) (N=10) (N=5) (N=3) (N) (N=4) (N=1) (N=4)
Afternoon session
Frequency 9. 000 16. 000 25. 000 4. 000 14. 000 18.000 S. 000 2. 000 7. 000
Average . 600 1. 067 1. 667 . S71 2.000 2.571 . 625 . 250 . 875(N=15) (N=15) (N=15) (N=7) (N=7) (N=7) (N=8) (N=8) (N=8)
Weighted 1. 286 3. 200 2. 778 1. 333 4. 667 4.500 1. 250 1. 000 1. 400average (N=7) (N=5) (N=9) (N=3) (N=3) (N=4) (N=4) (N=2) (N=5)
37
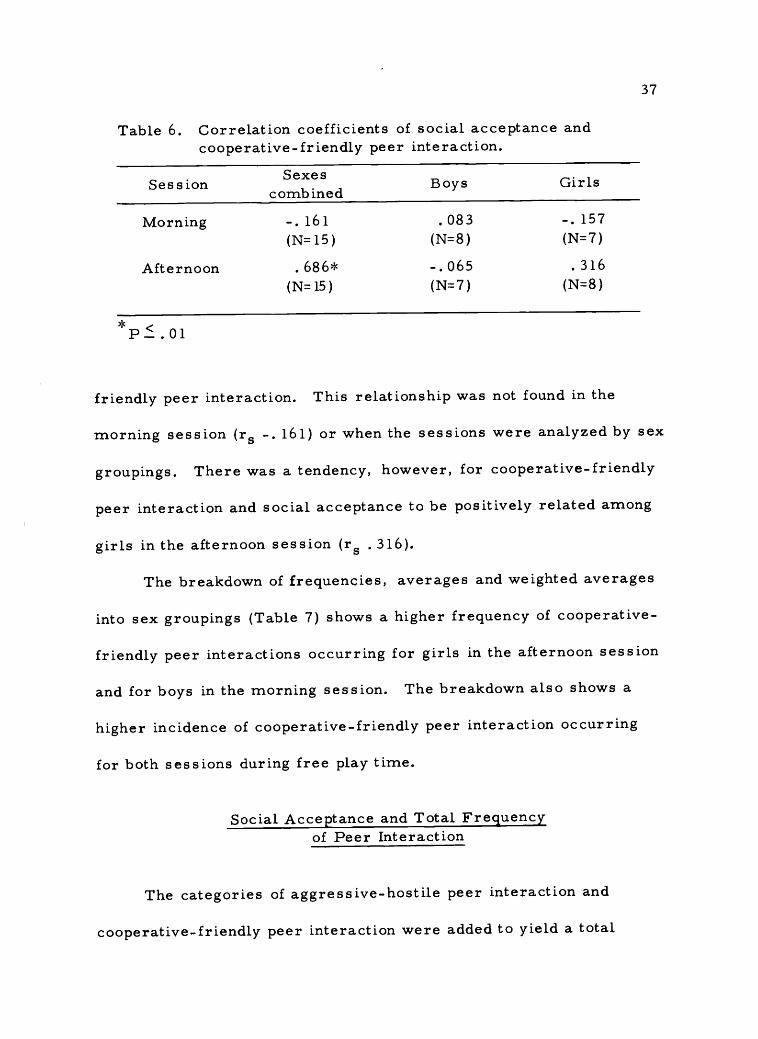
Table 6. Correlation coefficients of social acceptance andcooperative-friendly peer interaction.
Session Sexescombined Boys Girls
Morning -.161 .083 -. 157(N=15) (N=8) (N=7)
Afternoon . 686* -.065 . 316(N=15) (N=7) (N=8)
*P<.01
friendly peer interaction. This relationship was not found in the
morning session (rs -. 161) or when the sessions were analyzed by sex
groupings. There was a tendency, however, for cooperative-friendly
peer interaction and social acceptance to be positively related among
girls in the afternoon session (rs . 316).
The breakdown of frequencies, averages and weighted averages
into sex groupings (Table 7) shows a higher frequency of cooperative-
friendly peer interactions occurring for girls in the afternoon session
and for boys in the morning session. The breakdown also shows a
higher incidence of cooperative-friendly peer interaction occurring
for both sessions during free play time.
Social Acceptance and Total Frequencyof Peer Interaction
The categories of aggressive-hostile peer interaction and
cooperative-friendly peer interaction were added to yield a total

Table 7. Frequencies, averages, and weighted averages of cooperative-friendly peer interactions.
GroupingSexes combined
Free Groupplay time
Total
BoysFree Groupplay time Total
GirlsFree Groupplay time
Total
Morning session
Frequency 818.000 231. 000 1049. 000 459.000 1 23. 000 582. 000 35 9. 000 108.000 467. 000
Average 5 4. 533 15.400 69. 933 37. 375 15.375 72. 750 51. 285 15.428 66. 71 4(N=15) (N=15) (N=15) (N=8) (N=8) (N=8) (N=7) (N=7) (N=7)
Weighted 5 4. 533 15.400 69.933 57.375 15.375 72.750 51.28S 15.428 66. 71 4average (N=15) (N=15) (N=15) (N=8) (N=8) (N=8) (N=7) (N=7) (N=7)
Afternoon session
Frequency 738. 000 114. 000 85 2. 000 255. 000 53. 000 308.000 483. 000 61.000 5 44. 000
Average 49. 200 7. 600 56. 800 36. 428 7. 571 44.000 60. 375 7. 675 68.00
Weighted 52. 71 4 7. 600 56. 800 37.500 7. 5 71 44.00 60. 375 7.67S 68.000average (N =14) (N=15) (N=15) (N=6) (N=7) (N=7) (N=8) (N=8) (N=8)

39
frequency of peer interaction. Spearman Rank Correlation Coefficients
for the variables of social acceptance and total frequency of peer
interaction appear in Table 8.
Table 8. Correlation coefficients of social acceptance andtotal frequency of peer interaction.
Session Sexescombined Boys Girls
Morning -. 298 .065 -. 386(N=15) (N=8) (N=7)
Afternoon .454* -. 798* .071(N=15) (N=7) (N=8)
*P< .05
A significant positive correlation coefficient (rs . 454) was found
in the afternoon session with the sexes combined, indicating a signifi-
cant positive relationship between social acceptance and total fre-
quency of peer interaction. A significant negative correlation coeffi-
cient, however, was obtained for boys in the afternoon session regard-
ing these two variables (rs -. 798). No significant correlation
coefficients were found for the morning session, although data on
girls in this session show a tendency toward an inverse relationship
between social acceptance and total frequency of peer interaction (rs
-.386).
A breakdown of the frequencies, averages and weighted averages
for the category of total frequency of peer interaction (Table 9)

Table 9. Frequencies, averages, and weighted averages of total frequency of peer interaction.
GroupingSexes combined
Free Groupplay time
Total
Boys
Free Groupplay time
Total
GirlsFree Groupplay time
Total
Morning session
836.000
55. 733(N=15)
69. 666
239.000
15. 933(N=15)
23. 900
1075. 000
69. 933(N=15)
80. 692
471.000
58. 875(N=8)
67. 285
128.000
16.000(N=8)
21. 333
599.000
74. 875(N=8)
85.571
365. 000
52. 142(N=7)
60. 833
111.000
15.857(N=7)
27.750
476.000
78. 000(N=7)
79. 333
Frequency
Average
Weightedaverage (N=12) (N=10) (N=13) (N=7) (N=6) (N=7) (N=6) (N=4) (N=6)
Afternoon session
Frequency 747.000 130.000 877. 000 259.000 67.000 326.000 488.000 63.000 476.000
Average 49. 800 26.000 58. 466 37.000 9.571 46. 571 61.000 7.875 68. 875
Weighted 67.909 13.000 73.083 51. 800 13.400 54. 33 3 81. 333 12.800 78. 714average (N=11) (N=10) (N=12) (N=5) (N=5) (N=6) (N=6) (N=5) (N=7)

41
indicates a higher frequency of peer interaction occurring for boys in
the morning session and for girls in the afternoon session. The
frequencies for both sexes occurred predominately during free play
time for both sessions.
Summary
Data were analyzed using the Spearman Rank Correlation Coef-
ficient (rs) method. Few significant correlation coefficients were
found when analyzing the data by session and for sex groupings. A
significant positive correlation coefficient regarding the relationship
between social acceptance and aggressive-hostile peer interaction was
found in the morning session with the sexes combined (rs .435). No
significant correlation coefficients were found regarding this relation-
ship in the afternoon session or when either session were analyzed by
sex groupings.
A significant positive correlation coefficient was found regarding
the relationship between social acceptance and cooperative-friendly
peer interaction in the afternoon session with the sexes combined (rs
. 686). No significant correlation coefficients were found regarding
this relationship in the morning session or when either session was
analyzed by sex groupings. With respect to the relationship between
social acceptance and total frequency of peer interaction, a significant
positive correlation coefficient was found for the afternoon sessions

42
(rs . 454) with the sexes combined, and a significant negative correla-
tion coefficient was found for boys in the afternoon session (rs -. 789).
No other significant correlation coefficients were found.

43
SUMMARY AND DISCUSSION
Summary
The subjects of the present study were 30 children attending two
sessions of a child development laboratory established by the Depart-
ment of Family Life at Oregon State University. The 15 children in
the morning session, eight boys and seven girls, ranged in age from
three years-eight months to four years-three months. The 15 children
in the afternoon session, seven boys and eight girls, ranged in age
from three years-six months to four years-five months.
The purpose of this study was to explore the relationship between
social acceptance and observed peer interactions. Peer interactions
observed included aggressive-hostile peer interactions and cooperative-
friendly peer interactions. Specifically, the hypothesis explored was:
There will be no relationship between social
acceptance and
a) aggressive-hostile peer interaction
b) cooperative-friendly peer interaction
c) total frequency of peer interaction
A picture sociometric interview and the Social Interaction Scale
were the instruments used to measure social acceptance and the
peer interactions. Data were analyzed using the Spearman Rank
Correlation Coefficient (rs) method. Few significant correlation

44
coefficients were found when analyzing the variables by session and by
sex groupings.
The results of this study may be summarized as follows:
1) The Spearman Rank Correlation Coefficient obtained between
social acceptance and aggressive-hostile peer interaction,
cooperative-friendly peer interaction, and frequency of peer
interaction were inconsistent among sessions. Therefore the
null hypothesis may be held tenable for the sample studied.
2) Few significant correlation coefficients were obtained. Those
found seemed to emphasize differences between the two pre-
school sessions chosen for the study.
3) A positive significant correlation coefficient for the morning
session was indicated for social acceptance and its relationship
to frequency of aggressive-hostile peer interaction when the
session data were analyzed for the sexes combined. No other
significant correlation coefficients were found for the morning
session.
4) The rs values obtained for the afternoon session showed a
positive significant relationship existing between social
acceptance and cooperative-friendly peer interaction, and total
frequency of peer interaction for the sexes combined. A signifi-
cant negative correlation coefficient was found between social
acceptance and total frequency of peer interaction among boys.

45
No other significant correlation coefficients were found for the
afternoon session.
Discussion
The main assumption upon which the present study was based is
the notion that a high level of mental health is the desired state of being
for individuals. Furthermore, for optimum mental health, it seems
essential that every individual have or be capable of having positive
interpersonal relationships with his peers (Potashin, 1946).
The investigation of peer relationships among young children
provides one approach to the study of interpersonal relationships. The
peer interactions explored in the present study were aggressive-
hostile peer interaction, cooperative-friendly peer interaction and
total frequency of peer interaction and their relationship to social
acceptance.
Studies of aggressive-hostile peer interaction in children have
been conducted by a number of investigators with inconsistent results.
Lippitt (1941); Marshall and McCandless (1957a) have concluded there
was no relationship between observed hostile-aggressive behavior in
nursery school children and social acceptance. Three other investi-
gators have shown a negative relationship between aggression and
social acceptance, indicating that children with low social acceptance
displayed highly aggressive behavior (Koch, 1933; Dunnington, 1957a;

46
Moore and Updegraff, 1964). Moore (1967) suggested in her review of
the research that
. . there is some evidence to suggest that aggression ismore closely related to the number of times a child isselected as a disliked peer than to the number of timeshe is selected as a liked peer (p. 290).
The correlation coefficients found between aggressive-hostile
peer interaction and social acceptance in the present study indicated
a significant positive relationship for the morning session and a
negative, although negligible, relationship for the afternoon session.
Such a discrepancy may suggest that the teacher variable may be
operative in influencing how children in both sessions are preceiving
the social acceptability or unacceptability of aggressive behavior.
No measure of teacher behavior was employed in this study suggesting
a major limitation regarding this investigation.
The positive relationship between aggressive-hostile peer inter-
action and social acceptance found in the morning session might also
be due to the quality of the aggressive act, rather than the quantity of
the aggression shown. From observational data collected in the present
study it would be impossible to run correlations for the aggressive-
hostile behavior category breakdown, due to the low frequencies of
aggressive behavior shown. If such an analysis could be carried out,
it might have given an indication of the differences existing between the
two preschool sessions regarding the quality or kind of aggressive
behavior observed.

47
Another possible reason for the differences found between the
two sessions might be the total number of "easily frightened" children
in each session. Moore (1967) suggested that aggression aimed at
"easily frightened" children would appear to detract more from
aggressive children's social acceptance than it would in groups with a
lower number of "easily frightened" children. A negative correlation
coefficient would then theoretically show a higher percentage of
"easily frightened" children receiving the aggressions of the group and
influencing the number of negative votes the aggressors would receive
on a sociometric interview. It would therefore seem necessary,
when attempting to relate aggressive-hostile peer interaction to
social acceptance, to have a measure of the quality, as well as the
quantity, of the aggressive act shown and, furthermore, to know what
type of child toward whom the aggression was directed.
The positive relationship postulated in the research existing
between social acceptance and cooperative-friendly peer interaction
was borne out only for the afternoon session in the present study.
Analysis of the breakdown for the cooperative-friendly behavior
category might reveal certain cooperative behaviors which are them-
selves more indicative of social acceptance than all of the behaviors
combined into a single category. A high level of such a behavior
would cause one session to appear as more socially acceptable, when

48
in actuality it is one or two specific behaviors which are determining
the acceptance.
The assumption from past research that the more a child
participates within his peer group, the more he will be recognized by
his peers (Gergory, 1943; Campbell and Yarrow, 1961; Moore, 1967)
suggests a relationship existing between social acceptance and total
frequency of peer interaction. Social acceptance has been found to
be related to the degree and direction of a child's total outgoing energy.
The correlation coefficients found in the present study offer data only
partially supporting this relationship. A significant positive relation-
ship was found for the afternoon session when analyzed for sexes
combined, and a negative, nonsignificant relationship was indicated
for boys alone. No significant correlation coefficients were found for
the morning session; however, there was a tendency for the data from
the morning girls to show an inverse relationship between social
acceptance and total frequency of peer interaction.
The correlation coefficients on total frequency of peer inter-
action and social acceptance follow the pattern indicated by the
relationships between social acceptance and the first two variables of
the hypothesis when the following assumption is taken into account.
Preschool children who display outward directed energy and initiative
are found to be more highly chosen when these qualities are present in
such a degree that they stimulate rather than overpower the person

49
doing the choosing (Gregory, 1943). It would seem that the afternoon
session with a higher degree of cooperative-friendly peer interaction
would have a positive correlation coefficient when the total frequency
of peer interaction was related to social acceptance. Conversely,
for the morning session, with a high degree of aggressive-hostile
peer interaction, there would be a negative correlation coefficient
between the total frequency of peer interaction and social acceptance.
The studies exploring the relationship between social acceptance
and total frequency of peer interaction including Dunnington (1957a),
McCandless and Marshall (1957a), Moore and Updegraff (1964), and
the present study, concur that no "one" factor can be delineated as
the "cause" or primary determinant of a child's social acceptance.
Further research is needed in this area to ensure representative
observations of each child's social interactions with his peers.
Limitations of the Study
Several limitations are indicated for the present study. These
limitations may be operating individually or together to influence the
relationship found among the variables for the two preschool sessions
studied. One factor which might have influenced the social acceptance
measure is the lack of a retesting to ascertain the reliability of the
sociometric interview. The positions of the children on the social
acceptance continuum may have varied, causing a change in the
correlation coefficients found.

50
Limitations regarding the observational data include the small
sample size and the low level of behavior frequencies found. An
observational period twice as long as that of the present study would
secure a larger frequency count, enabling analysis for all categories
of peer interaction. The possibility of observer bias must also be
considered. A measure of reliability among all six observers would
eliminate the possibility of such bias occurring.
Another limitation to the present study is the lack of a measure
of teacher behavior. The uncontrolled teacher variable might have
explained further some of the differences existing between the two
preschool sessions, An observational schedule of the teacher's
behaviors, specific reinforcement patterns and teaching practices
would add valuable information on the total environment in which the
child interacts. The variation in the relationships between the variables
found in the present study might also be the result of assuming that the
two different sessions observed were relatively similar in program and
teacher philosophy. Such an assumption was questionable on the basis
of the data collected in the present study. This factor is an important
variable to consider if the SIS is used to correlate two or more groups
with another test or behavior variable.
Suggestions for Further Research
As a result of this study on social acceptance and its relationship

51
to peer interactions of preschool children, suggestions can be made
for further research. Present results indicated a need for the
expansion of the behavioral categories used in the research instrument.
Such research might include the addition of a measure for teacher
behavior, taken as the children's behaviors are also being observed.
This measure would allow for inferences regarding the type and
quality of the preschool program examined. Possible teacher bias
might appear which would have an extensive influence upon the
children's perception or reactions to certain variables, for example
aggressive-hostile behaviors. The possible inclusion of a longer
observational period would seem to expand the frequencies reported
and hopefully allow all of the variables studied to undergo statistical
analysis. Further delineation of behavioral frequencies for the cate-
gories of independent activity and teacher interaction would refine and
clarify the group time data.
The use of the sociometric instrument for measuring social
acceptance although lacking specific reliability and validity, proved
useful in the present study. Suggestions for sociometrics in future
research are that the techniques be examined individually for the type
of research being conducted and the specific sample to be studied.
For preschool subjects involved in the present study, the picture
sociometric interview held the children's attention and seemed to
be of interest to them. A retest measure would be advisable to ensure

52
the reliability of the children's choices. Measurement of behavioral
characteristics as possible determinants of social acceptance seems
a valuable avenue for further research into interpersonal relationships.
The present study used a composite sociometric score. In this
particular study all of the children received either a positive or a
negative vote. In future research, data analysis might include an
individual analyses for positive scores, negative scores, and composite
scores. This then would present a more complete view of the dyna-
mics of social acceptance.

53
BIBLIOGRAPHY
Anderson, J. E. 1939. The development of social behavior. TheJournal of Sociology 44:839-857.
Bandura, A. and R. H. Walters. 1963. Social learning and person-ality development. New York, Holt, Rinehart and Winston.329 p.
Body, M. K. 1955. Patterns of aggression in the nursery school.Child Development 26:3-11.
Booney, M. E. 1946. A sociometric study of the relationship ofsome factors to mutual friendships on the elementary, secon-dary, college levels. Sociometry 1:21-48.
Booney, M. E. and J. Powell. 1953. Differences in social behaviorbetween sociometrically high and sociometrically low children.Journal of Educational Research 46:481-494.
Budden, J. A. 1943. Study of the degree of consistency of socialacceptability of preschool children in a nursery school setting.Unpublished student research, Institute of Child Study Library,University of Toronto. (Cited in: Northway, M. L. 1943.Social relationships among preschool children abstracts andinterpretation of three studies. Sociometry 6:429-435)
Campbell, D. T. 1960. A rationale for weighing first, second, andthird sociometric choices. In: The Sociometry Reader byJ. L. Moreno. Illinois, The Free Press. p. 137-138.
Campbell, J. D. and M. R. Yarrow. 1961. Perceptual andbehavior correlates of social effectiveness. Sociometry 24:1-20.
Challman, R. C. 1932. Factors influencing friendship among pre-school children. Child Development 3:146-158.
Dunnington, M. J. 1957a. Investigation of areas of disagreement insociometric measurement of preschool children. ChildDevelopment 28:93-102.
1957b. Behavioral differences of sociometricstatus groups in a nursery school. Child Development 28 :103-111.

54
Fiske, D. W. and J. A. Cox, Jr. 1965. The consistency of ratingsby peers. Journal of Applied Psychology 49:434-438.
Fite, M. D. 1940. Aggressive behavior in young children andchildren's attitudes toward aggression. Genetic PsychologyMonographs 22:151-319.
Frankel, E. B. 1946. The social relationships of nursery schoolchildren. Sociometry 9:210-225.
Gregory, M. 1943. A study of children's behaviors with chosencompanions in an experimental play situation. Master'sthesis. Toronto, University of Toronto. (Cited in: Northway,M. L. 1943. Social relationships among preschool childrenabstracts and interpretation of three studies. Sociometry 6:429-433)
Hagman, E. P. 1933. The companionship of preschool children.Studies in Child Welfare 7:1-69.
Hollander, E. P. 1965. Validity of peer nominations in predicting adistant performance criteria. Journal of Applied Psychology49:434-438.
Hollingshead, A. B. 1957. A two factor index of social position.New Haven, Connecticut. 11 numb, leaves. (mimeographed)
Hoffman, L. W. and M. L. Hoffman (ed. ), 1964. Review of childdevelopment research. Volume I, New York, Russell SageFoundation. 547 p.
1966. Review of child development research.Volume II. New York, Russell Sage Foundation. 597 p.
Horowitz, F. D. 1961. Latency of sociometric choice among pre-school children. Child Development 3 2: 235 - 24 2.
Jennings, H. H. 1950. Leadership and isolation. New York,Logmans, Green and Co. 349 p.
Justman, J. and J. W. Wrightstone. 1951. A comparison of threemethods of measuring pupil status in the classroom. Educationaland Psychological Measurement 11:362-367.

55
Koch, H. L. 1934. Popularity in preschool children. ChildDevelopment 5:164-175.
Lemann, T. B. and R. L. Solomon. 1952. Group characteristics asrevealed in sociometric patterns and personality ratings.Sociometry 15:17-90.
Lippitt, R. 1941. Popularity among preschool children. ChildDevelopment 12:306-332.
Lippitt, R. and M. Gold. 1959. Classroom social structure as amental health problem. Journal of Social Issues 15:40-58.
Marshall, H. R. 1957. An evaluation of sociometric social behaviorresearch with preschool children. Child Development 28 :131-137.
Marshall, H. R. and B. R. McCandless. 1957a. A study in predictionof social behavior of preschool children. Child Development28:149-159.
1957b. Relationships between dependence on adultsand social acceptance by peers. Child Development 28:413-419.
McCandless, B. R. and H. R. Marshall. 1957a. A picture socio-metric technique for preschool children and its relation toteacher judgements of friendships. Child Development 28 :139-147.
1957b. Sex differences in social acceptance andparticipation of preschool children, Child Development 18:421-425.
Miller, D. R. 1960. Motivation and affect. In: Handbook of researchmethods in child development, ed. by P. H. Mussen. New York,Wiley. p. 688-769.
Moore, S. G. 1967. Correlates of peer acceptance in nursery schoolchildren. Young Children 22:281-297.
Moore, S. G. and R. Updegraff. 1964. Children's sociometricstatus and their social behaviors as perceived by peers.Unpublished manuscript, University if Minnesota. (Cited in:Moore, S. G. 1967. Correlates of peer acceptance in nurseryschool children. Young Children 22:281-297)

56
Moreno, F. B. 1942. Sociometric status of children in a nurseryschool group. Sociometry 4:395-411.
Moreno, J. L. (ed. ). 1960. The sociometry reader. Illinois, TheFree Press. 773 p.
Mussen, P. H. (ed. ). 1960. Handbook of research methods in childdevelopment. New York, Wiley. 1061 p.
Northway, M. L. 1943. Social relationships among preschoolchildren abstracts and interpreation of three studies. Socio-metry 6:429-433.
1946. Sociometry and some challenging problemsof social relationships. Sociometry 9:187-198.
1952. A primer of sociometry. Canada, Universityof Toronto Press. 48 p.
Northway, M. L. and L. Weld. 1957. Sociometric testing. Canada,University of Toronto Press. 72 p.
Pepinsky, P. N. 1949. The meaning of "validity" and "reliability"as applied to sociometric tests. Educational and PsychologicalMeasurement 9:39-49.
Potashin, R. A. 1946. A sociometric study of children's friendships.Sociometry 9:48-70.
Snedecor, G. W. and W. G. Cochran. 1967. Statistical methods.Ames, The Iowa State University Press. 593 p.
Swift, J. W. 1964. Effects of early group experience: the nurseryschool and day nursery. In: Review of child developmentresearch. Volume I. ed. by L. W. Hoffman and M. L.Hoffman. New York, Russell Sage Foundation. p. 249-288.
Volenski, L. 1971. Parental attitudes and children's social behavior.Ph. D. thesis. Corvallis, Oregon State University. (Notcompleted)
Walters, J., D. Pearce and L. Dahms. 1957. Affectional andaggressive behavior of preschool children. Child Development28:15-26.

57
Walters, J. C. 1965. Unpublished material on percentage ofagreement. Tallahassee, Florida State University. 2 numb.leaves.
Young, L. V. and D. H. Cooper. 1944. Some factors associatedwith popularity. The Journal of Educational Psychology 35:513-535.
APPENDICES

APPENDIX A
SOCIOMETRIC TEST
Name Session M A Date1. Who do you like to play with inside?
1.
2. who else ?
3. and who else?2. Who do you not like to play with inside?
1.
2. who else?3. and who else?
3. Who do you like to play with outside ?
1.
2. who else?3. and who else?
4. Who do you not like to play with outside?
1.
2. who else?3. and who else?
5. Who would you like to sit next to at juice?
1.
2. who else ?
3. and who else?6. Who would you not like to sit next to at juice?
1.
2. who else ?
3. and who else?
58

Subject
APPENDIX B
SOCIAL INTERACTION SCALE
Observer
PlaceDateTime
Interval CP Cooperative playPP Positive physical contactTP Talking with peerHP Helping peerBA Bodily attackNP Negative physical attack
with objectNV Verbal attackIN Infringement of property
or invasion of territory
1
23
45
67
8
9
1011121314151617181920
59
PA Passive when attackedCR CriesDP Defensive postureTE Telling teacherRP Recover propertyIG IgnoresWD Withdraws from playCO CompliantNC Non-compliantID Independent activityTI Teacher interaction
CP PP TP HP BA NP NV IN PA CR DP TE RP IG WD CO NC ID TI

APPENDIX C
Behavioral frequencies of subjects as measured by the Social Interaction Scale.
Subject
Cooperativepeer
interaction
Aggressivepeer
interactionVictim of
aggress ion
Noncoopera-tive peer
interactionCP PP TP HP CC BA NP NV IN PA CR DP TE RP IG WD NC
AB1 40 0 41 0 5 2 0 0 6 1 0 0 0 0 0 1 1
AB2 49 0 42 0 5 0 0 0 0 2 0 0 0 0 0 0 0
AB3 49 0 27 0 3 0 0 0 0 1 1 0 0 0 0 1 0
AB4 57 0 42 0 8 2 0 0 0 0 0 1 0 0 0 2 1
AB5 18 0 10 1 15 0 1 0 1 1 4 1 1 0 0 0 0
AB6 34 0 16 0 7 1 0 0 0 0 1 4 0 1 0 1 0AB7 33 0 22 0 4 2 0 0 0 1 5 0 0 0 0 0 0
AB8 35 0 11 2 2 0 0 0 2 1 10 1 0 1 0 0 0
AG1 53 0 27 1 5 0 0 0 1 0 0 0 0 0 0 0 0
AG2 35 0 37 0 6 0 0 0 0 0 0 0 0 1 0 1 0
AG3 25 0 9 5 14 0 2 1 2 1 1 0 0 0 0 0 0
AG4 26 0 12 1 20 0 0 0 0 0 1 2 0 0 2 1 0
AG5 48 0 21 1 2 0 0 0 0 1 0 0 0 0 1 0 0
AG6 31 0 10 0 1 1 0 0 1 0 0 0 0 1 0 1 0
AG7 37 3 35 0 4 0 0 0 1 0 0 1 0 0 0 0 0
Totals 570 3 362 11 101 8 3 1 14 9 23 10 1 4 3 8 2
(Continued on next page)

Appendix C. (Continued)
Subject
Cooperativepeer
interaction
Aggressivepeer
interaction
Victim of Noncoopera-aggress ion tive peer
interactionCP PP TP HP CC BA NP NV IN PA CR DP TE RP IG WD NC
PB 1 0 0 0 0 0 0 0 0 0 1 0 1 0 0 0 0 0PB2 35 0 13 0 0 0 1 0 1 0 0 0 0 0 0 0 0PB3 49 0 2 0 13 0 0 0 0 0 0 0 0 0 1 0 0PB4 20 0 7 0 0 0 1 0 0 0 0 0 0 0 0 0 0PB5 44 4 16 0 0 7 0 0 2 1 0 2 0 0 1 0 0PB 6 52 0 9 0 4 0 0 0 0 0 0 0 0 0 0 0 0PB7 22 0 24 0 1 4 0 0 2 0 1 0 0 0 0 1 0
PG1 36 0 33 0 11 0 0 0 2 0 0 0 0 1 0 0 0PG2 18 0 7 0 2 0 0 0 1 0 0 1 0 1 0 0 0PG3 32 2 44 0 1 1 0 0 1 0 1 0 0 0 0 0 0PG4 45 19 3 1 0 1 0 0 0 1 0 1 0 1 0 0 0PG5 42 2 24 0 0 0 0 0 0 1 0 1 0 0 0 0 0PG6 53 1 18 0 1 0 0 0 0 1 2 3 0 0 0 0 0PG7 52 0 14 0 0 1 0 0 0 0 0 4 0 0 0 0 0PG8 58 0 22 0 2 0 0 0 0 0 0 0 0 0 0 0 0
Totals 558 28 236 1 38 14 2 0 9 5 4 13 0 3 0 0 0
AB - morning boysAG - morning girls
PB - afternoon boysPG - afternoon girls

APPENDIX D
Frequencies, Averages and weighted averages of noncooperative peer interaction.
GroupingSexes combined Boys Girls
Freeplay
Grouptime Total
Freeplay
Grouptime
TotalFreeplay
Grouptime
Total
Morning session
Frequency 7.000 6.000 13. 000 3.000 4.000 7.000 4.000 2.000 6.000
Average . 467 .400 . 867 . 375 .500 . 85 7 . 571 . 286 . 857(N=15) (N=15) (N=15) (N=8) (N=8) (N=8) (N=7) (N=7) (N=7)
Weighted 1.000 2.000 1. 625 1.000 2.000 1. 750 1.000 2.000 1.500average (N=7) (N=3) (N=8) (N=3) (N=2) (N=4) (N=4) (N=1) (N=4)
Afternoon session
Frequency 1. 000 1. 000 2. 000 1.000 1. 000 2. 000 0. 000 0. 000 0.000
Average . 067 . 067 .133 . 143 .143 . 286 0.000 0. 000 0. 000(N=15) (N=15) (N=15) (N=7) (N=7) (N=7) (N=8) (N=8) (N=8)
Weighted 1. 000 1. 000 1. 000 1.000 1. 000 1.000 0.000 0. 000 0.000average (N=1) (N=1) (N=2) (N=1) (N=1) (N=2) (N:0) (N::1) (NZI)

APPENDIX E
Frequencies, averages and weighted averages of victim of peer interactions.
GroupingSexes combined Boys Girls
Freeplay
Grouptime
Total Freeplay
Grouptime
Total Freeplay
Grouptime
Total
Morning session
Frequency 41.000 7.000 48.000 36.000 3.000 39.000 5.000 4.000 9.000
Average 2.733 . 467 3.200 4.500 . 375 4.875 . 714 . S71 1.286(N=15) (N=15) (N=15) (N=8) (N=8) (N=8) (N=7) (N=7) (N=7)
Weighted 3.416 1.000 3.416 5.142 1.000 4.875 1.000 1.000 1.000average (N=12) (N=7) (N=14) (N=7) (N=3) (N=8) (NS) (N=4) (N=6)
Afternoon session
Frequency 20.000 7.000 27.000 4.000 2.000 6.000 16.000 S. 000 21.000
Average 1.333 .467 1.800 .571 .286 .857 2.000 .714 2.675(N=15) (N=15) (N=15) (N=8) (N=8) (N=8) (N=7) (N=7) (N=7)
Weighted 2.222 2.333 2.700 1.333 2.000 2.000 2.667 2.500 3.000average (N=9) (N=3) (N=10) (N=3) (N=1) (N=3) (N=6) (N=2) (N=7)