childhood lead poisoning in galveston, texas: background · childhood lead poisoning in galveston,...
TRANSCRIPT

B A C K G R O U N D

C H I L D H O O D L E A D P O I S O N I N G I N G A LV E S T O N , T E X A S12
B A C K G R O U N D
WHAT IS LEAD?
Lead (Pb) is a heavy, low melting, bluish-gray metal that occurs naturally in the Earth’s crust (7). It is actually a relatively uncommon metal, compared with the two most abundant metals: aluminum and iron (7), and is usually found combined with two or more other elements to form lead compounds. Most commonly it is found in its +2 oxidation state, combined with other substances to form compounds such as galena (PbS), anglesite (PbSO4) and cerussite (PbCO3) (154). Because of its wide availability, durability, malleability, and low melting point (low enough to melt in a camp fire), humans have been using lead for numerous purposes since ancient times (166). Indeed, environmental lead levels have increased more than 1,000-fold over the past three centuries alone, with the greatest increase occurring between the years 1950 and 2000—reflecting the increasing worldwide use of leaded gasoline (7). Currently the U.S. leads the world in the production of refined lead (one third of the world’s reserves are in North America), as well as in the consumption of lead, using 1.3 million tons of lead in 1980—approximately 40% of the worlds supply. In 1986, lead was the fifth most used metal in the U.S. (286). Most lead used by industry comes from mined ores (“primary”) or from recycled scrap metal or batteries (“secondary”). In the U.S., lead is mined primarily in Alaska and Missouri. However, most lead today is “secondary” lead obtained from lead-acid batteries. It is reported that 97% of these batteries are recycled (7).
HISTORy OF LEAD USE AND REGULATION
Lead has been used for more than 2000 years (7,166). The Romans, for example, used lead to build their aqueducts and water pipes, sweeten food and preserve wine (171), and the use of leaded type in the 15th century made mass printing possible. In more recent history, lead has been used extensively in the U.S. and elsewhere. Lead and lead alloys are commonly found in pipes, storage batteries, weights, shot and ammunition, cable covers, and radiation sheets. The largest use for lead is in storage batteries in cars and other vehicles. Lead was also added to most interior and exterior oil house paints for most of the 20th century as pigment and to increase durability and coverage. Lead tetroxide is a strong red pigment, often used as a primer to control rust and in fireworks. Lead chromate is a strong yellow pigment still used for highway stripes. Prior to 1950, paints contained as much as 50% lead by dry weight. Lead compounds are also used as a pigment in dyes, and ceramic glazes and in caulk, although the amount of lead used in these products has been reduced in recent years. Tetraethyl lead and tetramethyl lead were once extensively used in the U.S. as gasoline additives to increase octane rating and to “reduce engine knocking.” Lead is still
used in gasoline in many developing countries. The use of lead in ammunition, which is the largest non-battery end-use, has remained fairly constant in recent years. Lead, generally as lead arsenate, has also been used as a pesticide especially in orchards (7). A more detailed discussion of the sources of exposure is addressed in the section, “Sources of Lead Exposure,” beginning on page 14.
Despite its known toxicity and increasing levels of lead in the environment, efforts to curb its use have been slow. Indeed, its usefulness, profitability and sweet taste appear to have contributed to the Romans—and others much more recently—consciously minimizing its known adverse health effects, despite mounting medical evidence about lead’s extensive and often irreversible toxicity. Nriagu and others have suggested that lead poisoning, also called “plumbism,” contributed to the downfall of the Roman empire. He estimates that Roman aristocrats ingested roughly 180 µg of lead daily (219). If accurate, this level of lead would have had significant physiological consequences, including anemia, neurological symptoms, depressed sperm count, and impaired pregnancy and fetal development. The characteristic features of acute lead poisoning—anemia, colic, neuropathy, sterility and coma—were first described by Hippocrates and Nicander during the 5th and 2nd centuries BC, respectively (219). In 1904, an Australian physician, J. Lockhart Gibson, published the first warnings of the toxic effects of lead-based paint in children (106), and five years later France, Belgium and Austria became the first countries to ban leaded paint. Most other European nations as well as Cuba and Australia phased out lead-based paint in the 1920s and 1930s. In 1922, League of Nations members signed an agreement forbidding the use of white lead interior paint. The U.S. did not join in the prohibition. Massachusetts banned lead paint that year, but the lead industry helped to engineer a repeal. The National Lead Company and other white-lead producers continued to maintain that lead paint was not harmful. During the 1920s, these companies produced 200,000 tons of white lead a year, making the U.S. the world’s largest lead producer. In 1928, to combat undesirable publicity about lead’s health hazards, the companies formed the Lead Industries Association, a trade group of white-lead manufacturers to promote and defend its use. “It’s very clear from the lead industry’s own documents that it did everything it could to obscure the dangers associated with lead in paint and gasoline for as long as it possibly could,
“Environmental lead levels have increased more than 1,000-fold over the past three centuries alone, with the greatest increase occurring between the years 1950 and 2000—reflecting the increasing worldwide use of leaded gasoline.”

C H I L D H O O D L E A D P O I S O N I N G I N G A LV E S T O N , T E X A S 13
B A C K G R O U N D
and it was very successful,” says Dr. Jerome Paulson, associate professor of pediatrics and public health at George Washington University and co-director of the Mid-Atlantic Center for Children’s Health and the Environment (225). In 1977, the U.S. Consumer Product Safety Commission (CPSC) issued a final ban on lead-containing exterior and interior residential paint and lead-based paint on toys and furniture (Table 1). This regulation, which went into effect in 1978, lowered the allowable amount of lead in paint to 0.06 percent, a level conforming to the maximum amount permissible under the Lead-Based Paint Poisoning Prevention Act. This Act, administered primarily by the Department of Housing and Urban Development (HUD), prohibits application of lead-based paint to housing constructed or rehabilitated with federal assistance. Exempted from the ban are mirrors backed with lead-containing paint that are part of articles of furniture, artists’ paints, certain agricultural and industrial coatings, touch-up coatings for appliances and lawn and garden equipment, graphic arts coatings, roadway paint, and certain coatings for powered model aircraft. In 1992, the U.S. Congress passed the Residential Lead-Based Paint Hazard Reduction Act of Title X of the Housing and Community Development Act, expanding on previous efforts (166). In addition, the Federal Hazardous Substance Act (FHSA) bans children’s products containing hazardous amounts of lead. The recent realization that many children’s vinyl lunch boxes had significant levels of lead added as a stabilizer to the vinyl is an example of a non-paint children’s product covered under the FHSA. See also “Sources of Lead Exposure: Other Sources” on page 20.
Many countries, however, continue to manufacture and sell lead-based paints that would be prohibited in the U.S. and in many other countries. One study found that more than 75 percent of the consumer paint tested from countries without controls on lead paint—representing more than 2.5 billion people—had levels exceeding U.S. regulations. About 50 percent of the paint sold in China, India and Malaysia had lead levels 30 times higher than U.S. regulations would allow. Children’s toys and other items imported from these countries can have high lead levels. In 1923, tetraethyl and tetramethyl lead were introduced as a gasoline additives. In addition to increasing the octane of gasoline, leaded gasoline also protected exhaust valve seats, in vehicles designed to operate on leaded gasoline, from excessive wear. Despite the president of the National Lead
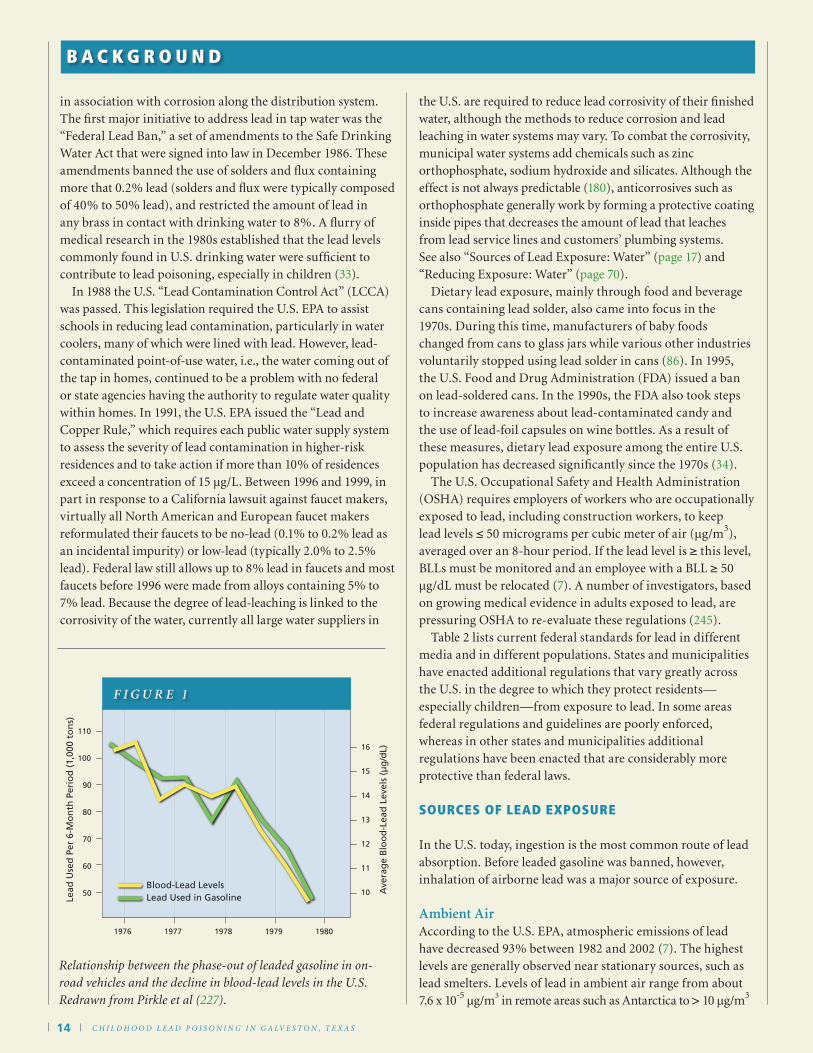
Company acknowledging in 1921 that lead is toxic (147), and despite the deaths of 15 workers involved in the manufacture of the gasoline additive in 1924, the U.S. Surgeon General found insufficient evidence to support a ban on leaded gasoline (171). It was not until the early 1970s that researchers were able to demonstrate conclusively that exposure to airborne lead from gasoline combustion was a public health threat. In 1973, the U.S. Environmental Protection Agency (EPA) ordered a gradual phase-out of leaded gasoline, which led to a complete ban of the use of leaded gasoline in on-road vehicles by 1996. In 1979, cars released 200 million pounds of lead into the air in the U.S. In 1989, when the use of lead was limited but not banned, cars released only 4.8 million pounds to the air. Current U.S. EPA rules still allow fuel containing lead to be sold for off-road use, including aircraft, racing cars, farm equipment, and marine engines. Figure 1 demonstrates the significant impact of the phase-out of lead from gasoline on lead exposure in the U.S. population. Lead contamination of drinking water in the U.S. has also been recognized as a significant health problem and a series of regulations have been enacted to provide guidelines for the states and to reduce the likelihood of contamination (180). The early federal efforts to keep lead out of drinking water, most of which were part of the 1975 National Interim Primary Drinking Water Regulations, were largely ineffective as they controlled lead at the distribution source rather than at the consumer’s tap. Subsequent research demonstrated that most contamination occurred between the source and the tap, often
“One study found . . . that about 50 percent of the paint sold in China, India and Malaysia had lead levels 30 times higher than U.S. regulations would allow. Children’s toys and other items imported from these countries can have high lead levels.”
Tab le 1 . Year lead ban ned in househol d paint, in order by year, in variou s countrie s.
COUNTRY YEA R OF BAN
Austria 190 9
Belgium 1909
Fra nce 1909
Gree ce 1922
Tunis ia 1922
Czechoslovaki a 1924
Great Britain 1926
Swe den 1926
Po land 1927
Spain 1931
Yugoslavia 1931
Cuba 1934
Un ited S tates 1978*
*Max imum allow able 0.06%.
Year of Ban
1909
1909
1909
1922
1922
1924
1926
1926
1927
1931
1931
1934
1978*
Country
Austria
Belgium
France
Greece
Tunisia
Czechoslovakia
Great Britain
Sweden
Poland
Spain
Yugoslavia
Cuba
United States
Table 1 - Year lead banned in household paint, in order by year,
in various countries.
*Maximum allowable 0.06%.
C H I L D H O O D L E A D P O I S O N I N G I N G A LV E S T O N , T E X A S14
in association with corrosion along the distribution system. The first major initiative to address lead in tap water was the “Federal Lead Ban,” a set of amendments to the Safe Drinking Water Act that were signed into law in December 1986. These amendments banned the use of solders and flux containing more that 0.2% lead (solders and flux were typically composed of 40% to 50% lead), and restricted the amount of lead in any brass in contact with drinking water to 8%. A flurry of medical research in the 1980s established that the lead levels commonly found in U.S. drinking water were sufficient to contribute to lead poisoning, especially in children (33). In 1988 the U.S. “Lead Contamination Control Act” (LCCA) was passed. This legislation required the U.S. EPA to assist schools in reducing lead contamination, particularly in water coolers, many of which were lined with lead. However, lead-contaminated point-of-use water, i.e., the water coming out of the tap in homes, continued to be a problem with no federal or state agencies having the authority to regulate water quality within homes. In 1991, the U.S. EPA issued the “Lead and Copper Rule,” which requires each public water supply system to assess the severity of lead contamination in higher-risk residences and to take action if more than 10% of residences exceed a concentration of 15 µg/L. Between 1996 and 1999, in part in response to a California lawsuit against faucet makers, virtually all North American and European faucet makers reformulated their faucets to be no-lead (0.1% to 0.2% lead as an incidental impurity) or low-lead (typically 2.0% to 2.5% lead). Federal law still allows up to 8% lead in faucets and most faucets before 1996 were made from alloys containing 5% to 7% lead. Because the degree of lead-leaching is linked to the corrosivity of the water, currently all large water suppliers in
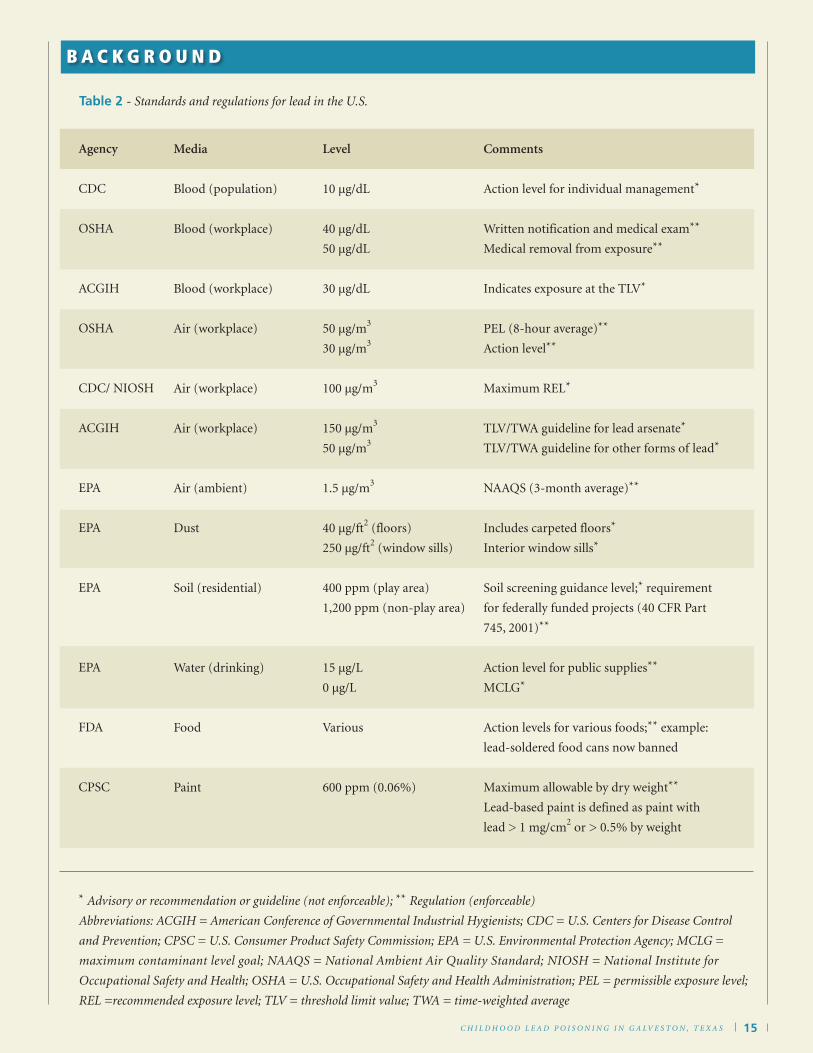
the U.S. are required to reduce lead corrosivity of their finished water, although the methods to reduce corrosion and lead leaching in water systems may vary. To combat the corrosivity, municipal water systems add chemicals such as zinc orthophosphate, sodium hydroxide and silicates. Although the effect is not always predictable (180), anticorrosives such as orthophosphate generally work by forming a protective coating inside pipes that decreases the amount of lead that leaches from lead service lines and customers’ plumbing systems. See also “Sources of Lead Exposure: Water” (page 17) and “Reducing Exposure: Water” (page 70). Dietary lead exposure, mainly through food and beverage cans containing lead solder, also came into focus in the 1970s. During this time, manufacturers of baby foods changed from cans to glass jars while various other industries voluntarily stopped using lead solder in cans (86). In 1995, the U.S. Food and Drug Administration (FDA) issued a ban on lead-soldered cans. In the 1990s, the FDA also took steps to increase awareness about lead-contaminated candy and the use of lead-foil capsules on wine bottles. As a result of these measures, dietary lead exposure among the entire U.S. population has decreased significantly since the 1970s (34). The U.S. Occupational Safety and Health Administration (OSHA) requires employers of workers who are occupationally exposed to lead, including construction workers, to keep lead levels ≤ 50 micrograms per cubic meter of air (µg/m3), averaged over an 8-hour period. If the lead level is ≥ this level, BLLs must be monitored and an employee with a BLL ≥ 50 µg/dL must be relocated (7). A number of investigators, based on growing medical evidence in adults exposed to lead, are pressuring OSHA to re-evaluate these regulations (245). Table 2 lists current federal standards for lead in different media and in different populations. States and municipalities have enacted additional regulations that vary greatly across the U.S. in the degree to which they protect residents—especially children—from exposure to lead. In some areas federal regulations and guidelines are poorly enforced, whereas in other states and municipalities additional regulations have been enacted that are considerably more protective than federal laws.
SOURCES OF LEAD ExpOSURE
In the U.S. today, ingestion is the most common route of lead absorption. Before leaded gasoline was banned, however, inhalation of airborne lead was a major source of exposure. Ambient AirAccording to the U.S. EPA, atmospheric emissions of lead have decreased 93% between 1982 and 2002 (7). The highest levels are generally observed near stationary sources, such as lead smelters. Levels of lead in ambient air range from about 7.6 x 10⁻⁵ µg/m3 in remote areas such as Antarctica to > 10 µg/m3
B A C K G R O U N D
50
60
70
80
90
100
110
Lead
Use
d P
er 6
-Mo
nth
Per
iod
(1,
000
ton
s)
10
11
12
13
14
15
16
Ave
rag
e B
loo
d-L
ead
Lev
els
(µg
/dL)
Blood-Lead LevelsLead Used in Gasoline
1976 1977 1978 1979 1980
f i g u r e 1
Relationship between the phase-out of leaded gasoline in on-road vehicles and the decline in blood-lead levels in the U.S. Redrawn from Pirkle et al (227).
C H I L D H O O D L E A D P O I S O N I N G I N G A LV E S T O N , T E X A S 15
B A C K G R O U N D
Agency
CDC
OSHA
ACGIH
OSHA
CDC/ NIOSH
ACGIH
EPA
EPA
EPA
EPA
FDA
CPSC
Media
Blood (population)
Blood (workplace)
Blood (workplace)
Air (workplace)
Air (workplace)
Air (workplace)
Air (ambient)
Dust
Soil (residential)
Water (drinking)
Food
Paint
Level
10 µg/dL
40 µg/dL
50 µg/dL
30 µg/dL
50 µg/m3
30 µg/m3
100 µg/m3
150 µg/m3
50 µg/m3
1.5 µg/m3
40 µg/ft2 (floors)
250 µg/ft2 (window sills)
400 ppm (play area)
1,200 ppm (non-play area)
15 µg/L
0 µg/L
Various
600 ppm (0.06%)
Comments
Action level for individual management*
Written notification and medical exam**
Medical removal from exposure**
Indicates exposure at the TLV*
PEL (8-hour average)**
Action level**
Maximum REL*
TLV/TWA guideline for lead arsenate*
TLV/TWA guideline for other forms of lead*
NAAQS (3-month average)**
Includes carpeted floors*
Interior window sills*
Soil screening guidance level;* requirement
for federally funded projects (40 CFR Part
745, 2001)**
Action level for public supplies**
MCLG*
Action levels for various foods;** example:
lead-soldered food cans now banned
Maximum allowable by dry weight**
Lead-based paint is defined as paint with
lead > 1 mg/cm2 or > 0.5% by weight
* Advisory or recommendation or guideline (not enforceable); ** Regulation (enforceable)
Abbreviations: ACGIH = American Conference of Governmental Industrial Hygienists; CDC = U.S. Centers for Disease Control
and Prevention; CPSC = U.S. Consumer Product Safety Commission; EPA = U.S. Environmental Protection Agency; MCLG =
maximum contaminant level goal; NAAQS = National Ambient Air Quality Standard; NIOSH = National Institute for
Occupational Safety and Health; OSHA = U.S. Occupational Safety and Health Administration; PEL = permissible exposure level;
REL =recommended exposure level; TLV = threshold limit value; TWA = time-weighted average
Table 2 - Standards and regulations for lead in the U.S.

C H I L D H O O D L E A D P O I S O N I N G I N G A LV E S T O N , T E X A S16
near point sources or along major roadways where lead is generally still present from leaded gasoline. The EPA national ambient air quality standard for lead is 1.5 µg/m3, averaged over 3 months. In the 8-county Houston-Galveston ozone nonattainment area, monitoring of air lead levels is no longer required as results over several years found no exceedances. Air levels may be elevated near heavy traffic, where particulate matter is kept airborne, but no monitoring is currently done close to area roadways. See also “Sources of Lead Exposure: Soil,” (this page).
PaintDeteriorating house paint is the largest single source of lead exposure and the major source of lead poisoning in children (223). Housing built before 1950, which makes up 22.3% of the U.S. housing stock, poses the greatest risk because house paint contained the highest amount of lead (up to 50% by weight) prior to this time. In the City of Galveston, Census 2000 data indicate that 77.4% of the housing stock was built before 1978 (279). Moreover, studies conducted by the CDC have revealed relatively high BLLs in children who live in housing built before 1973 (51). Homes built before then, particularly those in need of repair or renovation, therefore pose the greatest risk to residents. The U.S. HUD estimates that 90% of privately owned units built before 1940, 80% of units built between 1940 and 1959, and 62% of units built between 1960 and 1979 contain some lead-based paint (283). Indoors, dust from deteriorating paint dust is generally the greatest concern, although lead-contaminated dust can also accumulate to significant levels from tracking contaminated soil indoors. Lanphear and associates noted that levels of floor lead dust (10 µg/ft2) and soil lead (72 ppm) almost 10-fold lower than EPA guidelines resulted in a mean BLL of 4.6 µg/dL in children (157), emphasizing the role of floor dust lead. The EPA defines a floor wipe sample of 40 µg/ft2 and a window sill wipe of 250 µg/ft2 as a hazard. Renovation of older residential buildings without taking proper precautions can result in not only poisoning the workers and residents but can seriously contaminate the home and the area around the home or apartment. One example in Galveston occurred in 1994 and involved workers who were asked to sandblast the paint from an older structure. The GCHD was notified by an emergency-department physician of a 32-year-old man with a BLL of 111 µg/dL who complained of symptoms of abdominal pain, vomiting, weight loss, constipation, headache, memory loss, tinnitus, a metallic taste, stuttering, arthralgias, and discoloration of the gums (50). The patient reported that for six weeks in February and March of that year, he and seven others had sandblasted a 100-year-old five-story building in Galveston and that large quantities of dust had been created during the process. Follow-up revealed that one of his co-workers had a BLL of 245 µg/dL. Subsequent analysis of the worksite found lead levels as high as
145,000 µg/ft2 along the inner surface of a window pane. As noted in the previous section, the use of lead-based household paint in the U.S. was not banned until 1978, and some uses of lead-based paint continue today. Although these other uses of lead-based paint, such as highway and marine paint, are less likely to poison children directly, take-home lead from parental occupations is a significant source of exposure in some households, and deteriorating paint from bridges or highways on which lead-based paint was or continues to be used can contaminate nearby soil around residences and be tracked indoors. Currently approximately five billion square feet of nonresidential surface area in the U.S., including approximately 89% of the nation’s steel bridges, are covered with lead paint (170). In addition to exterior and interior house paint and paint used on commercial and public infrastructure surfaces, lead-based paint can be found on old furniture and toys, as well as
some new items imported from countries with less stringent lead laws. For example, in August 2007, Fisher-Price recalled 83 types of toys—including the popular Big Bird, Elmo, Cora and Diego characters—because the paint contained excessive amounts of lead. The worldwide recall involved 96,700 plastic preschool toys made by a Chinese vendor and sold in the U.S. between May and August, 2007 (261).
SoilLead adheres tenaciously to soil particles and thus lead contamination from car exhaust, paint dust and lead-based pesticides persists for decades. Soil may be contaminated around older wooden homes with exterior lead paint, especially following improper power sanding to prepare the exterior for painting (139), which can release significant amounts of lead dust. In relatively uncontaminated rural areas, soil-lead levels are usually < 50 ppm, whereas urban soil levels are typically > 200 ppm. In one study of 169 homes, the mean soil-lead level near the foundation was 1,022 ppm (157). The EPA considers a soil-lead level of 400 ppm in a play area to be a hazard; the level of concern for residential yards is 1,200 ppm (Table 2). The findings of Lanphear and associates suggest that, in children with BLLs ≥ 10 µg/dL, lead-contaminated soil contributes significantly to their lead uptake. They also estimated that an increase of soil lead from 1 ppm to 1,000 ppm would result in a 2.4 µg/dL increase in blood lead (160). Sixteen percent of pre-1980 homes have adjacent soil lead concentrations > 500 ppm, and the chance of having levels
B A C K G R O U N D
“Currently approximately five billion square feet of nonresidential surface area in the U.S., including approximately 89% of the nation’s steel bridges, are covered with lead paint.”
C H I L D H O O D L E A D P O I S O N I N G I N G A LV E S T O N , T E X A S 17
> 500 ppm is 4–5 times higher if the house has exterior lead-based paint. Indeed, lead in urban soil is increasingly regarded as a potentially major source of lead poisoning, especially among children (191,304), and even in lead-safe homes and schools significant levels of lead can often be found near entrances where lead is tracked in from outdoors (163). Galveston, New Orleans and other coastal areas may face additional sources of soil-based contamination (191). Soil sediment from flood waters can contaminate coastal properties with lead and other toxic metals, and coastal properties may be more susceptible to the erosive effects of sea wind and salt on exterior lead-covered structures. In a recent study of New Orleans, Mielke and associates noted that, prior to Hurricane Katrina, 10 inner city census tracts had median surface soil levels of lead > 1,000 mg/kg (2.5 times the U.S. standard), with post-Katrina levels considerably higher. Mielke’s group estimates, based on a pilot soil remediation project, that the post-Katrina benefits of reducing soil levels of lead would significantly outweigh the foreseeable costs of childhood lead poisoning (annual costs of $76 million in health, education, and societal harm)(191). Also, soil along freeways or older roadways is usually contaminated by past emissions of lead in auto exhaust, with the levels decreasing with distance from the roadway and proportionate to traffic volume (112). The Agency for Toxic Substances and Disease Registry (ATSDR) estimates that leaded gasoline use left behind 4 to 5 million metric tons of lead in the environment (304). Other sources of soil contamination with lead include sites of previous industrial contamination. An excellent example in the Houston, Texas, area is the Many Diversified Interests (MDI) National Priority Listing (NPL) Superfund site in the Fifth Ward, a predominantly low-income historical, but not historically protected, African-American neighborhood located approximately two miles east of downtown Houston (288). This 36-acre site was previously home to several industries, including two steel casting foundries and a spent catalyst recycling plant that contaminated the site with lead and several other known toxins. Significantly elevated levels of lead have been found at the site, in the groundwater and in the soil of nearby residential properties. A 1998 Texas Department of Health/ATSDR study found that 22% of the children in the Fifth Ward had BLLs ≥ 10 µg/dL, a percentage that has fallen in more recent years largely to targeted intervention in the area. Although lead-based paint has been determined to be a source of exposure in many of the children, the contaminated soil is a major source as well. Numerous community and governmental agencies are currently working with the Fifth Ward to remediate homes and remove contaminated soil. In 2006, Clinton-Gregg Investments, L.P., purchased the site and agreed to clean up the ground and water contamination with U.S. EPA oversight.
WaterLead is rarely found in source water, but enters tap water through corrosion of plumbing materials. In Galveston County, no cases of elevated BLLs from drinking water have been reported. Although the number of in-home tap water sources tested is very low (103), there is a considerable amount of older plumbing. Exposure to lead from contaminated tap water is a significant source of body burden in many communities, and can vary from household to household based on the type of plumbing and fixtures. Regardless of the household plumbing, the relative corrosivity of the municipal water supply plays an important role in determining the amount of lead that leaches into the tap water. The U.S. EPA estimated in 1991 that 14% to 20% of total U.S. lead exposure was from drinking water (180). In most instances the sources are lead pipes, plumbing fixtures and solder along distribution lines. In addition, some early water coolers, which were lined with lead, were also sources of contamination in schools and businesses. Homes built before 1986 are more likely to have sources of lead in their plumbing systems. However, new homes are also at risk as even “lead-free” plumbing may legally contain up to 8 percent lead. The most common problem is with brass or chrome-plated brass faucets and fixtures, which can leach significant amounts of lead into the water. The degree of leaching is dependent on a number of factors including pH (acidity); concentrations of sulfate, chloride and
orthophosphate; and the presence of organic matter. Lead levels in tap water tend to be higher if the water is acidic, heated or has been sitting in the pipes for some time. Recent evidence also indicates that the use of silicofluorides to fluoridate municipal water may increase exposure to lead as this class of compounds increases water corrosivity. Blood-lead data from nearly 800,000 children in the U.S. suggest that children who live in communities with fluoridated water are twice as likely to have a BLL ≥ 10 µg/dL than those who live in communities without municipal fluoridation (72). Residential leaded-brass water meters and cut-off values are two other sources of contamination of household drinking water. As a result of a lawsuit in California in 1999, only no-lead water meters can now be sold in California (180). Maas and associates argue, based on new health research suggesting that a disproportionate amount of childhood neurological damage occurs at BLLs less than 5 µg/dL (see “What Are the Health Effects: Neurological” beginning on
“The U.S. EPA estimated in 1991 that 14% to 20% of total U.S. lead exposure was from drinking water. In most instances the sources are lead pipes, plumbing fixtures and solder along distribution lines.”
B A C K G R O U N D
C H I L D H O O D L E A D P O I S O N I N G I N G A LV E S T O N , T E X A S18
page 32), that water—rather than paint—may be responsible for significant cognitive and behavioral damage (180). They note that ingestion of only 31.2 µg per day of lead via water—the equivalent of two liters of water with a lead concentration of approximately 15 µg/L (the EPA action level for drinking water)—would produce a BLL of 5 µg/dL. That lead in tap water is still a concern was highlighted in 2003 by a significant number of water samples in Washington, D.C., having lead levels above the EPA action level. In this instance it was found that the chloramines the city began using in 2001 to disinfect its water increased corrosivity and lead leaching. In July 2007, EPA received the D.C. Water and Sewer Authority’s (WASA) most recent report on lead levels in D.C. drinking water. WASA reported that 90 percent of the samples had lead levels of 10 µg/L or less (287). Since August 2004 orthophosphate has been added to the entire D.C. distribution system as a corrosion inhibitor. Although tap water is the primary concern because of the large number of residents potentially affected, contaminated well or ground water, run-off from contaminated sites and flood waters may occasionally contain significantly elevated lead levels. Lead is not a common contaminant in well or ground water. Well or ground water contamination with lead generally occurs when the water is close to a site of contamination such as a freeway, lead mine, landfill, smelter or battery reclamation site. In Houston, Texas, ground water beneath the MDI Superfund site in the Fifth Ward near downtown is contaminated due to earlier industrial activities at the site. Anyone using well water should have the well regularly analyzed by a reputable laboratory. Studies of Hurricane Katrina floodwaters and the disturbed sediment that remained after the floodwaters receded demonstrated lead levels above public health standards in a number of areas in New Orleans, usually in areas with elevated soil-lead levels pre-Katrina. In general, lead-contaminated floodwater is not considered to be a significant source of exposure as only miniscule amounts are absorbed through the skin and large amounts of floodwater are not ingested. However, sediment from flooding can be contaminated and should be tested as warranted.
Food and BeveragesLead-glazed pottery and dishes and leaded crystal can be a source of poisoning. Both recently produced pottery produced in other countries and antique dishes and glasses can present problems. Fiesta ware, like most dishes made before 1972, contains lead and other heavy metals. It is especially important not to put acidic foods, such as orange juice, wine and tomato sauce, in these containers because low pH causes lead to leach into the food. Also, certain candies test consistently high in lead. Of particular concern are various Mexican chile and tamarind candies, especially Chaca Chaca, Bolirindo by Dulmex,
Rollito de Tamarindo by Dumex, and Lucas Limon. In some instances the lead is found in the seasoning; in others it is in the ink used for the candy wrappers. Lead is also readily taken up by plants. This can be used effectively to reduce soil levels and the tracking of lead dust into homes. However, it is important that food for consumption not be grown in contaminated soil or close to a major source, such as along a major roadway. Lead in soil especially concentrates in root vegetables and leafy green vegetables. In Houston, Urban Harvest recommends that all gardens for edible fruits and vegetables be grown in raised beds with new soil to avoid lead, pesticide and other contaminants in food.
LactationMother’s milk is the ideal food for newborns. However, lactation can also expose infants to elevated levels of lead if the milk is produced by mothers with current ongoing exposure to lead or by mothers who have been exposed earlier in life, due to the redistribution of cumulative maternal bone-lead stores. For high-risk mothers, both current and past exposure can contribute to contaminated breast milk. In a study by Ettinger and associates, breast milk lead accounted for 12% of the variance of infant BLLs at one month of age, whereas maternal blood lead accounted for 30% (89). Although the levels of lead in breast milk tend to be low, a growing awareness of the effects of even low levels of lead during early windows of neural development has generated renewed interest in approaches to reduce childhood exposure from lactational lead. Aside from eliminating exposure, various nutritional approaches are being examined. Nevertheless, current evidence continues to suggest that the nutritional and other benefits of human milk outweigh the effects of lactational lead except in extreme cases.
Folk Remedies and CosmeticsSome ethnic folk remedies, such as greta and azarcón, are 70% to 90% lead (47). These remedies are commonly found in areas of the U.S., such as the Houston-Galveston area, where there is a large population of Mexican Americans. They are usually sold in “herberias” and prescribed by “curanderas.” They are more often used by first generation immigrants and are commonly administered for “empacho” to infants, who are also particularly susceptible to their toxicity. South Asian traditional remedies which contain lead include Balrakshak Sogati, Triphala Tablet, Zandu Sudarshan Tablet, Balguti Kaseria, Somva 34, Triphala Guggal, and Balsathi. Some cosmetics also contain significant amounts of lead. Of particular importance is a traditional cosmetic called kohl, which is often applied around the eyes in Asia, Africa and the Middle East (222). In one study of 22 kohl samples, seven had lead levels in excess of 50%. In addition, some types of hair colorants and dyes contain lead acetate.
B A C K G R O U N D

C H I L D H O O D L E A D P O I S O N I N G I N G A LV E S T O N , T E X A S 19
HobbiesHobbies can be a significant source of lead exposure. Hobbies involving lead include recreational target shooting, home remodeling, refinishing furniture, casting bullets and fishing weights, and making stained glass and ceramics. In one recent instance, a 64-year-old woman was referred to her local hospital with a 6-month history of anorexia, weight loss, and abdominal pain (76). Six months later she presented with left- and right-sided wrist drops. The clinical suspicion of lead intoxication was confirmed by a BLL of 146 µg/dL. A subsequent history revealed numerous potential sources of lead exposure including a childhood history of making wooden shoes with her father and subsequently working in a paint shop. She also had had lead water piping in her home until recently. However, the key factor was her hobby of flower arranging: she used large amounts of lead to make decorative figures around which she arranged the flowers. Other examples include a case of lead poisoning experienced by a female art conservator who was involved in restoring antique Peruvian tapestry, and a case of an entire family experiencing lead intoxication secondary to the pottery work by an artist family member (97). Yet another example involved recreational shooters at indoor firing ranges where powder charges were employed. Of the 22 marksmen who used power charges, their BLLs in some cases doubled over the course of the shooting season (270).
OccupationalIn the U.S., an estimated 95% of elevated BLLs in adults are attributable to occupational exposure (50,54), with approximately 0.5 and 1.5 million workers exposed to lead in the workplace (7). Industries that expose workers to lead include battery manufacturing, painting, rubber products and plastics industries, municipal waste incineration, soldering, steel welding and cutting operations, lead compound manufacturing, nonferrous smelting, radiator repair, brass and bronze foundries, pottery production, scrap metal recycling, firing ranges, and wrecking and demolition. In the smelting and refining of lead, mean concentrations of lead in air can reach 4,470 µg/m3; in the manufacture of storage batteries, mean airborne concentrations of lead ranging between 50 and 5,400 µg/m3 have been recorded; and in the breathing zone of welders of structural steel, an average lead concentration of 1,200 µg/m3 has been found. In a 1992 study of a lead mine in Romania, workers had mean BLLs of 77.4 µg/dL. In children living near the lead smelter, a mean BLL of 63.3 µg/dL was found (296). The removal of lead-containing paint from homes or other structures, such as bridges and marine vessels, is another common occupational exposure. Approximately 2–3% of children with a BLL ≥ 10 µg/dL have been exposed to “take-home” lead, that is, lead brought home from the workplace on the clothes or in the vehicles of their adult caregivers.
Endogenous Exposure from BonePersons exposed to lead store variable amounts of the metal in their bodies (see “Storage”, page 21), with bone and teeth being prime repositories. Under various normal and disease conditions, lead can be released back into the blood. In general, little lead is released from teeth; bone, however, continuously undergoes remodeling and is often a major source of lead in blood. Plasma levels in children may be particularly influenced by bone levels as children’s bones are in continual growth, leading to a state in which lead in bone is continuously released back into the blood compartment (17,118). In pregnant women, increased levels of lead, presumably released from bone, are often
found in the mothers’ blood (272). Lead easily crosses the placenta, exposing the developing fetus to potentially high levels of lead at a time when exposure may be especially damaging. Healthcare professionals are currently considering guidelines for routine screening of high-risk mothers. In general, a fetus will have BLLs similar to that of the mother, with studies suggesting that the source of the lead is approximately two thirds dietary and one third skeletal (10). Women from Eastern Europe and infants adopted from these countries sometimes have high levels of lead. Although not a contraindication to adoption, the BLLs need to be known at the time of adoption to avoid unnecessary suspicion of current lead poisoning, to track levels, and to put in place early support. Increased bone demineralization in postmenopausal women has also been associated with elevated lead levels. In a study by Nash and co-workers, factors related to bone turnover were significant predictors of BLLs, with postmenopausal women having BLLs approximately 25% higher than premenopausal women, after controlling for numerous potential confounders (206). Among women or men with osteoporosis, the release of endogenous lead and the potential for adverse lead-related health effects in adulthood are intensified (257,278). Moreover, lead may worsen the prognosis of osteoporosis since lead is known to inhibit activation of vitamin D, uptake of dietary calcium, and several regulatory aspects of bone-cell function (257).
TransfusionVery premature infants (who need repeated blood transfusions), together with those who need double-volume exchange transfusions, cardiac surgery necessitating
“Approximately 2–3% of children with a BLL ≥ 10 µg/dL have been exposed to “take-home” lead, that is, lead brought home from the workplace on the clothes or in the vehicles of their adult caregivers.”
B A C K G R O U N D

C H I L D H O O D L E A D P O I S O N I N G I N G A LV E S T O N , T E X A S20
bypass, extra-corporeal membrane oxygenation, or chronic transfusions, are extensively exposed to donated blood—which is not currently screened for lead levels. Bearer and associates studied 19 very premature infants who received 79 transfusions during the first four weeks of life in 1991. The mean number of transfusions was 4.2, with a mean of 15.7 mL/kg packed red blood cells (pRBCs) for a mean lead dose of 1.56 ± 1.77 µg/dL (19). The mean lead level in whole blood was 2.5 µg/dL (range 0–10 µg/dL); the mean lead level in the pRBCs was 5.0 µg/dL (range 0–13 µg/dL). They found that increases in post-transfusion BLLs in the infants were linear with doses higher than 1.5 µg/dL. The authors noted that 64 of the 79 transfusions (81%) in their study exceeded the California Safe Drinking Water and Toxic Enforcement Act of 1986 (Proposition 65) guidelines that require notification in any place of business where exposure to lead exceeds 0.5 µg per day via any route. They recommended that blood for very premature babies be screened and that no infants receive pRBC with a BLL ≥ 3.3 µg/dL or whole blood ≥ 1.6 µg/dL. They estimated that if all of the infants who had post infusional BLLs > 5 µg/dL had received blood with lower lead levels, the lifetime savings for each child due to lost IQ points would be $143,289 (19). To ascertain if hazardous concentrations of lead continue to be present in transfused blood, they measured the BLL of 100 units of blood by atomic absorption spectroscopy in 2001 (18). The median BLL was 0.07 nmol/L (2.5 µg/dL) and the median was 0.22 nmol/L (3.9 µg/dL), suggesting little change over the 10-year period and representing an unacceptable hazard of lead exposure, particularly for very premature infants who often receive multiple transfusions from the same donor.
Other SourcesNumerous consumer products, such as children’s vinyl lunch boxes and some cosmetics, may contain small amounts lead. Daluga and Miller recently tested 40 vinyl lunch boxes and found that 35% were positive for lead (73). They noted that many of the boxes were marketed under well-known names. In the lunch boxes, which were made in China, the lead was added to the vinyl as a stabilizer. Another unexpected source of lead is Halloween costumes, with face masks often containing the highest levels (73). Fireworks are another source. Although the U.S. bans importation of fireworks containing lead, enforcement is lax and post-fireworks air analyses have generally found significant levels of lead in the combustion particles (174). Jewelry is yet another potential source of lead poisoning. In June 2007 the U.S., in cooperation with GeoCentral, of Napa, CA, announced a voluntary recall of approximately 19,000 “Butterfly Necklaces” manufactured in China because of high lead content in the clasp. Other infrequent sources of lead exposure include gunshot wounds, chewing on crayons with lead, sidewalk chalk, and burning candles with lead wicks.
HOW DOES LEAD GET INTO AND OUT OF THE BODy?
AbsorptionSome of the lead that enters one’s body comes from breathing in tiny particles or chemicals that contain lead. Once this lead is breathed deeply into the lungs, it passes into the bloodstream and then is distributed throughout the body. Particles that are too large to enter the deeper recesses of lungs can be coughed up and swallowed. Lead intake from air is generally greater in children than in adults, probably due to their higher rate of breathing, which leads to greater exposure per kg of weight, as well as to the increased efficiency of exchange across the air-blood interface in children’s lungs. In adults, each 1 µg/m3 increase of lead in ambient air has been found to increase the mean BLL by approximately 1 µg/dL, whereas in children each 1 µg/m3 increase in ambient air lead causes a mean increase of 2 µg/dL or more in the BLL (286). The main route of lead absorption is the gastrointestinal tract. The amount of lead that enters the blood from the gastrointestinal tract partially depends on the form of the lead, dose, age, sex, genetic background, nutritional status, when the last meal was eaten, how well the lead particles are dissolved in the stomach juices, and whether the exposure is short-term or chronic (7). Experiments using adult volunteers have demonstrated that, in adults who had just eaten, the amount of lead that entered the bloodstream was about 6% of the total amount ingested (7). In adults who had not eaten for a day, about 60–80% of the lead entered the bloodstream. In general, if adults and children ingest the same amount
of lead, a larger proportion will enter the blood in children than in adults. Young children, especially those with dietary deficiencies of iron, calcium or zinc, absorb approximately 5–10 times more ingested lead through their gastrointestinal tract than do adults (115). The amount of lead absorbed also varies with whether the ingested lead is in food, water, soil or dust. Studies suggest that, in general, gastrointestinal absorption of lead in soil is approximately 30% lower than from food (169), and that the greatest increases in BLLs at low levels of exposure occur when the exposure is to lead in water (252). Skin is an effective barrier against lead and only a small portion of lead dust on the skin will pass through the skin and enter the blood if it is not washed off. It is easy, however,
B A C K G R O U N D
“Lead intake from air is generally greater in children than in adults, probably due to their higher rate of breathing, which leads to greater exposure per kg of weight, as well as to the increased efficiency of exchange across the air-blood interface in children’s lungs.”

C H I L D H O O D L E A D P O I S O N I N G I N G A LV E S T O N , T E X A S 21
to ingest lead that is on one’s hands. One can, for example, accidentally swallow lead that is on one’s hands while eating, drinking, smoking, or applying cosmetics (for example, lip balm). Young children can swallow a considerable amount of lead-contaminated dust when they put their hands and foreign objects in their mouths. “Pica,” which is the eating of nonfood items such as dirt or paint chips, is common among infants and toddlers. If the behavior continues after about three years of age and is characterized by compulsive cravings to eat nonfood items, it is considered a disorder. Pica is also common during pregnancy. Pica may cause elevated BLLs in children and adults. Damaged skin (for example, scrapes, scratches, and wounds) also absorbs more lead. Tetraethyl and tetramethyl lead, gasoline additives not longer allowed in the U.S., are the only forms of lead that easily penetrate the skin.
StorageThe excretory half-life of lead in blood, in adult humans, is approximately 30 days. After entering the bloodstream approximately 99% of circulating lead is initially bound to red blood cells, which disperse the lead to the soft tissues such as the liver, kidneys, lungs, brain, spleen, muscles and heart over the following 4–6 weeks. Tissue distribution differs among children and adults, with a greater percentage of lead accumulating in the immature brain in children than in adults. The rate of excretion is low and much of the lead, especially in situations of chronic exposure, moves into the bones and teeth for “storage.” In adults, about 94% of the retained lead is stored in bone (7) whereas in children about 73% is stored in bone, resulting in more soft-tissue lead in children. Bone lead will reenter the blood under various circumstances (e.g., during pregnancy, during breast feeding, after menopause in women, after a bone is broken, in conjunction with certain diseases such as osteoporosis, and in hormonal imbalances). The half-life in bone is estimated to range from 3 years in trabecular bone such as the patella to 30 years in dense cortical bone such as the tibia. Due to the slow turnover and release of lead from cortical bone, bone-lead levels often increase with age (134). See also “Endogenous Exposure from Bone” (page 19).
ExcretionLead does not metabolize to any other form in the body. Independent of the route of exposure, absorbed lead is excreted primarily in urine and feces; sweat, saliva, hair and nails, and breast milk are minor routes of excretion (7). Studies have shown that clearance is greater for adults than for children. Following short-term exposure, about 99% of the amount of lead taken into the body of an adult will leave the body as waste within a couple of weeks. In children the amount that is eliminated is only about 32% (7). Under conditions of continued exposure, the lead will begin to accumulate in body tissues, especially bone, and the rate of excretion is slower.
HOW IS LEAD ExpOSURE MEASURED?
Several different methods are used to measure lead exposure (17). Lead levels measured in blood, bone and teeth are the most used and validated techniques, with each measuring a different component of lead sequestration.
BloodThe blood-lead concentration, also known as BLL, is the most commonly used biological marker of lead dose because a BLL test is both easy and cheap to perform. BLLs are expressed in µg/dL. For children, either capillary or venous blood specimens are collected, whereas adult blood samples are generally obtained from veins. Because capillary blood specimens can be contaminated by lead on the skin, national and state blood lead screening guidelines currently require that capillary lead levels ≥ 10 µg/dL be confirmed with a second capillary sample or, preferably, a venous blood sample. The CDC and TDSHS have published detailed collection methodology (see “Useful Resources”). The concentration of lead in blood reflects the equilibrium between current exposure, excretory loss, and the movement of lead between other longer term storage sites such as bone (230). More than 95% of lead in blood is bound to red cells (201) with a relatively short half-life (35 days) in the bloodstream. For this reason, BLL is an indicator of relatively recent exposure (134). Only a small fraction of blood-lead exists in the plasma in a “free” state (i.e., not bound to red blood cells), but plasma-lead is considered to be the most rapidly exchangeable fraction of lead in the bloodstream and the most bioavailable form for crossing soft tissue membranes into target organs or across the placenta (17,133). For this reason, the ratio of plasma-lead to whole blood-lead levels (% plasma-lead/blood-lead ratio) is sometimes used to monitor exposure and assess risk in different populations (17). Data from studies utilizing direct measurements of lead in plasma suggest that the ratio of lead in plasma to whole blood lead can vary by a factor of 2 to 3, with bone lead as a major determinant of plasma lead levels (26,128). The level of detection (LOD) for lead in blood varies by methodology and, to a lesser extent, the laboratory used. In the data received for our geospatial and statistical analysis of blood-lead levels and predictive variables in Galveston, which begins on page 44, a number of different laboratories were used including Quest, LabCorp, and the TDSHS Laboratory. These three laboratories and most others use graphic furnace atomic absorption spectroscopy (GFAAS). Although some sources cite the LOD of GFAAS as reliable down to 1 µg/dL, the TDSHS reports anything below 3 µg/dL as < 3 µg/dL as it feels that anything below 3 µg/dL may be unreliable with this method. A few laboratories still use anodic stripping voltametry, which has an LOD of 5 µg/dL. Increasingly, however, laboratories are using inductively coupled plasma/
B A C K G R O U N D
C H I L D H O O D L E A D P O I S O N I N G I N G A LV E S T O N , T E X A S22
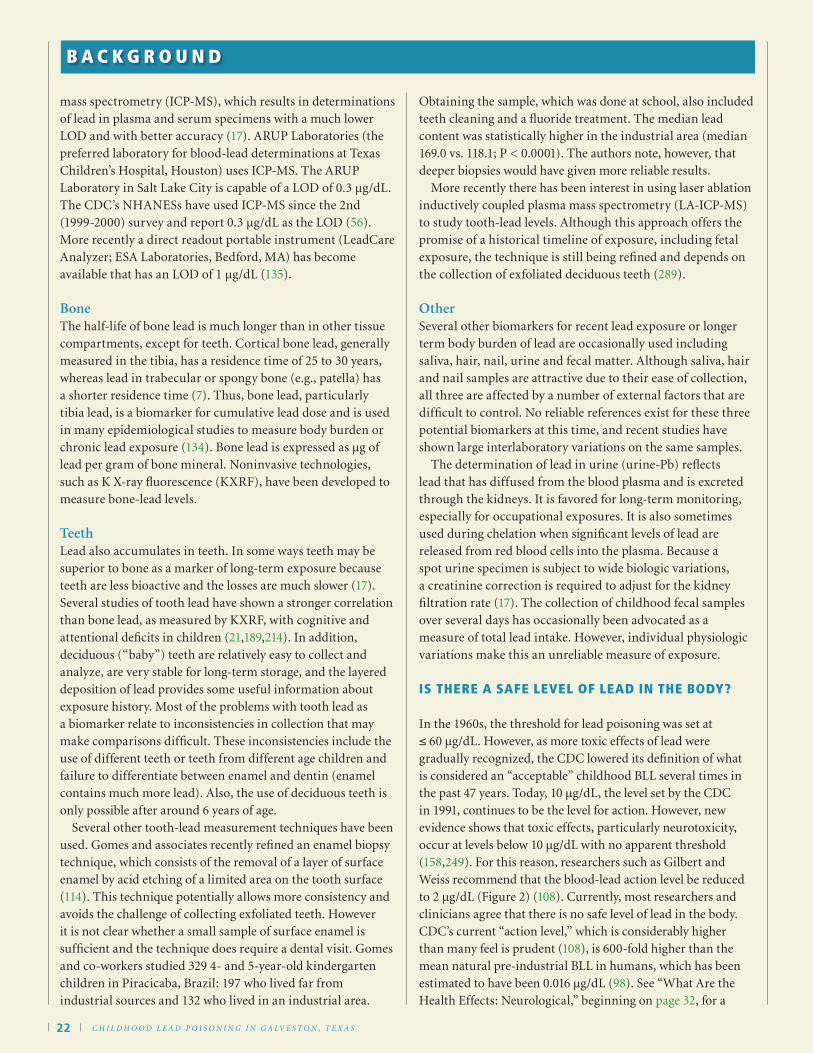
mass spectrometry (ICP-MS), which results in determinations of lead in plasma and serum specimens with a much lower LOD and with better accuracy (17). ARUP Laboratories (the preferred laboratory for blood-lead determinations at Texas Children’s Hospital, Houston) uses ICP-MS. The ARUP Laboratory in Salt Lake City is capable of a LOD of 0.3 µg/dL. The CDC’s NHANESs have used ICP-MS since the 2nd (1999-2000) survey and report 0.3 µg/dL as the LOD (56). More recently a direct readout portable instrument (LeadCare Analyzer; ESA Laboratories, Bedford, MA) has become available that has an LOD of 1 µg/dL (135).
BoneThe half-life of bone lead is much longer than in other tissue compartments, except for teeth. Cortical bone lead, generally measured in the tibia, has a residence time of 25 to 30 years, whereas lead in trabecular or spongy bone (e.g., patella) has a shorter residence time (7). Thus, bone lead, particularly tibia lead, is a biomarker for cumulative lead dose and is used in many epidemiological studies to measure body burden or chronic lead exposure (134). Bone lead is expressed as µg of lead per gram of bone mineral. Noninvasive technologies, such as K X-ray fluorescence (KXRF), have been developed to measure bone-lead levels.
TeethLead also accumulates in teeth. In some ways teeth may be superior to bone as a marker of long-term exposure because teeth are less bioactive and the losses are much slower (17). Several studies of tooth lead have shown a stronger correlation than bone lead, as measured by KXRF, with cognitive and attentional deficits in children (21,189,214). In addition, deciduous (“baby”) teeth are relatively easy to collect and analyze, are very stable for long-term storage, and the layered deposition of lead provides some useful information about exposure history. Most of the problems with tooth lead as a biomarker relate to inconsistencies in collection that may make comparisons difficult. These inconsistencies include the use of different teeth or teeth from different age children and failure to differentiate between enamel and dentin (enamel contains much more lead). Also, the use of deciduous teeth is only possible after around 6 years of age. Several other tooth-lead measurement techniques have been used. Gomes and associates recently refined an enamel biopsy technique, which consists of the removal of a layer of surface enamel by acid etching of a limited area on the tooth surface (114). This technique potentially allows more consistency and avoids the challenge of collecting exfoliated teeth. However it is not clear whether a small sample of surface enamel is sufficient and the technique does require a dental visit. Gomes and co-workers studied 329 4- and 5-year-old kindergarten children in Piracicaba, Brazil: 197 who lived far from industrial sources and 132 who lived in an industrial area.
Obtaining the sample, which was done at school, also included teeth cleaning and a fluoride treatment. The median lead content was statistically higher in the industrial area (median 169.0 vs. 118.1; P < 0.0001). The authors note, however, that deeper biopsies would have given more reliable results. More recently there has been interest in using laser ablation inductively coupled plasma mass spectrometry (LA-ICP-MS) to study tooth-lead levels. Although this approach offers the promise of a historical timeline of exposure, including fetal exposure, the technique is still being refined and depends on the collection of exfoliated deciduous teeth (289).
OtherSeveral other biomarkers for recent lead exposure or longer term body burden of lead are occasionally used including saliva, hair, nail, urine and fecal matter. Although saliva, hair and nail samples are attractive due to their ease of collection, all three are affected by a number of external factors that are difficult to control. No reliable references exist for these three potential biomarkers at this time, and recent studies have shown large interlaboratory variations on the same samples. The determination of lead in urine (urine-Pb) reflects lead that has diffused from the blood plasma and is excreted through the kidneys. It is favored for long-term monitoring, especially for occupational exposures. It is also sometimes used during chelation when significant levels of lead are released from red blood cells into the plasma. Because a spot urine specimen is subject to wide biologic variations, a creatinine correction is required to adjust for the kidney filtration rate (17). The collection of childhood fecal samples over several days has occasionally been advocated as a measure of total lead intake. However, individual physiologic variations make this an unreliable measure of exposure.
IS THERE A SAFE LEvEL OF LEAD IN THE BODy?
In the 1960s, the threshold for lead poisoning was set at ≤ 60 µg/dL. However, as more toxic effects of lead were gradually recognized, the CDC lowered its definition of what is considered an “acceptable” childhood BLL several times in the past 47 years. Today, 10 µg/dL, the level set by the CDC in 1991, continues to be the level for action. However, new evidence shows that toxic effects, particularly neurotoxicity, occur at levels below 10 µg/dL with no apparent threshold (158,249). For this reason, researchers such as Gilbert and Weiss recommend that the blood-lead action level be reduced to 2 µg/dL (Figure 2) (108). Currently, most researchers and clinicians agree that there is no safe level of lead in the body. CDC’s current “action level,” which is considerably higher than many feel is prudent (108), is 600-fold higher than the mean natural pre-industrial BLL in humans, which has been estimated to have been 0.016 µg/dL (98). See “What Are the Health Effects: Neurological,” beginning on page 32, for a
B A C K G R O U N D

C H I L D H O O D L E A D P O I S O N I N G I N G A LV E S T O N , T E X A S 23
B A C K G R O U N D
discussion of some of the deleterious effects that have been observed at BLLs below 5 µg/dL. Although blood lead is a good marker of recent exposure, plasma- and bone-lead levels may be of more importance with regard to toxicity and chronic exposure and/or effects.
HOW COMMON IS LEAD pOISONING?
In the late 1970s, the median BLL of U.S. preschool children was 15 µg/dL, and 88% of children had a level ≥ 10 µg/dL (183). At the same time, the mean BLL of poor Black childrenwas 23 µg/dL, and 18.5% of poor Black children had a level ≥ 30 µg/dL. The removal of lead from gasoline (Figure 1), paint and other products resulted in a significant drop in blood-lead concentrations over the period between the second (1976–1980) and the first phase of the third (1988–1991) NHANESs. The percentage of children 1 to 5 years of age with BLLs ≥ 10 µg/dLdecreased from 88% to 8.9% during this period (227,228). The most recent NHANES results reflect a continuing decrease in BLLs in young children, with 1.6% of children aged 1 to 5 years having a BLL ≥ 10 µg/dL in 1999–2002 (53). The geometric mean BLL for this last period was 1.9 µg/dL. However, the decrease in elevated BLLs is not uniform across the country; there are still communities and groups disproportionately affected by high rates of elevated BLLs. In Table 3, surveillance data collected by the CDC from NHANES and state lead-testing programs indicate that the percentage of children with BLLs ≥ 10 µg/dL is consistently higher among Black children, although the percentage is gradually dropping—from 17.7% in 1997 to 8.7% in 2001. Latino and low-income children are also more likely to have elevated BLLs (94). NHANES data collected between 1999 and 2002 revealed that among children aged 1 to 5 years, non-Hispanic Blacks and Mexican Americans had higher
percentages of BLLs ≥ 10 µg/dL (3.1% and 2.0%, respectively) and higher geometric mean BLLs (2.8 µg/dL and 1.9 µg/dL) than non-Hispanic Whites (1.3% and 1.8 µg/dL) (53). Older communities across the U.S. typically have more contaminated housing stock and therefore higher BLLs and bone-lead levels in their residents. Galveston is typical of a historical community with a higher potential for exposure and elevated BLLs than in much of the U.S. See “Lead Exposure in Galveston, Texas” beginning on page 26, for a discussion of the area and some of its challenges in relation to lead exposure. In addition, subpopulations of adults working in certain industries, such as battery manufacturing and housing
construction, have disproportionately high percentages of workers with elevated BLLs. According to workplace lead standards set by OSHA, an employee must be removed from exposure when his or her BLL exceeds 50 µg/dL. The CDC’s Adult Blood Lead Epidemiology and Surveillance (ABLES) program considers an elevated adult BLL to be ≥ 25 µg/dL (54). The geometric mean BLL for adults aged 20-59 years in 1999–2002 was 1.5 µg/dL (53). Approximately 94% of elevated BLL adult cases are due to occupational exposure (54). Indirectly, through “take-home” lead as well as exposure during fetal development either from exogenous maternal exposure or from leaching of lead stored in bones previously, children are often exposed to lead via their caregivers. As noted earlier, the predominant way of reporting “lead poisoning,” that is, the percentage of children with BLLs ≥ 10 µg/dL often unintentionally suggests that below 10 µg/dL is safe. In addition, other measures of body lead burden or bioavailability may be as or more useful than the BLL. Given what we know today about the long-term effects of lead, the majority of the U.S. population has levels of lead sufficient to have an adverse effect on their health. These levels should gradually fall over the next several generations, especially if lead is removed from homes.
Who Is Most at Risk?A number of factors, including age, race, ethnicity, poverty, occupation, nutrition, education and genetic susceptibility result in some people being more at risk than others. In addition, where one lives is a major factor as lead levels are generally highest in older urban areas. Within these
Blo
od
Lea
d (
µg
/dL)
1960CDC CDC CDC CDC
Agency & Year
WHO EPA CDC CDC0
10
20
30
40
50
60
70
1973 1975 1985 1986 1986 1990 2006?
f i g u r e 2
The guideline for action for elevated levels of lead in the blood has decreased steadily as the awareness of the lasting deleterious effects of lead on developing brains and other systems have become better appreciated. Redrawn from Gilbert and Weiss (108).
“Older communities across the U.S. typically have more contaminated housing stock and therefore higher BLLs and bone-lead levels in their residents. Galveston is typical of a historical community with a higher potential for exposure and elevated BLLs than in much of the U.S.”

C H I L D H O O D L E A D P O I S O N I N G I N G A LV E S T O N , T E X A S24
B A C K G R O U N D
Year
1997
1998
1999
2000
2001
Race / Ethnicity
White
Black
Native Am
Asian
Hispanic
Other
Unknown
White
Black
Native Am
Asian
Hispanic
Other
Unknown
White
Black
Native Am
Asian
Hispanic
Other
Unknown
White
Black
Native Am
Asian
Hispanic
Other
Unknown
White
Black
Native Am
Asian
Hispanic
Other
Unknown
# Tested
419,428
359,505
5,951
19,697
151,833
17,861
729,081
401,830
358,241
6,330
20,984
135,728
16,323
797,472
408,672
339,813
9,745
19,874
139,028
18,323
874,086
414,833
325,086
13,717
21,886
154,962
17,029
1,188,419
433,317
327,126
15,161
20355
154,723
22,073
1,449,543
# With BLL ≥ 10 µg/dL
15,713
63,458
327
1,562
14,383
1,571
33,498
13,426
54,177
286
1,432
12,132
1,160
33,919
11,391
41,471
251
1,172
10,180
1,002
27,768
10,250
34,483
234
1,084
9,685
869
30,952
8,738
28,291
230
901
8,625
872
27,230
% With BLL ≥ 10 µg/dL
3.75
17.65
5.49
7.93
9.47
8.80
4.59
3.34
15.12
4.52
6.82
8.94
7.11
4.25
2.79
12.20
2.58
5.90
7.32
5.47
3.18
2.47
10.61
1.71
4.95
6.25
5.10
2.60
2.02
8.65
1.52
4.43
5.57
3.95
1.88
Table 3 - Blood lead levels in children 1–5 years of age, by race/ethnicity, in the U.S., 1997–2001. Data from U.S. Centers for Disease Control and Prevention (57).
Abbreviations: Am = American; BLL = blood-lead level; µg/dL = micrograms per deciliter. Data from (1) National Health and Nutrition Examination Surveys (NHANES) conducted during 1976–1980, 1988–1991, 1991–1994, and 1999–2000; and (2) state child blood-lead surveillance data collected during 1997–2001
Table 3 - Blood lead levels in children 1–5 years of age, by race/ethnicity, in the U.S., 1997–2001. Data from U.S. Centers for Disease Control and Prevention (57).
C H I L D H O O D L E A D P O I S O N I N G I N G A LV E S T O N , T E X A S 25
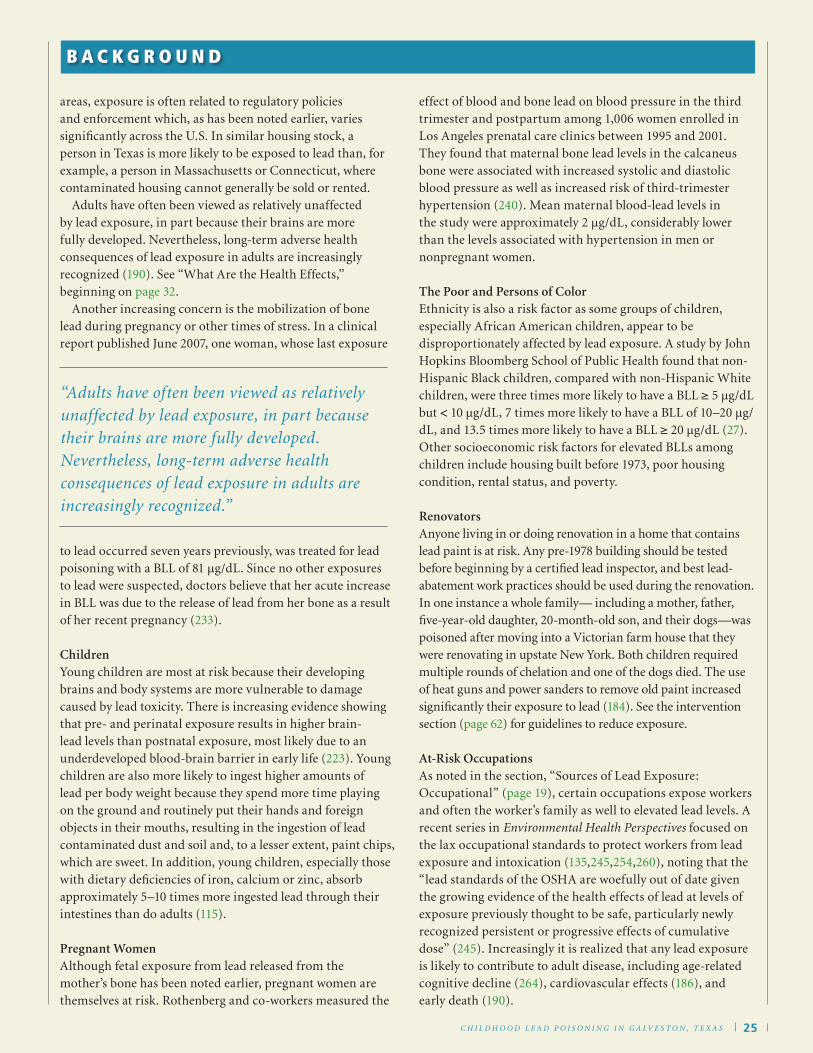
areas, exposure is often related to regulatory policies and enforcement which, as has been noted earlier, varies significantly across the U.S. In similar housing stock, a person in Texas is more likely to be exposed to lead than, for example, a person in Massachusetts or Connecticut, where contaminated housing cannot generally be sold or rented. Adults have often been viewed as relatively unaffected by lead exposure, in part because their brains are more fully developed. Nevertheless, long-term adverse health consequences of lead exposure in adults are increasingly recognized (190). See “What Are the Health Effects,” beginning on page 32. Another increasing concern is the mobilization of bone lead during pregnancy or other times of stress. In a clinical report published June 2007, one woman, whose last exposure
to lead occurred seven years previously, was treated for lead poisoning with a BLL of 81 µg/dL. Since no other exposures to lead were suspected, doctors believe that her acute increase in BLL was due to the release of lead from her bone as a result of her recent pregnancy (233).
ChildrenYoung children are most at risk because their developing brains and body systems are more vulnerable to damage caused by lead toxicity. There is increasing evidence showing that pre- and perinatal exposure results in higher brain-lead levels than postnatal exposure, most likely due to an underdeveloped blood-brain barrier in early life (223). Young children are also more likely to ingest higher amounts of lead per body weight because they spend more time playing on the ground and routinely put their hands and foreign objects in their mouths, resulting in the ingestion of lead contaminated dust and soil and, to a lesser extent, paint chips, which are sweet. In addition, young children, especially those with dietary deficiencies of iron, calcium or zinc, absorb approximately 5–10 times more ingested lead through their intestines than do adults (115).
Pregnant WomenAlthough fetal exposure from lead released from the mother’s bone has been noted earlier, pregnant women are themselves at risk. Rothenberg and co-workers measured the
effect of blood and bone lead on blood pressure in the third trimester and postpartum among 1,006 women enrolled in Los Angeles prenatal care clinics between 1995 and 2001. They found that maternal bone lead levels in the calcaneus bone were associated with increased systolic and diastolic blood pressure as well as increased risk of third-trimester hypertension (240). Mean maternal blood-lead levels in the study were approximately 2 µg/dL, considerably lower than the levels associated with hypertension in men or nonpregnant women.
The Poor and Persons of ColorEthnicity is also a risk factor as some groups of children, especially African American children, appear to be disproportionately affected by lead exposure. A study by John Hopkins Bloomberg School of Public Health found that non-Hispanic Black children, compared with non-Hispanic White children, were three times more likely to have a BLL ≥ 5 µg/dL but < 10 µg/dL, 7 times more likely to have a BLL of 10–20 µg/dL, and 13.5 times more likely to have a BLL ≥ 20 µg/dL (27). Other socioeconomic risk factors for elevated BLLs among children include housing built before 1973, poor housing condition, rental status, and poverty.
RenovatorsAnyone living in or doing renovation in a home that contains lead paint is at risk. Any pre-1978 building should be tested before beginning by a certified lead inspector, and best lead-abatement work practices should be used during the renovation. In one instance a whole family— including a mother, father, five-year-old daughter, 20-month-old son, and their dogs—was poisoned after moving into a Victorian farm house that they were renovating in upstate New York. Both children required multiple rounds of chelation and one of the dogs died. The use of heat guns and power sanders to remove old paint increased significantly their exposure to lead (184). See the intervention section (page 62) for guidelines to reduce exposure.
At-Risk OccupationsAs noted in the section, “Sources of Lead Exposure: Occupational” (page 19), certain occupations expose workers and often the worker’s family as well to elevated lead levels. A recent series in Environmental Health Perspectives focused on the lax occupational standards to protect workers from lead exposure and intoxication (135,245,254,260), noting that the “lead standards of the OSHA are woefully out of date given the growing evidence of the health effects of lead at levels of exposure previously thought to be safe, particularly newly recognized persistent or progressive effects of cumulative dose” (245). Increasingly it is realized that any lead exposure is likely to contribute to adult disease, including age-related cognitive decline (264), cardiovascular effects (186), and early death (190).
B A C K G R O U N D
“Adults have often been viewed as relatively unaffected by lead exposure, in part because their brains are more fully developed. Nevertheless, long-term adverse health consequences of lead exposure in adults are increasingly recognized.”

C H I L D H O O D L E A D P O I S O N I N G I N G A LV E S T O N , T E X A S26
B A C K G R O U N D
The Genetically SusceptibleGenetic factors may explain why uptake and symptoms differ among people with similar lead exposure and/or similar BLLs. Recent studies suggest that polymorphisms of the vitamin D receptor (VDR) and delta-aminolevulinic acid dehydratase (ALAD) genes may make certain individuals more vulnerable to lead (221). The VDR is important in maintaining calcium homeostasis and ALAD is an enzyme in the heme biosynthesis pathway. See also “Biological Mechanisms of Harm” (page 39).
LEAD ExpOSURE IN GALvESTON, TExAS
Founded in 1836, the City of Galveston is a historical town located in Galveston County off the coast of Southeast Texas. Prior to the 1900s, the island-city was a thriving metropolis with prosperous trade and wholesale businesses. From the 1920s to 1940s, Galveston became an entertainment hot spot filled with casinos and nightclubs that hosted big name performers such as Frank Sinatra and Duke Ellington. Today, Galveston continues to be a major tourist destination and is well known for its historical homes, ships, and landmarks. Galveston County in general and the City of Galveston in particular are disproportionately affected by environmental lead exposure (Figure 3; Table 4). Childhood BLLs in Galveston are significantly higher than the Texas and national averages, and have not followed the decreasing trend of BLLs in most of the nation. Despite the high percentage of children with elevated BLLs, funding support for outreach, screening, intervention and lead-abatement from government sources has not generally been forthcoming, in part because of the city’s small population, relative to other urban areas. Blood-lead screening data collected by the GCHD and the TX
CLPPP for 2001–2003 show that, of tested children under6 years of age, 11.5% who lived in Galveston County and 17.8% who lived in the City of Galveston had lead levels ≥ 10 µg/dL,compared with 2.8% of Texas children in general (103). Although the percentages vary somewhat depending on the source, the sampling methodology and the surveillance guidelines, they are surprisingly consistent across studies.
Javier and associates at the University of Texas Medical Branch (UTMB) in Galveston reviewed Medicaid lead-screening data collected between January 1993 and December 1994 from 1,571 low-income children age 6 months to 8 years who lived in the City of Galveston and who were tested at the UTMB Children’s Clinic (141). They found that 19.1% of the children had BLLs ≥ 10 µg/dL, with higher levels in east Galveston (zip codes 77550 and 77553) (141). In 2003, the Galveston Children’s Report Card gave the region an “F” for elevated BLLs in children (101). The numbers in Table 4, from several sources, are comparable to the data we received from the GCHD, which we analyze in the section titled “Galveston: Using GIS to Identify Hot Spots,” beginning on page 44. The City of Galveston, which accounted for over 80% of the elevated BLL cases reported in Galveston County from 1992 to 2002 (103), has a number of risk factors including high percentages of (1) African Americans, (2) children under the age of 5, (3) households with low incomes, and (4) older homes. In a study by Javier and associates, researchers found that prevalence of elevated lead was 23% in African Americans, compared with 17% in Whites, 13% in Hispanics and 11% in Asians (141). According to Census 2000, 23.4% of Galveston’s 57,247 residents are younger than 18 years, with the distribution nearly equal among Blacks (32.2%), Hispanics (35.5%) and Whites (27.9%). Galveston also has a high percentage (35.6%) of children less than 5 years of age living in poverty, which is of particular concern because children in low-income households are more likely to have poor nutrition as well as reside in deteriorated housing. In addition to socioeconomic risk factors, Galveston has a large number of older homes and apartments, both historic and non-historic. Of all the housing units in the city, 77.4% were built before 1978, according to the U.S. Census Bureau (279).
“Galveston County in general and the City of Galveston in particular are disproportionately affected by environmental lead exposure. Childhood BLLs in Galveston are significantly higher than the Texas and national averages, and have not followed the decreasing trend of BLLs in most of the nation.”
30
35
25
Perc
en
tag
e
Year
1997 1998 1999 2000 2001 2002 2003
15
10
5
0
Galveston City
Galveston County
Texas (Report Card)
f i g u r e 3
Percentage of children 6 years of age or younger with blood-lead levels ≥ 10 µg/dL. Sources: Galveston County Health District and Texas Department of State Health Services.
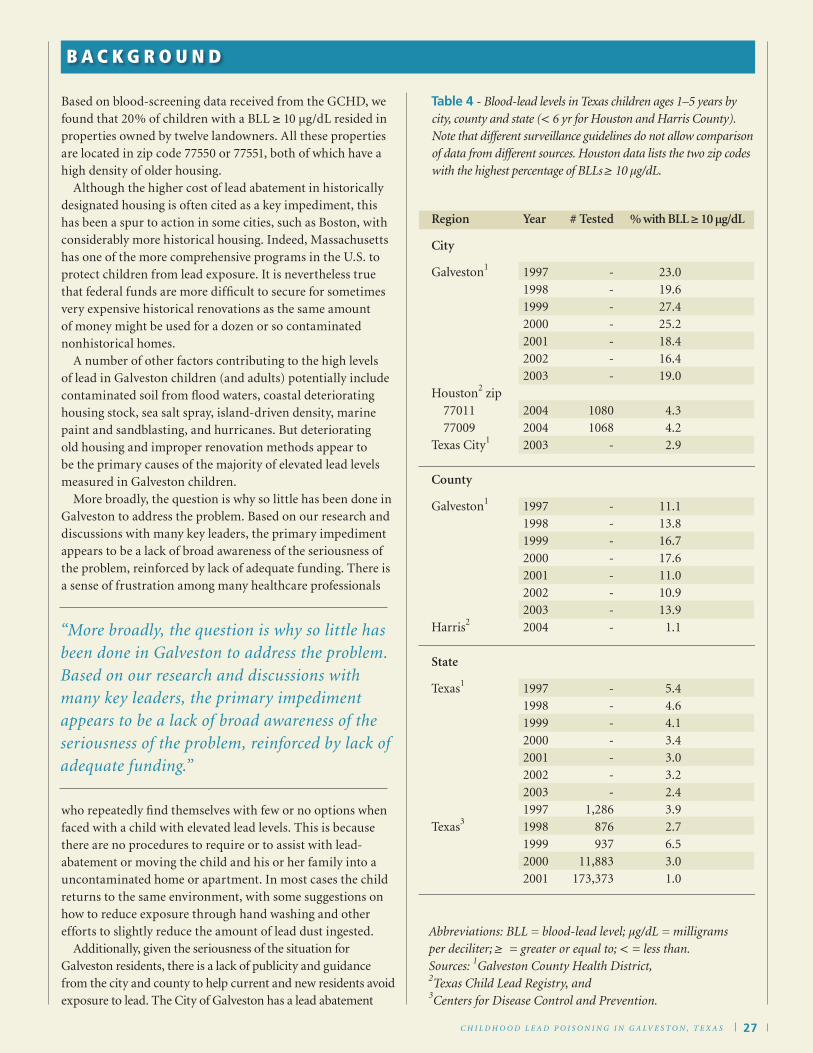
Based on blood-screening data received from the GCHD, we found that 20% of children with a BLL ≥ 10 µg/dL resided in properties owned by twelve landowners. All these properties are located in zip code 77550 or 77551, both of which have a high density of older housing. Although the higher cost of lead abatement in historically designated housing is often cited as a key impediment, this has been a spur to action in some cities, such as Boston, with considerably more historical housing. Indeed, Massachusetts has one of the more comprehensive programs in the U.S. to protect children from lead exposure. It is nevertheless true that federal funds are more difficult to secure for sometimes very expensive historical renovations as the same amount of money might be used for a dozen or so contaminated nonhistorical homes. A number of other factors contributing to the high levels of lead in Galveston children (and adults) potentially include contaminated soil from flood waters, coastal deteriorating housing stock, sea salt spray, island-driven density, marine paint and sandblasting, and hurricanes. But deteriorating old housing and improper renovation methods appear to be the primary causes of the majority of elevated lead levels measured in Galveston children. More broadly, the question is why so little has been done in Galveston to address the problem. Based on our research and discussions with many key leaders, the primary impediment appears to be a lack of broad awareness of the seriousness of the problem, reinforced by lack of adequate funding. There is a sense of frustration among many healthcare professionals
who repeatedly find themselves with few or no options when faced with a child with elevated lead levels. This is because there are no procedures to require or to assist with lead-abatement or moving the child and his or her family into a uncontaminated home or apartment. In most cases the child returns to the same environment, with some suggestions on how to reduce exposure through hand washing and other efforts to slightly reduce the amount of lead dust ingested. Additionally, given the seriousness of the situation for Galveston residents, there is a lack of publicity and guidance from the city and county to help current and new residents avoid exposure to lead. The City of Galveston has a lead abatement
C H I L D H O O D L E A D P O I S O N I N G I N G A LV E S T O N , T E X A S 27
B A C K G R O U N D
“More broadly, the question is why so little has been done in Galveston to address the problem. Based on our research and discussions with many key leaders, the primary impediment appears to be a lack of broad awareness of the seriousness of the problem, reinforced by lack of adequate funding.”
Table 4 - Blood-lead levels in Texas children ages 1–5 years by city, county and state (< 6 yr for Houston and Harris County). Note that different surveillance guidelines do not allow comparison of data from different sources. Houston data lists the two zip codes with the highest percentage of BLLs ≥ 10 µg/dL.
Abbreviations: BLL = blood-lead level; µg/dL = milligrams per deciliter; ≥ = greater or equal to; < = less than.Sources: 1Galveston County Health District, 2Texas Child Lead Registry, and 3Centers for Disease Control and Prevention.
Region
City
Galveston1
Houston2 zip 77011 77009Texas City1
County
Galveston1
Harris2
State
Texas1
Texas3
Year
1997199819992000200120022003
200420042003
19971998199920002001200220032004
199719981999200020012002200319971998199920002001
# Tested
-------
10801068
-
--------
-------
1,286876937
11,883173,373
23.019.627.425.218.416.419.0
4.34.22.9
11.113.816.717.611.010.913.9
1.1
5.44.64.13.43.03.22.43.92.76.53.01.0
% with BLL ≥ 10 µg/dL

C H I L D H O O D L E A D P O I S O N I N G I N G A LV E S T O N , T E X A S28
B A C K G R O U N D
regulation to limit contamination when removing exterior paint (see the current lead ordinance for Galveston, beginning on page 79, under “Intervention: Getting the Lead Out”). Likewise, the Galveston Historical Foundation has a paint program and is also renovating a contaminated low-income historically significant home using best practices. However, currently neither the City nor the Foundation’s websites about restoring historical homes include information about potential exposure to lead and lead safe practices. Fortunately, a number of recent efforts—including commission of this report—suggest that there is considerable
interest in the community to address this issue in a holistic way that involves not just the GCHD, but local foundations, HUD, the Galveston City Council, the Galveston Historical Foundation, the Galveston Independent School District and Galveston realtors. Most successful efforts in the U.S. have utilized a collaborative approach and strong leadership to make fundamental changes to eliminate lead exposure.
Historical Housing in GalvestonAs noted above, Galveston has an impressive number of historical housing units, some of which are legally protected and many others which are worthy of preservation. See “Using GIS to Identify Hot Spots in Galveston: Results” (page 51) for a map showing the Galveston historical districts, as well as pre-1950 and pre-1978 housing. Although the guidelines for historical renovation vary significantly throughout the city (personal communication, Brian Davis, Galveston Historical Foundation, August 2007), there are municipal, foundation-supported and federal programs in place to help with historical lead abatement. Having a historical property does not exempt owners from protecting workers, neighbors and residents from exposure to lead. Within the City of Galveston, there are six designated historical districts, most of which are nationally designated historic districts:
• East End (approximately 463 residential structures), • Silk Stocking (approximately 203 residential structures), • The Strand (approximately 45 mainly commercial structures,
with some mixed-use apartments or town homes), • Lost Bayou (approximately 190 residential structures),• Cedar Lawn (approximately 98 residential structures), and • Denver Court (approximately 389 residential structures).
The approximately 1,300 residential structures within these districts must adhere to guidelines prepared by the City of Galveston to preserve the historic integrity of the structures, while also ensuring that the buildings are safe for habitation. The Galveston Historical Foundation notes that all structures east of 61st street are considered historic, although there are no enforceable renovation guidelines for structures outside of those in place for the designated historic districts and buildings that have been named historic landmarks by national, state or local authorities. Of the 13,473 residential structures between 1st and 81st streets included in our analysis, approximately 10% are legally designated historical housing units.
WHAT ARE THE REAL COSTS OF LEAD pOISONING?
Many people are aware that exposure to lead is dangerous, especially to children. They often think that high levels of lead may reduce a child’s IQ by a few points, but that this is either inconsequential or reversible once the lead level is reduced. Many people also think that elevated lead levels are not common and that BLLs below 10 µg/dL are “safe.” None of these assumptions is true. As discussed in detail in the “What Are the Health Effects: Neurological” section (beginning on page 32), any amount of lead in the body—especially in children—negatively affects cognition, behavior and health. The American Academy of Pediatrics (AAP) argues that the negative effects of lead on academic performance have a major impact on the child’s future social function, employment and earnings (10). Some critics, however, are not convinced that a couple of lost IQ points will negatively affect a child’s future, claiming that extra schooling and one-on-one tutoring will compensate for the slower learning pace. First, most evidence suggests that most of the damage is irreversible. Second, children with low-level lead poisoning are seldom even identified, let alone offered extra help. This is especially true for those most at risk, low-income minority children. Third, the loss of several IQ points at the population level has a massive effect on society as a whole. In his essay, “Exposure to Lead in Children – How Low is Low Enough?,” Rogan states, “Although critics question the importance of small decrements in the IQs of individual children . . . relatively small changes in the mean IQ of a large number of children will dramatically increase the proportion of children below any fixed level of concern, such as an IQ of 80, and decrease the proportion above any “gifted” level, such as 120” (236). Based on recent data, roughly 50% of the nation’s children have lead levels high enough to negatively affect school performance (199). In addition, lead neurotoxicity does not only affect IQ. It decreases graduation rates and increases antisocial and criminal behavior. Lead is strongly linked with numerous behavior disorders and learning problems including
“Additionally, given the seriousness of the situation for Galveston residents, there is a lack of publicity and guidance from the city and county to help current and new residents avoid exposure to lead.”

dyslexia, autism, attention deficit disorder, diminished self esteem, and increased aggression and impulsivity. These problems undermine achievement and directly or indirectly affect everyone. Researchers from the CDC and Harvard University quantified the economic benefits from projected improvements in worker productivity resulting from the reduction in children’s exposure to lead in the U.S. since 1976 (116). Based on published studies, they estimated that IQ scores decrease between 0.185 and 0.323 points for each 1 µg/dL of lead in the blood, and that each IQ point raises a worker’s productivity by 1.76%–2.38%. They then calculated the economic benefit associated with that increased productivity for each year’s cohort of approximately 3.8 million 2-year-old children between 1976 and 1999, based on their mean BLL. The authors calculated that the annual economic benefit of reduced BLLs in 2-year-old children since 1976 ranged from $110 to $319 billion. In another study, using an environmentally attributable fraction model, it was estimated that the present value of economic losses in the U.S. attributable to lead exposure amounts to $43.4 billion per year in each annual birth cohort (155). More recently, one study estimated that mild mental retardation and cardiovascular disease resulting from exposure to lead amounts to almost 1% of the global burden of disease (96).
CrimeOne particularly well studied association is that of childhood exposure to lead and antisocial behavior, including crime and/or incarceration in later life (212,213,215,216,268). Numerous studies have shown that lead-exposure related effects, such as reduced school performance, attention deficit and hyperactivity disorder (ADHD) and various antisocial and aggressive behaviors, contribute to an increased probability of violence and delinquent activity in later life. Herbert Needleman, one of the foremost lead experts in the nation, and associates published one such study in 2002 in Neurotoxicology and Teratology. His group measured tibia bone-lead levels in 194 arrested and adjudicated 12–18-year-old delinquents and in 146 non-delinquent teenagers attending high school (212). They found that the delinquents had significantly higher bone lead concentrations than the controls (212). The work of Stretesky and Lynch, two sociologists at Colorado State University, supports this finding. These investigators conducted a cross-sectional ecological study looking at the homicide rates in 3,111 U.S. counties (267). After adjusting for six sociological and nine air pollutant factors, they found that the counties with the highest air lead concentrations had four times the murder rate of the counties with the lowest air lead concentrations (267). Rick Nevin, an economist, examined the temporal relationships between the rates for multiple types of crime and the amount of lead in gasoline and paint lead, the two major sources of exposure in the U.S. (215). Using a lag of approximately 20 years, he
demonstrated that since the early 1900s, the rates of virtually all types of major crime in the U.S. have followed remarkably closely to the changes in lead exposure, suggesting a strong influence of lead exposure on criminal activity (Figure 4) (215). These recent studies reinforce seminal work published by Needleman and associates in 1979—nearly 30 years ago—that found a clear association between elevated levels of lead in baby teeth in apparently asymptomatic elementary school children and numerous measures of negative behavior and overall poor functioning (211).
C H I L D H O O D L E A D P O I S O N I N G I N G A LV E S T O N , T E X A S 29
B A C K G R O U N D
Lead Year : Crime Year (23 year lag)
1941
: 19
64
1944
: 19
67
1947
: 19
70
1950
: 19
73
1953
: 19
76
1956
: 19
79
1959
: 19
82
1962
: 19
85
1965
: 19
88
1968
: 19
91
1971
: 19
94
1974
: 19
97
1977
: 20
00
1980
: 20
03
1983
: 20
06
1986
: 20
09
8000
7000
6000
5000
4000
3000
2000
1000
0
Ton
s o
f G
aso
line
Lead
per
Th
ou
san
d P
op
ula
tio
n
Vio
len
t C
rim
ep
er 1
00,0
00 In
hab
itan
ts
1.5
1.2
0.9
0.6
0.3
0
Gasoline LeadViolent Crime
Gasoline lead vs. violent crime. Redrawn from Nevin et al (215).
f i g u r e 4