childhood diet and mobilityat medieval (1240s ad) solt
TRANSCRIPT

CHILDHOOD DIET AND MOBILITYAT MEDIEVAL (1240s AD) SOLT-TÉTELHEGY, HUNGARY AS RECONSTRUCTED FROM STABLE CARBON, NITROGEN, AND
OXYGEN ISOTOPE ANALYSIS
by
ARIANA GUGORA B.A. University of Florida, 2011
A thesis submitted in partial fulfillment of the requirements for the degree of Master of Arts
in the Department of Anthropology in the College of Sciences
at the University of Central Florida Orlando, Florida
Spring Term
2015

ii
©2015 Ariana Gugora
iii
ABSTRACT
Between 2005 and 2009, archaeologists excavated more than 100 skeletons from the medieval
(1240s AD) Hungarian site of Solt-Tételhegy. Stable carbon and nitrogen isotope analyses were
conducted on dental enamel and dentin from 24 individuals to examine their childhood diet.
Although previous stable isotopic research has described the diet of medieval European peoples,
this is the first such study on a medieval Hungarian population. The enamel δ13C values range
from -14.4‰ to -8.6‰, with a mean of -11.1‰, while the dentin δ13C values range from -19.4‰
to -14.9‰, with an average of -17.4‰. These data indicate that C3 plants were the main plant
type consumed by the majority of this population, with the exception of a few individuals, who
appear to have included C4 plants in their diet. These results are to be expected, given the
dominance of C3 over C4 plants in medieval Central Europe. Thus, based on historical and
isotopic evidence, the outliers may have spent their childhoods elsewhere and later migrated into
the Solt-Tételhegy area. The δ15N values range from 9.5‰ to 11.6‰, with a mean of 10.6‰,
indicating that animal protein was prevalent in the diets of the sample population. Despite clear
signs of status differences indicated by burial location, stable nitrogen values also point to
relatively egalitarian access to animal protein amongst the individuals. The enamel δ18Op values
range from 23.6‰ to 27.2‰, with an average of 25.1‰, suggesting that multiple migrations
occurred into the study site. The results of this study show that the dietary and mobility
information gleaned from stable isotope analysis can be used to interpret the lifeways of
archaeological peoples.

iv
ACKNOWLEDGMENTS
First and foremost, I would like to thank my family and friends for their encouragement
in my academic endeavors, particularly this year. The support I have received from my parents,
especially from my mother, has helped me in every way during graduate school, and I do not
think I would have been as successful without it. I would like to thank my adviser and my
committee members, Dr. Tosha Dupras, Dr. Lana Williams, and Dr. John Schultz, for their
encouragement and input throughout my Master's coursework. I would not have gotten through it
without them. Dr. Tosha Dupras has consistently made time to discuss my thesis with me,
whether it was to troubleshoot mysteriously disappearing values on a scatterplot or to provide
detailed comments on my drafts. She was so very patient with my edits and questions. Dr. Lana
Williams supported and guided me from the beginning of my graduate studies, and I am as
grateful for this now as I was when I started. Dr. John Schultz, too, has been instrumental,
because his feedback, particularly on my term papers, has enabled me to grow significantly as a
scientific writer. Likewise, this study would not have been possible without Dr. Erzsébet Fóthi at
the Hungarian Natural History Museum in Budapest, and I thank her for allowing me to work on
this remarkable sample and for the opportunity to forge research ties with the museum. I would
also like to thank the Colorado Plateau Stable Isotope Laboratory at the University of Arizona
and the Light Stable Isotope Mass Spectrometry Laboratory at the University of Florida for
processing these samples so quickly.
v
TABLE OF CONTENTS
LIST OF FIGURES ..................................................................................................................... viii
LIST OF TABLES ........................................................................................................................ xii
CHAPTER ONE: INTRODUCTION ............................................................................................. 1
Historical Background ................................................................................................................ 2
CHAPTER TWO: LITERATURE REVIEW ................................................................................. 9
Teeth ........................................................................................................................................... 9
Stable Isotopes .......................................................................................................................... 11
Collagen ................................................................................................................................ 14
Hydroxyapatite ...................................................................................................................... 15
Carbon ................................................................................................................................... 16
Nitrogen ................................................................................................................................ 18
Oxygen .................................................................................................................................. 21
Medieval European Diet ........................................................................................................... 24
Limitations of Stable Isotopes in Bioarchaeology .................................................................... 29
CHAPTER THREE: MATERIALS AND METHODS ............................................................... 30
Samples from Solt-Tételhegy ................................................................................................... 30
Materials ................................................................................................................................... 36
Methods..................................................................................................................................... 39

vi
Collagen ................................................................................................................................ 39
Apatite ................................................................................................................................... 41
CHAPTER FOUR: RESULTS ..................................................................................................... 43
Sample Preservation.................................................................................................................. 43
Collagen ................................................................................................................................ 43
Apatite ................................................................................................................................... 49
Diet ............................................................................................................................................ 50
Collagen ................................................................................................................................ 50
Apatite ................................................................................................................................... 59
Origins and Mobility ................................................................................................................. 61
CHAPTER FIVE: DISCUSSION ................................................................................................. 66
General Diet in Medieval Hungary and East-Central Europe .................................................. 66
Diet and Stable Isotopes............................................................................................................ 68
C3 and C4 Plant Consumption ............................................................................................... 68
Diet and Tooth Type ................................................................................................................. 71
Social Influences on Diet .......................................................................................................... 72
Diet and Illness ......................................................................................................................... 75
Diet and Migration .................................................................................................................... 75
Moravian Migration .............................................................................................................. 79

vii
Other Migrations ................................................................................................................... 82
Prevalence of Migration amongst C3 vs. C4 Plant-eaters ...................................................... 84
CHAPTER SIX: CONCLUSIONS ............................................................................................... 86
Future Directions ...................................................................................................................... 88
REFERENCES ............................................................................................................................. 89

viii
LIST OF FIGURES
Figure 1. Map of the Kingdom of Hungary in the late 13th century AD (taken from
http://commons.wikimedia.org/wiki/File:Hungary_13th_cent.png#/media/File:Hungary_13th_ce
nt.png). ............................................................................................................................................ 3
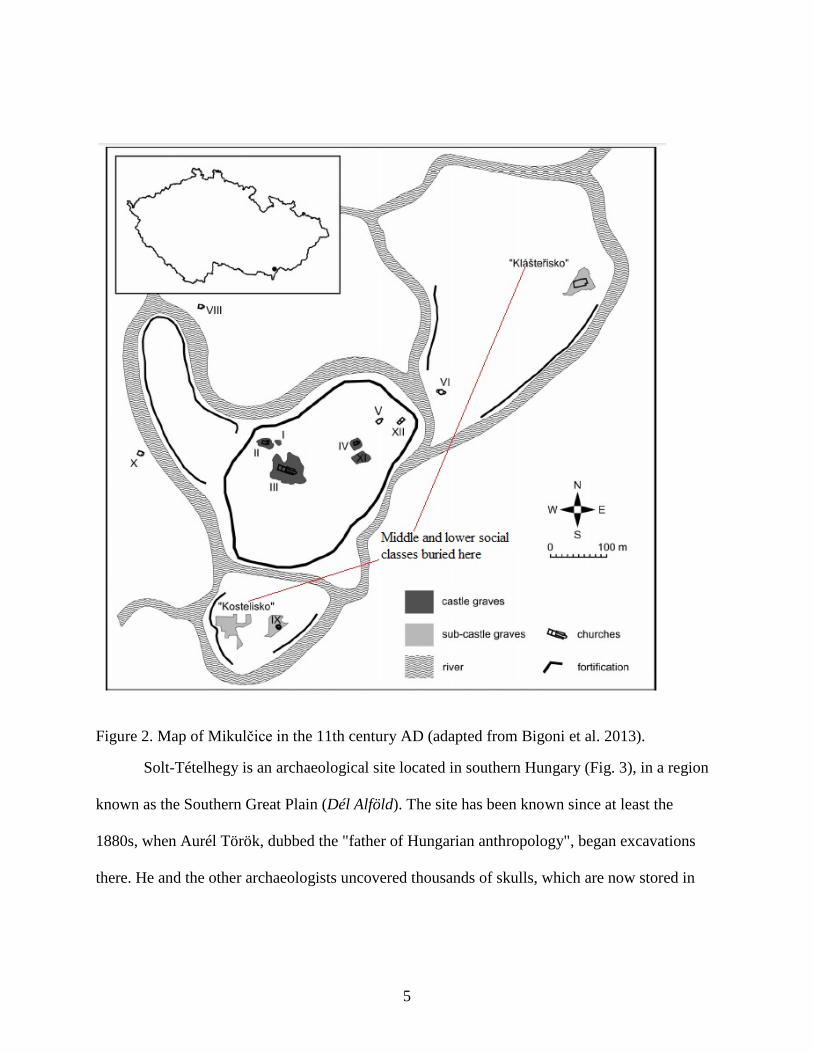
Figure 2. Map of Mikulčice in the 11th century AD (adapted from Bigoni et al. 2013). ............... 5
Figure 3. Map of present-day Hungary, with the study site of Solt-Tételhegy circled in red.
Because medieval Hungary was larger, Solt-Tételhegy would have been in the center of the
kingdom (adapted from
http://commons.wikimedia.org/wiki/File:HU_counties_names.svg#/media/File:HU_counties_na
mes.svg). ......................................................................................................................................... 6
Figure 4. Aerial view of Solt-Tételhegy's templomdomb, or hill-church, prior to excavations in
2005 (adapted from Szentpéteri 2009; 2010).................................................................................. 7
Figure 5. Photograph of the excavation of the Árpádian/medieval cemetery (image courtesy of J.
Szentpéteri). .................................................................................................................................. 30
Figure 6. Photograph of a skeleton interred near the medieval church (image courtesy of J.
Szentpéteri). .................................................................................................................................. 31
Figure 7. Excavation map of the cemetery (upper) and the church (lower) at Solt-Tételhegy
(courtesy of J. Szentpéteri). .......................................................................................................... 32
Figure 8. Skull of male (ST 4) excavated from grave 4 in the cemetery (Fóthi and Bernert 2014)
and the tooth sample extracted from it (photograph taken by A. Gugora 2014). Note the longer
and narrower brain case. ............................................................................................................... 34

ix
Figure 9. Skull of male (ST 56) excavated from grave 56 in the cemetery (Fóthi and Bernert
2014) and the tooth sample extracted from it (photograph taken by A. Gugora 2014). Again, note
the longer and narrower brain case. .............................................................................................. 35
Figure 10. Hyperbrachycranic skull of male (ST 304) buried inside the medieval church (Fóthi
and Bernert 2014). Note the shorter and wider brain case. ........................................................... 35
Figure 11. Hyperbrachycranic skull of female (ST 300/I) buried inside the medieval church
(Fóthi and Bernert 2014). Again, note the shorter and wider brain case. ..................................... 36
Figure 12. Graph showing the distribution of age (years) and sex from the sample population. . 38
Figure 13. Pie chart with the percentage of sexes in the sample population. ............................... 38
Figure 14. Graph of the carbon weight percentage (% C) and δ13C (‰) values from dentin
collagen. The red dotted line indicates the maximum cut-off for acceptable collagen preservation
at 47%. .......................................................................................................................................... 45
Figure 15. Graph showing the nitrogen weight percentage (%N) and δ15N (‰) from dentin
collagen. The red dotted line shows the maximum cut-off for acceptable collagen preservation at
17.3%. ........................................................................................................................................... 46
Figure 16. Graph depicting the linear relationship (with a trend line) between the carbon weight
percentage (%C) and the nitrogen weight percentage (%N) from dentin collagen samples. ....... 47
Figure 17. Graph depicting the collagen yield vs. the C:N ratio from dentin. The red dotted lines
show that the sample falls within the acceptable C:N range. ....................................................... 48
Figure 18. Graph depicting δ13C (‰) and δ15N (‰) from dentin collagen. ................................. 51
Figure 19. Graph showing the relationship between median age (years) and δ13C (‰) from dentin
collagen. The results are sorted by tooth type. .............................................................................. 52

x
Figure 20. Graph depicting the relationship between median age (years) and δ15N (‰) from
dentin collagen. The results are sorted by tooth type. ................................................................... 52
Figure 21. Graph comparing δ13C (‰) and δ15N (‰) from dentin collagen. The results are
differentiated by tooth type. .......................................................................................................... 53
Figure 22. Graph comparing δ13C (‰) and δ15N (‰) from dentin collagen. The results are sorted
by sex. ........................................................................................................................................... 54
Figure 23. Graph comparing δ13C (‰) and δ15N (‰) from dentin collagen. The results are
distinguished by burial location. ................................................................................................... 55
Figure 24. Graph showing the percentage of C4 plants consumed in relation to dentin δ13C (‰)
versus δ15N (‰) values. The results are sorted by sex. ................................................................ 57
Figure 25. Graph showing the percentage of C4 plants consumed in relation to dentin δ13C (‰)
versus δ15N (‰). The results are distinguished by tooth type. ..................................................... 58
Figure 26. Graph depicting the percentage of C4 plants consumed in relation to dentin δ13C (‰)
versus δ15N (‰). The results are sorted by burial location. .......................................................... 58
Figure 27. Graph of the relationship between median age (years) and δ13C (‰) from enamel
apatite. The results are distinguished by tooth type. ..................................................................... 59
Figure 28. Graph depicting differences in δ13C (‰) from enamel apatite (carbonate) and δ13C
(‰) from dentin collagen. The results are differentiated by sex. ................................................. 60
Figure 29. Graph showing differences in δ13C (‰) from enamel apatite (carbonate) and δ13C (‰)
from dentin collagen. The results are distinguished by burial location. ....................................... 61
Figure 30. Graph showing the relationship between median age (years) and δ18O (‰) from
enamel apatite. The results are differentiated by tooth type. ........................................................ 63

xi
Figure 31. Graph comparing δ13C (‰) and δ18O (‰) from enamel apatite. The results are sorted
by sex. ........................................................................................................................................... 64
Figure 32. Graph showing δ13C (‰) versus δ18O (‰) from enamel apatite. The results are
distinguished by burial location. ................................................................................................... 65
Figure 33. Oxygen isoscape map of Europe, with the δ18O values (‰) of annual precipitation
reported in VSMOW (adapted from waterisotopes.org)............................................................... 78
Figure 34. Oxygen isoscape map of Eurasia, with the δ18O values (‰) of annual precipitation
reported in VSMOW. Hungary has been circled in black (adapted using ArcGIS from
waterisotopes.org). ........................................................................................................................ 79
Figure 35. Map of the trade routes in medieval (800-1300 AD) Europe, with the study site
denoted by the red marker (adapted from sumy.net.ua). .............................................................. 83
Figure 36. Oxygen isoscape map focused on Europe, North Africa, and the Middle East. The
δ18O values (‰) of annual precipitation are reported in VSMOW. Hungary has been circled in
black (adapted using ArcGIS from waterisotopes.org). ................................................................ 84

xii
LIST OF TABLES
Table 1. Developmental stages of permanent first and second molars (Dupras and Tocheri 2007;
Holly 1991; Leicester 1953). ........................................................................................................ 11
Table 2. The relative terrestrial abundances of carbon and nitrogen isotopes (adapted from
Katzenberg 2008). ......................................................................................................................... 12
Table 3. Sources of nitrogen enrichment in humans. .................................................................... 21
Table 4. Summary of medieval European diet studies. ................................................................ 26
Table 5. Study samples from medieval Solt-Tételhegy, Hungary. ............................................... 37
Table 6. Stable carbon and nitrogen isotope results from dentin collagen for the Solt-Tételhegy
samples. ......................................................................................................................................... 44
Table 7. Stable carbon and oxygen isotope results from enamel apatite for the Solt-Tételhegy
samples. ......................................................................................................................................... 49
Table 8. Values for dentin δ13C and percentage of C4 plants (PC4) in the diet of the research
sample, sorted from lowest to highest PC4 value. ......................................................................... 56
Table 9. Stable oxygen isotope results for Solt-Tételhegy, reported in VSMOW. ...................... 62
Table 10. Summary of the stable oxygen isotope results from Brettell et al. (2012) and Daux et
al. (2008). ...................................................................................................................................... 76
Table 11. The δ18O values (‰) for the research sample, reported in VSMOW. .......................... 81

1
CHAPTER ONE: INTRODUCTION
Stable isotope analysis has been employed by bioarchaeologists since the early 1970s to
understand the diet, nutritional health, weaning history, and migration patterns of both
prehistoric and historic humans (Giblin 2009; Harrison and Katzenberg 2003; Macko et al. 1999;
Schoeninger and Moore 1992). Although many authors have published on the diet of medieval
Europeans, there is currently no stable isotopic research on the diet of ancient people from
Hungary, particularly during the medieval period. As a result, the purpose of this pilot study is to
ascertain the childhood diet of twenty-four individuals from medieval (1240s AD) Solt-
Tételhegy (in southern Hungary), using stable carbon and nitrogen isotope analysis of dental
enamel and dentin. This research will examine if sex and status influenced the diet of these
people, as four of the individuals from the sample are thought to have occupied a higher rung in
society due to their burial location (Fóthi and Bernert 2014). Additionally, the study highlights
the probability that migration into the site occurred, using data from stable oxygen isotope
analysis of enamel. Because there is a dearth of Central European stable isotope studies, the
results from Solt-Tételhegy could serve as the springboard for further such research in Hungary
and in other countries from the region. Dietary information from these areas will enrich the
current understanding of how different medieval peoples lived in Europe, while also providing a
comparison based on culture- and/or location-specific variables. Oxygen isotope information
may begin to lay the foundation for future mobility studies in Hungary, by providing information
of origin and mobility for the medieval peoples in this area.
2
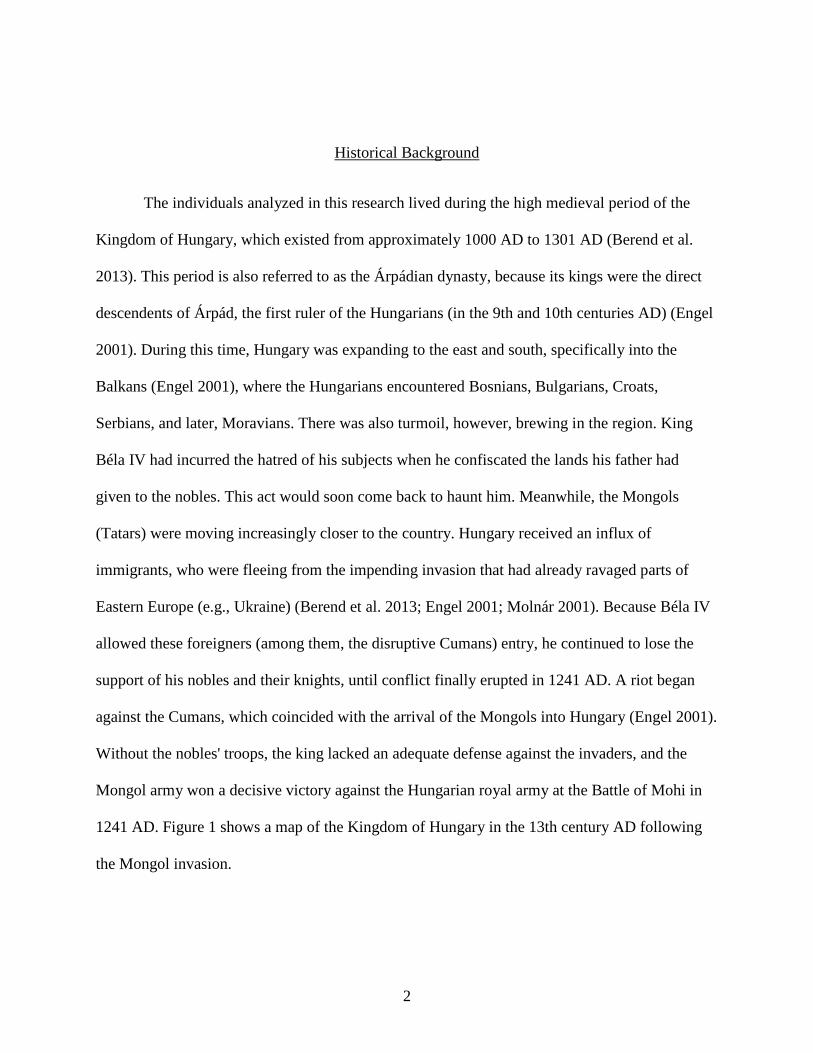
Historical Background
The individuals analyzed in this research lived during the high medieval period of the
Kingdom of Hungary, which existed from approximately 1000 AD to 1301 AD (Berend et al.
2013). This period is also referred to as the Árpádian dynasty, because its kings were the direct
descendents of Árpád, the first ruler of the Hungarians (in the 9th and 10th centuries AD) (Engel
2001). During this time, Hungary was expanding to the east and south, specifically into the
Balkans (Engel 2001), where the Hungarians encountered Bosnians, Bulgarians, Croats,
Serbians, and later, Moravians. There was also turmoil, however, brewing in the region. King
Béla IV had incurred the hatred of his subjects when he confiscated the lands his father had
given to the nobles. This act would soon come back to haunt him. Meanwhile, the Mongols
(Tatars) were moving increasingly closer to the country. Hungary received an influx of
immigrants, who were fleeing from the impending invasion that had already ravaged parts of
Eastern Europe (e.g., Ukraine) (Berend et al. 2013; Engel 2001; Molnár 2001). Because Béla IV
allowed these foreigners (among them, the disruptive Cumans) entry, he continued to lose the
support of his nobles and their knights, until conflict finally erupted in 1241 AD. A riot began
against the Cumans, which coincided with the arrival of the Mongols into Hungary (Engel 2001).
Without the nobles' troops, the king lacked an adequate defense against the invaders, and the
Mongol army won a decisive victory against the Hungarian royal army at the Battle of Mohi in
1241 AD. Figure 1 shows a map of the Kingdom of Hungary in the 13th century AD following
the Mongol invasion.

3
Figure 1. Map of the Kingdom of Hungary in the late 13th century AD (taken from http://commons.wikimedia.org/wiki/File:Hungary_13th_cent.png#/media/File:Hungary_13th_cent.png).
This defeat marked the beginning of a time of socioeconomic and political crisis for the
medieval Hungarians. Villages disappeared (31 out of 43 in Orosháza), trade routes crumbled,
and commerce virtually disappeared from entire regions (e.g., Bács and Ungvár). Parts of the
Great Plain (Alföld), where the Mongols had camped for a year, were completely destroyed.
Farmland that had been ravaged no longer yielded crops, causing widespread famine and social
unrest. And although the war had claimed casualties, as had the resulting disease epidemics, the
Mongols also took captives, leading to a population decline by about 15-20% (Engel 2001;
Molnár 2001). Striving to rebuild his kingdom, Béla IV enacted drastic changes, one of which
4
was the formation of a new class of free peasant tenants (Engel 2001). Instead of working the
land as serfs, they could now "rent" their own plots, which may have enabled them to improve
their overall diet. Additionally, in an effort to repopulate Hungary, the king invited Germans,
Poles, Romanians, and Moravians, along with other ethic peoples, to settle in the various regions
(Berend et al. 2013; Molnár 2001). It is this last group, the Moravians, who are of particular
importance to this research. The Moravians are a Slavic ethnic group that broke off from the
Kingdom of Croatia to settle along the River Moravia in the 9th century AD (Bigoni et al. 2013;
Róna-Tas 1999). They established Great Moravia, whose most important settlement was
Mikulčice (Fig. 2). With multiple churches, burial grounds, and handicraft industries, it was both
an administrative and a cultural center. The higher classes intermixed with the lower classes, as
evidenced by the lack of social stratification of individuals interred in the churchyard (Bigoni et
al. 2013). For whatever reason, it appears that some of the Moravians left Great Moravia and
later inhabited parts of southern Hungary (Berend et al. 2013). It is from this group that part of
this research sample most likely originates.
5
Figure 2. Map of Mikulčice in the 11th century AD (adapted from Bigoni et al. 2013).
Solt-Tételhegy is an archaeological site located in southern Hungary (Fig. 3), in a region
known as the Southern Great Plain (Dél Alföld). The site has been known since at least the
1880s, when Aurél Török, dubbed the "father of Hungarian anthropology", began excavations
there. He and the other archaeologists uncovered thousands of skulls, which are now stored in

6
the Anthropological Collection of the Hungarian Natural History Museum in Budapest
(Szentpéteri 2009).
Figure 3. Map of present-day Hungary, with the study site of Solt-Tételhegy circled in red. Because medieval Hungary was larger, Solt-Tételhegy would have been in the center of the kingdom (adapted from http://commons.wikimedia.org/wiki/File:HU_counties_names.svg#/media/File:HU_counties_names.svg).
There are five primary medieval settlements, spanning 100 hectares, at Solt-Tételhegy:
the templomdomb (hill-church) and várdomb (hill-fortress) to the north, a third on the east side, a
fourth in the central part, and a fifth to the south (Szentpéteri 2009). The most intensive
settlements were at the templomdomb and várdomb, but all five areas may have been larger and
more densely populated than other contemporaneous settlements in the region. Such a cluster of

7
habitations, including at least two churches, was relatively rare in the region. Additionally, other
archaeological evidence (e.g., well-constructed houses, high-quality decorative items, expensive
grave goods, imported ceramics, and tax stamps) suggests a higher-status settlement. Therefore,
medieval Solt-Tételhegy is comparable to Árpádian-period administrative centers, such as Bács.
Solt-Tételhegy's hill-church (Fig. 4) was used as a cemetery since the middle Bronze Age
(by the Vatya culture), first as a pagan cemetery, and then as a Christian cemetery (Somogyvári
2014; Szentpéteri 2009). As such, the site contains artifacts and human remains from many
different time periods, including the high medieval or Árpádian period (1000-1301 AD). During
the middle Bronze Age (2200-1570 BC), trenches were dug and ramparts were constructed, the
latter of which were fortified in the Middle Ages.
Figure 4. Aerial view of Solt-Tételhegy's templomdomb, or hill-church, prior to excavations in 2005 (adapted from Szentpéteri 2009; 2010).
It is thought by Fóthi and Bernert (2014) that some of the Moravians who left Mikulčice
are buried at Solt-Tételhegy, and their skeletons are among the 108 excavated by archaeologist
József Szentpéteri and his team in 2009. The builder of one of the churches and possibly three of

8
his family members may have been Moravians. They were interred inside the church itself, thus
suggesting that they occupied a higher social status (Singman 2013). These four individuals are
also included in the research sample.
The purpose of this research is threefold: 1) to examine the childhood diet of twenty-four
inhabitants from medieval (1240s AD) Solt-Tételhegy, Hungary, 2) to identify migrants within
the study population, and 3) to pinpoint as precisely as possible the geographic origins of the
immigrants. In other words, what foods did the inhabitants of medieval (1240s) Solt-Tételhegy
eat during childhood? Were there migrants within the study population? And, if so, where did the
immigrants come from? Additionally, the influence of sex and status on diet is also discussed.
Stable carbon and nitrogen isotope analyses from dental enamel and dentin were used to
determine childhood diet, while stable oxygen isotope analysis from enamel was used to confirm
childhood migration. This research is the first to apply stable isotope analysis to address
childhood diet and mobility of a population from medieval Hungary. It is also unique in that it
provides an isotopic comparison of the childhood diet of a medieval Hungarian population with
that of contemporaneous European populations.
9
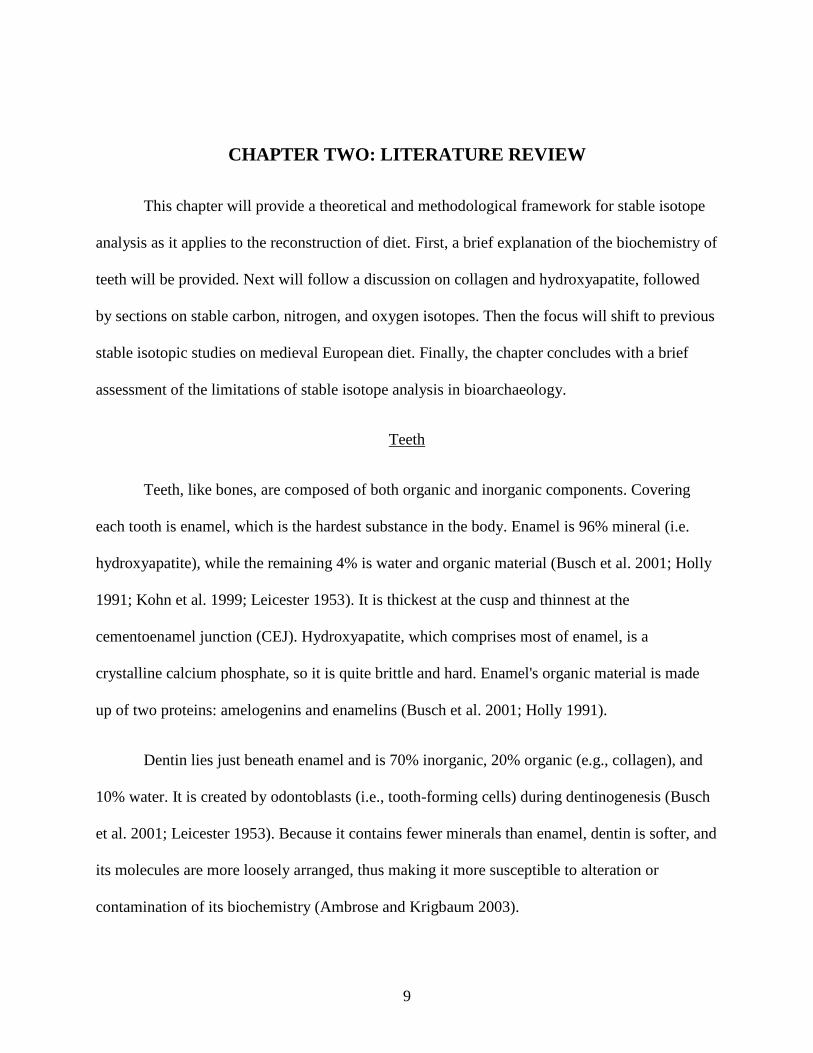
CHAPTER TWO: LITERATURE REVIEW
This chapter will provide a theoretical and methodological framework for stable isotope
analysis as it applies to the reconstruction of diet. First, a brief explanation of the biochemistry of
teeth will be provided. Next will follow a discussion on collagen and hydroxyapatite, followed
by sections on stable carbon, nitrogen, and oxygen isotopes. Then the focus will shift to previous
stable isotopic studies on medieval European diet. Finally, the chapter concludes with a brief
assessment of the limitations of stable isotope analysis in bioarchaeology.
Teeth
Teeth, like bones, are composed of both organic and inorganic components. Covering
each tooth is enamel, which is the hardest substance in the body. Enamel is 96% mineral (i.e.
hydroxyapatite), while the remaining 4% is water and organic material (Busch et al. 2001; Holly
1991; Kohn et al. 1999; Leicester 1953). It is thickest at the cusp and thinnest at the
cementoenamel junction (CEJ). Hydroxyapatite, which comprises most of enamel, is a
crystalline calcium phosphate, so it is quite brittle and hard. Enamel's organic material is made
up of two proteins: amelogenins and enamelins (Busch et al. 2001; Holly 1991).
Dentin lies just beneath enamel and is 70% inorganic, 20% organic (e.g., collagen), and
10% water. It is created by odontoblasts (i.e., tooth-forming cells) during dentinogenesis (Busch
et al. 2001; Leicester 1953). Because it contains fewer minerals than enamel, dentin is softer, and
its molecules are more loosely arranged, thus making it more susceptible to alteration or
contamination of its biochemistry (Ambrose and Krigbaum 2003).

10
This study addresses childhood diet, so it is important to understand tooth formation.
Since permanent first and second molars dominate the sample, they are the primary focus of this
discussion. However, a brief explanation will be provided for deciduous second molars, as one
individual is represented by this tooth. The deciduous second molar begins to form during the
18th-19th week in utero and is completely developed around 3 years of age (Holly 1991).
Permanent teeth begin to form around the 20th week of prenatal development, but the majority of
formation occurs postnatal. Maxillary first molars develop from birth to 9-10 years, and second
molars develop from 2.5-3 years to 14-16 years. Mandibular first molars also form from birth to
9-10 years; second molars, from 2.5-3 years to 14-15 years (Holly 1991). The isotope values for
enamel, however, will represent the age at which the crown develops. As elucidated by Dupras
and Tocheri (2007), the crown of deciduous second molars begins to form before birth and is
complete by 1 year of age. The crown of permanent first molars develops between 2 and 5 years,
whereas the crown of permanent second molars forms between 4 and 6 years (Dupras and
Tocheri 2007). Table 1 shows the developmental stages of permanent molars in greater detail.

11
Table 1. Developmental stages of permanent first and second molars (Dupras and Tocheri 2007; Holly 1991; Leicester 1953).
Maxillary Teeth
Developmental Stages First Molar Second Molar
Initial calcification Birth 2.5-3 years
Crown completed 2.5-3 years 7-8 years
Root completed 9-10 years 14-16 years
Mandibular Teeth
Initial calcification Birth 2.5-3 years
Crown completed 2.5-3 years 7-8 years
Root completed 9-10 years 14-15 years
Stable Isotopes
Before one can delve into stable isotope analysis, the basics must be understood. Isotopes
are two or more alternative forms of an element, possessing the same number of protons and
electrons but a different number of neutrons (DeNiro 1987). Different isotopes react at different
rates, potentially leading to a difference in the isotopic ratios of the reactants and the products.
This is called isotopic fractionation, and it is what makes the stable isotopic analysis of diet
possible. The different reaction rates translate into different ratios of stable isotopes, enabling
bioarchaeologists to determine if, for instance, a person's diet contained more terrestrial protein
or marine protein. An important part of isotopic fractionation is that the isotopes with a lower
atomic weight react more quickly in photosynthesis than those with a heavier weight, so they
12
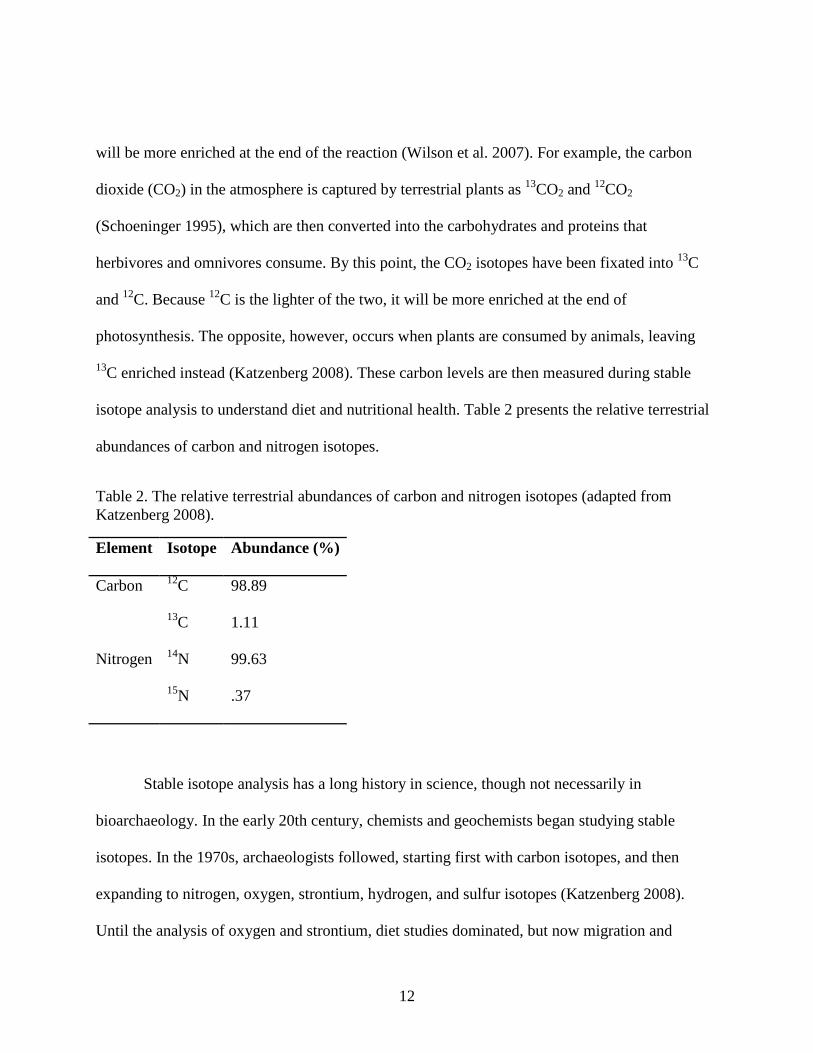
will be more enriched at the end of the reaction (Wilson et al. 2007). For example, the carbon
dioxide (CO2) in the atmosphere is captured by terrestrial plants as 13CO2 and 12CO2
(Schoeninger 1995), which are then converted into the carbohydrates and proteins that
herbivores and omnivores consume. By this point, the CO2 isotopes have been fixated into 13C
and 12C. Because 12C is the lighter of the two, it will be more enriched at the end of
photosynthesis. The opposite, however, occurs when plants are consumed by animals, leaving
13C enriched instead (Katzenberg 2008). These carbon levels are then measured during stable
isotope analysis to understand diet and nutritional health. Table 2 presents the relative terrestrial
abundances of carbon and nitrogen isotopes.
Table 2. The relative terrestrial abundances of carbon and nitrogen isotopes (adapted from Katzenberg 2008).
Element Isotope Abundance (%)
Carbon 12C 98.89
13C 1.11
Nitrogen 14N 99.63
15N .37
Stable isotope analysis has a long history in science, though not necessarily in
bioarchaeology. In the early 20th century, chemists and geochemists began studying stable
isotopes. In the 1970s, archaeologists followed, starting first with carbon isotopes, and then
expanding to nitrogen, oxygen, strontium, hydrogen, and sulfur isotopes (Katzenberg 2008).
Until the analysis of oxygen and strontium, diet studies dominated, but now migration and

13
mobility studies are becoming increasingly more common. Stable isotope analysis operates on
two basic premises. First, that humans absorb the biochemical signatures of the foods they eat
(Ambrose and Krigbaum 2003; Papathanasiou 2003; Richards and Hedges 1998). Second, that
the natural abundance of isotopes in food varies according to the environments in which they are
produced (Chenery et al. 2010). When humans eat or drink, the isotopic signatures in food and
water are incorporated into their bones, teeth, soft tissues, hair, and nails, allowing for the
reconstruction of diet, mobility, and nutritional health (Chenery et al. 2010; Papathanasiou
2003). Although bones, teeth, hair, and nails can all be sources for isotopic research, the analyses
for this research focused on teeth.
Humans are what they eat, within reason. Isotopic compositions can differ based on the
atmospheric and geochemical characteristics of their environments. According to van Klinken et
al. (2000), there is greater variation among stable isotopic ratios in Africa, Asia, and the
Americas than in Europe. This is because Europe has less resource diversity and thus less stable
isotopic variation.
Stable isotopes are measured with gas isotope ratio mass spectrometers (IRMS). They are
composed of an inlet, an ion source, a mass analyzer, and an ion collector (Katzenberg 2008).
When a sample undergoes stable isotope analysis, there are four main steps. First, the sample
becomes a gas and is ionized by the ion source. Second, the molecules enter a tube, and a magnet
sorts the ionized molecules according to their mass. Next, the ions move into the ion collector
and are measured. Finally, the two most plentiful isotopes (e.g., 12C and 13C) are compared with
an international standard. These two isotopes will then become the isotope ratios used in stable

14
isotope studies, written as delta (δ) values in parts per mil (‰). The international standard used
for δ13C is Vienna Pee Dee Belemnite (VPDB), and for δ15N, it is atmospheric nitrogen (AIR).
(Tykot 2006). The Vienna Standard Mean Ocean Water (VSMOW) has been the international
standard used for δ18O (Coplen 1994; Dufour et al. 2007), but it is now moving to VPDB.
Collagen
Much of the past and present stable isotopic research on prehistoric and historic humans
has focused on collagen, primarily because of what it can tell bioarchaeologists about diet
(Macko et al. 1999; Richards and Hedges 1998). Collagen is the organic (protein) component of
tissues (Larsen 2002; Papathanasiou 2003). According to van Klinken (1999), carbon composes
approximately 35% of collagen; nitrogen, approximately 11-16%. Since bone collagen is slow to
turnover, the isotopic values reflect the average protein intake over the last ten or more years of a
person's life (Chenery et al. 2010; Richards and Hedges 1998). Furthermore, because tooth
dentin and different types of bone have varying collagen turnover times, researchers can examine
an individual's diet at different stages of his or her life (Chenery et al. 2010). For example, stable
isotopes extracted from dentin portray diet during childhood, as that is when tooth formation
occurs, and there is little to no change in dentin structure after formation. Conversely, stable
isotopes extracted from adult long bone shafts show diet during adolescence and adulthood
(Chenery et al. 2010). As a result, it is possible to outline someone's nutritional history from birth
to death using teeth and bones. Additionally, tissue turnover times depend on metabolic rates
(Hedges and Reynard 2007; Tieszen et al. 1983). The quicker a tissue's metabolic rate, the faster

15
its turnover time. This explains why dentin has a slower turnover rate than bone, because it is not
nearly as metabolically active (Hedges and Reynard 2007).
Collagen provides the carbon and nitrogen stable isotopes necessary for reconstruction of
the protein portion of diet (Chenery et al. 2010; Papathanasiou 2003), and 13C/12C and 15N/14N
ratios from collagen are instrumental in determining the proportion of protein absorbed from
plants and animals, respectively. They also shed light on the relative amounts of marine and
terrestrial foods in the diet (DeNiro 1987; Papathanasiou 2003). As autotrophs, plants are the
first step in food chains, so they set the carbon and nitrogen isotopic signatures for aquatic and
terrestrial foods (DeNiro 1987).
Hydroxyapatite
As a phosphate mineral, hydroxyapatite is the inorganic component of bones and teeth
(Ambrose and Krigbaum 2003). In teeth, it is found in enamel, which is the apatite source for
this research sample. Like the collagen in dentin, enamel's apatite is an excellent indicator of an
individual's diet as a child, because tooth enamel forms early in childhood and is not replaced
after formation (Bentley 2006). However, unlike collagen, which reflects dietary protein, apatite
reflects the carbohydrate portion of diet (Papathanasiou 2003). It is less susceptible to diagenetic
alteration of its stable isotopes, due to the biochemical properties of tooth enamel. Tooth enamel
is denser and harder than dentin, has larger phosphate crystals, and has less pore space, leading
to greater resistance to post-depositional isotopic contamination (Bentley 2006; Dufour et al.
2007).

16
Carbon
Stable carbon isotope ratios (δ13C) are primarily used to distinguish between C3 and C4
plants, as well as between marine and terrestrial C3 plant-based foods in temperate regions to
which C4 plants are not indigenous (Chenery et al. 2010; Giblin 2009; Müldner and Richards
2005; Papathanasiou 2003; Wilson et al. 2007). Carbon isotope ratios in terrestrial plants are
influenced by multiple factors, such as the isotopic composition of atmospheric CO2 when it is
converted into plant carbon (DeNiro 1987; Wilson et al. 2007). However, as carbon passes from
one trophic level to another (e.g., from plants to herbivores), isotopic fractionation is minimal.
This means that the δ13C values of animal tissues lie within 5‰ of the δ13C values of the plants
or animals they have consumed (DeNiro 1987).
Because the different plant types (e.g., C3 vs. C4) are so important to stable carbon
isotope analysis, they merit closer inspection. Most food plants are C3 plants, such as wheat, rye,
barley, tubers (e.g., potatoes), legumes, nuts, and leafy greens. They grow in temperate regions,
like Europe, the Middle East, and parts of Asia (DeNiro 1987; Mays 1997; Papathanasiou 2003).
Interestingly, since bees eat the products of C3 plants (e.g., nectar and pollen), honey has a
similar δ13C value to C3 plants (DeNiro 1987). C4 plants, on the other hand, thrive in tropical
areas, like Africa and Southeast Asia. Maize, millet, and sugar cane are examples of C4 plants
(DeNiro 1987; Mays 1997), though only millet is applicable to this study. There is a third type of
plant called CAM plants, but because their carbon isotopic signatures can resemble either C3 or
C4 plants, it is generally not feasible to differentiate them (DeNiro 1987). C3 plants have δ13C
values ranging between -33‰ and -22‰, with an average of -27‰, while C4 plants have δ13C

17
values between -16‰ and -9‰, with an average of -12.5‰ (DeNiro 1987; Mays 1997). The
differences between C3 and C4 plants do not end there. C3 plants are depleted in 13C by 5-15%
relative to C4 plants because of the various enzymes used to fix carbon (Macko et al. 1999). As
Papathanasiou (2003) states, C4 plants, unlike C3 plants, fix nearly all available atmospheric
CO2, giving them greater, or enriched, 13C values.
Marine plants are more isotopically enriched than terrestrial plants, because they use
dissolved bicarbonate in the seawater, instead of atmospheric CO2. In other words, their δ13C
values are about 7.5‰ less negative than those of land plants (DeNiro 1987; Papathanasiou
2003). Furthermore, δ13C values of marine animals are roughly 5‰ more positive than those of
terrestrial, temperate-climate animals (DeNiro 1987; Mays 1997; Papathanasiou 2003).
Additional support for environmental influences on carbon is presented by Ambrose and
Krigbaum (2003) and Richards et al. (2000), who assert that closed, humid forests create a
"canopy effect," which leads to lower food web δ13C values. Open, hot, and dry areas, on the
other hand, have relatively high food web δ13C values. Richards and Hedges (1998) state that
humans with terrestrial diets from warm regions of Europe (e.g., the Mediterranean) have δ13C
values that are 1-2‰ more positive than those of humans from colder Europe. Finally, it is
acknowledged that due to the increased burning of fossil fuels (e.g., coal and gasoline), pre-
Industrial Revolution atmospheric and biological δ13C ratios were more positive than today's
ratios (DeNiro 1987; Mays 1997). Therefore, it is important to be aware of a sample's
depositional environment when performing stable isotope studies.

18
A normal range for human bone/tooth δ13C levels is -20.5‰ to -18.8‰, if the individuals
consumed a diet of only C3 plants (Chenery et al. 2010). Mays (1997) specifies that expected
δ13C values for bone/dentin collagen of humans consuming only C3 plants, such as some
medieval European peasants, are between -21‰ and -22‰. The author also explains that a diet
consisting mostly of marine foods might yield collagen δ13C levels of -12‰ to -13‰, as marine
animals' carbon isotope values range between -17‰ and -18‰. These figures are supported by
Papathanasiou (2003) and Richards and Hedges (1998), who found that humans eating only
terrestrial C3 plants have δ13C values of about -20‰, whereas people consuming mostly marine
resources have δ13C ratios of nearly -12‰.
Because stable carbon isotopes are used to determine diet, including the protein
proportions, they are inextricably linked with apatite and collagen (Papathanasiou 2003). This
study, therefore, incorporates both.
Nitrogen
Nitrogen also conveys dietary information, though primarily via the trophic levels of
organisms involved in a particular ecosystem's food web (Chenery et al. 2010; Richards et al.
2000; Wilson et al. 2007). Stable nitrogen isotope values allow bioarchaeologists to determine
the relative importance of animals and plants in humans' diets (Chenery et al. 2010). On land and
in water, δ15N is enriched as nitrogen passes through the food chain from producers (plants) to
consumers (animals and humans). Marine food chains are longer, which lead to greater 15N
enrichment (DeNiro 1987; Papathanasiou 2003). Macko et al. (1999) and Papathanasiou (2003)
estimate this step-wise enrichment as being 2-3‰ more than the preceding level. Therefore,

19
humans who consume fewer marine resources, such as farmers, will have lower δ15N values than
those whose diets are rich in marine animals. Richards and Hedges (1998) place δ15N levels at 5-
12‰ and 12-22‰ for terrestrial-feeders and marine-feeders, respectively. Another reason marine
15N is more enriched is due to the source of the nitrogen. In marine environments, bacterial
denitrification (i.e., nitrate reduction) contributes most of the available nitrogen, while terrestrial
nitrogen is produced by N2 fixation. The former process creates more 15N than does the latter
process (Schoeninger and Moore 1992).
But marine foods are not the sole sources of higher δ15N values. Animal protein in
general, as opposed to plant protein, will contribute to higher nitrogen values, because it is higher
in the food chain and is thus at a higher trophic level (Hedges and Reynard 2007; Reynard and
Hedges 2008; Richards and Hedges 1998). As van Klinken et al. (2000) state, the increased δ15N
values seen in humans may also be partly explained by the "manuring effect." This occurs when
δ15N values in soil increase because of natural fertilizers, like animal feces, which are then
incorporated into humans' plant and animal food sources.
Climate and precipitation, too, can affect stable nitrogen isotope values. Aridity, for
example, may lead to δ15N enrichment, as Ambrose (1991) argues. When aridity increases, so do
δ15N values. Herbivorous mammals were studied to determine that drought-tolerant animals had
enriched nitrogen values, whereas water-dependent animals did not (Ambrose and DeNiro 1987).
One possible explanation for this is that the drought-tolerant mammals excreted urea at a slower
rate.

20
Another cause of elevated δ15N values (in young children, at least) is breastfeeding
(Dupras and Tocheri 2007; Dupras et al. 2001; Fuller et al. 2006; Richards et al. 2002). Babies
who have been recently breastfed have higher nitrogen values than their mothers, since they
occupy a higher trophic level, due to consumption of their mother's milk. Because dentin is
slower to turn over than bone, the dentin formed during infancy will retain an enriched δ15N
value after weaning has occurred, though the values will decrease after a couple years. And since
formation rates for teeth are known, it is possible to determine at what age weaning began.
The final two sources of nitrogen enrichment are nutritional stress and pathological
conditions. As already discussed, diets high in protein result in higher δ15N values, but the
reverse can be true also (Hedges and Reynard 2007). If a person is severely protein-deficient,
that can also lead to enriched nitrogen levels. Nutritional stress may result from many different
reasons, such as metabolic disease (e.g., osteomalacia/rickets), cultural factors (e.g., unequal
access to food), or environmental factors (e.g., famine). Some of these manifest in skeletal
tissues, including teeth. Enamel hypoplasia, for example, is the incomplete formation of tooth
enamel and is directly related to malnourishment and/or disease (Katzenberg et al. 1996; Polet
and Katzenberg 2003). After nitrogen is absorbed into bodily tissues, some of it is used and some
of it is excreted as urea. Positive nitrogen balance means that more nitrogen is consumed than
excreted during tissue formation (Katzenberg and Lovell 1999). This could lead to lower δ15N
values. On the flipside, enriched δ15N levels may stem from a negative nitrogen balance, which
means that the organism's nitrogen consumption is insufficient. The body is then forced to
scavenge protein from musculoskeletal tissues. And, like during isotopic fractionation, the lighter
14N is excreted, while the heavier 15N remains and is enriched. This is most apparent in tissues

21
with fast turnover rates; thus, even if individuals in the Solt-Tételhegy sample were ill or
malnourished, their dentin collagen would probably not reflect it, unless the nutritional stress or
pathological condition was present during tooth formation. Table 3 summarizes the factors that
contribute to elevated δ15N levels.
Table 3. Sources of nitrogen enrichment in humans.
Sources of δ15N enrichment δ15N values Reference(s) Marine-based diet 17-20‰ DeNiro 1987; Macko et al. 1999;
Papathanasiou 2003 Climate/precipitation 13-18‰ Ambrose 1991; Ambrose and DeNiro
1987 Breastfeeding +2-3‰ Dupras and Tocheri 2007; Richards et
al. 2002 Pathological/nutritional stress conditions 12.9‰ Hedges and Reynard 2007;
Katzenberg et al. 1996; Katzenberg and Lovell 1999
Oxygen
Stable oxygen isotopes reflect climate and are one component of mobility studies
(Chenery et al. 2010; Giblin 2009). They also provide information on population dynamics,
habitat utilization by humans, and procurement origins for food and natural resources (Dufour
2007). As such, oxygen isotopes are useful in dietary studies, as well, because bioarchaeologists
can determine the area from where a given group of people obtained its food. The δ18O of
skeletal phosphate is controlled by the isotopic composition of drinking water, which depends on
the source of precipitation, distance from the coast, altitude, temperature of precipitation,
evaporation rates, and local climate conditions (Chenery et al. 2010; Fricke et al. 1995; Tykot
22
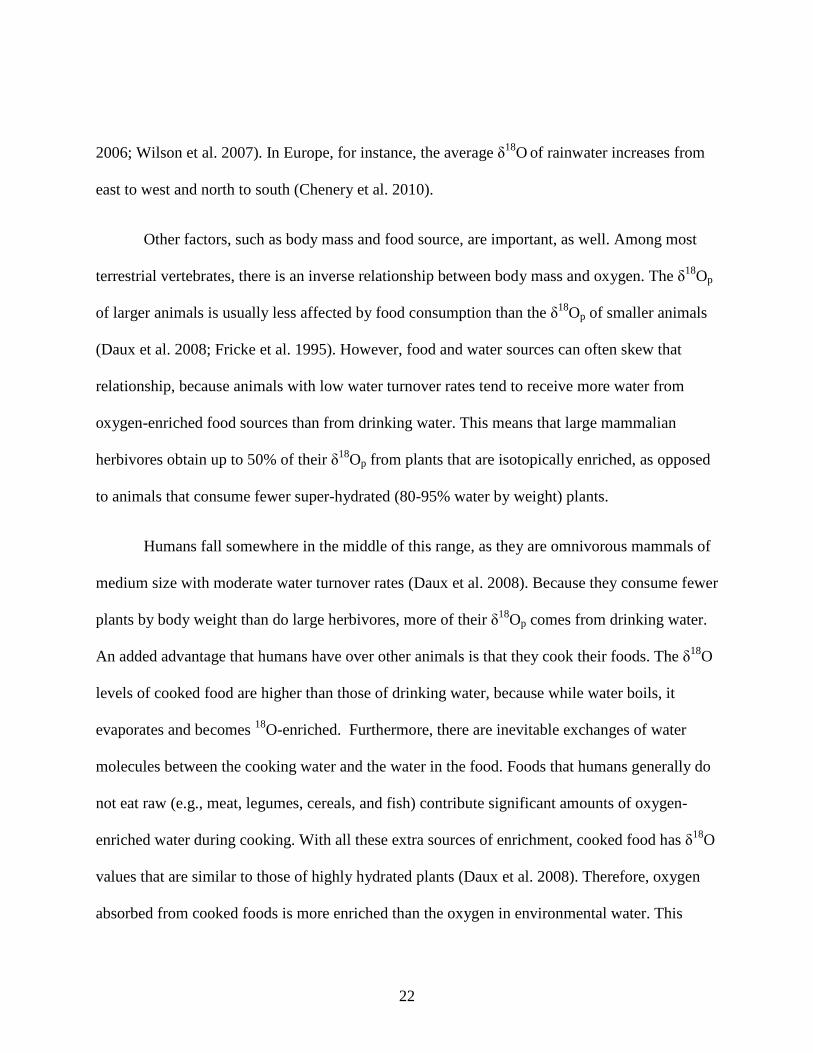
2006; Wilson et al. 2007). In Europe, for instance, the average δ18O of rainwater increases from
east to west and north to south (Chenery et al. 2010).
Other factors, such as body mass and food source, are important, as well. Among most
terrestrial vertebrates, there is an inverse relationship between body mass and oxygen. The δ18Op
of larger animals is usually less affected by food consumption than the δ18Op of smaller animals
(Daux et al. 2008; Fricke et al. 1995). However, food and water sources can often skew that
relationship, because animals with low water turnover rates tend to receive more water from
oxygen-enriched food sources than from drinking water. This means that large mammalian
herbivores obtain up to 50% of their δ18Op from plants that are isotopically enriched, as opposed
to animals that consume fewer super-hydrated (80-95% water by weight) plants.
Humans fall somewhere in the middle of this range, as they are omnivorous mammals of
medium size with moderate water turnover rates (Daux et al. 2008). Because they consume fewer
plants by body weight than do large herbivores, more of their δ18Op comes from drinking water.
An added advantage that humans have over other animals is that they cook their foods. The δ18O
levels of cooked food are higher than those of drinking water, because while water boils, it
evaporates and becomes 18O-enriched. Furthermore, there are inevitable exchanges of water
molecules between the cooking water and the water in the food. Foods that humans generally do
not eat raw (e.g., meat, legumes, cereals, and fish) contribute significant amounts of oxygen-
enriched water during cooking. With all these extra sources of enrichment, cooked food has δ18O
values that are similar to those of highly hydrated plants (Daux et al. 2008). Therefore, oxygen
absorbed from cooked foods is more enriched than the oxygen in environmental water. This

23
translates to a maximum enrichment of 2‰ compared to drinking water (Daux et al. 2008; Fricke
et al. 1995).
Measurements of δ18O from tooth enamel provide a record of the climate in which a
person was raised, as enamel forms during childhood and does not change thereafter (Fricke et
al. 1995). But because oxygen undergoes fractionation due to metabolic processes, (Daux et al.
2008; DeNiro 1987), identification of migrants in a society is not always straightforward.
Additionally, there is much variation in oxygen sources between individuals in a population. For
example, Daux et al. (2008) state that isotopic fractionation between the water from cooked food
and the water from the environment (e.g., from aquifers or rivers) is between 1.2‰ and 6.2‰,
with the highest values belonging to vegetables. This makes establishing a local baseline
difficult. However, higher δ18O values generally suggest origins in warm, coastal, or arid
environments (Chenery et al. 2010).
Brettell et al. (2012) studied stable oxygen and strontium isotope ratios from several
Central and Western European archaeological sites to determine if migrations occurred into the
areas. Although the majority of individuals from each of the sites was deemed to be local,
approximately ten individuals total were almost certainly immigrants. Chenery et al. (2010)
illustrated the diversity of a population from Roman Gloucester, England (2nd century AD),
using δ18O and strontium isotope values from human enamel apatite. They determined that most
of the individuals spent their childhoods in the UK but that at least six migrated into the area
from Continental Europe. Dufour et al. (2007) used stable oxygen isotope analysis to trace the
origins of archaeological fish found in ancient Turkey, demonstrating that oxygen can be used to

24
construct geographical food webs. This is helpful if one is interested in the impact of trade on a
particular population, and it is also applicable to medieval diet.
Medieval European Diet
Numerous studies have been undertaken on the diet of past humans. Bone stable isotope
analysis of archaeological European remains has been used extensively to study the relative
contributions of marine resources in medieval European diets. Mays (1997), for example,
demonstrated that monastic diets included more marine resources than did the diets of laypeople.
The nutritional history of medieval English peoples has been reconstructed to examine the
effects of religion and status (Müldner and Richards 2005). Müldner and Richards (2007) also
discovered that there was significant variation in marine animal consumption between males and
females, as well as between the different social classes, in medieval York, England. Carbon and
nitrogen stable isotope analysis has been used to determine that the diet of individuals in
medieval Norwich contained a surprising amount of marine resources (20-30% of diet) and that
pork may have been a high-status meat (Bayliss et al. 2004). Nitrogen stable isotopes have shed
light on weaning ages in medieval Wharram Percy (Richards et al. 2002), as well as in medieval
Fishergate House, York (Burt 2013). Stable isotopes have also demonstrated that the people
interred in late medieval Orkney ate a marine-heavy diet, including seals, and that males
consumed more marine mammals than did females (Richards et al. 2006).
Yoder (2010) studied the regional and temporal patterning of diet in medieval Danish
peasant populations, with the conclusion that some regional, but no temporal patterning exists.
Stable carbon and nitrogen isotopes have shown that there were clear status-based differences in

25
the diet of elites, monks, and peasants buried at the Cistercian monastery of Øm Kloster in
Denmark (Yoder 2012). Stable isotopes have been used to understand dietary patterns, including
sex-based differences in diet, from early-late medieval Sigtuna, Sweden (Kjellström et al. 2009).
Also in Sweden, Linderholm and Kjellström (2011) discovered social differences in the diet of
the residents of medieval Sigtuna.
Studying dental wear and caries, instead of stable isotopes, Esclassan et al. (2009)
determined the dietary history of the inhabitants of medieval Vilarnau, France. In late medieval
Koksijde, Belgium, social status was a likely cause of observed variations in human diet (Polet
and Katzenberg 2003). Using stable carbon and nitrogen isotopes, Müldner et al. (2014) found
that late medieval Belgians near the coast grazed their food animals on halophytic plants. The
medieval cod (Gadus sp.) trade in Northwest Europe has been mapped using stable isotopes,
indicating that fish from the region were consumed even in the UK (Barrett et al. 2008).
Additionally, stable isotopes have shown that male peasants consumed more animal
products than did female peasants in medieval Giecz, Poland (Reitsema et al. 2010). Hakenbeck
et al. (2010) used carbon and nitrogen stable isotopes to determine the diet of people living in
medieval Bavaria, including sex-based dietary differences. Another study from medieval
Germany (Weingarten) showed that different settlements had very different diets (Schutkowski
et al. 1999). The diet of people living in early medieval Croatia (in Ravni Kotari) has been
deduced with stable carbon and nitrogen isotope ratios (Lightfoot et al. 2012).
By comparing dentin and bone collagen, Reitsema and Vercellotti (2012) discovered that
diet changed throughout the lifetime of the residents of medieval Trino Vercellese, Italy.

26
Additionally, the Church's impact on the diets of late medieval Italians was examined by
Salamon et al. (2008).
Finally, not all stable isotope studies are completed on human bones and teeth. Some
projects use animal skeletal material. For example, Halley and Rosvold (2014) compared the
stable carbon and nitrogen values of pigs (Sus scrofa) from medieval Norway with those of other
northwestern European countries to better understand human stable isotope ratios and thus diet.
A study from Poland (Kałdus) utilized animal bone collagen and apatite to chronicle the human-
environment interactions that occurred during the medieval period (Reitsema et al. 2013). A
summary of the medieval European diet studies described in this section is shown in Table 4.
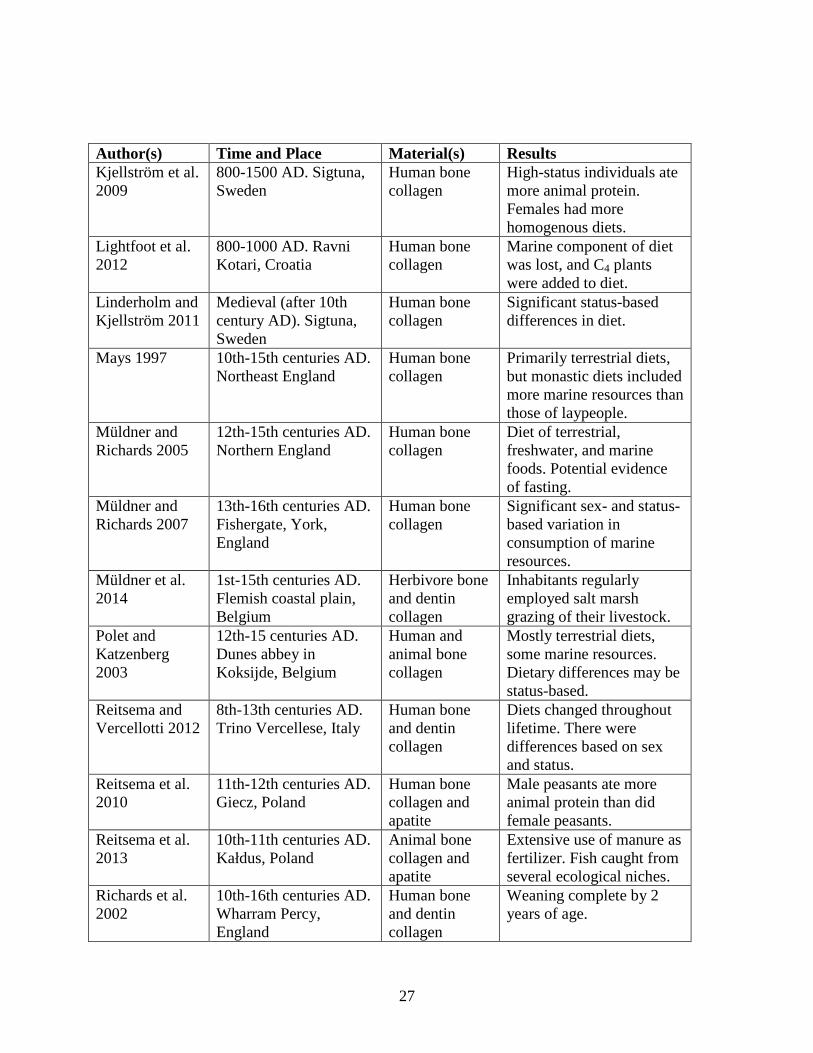
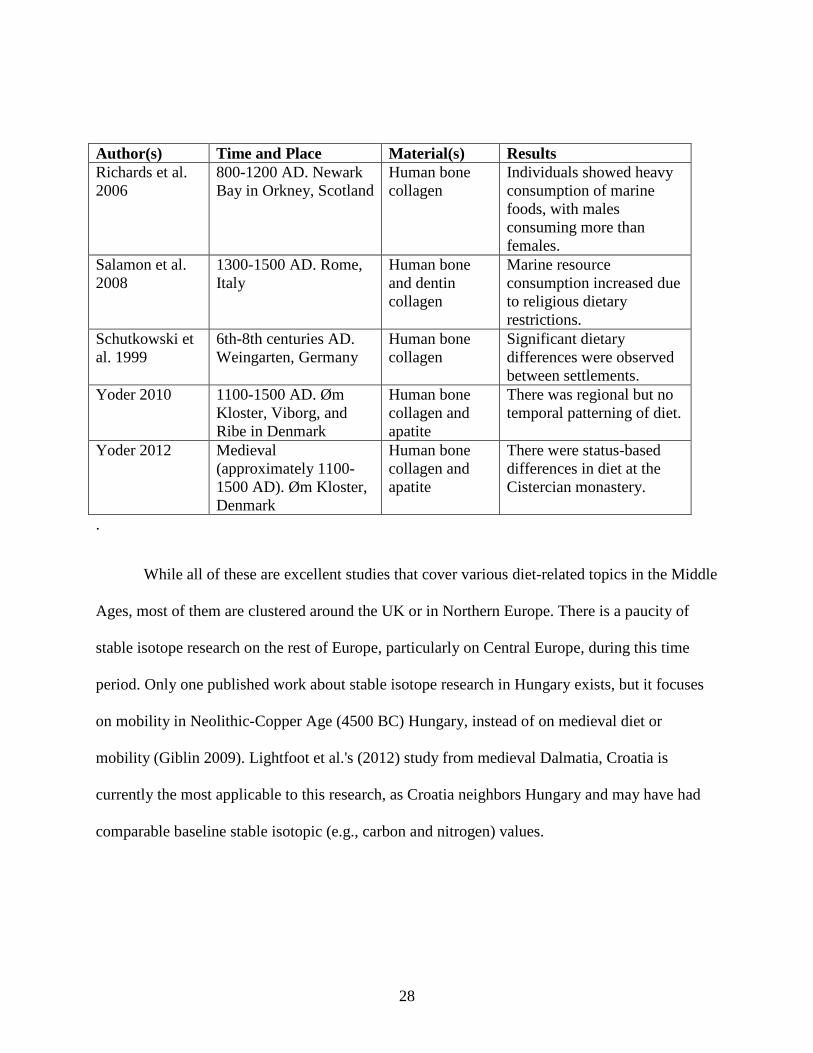
Table 4. Summary of medieval European diet studies.
Author(s) Time and Place Material(s) Results Barrett et al. 2008
9th-15th centuries AD. Arctic Norway, North Sea, Kattegat, and Baltic Sea
Cod (Gadus sp.) bone collagen
Cod was traded over very long distances in Northern and Western Europe.
Bayliss et al. 2004
10th-14th centuries AD. Central Norwich, England
Human bone collagen
Diets contained large amounts of marine resources. Pork may have been high-status food.
Burt 2013 14th-15th centuries AD. Fishergate House, York, England
Human bone collagen
Weaning complete by 2 years.
Esclassan et al. 2009
12th-14th centuries AD. Villarnau, France
Human dental wear and caries
Tooth loss caused by deep caries, attrition, periodontitis, and trauma. Females had more caries than males.
Hakenbeck et al. 2010
Early medieval. Bavaria Human bone collagen
Limited marine resources. Significant sex-based dietary differences.
Halley and Rosvold 2014
1300-1400 AD. Bergen, Norway; NW Europe
Pig (Sus scrofa) bone collagen
Pigs from Bergen consumed marine protein.
27
Author(s) Time and Place Material(s) Results Kjellström et al. 2009
800-1500 AD. Sigtuna, Sweden
Human bone collagen
High-status individuals ate more animal protein. Females had more homogenous diets.
Lightfoot et al. 2012
800-1000 AD. Ravni Kotari, Croatia
Human bone collagen
Marine component of diet was lost, and C4 plants were added to diet.
Linderholm and Kjellström 2011
Medieval (after 10th century AD). Sigtuna, Sweden
Human bone collagen
Significant status-based differences in diet.
Mays 1997 10th-15th centuries AD. Northeast England
Human bone collagen
Primarily terrestrial diets, but monastic diets included more marine resources than those of laypeople.
Müldner and Richards 2005
12th-15th centuries AD. Northern England
Human bone collagen
Diet of terrestrial, freshwater, and marine foods. Potential evidence of fasting.
Müldner and Richards 2007
13th-16th centuries AD. Fishergate, York, England
Human bone collagen
Significant sex- and status-based variation in consumption of marine resources.
Müldner et al. 2014
1st-15th centuries AD. Flemish coastal plain, Belgium
Herbivore bone and dentin collagen
Inhabitants regularly employed salt marsh grazing of their livestock.
Polet and Katzenberg 2003
12th-15 centuries AD. Dunes abbey in Koksijde, Belgium
Human and animal bone collagen
Mostly terrestrial diets, some marine resources. Dietary differences may be status-based.
Reitsema and Vercellotti 2012
8th-13th centuries AD. Trino Vercellese, Italy
Human bone and dentin collagen
Diets changed throughout lifetime. There were differences based on sex and status.
Reitsema et al. 2010
11th-12th centuries AD. Giecz, Poland
Human bone collagen and apatite
Male peasants ate more animal protein than did female peasants.
Reitsema et al. 2013
10th-11th centuries AD. Kałdus, Poland
Animal bone collagen and apatite
Extensive use of manure as fertilizer. Fish caught from several ecological niches.
Richards et al. 2002
10th-16th centuries AD. Wharram Percy, England
Human bone and dentin collagen
Weaning complete by 2 years of age.
28
Author(s) Time and Place Material(s) Results Richards et al. 2006
800-1200 AD. Newark Bay in Orkney, Scotland
Human bone collagen
Individuals showed heavy consumption of marine foods, with males consuming more than females.
Salamon et al. 2008
1300-1500 AD. Rome, Italy
Human bone and dentin collagen
Marine resource consumption increased due to religious dietary restrictions.
Schutkowski et al. 1999
6th-8th centuries AD. Weingarten, Germany
Human bone collagen
Significant dietary differences were observed between settlements.
Yoder 2010 1100-1500 AD. Øm Kloster, Viborg, and Ribe in Denmark
Human bone collagen and apatite
There was regional but no temporal patterning of diet.
Yoder 2012 Medieval (approximately 1100-1500 AD). Øm Kloster, Denmark
Human bone collagen and apatite
There were status-based differences in diet at the Cistercian monastery.
.
While all of these are excellent studies that cover various diet-related topics in the Middle
Ages, most of them are clustered around the UK or in Northern Europe. There is a paucity of
stable isotope research on the rest of Europe, particularly on Central Europe, during this time
period. Only one published work about stable isotope research in Hungary exists, but it focuses
on mobility in Neolithic-Copper Age (4500 BC) Hungary, instead of on medieval diet or
mobility (Giblin 2009). Lightfoot et al.'s (2012) study from medieval Dalmatia, Croatia is
currently the most applicable to this research, as Croatia neighbors Hungary and may have had
comparable baseline stable isotopic (e.g., carbon and nitrogen) values.

29
Limitations of Stable Isotopes in Bioarchaeology
Stable isotope analysis has certainly enriched bioarchaeological studies, but there are
limitations that must be taken into account. Depending on the temporal setting of the samples,
results may be affected by the post-Industrial Revolution introduction of fossil fuels (Katzenberg
2008). Similarly, stable isotope values can be altered by certain environmental factors, such as
climate and source of precipitation (Ambrose and Krigbaum 2003).
While collagen is a crucial part of stable isotope research, it has limitations, as well. It is
especially susceptible to diagenetic alteration, which leads to contamination and/or replacement
of biogenic stable isotopes (Macko et al. 1999). The older the sample, the more likely that the
collagen will hydrolize, denature, or dissolve away (Lee-Thorp 2000). Cleaning procedures in
weak acid solutions (e.g., hydrochloric acid solution) are effective in removing surface
diagenetic isotopes, but if they have been incorporated deeper, they may skew results. For
example, diagenetic dentin carbon can make it appear that the individual consumed more plant
protein than he or she actually did.
As Daux et al. (2008) elucidate, establishing a local baseline for oxygen is difficult for
several reasons. Multiple environmental factors, such as source of precipitation and evaporation
rates, impact the oxygen levels in surface water. Many variables also affect the oxygen isotope
values found in human skeletal tissues. Enrichment occurs between the uptake of 18Odw and the
measurement of δ18Op, and oxygen isotopic fractionation occurs when food is cooked. These
changes vary depending on the type of food consumed, as well as the initial 18O levels of the raw
food and cooking water.

30
CHAPTER THREE: MATERIALS AND METHODS
Samples from Solt-Tételhegy
Between 2005 and 2009, József Szentpéteri led multiple excavations at Solt-Tételhegy
(Figs. 5-6). In total, 125 skeletons were recovered and are currently housed in the Anthropology
Collection at the Hungarian Natural History Museum in Budapest. The individuals in this study
are among the 108 skeletons discovered at the northern edge of the site in 2009. A map of the
excavation area is provided in Figure 7. Before proceeding with this chapter, it is important to
discuss the previous anthropological research conducted on these individuals.
Figure 5. Photograph of the excavation of the Árpádian/medieval cemetery (image courtesy of J. Szentpéteri).

31
Figure 6. Photograph of a skeleton interred near the medieval church (image courtesy of J. Szentpéteri).
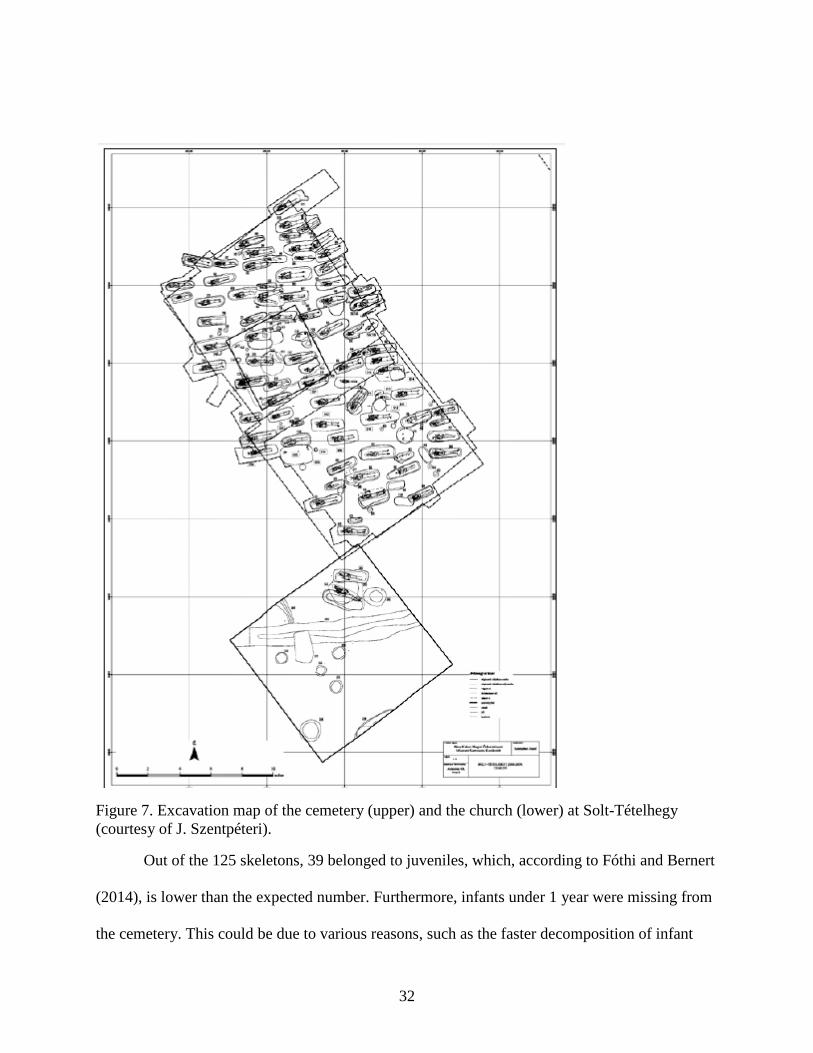
32
Figure 7. Excavation map of the cemetery (upper) and the church (lower) at Solt-Tételhegy (courtesy of J. Szentpéteri).
Out of the 125 skeletons, 39 belonged to juveniles, which, according to Fóthi and Bernert
(2014), is lower than the expected number. Furthermore, infants under 1 year were missing from
the cemetery. This could be due to various reasons, such as the faster decomposition of infant

33
bones or different funeral practices for infants (Fóthi and Bernert 2014; Szentpéteri 2014). In
contemporaneous cemeteries, babies were usually interred in shallower graves, increasing the
potential for environmental degradation of their comparatively small and thin bones. Another
possibility is that excavation of the cemetery is not yet complete and the infant skeletons are
buried in one section. Among the skeletons, there were 47 adult females and 35 adult males. It is
noteworthy that between the ages of 15 and 24 years, the mortality rate for adult females was
higher than for adult males, perhaps due to deaths during miscarriage, pregnancy, or childbirth.
Mortality rates for females peaked at 30-34 years, with as many as 1/4 of the females dying in
that age range. Males, too, died most often in middle adulthood, despite few skeletal injuries to
suggest accidental or violent deaths (Fóthi and Bernert 2014). The average height for males was
168 cm; for females, 155 cm.
There appear to be two distinctive skull shapes in the sample population. The majority
(77%) of individuals have long, narrow skulls, with a moderately high brain case and a tall, thin
face, as seen in Figures 8-9. The remaining 23% have hyperbrachycranic skulls, which are
characterized by a short, wide brain case and a narrow forehead (Figs 10-11). These
hyperbrachycranic skulls suggest origins in the Balkans or the Dinaric Alps (Fóthi and Bernert
2014). The hyperbrachycranic individuals are also taller, with a male (ST 304) reaching 177 cm
and a female (ST 300/I) reaching 161.2 cm. The hyperbrachycranic individuals were interred
inside a Gothic church, while all members of the first group were buried outside the church.
Although the cemetery outside the church was used by various social statuses, ethnicities, and
nationalities, most of the individuals were shorter in stature and had longer skulls (Fóthi and
Bernert 2014). Based on skull shape, size, and measurements, the individuals found inside the

34
church (i.e., the hyperbrachycranic individuals) most closely resemble contemporaneous people
from Mikulčice, Czech Republic. Significantly, the most populous ethnicity that lived in
Mikulčice were the Moravians.
Figure 8. Skull of male (ST 4) excavated from grave 4 in the cemetery (Fóthi and Bernert 2014) and the tooth sample extracted from it (photograph taken by A. Gugora 2014). Note the longer and narrower brain case.

35
Figure 9. Skull of male (ST 56) excavated from grave 56 in the cemetery (Fóthi and Bernert 2014) and the tooth sample extracted from it (photograph taken by A. Gugora 2014). Again, note the longer and narrower brain case.
Figure 10. Hyperbrachycranic skull of male (ST 304) buried inside the medieval church (Fóthi and Bernert 2014). Note the shorter and wider brain case.

36
Figure 11. Hyperbrachycranic skull of female (ST 300/I) buried inside the medieval church (Fóthi and Bernert 2014). Again, note the shorter and wider brain case.
Materials
This research sample consists of either 1st or 2nd molars (mandibular or maxillary) from
24 individuals excavated from Solt-Tételhegy's hill-church in 2009. Twelve teeth are from adult
males, ten teeth are from adult females, and two teeth are from juvenile individuals whose sex
could not be determined (Table 5 and Figs. 12-13). As such, one deciduous molar is present (ST
121/I), while the remaining 23 are permanent molars. The samples were collected at the
Hungarian Natural History Museum in Budapest on June 16-17, 2014 using dental pliers. A
photograph of each tooth was taken before and after extraction, with relevant site information
included. Molars were chosen because they have the largest surface area and contain abundant
dentin and enamel from which stable isotopes could be analyzed.
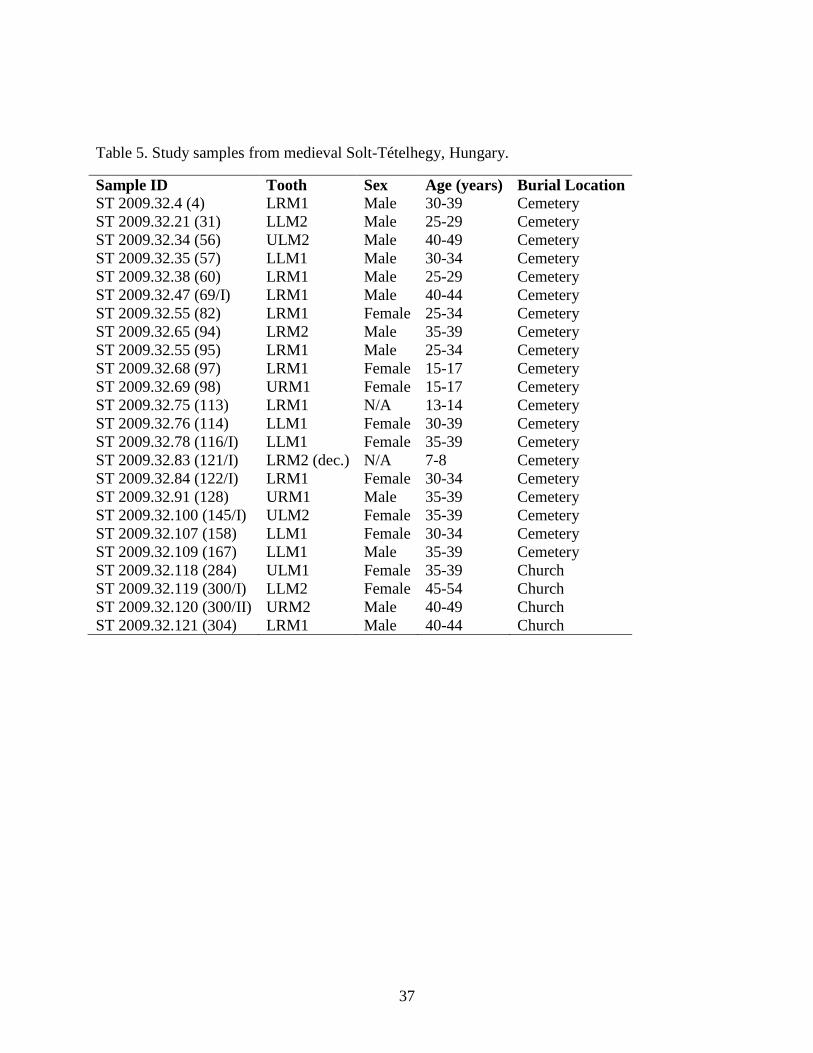
37
Table 5. Study samples from medieval Solt-Tételhegy, Hungary.
Sample ID Tooth Sex Age (years) Burial Location ST 2009.32.4 (4) LRM1 Male 30-39 Cemetery ST 2009.32.21 (31) LLM2 Male 25-29 Cemetery ST 2009.32.34 (56) ULM2 Male 40-49 Cemetery ST 2009.32.35 (57) LLM1 Male 30-34 Cemetery ST 2009.32.38 (60) LRM1 Male 25-29 Cemetery ST 2009.32.47 (69/I) LRM1 Male 40-44 Cemetery ST 2009.32.55 (82) LRM1 Female 25-34 Cemetery ST 2009.32.65 (94) LRM2 Male 35-39 Cemetery ST 2009.32.55 (95) LRM1 Male 25-34 Cemetery ST 2009.32.68 (97) LRM1 Female 15-17 Cemetery ST 2009.32.69 (98) URM1 Female 15-17 Cemetery ST 2009.32.75 (113) LRM1 N/A 13-14 Cemetery ST 2009.32.76 (114) LLM1 Female 30-39 Cemetery ST 2009.32.78 (116/I) LLM1 Female 35-39 Cemetery ST 2009.32.83 (121/I) LRM2 (dec.) N/A 7-8 Cemetery ST 2009.32.84 (122/I) LRM1 Female 30-34 Cemetery ST 2009.32.91 (128) URM1 Male 35-39 Cemetery ST 2009.32.100 (145/I) ULM2 Female 35-39 Cemetery ST 2009.32.107 (158) LLM1 Female 30-34 Cemetery ST 2009.32.109 (167) LLM1 Male 35-39 Cemetery ST 2009.32.118 (284) ULM1 Female 35-39 Church ST 2009.32.119 (300/I) LLM2 Female 45-54 Church ST 2009.32.120 (300/II) URM2 Male 40-49 Church ST 2009.32.121 (304) LRM1 Male 40-44 Church

38
Figure 12. Graph showing the distribution of age (years) and sex from the sample population.
Figure 13. Pie chart with the percentage of sexes in the sample population.
0
1
2
3
4
5
6
7-8 13-14 15-17 25-29 25-34 30-34 30-39 35-39 40-44 40-49 45-54
Num
ber
of In
divi
dual
s
Age Range (Years)
Female Male N/A
42%
50%
8%
Females Males N/A
39
The teeth were in excellent condition, considering the time period and the age of the
individuals, with minimal occlusal wear. This ensured that the molars would yield plenty of
dentin and enamel. Plaque and calculus were also minimal, as were caries, which only seven
individuals demonstrated. Plaque, calculus, and caries were removed using a dental pick and
were stored in their respective tooth's plastic sample collection bag. Additionally, the skulls were
in good condition, displaying little to no skeletal degradation. The alveolar processes remained
intact enough that extracting the teeth sometimes proved difficult. As a result, if the integrity of
the mandible or maxilla was deemed to be in jeopardy, another skull with slightly looser dental
alveoli was selected. Furthermore, either all or the majority of teeth were still present, whether in
the skull or in the grave, suggesting that tooth loss during life was not rampant.
Methods
Using procedures outlined on UCF's Bioarchaeology Lab Protocol sheets (2014, adapted
from Longin 1971), collagen was extracted from tooth dentin, while apatite was taken from
enamel. The entire extraction process lasted 79 days, not counting the amount of time it took the
mass spectrometry labs to analyze the stable isotopes.
Collagen
To clean the teeth, they were first rinsed with de-ionized water in an ultrasonicator
machine (Fisher Scientific FS30) until the water was clear and debris-free. The molars were
allowed to dry overnight in the oven (Precision Scientific Co. Thelco Model 4) at 60º C. The
dentin was manually separated from the enamel, broken into smaller chunks, weighed, and
placed into 10 mL glass culture test tubes. Each sample was then immersed into 2 mL of 2%
40
hydrochloric acid (HCl) solution, which was changed and agitated daily for approximately 2
months, until the dentin demineralized and only a "ghost" or pseudomorph remained.
The demineralized dentin was rinsed 3 times with distilled water and placed into 2 mL of
.5 M sodium hydroxide (NaOH) for 20 minutes, while being agitated every 5 minutes.
Afterwards, the samples were spun down at 2400 rpm for 10 minutes in a centrifuge (Thermo
Scientific Sorvall ST40), and the NaOH cycle was repeated until the solution was clear in color.
The NaOH was then removed, and the samples were rinsed at least 5 times in de-ionized water
so that the pH reached 7±1. The NaOH step is important because it removes trace elements
and/or contaminants that could lead to diagenetic alteration.
Next, 2 mL of .25 M HCl acid solution was added, the samples were spun down, and the
acid was removed. Distilled water was added to bring the pH to between 2.5 and 3. The collagen
was solubilized by heating it in 2 mL of de-ionized water, after which the test tubes were sealed
and baked at 90º C for 24 hours in the Fisher Scientific Isotemp oven. Samples were then
transferred into empty glass dram vials (weighed beforehand) to bake uncovered at 60º C for 24-
48 hours, until the water evaporated and only collagen remained. The samples were weighed,
and the percent yields were calculated using Equation 3.1:
collagen yield (%) = � collagen weight (g)dry sample weight (g)
�× 100 ( 3.1 )
The final step was to send the samples to the Colorado Plateau Stable Isotope Laboratory
(CPSIL) to stable carbon and nitrogen isotope analysis with the use of a mass spectrometer.

41
Apatite
Apatite extraction is less time-consuming than collagen extraction, though the first few
steps are shared. The teeth were first cleaned in distilled water with an ultrasonicator machine,
and they were left to dry overnight in the oven at 60º C. Afterwards, the enamel was manually
separated from the dentin and subsequently ground into a fine powder (approximately 180
microns in size), using a steel mortar and pestle. About 20-30 mg of the powdered enamel were
weighed out and placed into 2 mL plastic, capped sample tubes.
Then .04 mL of 2% sodium hypochlorite solution per mg of sample was added to the
enamel in each of the plastic tubes, after which the bleach solution was left to sit for 24 hours.
The next day, the bleach was removed. The samples were rinsed 5 times in de-ionized water,
with the help of a centrifuge at 2400 rpm for 5-10 minutes to compact the powder. This step
ensured that none of the sample was pipetted out with the liquid.
Next, .04 mL of .1 M acetic acid solution per mg of sample was added to each tube. The
uncapped samples were covered with plastic wrap and allowed to stand at room temperature for
4 hours, after which they were again rinsed 5 times with distilled water following the same
procedure as for the removal of the bleach. The bleach and acetic acid solutions are essential,
because they remove any possible contaminants that could interfere with the stable isotopic
values. At this time, it was crucial that all the water was pipetted out, since the tubes were
covered with a Kimwipe and placed in the freezer until completely frozen. If any water were to
have remained in the sample tube, isotopic exchange could have occurred between the carbonate
and the water, which might have skewed results.
42
Once the samples were frozen, they were freeze-dried for 1-2 days. As the name implies,
this process has 2 steps: first, the samples were frozen around -60º C, and then they were dried
with the help of a vacuum. By this stage, the powdered enamel has become apatite. Finally, the
dried samples were weighed, and the percent yields were calculated using Equation 3.2:
Apatite yield (%) = � treated sample (mg)untreated sample (mg)
� × 100 ( 3.2 )
The last step was to send the dentin samples to the Colorado Plateau Analytical
Laboratory at Northern Arizona University to undergo mass spectrometry. Stable carbon isotopes
were measured in the samples with gas isotope-mass spectroscopy, using a Delta V Advantage
Mass Spectrometer, with a Carlo Ebra NC2100 Elemental Analyzer. The enamel samples were
sent to the Light Stable Isotope Mass Spectrometry Laboratory at the University of Florida for
stable oxygen isotope analysis.

43
CHAPTER FOUR: RESULTS
This chapter describes the results of the stable isotope analyses for the Solt-Tételhegy
sample, including preservation and any differences in isotopic values based on age, sex, tooth
type, and burial location. The level of preservation is determined through carbon (%C) and
nitrogen (%N) concentrations, collagen yields (%), C:N ratios, and apatite yields (%). Due to
inadequate sample size (n=24), no statistical tests were performed. It is important to remember
that because the stable isotope analyses employed teeth, not bone, the results reflect childhood,
not adulthood, diet.
Sample Preservation
Teeth, like bone, are vulnerable to microbes and post-depositional processes that may
degrade the organic (collagen) and mineral (hydroxyapatite) portions of teeth. This can lead to
diagenetic alteration of their stable isotopes and, therefore, potentially skewed results.
Collagen
The carbon and nitrogen isotopes extracted from dentin collagen are particularly at risk of
diagenesis, because dentin's biochemical structure is less compacted than that of enamel. As a
result, there are larger spaces between the molecules into which microbial contaminants may
embed themselves. Preservation for dentin collagen was assessed using carbon (%C) and
nitrogen (%N) concentrations, collagen yields (%), and C:N ratios. Table 6 presents the stable
carbon and nitrogen isotope results from dentin collagen, as well as the levels of preservation.
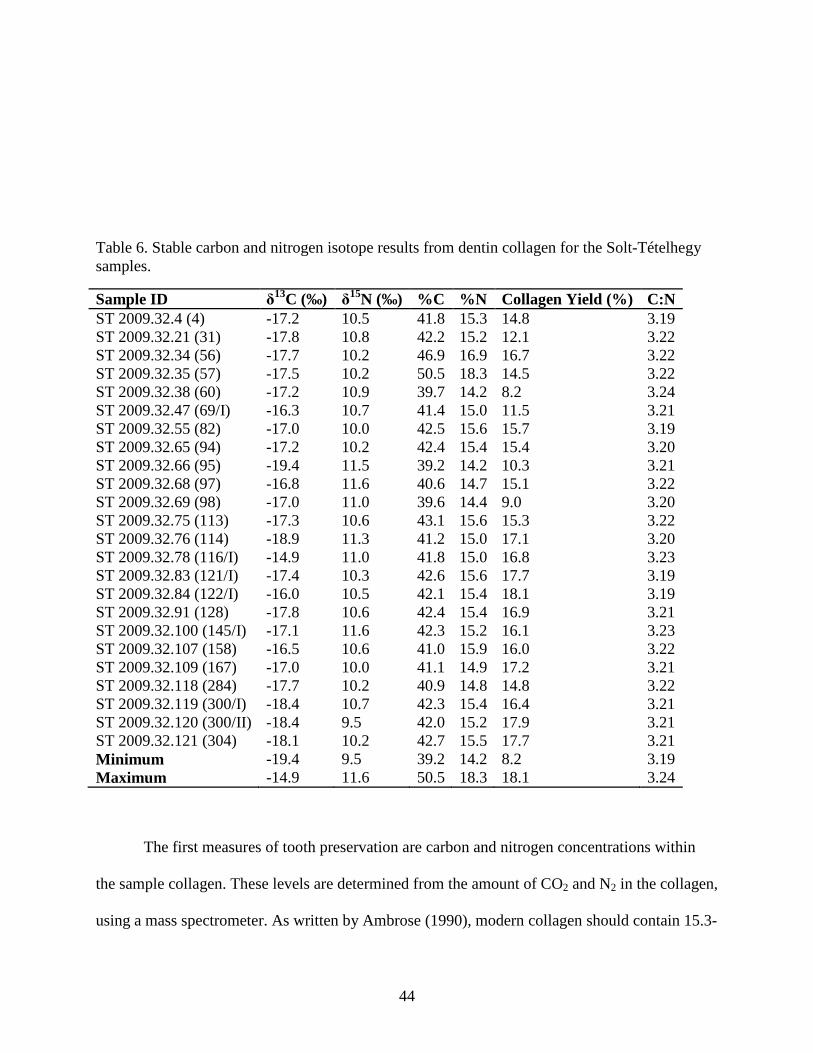
44
Table 6. Stable carbon and nitrogen isotope results from dentin collagen for the Solt-Tételhegy samples.
Sample ID δ13C (‰) δ15N (‰) %C %N Collagen Yield (%) C:N ST 2009.32.4 (4) -17.2 10.5 41.8 15.3 14.8 3.19 ST 2009.32.21 (31) -17.8 10.8 42.2 15.2 12.1 3.22 ST 2009.32.34 (56) -17.7 10.2 46.9 16.9 16.7 3.22 ST 2009.32.35 (57) -17.5 10.2 50.5 18.3 14.5 3.22 ST 2009.32.38 (60) -17.2 10.9 39.7 14.2 8.2 3.24 ST 2009.32.47 (69/I) -16.3 10.7 41.4 15.0 11.5 3.21 ST 2009.32.55 (82) -17.0 10.0 42.5 15.6 15.7 3.19 ST 2009.32.65 (94) -17.2 10.2 42.4 15.4 15.4 3.20 ST 2009.32.66 (95) -19.4 11.5 39.2 14.2 10.3 3.21 ST 2009.32.68 (97) -16.8 11.6 40.6 14.7 15.1 3.22 ST 2009.32.69 (98) -17.0 11.0 39.6 14.4 9.0 3.20 ST 2009.32.75 (113) -17.3 10.6 43.1 15.6 15.3 3.22 ST 2009.32.76 (114) -18.9 11.3 41.2 15.0 17.1 3.20 ST 2009.32.78 (116/I) -14.9 11.0 41.8 15.0 16.8 3.23 ST 2009.32.83 (121/I) -17.4 10.3 42.6 15.6 17.7 3.19 ST 2009.32.84 (122/I) -16.0 10.5 42.1 15.4 18.1 3.19 ST 2009.32.91 (128) -17.8 10.6 42.4 15.4 16.9 3.21 ST 2009.32.100 (145/I) -17.1 11.6 42.3 15.2 16.1 3.23 ST 2009.32.107 (158) -16.5 10.6 41.0 15.9 16.0 3.22 ST 2009.32.109 (167) -17.0 10.0 41.1 14.9 17.2 3.21 ST 2009.32.118 (284) -17.7 10.2 40.9 14.8 14.8 3.22 ST 2009.32.119 (300/I) -18.4 10.7 42.3 15.4 16.4 3.21 ST 2009.32.120 (300/II) -18.4 9.5 42.0 15.2 17.9 3.21 ST 2009.32.121 (304) -18.1 10.2 42.7 15.5 17.7 3.21 Minimum -19.4 9.5 39.2 14.2 8.2 3.19 Maximum -14.9 11.6 50.5 18.3 18.1 3.24
The first measures of tooth preservation are carbon and nitrogen concentrations within
the sample collagen. These levels are determined from the amount of CO2 and N2 in the collagen,
using a mass spectrometer. As written by Ambrose (1990), modern collagen should contain 15.3-

45
47% carbon and 5.5-17.3% nitrogen, but these ranges are deemed applicable to archaeological
collagen, as well. Only one sample from this study (ST 57, with %C=50.5 and %N=18.3)
showed a %C and a %N outside the acceptable range (Figs. 14-15). However, because these
values are only slightly greater than the accepted ranges, they are still adequate for the purpose
of this study. As expected, there is a strong linear relationship between the carbon and nitrogen
concentrations for this sample (Fig. 16).
Figure 14. Graph of the carbon weight percentage (% C) and δ13C (‰) values from dentin collagen. The red dotted line indicates the maximum cut-off for acceptable collagen preservation at 47%.
-20
-19
-18
-17
-16
-15
-14
35 40 45 50 55
δ13 C
dent
in (‰
)
%Cdentin

46
Figure 15. Graph showing the nitrogen weight percentage (%N) and δ15N (‰) from dentin collagen. The red dotted line shows the maximum cut-off for acceptable collagen preservation at 17.3%.
9
10
11
12
14 15 16 17 18 19 20
δ15 N
(‰)
%N
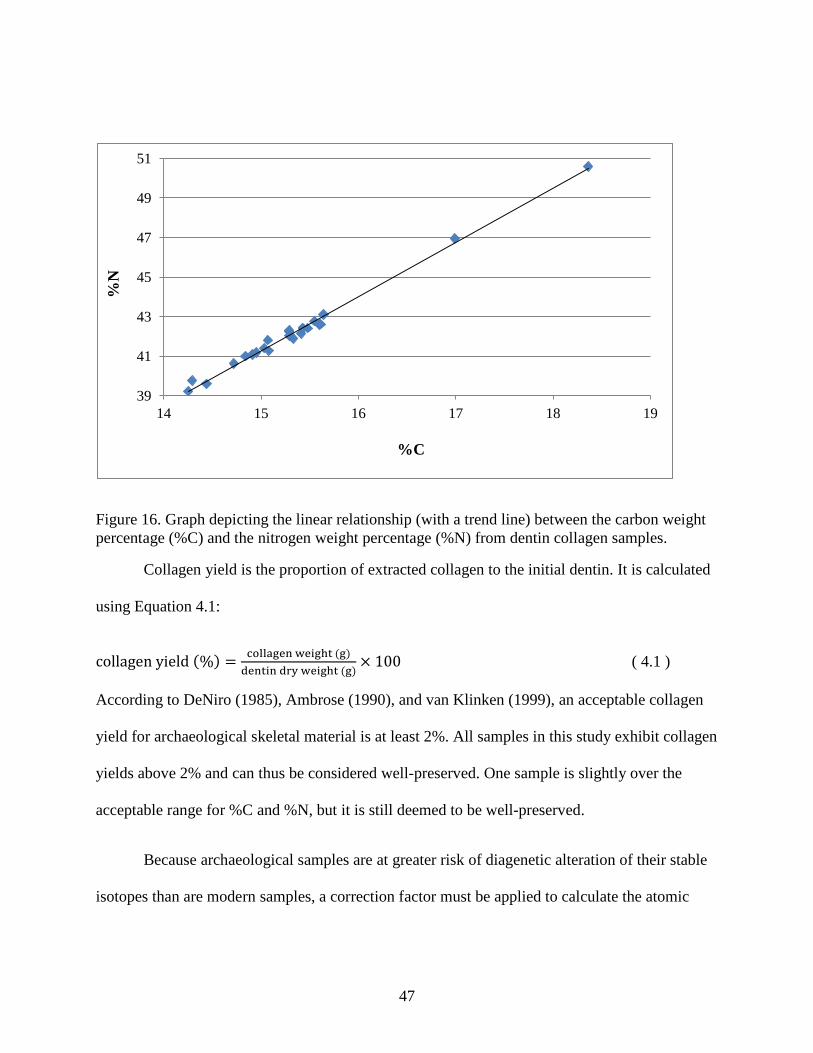
47
Figure 16. Graph depicting the linear relationship (with a trend line) between the carbon weight percentage (%C) and the nitrogen weight percentage (%N) from dentin collagen samples.
Collagen yield is the proportion of extracted collagen to the initial dentin. It is calculated
using Equation 4.1:
collagen yield (%) = collagen weight (g)dentin dry weight (g)
× 100 ( 4.1 )
According to DeNiro (1985), Ambrose (1990), and van Klinken (1999), an acceptable collagen
yield for archaeological skeletal material is at least 2%. All samples in this study exhibit collagen
yields above 2% and can thus be considered well-preserved. One sample is slightly over the
acceptable range for %C and %N, but it is still deemed to be well-preserved.
Because archaeological samples are at greater risk of diagenetic alteration of their stable
isotopes than are modern samples, a correction factor must be applied to calculate the atomic
39
41
43
45
47
49
51
14 15 16 17 18 19
%N
%C
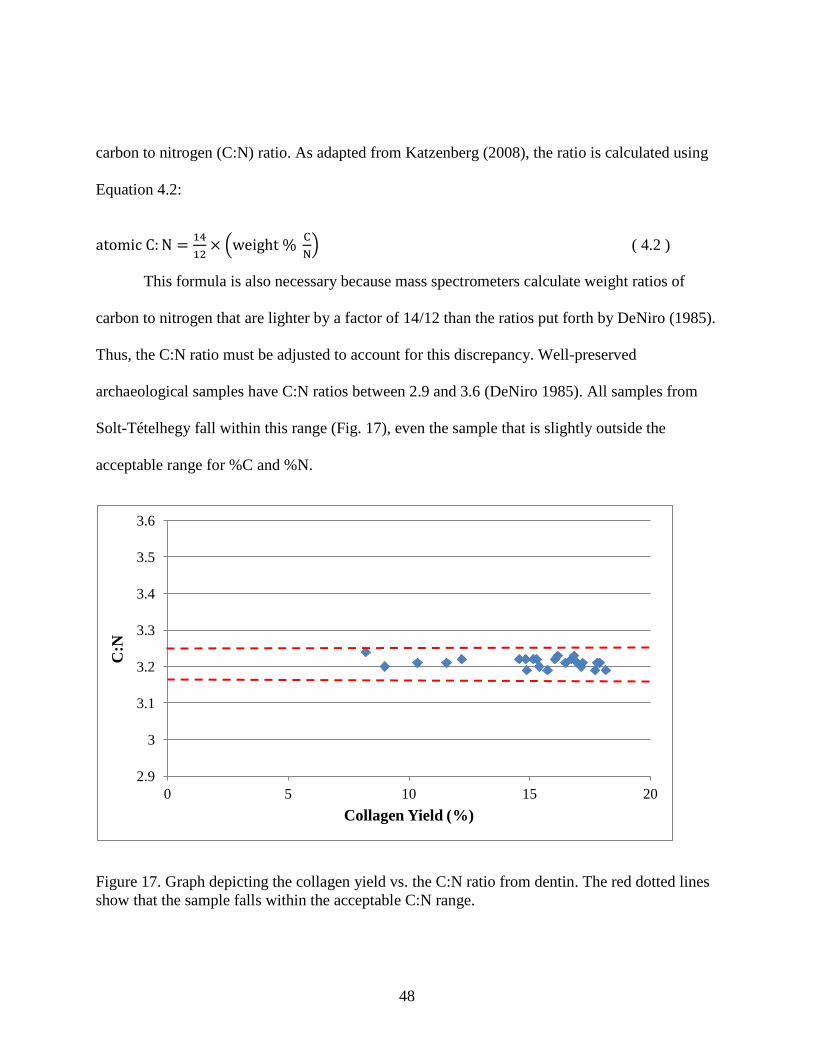
48
carbon to nitrogen (C:N) ratio. As adapted from Katzenberg (2008), the ratio is calculated using
Equation 4.2:
atomic C: N = 1412
× �weight % CN� ( 4.2 )
This formula is also necessary because mass spectrometers calculate weight ratios of
carbon to nitrogen that are lighter by a factor of 14/12 than the ratios put forth by DeNiro (1985).
Thus, the C:N ratio must be adjusted to account for this discrepancy. Well-preserved
archaeological samples have C:N ratios between 2.9 and 3.6 (DeNiro 1985). All samples from
Solt-Tételhegy fall within this range (Fig. 17), even the sample that is slightly outside the
acceptable range for %C and %N.
Figure 17. Graph depicting the collagen yield vs. the C:N ratio from dentin. The red dotted lines show that the sample falls within the acceptable C:N range.
2.9
3
3.1
3.2
3.3
3.4
3.5
3.6
0 5 10 15 20
C:N
Collagen Yield (%)

49
Apatite
Because tooth enamel is nonporous, unlike dentin, it is less subject to diagenetic
alteration of its stable isotopes. Table 7 presents the stable carbon and oxygen isotope results
from enamel apatite. If one considers that a yield of 2% is sufficient for isotope analysis (DeNiro
1985; Ambrose 1990; van Klinken 1999), then the apatite yields for this sample, which are all
greater than 50%, indicate that the teeth are very well-preserved. Apatite yield is the proportion
of extracted apatite to the dry enamel and is calculated using Equation 4.3:
apatite yield (%) = apatite weight (mg)dry enamel weight (mg)
× 100 ( 4.3 )
Table 7. Stable carbon and oxygen isotope results from enamel apatite for the Solt-Tételhegy samples.
Sample ID δ13C (‰) δ18O (‰) Apatite Yield (%) ST 2009.32.4 (4) -11.4 24.5 94.5 ST 2009.32.21 (31) -11.9 23.7 75.6 ST 2009.32.34 (56) -11.4 23.6 92.4 ST 2009.32.35 (57) -10.8 24.3 91.1 ST 2009.32.38 (60) -11.0 25.5 92.3 ST 2009.32.47 (69/I) -9.8 24.6 92.0 ST 2009.32.55 (82) -10.1 25.4 91.2 ST 2009.32.65 (94) -11.3 24.3 92.9 ST 2009.32.66 (95) -14.4 25.4 92.3 ST 2009.32.68 (97) -11.2 25.1 91.4 ST 2009.32.69 (98) -10.1 24.8 91.9 ST 2009.32.75 (113) -11.6 26.3 90.7 ST 2009.32.76 (114) -13.2 25.3 90.6 ST 2009.32.78 (116/I) -10.2 24.6 93.4 ST 2009.32.83 (121/I) -9.6 25.0 92.7 ST 2009.32.84 (122/I) -10.4 25.0 90.6 ST 2009.32.91 (128) -11.1 27.2 87.1 ST 2009.32.100 (145/I) -9.6 25.1 92.9 ST 2009.32.107 (158) -9.3 25.0 69.2 ST 2009.32.109 (167) -8.6 24.8 93.6 ST 2009.32.118 (284) -10.8 24.8 93.4 ST 2009.32.119 (300/I) -12.6 26.6 93.2
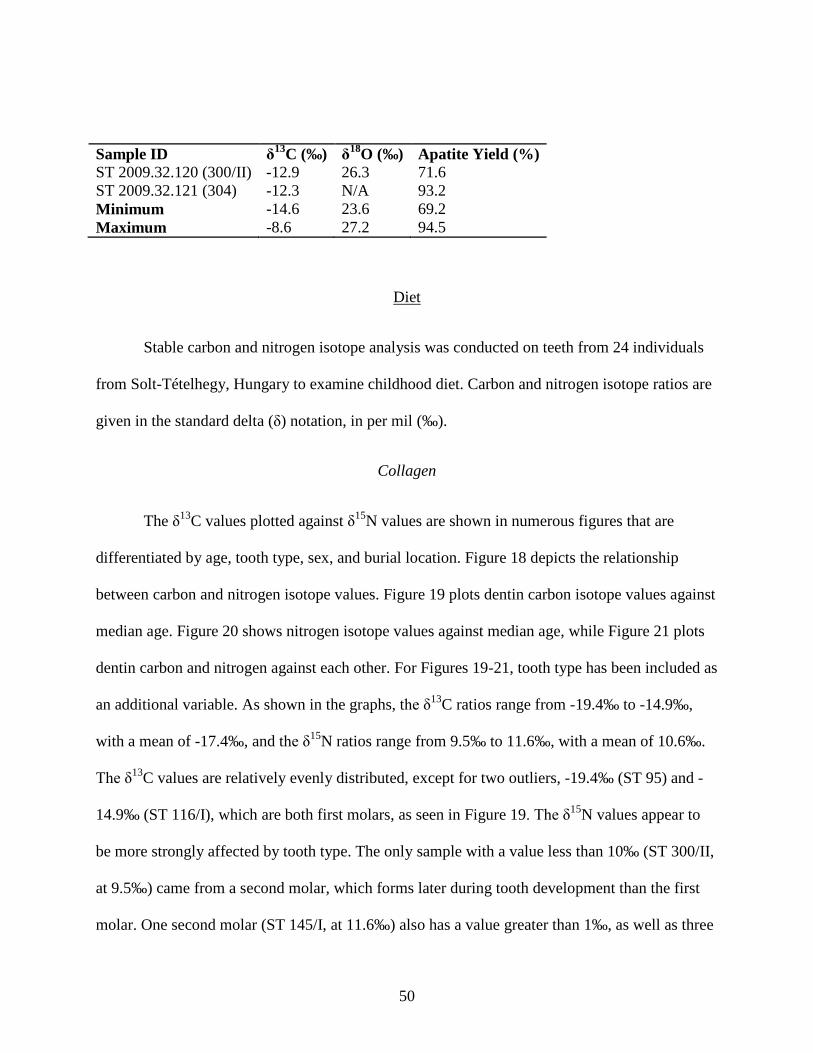
50
Sample ID δ13C (‰) δ18O (‰) Apatite Yield (%) ST 2009.32.120 (300/II) -12.9 26.3 71.6 ST 2009.32.121 (304) -12.3 N/A 93.2 Minimum -14.6 23.6 69.2 Maximum -8.6 27.2 94.5
Diet
Stable carbon and nitrogen isotope analysis was conducted on teeth from 24 individuals
from Solt-Tételhegy, Hungary to examine childhood diet. Carbon and nitrogen isotope ratios are
given in the standard delta (δ) notation, in per mil (‰).
Collagen
The δ13C values plotted against δ15N values are shown in numerous figures that are
differentiated by age, tooth type, sex, and burial location. Figure 18 depicts the relationship
between carbon and nitrogen isotope values. Figure 19 plots dentin carbon isotope values against
median age. Figure 20 shows nitrogen isotope values against median age, while Figure 21 plots
dentin carbon and nitrogen against each other. For Figures 19-21, tooth type has been included as
an additional variable. As shown in the graphs, the δ13C ratios range from -19.4‰ to -14.9‰,
with a mean of -17.4‰, and the δ15N ratios range from 9.5‰ to 11.6‰, with a mean of 10.6‰.
The δ13C values are relatively evenly distributed, except for two outliers, -19.4‰ (ST 95) and -
14.9‰ (ST 116/I), which are both first molars, as seen in Figure 19. The δ15N values appear to
be more strongly affected by tooth type. The only sample with a value less than 10‰ (ST 300/II,
at 9.5‰) came from a second molar, which forms later during tooth development than the first
molar. One second molar (ST 145/I, at 11.6‰) also has a value greater than 1‰, as well as three

51
first molars (ST 114, at 11.3‰; ST 95, at 11.5‰; and ST 94, at 11.6‰). For the graphs that
include median age, it is important to remember that the median age applies only to the age at
which the individual died, not to the age of tooth formation.
Figure 18. Graph depicting δ13C (‰) and δ15N (‰) from dentin collagen.
9
10
11
12
-20 -19 -18 -17 -16 -15 -14
δ15 N
(‰)
δ13Cdentin (‰)

52
Figure 19. Graph showing the relationship between median age (years) and δ13C (‰) from dentin collagen. The results are sorted by tooth type.
Figure 20. Graph depicting the relationship between median age (years) and δ15N (‰) from dentin collagen. The results are sorted by tooth type.
-20
-19
-18
-17
-16
-15
-14
7 9 11 13 15 17 19 21 23 25 27 29 31 33 35 37 39 41 43 45 47 49 51
δ13 C
dent
in (‰
)
Median Age (Years)
1st Molar 2nd Molar
9
9.5
10
10.5
11
11.5
12
7 9 11 13 15 17 19 21 23 25 27 29 31 33 35 37 39 41 43 45 47 49 51
δ15 N
(‰)
Median Age (Years)
1st Molar 2nd Molar

53
Figure 21. Graph comparing δ13C (‰) and δ15N (‰) from dentin collagen. The results are differentiated by tooth type.
Figure 22 depicts dentin δ13C against δ15N, sorted by sex. The majority of individuals are
clustered in the center of the graph, but the highest dentin δ13C (ST 116/I, at -14.9‰) and δ15N
(ST 97, at 11.6‰) values belong to females; the lowest (ST 95, at -19.4‰ and ST 300/II, at
9.5‰, respectively), to males.
9
9.5
10
10.5
11
11.5
12
-20 -19 -18 -17 -16 -15 -14
δ15 N
(‰)
δ13Cdentin (‰)
1st Molar 2nd Molar

54
Figure 22. Graph comparing δ13C (‰) and δ15N (‰) from dentin collagen. The results are sorted by sex.
Of the 24 individuals in this study sample, 20 were buried in a cemetery surrounding a
Gothic church, while four were buried inside the church itself. Figure 23 compares stable carbon
and nitrogen isotope values based on burial location. The majority of samples are evenly
distributed, but there are clear outliers among the carbon (δ13C= -19.4‰ and -14.9‰) and
nitrogen (δ15N= 9.5‰, 11.3‰, 11.6‰, and 11.6‰) isotopes. It appears that this variation is
affected by burial location, as the lowest δ15N value came from an individual buried inside the
church and the highest from outside it. Additionally, it should be noted that both the lowest and
the highest δ13C values were found in individuals interred in the cemetery.
9
9.5
10
10.5
11
11.5
12
-20 -19 -18 -17 -16 -15 -14
δ15 N
(‰)
δ13Cdentin (‰)
Female Male N/A

55
Figure 23. Graph comparing δ13C (‰) and δ15N (‰) from dentin collagen. The results are distinguished by burial location.
The percentage of C4 plants consumed by each individual in the sample can be calculated
using White and Schwarcz's (1989) formula, shown in Equation 4.4:
percentage C4 = (δc−δ3+∆dc)(δ4−δ3) × 100 ( 4.4 )
where δc= the sample's δ13C value, ∆dc= the isotopic fractionation between diet and individual (-
5), δ3= the average δ13C value of C3 plants (-26‰), and δ4= the average δ13C of C4 plants (-9‰).
However, this study modifies the equation to better suit the sample population. Instead of using
White and Schwarcz's (1989) δ4 value, van der Merwe's (1982) value of -12.5‰ is preferable,
because corn, a C4 plant from the Americas, was not consumed in Europe during the 1200s AD.
Therefore, the new formula can be seen in Equation 4.5:
percentage C4 = �δc−(−26)+(−5)��−12.5−(−26)�
× 100 ( 4.5 )
9
9.5
10
10.5
11
11.5
12
-20 -19 -18 -17 -16 -15 -14
δ15 N
(‰)
δ13C (‰)
Outside the Church Inside the Church
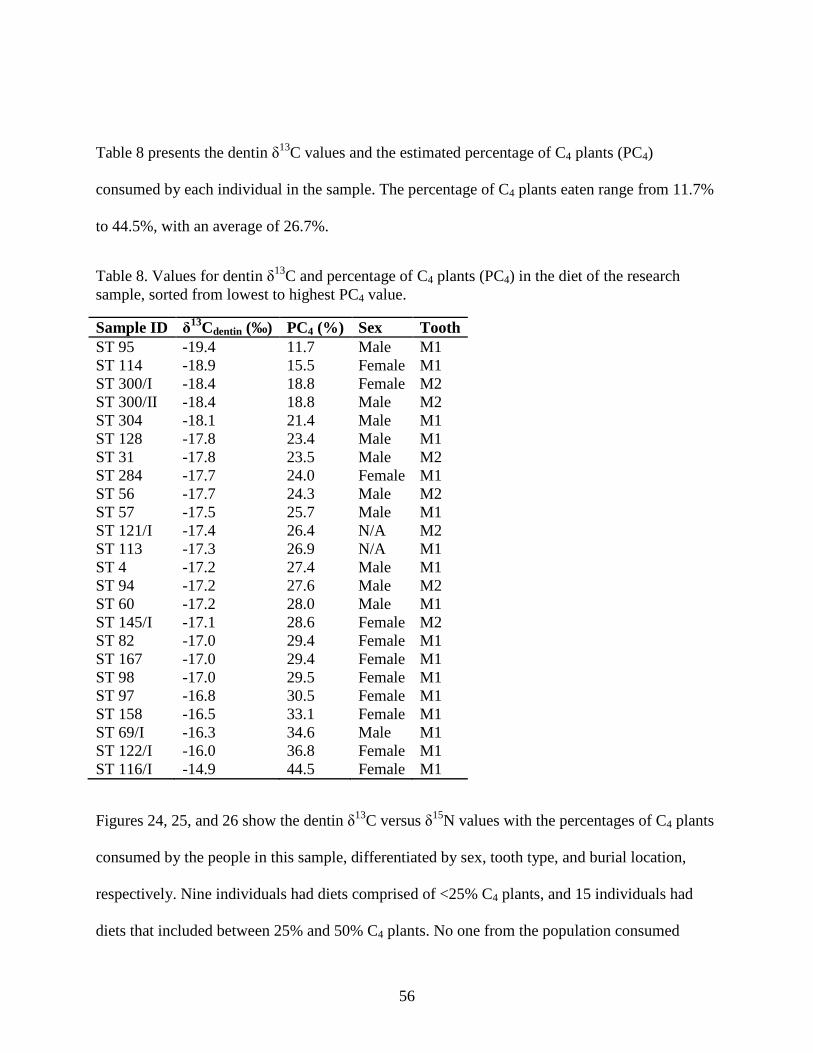
56
Table 8 presents the dentin δ13C values and the estimated percentage of C4 plants (PC4)
consumed by each individual in the sample. The percentage of C4 plants eaten range from 11.7%
to 44.5%, with an average of 26.7%.
Table 8. Values for dentin δ13C and percentage of C4 plants (PC4) in the diet of the research sample, sorted from lowest to highest PC4 value.
Sample ID δ13Cdentin (‰) PC4 (%) Sex Tooth ST 95 -19.4 11.7 Male M1 ST 114 -18.9 15.5 Female M1 ST 300/I -18.4 18.8 Female M2 ST 300/II -18.4 18.8 Male M2 ST 304 -18.1 21.4 Male M1 ST 128 -17.8 23.4 Male M1 ST 31 -17.8 23.5 Male M2 ST 284 -17.7 24.0 Female M1 ST 56 -17.7 24.3 Male M2 ST 57 -17.5 25.7 Male M1 ST 121/I -17.4 26.4 N/A M2 ST 113 -17.3 26.9 N/A M1 ST 4 -17.2 27.4 Male M1 ST 94 -17.2 27.6 Male M2 ST 60 -17.2 28.0 Male M1 ST 145/I -17.1 28.6 Female M2 ST 82 -17.0 29.4 Female M1 ST 167 -17.0 29.4 Female M1 ST 98 -17.0 29.5 Female M1 ST 97 -16.8 30.5 Female M1 ST 158 -16.5 33.1 Female M1 ST 69/I -16.3 34.6 Male M1 ST 122/I -16.0 36.8 Female M1 ST 116/I -14.9 44.5 Female M1
Figures 24, 25, and 26 show the dentin δ13C versus δ15N values with the percentages of C4 plants
consumed by the people in this sample, differentiated by sex, tooth type, and burial location,
respectively. Nine individuals had diets comprised of <25% C4 plants, and 15 individuals had
diets that included between 25% and 50% C4 plants. No one from the population consumed

57
between 50% and 75% C4 plants or >75% C4 plants. There appears to be only a moderate
relationship between sex and the percentage of C4 plants consumed, with the majority of females
eating between 25-50% C4 plants. Males, however, are relatively evenly distributed. Most of the
first molars fall into the 25-50% C4 range, while the second molars are more evenly distributed,
as Figure 25 displays.
Figure 24. Graph showing the percentage of C4 plants consumed in relation to dentin δ13C (‰) versus δ15N (‰) values. The results are sorted by sex.
9
9.5
10
10.5
11
11.5
12
-20 -19 -18 -17 -16 -15 -14
δ15 N
(‰)
δ13Cdentin (‰) Female Male N/A
<25% C4 diet 25-50% C4 50-75% C4 diet

58
Figure 25. Graph showing the percentage of C4 plants consumed in relation to dentin δ13C (‰) versus δ15N (‰). The results are distinguished by tooth type.
Figure 26. Graph depicting the percentage of C4 plants consumed in relation to dentin δ13C (‰) versus δ15N (‰). The results are sorted by burial location.
9
9.5
10
10.5
11
11.5
12
-20 -19 -18 -17 -16 -15 -14
δ15 N
(‰)
δ13Cdentin (‰) 1st Molar 2nd Molar
<25% C4 diet 25-50% C4 diet 50-75% C4 diet
9
9.5
10
10.5
11
11.5
12
-20 -19 -18 -17 -16 -15 -14
δ15 N
(‰)
δ13Cdentin (‰) Outside the Church Inside the Church
<25% C4 25-50% C4 50-75% C4 diet

59
The creation of a food web was not possible for this sample, because there is currently no
stable isotope data for flora or fauna from medieval Hungary.
Apatite
Figure 27 depicts the relationship between median age and carbonate isotope values,
differentiated by tooth type. The enamel δ13C ratios range from -14.4‰ to -8.6‰, with a mean of
-11.1‰. The values are relatively scattered, with just one obvious outlier (δ13C= -14.4‰), in a
first molar. However, another first molar (δ13C = -8.6‰) is the only tooth with a carbonate
isotope value greater than -9‰.
Figure 27. Graph of the relationship between median age (years) and δ13C (‰) from enamel apatite. The results are distinguished by tooth type.
When examining stable carbon isotope values from enamel, Figure 28 shows that there
are sex-based differences. Although most of the values are clustered between -12‰ and -9‰,
-17
-16
-15
-14
-13
-12
-11
-10
-9
-8
7 9 11 13 15 17 19 21 23 25 27 29 31 33 35 37 39 41 43 45 47 49 51
δ13 C
enam
el (‰
)
Median Age (Years)
1st Molar 2nd Molar

60
three values stand out. Males display both the lowest (-14.4‰) and highest (-8.6‰) values, while
a female has the next lowest (-13.2‰) carbonate value.
Figure 28. Graph depicting differences in δ13C (‰) from enamel apatite (carbonate) and δ13C (‰) from dentin collagen. The results are differentiated by sex.
The effect of burial location on enamel carbon values can be seen in Figure 29. The
lowest (-14.4‰) and highest (-8.6‰) enamel δ13C values came from individuals buried in the
cemetery outside the church. The values of three people interred inside the church cluster
between -13‰ and -12‰, while a fourth is an outlier at -10.8‰.
-20
-19
-18
-17
-16
-15
-14
-15 -14 -13 -12 -11 -10 -9 -8
δ13 C
dent
in (‰
)
δ13Cenamel (‰)
Male Female N/A

61
Figure 29. Graph showing differences in δ13C (‰) from enamel apatite (carbonate) and δ13C (‰) from dentin collagen. The results are distinguished by burial location.
Origins and Mobility
Stable oxygen isotope analysis was performed on enamel apatite from 24 individuals
from Solt-Tételhegy, Hungary to determine if childhood migration into the study site occurred.
Oxygen isotope values are written in standard delta (δ) notation, in per mil (‰), and in
VSMOW. Results for only 23 samples, instead of the full 24, are reported, because one sample
(ST 304) was unfortunately lost during stable isotope analysis. The values range between 23.6‰
and 27.2‰, with an average of 25.1‰. Table 9 shows the stable oxygen isotope ratios of 23
individuals from the study sample.
-20
-19
-18
-17
-16
-15
-14
-15 -14 -13 -12 -11 -10 -9 -8
δ13 C
dent
in (‰
)
δ13Cenamel (‰)
Outside the Church Inside the Church

62
Table 9. Stable oxygen isotope results for Solt-Tételhegy, reported in VSMOW.
Sample ID δ18O (‰) ST 2009.32.4 (4) 24.5 ST 2009.32.21 (31) 23.7 ST 2009.32.34 (56) 23.6 ST 2009.32.35 (57) 24.3 ST 2009.32.38 (60) 25.5 ST 2009.32.47 (69/I) 24.6 ST 2009.32.55 (82) 25.4 ST 2009.32.65 (94) 24.3 ST 2009.32.66 (95) 25.4 ST 2009.32.68 (97) 25.1 ST 2009.32.69 (98) 24.8 ST 2009.32.75 (113) 26.3 ST 2009.32.76 (114) 25.3 ST 2009.32.78 (116/I) 24.6 ST 2009.32.83 (121/I) 25.0 ST 2009.32.84 (122/I) 25.0 ST 2009.32.91 (128) 27.2 ST 2009.32.100 (145/I) 25.1 ST 2009.32.107 (158) 25.0 ST 2009.32.109 (167) 24.8 ST 2009.32.118 (284) 24.8 ST 2009.32.119 (300/I) 26.6 ST 2009.32.120 (300/II) 26.3
Figure 30 depicts median age versus δ18O from enamel apatite, with tooth type as an
additional variable. The lowest (ST 56, at 23.6‰) and highest (ST 128, at 27.2‰) values are
seen in 1st molars. Several first molars also appear to cluster between 24‰ and 26‰, with ratios
from second molars showing greater overall variation.

63
Figure 30. Graph showing the relationship between median age (years) and δ18O (‰) from enamel apatite. The results are differentiated by tooth type.
The relationship between enamel δ13C (‰), δ18O, and sex is shown in Figure 31. Most of
the oxygen isotope values for males and females lie between 24‰ and 26‰, but there are a few
obvious outliers, the most extreme belonging to males (at 23.6‰ and 27.2‰). There are also two
clear outliers among the females (at 25.3‰ and 26.6‰), as well as a large gap between the two
juveniles whose sex could not be determined. There appears to be a relationship between carbon
and oxygen, since moderate-high isotope values for carbon (-12‰ to -9‰) seem to correlate
with moderate values for oxygen (24-26‰). Of course, this is not true for all samples. An
intermediate δ13C (-11.1‰) value has a high δ18O (27.2‰) value, and an intermediate δ18O
(25.4‰) ratio has a very low δ13C (-14.4‰) ratio. It is noteworthy that these carbon and oxygen
values belong to males.
23
24
25
26
27
28
7 9 11 13 15 17 19 21 23 25 27 29 31 33 35 37 39 41 43 45 47 49 51
δ18 O
(‰)
Median Age (Years)
1st Molar 2nd Molar
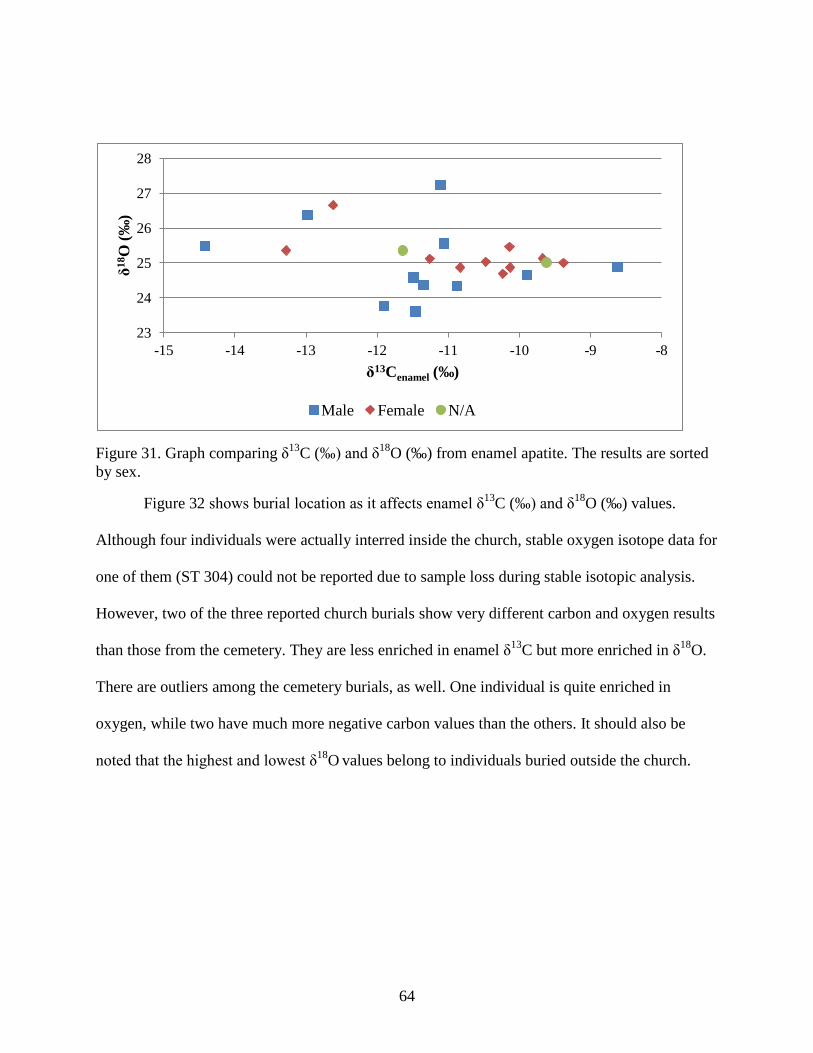
64
Figure 31. Graph comparing δ13C (‰) and δ18O (‰) from enamel apatite. The results are sorted by sex.
Figure 32 shows burial location as it affects enamel δ13C (‰) and δ18O (‰) values.
Although four individuals were actually interred inside the church, stable oxygen isotope data for
one of them (ST 304) could not be reported due to sample loss during stable isotopic analysis.
However, two of the three reported church burials show very different carbon and oxygen results
than those from the cemetery. They are less enriched in enamel δ13C but more enriched in δ18O.
There are outliers among the cemetery burials, as well. One individual is quite enriched in
oxygen, while two have much more negative carbon values than the others. It should also be
noted that the highest and lowest δ18O values belong to individuals buried outside the church.
23
24
25
26
27
28
-15 -14 -13 -12 -11 -10 -9 -8
δ18 O
(‰)
δ13Cenamel (‰)
Male Female N/A

65
Figure 32. Graph showing δ13C (‰) versus δ18O (‰) from enamel apatite. The results are distinguished by burial location.
23
24
25
26
27
28
-15 -14 -13 -12 -11 -10 -9 -8
δ18 O
(‰)
δ13Cenamel (‰)
Outside the Church Inside the Church

66
CHAPTER FIVE: DISCUSSION
This chapter provides an in-depth examination of the study's results within the historical
background of the research site. The diets of the individuals are analyzed and compared to the
diets of contemporaneous populations from Europe. Migration is also discussed, and stable
oxygen isotope levels are compared with populations from other parts of Europe.
General Diet in Medieval Hungary and East-Central Europe
Land was extremely important in early medieval Hungary, as it not only provided food
for humans and herd animals, but possession of it also determined one's place in the social
hierarchy. In the 1200s AD, land was the sole means of acquiring noble status in Hungary, and
after the Mongol invasion of 1241 AD, even free peasants could farm their own land (Engel
2001). Since medieval Hungary, especially eastern and southern Hungary, was sparsely
inhabited, there was plenty of viable farmland. Forests were cleared, and during the first half of
the 13th century, the method of agriculture changed to a system of land rotation (Berend et al.
2013). This meant that plots of land were farmed for 3-5 years, after which they were allowed to
rest and new plots were utilized. Any uncultivated land was devoted to ungulate grazing (Berend
et al. 2013; Engel 2001).
As with most of medieval Europe, Hungary primarily cultivated C3 cereal crops. Wheat
was planted on the central lands, while barley, rye, oats (which are native to Central Europe), and
millet (a C4 plant native to Europe) grew on the periphery lands (Adamson 2004; Berend et al.
2013). Solt-Tételhegy is located in present-day southern Hungary (in the Southern Great Plains),
but it would have been more central in the Middle Ages, since the Kingdom of Hungary was
67
much larger. Wheat would have been the most common grain grown in the region. In fact,
historical sources state that by the early 13th century AD, cereal cultivation was prevalent across
the plains. Yields increased from about double to triple, or even quadruple, the amount of grain
sowed (Berend et al. 2013). Cereals, however, were not the only food plants that grew in the
region. Apples, cherries, sour cherries, peaches, watermelons, peas, onions, beans, lentils,
hazelnuts, and walnuts were also staples in the diets of medieval Hungarians (Adamson 2004;
Berend et al. 2013). Fruits and vegetables were important, and some of the most lucrative
agricultural advances came from the Benedictine monasteries. They introduced intensive garden
cultivation, including orchards and vineyards, leading to the increasing importance of wine and
viticulture. This led to more local and international trade, with grain, wine, live animals (e.g.,
oxen, pigs, and sheep), fruit, honey, salted fish, and salt being the main trade goods (Berend et al.
2013).
Meat, though less plentiful than C3 plants in the diet, was consumed with relative
regularity, and, at the time, animal husbandry played a more significant role in East-Central
Europe than in Western Europe (Berend et al. 2013). Livestock and other food animals were
either kept alongside farmlands in villages, annually on pastures, or seasonally on pastures.
Cattle, sheep, goats, pigs, and horses were the most important animals, for both food and labor,
and cow bones comprise up to 60% of zooarchaeological remains in many settlements (Berend et
al. 2013). Small ruminates, such as goats and sheep, were the most common animals raised in
villages, as they do not require vast pastures, unlike cows and horses. Poultry appears to have
been less popular, making up only 1-8% of zooarchaeological assemblages (Berend et al. 2013),
but bird bones are also less sturdy than mammal bones and may not have survived as well. While

68
hunting was considered a sport for nobles and royals, wild game actually contributed very little
to overall meat consumption (Adamson 2004). Animals like boar, venison, hare, pheasant, and
pigeon were eaten mostly during feasts, while domesticated animals (e.g., chickens, cows, pigs,
and sheep) were preferred for everyday meals. Hungary is also home to many lakes and rivers,
and because of this, freshwater fish, particularly carp and trout, constituted a large part of the
medieval diet (Adamson 2004; Berend et al. 2013).
Diet and Stable Isotopes
According to archaeological and historical sources, it appears that medieval Hungarians
generally had sufficient food. They were not plagued by famine or resource shortages, except in
exceptional circumstances (e.g., during and directly after the Mongol invasion). Contrary to
popular opinion, medieval Europeans as a whole were neither limited nor nutritionally-
impoverished in their selection of foods. As previous studies have demonstrated (Adamson 2004;
Berend et al. 2013; Hakenbeck et al. 2010; Richards et al. 2006), most social classes were able to
procure a relatively wide array of plant foods. The lower classes had access to dietary basics,
such as bread, dairy, meat (usually cheap cuts), eggs, produce, and preserved fish. Based on the
minimal tooth wear observed on the older individuals from Solt-Tételhegy (in their 40s), their
diet, at least, did not appear to have included much grit.
C3 and C4 Plant Consumption
Both collagen and apatite contribute stable carbon isotopes. Humans who consume a diet
of terrestrial C3 plants, with few to no C4 plants, are expected to have dentin δ13C values between
-19‰ and -22‰ (Mays 1997; Papathanasiou 2003; Richards and Hedges 1998). C3 plants have

69
more negative stable carbon isotope ratios than do C4 plants, so they will result in more negative
δ13C values in humans (DeNiro 1987; Mays 1997). From the medieval Solt-Tételhegy sample,
only one (ST 95 at -19.41‰) individual fits this trend, while the rest of the population falls
within the -18‰ to -14‰ range. All individuals displayed C3 plant percentages higher than 50%,
with most being above 70%. These values indicate that C3 plants were the dominant produce but
that C4 plants constituted an average of 26.7% of the diet. The enamel δ13C, or carbonate, values
support the dentin carbon values. Most of the population consumed more C3 plants than C4
plants, with the probable exception of four individuals, whose carbonate δ13C ratios range from -
9.6‰ to -8.6‰. All others are either intermediate between C3 and C4 values or are closer to C3
values. This holds true for other medieval European populations, as well, because C3 plants were
the most plentiful edible plant type in Europe. Cereal crops, such as wheat, barley, oats, and rye,
were the primary C3 foods, but legumes, root vegetables, cabbages, onions, and various fruits
were also consumed, though probably in reduced quantities (Adamson 2004; Berend et al. 2013).
Grains were popular due to their many uses. They could be baked into breads; cooked into soups,
stews, porridges, and potages; mixed into batters; or brewed into beers. They were also usually
cheaper than the more vitamin- and fiber-rich vegetables (Adamson 2004). As for C4 plants, the
most likely species eaten by the study sample is millet, because it has been cultivated in Europe
since at least 2000 BC (Adamson 2004). C4 plant consumption varies, with the highest
percentage belonging to a female (ST 116/I, at 44.5%) and the lowest belonging to a male (ST
95, at 11.7%). Both of these individuals were buried in the cemetery outside the church, so they
were presumably from the same ethnic group and from a similar social status. This dietary
difference could be attributed to various causes, including status- and sex-based causes.
70
Historically, millet has been associated with lower-status diets and was used as animal fodder
(Dupras and Tocheri 2007; Reitsema and Vercellotti 2012). Thus, the individuals with higher
levels of millet consumption could have occupied a slightly lower rung in society, or they may
not have been able to afford C3 cereals. It is also possible that they had more access to millet than
to other grains or vegetables, simply because they grew up in areas with high millet cultivation,
like the Slavic areas of East-Central Europe (Berend et al. 2013; Lightfoot et al. 2012). Sex may
play a role, since more females than males show PC4 levels ranging from 25% to 50%. Female
children, for whatever reason, could have been preferentially fed millet. Weaning, however,
could have contributed to the increased PC4 levels, as well. In historical societies, millet, mixed
with goat's milk, cow's milk, sheep's milk, or water, was a popular weaning food (Dupras and
Tocheri 2007; Dupras et al. 2001; Fuller et al. 2006), so the individuals with high C4 plant
percentages could be displaying weaning signals. Support for the weaning hypothesis is lent by
the observation that the majority of high PC4 levels come from 1st molars. A final possibility to
explain the differences in C4 plant consumption is that millet was used as an illness or a
convalescence food by the residents of medieval Solt-Tételhegy, like it was by Roman-era
Egyptians (Dupras 2015, personal communication). If the individuals with high C4 plant
consumption had a chronic illness or nutritional deficiency during dental crown formation, their
δ15N values may be enriched. Two females do indeed show a positive correlation between high
nitrogen isotope and high PC4 levels, so they may have been given millet specifically to aid in
recovery from their illness.
A common δ15N estimate for terrestrial feeders is between 5‰ and 12‰, while for
marine feeders, it is 12-22‰ (Richards and Hedges 1998). The values from Solt-Tételhegy fall

71
strictly within the terrestrial feeders range, despite historical sources stating that moderate
amounts of freshwater and marine fish were consumed by medieval Hungarians. With the
highest δ15N value at 11.6‰, the study population evidently did not consider fish to be an
important part of its diet. Instead, it is likely that the individuals absorbed protein from terrestrial
plants and animals, such as small ruminates (e.g., goats and sheep), chickens, and cows. Pigs
were eaten in medieval Hungary, but secondarily to ruminates (Adamson 2004; Berend et al.
2013). Because pigs are generally omnivorous, like humans, they occupy a higher trophic level
than do herbivorous food animals and thus contribute higher δ15N values to their consumers. For
example, residents of medieval Norwich showed potential signs of heavy pork consumption, as
their nitrogen isotope values were very enriched (Bayliss et al. 2004). However, the δ15N values
of this sample are consistently lower than Bayliss et al.'s (2004) values, suggesting that pigs were
not as prevalent in the diet. The inhabitants of Solt-Tételhegy consumed a moderate amount of
animal protein during their childhood, but it is likely that much of their childhood dietary protein
came from plants.
Diet and Tooth Type
Because this study utilizes teeth, only childhood diet is reflected; however, because tooth
developmental rates are well known, it is possible to determine the approximate age at which the
individuals were consuming the bulk of their research-relevant diet.
The lowest and highest dentin δ13C values are from first molars, which are fully formed
between 9 and 10 years, as are the lowest and highest enamel δ13C ratios. For the most part, the
first molars have greater dentin and enamel carbon isotope enrichment. This could indicate
72
retained weaning signals, a weaning effect, or the presence of weaning foods, such as cow's milk
or millet. Infants who are weaning display greater dentin carbon and/or nitrogen isotope values,
as they occupy a higher trophic level than other humans, due to consumption of their mother's
milk (Dupras and Tocheri 2007; Dupras et al. 2001). One reason why first molars are a better
marker for breastfeeding and weaning is that they develop before second molars do; thus, they
ultimately contain more protein during infancy than second molars (Richards et al. 2002). One
second molar, however, also shows an enriched δ15N ratio, which could be the result of a
pathological condition. But without examining the individual's bones, this remains mere
conjecture.
Social Influences on Diet
As several stable isotopic studies have demonstrated, diet and social life are inextricably
linked in medieval Europe. Males tended to consume more animal protein than females, because
they were deemed to be higher in the social hierarchy and because they usually engaged in more
demanding physical activity (Reitsema et al. 2010; Richards et al. 2006). At the same time, male
children were often valued above female children (Reitsema et al. 2010). Medieval Solt-
Tételhegy, however, does not appear to conform to these trends. Rather, it is females, not males,
who have the highest dentin carbon isotope values, as well as the most enriched nitrogen isotope
values. This indicates that most female children ate as much animal protein as male children.
Why this is the case is as yet unclear. Perhaps some of the families with female children could
better afford meat and non-starchy vegetables. Or perhaps female children were simply exposed
to more protein as a result of aiding their mothers in food preparation, as suggested by Reitsema
73
and Vercellotti (2012). Additionally, it has been documented in both historical and modern
societies that females tended to snack throughout the day, due to their proximity to food (Larsen
1997). Another possibility, however, is that female children were fed higher-quality diets to
ensure they survived to reproductive age.
Solt-Tételhegy also differs from many other medieval settlements in its relatively
egalitarian access to food and meat in particular. Although there are outliers among enamel δ13C,
dentin δ13C, and δ15N isotope values, social status does not appear to explain this. The four
individuals who were interred inside the church were likely more privileged than those buried
outside it, especially considering one of them was involved in its construction, yet their stable
isotope values are not necessarily more enriched. In fact, the lowest δ15N value belongs to one of
the males excavated from beneath the church. Furthermore, most of the individuals buried in the
cemetery display more enriched δ15N values, suggesting that higher status did not always equate
with preferential access to animal protein. If Solt-Tételhegy really was an Árpádian-period
administrative center, it was wealthier than many other contemporaneous settlements in Hungary
(Szentpéteri 2014). It is therefore possible that, by default, its residents enjoyed a more
comfortable lifestyle with higher-quality food resources. Alternatively, the individuals buried in
the cemetery could span multiple social classes, some higher and some lower, though all were
probably less affluent than the individuals interred inside the church. Thus, differences in wealth
and access to animal and plant protein may have existed amongst those interred in the cemetery.
The final social characteristic that will be discussed is religion. Strict fasting laws
imposed by the Catholic Church prohibited the consumption of mammalian protein on nearly
74
half the days of the year (Kjellström et al. 2009; Müldner and Richards 2007; Salamon et al.
2008). To combat this, medieval peoples incorporated fish into their diets. Solt-Tételhegy's
inhabitants do not show overly depleted carbon or nitrogen values, but neither are they as
enriched as other medieval European populations (e.g., Swedish). Szentpéteri (2014) writes that
most Árpádian-period settlements in Hungary lacked a church, but Solt-Tételhegy had at least
two. The church in which four individuals were interred had existed in some form or another
since the middle Bronze Age (Somogyvári 2014; Szentpéteri 2014), so when Hungary eschewed
paganism in favor of Christianity in 1000 AD, the villagers were subject to the Church's fasting
restrictions. Furthermore, the town had two religious buildings by the 1200s AD, suggesting that,
on the surface, at least, the residents adhered closely to Catholic dietary directives. This may
partly explain why, despite evidence of status and wealth (e.g., tax stamps, imported ceramics,
high-quality artifacts, and egalitarian access to food), the research population has lower δ15N
values than medieval sites in Northern Europe (e.g., Sigtuna, Sweden). Two other religious
explanations for the relatively low nitrogen isotope levels are Islam and Judaism. Despite the
official dominance of Christianity, medieval Hungary was home to many Muslims and Jews,
because the kingdom was especially accepting of them (Berend et al. 2013). Neither faith allows
its adherents to consume pork, which is a high trophic-level protein. This could also account for
the individuals with low δ15N values. It is therefore possible that Jews, Muslims, or both lived in
medieval Solt-Tételhegy.

75
Diet and Illness
When a person is suffering from illness or malnourishment, one of the side effects is a
negative nitrogen balance, wherein the body is not absorbing enough nitrogen. To compensate,
the body cannibalizes protein from musculoskeletal tissues, leading to the excretion of 14N and
the absorption and subsequent enrichment of 15N (Katzenberg and Lovell 1999). Negative
nitrogen balance may possibly explain why two females from medieval Solt-Tételhegy have
higher δ15N values than males. If these female children were chronically ill or experiencing
chronic nutritional stress during dental crown formation, their bodies could have been thrown
into negative nitrogen balance. The fact that a female also had the highest PC4 consumption
lends further support to this idea, since millet may have been used as an illness food. However,
until pathological data is acquired for this sample, the link between nitrogen enrichment, millet,
and pathological/nutritional stress is merely conjecture.
Diet and Migration
Comparisons between the study population's oxygen isotope values can be made with
those of contemporaneous populations elsewhere in Europe. Solt-Tételhegy's δ18O values are
enriched by approximately 5‰ in comparison to the various Eurasian countries (e.g., Belgium,
Germany, and Iran) reported by Daux et al. (2008), and at least 4‰ greater than the values
determined by Brettell et al. (2012) for medieval France and Germany. It is therefore likely that
the sample population was consuming more 18O-enriched food and water during childhood than
were other Eurasian populations. Table 10 provides the δ18O values (‰) found by Brettell et al.
(2012) and Daux et al. (2008).

76
Table 10. Summary of the stable oxygen isotope results from Brettell et al. (2012) and Daux et al. (2008).
Authors Sites δ18O (‰) Brettell et al. (2012) Kent, UK 17.6-18.8
Hannover-Anderten, Germany 16.9-17.9 Sannerville and Giberville, France 17.4-18.2
Daux et al. (2008) Brussels, Belgium 15.9-17.5 Bordeaux, Le Tholy, and St. Amand, France 16.2-18.3 Flossenbürg, Germany Mean: 16.4 Athens, Greece Mean: 16.9 Kermanshah, Iran 17.6-18.4
If skull shape is the sole determining factor, there appear to be two separate ethnic
groups, which are conveniently differentiated by burial location, as well. The first group consists
of the individuals buried outside the church, who have a longer and narrower brain case. The
second group is comprised of individuals interred inside the church, with hyperbrachycranic
(shorter and wider) skulls. However, stable oxygen isotope values introduce the possibility of
multiple ethnicities and/or nationalities arriving in medieval Solt-Tételhegy from Central Europe,
Eastern Europe, the Mediterranean, and even the Middle East.
Although the baseline δ18O levels used in this study are modern, it is nevertheless
possible to compare these values with the research sample's δ18O values. All of the δ18O are
above 23.6‰ but below 28‰. Thus, as Figures 33-34 show, no individuals migrated from
Northern Europe or Russia. It is also unlikely that anyone travelled from the British Isles.
Instead, since the majority of the values range from 24-25‰, these individuals were most likely
born in Central and Eastern Europe (Fig. 35). This is to be expected, as early medieval Hungary

77
was a veritable melting pot of Central and Eastern European ethnicities, including Germans,
Slavs (e.g., Moravians from present-day Czech Republic), and the native Hungarians.

78
Figure 33. Oxygen isoscape map of Europe, with the δ18O values (‰) of annual precipitation reported in VSMOW (adapted from waterisotopes.org).
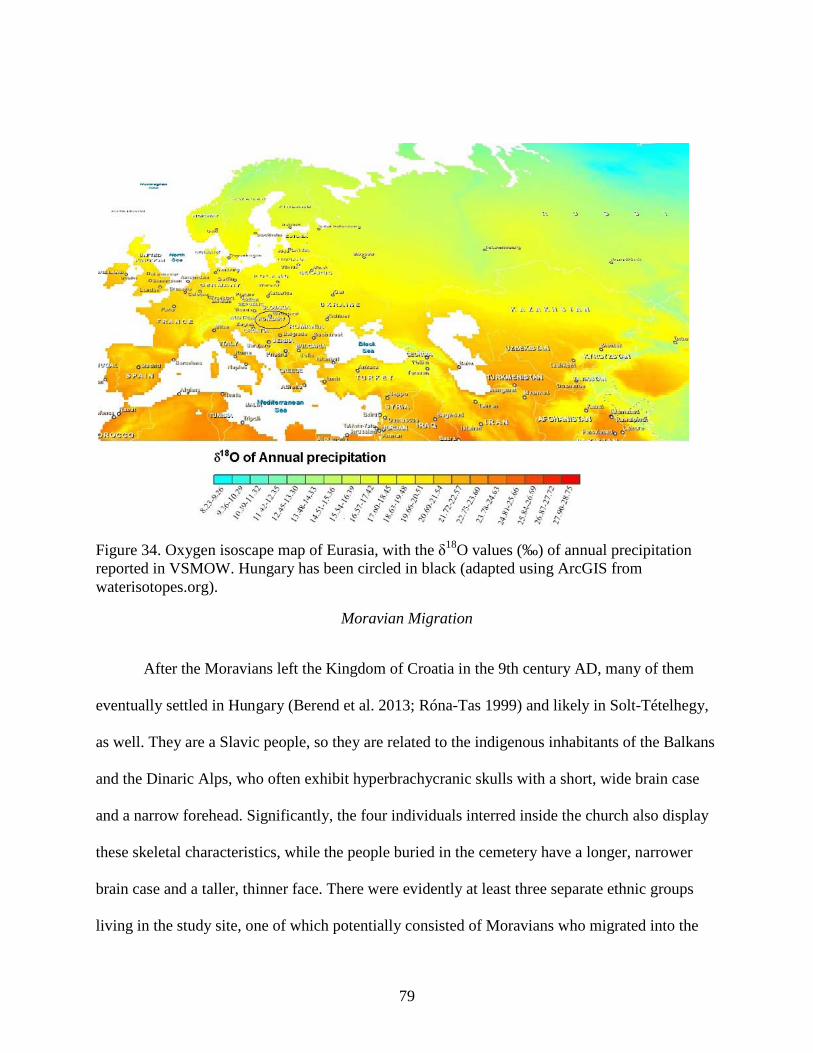
79
Figure 34. Oxygen isoscape map of Eurasia, with the δ18O values (‰) of annual precipitation reported in VSMOW. Hungary has been circled in black (adapted using ArcGIS from waterisotopes.org).
Moravian Migration
After the Moravians left the Kingdom of Croatia in the 9th century AD, many of them
eventually settled in Hungary (Berend et al. 2013; Róna-Tas 1999) and likely in Solt-Tételhegy,
as well. They are a Slavic people, so they are related to the indigenous inhabitants of the Balkans
and the Dinaric Alps, who often exhibit hyperbrachycranic skulls with a short, wide brain case
and a narrow forehead. Significantly, the four individuals interred inside the church also display
these skeletal characteristics, while the people buried in the cemetery have a longer, narrower
brain case and a taller, thinner face. There were evidently at least three separate ethnic groups
living in the study site, one of which potentially consisted of Moravians who migrated into the

80
settlement. Further support may be lent by church enamel δ13C values (-12.9‰, -12.6‰, and -
12.3‰) that differ by at least 1‰ from those buried in the cemetery. The individuals inside the
church also fall on the lower end of the PC4 range, indicating that C4 plants did not constitute a
large part of their childhood diets, unlike many of the people buried outside the church. A
possible explanation for this observation is that the hyperbrachycranic group (i.e., buried inside
the church) grew up elsewhere, perhaps where millet was not widely cultivated, before migrating
into Solt-Tételhegy later in life.
However, based on the stable oxygen isotope results (Table 11), this hypothesis does not
seem to hold up, for two reasons. First, the δ18O value for one of the hyperbrachycranic
individuals (ST 284, a female) is about 2‰ less than the values of the two remaining church-
buried individuals (a female and a male), which are grouped close together. Second, most of the
population, including ST 284, has similar enough oxygen isotope ratios that they form a cluster,
while two cemetery and two church burials are obvious outliers. Therefore, it is unlikely that all
the hyperbrachycranic individuals migrated into the settlement. A possible explanation is that the
hyperbrachycranic individuals constitute a separate genetic ethnic group: Moravian, whose
members may have grown up in very different places. Two of them, ST 300/I and ST 300/II,
entered Solt-Tételhegy in their late teens or early adulthood. ST 284, on the other hand, was
probably born there, and her parents or grandparents may have been migrants into the site.
Though all three individuals were buried inside the church, that does not necessarily mean they
belonged to the same family. The clustered male (ST 300/II) and female (ST 300/I) could be
related (e.g., siblings), and the lone female (ST 284) could be related to the fourth person (a

81
male) excavated from the church's interior. Unfortunately, δ18O data for this individual is not
available, due to sample loss during stable oxygen isotope analysis.
Table 11. The δ18O values (‰) for the research sample, reported in VSMOW.
Sample ID δ18O (‰) ST 2009.32.4 (4) 24.5 ST 2009.32.21 (31) 23.7 ST 2009.32.34 (56) 23.6 ST 2009.32.35 (57) 24.3 ST 2009.32.38 (60) 25.5 ST 2009.32.47 (69/I) 24.6 ST 2009.32.55 (82) 25.4 ST 2009.32.65 (94) 24.3 ST 2009.32.66 (95) 25.4 ST 2009.32.68 (97) 25.1 ST 2009.32.69 (98) 24.8 ST 2009.32.75 (113) 26.3 ST 2009.32.76 (114) 25.3 ST 2009.32.78 (116/I) 24.6 ST 2009.32.83 (121/I) 25.0 ST 2009.32.84 (122/I) 25.0 ST 2009.32.91 (128) 27.2 ST 2009.32.100 (145/I) 25.1 ST 2009.32.107 (158) 25.0 ST 2009.32.109 (167) 24.8 ST 2009.32.118 (284) 24.8 ST 2009.32.119 (300/I) 26.6 ST 2009.32.120 (300/II) 26.3
It is also important to note that two individuals from the cemetery display outlying δ18O
ratios. The first, ST 113, is considered an outlier simply because it is nearly identical to one of
the church-burial's (ST300/II) values, suggesting a common geographical origin. The second
cemetery burial will be discussed in the next subsection. From these observations, it is possible
that multiple, short-distance migrations occurred into the area. Thirteenth century Solt-Tételhegy
82
was a large settlement, perhaps even an administrative center. It is therefore conceivable that
people from different parts of East and Central Europe moved there for work or other reasons.
Furthermore, people from the Balkans and the Dinaric Alps, such as the hyperbrachycranic
Moravians, evidently also came to Solt-Tételhegy. One of these individuals may have even spent
her childhood there. This should come as no surprise, though, considering Hungary's long history
of diversity. During the Middle Ages, Germans, Poles, and Slavs were all frequent immigrants
into the country, and it appears that genetic Moravians lived and died in Solt-Tételhegy, as well.
Other Migrations
Medieval Solt-Tételhegy was situated near a prominent and extensive trade route. As
Figure 35 depicts, this trade route intersected with others throughout Eurasia, leading to the
inevitable commingling of different peoples. Additionally, the Kingdom of Hungary was at the
crossroads of the east and west, of Islam and Christianity. Its ethnic and religious tolerance
attracted Jewish and Muslim immigrants alike, who were not always welcome in Central or
Western Europe (Berend et al. 2013). Orosháza, in eastern Hungary, was particularly popular,
but whether or not Solt-Tételhegy was, as well, is uncertain.
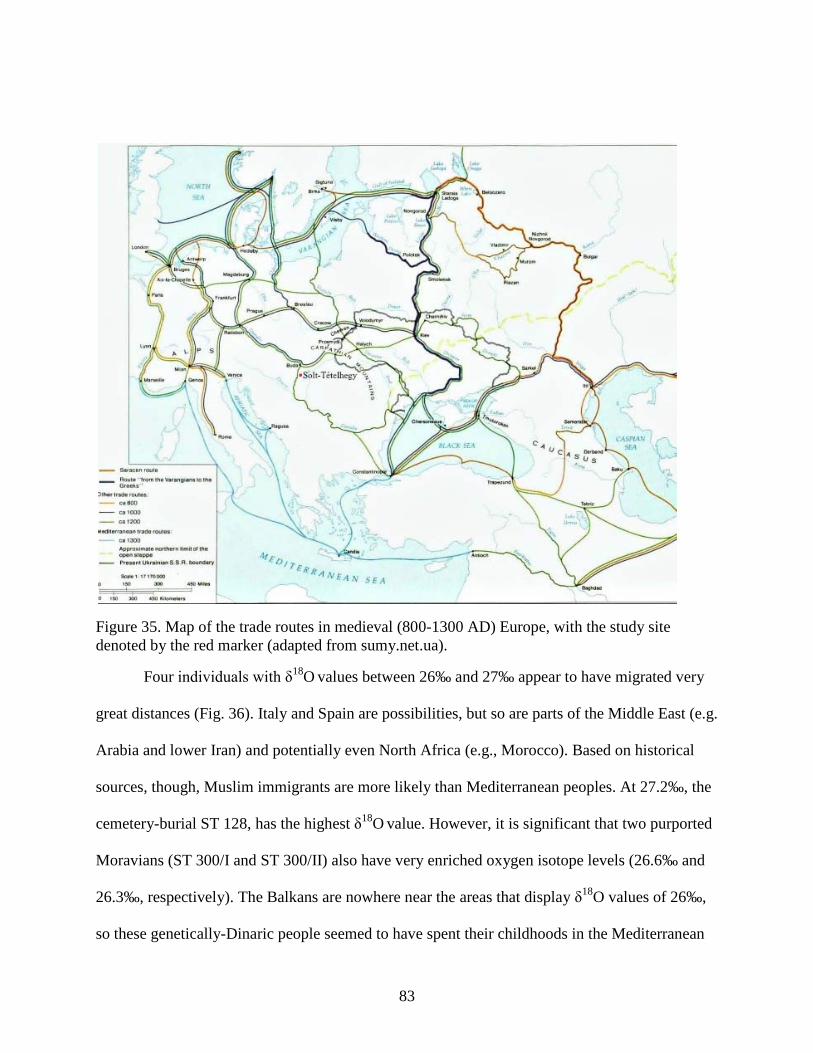
83
Figure 35. Map of the trade routes in medieval (800-1300 AD) Europe, with the study site denoted by the red marker (adapted from sumy.net.ua).
Four individuals with δ18O values between 26‰ and 27‰ appear to have migrated very
great distances (Fig. 36). Italy and Spain are possibilities, but so are parts of the Middle East (e.g.
Arabia and lower Iran) and potentially even North Africa (e.g., Morocco). Based on historical
sources, though, Muslim immigrants are more likely than Mediterranean peoples. At 27.2‰, the
cemetery-burial ST 128, has the highest δ18O value. However, it is significant that two purported
Moravians (ST 300/I and ST 300/II) also have very enriched oxygen isotope levels (26.6‰ and
26.3‰, respectively). The Balkans are nowhere near the areas that display δ18O values of 26‰,
so these genetically-Dinaric people seemed to have spent their childhoods in the Mediterranean
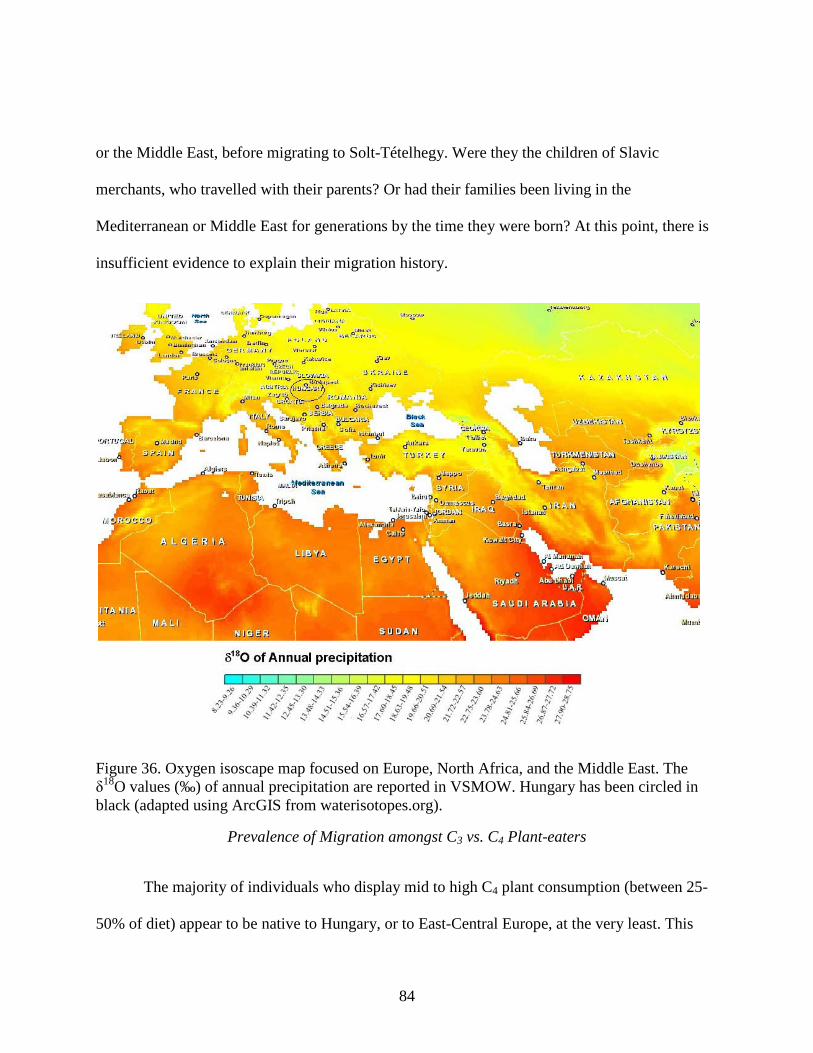
84
or the Middle East, before migrating to Solt-Tételhegy. Were they the children of Slavic
merchants, who travelled with their parents? Or had their families been living in the
Mediterranean or Middle East for generations by the time they were born? At this point, there is
insufficient evidence to explain their migration history.
Figure 36. Oxygen isoscape map focused on Europe, North Africa, and the Middle East. The δ18O values (‰) of annual precipitation are reported in VSMOW. Hungary has been circled in black (adapted using ArcGIS from waterisotopes.org).
Prevalence of Migration amongst C3 vs. C4 Plant-eaters
The majority of individuals who display mid to high C4 plant consumption (between 25-
50% of diet) appear to be native to Hungary, or to East-Central Europe, at the very least. This

85
supports historical accounts that East-Central Europe grew an abundance of C4 plants, such as
millet, as alternatives to C3 cereal crops or as a weaning food. However, C4 plants were grown
outside of East-Central Europe, as well. One individual whose δ18O value suggests a geographic
origin in the Mediterranean or in traditionally-Islamic lands has a PC4 of 26.9%. The remaining
three long-distance migrants, also either Mediterranean or Islamic peoples, show some of the
lowest percentages. If one considers that most modern millet is cultivated in semi-arid regions,
such as Africa or the Middle East, this finding is surprising. Additionally, the two lowest
percentages of C4 plant consumption are observed in East-Central Europeans. Various
explanations could account for the limited inclusion of C4 crops in these individuals' diets, but
perhaps the most likely is that they may have been a status- or sex-based food.
86
CHAPTER SIX: CONCLUSIONS
This research addressed questions of childhood diet and mobility of a medieval
population from Hungary. It provided preliminary insight into the childhood diets of at least
three different ethnic groups from 1240s AD Solt-Tételhegy, Hungary. Migrations into the site
were also discussed, as were the most probable geographic origins, and thus ethnicities, of the
immigrants. Furthermore, the influence of sex and status was examined, and comparisons were
drawn between Solt-Tételhegy and other medieval European sites.
According to historical documents, archaeobotany, and stable isotope analysis, the
sample population enjoyed a diet relatively abundant in both plant and animal foods. There was
no consistent pattern in diet based on sex, and social status did not affect diet in the expected
manner, as several individuals buried in the cemetery outside the church displayed greater carbon
and nitrogen isotope enrichment than those interred inside the church. Weaning signals may also
be present in first molars, while a pathological condition could explain the enrichment seen in
one second molar.
Stable dentin carbon analysis suggests that primarily terrestrial C3 plants comprised the
individuals' plant-protein quota. The average percentage of C4 plants consumed was only 26.7%.
However, C4 plants, most likely millet, comprised nearly 50% of one individual's diet. There
appears to be a link between C4 plant consumption and sex, as the highest percentage belonged
to a female (44.5%), while the lowest percentage belonged to a male (11.7%). Stable enamel
carbon analysis, too, depicts a diet rich in temperate C3 plants, with varying levels of C4 plant
consumption.

87
Stable nitrogen analysis shows that the residents consumed a moderate amount of animal
protein, though this varies by individual. However, because δ15N levels are not overly enriched,
they most likely consumed more plants than animal products. Additionally, it does not appear
that marine resources were included in the diet. Unlike many contemporaneous European
populations, the sample from Solt-Tételhegy does not depict consistent sex- or status-based
patterns in δ15N values, though the differences do not conform to trends seen elsewhere in
medieval Europe.
Stable oxygen isotope analysis appears to support the osteological observation that at
least three separate genetic ethnic groups are present in the study sample. One of these groups is
probably Moravian, another is likely native Hungarians (and therefore native East-Central
European), while the third could be either Mediterranean or Muslim. Although the precise origin
of the individuals cannot be determined with the data available, it is nevertheless clear that
several independent migrations occurred into Solt-Tételhegy.
This study is important to anthropology and to bioarchaeology. There currently exists no
other stable isotopic research on the people of medieval Hungary and only a few from East-
Central Europe in general. This analysis is a springboard for other stable isotope projects in
Hungary and in the region, and it also contributes to the larger body of stable isotopic studies on
medieval Europe. Additionally, most dietary isotopic research focuses on bones, rather than on
teeth, and thus on adulthood diet, instead of on childhood diet. In that respect, too, this study is
important.

88
Future Directions
This sample has the potential to yield a wealth of other information. It presents the
opportunity to pursue a nutritional profile for the entire lifespan, by combining stable isotope
analysis on both teeth (childhood diet) and bones (adulthood diet). Although the individuals with
enriched nitrogen ratios were likely consuming more protein, their values may also be attributed
to nutritional stress or to pathological conditions, particularly if their skeletons display signs of
either. Further migration studies are also possible. Comparing the stable oxygen isotope values
from this sample to those from medieval Moravian settlements, such as Mikulčice, could
pinpoint the geographical origins of Solt-Tételhegy's Slavic group. Likewise, δ18O comparisons
with Arabic, Iranian, or Mediterranean peoples may yield more precise conclusions about the
childhood homelands of the long-distance migrants.
89
REFERENCES
Adamson MW. 2004. Food in medieval times. Westport, Connecticut: Greenwood Press.
Ambrose SH. 1990. Preparation and characterization of bone and tooth collagen for isotopic analysis. Journal of Archaeological Science 17(4):431-451.
Ambrose SH. 1991. Effects of diet, climate and physiology on nitrogen isotope abundances in terrestrial foodwebs. Journal of Archaeological Science 18(3):293-317.
Ambrose SH and DeNiro MJ. 1987. Bone nitrogen isotope composition and climate. Nature 325: 201.
Ambrose SH and Krigbaum J. 2003. Bone chemistry and bioarchaeology. Journal of Anthropological Archaeology 22(3):193-199.
Barrett J, Johnstone C, Harland J, Van Neer W, Ervynck A, Makowiecki D, Heinrich D, Hufthammer AK, Enghoff IB, Amundsen C, Christiansen JS, Jones AKG, Locker A, Hamilton-Dyer S, Jonsson L, Lõugas L, Roberts C, and Richards M. 2008. Detecting the medieval cod trade: A new method and first results. Journal of Archaeological Science 35(4):850-861.
Bayliss A, Popescu EH, Beavan-Athfield N, Ramsey CB, Cook GT, and Locker A. 2004. The potential significance of dietary offsets for the interpretation of radiocarbon dates: An archaeologically significant example from medieval Norwich. Journal of Archaeological Science 31(5):563-579.
Bentley RA. 2006. Strontium isotopes from the earth to the archaeological skeleton: A review. Journal of Archaeological Method and Theory 13(3):135-187.
Berend N, Urbańczyk P, and Wiszewski P. 2013. Central Europe in the high middle ages: Bohemia, Hungary, and Poland, c. 900-c. 1300. NY: Cambridge University Press.
Bigoni L, Krajíček V, Sládek V, Velemínský P, and Velemínská J. 2013. Skull shape asymmetry and the socioeconomic structure of an early medieval Central European society. American Journal of Physical Anthropology 150(3):349-364.
Brettell R, Evans J, Marzinzik S, Lamb A, and Montgomery J. 2012. "Impious Easterners": Can oxygen and strontium isotopes serve as indicators of provenance in early medieval European cemetery populations? European Journal of Archaeology 15(1): 117-145.
Burt NM. 2013. Stable isotope ratio analysis of breastfeeding and weaning practices of children from medieval Fishergate House York, UK. American Journal of Physical Anthropology 152(7):407-416.

90
Busch S, Schwarz U, and Kniep R. 2001. Morphogenesis and structure of human teeth in relation to biomimetically grown fluorapatite-gelatin composites. Chemistry of Materials 13(10):3260-3271.
Chenery C, Müldner G, Evans J, Eckardt H, and Lewis M. 2010. Strontium and stable isotope evidence for diet and mobility in Roman Gloucester, UK. Journal of Archaeological Science 37(1):150-163.
Coplen TB. 1994. Reporting of stable hydrogen, carbon, and oxygen isotopic abundances. Pure and Applied Chemistry 66(2):273-276.
Daux V, Lécuyer C, Héran M, Amiot R, Simon L, Fourel F, Martineau F, Lynnerup N, Reychler H, and Escarguel G. 2008. Oxygen isotope fractionation between human phosphate and water revisited. Journal of Human Evolution 55(6):1138-1147.
DeNiro MJ. 1985. Postmortem preservation and alteration of in vivo bone collagen isotope ratios in relation to paleodietary reconstruction. Nature 317(6040):806-809.
DeNiro MJ. 1987. Stable isotopy and archaeology. American Scientist 75(2):182-191.
Dufour E, Holmden C, Van Neer W, Zazzo A, Patterson WP, Degryse P, and Keppens E. 2007. Oxygen and strontium isotopes as provenance indicators of fish at archaeological sites: The case study of Sagalassos, SW Turkey. Journal of Archaeological Science 34(8):1226-1239.
Dupras TL and Tocheri MW. 2007. Reconstructing infant weaning histories at Roman period Kellis, Egypt using stable isotope analysis of dentition. American Journal of Physical Anthropology 134(1):63-74.
Dupras TL, Schwarcz HP, and Fairgrieve SI. 2001. Infant feeding and weaning practices in Roman Egypt. American Journal of Physical Anthropology 115(3):204-212.
Engel P. 2001. The realm of St. Stephen: A history of medieval Hungary, 895-1526. London: IB Tauris and Co. Ltd.
Esclassan R, Grimoud AM, Ruas MP, Donat R, Sevin A, Astie F, Lucas S, and Crubezy E. 2009. Dental caries, tooth wear, and diet in an adult medieval (12th-14th century) population from Mediterranean France. Archives of Oral Biology 54(3):287-297.
Fóthi E and Bernert Zs. 2014. A solt-tételhegyi Árpád-kori temető antropológiai vizsgálata. In: Somogyvári A, Szentpéteri J, and Székely Gy, editors. Településtörténeti kutatások: Solt-Tételhegy, Kiskunfélegyháza, Amler-bánya. Budapest: MTA Bölcsészettudományi Kutatóközpont. p 135-151.
Fricke HC, O'Neil JR, and Lynnerup N. 1995. Oxygen isotope composition of human tooth enamel from medieval Greenland: Linking climate and society. Geology 23(10):869-872.

91
Fuller BT, Fuller JL, Harris DA, and Hedges REM. 2006. Detection of breastfeeding and weaning in modern human infants with carbon and nitrogen stable isotope ratios. American Journal of Physical Anthropology. 219(2):279-293.
Giblin JI. 2009. Strontium isotope analysis of Neolithic and Copper Age populations on the Great Hungarian Plain. Journal of Archaeological Science 36(2):491-497.
Hakenbeck S, McManus E, Geisler H, Grupe G, and O'Connell T. 2010. Diet and mobility in early medieval Bavaria: A study of carbon and nitrogen stables isotopes. American Journal of Physical Anthropology 143(2):235-249.
Halley DJ and Rosvold J. 2014. Stable isotope analysis and variation in medieval domestic pig husbandry practices in northwest Europe: Absence of evidence for a purely herbivorous diet. Journal of Archaeological Science 49:1-5.
Harrison RG and Katzenberg MA. 2003. Paleodiet studies using stable carbon isotopes from bone apatite and collagen: Examples from Southern Ontario and San Nicholas Island, California. Journal of Anthropological Archaeology 22(3):227-244.
Hedges REM and Reynard LM. 2007. Nitrogen isotopes and the trophic level of humans in archaeology. Journal of Archaeological Science 34(8):1240-1251.
Katzenberg MA. 2008. Stable isotope analysis: A tool for studying past diet, demography, and life history. In: Katzenberg MA, Saunders SR, editors. Biological anthropology of the human skeleton. New York: Wiley-Liss. p 413-441.
Katzenberg MA, Herring DA, and Saunders SR. 1996. Weaning and infant mortality: Evaluating the skeletal evidence. American Journal of Physical Anthropology 101(23):177-199.
Katzenberg MA and Lovell NC. 1999. Stable isotope variation in pathological bone. International Journal of Osteoarchaeology 9(5):316-224.
Kjellström A, Storå J, Possnert G, and Linderholm A. 2009. Dietary patterns and social structures in medieval Sigtuna, Sweden, as reflected in stable isotope values in human skeletal remains. Journal of Archaeological Science 36(12):2689-2699.
Kohn MJ, Schoeninger MJ, and Barker WW. 1999. Altered states: Effects of diagenesis on fossil tooth chemistry. Geochimica et Cosmochimica Acta 63(18):2737-2747.
Larsen CS. 1997. Bioarchaeology: Interpreting behavior from the human skeleton. UK: Cambridge University Press.
Larsen CS. 2002. Bioarchaeology: The lives and lifestyles of past people. Journal of Archaeological Research 10(2):119-166.

92
Lee-Thorpe JA. 2000. Preservation of biogenic carbon isotope signals in Plio-Pleistocene bone and tooth mineral. In: Ambrose SH and Katzenberg MA, editors. Biogeochemical approaches to paleodietary analysis. New York: Kluwer Academic Publishers. p 89-111.
Leicester HM. 1953. The biochemistry of teeth. Annual Review of Biochemistry 22:341-350.
Lightfoot E, Šlaus M, and O'Connell TC. 2012. Changing cultures, changing cuisines: Cultural transitions and dietary change in Iron Age, Roman, and early medieval Croatia. American Journal of Physical Anthropology 148(4):543-556.
Linderholm A and Kjellström A. 2011. Stable isotope analysis of a medieval skeletal sample indicative of systematic disease from Sigtuna, Sweden. Journal of Archaeological Science 38(4):925-933.
Longin R. 1971. New method of collagen extraction for radiocarbon dating. Nature 230:241-242.
Macko SA, Lubec G, Teschler-Nicola M, Andrusevich V, and Engel MH . 1999. The Ice Man's diet as reflected by the stable nitrogen and carbon isotopic composition of his hair. The Federation of American Societies for Experimental Biology Journal 13(3):559-562.
Mays SA. 1997. Carbon stable isotope rations in medieval and later human skeletons from Northern England. Journal of Archaeological Science 24(6):561-567.
Molnár M. 2001. From the beginnings until 1301. In: A concise history of Hungary. Cambridge, UK: Cambridge University Press.
Müldner G and Richards MP. 2005. Fast or feast: Reconstructing diet in later medieval England by stable isotope analysis. Journal of Archaeological Science 32(1):39-48.
Müldner G and Richards MP. 2007. Diet and diversity at later medieval Fishergate: The isotopic evidence. American Journal of Physical Anthropology 134(2):162-174.
Müldner G, Britton K, and Ervynck A. 2014. Inferring animal husbandry strategies in coastal zones through stable isotope analysis: New evidence from the Flemish coastal plain (Belgium, 1st-15th century AD). Journal of Archaeological Science 41:322-332.
Papathanasiou A. 2003. Stable isotope analysis in Neolithic Greece and possible implications on human health. International Journal of Osteoarchaeology 13(5):314-324.
Polet C and Katzenberg MA. 2003. Reconstruction of the diet in a medieval monastic community from the coast of Belgium. Journal of Archaeological Science 30(5):525-533.
Reitsema LJ, Crews DE, and Polcyn M. 2010. Preliminary evidence for medieval Polish diet from carbon and nitrogen stable isotopes. Journal of Archaeological Science 37(7):1413-1423.

93
Reitsema LJ and Vercellotti G. 2012. Stable isotope evidence for sex- and status-based variations in diet and life history at medieval Trino Vercellese, Italy. American Journal of Physical Anthropology 148(4):589-600.
Reitsema LJ, Kozłowski T, and Makowiecki D. 2013. Human-environment interactions in medieval Poland: A perspective from the analysis of faunal stable isotope ratios. Journal of Archaeological Science 40(10):3636-3646.
Reynard LM and Hedges REM. 2008. Stable hydrogen isotopes of bone collagen in paleodietary and paleoenvironmental reconstruction. Journal of Archaeological Science 35(5):1934-1942.
Richards MP and Hedges REM. 1998. Stable isotope analysis reveals variations in human diet at the Poundbury Camp cemetery site. Journal of Archaeological Science 25(12):1247-1252.
Richards MP, Pettitt PB, Trinkaus E, Smith FH, Paunović M, and Karavanić I. 2000. Neanderthal diet at Vindija and Neanderthal predation: The evidence from stable isotopes. Proceedings of the National Academy of Sciences 97(13):7663-7666.
Richards MP, Mays S, and Fuller BT. 2002. Stable carbon and nitrogen isotope values of bone and teeth reflect weaning age at the medieval Wharram Percy site, Yorkshire, UK. American Journal of Physical Anthropology 119(3):205-210.
Richards MP, Fuller BT, and Molleson TI. 2006. Stable isotope paleodietary study of humans and fauna from the multi-period (Iron Age, Viking, and Late Medieval) site of Newark Bay, Orkney. Journal of Archaeological Science 33(1):122-131.
Róna-Tas A. 1999. Hungarians and Europe in the early Middle Ages: An introduction to early Hungarian history. Budapest: Central European University Press.
Salamon M, Coppa A, McCormick M, Rubini M, Vargiu R, and Tuross N. 2008. The consilience of historical and isotopic approaches in reconstructing the medieval Mediterranean diet. Journal of Archaeological Science 35(6):1667-1672.
Schoeninger MJ. 1995. Stable isotope studies in human evolution. Evolutionary Anthropology 4(3):83-98.
Schoeninger MJ and Moore K. 1992. Bone stable isotope studies in archaeology. Journal of World Prehistory 6(2):247-296.
Schutkowski H, Herrmann B, Wiedemann F, Bocherens H, and Grupe G. 1999. Diet, status and decomposition at Weingarten: Trace element and isotope analysis on early medieval skeletal material. Journal of Archaeological Science 26(6):675-685.
Singman JL. 2013. The life cycle. In: The middle ages: Everyday life in medieval Europe. NY: Sterling.

94
Somogyvári A. 2014. Bronzkori telepjelenségek és erődítésnyomok Solt-Tételen. In: Somogyvári A, Szentpéteri J, and Székely Gy, editors. Településtörténeti kutatások: Solt-Tételhegy, Kiskunfélegyháza, Amler-bánya. Budapest: MTA Bölcsészettudományi Kutatóközpont. p 63-84.
Szentpéteri J. 2009. Interdisciplinary investigations at the Solt, Tételhegy site in Bács-Kiskun county. Régészeti Kutatások Magyarországon 53-80.
Szentpéteri J. 2010. The history of Solt-Tételhegy from the prehistoric to modern day: Preliminary results of the Castrum Tetel Program (2007-2009). Múzeumőr 8(1):3-8.
Szentpéteri J. 2014. Semmiből egy régi világot: Kutatások Solt-Tételhegyen (2005-2013). In: Somogyvári A, Szentpéteri J, and Székely Gy, editors. Településtörténeti kutatások: Solt-Tételhegy, Kiskunfélegyháza, Amler-bánya. Budapest: MTA Bölcsészettudományi Kutatóközpont. p 7-22.
Tieszen LL, Boulton TW, Tesdahl KG, and Slade NA. 1983. Fractionation and turnover of stable carbon isotopes in animal tissues: Implications for δ13C analysis of diet. Oecologia 57(1-2):32-37.
Tykot RH. 2006. Isotope analysis and the histories of maize. In: Staller JE, Tykot RH, Benz BF, editors. Histories of maize: Multidisciplinary approaches to the prehistory, linguistics, biogeography, domestication, and evolution of maize. Walnut Creek, CA: Left Coast Press, Inc.
van der Merwe NJ. 1982. Carbon isotope, photosynthesis, and archaeology: Different pathways of photosynthesis cause characteristic changes in carbon isotope ratios that make possible the study of prehistoric human diets. American Scientist 70(6):596-606.
van Klinken GJ. 1999. Bone collagen quality indicators for paleodietary and radiocarbon measurements. Journal of Archaeological Science 26(6):687-695.
van Klinken GJ, Richards MP, and Hedges REM. 2000. An overview of causes for stable isotope variations in past European human populations: Environmental, ecophysiological, and cultural effects. In: Ambrose SH and Katzenberg MA, editors. Biogeochemical approaches to paleodietary analysis. New York: Kluwer Academic/Plenum Publishers. p 39-63.
White CD and Schwarcz HP. 1989. Ancient Maya diet: As inferred from isotopic and elemental analysis of human bone. Journal of Archaeological Science 16(5):451-474.
Wilson AS, Taylor T, Ceruti MC, Chavez JA, Reinhard J, Grimes V, Meier-Augenstein W, Cartmell H, Stern B, Richards MP, Worobey M, Barnes I, and Gilbert MTP. 2007. Stable isotope and DNA evidence for ritual sequences in Inca child sacrifice. Proceedings of the National Academy of Sciences 104(42):16456-16461.

95
Yoder C. 2010. Diet in medieval Denmark: A regional and temporal comparison. Journal of Archaeological Science 37(9):2224-2236.
Yoder C. 2012. Let them eat cake? Status-based differences in diet in medieval Denmark. Journal of Archaeological Science 39(4):1183-1193.