childfund international, usa...kpmg llp suite 2000 1021 east cary street richmond, va 23219-4023...
TRANSCRIPT
CHILDFUND INTERNATIONAL, USA
Consolidated Financial Statements
June 30, 2016
(With Independent Auditors’ Report Thereon)

CHILDFUND INTERNATIONAL, USA
Table of Contents
Page
Independent Auditors’ Report 1
Consolidated Financial Statements:
Consolidated Statement of Financial Position – June 30, 2016 3
Consolidated Statement of Activities – Year ended June 30, 2016 4
Consolidated Statement of Cash Flows – Year ended June 30, 2016 5
Consolidated Statement of Functional Expenses – Year ended June 30, 2016 6
Notes to Consolidated Financial Statements 7
KPMG LLPSuite 20001021 East Cary StreetRichmond, VA 23219-4023
KPMG LLP is a Delaware limited liability partnership, the U.S. member firm of KPMG International Cooperative (“KPMG International”), a Swiss entity.
Independent Auditors’ Report
The Board of Directors
ChildFund International, USA:
We have audited the accompanying consolidated financial statements of ChildFund International, USA,
(ChildFund), which comprise the consolidated statement of financial position as of June 30, 2016, and the
related consolidated statements of activities, cash flows, and functional expenses for the year then ended,
and the related notes to the consolidated financial statements.
Management’s Responsibility for the Financial Statements
Management is responsible for the preparation and fair presentation of these consolidated financial
statements in accordance with U.S. generally accepted accounting principles; this includes the design,
implementation, and maintenance of internal control relevant to the preparation and fair presentation of
consolidated financial statements that are free from material misstatement, whether due to fraud or error.
Auditors’ Responsibility
Our responsibility is to express an opinion on these consolidated financial statements based on our audit. We
conducted our audit in accordance with auditing standards generally accepted in the United States of
America. Those standards require that we plan and perform the audit to obtain reasonable assurance about
whether the consolidated financial statements are free from material misstatement.
An audit involves performing procedures to obtain audit evidence about the amounts and disclosures in the
consolidated financial statements. The procedures selected depend on the auditors’ judgment, including the
assessment of the risks of material misstatement of the consolidated financial statements, whether due to
fraud or error. In making those risk assessments, the auditor considers internal control relevant to the
organization’s preparation and fair presentation of the consolidated financial statements in order to design
audit procedures that are appropriate in the circumstances, but not for the purpose of expressing an opinion
on the effectiveness of the organization’s internal control. Accordingly, we express no such opinion. An
audit also includes evaluating the appropriateness of accounting policies used and the reasonableness of
significant accounting estimates made by management, as well as evaluating the overall presentation of the
consolidated financial statements.
We believe that the audit evidence we have obtained is sufficient and appropriate to provide a basis for our
audit opinion.
Opinion
In our opinion, the consolidated financial statements referred to above present fairly, in all material respects,
the consolidated financial position of ChildFund as of June 30, 2016, and the changes in their net assets, their
cash flows, and their functional expenses for the year then ended in accordance with U.S. generally accepted
accounting principles.

CHILD
2
Report on Summarized Comparative Information
We have previously audited ChildFund International, USA’s 2015 consolidated financial statements, and we
expressed an unmodified audit opinion on those audited consolidated financial statements in our report dated
November 18, 2015. In our opinion, the summarized comparative information presented herein as of and
for the year ended June 30, 2015 is consistent, in all material respects, with the audited consolidated financial
statements from which it has been derived.
November 22, 2016
3
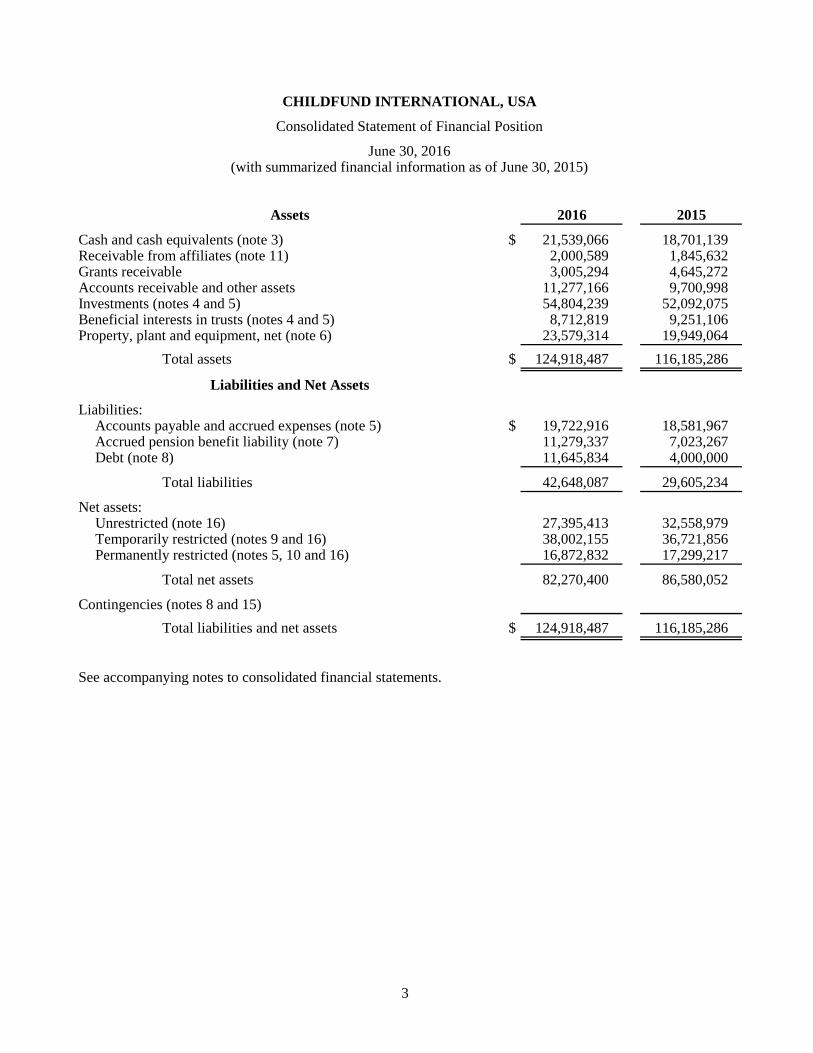
CHILDFUND INTERNATIONAL, USA
Consolidated Statement of Financial Position
June 30, 2016(with summarized financial information as of June 30, 2015)
Assets 2016 2015
Cash and cash equivalents (note 3) $ 21,539,066 18,701,139 Receivable from affiliates (note 11) 2,000,589 1,845,632 Grants receivable 3,005,294 4,645,272 Accounts receivable and other assets 11,277,166 9,700,998 Investments (notes 4 and 5) 54,804,239 52,092,075 Beneficial interests in trusts (notes 4 and 5) 8,712,819 9,251,106 Property, plant and equipment, net (note 6) 23,579,314 19,949,064
Total assets $ 124,918,487 116,185,286
Liabilities and Net Assets
Liabilities:Accounts payable and accrued expenses (note 5) $ 19,722,916 18,581,967 Accrued pension benefit liability (note 7) 11,279,337 7,023,267 Debt (note 8) 11,645,834 4,000,000
Total liabilities 42,648,087 29,605,234
Net assets:Unrestricted (note 16) 27,395,413 32,558,979 Temporarily restricted (notes 9 and 16) 38,002,155 36,721,856 Permanently restricted (notes 5, 10 and 16) 16,872,832 17,299,217
Total net assets 82,270,400 86,580,052
Contingencies (notes 8 and 15)Total liabilities and net assets $ 124,918,487 116,185,286
See accompanying notes to consolidated financial statements.
4
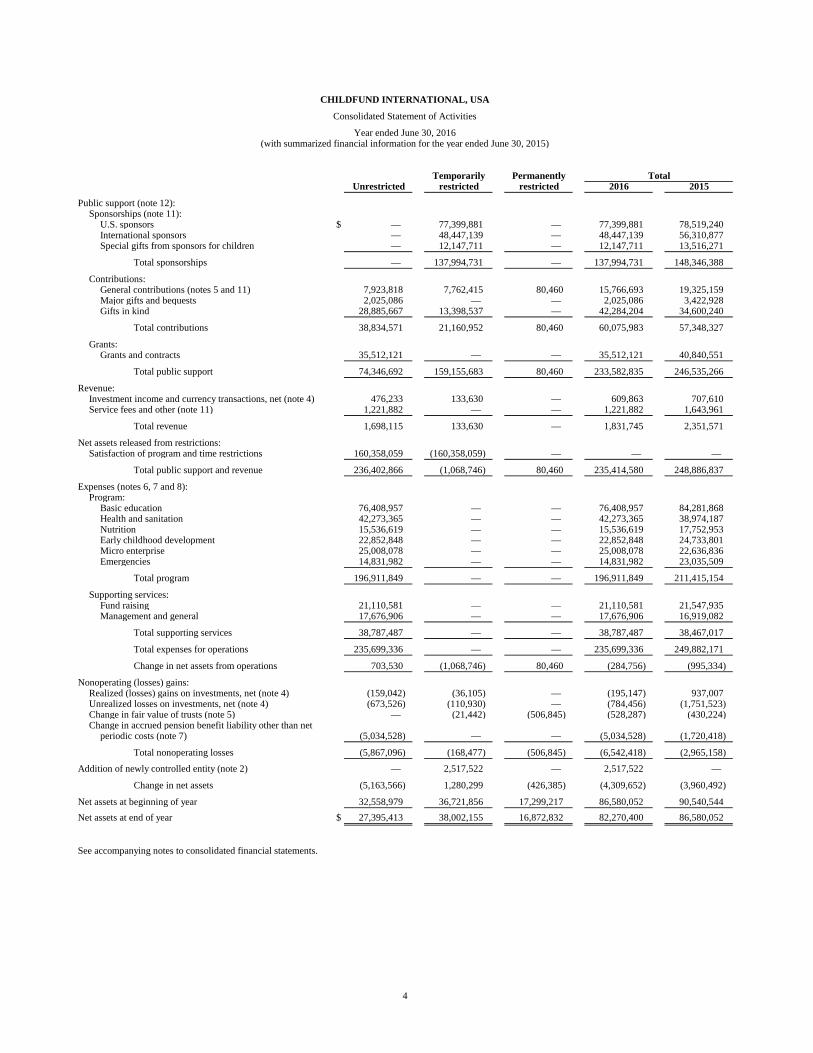
CHILDFUND INTERNATIONAL, USA
Consolidated Statement of Activities
Year ended June 30, 2016(with summarized financial information for the year ended June 30, 2015)
Temporarily Permanently TotalUnrestricted restricted restricted 2016 2015
Public support (note 12):Sponsorships (note 11):
U.S. sponsors $ — 77,399,881 — 77,399,881 78,519,240 International sponsors — 48,447,139 — 48,447,139 56,310,877 Special gifts from sponsors for children — 12,147,711 — 12,147,711 13,516,271
Total sponsorships — 137,994,731 — 137,994,731 148,346,388
Contributions:General contributions (notes 5 and 11) 7,923,818 7,762,415 80,460 15,766,693 19,325,159 Major gifts and bequests 2,025,086 — — 2,025,086 3,422,928 Gifts in kind 28,885,667 13,398,537 — 42,284,204 34,600,240
Total contributions 38,834,571 21,160,952 80,460 60,075,983 57,348,327
Grants:Grants and contracts 35,512,121 — — 35,512,121 40,840,551
Total public support 74,346,692 159,155,683 80,460 233,582,835 246,535,266
Revenue:Investment income and currency transactions, net (note 4) 476,233 133,630 — 609,863 707,610 Service fees and other (note 11) 1,221,882 — — 1,221,882 1,643,961
Total revenue 1,698,115 133,630 — 1,831,745 2,351,571
Net assets released from restrictions:Satisfaction of program and time restrictions 160,358,059 (160,358,059) — — —
Total public support and revenue 236,402,866 (1,068,746) 80,460 235,414,580 248,886,837
Expenses (notes 6, 7 and 8):Program:
Basic education 76,408,957 — — 76,408,957 84,281,868 Health and sanitation 42,273,365 — — 42,273,365 38,974,187 Nutrition 15,536,619 — — 15,536,619 17,752,953 Early childhood development 22,852,848 — — 22,852,848 24,733,801 Micro enterprise 25,008,078 — — 25,008,078 22,636,836 Emergencies 14,831,982 — — 14,831,982 23,035,509
Total program 196,911,849 — — 196,911,849 211,415,154
Supporting services:Fund raising 21,110,581 — — 21,110,581 21,547,935 Management and general 17,676,906 — — 17,676,906 16,919,082
Total supporting services 38,787,487 — — 38,787,487 38,467,017
Total expenses for operations 235,699,336 — — 235,699,336 249,882,171
Change in net assets from operations 703,530 (1,068,746) 80,460 (284,756) (995,334)
Nonoperating (losses) gains:Realized (losses) gains on investments, net (note 4) (159,042) (36,105) — (195,147) 937,007 Unrealized losses on investments, net (note 4) (673,526) (110,930) — (784,456) (1,751,523) Change in fair value of trusts (note 5) — (21,442) (506,845) (528,287) (430,224) Change in accrued pension benefit liability other than net
periodic costs (note 7) (5,034,528) — — (5,034,528) (1,720,418)
Total nonoperating losses (5,867,096) (168,477) (506,845) (6,542,418) (2,965,158)
Addition of newly controlled entity (note 2) — 2,517,522 — 2,517,522 —
Change in net assets (5,163,566) 1,280,299 (426,385) (4,309,652) (3,960,492)
Net assets at beginning of year 32,558,979 36,721,856 17,299,217 86,580,052 90,540,544 Net assets at end of year $ 27,395,413 38,002,155 16,872,832 82,270,400 86,580,052
See accompanying notes to consolidated financial statements.
5
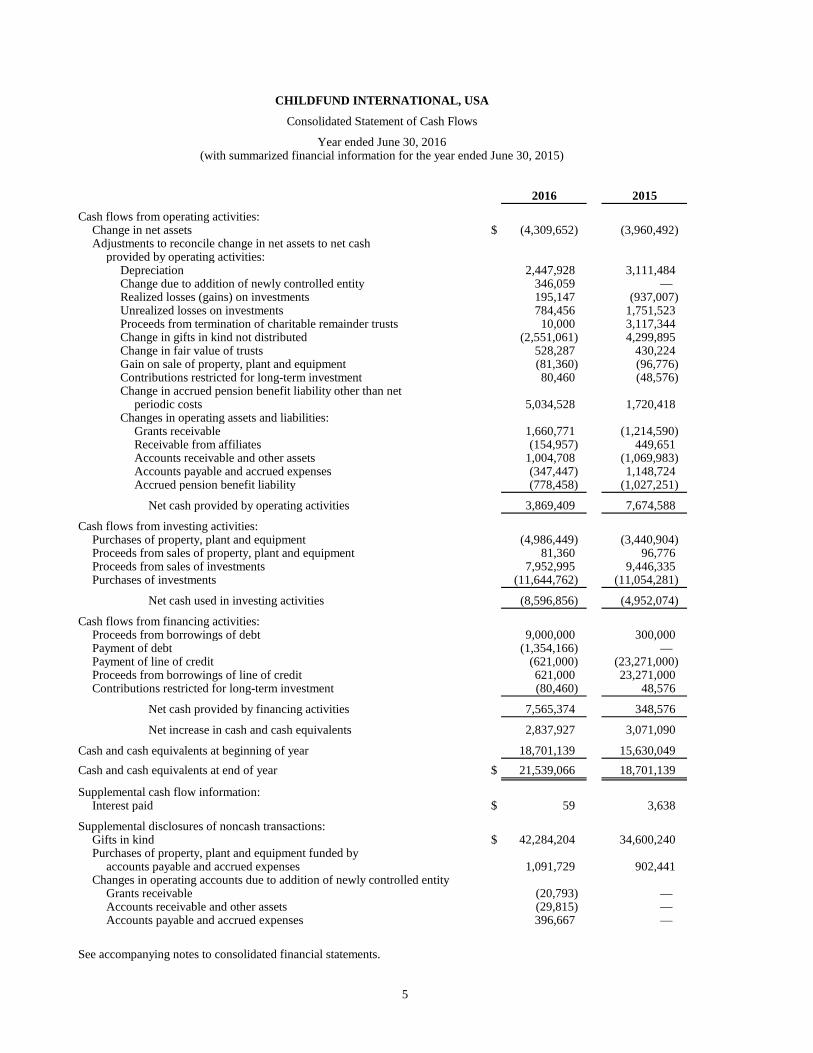
CHILDFUND INTERNATIONAL, USA
Consolidated Statement of Cash Flows
Year ended June 30, 2016(with summarized financial information for the year ended June 30, 2015)
2016 2015
Cash flows from operating activities:Change in net assets $ (4,309,652) (3,960,492) Adjustments to reconcile change in net assets to net cash
provided by operating activities:Depreciation 2,447,928 3,111,484 Change due to addition of newly controlled entity 346,059 — Realized losses (gains) on investments 195,147 (937,007) Unrealized losses on investments 784,456 1,751,523 Proceeds from termination of charitable remainder trusts 10,000 3,117,344 Change in gifts in kind not distributed (2,551,061) 4,299,895 Change in fair value of trusts 528,287 430,224 Gain on sale of property, plant and equipment (81,360) (96,776) Contributions restricted for long-term investment 80,460 (48,576) Change in accrued pension benefit liability other than net
periodic costs 5,034,528 1,720,418 Changes in operating assets and liabilities:
Grants receivable 1,660,771 (1,214,590) Receivable from affiliates (154,957) 449,651 Accounts receivable and other assets 1,004,708 (1,069,983) Accounts payable and accrued expenses (347,447) 1,148,724 Accrued pension benefit liability (778,458) (1,027,251)
Net cash provided by operating activities 3,869,409 7,674,588
Cash flows from investing activities:Purchases of property, plant and equipment (4,986,449) (3,440,904) Proceeds from sales of property, plant and equipment 81,360 96,776 Proceeds from sales of investments 7,952,995 9,446,335 Purchases of investments (11,644,762) (11,054,281)
Net cash used in investing activities (8,596,856) (4,952,074)
Cash flows from financing activities:Proceeds from borrowings of debt 9,000,000 300,000 Payment of debt (1,354,166) — Payment of line of credit (621,000) (23,271,000) Proceeds from borrowings of line of credit 621,000 23,271,000 Contributions restricted for long-term investment (80,460) 48,576
Net cash provided by financing activities 7,565,374 348,576
Net increase in cash and cash equivalents 2,837,927 3,071,090
Cash and cash equivalents at beginning of year 18,701,139 15,630,049 Cash and cash equivalents at end of year $ 21,539,066 18,701,139
Supplemental cash flow information:Interest paid $ 59 3,638
Supplemental disclosures of noncash transactions:Gifts in kind $ 42,284,204 34,600,240 Purchases of property, plant and equipment funded by
accounts payable and accrued expenses 1,091,729 902,441 Changes in operating accounts due to addition of newly controlled entity
Grants receivable (20,793) — Accounts receivable and other assets (29,815) — Accounts payable and accrued expenses 396,667 —
See accompanying notes to consolidated financial statements.
6
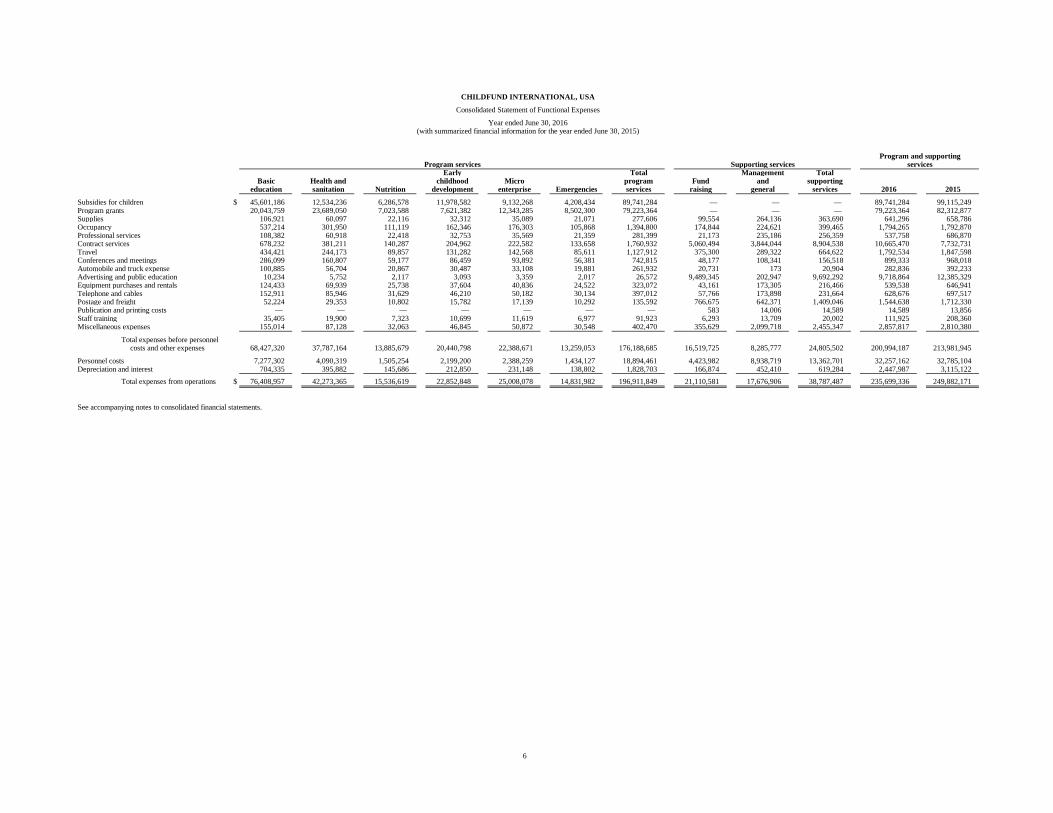
CHILDFUND INTERNATIONAL, USA
Consolidated Statement of Functional Expenses
Year ended June 30, 2016(with summarized financial information for the year ended June 30, 2015)
Program and supportingProgram services Supporting services services
Early Total Management TotalBasic Health and childhood Micro program Fund and supporting
education sanitation Nutrition development enterprise Emergencies services raising general services 2016 2015
Subsidies for children $ 45,601,186 12,534,236 6,286,578 11,978,582 9,132,268 4,208,434 89,741,284 — — — 89,741,284 99,115,249 Program grants 20,043,759 23,689,050 7,023,588 7,621,382 12,343,285 8,502,300 79,223,364 — — — 79,223,364 82,312,877 Supplies 106,921 60,097 22,116 32,312 35,089 21,071 277,606 99,554 264,136 363,690 641,296 658,786 Occupancy 537,214 301,950 111,119 162,346 176,303 105,868 1,394,800 174,844 224,621 399,465 1,794,265 1,792,870 Professional services 108,382 60,918 22,418 32,753 35,569 21,359 281,399 21,173 235,186 256,359 537,758 686,870 Contract services 678,232 381,211 140,287 204,962 222,582 133,658 1,760,932 5,060,494 3,844,044 8,904,538 10,665,470 7,732,731 Travel 434,421 244,173 89,857 131,282 142,568 85,611 1,127,912 375,300 289,322 664,622 1,792,534 1,847,598 Conferences and meetings 286,099 160,807 59,177 86,459 93,892 56,381 742,815 48,177 108,341 156,518 899,333 968,018 Automobile and truck expense 100,885 56,704 20,867 30,487 33,108 19,881 261,932 20,731 173 20,904 282,836 392,233 Advertising and public education 10,234 5,752 2,117 3,093 3,359 2,017 26,572 9,489,345 202,947 9,692,292 9,718,864 12,385,329 Equipment purchases and rentals 124,433 69,939 25,738 37,604 40,836 24,522 323,072 43,161 173,305 216,466 539,538 646,941 Telephone and cables 152,911 85,946 31,629 46,210 50,182 30,134 397,012 57,766 173,898 231,664 628,676 697,517 Postage and freight 52,224 29,353 10,802 15,782 17,139 10,292 135,592 766,675 642,371 1,409,046 1,544,638 1,712,330 Publication and printing costs — — — — — — — 583 14,006 14,589 14,589 13,856 Staff training 35,405 19,900 7,323 10,699 11,619 6,977 91,923 6,293 13,709 20,002 111,925 208,360 Miscellaneous expenses 155,014 87,128 32,063 46,845 50,872 30,548 402,470 355,629 2,099,718 2,455,347 2,857,817 2,810,380
Total expenses before personnelcosts and other expenses 68,427,320 37,787,164 13,885,679 20,440,798 22,388,671 13,259,053 176,188,685 16,519,725 8,285,777 24,805,502 200,994,187 213,981,945
Personnel costs 7,277,302 4,090,319 1,505,254 2,199,200 2,388,259 1,434,127 18,894,461 4,423,982 8,938,719 13,362,701 32,257,162 32,785,104 Depreciation and interest 704,335 395,882 145,686 212,850 231,148 138,802 1,828,703 166,874 452,410 619,284 2,447,987 3,115,122
Total expenses from operations $ 76,408,957 42,273,365 15,536,619 22,852,848 25,008,078 14,831,982 196,911,849 21,110,581 17,676,906 38,787,487 235,699,336 249,882,171
See accompanying notes to consolidated financial statements.

CHILDFUND INTERNATIONAL, USA
Notes to Consolidated Financial Statements
June 30, 2016
(with summarized financial information for June 30, 2015)
7 (Continued)
(1) Organization
ChildFund International, USA (ChildFund), formerly known as Christian Children’s Fund, Inc. was
established in 1938 and has developed into an international, nonsectarian, not-for-profit child development
organization. ChildFund assists children and family members in 27 countries worldwide. There are
approximately 536,000 enrolled children in ChildFund’s programs. Of these children, approximately
458,000 are sponsored children who are supported through monthly contributions.
Most of the sponsorships – more than 232,000 – are supported by U.S. donors; the remainder are supported
by in-country fundraising offices and international donors who sponsor children through members of
ChildFund Alliance in Australia, Canada, Denmark, France, Germany, Ireland, Japan, Korea, New Zealand,
Sweden, and Taiwan. ChildFund is a member of ChildFund Alliance, a global network of 11 child
development organizations.
ChildFund is incorporated and headquartered in the Commonwealth of Virginia.
(2) Summary of Significant Accounting Policies
ChildFund’s accounting policies are summarized as follows:
(a) Basis of Accounting
The accompanying consolidated financial statements have been prepared using the accrual method of
accounting in accordance with U.S. generally accepted accounting principles.
Balances and transactions are presented according to the existence or absence of donor-imposed
restrictions. This has been accomplished by recording transactions into the following classes of net
assets:
Unrestricted net assets – Net assets resulting from public support and revenue not subject to
donor-imposed restrictions.
Temporarily restricted net assets – Net assets resulting from public support and revenue whose
use by ChildFund is limited by donor-imposed restrictions that either expire by passage of time
or can be fulfilled and removed by actions of ChildFund pursuant to those donor-imposed
restrictions.
Permanently restricted net assets – Net assets that generally represent contributions and other
inflows of assets whose use by ChildFund is permanently limited by donor-imposed restrictions
that neither expire by passage of time nor can be fulfilled or otherwise removed by actions of
ChildFund.
CHILDFUND INTERNATIONAL, USA
Notes to Consolidated Financial Statements
June 30, 2016
(with summarized financial information for June 30, 2015)
8 (Continued)
Public support and revenue are reported as increases in unrestricted net assets unless the use of the
related assets is limited by donor-imposed restrictions. Sponsorship revenue is classified as
temporarily restricted. Expirations of temporary restrictions on net assets (i.e., the donor-stipulated
purpose has been fulfilled and/or the stipulated time period has elapsed) are reported as
reclassifications from temporarily restricted net assets to unrestricted net assets and reported in the
statement of activities as net assets released from restrictions. Expenses are reported as decreases in
unrestricted net assets. Gains and losses on investments are reported as increases or decreases in
unrestricted net assets unless donors or state law restrict their use.
(b) Principles of Consolidation
The accompanying consolidated financial statements include the accounts and operations of the
ChildFund international office, national offices, and fundraising offices. All significant transactions
between the organizations, including all inter-organization balances, have been eliminated in
consolidation. In compliance with local laws, certain of these national offices and fund raising offices
are separate legal entities.
ChildFund established the India Society (the Society) in 1984. The Society is registered under the
Societies Registration Act of 1860 and exists under the laws of India. In December 2015, the Society’s
governing body took action which gave ChildFund majority voting power of the governing body and
therefore, ChildFund began consolidating the Society. The financial impact of the consolidation
resulted in approximately $2,900,000 in cash, $51,000 in receivables, $397,000 in payables, and
$2,517,000 temporarily restricted net assets being recorded by ChildFund.
(c) Use of Estimates
The preparation of the consolidated financial statements, in conformity with U.S. generally accepted
accounting principles, requires management to make estimates and assumptions that affect the reported
amounts of assets and liabilities and disclosure of contingent assets and liabilities at the date of the
consolidated financial statements, and the reported amounts of revenue and expenses during the
reporting period. Actual results could differ from those estimates. Significant accounting estimates and
management judgments reflected in the consolidated financial statements include valuation of
investments measured at net asset value (NAV) and beneficial interests in trusts and accrued pension
benefit liability.
(d) Investments and Beneficial Interests in Trusts and Fair Value Measurements
Financial Accounting Standards Board (FASB) Accounting Standards Codification (ASC) 820-10-65,
Fair Value Measurements and Disclosures, established a fair value hierarchy that prioritizes the inputs
to valuation techniques used to measure fair value. The hierarchy gives the highest priority to
unadjusted quoted prices in active markets for identical assets or liabilities (Level 1 measurements)
and the lowest priority to measurements involving significant unobservable inputs (Level 3
measurements). The three levels of the fair value hierarchy are as follows:
Level 1 inputs are quoted prices (unadjusted) in active markets for identical assets or liabilities
that ChildFund has the ability to access at the measurement date.
CHILDFUND INTERNATIONAL, USA
Notes to Consolidated Financial Statements
June 30, 2016
(with summarized financial information for June 30, 2015)
9 (Continued)
Level 2 inputs are inputs other than quoted prices included within Level 1 that are observable
for the asset or liability, either directly or indirectly.
Level 3 inputs are unobservable inputs for the asset or liability.
If the inputs used to measure the asset or liability fall within different levels of the hierarchy, the
classification is based on the lowest level input that is significant to the fair value measurement of the
asset or liability.
Investments in readily marketable equity securities and all debt securities are recorded at fair value,
which are based on quoted market prices, where available. Due to variations in trading volumes and
the lack of quoted market prices for some fixed maturities, the fair value of fixed maturities is normally
derived through recent reported trades for identical or similar securities, making adjustments through
the reporting date based upon available market observable data. If there are no recent reported trades,
the fair value of fixed maturities may be derived through the use of matrix pricing or model processes,
where the future cash flow expectations are developed based upon performance and discounted at an
estimated market rate.
For investments measured at NAV, fair value is based on NAV reported by underlying investment
managers and reviewed by ChildFund after considering various sources of information. These values
are further evaluated by doing internal reviews on the current fair values of the securities within these
investments. The NAV is utilized as a practical expedient for fair value. The estimates of fair values,
because of the inherent uncertainty of valuation of these estimates, may differ from the values that
would have been used had a ready market existed.
Except for investments where donors specifically provide otherwise, investments are maintained in a
pooled account. Additions to investments are assigned units of participation in the pooled account
based upon their fair value on the date they enter the pooled account and the most recently determined
unit fair value for the existing units of participation. Withdrawals are based upon the most recently
determined fair value of the respective units of participation that include both realized and unrealized
net gains and losses. The market value of the units of participation is calculated monthly.
The fair value of beneficial interests in perpetual and charitable remainder trusts is estimated by
applying ChildFund’s share of the earnings of the trust times the fair value of the underlying assets in
the trusts as of the reporting date.
Investments and beneficial interests in perpetual trusts are exposed to several risks, such as interest
rate, currency, market and credit risks. Due to the level of risk associated with certain investments and
beneficial interests in trusts, it is at least reasonably possible that changes in the values of investments
and beneficial interests in trusts will occur in the near term and that such changes could materially
affect the amounts reported in ChildFund’s consolidated financial statements.
Investment transactions are recorded on a trade date basis. Dividends are recorded on the ex-dividend
date and interest is recognized on the accrual basis. Realized gains and losses are determined by
specific identification. Realized and unrealized gains and losses and change in fair value of trusts are
recorded in the nonoperating revenues section of the consolidated statement of activities. Fees paid to

CHILDFUND INTERNATIONAL, USA
Notes to Consolidated Financial Statements
June 30, 2016
(with summarized financial information for June 30, 2015)
10 (Continued)
custodian and investment managers are recorded on the accrual basis and are netted against investment
income and currency transactions on the consolidated statement of activities.
(e) Financial Instruments and Credit Risk
Financial instruments, which potentially subject ChildFund to concentrations of credit risk, consist
principally of cash and cash equivalents and investments. ChildFund invests its cash and investments
with high-quality financial institutions and limits the amount of credit exposure to any one financial
institution. ChildFund’s cash balances include aggregate bank balances on deposit both inside the
United States and with international banks outside the United States. These balances can exceed FDIC
limits or in the case of international accounts, not be covered under the FDIC. ChildFund has not
experienced any losses in such accounts and believes it is not exposed to any significant credit risk on
its cash and cash equivalents. In some cases, ChildFund has opened segregated cash accounts to meet
restrictions placed on those funds by the donor. In general, these are grant funded accounts.
Credit risk with respect to investments is generally limited, because by ChildFund’s policy the
investments are kept within limits designed to prevent risks caused by concentration.
(f) Accounts Receivable and Other Assets
Accounts receivable and other assets consist of general receivables, pledges receivable, advances,
prepaid expenses and undistributed gifts-in-kind.
(g) Property, Plant and Equipment
Land is carried at cost or fair value at the date of donation in the case of gifts. Buildings, furniture,
fixtures and equipment, and data processing are carried at cost or fair value at the date of donation in
the case of gifts, less accumulated depreciation. Depreciation of buildings and equipment is recorded
on a straight-line basis over the estimated useful lives of the assets (5 to 40 years for buildings and
improvements, 3 to 10 years for furniture, fixtures, and equipment, and 3 to 10 years for data
processing). Upon retirement and disposition, the cost and accumulated depreciation of buildings,
furniture, fixtures, and equipment, and data processing are removed from the accounts with any gain
or loss reflected in the consolidated statement of activities. Maintenance and repair costs are expensed
as incurred.
CHILDFUND INTERNATIONAL, USA
Notes to Consolidated Financial Statements
June 30, 2016
(with summarized financial information for June 30, 2015)
11 (Continued)
(h) Revenue Recognition
Revenue is recognized during the period it is earned. Donated or contributed property, plant and
equipment, investments, services and gifts-in-kind are recorded at fair value when received. The
majority of gifts-in-kind consists of TOM shoes and public service announcements. The fair value of
gifts-in-kind are recorded using an exit value approach. ChildFund received approximately $8,290,700
and $12,504,600 of gifts-in-kind shoes during the years ended June 30, 2016 and 2015, respectively.
Approximately $5,209,000 and $3,721,000 of gifts-in-kind shoes yet to be distributed was included in
accounts receivable and other assets at June 30, 2016 and 2015, respectively. ChildFund received
approximately $27,998,200 and $17,840,900 of in-kind media and broadcast time in the form of public
service announcements during the years ended June 30, 2016 and 2015, respectively. The public
service announcements, which have been featured in major magazines, airports, high traffic malls and
shopping centers, were designed to educate the public about the challenges faced in ChildFund’s
program communities. ChildFund uses a third party purchasing agency to secure its public service
announcements from media outlets as well as to estimate their fair value under an exit value approach,
using billing rates normally charged to other customers under similar circumstances.
Government grant revenue is recognized as earned, which is generally when costs are incurred.
Sponsorship revenues are unconditional transfers of cash recognized during the period received. Since
these contributions are made without any promise to give in future periods, there are no sponsorships
receivable recorded in the consolidated statement of financial position.
(i) Expenses
Expenses are recognized during the period in which they are incurred. Expenses paid in advance
primarily include insurance, advertising, postage and software maintenance and are deferred to the
applicable period. The cost of providing various programs and supporting services have been
summarized on a functional basis in the consolidated statement of activities.
(j) Definition of Operations
Operating activities exclude realized and unrealized gains and losses on investments, change in fair
value of trusts, and change in accrued pension benefit liability other than net periodic costs.
(k) Foreign Currency Translation
All cash balances in foreign banks have been translated at foreign exchange rates in effect as of
year-end. No other assets or liabilities of ChildFund are subject to foreign currency translation. All
foreign office revenue and expense amounts are converted at the rate of exchange in effect at
approximately the date of the transaction.
CHILDFUND INTERNATIONAL, USA
Notes to Consolidated Financial Statements
June 30, 2016
(with summarized financial information for June 30, 2015)
12 (Continued)
(l) Summarized Comparative Information
The consolidated financial statements include certain prior year summarized comparative information
in total but not by net asset class. Such information does not include sufficient detail to constitute a
presentation in conformity with accounting principles generally accepted in the United States.
Accordingly, such information should be read in conjunction with ChildFund’s consolidated financial
statements for the year ended June 30, 2015, from which the summarized information was derived.
(3) Cash and Cash Equivalents
ChildFund considers all short-term deposits with an original maturity of three months or less to be cash
equivalents. Cash in excess of current operating and program requirements was invested throughout the year
on a short-term basis in various money market instruments. Cash equivalents were approximately $6,177,000
and $5,061,000 as of June 30, 2016 and 2015, respectively.
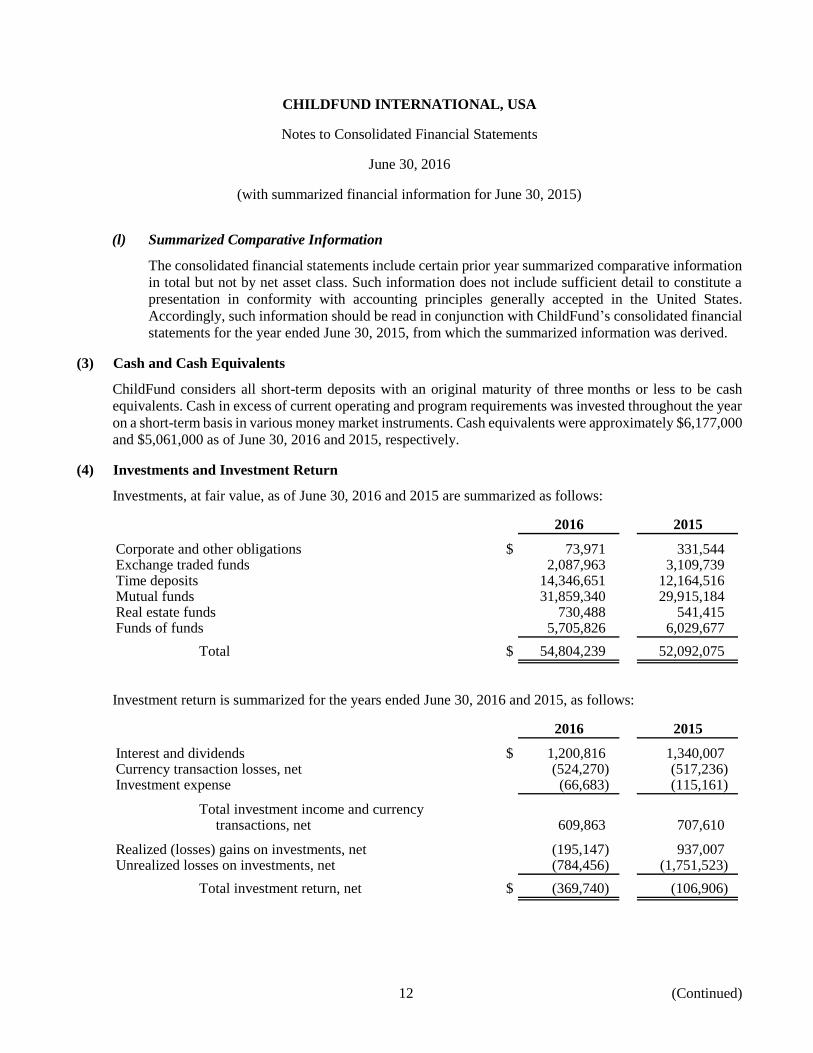
(4) Investments and Investment Return
Investments, at fair value, as of June 30, 2016 and 2015 are summarized as follows:
2016 2015
Corporate and other obligations $ 73,971 331,544 Exchange traded funds 2,087,963 3,109,739 Time deposits 14,346,651 12,164,516 Mutual funds 31,859,340 29,915,184 Real estate funds 730,488 541,415 Funds of funds 5,705,826 6,029,677
Total $ 54,804,239 52,092,075
Investment return is summarized for the years ended June 30, 2016 and 2015, as follows:
2016 2015
Interest and dividends $ 1,200,816 1,340,007 Currency transaction losses, net (524,270) (517,236) Investment expense (66,683) (115,161)
Total investment income and currencytransactions, net 609,863 707,610
Realized (losses) gains on investments, net (195,147) 937,007 Unrealized losses on investments, net (784,456) (1,751,523)
Total investment return, net $ (369,740) (106,906)
CHILDFUND INTERNATIONAL, USA
Notes to Consolidated Financial Statements
June 30, 2016
(with summarized financial information for June 30, 2015)
13 (Continued)
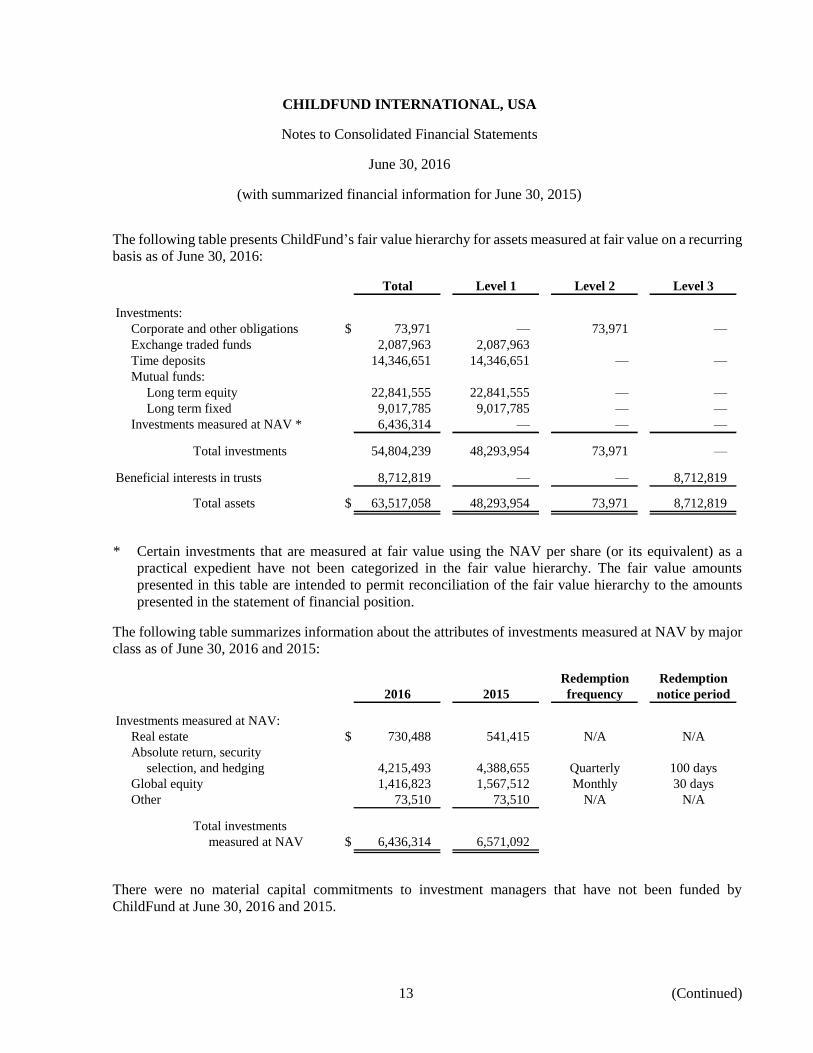
The following table presents ChildFund’s fair value hierarchy for assets measured at fair value on a recurring
basis as of June 30, 2016:
Total Level 1 Level 2 Level 3
Investments:
Corporate and other obligations $ 73,971 — 73,971 —
Exchange traded funds 2,087,963 2,087,963
Time deposits 14,346,651 14,346,651 — —
Mutual funds:
Long term equity 22,841,555 22,841,555 — —
Long term fixed 9,017,785 9,017,785 — —
Investments measured at NAV * 6,436,314 — — —
Total investments 54,804,239 48,293,954 73,971 —
Beneficial interests in trusts 8,712,819 — — 8,712,819
Total assets $ 63,517,058 48,293,954 73,971 8,712,819
* Certain investments that are measured at fair value using the NAV per share (or its equivalent) as a
practical expedient have not been categorized in the fair value hierarchy. The fair value amounts
presented in this table are intended to permit reconciliation of the fair value hierarchy to the amounts
presented in the statement of financial position.
The following table summarizes information about the attributes of investments measured at NAV by major
class as of June 30, 2016 and 2015:
Redemption Redemption
2016 2015 frequency notice period
Investments measured at NAV:
Real estate $ 730,488 541,415 N/A N/A
Absolute return, security
selection, and hedging 4,215,493 4,388,655 Quarterly 100 days
Global equity 1,416,823 1,567,512 Monthly 30 days
Other 73,510 73,510 N/A N/A
Total investments
measured at NAV $ 6,436,314 6,571,092
There were no material capital commitments to investment managers that have not been funded by
ChildFund at June 30, 2016 and 2015.

CHILDFUND INTERNATIONAL, USA
Notes to Consolidated Financial Statements
June 30, 2016
(with summarized financial information for June 30, 2015)
14 (Continued)
The following table presents ChildFund’s fair value hierarchy for assets measured at fair value on a recurring
basis as of June 30, 2015:
Total Level 1 Level 2 Level 3
Investments:
Corporate and other obligations $ 331,544 — 331,544 —
Exchange traded funds 3,109,739 3,109,739 — —
Time deposits 12,164,516 12,164,516 — —
Mutual funds:
Long term equity 20,200,035 20,200,035 — —
Long term fixed 8,570,855 8,570,855 — —
International multi-asset 1,144,294 1,144,294 — —
Investments measured at NAV * 6,571,092 — — —
Total investments 52,092,075 45,189,439 331,544 —
Beneficial interests in trusts 9,251,106 — — 9,251,106
Total assets $ 61,343,181 45,189,439 331,544 9,251,106
* Certain investments that are measured at fair value using the NAV per share (or its equivalent) as a
practical expedient have not been categorized in the fair value hierarchy. The fair value amounts
presented in this table are intended to permit reconciliation of the fair value hierarchy to the amounts
presented in the statement of financial position.
The following table summarizes changes in Level 3 beneficial interests in trusts measured at fair value on a
recurring basis for the periods ended June 30, 2016 and 2015:
2016 2015
Beginning balance $ 9,251,106 12,798,674 Proceeds from terminated charitable remainder trusts (10,000) (3,117,344) Change in fair value of beneficial in trusts (528,287) (430,224)
Ending balance $ 8,712,819 9,251,106
There were no significant transfers of investments between levels in the fair value hierarchy during the years
ended June 30, 2016 and 2015. There were no assets or liabilities measured at fair value on a nonrecurring
basis as of June 30, 2016 and 2015.
CHILDFUND INTERNATIONAL, USA
Notes to Consolidated Financial Statements
June 30, 2016
(with summarized financial information for June 30, 2015)
15 (Continued)
(5) Split Interest Agreements
(a) Charitable Gift Annuities
Total investments include amounts invested for ChildFund’s charitable gift annuity program. These
amounts are held in three segregated investment accounts. One for annuities issued to residents of
California, one for annuities issued to residents of Florida, and another for annuities issued to residents
of other states in which ChildFund is authorized to issue gift annuities. All segregated accounts are
stated at fair value, as described in note 2(d).
Under the charitable gift annuity agreements, the donor contributes assets to ChildFund. In return for
the contribution, ChildFund pays an annuity to the donor, and/or another annuitant selected by the
donor, for the remainder of the annuitant’s life, subject in some instances to a deferred beginning date.
The payout is a fixed amount based on a percentage of the original gift, as defined by the agreement.
The fair value of the assets received under the annuity agreement is held in the applicable segregated
investment account and invested in assets intended to comply with any investment restrictions imposed
by California or the other states in which ChildFund is authorized to issue gift annuities. Contribution
income is recognized at the date the agreement is established, net of the liability recorded for the
present value of the estimated future payments to be made to the respective annuitants.
These segregated investments as of June 30, 2016 and 2015 totaled $2,234,213 and $2,475,029,
respectively, and are reported as investments on the consolidated statement of financial position. The
liability associated with these charitable gift annuities is recorded at the present value of the gift based
on the IAR 2012 tables and IRS interest rates as of the date of agreement which range from 1.2% to
7.2% as of June 30, 2016 and 2015. The liability amounts are included in accounts payable and accrued
expenses on the consolidated statement of financial position as of June 30, 2016 and 2015 and total
$1,518,627 and $1,289,723, respectively.
(b) Perpetual Trusts
ChildFund is the beneficiary of approximately 10 perpetual trusts created by donors, the assets of
which are not in the possession of ChildFund. ChildFund has legally enforceable rights or claims to
the income from the assets. The fair values of beneficial interest in perpetual trusts at June 30, 2016
and 2015 were $8,358,245 and $8,865,090, respectively. Net decrease of $506,845 and $387,753
related to changes in fair values of these trusts for the years ended June 30, 2016 and 2015,
respectively, were reported in changes in permanently restricted net assets on the accompanying
statement of activities. There were no perpetual trusts given to ChildFund during the years ended
June 30, 2016 and 2015.
CHILDFUND INTERNATIONAL, USA
Notes to Consolidated Financial Statements
June 30, 2016
(with summarized financial information for June 30, 2015)
16 (Continued)
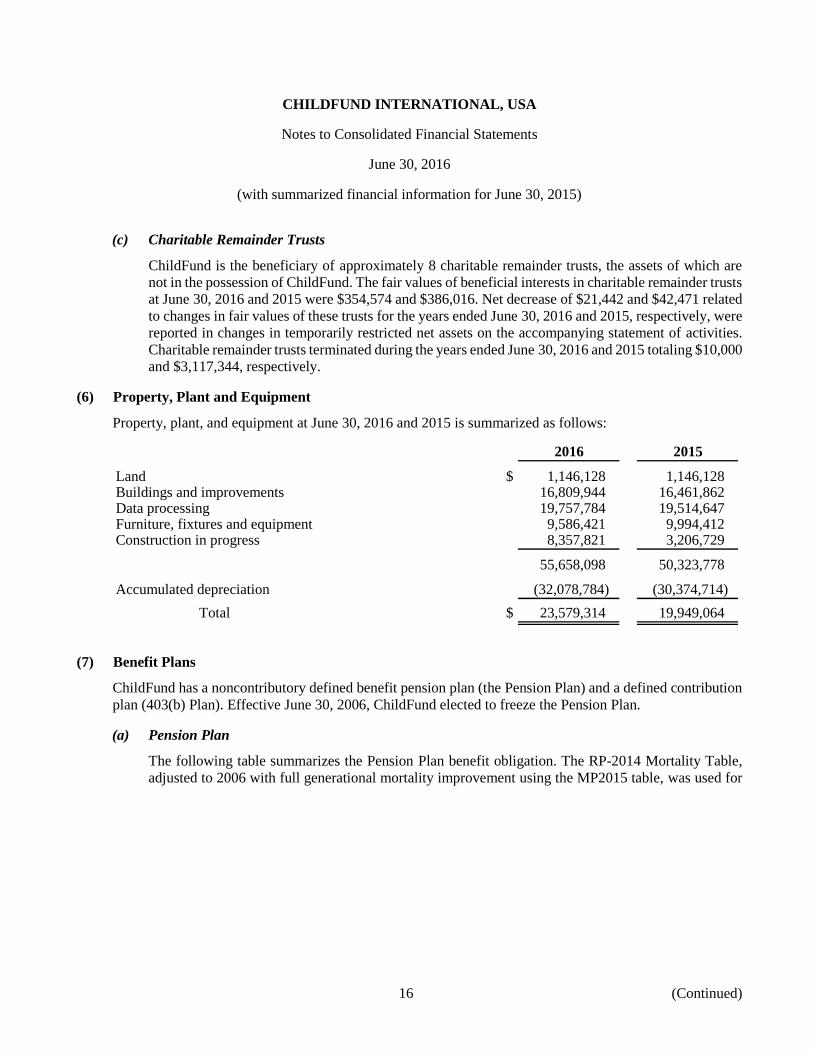
(c) Charitable Remainder Trusts
ChildFund is the beneficiary of approximately 8 charitable remainder trusts, the assets of which are
not in the possession of ChildFund. The fair values of beneficial interests in charitable remainder trusts
at June 30, 2016 and 2015 were $354,574 and $386,016. Net decrease of $21,442 and $42,471 related
to changes in fair values of these trusts for the years ended June 30, 2016 and 2015, respectively, were
reported in changes in temporarily restricted net assets on the accompanying statement of activities.
Charitable remainder trusts terminated during the years ended June 30, 2016 and 2015 totaling $10,000
and $3,117,344, respectively.
(6) Property, Plant and Equipment
Property, plant, and equipment at June 30, 2016 and 2015 is summarized as follows:
2016 2015
Land $ 1,146,128 1,146,128 Buildings and improvements 16,809,944 16,461,862 Data processing 19,757,784 19,514,647 Furniture, fixtures and equipment 9,586,421 9,994,412 Construction in progress 8,357,821 3,206,729
55,658,098 50,323,778
Accumulated depreciation (32,078,784) (30,374,714)
Total $ 23,579,314 19,949,064
(7) Benefit Plans
ChildFund has a noncontributory defined benefit pension plan (the Pension Plan) and a defined contribution
plan (403(b) Plan). Effective June 30, 2006, ChildFund elected to freeze the Pension Plan.
(a) Pension Plan
The following table summarizes the Pension Plan benefit obligation. The RP-2014 Mortality Table,
adjusted to 2006 with full generational mortality improvement using the MP2015 table, was used for
CHILDFUND INTERNATIONAL, USA
Notes to Consolidated Financial Statements
June 30, 2016
(with summarized financial information for June 30, 2015)
17 (Continued)
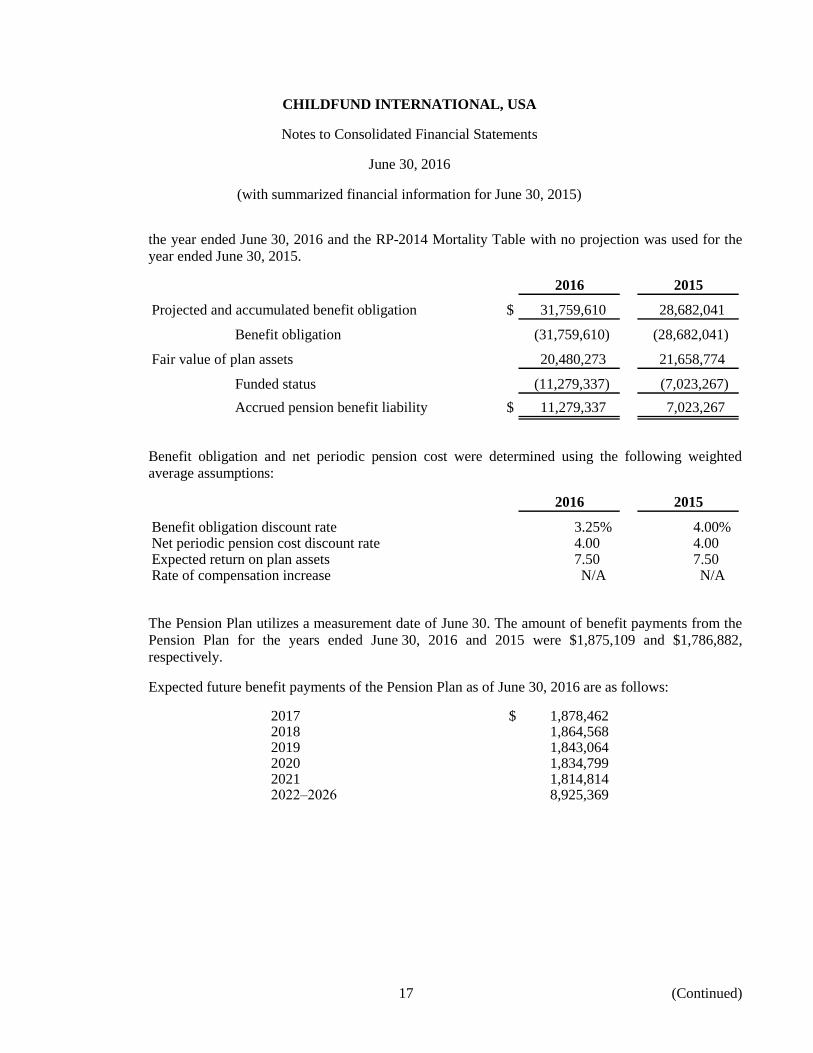
the year ended June 30, 2016 and the RP-2014 Mortality Table with no projection was used for the
year ended June 30, 2015.
2016 2015
Projected and accumulated benefit obligation $ 31,759,610 28,682,041
Benefit obligation (31,759,610) (28,682,041)
Fair value of plan assets 20,480,273 21,658,774
Funded status (11,279,337) (7,023,267)
Accrued pension benefit liability $ 11,279,337 7,023,267
Benefit obligation and net periodic pension cost were determined using the following weighted
average assumptions:
2016 2015
Benefit obligation discount rate 3.25% 4.00%Net periodic pension cost discount rate 4.00 4.00Expected return on plan assets 7.50 7.50Rate of compensation increase N/A N/A
The Pension Plan utilizes a measurement date of June 30. The amount of benefit payments from the
Pension Plan for the years ended June 30, 2016 and 2015 were $1,875,109 and $1,786,882,
respectively.
Expected future benefit payments of the Pension Plan as of June 30, 2016 are as follows:
2017 $ 1,878,462 2018 1,864,568 2019 1,843,064 2020 1,834,799 2021 1,814,814 2022–2026 8,925,369
CHILDFUND INTERNATIONAL, USA
Notes to Consolidated Financial Statements
June 30, 2016
(with summarized financial information for June 30, 2015)
18 (Continued)
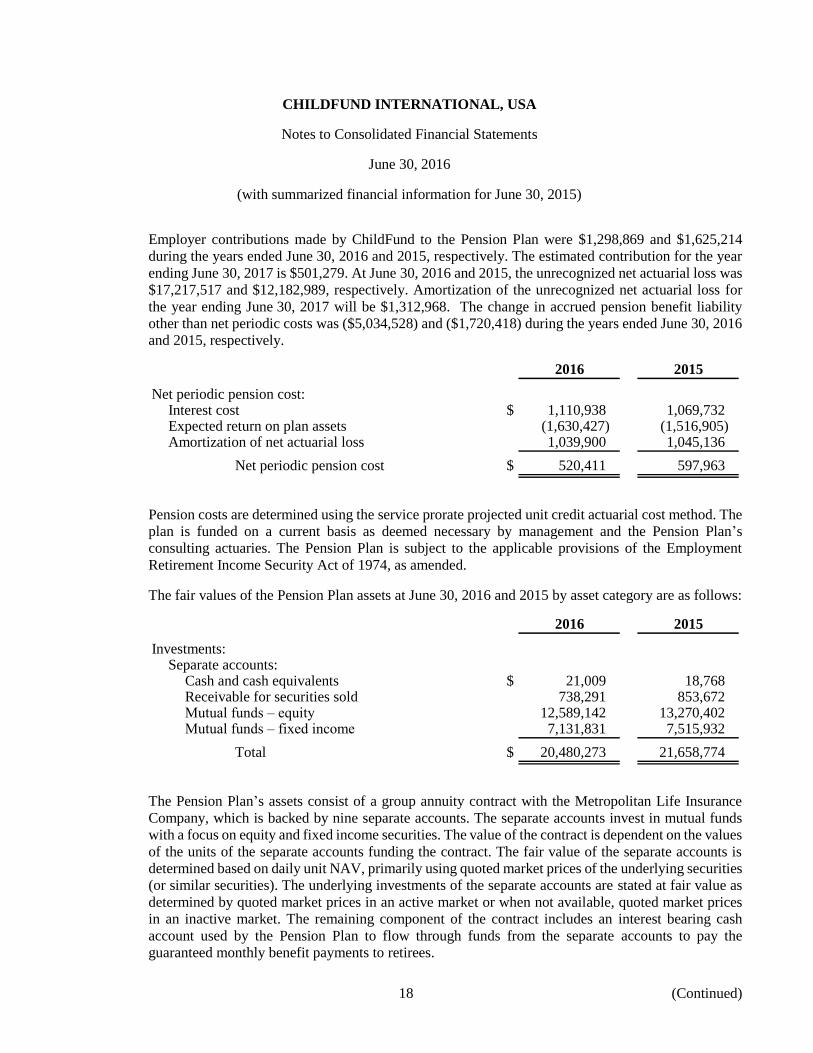
Employer contributions made by ChildFund to the Pension Plan were $1,298,869 and $1,625,214
during the years ended June 30, 2016 and 2015, respectively. The estimated contribution for the year
ending June 30, 2017 is $501,279. At June 30, 2016 and 2015, the unrecognized net actuarial loss was
$17,217,517 and $12,182,989, respectively. Amortization of the unrecognized net actuarial loss for
the year ending June 30, 2017 will be $1,312,968. The change in accrued pension benefit liability
other than net periodic costs was ($5,034,528) and ($1,720,418) during the years ended June 30, 2016
and 2015, respectively.
2016 2015
Net periodic pension cost:Interest cost $ 1,110,938 1,069,732 Expected return on plan assets (1,630,427) (1,516,905) Amortization of net actuarial loss 1,039,900 1,045,136
Net periodic pension cost $ 520,411 597,963
Pension costs are determined using the service prorate projected unit credit actuarial cost method. The
plan is funded on a current basis as deemed necessary by management and the Pension Plan’s
consulting actuaries. The Pension Plan is subject to the applicable provisions of the Employment
Retirement Income Security Act of 1974, as amended.
The fair values of the Pension Plan assets at June 30, 2016 and 2015 by asset category are as follows:
2016 2015
Investments:Separate accounts:
Cash and cash equivalents $ 21,009 18,768 Receivable for securities sold 738,291 853,672 Mutual funds – equity 12,589,142 13,270,402 Mutual funds – fixed income 7,131,831 7,515,932
Total $ 20,480,273 21,658,774
The Pension Plan’s assets consist of a group annuity contract with the Metropolitan Life Insurance
Company, which is backed by nine separate accounts. The separate accounts invest in mutual funds
with a focus on equity and fixed income securities. The value of the contract is dependent on the values
of the units of the separate accounts funding the contract. The fair value of the separate accounts is
determined based on daily unit NAV, primarily using quoted market prices of the underlying securities
(or similar securities). The underlying investments of the separate accounts are stated at fair value as
determined by quoted market prices in an active market or when not available, quoted market prices
in an inactive market. The remaining component of the contract includes an interest bearing cash
account used by the Pension Plan to flow through funds from the separate accounts to pay the
guaranteed monthly benefit payments to retirees.
CHILDFUND INTERNATIONAL, USA
Notes to Consolidated Financial Statements
June 30, 2016
(with summarized financial information for June 30, 2015)
19 (Continued)
The expected role of the Pension Plan equity investments is to maximize the long-term real growth of
assets, while the role of fixed income investments is to generate current income, provide for more
stable returns and provide some protection against a prolonged decline in the fair value of equity
investments.
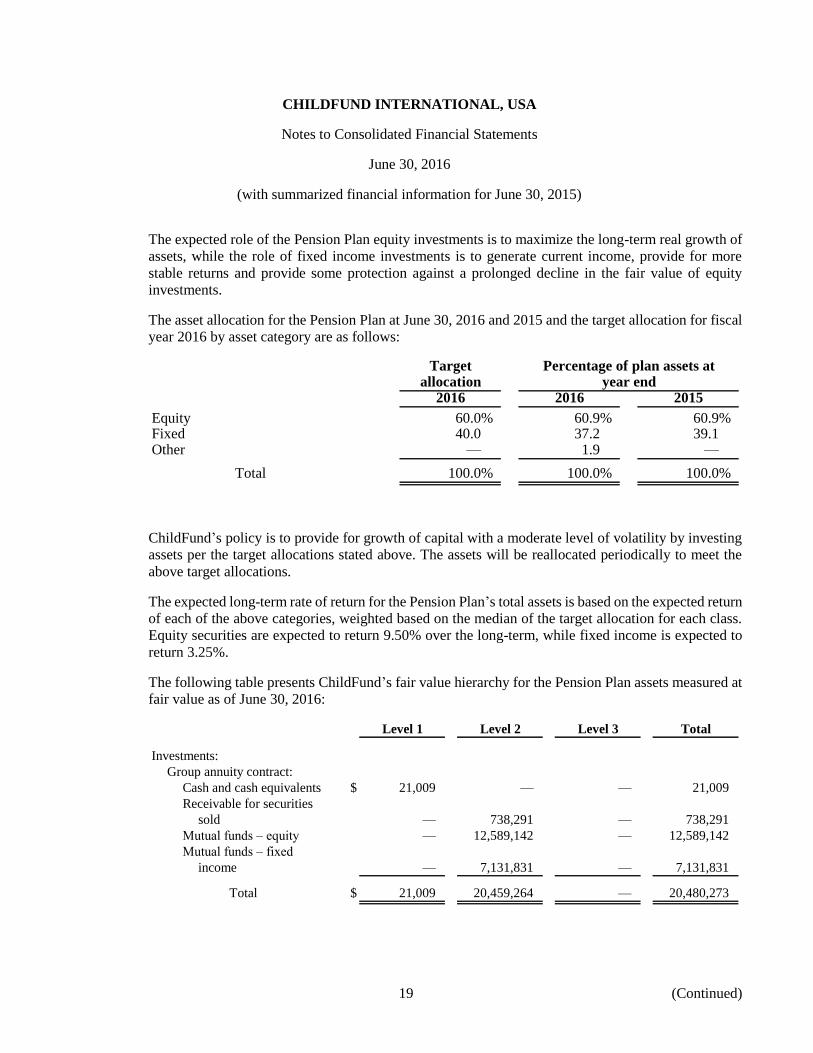
The asset allocation for the Pension Plan at June 30, 2016 and 2015 and the target allocation for fiscal
year 2016 by asset category are as follows:
Target Percentage of plan assets atallocation year end
2016 2016 2015
Equity 60.0% 60.9% 60.9%Fixed 40.0 37.2 39.1Other — 1.9 —
Total 100.0% 100.0% 100.0%
ChildFund’s policy is to provide for growth of capital with a moderate level of volatility by investing
assets per the target allocations stated above. The assets will be reallocated periodically to meet the
above target allocations.
The expected long-term rate of return for the Pension Plan’s total assets is based on the expected return
of each of the above categories, weighted based on the median of the target allocation for each class.
Equity securities are expected to return 9.50% over the long-term, while fixed income is expected to
return 3.25%.
The following table presents ChildFund’s fair value hierarchy for the Pension Plan assets measured at
fair value as of June 30, 2016:
Level 1 Level 2 Level 3 Total
Investments:
Group annuity contract:
Cash and cash equivalents $ 21,009 — — 21,009
Receivable for securities
sold — 738,291 — 738,291
Mutual funds – equity — 12,589,142 — 12,589,142
Mutual funds – fixed
income — 7,131,831 — 7,131,831
Total $ 21,009 20,459,264 — 20,480,273

CHILDFUND INTERNATIONAL, USA
Notes to Consolidated Financial Statements
June 30, 2016
(with summarized financial information for June 30, 2015)
20 (Continued)
The following table presents ChildFund’s fair value hierarchy for the Pension Plan assets measured at
fair value as of June 30, 2015:
Level 1 Level 2 Level 3 Total
Investments:
Group annuity contract:
Cash and cash equivalents $ 18,768 — — 18,768
Receivable for securities
sold — 853,672 — 853,672
Mutual funds – equity — 13,270,402 — 13,270,402
Mutual funds – fixed
income — 7,515,932 — 7,515,932
Total $ 18,768 21,640,006 — 21,658,774
(b) 403(b) Plan
All employees are eligible to participate in the 403(b) Plan. ChildFund contributed a nonvoluntary
amount equal to 6% of employees’ base pay to the 403(b) Plan each payroll period for all employees.
In addition, ChildFund also matches 50% of the first 6% of base pay that a participant contributes to
the Plan. The actual rate is approved annually by the ChildFund Board of Directors (the Board). Total
expense recognized for the years ended June 30, 2016 and 2015 related to the 403(b) Plan was
$701,755 and $841,146, respectively.
(8) Debt
At both June 30, 2016 and 2015, ChildFund had a $10,000,000 revolving line of credit. The line of credit
payable was due and payable on July 31, 2016, however ChildFund entered into an agreement in July 2016
to extend the line of credit until February 2017. Interest expense is based on daily one month LIBOR + 95
basis points and is due and payable in consecutive monthly payments until fully paid. The line of credit is
collateralized by ChildFund’s corporate headquarters building located in Richmond, Virginia. At both June
30, 2016 and 2015, no amounts were outstanding on the line of credit.
On August 9, 2013 ChildFund entered into a $13,000,000 commercial note that matures on August 9, 2023.
The interest rate on the note is 3.67% per annum. From September 1, 2013 through August 1, 2015, interest
payments on outstanding principal, as applicable, were due monthly. From September 1, 2015 through
August 1, 2023, principal payments, as applicable, are due monthly in the amount of $135,417 along with
interest payments on outstanding principal, as applicable. The note contains certain financial covenants that
must be adhered to by ChildFund. ChildFund was in compliance with all debt covenants during the years
ended June 30, 2016 and 2015. As of June 30, 2016 and 2015, the outstanding loan balance was $11,645,834
and $4,000,000, respectively.

CHILDFUND INTERNATIONAL, USA
Notes to Consolidated Financial Statements
June 30, 2016
(with summarized financial information for June 30, 2015)
21 (Continued)
(9) Temporarily Restricted Net Assets
Temporarily restricted net assets at June 30, 2016 and 2015 were available for the following purposes:
2016 2015
Subsidies and gifts for children $ 22,992,600 23,155,249 Appeal funded programs 4,002,856 6,096,857 Gifts in kind not distributed 7,153,092 4,602,031 Time restricted 354,574 386,016 Local programs and other 3,499,033 2,481,703
Total $ 38,002,155 36,721,856
(10) Permanently Restricted Net Assets
Permanently restricted net assets were $16,872,832 and $17,299,217 at June 30, 2016 and 2015, respectively.
The principal of these net assets must be invested in perpetuity; however, the income is expendable to support
subsidies for children and other restricted program activities.
(11) International Sponsors
Support from international sponsors is generated by autonomous organizations and consolidated operations.
(a) Autonomous Organizations
Supporting ChildFund are ChildFund Australia, BORNEfonden (Denmark), Un Enfant Par La Main
(France), ChildFund Kinderhilfswerk (Germany), ChildFund Ireland, ChildFund Japan, ChildFund
Korea, Barnfonden (Sweden), Taiwan Fund for Children and Families, ChildFund Educo and
ChildFund New Zealand. These autonomous organizations are incorporated in their respective
countries for the purpose of initiating and overseeing programs that are distinct and unique to their
mission. Because ChildFund does not control these organizations, their related assets, liabilities, net
assets, revenues and expenses are not reflected in the accompanying consolidated financial statements.
The sponsorships and special gifts for children received from these organizations are included in the
consolidated statements of activities for the years ended June 30, 2016 and 2015 and are summarized
by country in the accompanying table. As of June 30, 2016 and 2015, ChildFund has sponsorship
receivables from these autonomous organizations totaling $2,000,589 and $1,845,632, respectively.
These receivables are the result of the timing of collection of funds as compared to deposit by the
international offices. ChildFund recognized service fee revenue from these autonomous organizations
in the consolidated statements of activities for the years ended June 30, 2016 and 2015 of $1,094,826
and $1,248,225, respectively. The service fee covers the administrative costs of processing payments
and ensuring proper receipt of funding to the local partners and ChildFund National Offices that
support the sponsored children of the autonomous organizations.

CHILDFUND INTERNATIONAL, USA
Notes to Consolidated Financial Statements
June 30, 2016
(with summarized financial information for June 30, 2015)
22 (Continued)
(b) Consolidated Operations
ChildFund works with national fund raising offices in Brazil, Mexico, Thailand and other countries
that provide sponsorship revenue. These offices are organizations or segments of organizations that
are independently registered in conformity with the laws of their respective countries. ChildFund
possesses the power to direct the management and policies of these offices through affiliation
agreements and consolidates the financial position and activities of these organizations.
The sponsorships and special gifts for children received internationally from the autonomous
organizations and consolidated operations are included in the consolidated statement of activities for
the years ended June 30, 2016 and 2015, and are summarized in the accompanying table.
Special gifts General Total
Sponsorships for children contributions 2016 2015
Autonomous organizations:
Australia $ 11,160,413 555,569 302,010 12,017,992 15,203,911
Denmark 2,524,570 242,151 2,352 2,769,073 3,214,677
Educo — — 30,000 30,000 —
France 1,453,230 71,540 110,862 1,635,632 1,825,146
Germany 4,016,569 231,566 282,748 4,530,883 5,033,768
Ireland 616,590 94,569 19,680 730,839 858,722
Japan 101,946 — 9,985 111,931 127,502
Korea 3,268,849 50,068 546,926 3,865,843 3,935,317
New Zealand 4,190,544 403,817 87,076 4,681,437 5,972,680
Sweden 4,055,945 598,582 333,693 4,988,220 5,591,131
Taiwan 6,354,173 553,797 25,658 6,933,628 7,448,554
Total
autonomous
organizations 37,742,829 2,801,659 1,750,990 42,295,478 49,211,408
Special gifts General Total
Sponsorships for children contributions 2016 2015
Consolidated operations:
Brazil $ 1,484,893 341,234 170,974 1,997,101 2,664,156
Mexico 789,611 27,981 411,578 1,229,170 1,607,092
Thailand 8,426,722 140,647 2,267,848 10,835,217 11,475,903
Other 3,084 — — 3,084 2,984
Total
consolidated
operations 10,704,310 509,862 2,850,400 14,064,572 15,750,135
Total
international
sponsors $ 48,447,139 3,311,521 4,601,390 56,360,050 64,961,543
CHILDFUND INTERNATIONAL, USA
Notes to Consolidated Financial Statements
June 30, 2016
(with summarized financial information for June 30, 2015)
23 (Continued)
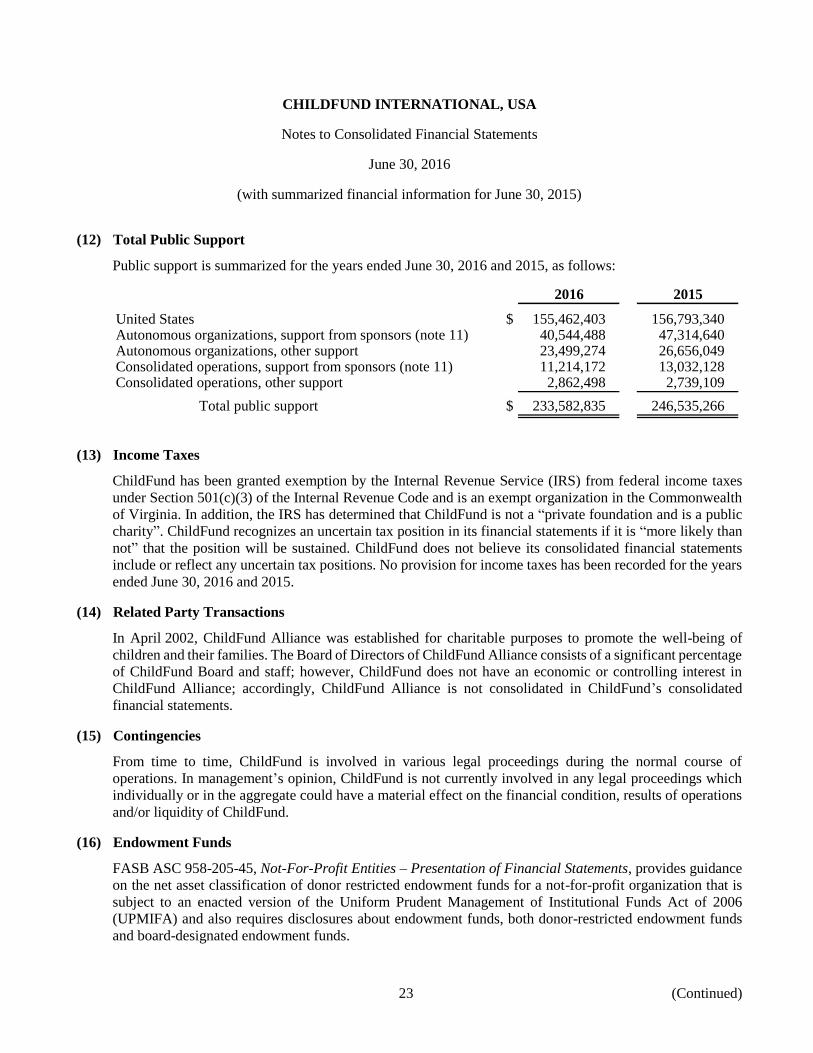
(12) Total Public Support
Public support is summarized for the years ended June 30, 2016 and 2015, as follows:
2016 2015
United States $ 155,462,403 156,793,340 Autonomous organizations, support from sponsors (note 11) 40,544,488 47,314,640 Autonomous organizations, other support 23,499,274 26,656,049 Consolidated operations, support from sponsors (note 11) 11,214,172 13,032,128 Consolidated operations, other support 2,862,498 2,739,109
Total public support $ 233,582,835 246,535,266
(13) Income Taxes
ChildFund has been granted exemption by the Internal Revenue Service (IRS) from federal income taxes
under Section 501(c)(3) of the Internal Revenue Code and is an exempt organization in the Commonwealth
of Virginia. In addition, the IRS has determined that ChildFund is not a “private foundation and is a public
charity”. ChildFund recognizes an uncertain tax position in its financial statements if it is “more likely than
not” that the position will be sustained. ChildFund does not believe its consolidated financial statements
include or reflect any uncertain tax positions. No provision for income taxes has been recorded for the years
ended June 30, 2016 and 2015.
(14) Related Party Transactions
In April 2002, ChildFund Alliance was established for charitable purposes to promote the well-being of
children and their families. The Board of Directors of ChildFund Alliance consists of a significant percentage
of ChildFund Board and staff; however, ChildFund does not have an economic or controlling interest in
ChildFund Alliance; accordingly, ChildFund Alliance is not consolidated in ChildFund’s consolidated
financial statements.
(15) Contingencies
From time to time, ChildFund is involved in various legal proceedings during the normal course of
operations. In management’s opinion, ChildFund is not currently involved in any legal proceedings which
individually or in the aggregate could have a material effect on the financial condition, results of operations
and/or liquidity of ChildFund.
(16) Endowment Funds
FASB ASC 958-205-45, Not-For-Profit Entities – Presentation of Financial Statements, provides guidance
on the net asset classification of donor restricted endowment funds for a not-for-profit organization that is
subject to an enacted version of the Uniform Prudent Management of Institutional Funds Act of 2006
(UPMIFA) and also requires disclosures about endowment funds, both donor-restricted endowment funds
and board-designated endowment funds.
CHILDFUND INTERNATIONAL, USA
Notes to Consolidated Financial Statements
June 30, 2016
(with summarized financial information for June 30, 2015)
24 (Continued)
ChildFund’s endowment consists of individual funds established for a variety of purposes. The endowment
includes both donor-restricted endowment funds and funds designated by the Board to function as
endowments. Net assets associated with endowment funds, including funds designated by the Board to
function as endowments, are classified and reported based on the existence or absence of donor-imposed
restrictions.
(a) Interpretation of Relevant Law
ChildFund has interpreted the Commonwealth of Virginia’s enacted version of the UPMIFA as
allowing ChildFund to appropriate for expenditure or accumulate as much of an endowment fund as
ChildFund determines is prudent for the uses, purposes, and duration for which the endowment fund
is established, subject to the intent of the donor as expressed in the gift instrument.
Unless otherwise stated in the gift instrument, the assets in an endowment fund should be donor
restricted assets until appropriated for expenditure by the Board. The remaining portion of the
donor-restricted endowment fund that is not classified in permanently restricted net assets is classified
as temporarily restricted net assets until those amounts are appropriated for expenditure by ChildFund
in a manner consistent with the standard of prudence prescribed by UPMIFA. In accordance with
UPMIFA, ChildFund considers the following factors in making a determination to appropriate or
accumulate donor-restricted endowment funds:
1. The duration and preservation of the fund
2. The purposes of ChildFund and the donor-restricted endowment fund
3. General economic conditions
4. The possible effect of inflation and deflation
5. The expected total return from income and the appreciation of investments
6. Other resources of ChildFund
7. The investment policies of ChildFund
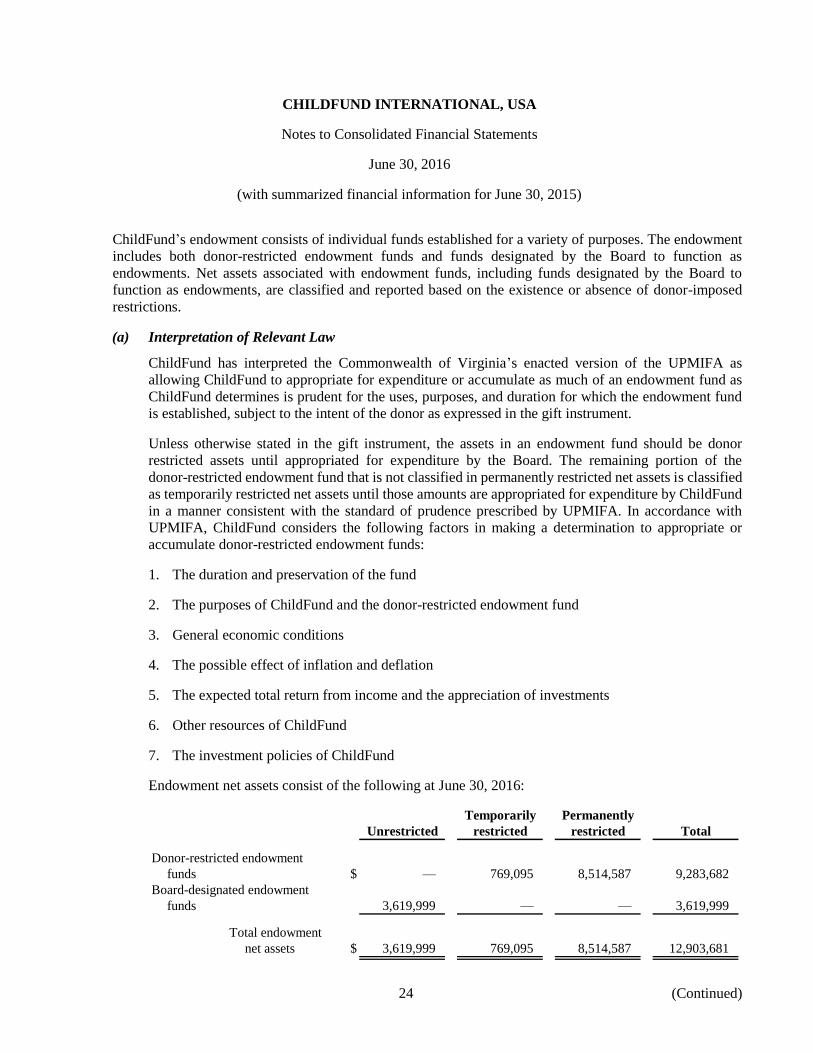
Endowment net assets consist of the following at June 30, 2016:
Temporarily Permanently
Unrestricted restricted restricted Total
Donor-restricted endowment
funds $ — 769,095 8,514,587 9,283,682
Board-designated endowment
funds 3,619,999 — — 3,619,999
Total endowment
net assets $ 3,619,999 769,095 8,514,587 12,903,681
CHILDFUND INTERNATIONAL, USA
Notes to Consolidated Financial Statements
June 30, 2016
(with summarized financial information for June 30, 2015)
25 (Continued)
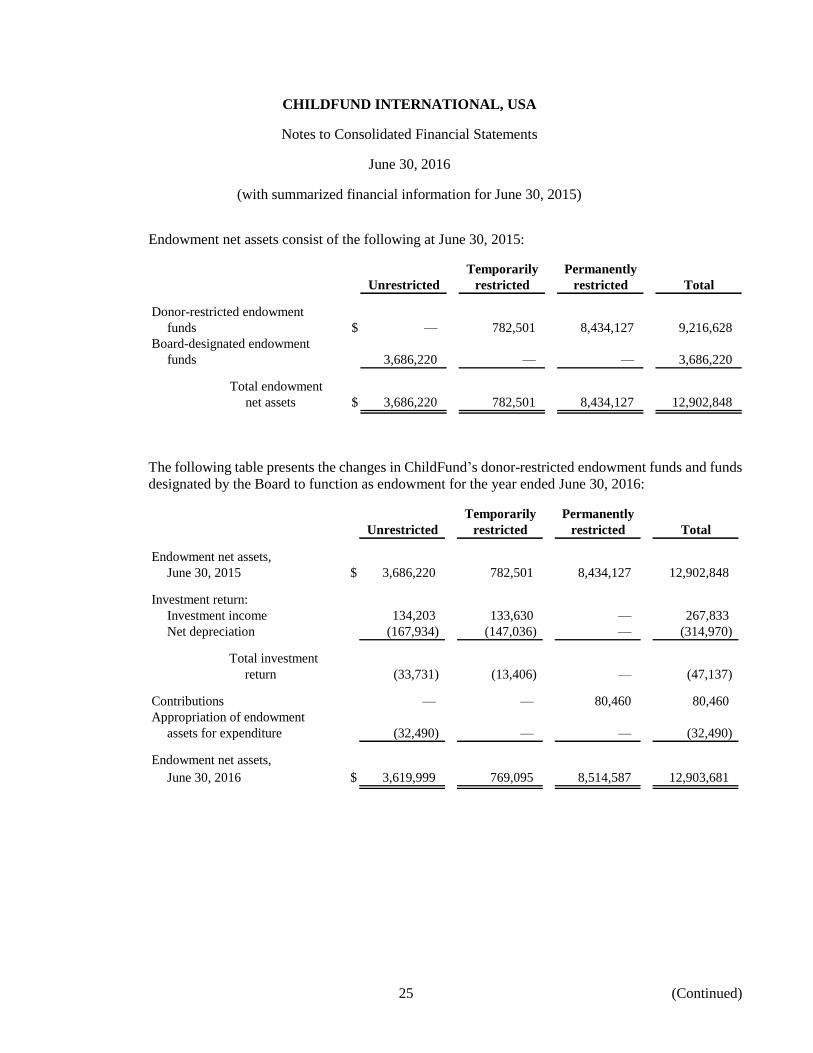
Endowment net assets consist of the following at June 30, 2015:
Temporarily Permanently
Unrestricted restricted restricted Total
Donor-restricted endowment
funds $ — 782,501 8,434,127 9,216,628
Board-designated endowment
funds 3,686,220 — — 3,686,220
Total endowment
net assets $ 3,686,220 782,501 8,434,127 12,902,848
The following table presents the changes in ChildFund’s donor-restricted endowment funds and funds
designated by the Board to function as endowment for the year ended June 30, 2016:
Temporarily Permanently
Unrestricted restricted restricted Total
Endowment net assets,
June 30, 2015 $ 3,686,220 782,501 8,434,127 12,902,848
Investment return:
Investment income 134,203 133,630 — 267,833
Net depreciation (167,934) (147,036) — (314,970)
Total investment
return (33,731) (13,406) — (47,137)
Contributions — — 80,460 80,460
Appropriation of endowment
assets for expenditure (32,490) — — (32,490)
Endowment net assets,
June 30, 2016 $ 3,619,999 769,095 8,514,587 12,903,681

CHILDFUND INTERNATIONAL, USA
Notes to Consolidated Financial Statements
June 30, 2016
(with summarized financial information for June 30, 2015)
26 (Continued)
The following table presents the changes in ChildFund’s donor-restricted endowment funds and funds
designated by the Board to function as endowment for the year ended June 30, 2015:
Temporarily Permanently
Unrestricted restricted restricted Total
Endowment net assets,
June 30, 2014 $ 4,513,540 812,406 8,385,551 13,711,497
Investment return:
Investment income 228,925 3,217 — 232,142
Net depreciation (253,550) (3,563) — (257,113)
Total investment
return (24,625) (346) — (24,971)
Contributions — — 48,576 48,576
Appropriation of endowment
assets for expenditure (817,827) (14,427) — (832,254)
Net assets released from
restrictions 15,132 (15,132) — —
Endowment net assets,
June 30, 2015 $ 3,686,220 782,501 8,434,127 12,902,848
(b) Funds with Deficiencies
From time to time, the fair value of assets associated with individual donor-restricted endowment funds
may fall below the level that the donor or UPMIFA requires ChildFund to retain as a fund of perpetual
duration. In accordance with U.S. generally accepted accounting principles, deficiencies of this nature
are reported in unrestricted net assets. At both June 30, 2016 and 2015, there were no deficiencies of
this nature.
(c) Return Objectives and Risk Parameters
Endowment assets include those assets of donor-restricted funds that the organization must hold in
perpetuity or for a donor-specified period as well as board-designated funds. ChildFund has adopted
investment and spending policies for endowment assets that attempt to provide a predictable stream of
funding to programs supported by its endowment while seeking to maintain the purchasing power of
the endowment assets. ChildFund expects its endowment funds to provide an average annual real rate
of return of approximately 5%.
CHILDFUND INTERNATIONAL, USA
Notes to Consolidated Financial Statements
June 30, 2016
(with summarized financial information for June 30, 2015)
27
(d) Strategies Employed for Achieving Objectives
To satisfy its long-term rate-of-return objectives, ChildFund relies on a total return strategy in which
investment returns are achieved through both capital appreciation (realized and unrealized) and current
yield (interest and dividends). ChildFund targets a diversified asset allocation that places emphasis on
investments in equities, bonds and absolute return strategies to achieve its long-term return objectives
within a prudent risk framework.
(e) Spending Policy and How Investment Objectives Relate to Spending Policy
ChildFund has two spending policies for endowments. For endowments restricted for child
sponsorships, the appropriation and expenditure typically occur within the same reporting period. The
spending rate is determined by the most current monthly sponsorship rate paid by sponsors in the
United States. In order to meet this spending rate, donors are asked to contribute a one-time endowment
gift. Investment gains and yields are used to provide the child with food, education, basic healthcare
and other assistance.
For nonsponsorship endowments, unless otherwise directed by the donor, the policy for appropriating
for distribution is equal to 5% of the endowment funds’ average fair value for the preceding
three years. In establishing this policy, ChildFund considered the expected return on its endowments.
Accordingly, ChildFund expects the current spending policies to allow its nonsponsorship
endowments to maintain their purchasing power by growing at a rate equal to planned payouts. For
those endowments that maintain donor restrictions, ChildFund considers the cumulative earnings and
expected rate of return and then appropriates available funds for distribution in accordance with the
donor restrictions.
(17) Subsequent Events
ChildFund has evaluated subsequent events for potential recognition and/or disclosure in the June 30, 2016
consolidated financial statements through November 22, 2016, the date the consolidated financial statements
were issued.