child undernutrition and feeding practices in nepal: …child undernutrition and feeding practices...
TRANSCRIPT

DHS Further Analysis Reports No. 122
Child Undernutrition and Feeding Practices in Nepal: Trends,
Inequities, and Determinants


DHS Further Analysis Reports No. 122
Child Undernutrition and Feeding Practices in Nepal: Trends, Inequities, and Determinants
Sumit Karn1 Debendra Prasad Adhikari2
Naveen Paudyal3 Basundhara Aryal4
Ramesh Kant Adhikari5 Mona Mehta Steffen6
ICF Rockville, Maryland, USA
January 2019
1 New ERA 2 United States Agency for International Development (USAID)/Nepal
3 UNICEF/Nepal 4 Family Welfare Division, Ministry of Health and Population, Nepal
5 KIST Medical College 6 The DHS Program, ICF
Corresponding author: Sumit Karn, New ERA, Rudramati Marg, Kalopul, Kathmandu, Nepal; email: [email protected]
Ministry of Health
and Population

Acknowledgments: The authors extend their sincere appreciation to Kiran Acharya (New ERA), Deepa Bhandari (University of Melbourne), and Sanjay Rijal (UNICEF) for their support and assistance during analysis, to Stanley Chitekwe (UNICEF) for his input into the analysis plan and finalization of the report, to Tom Fish (ICF) for developing a comparable health indicator for provinces for the 2011 DHS dataset, and to members of the Technical Working Group (consisting of representatives from the Family Welfare Division, Policy, Planning and Monitoring Division of the MoHP, and all key development partners that work in the health sector group) for creating the nutrition intervention district variable that was used in our analysis. The authors also gratefully acknowledge the helpful comments of peer reviewers, Rukundo Benedict (ICF), Sabita Tuladhar (USAID), Pooja Pandey (Suaahara II), and Raj Kumar Pokharel (MoHP).
Editor: Diane Stoy
Document Production: Natalie Shattuck, Joan Wardell
This study was implemented with support provided by the United States Agency for International Development (USAID) through The DHS Program (#AID-OAA-C-13-00095). The views expressed are those of the authors and do not necessarily reflect the views of USAID or the United States Government.
This study is a further analysis of the 2016 Nepal Demographic and Health Survey (2016 NDHS). The 2016 NDHS was conducted by New ERA under the aegis of the Ministry of Health and Population of Nepal. Funding for the survey was provided by USAID. ICF provided technical assistance through The DHS Program, a USAID-funded project providing support and technical assistance in the implementation of population and health surveys in countries worldwide.
Additional information about the 2016 NDHS may be obtained from the Ministry of Health and Population, Ram Shah Path, Kathmandu; telephone: +977-1-4262543/4262802; internet: http://www.mohp.gov.np; and New ERA, Rudramati Marg, Kathmandu, P.O. Box 722, Kathmandu 44600, Nepal; telephone: +977-1-4413603; email: [email protected]; internet: http://www.newera.com.np.
The DHS Program assists countries worldwide in the collection and use of data to monitor and evaluate population, health, and nutrition programs. Additional information about The DHS Program can be obtained from ICF, 530 Gaither Road, Suite 500, Rockville, MD 20850 USA; telephone: +1 301-407-6500, fax: +1 301-407-6501, email: [email protected], internet: www.DHSprogram.com.
Recommended citation:
Karn, Sumit, Debendra Adhikari, Naveen Paudyal, Basundhara Aryal, Ramesh Kant Adhikari, and Mona Mehta Steffen. 2019. Child Undernutrition and Feeding Practices in Nepal: Trends, Inequities, and Determinants. DHS Further Analysis Reports No. 122. Rockville, Maryland, USA: ICF.

iii
CONTENTS TABLES .................................................................................................................................................. v FIGURES .............................................................................................................................................. vii FOREWORD .......................................................................................................................................... ix ACKNOWLEDGMENTS ........................................................................................................................ xi ABSTRACT ......................................................................................................................................... xiii ACRONYMS AND ABBREVIATIONS ................................................................................................. xv
1 BACKGROUND ......................................................................................................................... 1 1.1 Introduction ................................................................................................................... 1 1.2 Policy Landscape for Nutrition in Nepal ........................................................................ 1 1.3 Approach for the Study ................................................................................................. 3
2 DATA AND METHODS ............................................................................................................. 5 2.1 DHS Data ...................................................................................................................... 5 2.2 Conceptual Framework ................................................................................................. 6 2.3 District Categorization of Nutrition Programming ........................................................ 11 2.4 Statistical Analysis ...................................................................................................... 12
3 TRENDS IN OUTCOME AND EXPLANATORY VARIABLES, 2011-2016 ............................ 13
4 STUNTING IN CHILDREN AGE 0-59 MONTHS ..................................................................... 15 4.1 Pattern and Distribution of Stunting in 2011 and 2016 ............................................... 15 4.2 Socioeconomic Inequalities in Stunting in 2011 and 2016 ......................................... 16 4.3 Understanding the Factors behind Stunting in Children (age 0-59 months) in
Nepal using DHS 2016 Data ....................................................................................... 18 4.3.1 Association of child-instrinsic factors with stunting ........................................ 18 4.3.2 Association of maternal factors with stunting ................................................. 18 4.3.3 Association of infant and young child feeding factors with stunting ............... 19 4.3.4 Association of health and environment factors with stunting ......................... 20 4.3.5 Association of socioeconomic status factors with stunting ............................ 22
4.4 Determinants of Child Stunting ................................................................................... 24
5 MINIMUM ACCEPTABLE DIET IN CHILDREN AGE 6-23 MONTHS .................................... 31 5.1 Socioeconomic Inequalities in Minimum Acceptable Diet in 2011 and 2016 ............. 31 5.2 Understanding the Factors behind Minimum Acceptable Diet in Children Age 6-
23 in Nepal .................................................................................................................. 33 5.2.1 Association of child-instrinsic factors with MAD ............................................. 33 5.2.2 Association of maternal factors with MAD ..................................................... 34 5.2.3 Association of health and environment factors with MAD ............................. 34 5.2.4 Association of socioeconomic status factors with MAD ................................. 36
5.3 Determinants of MAD .................................................................................................. 37
6 DISCUSSION ........................................................................................................................... 45 6.1 Stunting ....................................................................................................................... 45 6.2 Minimum Acceptable Diet ........................................................................................... 47 6.3 Limitations of the Study ............................................................................................... 48 6.4 Policy and Programmatic Implications ........................................................................ 49 6.5 Conclusion .................................................................................................................. 50
REFERENCES ...................................................................................................................................... 51
APPENDICES ....................................................................................................................................... 57


v
TABLES
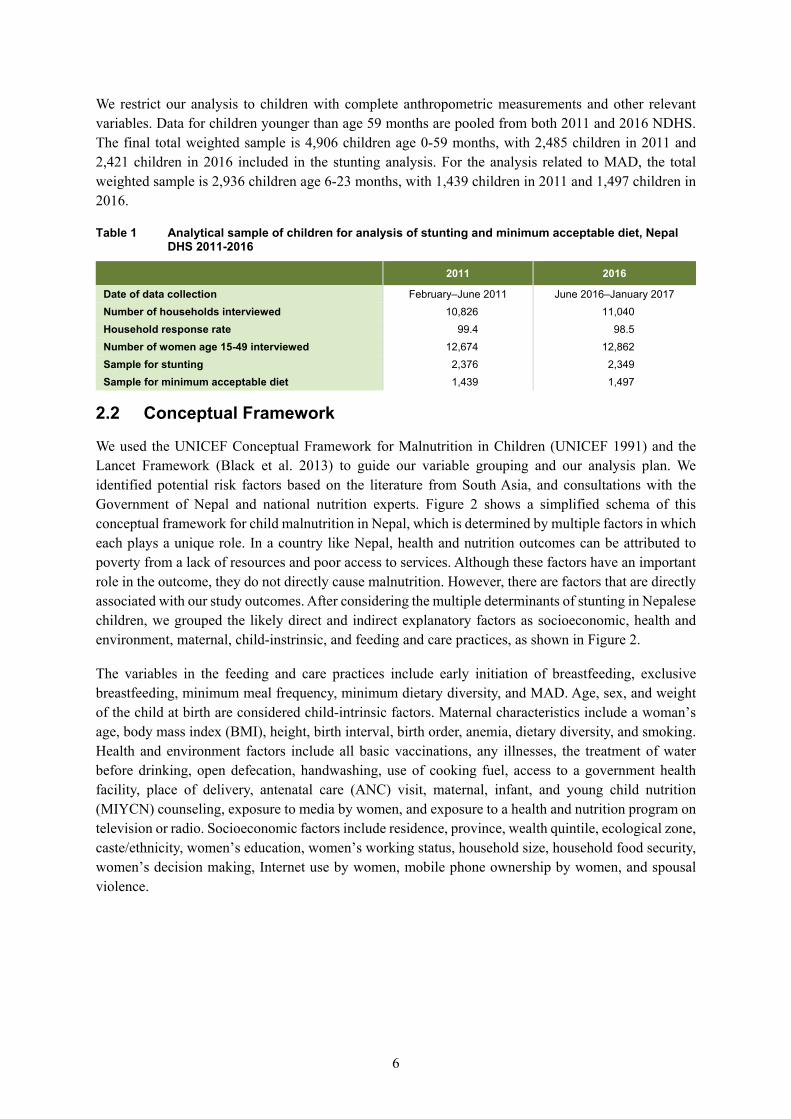
Table 1 Analytical sample of children for analysis of stunting and minimum acceptable diet, Nepal DHS 2011-2016 .............................................................. 6
Table 2 District categorization by different nutrition program interventions .................... 11
Table 3 Distribution and patterns of covariates in study population, Nepal DHS 2011-2016 .......................................................................................................... 14
Table 4 Trends in stunting across key explanatory variables, Nepal DHS 2011-2016 ................................................................................................................... 17
Table 5 Distribution of stunting across child-instrinsic factors, Nepal DHS 2016 ........... 18
Table 6 Distribution of stunting across maternal factors, Nepal DHS 2016 ................... 19
Table 7 Distribution of stunting across infant and young child feeding factors, Nepal DHS 2016 ................................................................................................ 20
Table 8 Distribution of stunting across health and environment factors, Nepal DHS 2016 ................................................................................................................... 21
Table 9 Distribution of stunting across socioeconomic factors, Nepal DHS 2016 .......... 23
Table 10 Association of stunting and child-instrinsic, maternal, infant and young child feeding, health and environment and socioeconomic factors. Results from separate multiple logistic regressions, Nepal DHS 2016 .......................... 25
Table 11 Trends in minimum acceptable diet among children age 6-23 months by key explanatory variables, Nepal DHS 2011-2016 ............................................ 32
Table 12 Distribution of minimum acceptable diet across child-instrinsic factors, Nepal DHS 2016 ................................................................................................ 34
Table 13 Distribution of minimum acceptable diet across maternal factors, Nepal DHS 2016 .......................................................................................................... 34
Table 14 Distribution of minimum acceptable diet across health and environment factors, Nepal DHS 2016 ................................................................................... 35
Table 15 Distribution of minimum acceptable diet across socioeconomic status factors, Nepal DHS 2016 ................................................................................... 37
Table 16 Association of minimum acceptable diet and child-instrinsic, maternal, health and environment, and socioeconomic factors. Results from multiple logistic regression, Nepal DHS 2016 ................................................................. 38


vii
FIGURES
Figure 1 Major milestones for nutrition policies and programs in Nepal, 2009-2016 ......... 2
Figure 2 Conceptual framework for stunting among children age 0-59 months ................ 7
Figure 3 Conceptual framework for minimum acceptable diet among children age 6-23 months ....................................................................................................... 10
Figure 4 Distribution of child height-for-age z-score (HAZ), Nepal DHS 2011-2016 ....... 15
Figure 5 Distribution of child height-for-age z-score (HAZ) by age of children,Nepal DHS 2011-2016 ................................................................................................. 16
Figure 6 Key child-instrinsic determinants of stunting in children age 0-59 months; adjusted odds ratios (ORs) with 95% confidence intervals (CIs), Nepal DHS 2016 .......................................................................................................... 27
Figure 7 Key maternal determinants of stunting in children age 0-59 months; adjusted odds ratios (ORs) with 95% confidence intervals (CIs), Nepal DHS 2016 .......................................................................................................... 27
Figure 8 Key health and environment determinants of stunting in children age 0-59 months; adjusted odds ratios (ORs) with 95% confidence intervals (CIs), Nepal DHS 2016 ................................................................................................ 28
Figure 9 Key socioeconomic determinants of stunting in children age 0-59 months; adjusted odds ratios (ORs) with 95% confidence intervals (CIs), Nepal DHS 2016 .......................................................................................................... 29
Figure 10 Minimum acceptable diet by province, Nepal DHS 2016 .................................. 33
Figure 11 Distribution of minimum acceptable diet in children across age, Nepal DHS 2016 .......................................................................................................... 33
Figure 12 Key child-instrinsic determinants of minimum acceptable diet in children age 6-23 months; adjusted odds ratios (ORs) with 95% confidence intervals (CIs), Nepal DHS 2016 ........................................................................ 40
Figure 13 Key maternal determinants of minimum acceptable diet in children age 6-23 months; adjusted odds ratios (ORs) with 95% confidence intervals (CIs), Nepal DHS 2016 ...................................................................................... 41
Figure 14 Key health and environment determinants of minimum acceptable diet in children age 6-23 months; adjusted odds ratios (ORs) with 95% confidence intervals (CIs), Nepal DHS 2016 ..................................................... 42
Figure 15 Key socioeconomic determinants of minimum acceptable diet in children age 6-23 months; adjusted odds ratios (ORs) with 95% confidence intervals (CIs), Nepal DHS 2016 ........................................................................ 43

ix
FOREWORD
The 2016 Nepal Demographic and Health Survey (NDHS) is the fifth nationally representative comprehensive survey conducted as part of the worldwide Demographic and Health Surveys (DHS) Program in the country. The survey was implemented by New ERA under the aegis of the Ministry of Health and Population (MoHP). Technical support for this survey was provided by ICF, with financial support from the United States Agency for International Development (USAID) through its mission in Nepal, and support for report production came from the United Nations Population Fund (UNFPA).
The standard format of the survey final report included only a descriptive presentation of findings and trends, and did not include analytical methods that can ascertain the significance of change and association among variables. Although largely sufficient, the final report is limited, particularly in providing answers to “why” questions – answers that are essential in reshaping important policies and programs. After the dissemination of the NDHS 2016, the MoHP and its partners convened and agreed on key areas that are necessary for assessing progress, gaps, and determinants in high-priority public health programs being implemented by the MoHP. In this context, seven further analysis studies have been conducted by technical professionals from the MoHP and its partners who work directly on the given areas, with technical support and facilitation from research agencies.
The primary objective of the further analysis of the 2016 NDHS is to provide more in-depth knowledge and insights into key issues that emerged from the survey. This information provides guidance for planning, implementing, refocusing, monitoring, and evaluating health programs in Nepal. The long-term objective of the further analysis is to strengthen the technical capacity of local institutions and individuals for analyzing and using data from complex national population and health surveys to better understand specific issues related to country need.
The further analysis of the 2016 NDHS is the concerted effort of many individuals and institutions, and it is with great pleasure that I acknowledge the work involved in producing this useful document. The participation and cooperation of the members of the Technical Advisory Committee in the different phases of the survey are highly valued. I would like to extend my appreciation to USAID/Nepal for providing financial support for the further analyses. I would also like to acknowledge ICF for its technical assistance at all stages. My sincere thanks also go to the New ERA team for the overall management and coordination of the entire process. I would also like to thank the Public Health Administration Monitoring and Evaluation Division, as well as the Policy Planning and Monitoring Division, MoHP, for their efforts and dedication to the completion of this further analysis of the 2016 NDHS.
Dr. Pushpa Chaudhary Secretary Ministry of Health and Population


xi
ACKNOWLEDGMENTS
The further analysis of the 2016 NDHS was conducted under the aegis of the Public Health Administration Monitoring and Evaluation Division (PHAMED) of the Ministry of Health and Population (MoHP). The United States Agency for International Development (USAID) provided financial support, with technical assistance provided by ICF. Additional support for report production was provided by the United Nations Population Fund (UNFPA). Overall coordination, facilitation, administration, and logistic support were provided by New ERA, a local research firm with extensive experience in conducting similar studies. The secondary analysis of the 2016 NDHS data has been conducted by technical professionals from the MoHP and Department of Health Services, USAID, and other partners who work directly on the given areas, with technical support and facilitation from ICF and New ERA.
I would like to express my deep appreciation for the contributions of many different stakeholders and for their valuable input in the various phases of the study and the final report. My sincere gratitude goes to all members of the National Monitoring and Evaluation Technical Advisory Group at MoHP for their valuable input. I appreciate the leadership of Mr. Giri Raj Subedi, Sr. Public Health Administrator, and the entire team of the Policy Planning and Monitoring Division, PHAMED, and the Child Health Division for their contributions during the different phases of the study.
My special gratitude goes to the authors, Mr. Sumit Karn, Mr. Debendra Adhikari, Mr. Naveen Paudyal, Mr. Basundhara Aryal, Dr. Ramesh Kant Adhikari, and Ms. Mona Mehta Steffen, for their hard work in completing this report. I would also like to express my deep appreciation to the peer reviewers, Ms. Rukundo Benedict (ICF), Ms. Sabita Tuladhar (USAID), Ms. Pooja Pandey (Suaahara II), and Mr. Raj Kumar Pokharel (MoHP) for their time and efforts.
The technical support provided by ICF is highly appreciated and acknowledged. My special thanks go to Ms. Mona Mehta Steffen and Dr. Kerry MacQuarrie for their technical support throughout the period.
My appreciation goes to the staff of New ERA, Mr. Yogendra Prasai, and the entire team of New ERA for excellently managing the further analysis activities.
Dr. Bikash Devkota Chief, Policy Planning and Monitoring Division Ministry of Health and Population


xiii
ABSTRACT
In the changing governance structure, it is crucial to assess the impact of intensive investment in nutrition policy and programming on improved child nutritional outcome and feeding practices in the country and to guide the government in future policy and programming based on the evidence. This study uses data collected from the 2011 and 2016 Nepal Demographic and Health Surveys (DHS) to examine stunting and minimum acceptable diet as the key nutritional outcomes. We used descriptive analysis to see the change in distribution from 2011 to 2016, chi-square tests to detect association, and applied logistic regression with 2016 data using Stata version 15.1.
Nepal has reduced the prevalence of stunting and improved recommended complementary feeding practices, especially among the disadvantaged groups in the past 5 years. Yet, inequities exist across socioeconomic and sociogeographic areas. The child-intrinsic determinants of stunting are age and low weight of child. Among health and environmental determinants, access to the government health facility is associated with stunting while receiving all basic vaccines, handwashing with soap and water, and access to media protect against stunting. Socioeconomic determinants of stunting are province and household size, while wealth quintile and mother’s education are protective factors. For minimum acceptable diet (MAD), the only child-intrinsic determinant is age of child. Maternal determinants of MAD are mothers’ age and dietary diversity score. Health and environmental determinants of MAD are open defecation free (ODF); handwashing with soap and water; maternal, infant, and young child nutrition (MIYCN) counselling; and districts with nutrition-intensive programming. The socioeconomic determinants of MAD are province; residence; wealth quintile; caste/ethnicity; and mother’s education. Current determinants show there is a need to strengthen and scale up a tailored multisectoral approach with an integrated package of nutrition-specific and nutrition-sensitive interventions across sectors, namely health; water, sanitation, and hygiene (WASH); agriculture; and education.
KEY WORDS: stunting, minimum acceptable diet, inequity, Nepal


xv
ACRONYMS AND ABBREVIATIONS
AFSP Agriculture and Food Security Project ANC antenatal care aOR adjusted odds ratio ARI acute respiratory infection
BMI body mass index
CCG child cash grant CI confidence interval
DHS Demographic and Health Survey DoHS Department of Health Services
EA enumeration area EBF exclusive breastfeeding EHA essential hygiene actions
FANTA Food and Nutrition Technical Assistance FAO Food and Agriculture Organization
GAFSP Global Agriculture and Food Security Program GIS geographic information system
HAZ height-for-age z-score HFIAS Household Food Insecurity Access Scale HFP homestead food production
ICN2 International Conference on Nutrition II ICT information and communication technology IMAM integrated management of acute malnutrition IYCF infant and young child feeding
KISAN knowledge-based integrated sustainable agriculture in Nepal
M&E monitoring and evaluation MAD minimum acceptable diet
MCH/FP maternal and child health/family planning MIYCN maternal, infant, and young child nutrition MoHP Ministry of Health and Population MSNP Multi-Sector Nutrition Plan
NDHS Nepal Demographic and Health Survey NHSP Nepal Health Sector Plan NPC National Planning Commission
ODF open defecation free OR odds ratio

xvi
PAHAL Promoting Agriculture, Health, and Alternative Livelihoods PPMD Policy, Planning and Monitoring Division PSU primary sampling unit
SAARC South Asian Association for Regional Cooperation SABAL Sustainable Action for Resilience and Food Security SDG sustainable development goal SUN scaling up nutrition
UNICEF United Nations Children’s Fund uOR unadjusted odds ratio USAID United States Agency for International Development
VIP ventilated improved pit latrine
WASH water, sanitation, and hygiene WB World Bank WHA World Health Assembly WHO World Health Organization

1
1 BACKGROUND
1.1 Introduction
Nepal has made a clear commitment to address undernutrition and micronutrient deficiencies. Meanwhile, the prevalence of stunting in children has declined over the past decade (Ministry of Health–MOH/Nepal, New ERA/Nepal, and ICF 2017). In 2012, the World Health Assembly (WHA) established six key nutrition-related targets to be achieved by 2025 when it endorsed a Comprehensive Implementation Plan on Maternal, Infant, and Young Child Nutrition (WHO 2014). The Sustainable Development Goal (SDG) 2.2 targets the end of all forms of malnutrition by 2030, including achieving, by 2025, the internationally agreed targets on stunting and wasting in children under age 5, and addressing the nutritional needs of adolescent girls, pregnant and lactating women, and older persons (United Nations 2015). As a signatory of the global Scaling Up Nutrition (SUN) movement and the WHA Assembly Resolution, Nepal endorsed the globally recommended, multi-sector approach for nutrition, which aims to accelerate the reduction in stunting in the next 5 years. The endorsed plan provides policy guidance and a framework for increased attention to and investment in nutrition interventions that can have a great impact on reducing stunting among children younger than age 5 with a targeted focus on the first 1,000 days of life (National Planning Commission 2012). The national Nepalese nutrition targets are aligned with the global nutrition targets (Ministry of Health and Population 2015b).
Nepal placed a high priority on improving child nutrition in its Multi-Sector Nutrition Plan 2013-2017. The country has prioritized implementing and scaling up evidence-based interventions that address undernutrition and micronutrient deficiencies within a multi-sector framework, which involves six key sectors: health; agriculture; education; local development; water, sanitation, and hygiene; and women and child welfare. Nepal has recently reformed its sociopolitical structure to adopt a federal form of governance with seven provinces and 753 rural and urban municipalities. In 2017, Nepal renewed its commitments to nutrition through the endorsement of the Multi-Sector Nutrition Plan II for 2018-22.
1.2 Policy Landscape for Nutrition in Nepal
Recent years have seen a concerted effort by the Government of Nepal to review, revise, and develop relevant sector policies for nutrition that ensure coherent, coordinated actions at all levels (National Planning Commission 2017). In 2011, Nepal officially joined the global SUN movement. This led the National Planning Commission (NPC), with the support of development agencies, to develop a comprehensive Multi-sector Nutrition Plan (MSNP) that included five key ministries. The MSNP was approved and endorsed by the Council of Ministers in June 2012. The longer-term, 10-year vision of the MSNP is to significantly reduce chronic malnutrition and to ensure overall socioeconomic development in Nepal.
The Government of Nepal, with support from its development partners, also initiated the implementation of many large-scale, multi-sector, integrated nutrition projects and programs under the common framework of the MSNP. In 2011, 2012, and 2013, Nepal began projects entitled Suaahara, KISAN (Knowledge-based Integrated Sustainable Agriculture in Nepal), and SABAL (Sustainable Action for Resilience and Food Security), which are supported by USAID; Sunaula Hazar Din (supported by the World Bank); Maternal and Young Child Nutrition Security Initiative in Asia (2011-2015) and Partnership for Improved Nutrition (Poshanka Lagi Hatemalo) in Nepal (2016-2019), supported by the European Union and UNICEF; and the Agriculture and Food Security Project, which

2
is funded by the Global Agriculture and Food Security Program (GAFSP) (National Planning Commission 2014). Simultaneously, the health sector prioritized nutrition and emphasized the need for a multi-sector approach to implementing policies and strategies (Ministry of Health and Population 2015a, 2017). In 2015, the Ministry of Health and Population (MoHP) approved the establishment of a National Nutrition Center; however, it has not been established yet. In addition, the health sector drafted two key national strategies, Infant and Young Child Feeding (IYCF) and Maternal Nutrition, which focus on the crucial window from conception until age 2.
Figure 1 Major milestones for nutrition policies and programs in Nepal, 2009-2016
The health sector has implemented priority interventions such as IYCF counseling, integrated management of severe malnutrition, and the distribution of multiple micronutrient powder for children, and has also strengthened the nutrition indicators in the routine health management information system (Department of Health Services 2017). In all policies and programs, the Government of Nepal, with support from its development partners, has focused on strengthening the community service delivery mechanism, improving local governance, enhancing coordination and leadership, and improving monitoring and evaluation. The Government has also demonstrated its explicit commitment to addressing disparities and inequities in concurrence with the SDG 2030 agenda of ‘Leave no one behind’ through the implementation of nutrition interventions that reduce stunting.
The 2009-10 Nutrition Assessment and Gap Analysis Report recommended adopting a multi-sector approach that involved key sectors in improving nutritional status. In response, a landmark commitment was made by the Government of Nepal and its development partners in the Multi-sector Nutrition Plan 2012-17. This plan identified nutrition as a key factor for socioeconomic and human capital development and established the importance of nutrition investments that created integrated, large-scale, multi-sector projects with high-impact nutrition programs throughout the country. More than 200 million U.S. dollars have been invested in Nepal for nutrition programs during the past 5 years (National Planning Commission 2017). Thus, it is important to assess the impact of nutrition activities on child nutritional and feeding status in the country and to understand the factors that influenced any change.
2009 20112011 20122012 20132013 2014 2015 2017
Nutrition Assessment and Gap Analy sis
Nepal joined SUN Movement
Suaahara Program Launched in 25 districts
MSNP endorsed by the cabinet
Suanaula Hazar Din launched
EU/UNICEF Supported MSNP
AFSP launchedSuaahara expanded in 5 districts
SABAL launched
National IYCF Strategy
Suaahara expanded in 16 districts
National Maternal Nutrition Strategy MSNP-II Endorsed

3
1.3 Approach for the Study
Stunting is an indicator in the monitoring framework for the National Development Plan, the WHA target, and SDG number 2. Further reduction in stunting and improvement in the coverage of nutrition interventions are necessary to continue improving early childhood growth and development. A clear identification of what worked and where it worked helps the implementing agencies devise appropriate strategies, determine investments, and track results.
In this context, the MoHP of the Government of Nepal commissioned further analysis of NDHS data related to nutrition. This further analysis study was planned in consultation with government agencies and key nutrition development partners to determine its scope and to identify the appropriate indicators for analysis. This study examines stunting and minimum acceptable diet (MAD) as key nutritional outcomes. Stunting was selected unanimously as an outcome because the Government of Nepal has identified stunting as the key outcome indicator for the Multi-sector Nutrition Plan II. It is also the main indicator for the 2025 WHA nutrition target. This report is intended for policymakers, program managers, and concerned stakeholders who are working in the field of child nutrition in Nepal.

5
2 DATA AND METHODS
2.1 DHS Data
This further analysis uses data collected from the Nepal 2011 and 2016 Demographic and Health Surveys (DHS). The NDHS is a nationally representative, cross-sectional survey that provides regular, periodic estimates of maternal and child health, nutrition, fertility, family planning, malaria, HIV/AIDS, and other country-specific health and population issues. The DHS Program, funded by the USAID, is globally recognized for its collection and dissemination of health and population trends in over 90 developing countries. The DHS Program is implemented worldwide by ICF, while the Nepal DHS is implemented in-country by New ERA with technical support from ICF. The DHS Survey in Nepal is part of a national survey conducted by the MoHP of the Government of Nepal.
The DHS survey in Nepal used multi-stage cluster sampling to obtain a nationally representative sample of households. The methodology for the DHS surveys is detailed elsewhere (Ministry of Health – MOH/Nepal, New ERA/Nepal, and ICF 2017; Ministry of Health Population – MOHP/Nepal, New ERA/Nepal, and ICF International 2012). In the 2011 survey, the country was divided into 13 domains1 with 5 development regions and 3 ecological zones. Both surveys have used the primary sampling unit (PSU) as sub-ward, ward, or group of wards in the rural areas, and sub-wards in the urban areas. During the 2011 survey, at the first stage of sampling, 289 PSUs (95 in urban areas and 194 in rural areas) were selected by systematic sampling with probability proportional to size. In the second stage, 40 households per PSU in rural areas and 35 households per PSU in urban areas were randomly selected. In contrast, the 2016 DHS used seven provinces in rural and urban areas, which yielded 14 domains. Wards in the rural areas and the wards and sub-wards (old-ward) in the urban areas were used as the PSU. One enumeration area (EA) was selected from each PSU in urban areas. In the first stage, 383 PSUs were selected with the probability proportional to ward size and with independent selection in each sampling stratum. Due to the large size of the urban wards, a ward, an EA, or a segment of a ward was considered a cluster. In the last stage of selection, a fixed number of 30 households per cluster was selected with an equal probability of systematic selection from the newly created household listing.
Since Nepal has recently transitioned to a federal governance structure, trend analysis of outcomes by provinces is useful. We created a province variable for the 2011 DHS data set by merging a newly created data file. This involved using geographic information system (GIS) coordinates with technical support from the GIS expert at ICF. It is important to note that samples from the 2011 survey were not designed to provide estimates for the new provinces. Therefore, the samples created after the data were merged may not be representative of the population in the new provinces. However, any concerns about representativeness are mitigated by the fact that the sample size for each survey is large and robust, and this supports using province at the analytical unit level.
All women of reproductive age (age 15-49) who were members of a sampled household or who had slept there the night before the survey were eligible for an interview. All children age 0-59 months and women of reproductive age in the households were measured for height and weight. Well-trained field staff measured the recumbent length of children age 2 or younger, or those who were shorter than 85 cm, and the standing height of the older children.
1 Due to the small population size in the mountain regions, the Western, Mid-western, and Far-western mountain regions are combined into one domain, which yielded a total of 13 domains.
6
We restrict our analysis to children with complete anthropometric measurements and other relevant variables. Data for children younger than age 59 months are pooled from both 2011 and 2016 NDHS. The final total weighted sample is 4,906 children age 0-59 months, with 2,485 children in 2011 and 2,421 children in 2016 included in the stunting analysis. For the analysis related to MAD, the total weighted sample is 2,936 children age 6-23 months, with 1,439 children in 2011 and 1,497 children in 2016.
Table 1 Analytical sample of children for analysis of stunting and minimum acceptable diet, Nepal DHS 2011-2016
2011 2016
Date of data collection February–June 2011 June 2016–January 2017 Number of households interviewed 10,826 11,040 Household response rate 99.4 98.5 Number of women age 15-49 interviewed 12,674 12,862 Sample for stunting 2,376 2,349 Sample for minimum acceptable diet 1,439 1,497
2.2 Conceptual Framework
We used the UNICEF Conceptual Framework for Malnutrition in Children (UNICEF 1991) and the Lancet Framework (Black et al. 2013) to guide our variable grouping and our analysis plan. We identified potential risk factors based on the literature from South Asia, and consultations with the Government of Nepal and national nutrition experts. Figure 2 shows a simplified schema of this conceptual framework for child malnutrition in Nepal, which is determined by multiple factors in which each plays a unique role. In a country like Nepal, health and nutrition outcomes can be attributed to poverty from a lack of resources and poor access to services. Although these factors have an important role in the outcome, they do not directly cause malnutrition. However, there are factors that are directly associated with our study outcomes. After considering the multiple determinants of stunting in Nepalese children, we grouped the likely direct and indirect explanatory factors as socioeconomic, health and environment, maternal, child-instrinsic, and feeding and care practices, as shown in Figure 2.
The variables in the feeding and care practices include early initiation of breastfeeding, exclusive breastfeeding, minimum meal frequency, minimum dietary diversity, and MAD. Age, sex, and weight of the child at birth are considered child-intrinsic factors. Maternal characteristics include a woman’s age, body mass index (BMI), height, birth interval, birth order, anemia, dietary diversity, and smoking. Health and environment factors include all basic vaccinations, any illnesses, the treatment of water before drinking, open defecation, handwashing, use of cooking fuel, access to a government health facility, place of delivery, antenatal care (ANC) visit, maternal, infant, and young child nutrition (MIYCN) counseling, exposure to media by women, and exposure to a health and nutrition program on television or radio. Socioeconomic factors include residence, province, wealth quintile, ecological zone, caste/ethnicity, women’s education, women’s working status, household size, household food security, women’s decision making, Internet use by women, mobile phone ownership by women, and spousal violence.

7
Figu
re 2
C
once
ptua
l fra
mew
ork
for s
tunt
ing
amon
g ch
ildre
n ag
e 0-
59 m
onth
s
Heal
th a
nd
Envi
ronm
ent F
acto
rs
Stun
ting i
n Chi
ldre
n(0
-59 m
onth
s)
Early
initi
atio
n of
bre
astfe
edin
gEx
clusiv
e br
east
feed
ing
Min
imum
mea
l fre
quen
cyM
inim
um d
ieta
ry d
ivers
ityM
inim
um a
ccep
tabl
e di
et
Age
of m
othe
rBM
I of m
othe
rHe
ight
of m
othe
rAn
emia
in m
othe
rBi
rth
inte
rval
Birt
h or
der
Mot
her’s
die
tary
dive
rsity
Mot
her’s
smok
ing
stat
us
Resid
ence
, Pro
vince
, Hou
seho
ld w
ealth
qui
ntile
, Eco
logi
cal z
one,
Cas
te/e
thni
city,
Mot
her’s
ed
ucat
ion,
Mot
her’s
wor
king
stat
us, H
ouse
hold
size
, Mot
her’s
dec
ision
mak
ing,
Inte
rnet
use
by
mot
her,
Mob
ile o
wne
d by
mot
her,
Expe
rienc
e of
spou
sal v
iole
nce
Basic
vacc
inat
ions
Any
illnes
s in
chi
ldre
nTr
eatm
ent o
f wat
er be
fore
drin
king
Open
def
ecat
ion
Hand
was
hing
Use
of co
okin
g fu
elAc
cess
to g
over
nmen
t hea
lth fa
cility
Plac
e of
del
ivery
ANC
visit
MIY
CNco
unse
ling
Mot
her’s
med
ia e
xpos
ure
Expo
sure
to T
V/ra
dio
heal
th a
nd n
utrit
ion
prog
ram
Nutr
ition
inte
nsive
pro
gram
dist
rict
Hous
ehol
d fo
od
secu
rity
Age
of c
hild
Sex
of ch
ildW
eigh
t of c
hild
at b
irth
Socio
-Eco
nom
icFa
ctor
s
Mat
erna
l Fa
ctor
s
Child
Intr
insic
Fact
ors

8
We coded stunting into a binary variable with 1 as stunted and 0 as not stunted. The standard DHS datasets include a variable for children’s height-for-age standard deviation, which is the number of standard deviation units from the median height among children at that age, according to the new WHO Child Growth Standards (WHO 2015). The measures in the data file are presented with two decimal places. We divided the variable by 100 to obtain the actual measure of the z-score (HAZ). A z-score less than -2 was considered stunting.
Age of children in months was grouped into 0-11, 12-23, 24-35, 36-47, and 48-59-month categories. The weight of child at birth was re-coded into small (<2.5kg), normal (2.5-3.49 kg), and large (3.5 kg or more). Age of women in years was categorized as 15-24, 25-34, and 35-49. The BMI of women was divided into three categories: underweight (<18.5), normal (18.5-24.9), and overweight/obese (≥25). Height of women was divided into two categories: less than 145 cm (stunted) and 145 cm or more (normal). Anemia in women was categorized as either anemic or non-anemic. Birth interval was grouped into less than 3 years and 3 years or more or no preceding interval (for first order births). Birth order was re-coded into three categories: first born, second to fourth, and fifth or more. Women’s dietary diversity score was calculated by grouping all food groups consumed by women into fewer than 5 food groups and 5 or more food groups, according to the FANTA/FAO guidelines (FAO and FHI360 2016). Women’s smoking status was grouped as smoking and nonsmoking. Indicators for IYCF were represented by dichotomous variables that indicated whether or not the child was fed per recommended practice for each variable. The variables included early initiation of breastfeeding (proportion of infants age 0-23 months who were breastfed within 1 hour of birth); exclusive breastfeeding (the proportion of infants age 0-5 months fed only breast milk); minimum meal frequency (proportion of breastfed and non-breastfed children age 6-23 months who receive solid, semisolid, or soft foods, including milk feeds for non-breastfed children, the minimum number of times or more); minimum dietary diversity (proportion of children age 6-23 months who received four or more food groups); and MAD (proportion of children age 6-23 months who received four or more food groups and a minimum meal frequency).
Vaccinations (proportion of children age 12-23 months who received all doses of basic vaccines) and any illnesses (children with acute respiratory infection (ARI), diarrhea, or fever) were categorized as dichotomous variables. Households with no toilet facility or those that use the bush or field for defecation were categorized as open defecation.2 Cooking fuel was categorized as solid and clean fuel.3 Handwashing was grouped as household with and without soap, water, or cleansing agents. Access to a government health facility was grouped into <30 minutes, 30-60 minutes, and over 60 minutes. Place of delivery was grouped into home/other and health facility. We use a variable categorizing residence in each of Nepal’s seven provinces and use the nomenclature Province 1 – Province 7, since these are the province names that were in effect at the time of the survey.4 Caste/ethnicity was grouped as Brahmin/Chhetri, Terai/Madhesi other caste, Dalit, Newar, Janajati, and Muslim. Women’s working status was categorized into three categories as not working, nonagricultural, and agricultural or self-
2 In this study, open defecation free (ODF) is defined as those households that have a shared or non-shared toilet. The toilets could be flush/pour flush toilets to piped sewer systems, septic tanks, and pit latrines; ventilated improved pit (VIP) latrines; pit latrines with or without slabs; and composting toilets. 3 Solid fuel includes charcoal, wood, straw/shrubs/grass, agricultural crops, and animal dung while clean fuel includes electricity and LPG/natural gas/biogas. 4 Province 4 has since changed its name to Gandaki Province (July 2018), Province 6 to Karnali Province (February 2018), and Province 7 to Sudurpashchim Province (September 2018). The remaining four provinces have not adopted permanent names as of the time of this publication.
9
employed. The household size was re-coded as more or less than 4. Household food security was grouped into food secure, mild, moderate, and severe food insecurity.
We generated a composite variable for women’s decision making by using three variables: women can refuse sex, can decide about their own health care, and can decide on the use of contraception. This variable is represented by two categories: a woman can or cannot make decisions about any of the three variables. Internet use by women was represented by use of Internet in previous 12 months or not. Similarly, experience of spousal violence is divided into two groups: women who were or were not experiencing either physical, sexual, or spousal violence.
For the MAD (Figure 3), the analysis is restricted to children age 6-23 months, with independent variables that include child-instrinsic, maternal, health and environment, and socioeconomic groups as previously defined. The analysis is based on the conceptual framework above. We removed some independent variables such as indicators related to IYCF, which were not relevant for the analysis. Age of the child was re-coded into either age 6-11 or 12-23 months. Household food security was grouped as food secure and food insecure due to the small sample size. Categorization for the other variables was the same as those used in the stunting analysis.

10
Figu
re 3
C
once
ptua
l fra
mew
ork
for m
inim
um a
ccep
tabl
e di
et a
mon
g ch
ildre
n ag
e 6-
23 m
onth
s
Heal
th a
nd
Envi
ronm
ent F
acto
rs
Min
imum
Acc
epta
ble D
iet i
n Chi
ldre
n(6
-23 m
onth
s)
Age
of m
othe
rAn
emia
in m
othe
rBi
rth
inte
rval
Birt
h or
der
Mot
her’s
die
tary
dive
rsity
Resid
ence
, Pro
vince
, Hou
seho
ld w
ealth
qui
ntile
, Eco
logi
cal z
one,
Cas
te/e
thni
city,
Mot
her’s
ed
ucat
ion,
Mot
her’s
wor
king
stat
us, H
ouse
hold
size
, Mot
her’s
dec
ision
mak
ing,
Inte
rnet
use
by
mot
her,
Mob
ile o
wne
d by
mot
her,
Expe
rienc
e of
spou
sal v
iole
nce
Any
illnes
s in
chi
ldre
nTi
me
to o
btai
n dr
inkin
g w
ater
Open
def
ecat
ion
Hand
was
hing
Use
of co
okin
g fu
elAc
cess
to g
over
nmen
t hea
lth fa
cility
Plac
e of
del
ivery
ANC
visit
MIY
CNco
unse
ling
Mot
her’s
med
ia e
xpos
ure
Expo
sure
to T
V/ra
dio
heal
th a
nd n
utrit
ion
prog
ram
Nutr
ition
inte
nsive
pro
gram
dist
rict
Hous
ehol
d fo
od
secu
rity
Age
of c
hild
Sex
of ch
ildW
eigh
t of c
hild
at b
irth
Socio
-Eco
nom
icFa
ctor
s
Mat
erna
l Fa
ctor
s
Child
Intr
insic
Fa
ctor
s
11
2.3 District Categorization of Nutrition Programming
The Government of Nepal has been implementing regular nutrition-specific and -sensitive interventions through its health and non-health sector networks and community outreach with female community health volunteers, farmer groups, teachers, students, and consumer groups. The interventions include iron and folic acid supplementation to pregnant and lactating women, growth monitoring and promotion, control of parasitic infestation by deworming, and Vitamin A supplementation to women and children. Since 2007 and 2008, the Nutrition Section of the MoHP decided to implement IYCF programs with support from development partners across all 75 districts of the country. After the MSNP was endorsed in 2012, Nepal experienced increased investment in nutrition. Different development partners began implementing multi-sector integrated projects and programs in different parts of the country. In 2012, USAID began an integrated nutrition project “Suaahara – good nutrition” first in 20 districts and then in 40 districts across the country. Other projects such as USAID’s KISAN, SABAL and PAHAL were also implemented. Likewise, UNICEF supported the Government of Nepal for implementation of programs, namely IMAM, IYCF linked with MNP, and Child Cash Grant. The World Bank supported the implementation of the Agriculture and Food Security Project and Sunaula Hazar Din.
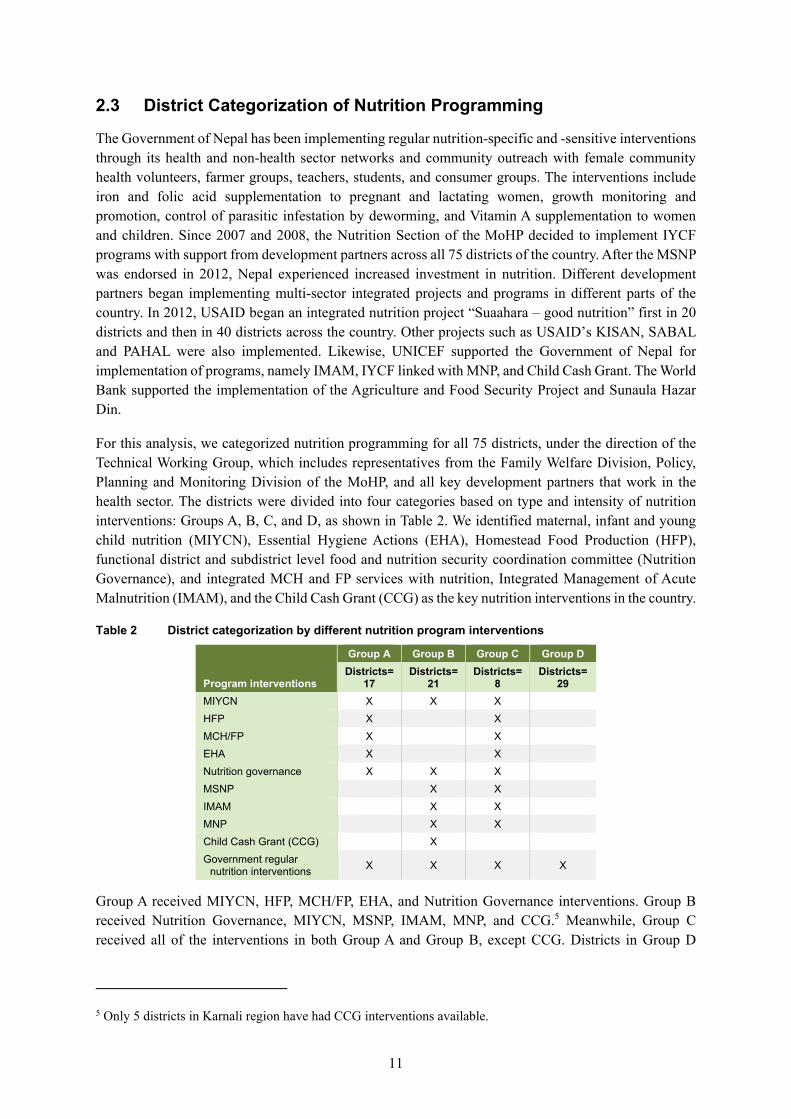
For this analysis, we categorized nutrition programming for all 75 districts, under the direction of the Technical Working Group, which includes representatives from the Family Welfare Division, Policy, Planning and Monitoring Division of the MoHP, and all key development partners that work in the health sector. The districts were divided into four categories based on type and intensity of nutrition interventions: Groups A, B, C, and D, as shown in Table 2. We identified maternal, infant and young child nutrition (MIYCN), Essential Hygiene Actions (EHA), Homestead Food Production (HFP), functional district and subdistrict level food and nutrition security coordination committee (Nutrition Governance), and integrated MCH and FP services with nutrition, Integrated Management of Acute Malnutrition (IMAM), and the Child Cash Grant (CCG) as the key nutrition interventions in the country.
Table 2 District categorization by different nutrition program interventions
Program interventions
Group A Group B Group C Group D Districts=
17 Districts=
21 Districts=
8 Districts=
29 MIYCN X X X HFP X X MCH/FP X X EHA X X Nutrition governance X X X MSNP X X IMAM X X MNP X X Child Cash Grant (CCG) X Government regular
nutrition interventions X X X X
Group A received MIYCN, HFP, MCH/FP, EHA, and Nutrition Governance interventions. Group B received Nutrition Governance, MIYCN, MSNP, IMAM, MNP, and CCG.5 Meanwhile, Group C received all of the interventions in both Group A and Group B, except CCG. Districts in Group D
5 Only 5 districts in Karnali region have had CCG interventions available.

12
received regular nutrition programs6 implemented by the government. Groups A, B, and C also received regular government nutrition interventions. According to the defined criteria, 17 districts were included in Group A, 21 districts in Group B, 8 districts in Group C, and 29 districts in Group D. See Appendix Table A1 for a list of districts in each group.
Before data collection, Group A had intervention exposure to a set of nutrition interventions (MIYCN, EHA, HFP, Nutrition Governance and MCH/FP) for 2.5 years. Group B received interventions (Nutrition Governance, MIYCN, IMAM and CCG) for approximately 2 years except for five districts in Karnali that received more than 5 years of CCG interventions. Districts in Group C had exposure to both set of interventions in Groups A and B. All groups were exposed to government-supported regular nutrition interventions, although only Group D did not receive additional interventions beyond the regular nutrition interventions.
2.4 Statistical Analysis
This study uses data from the household member recode data file (PR) for stunting and the children’s recode data file (KR) for MAD, with additional variables merged from the women’s recode file (IR) of the 2016 DHS for descriptive statistics, and the bivariate and multivariate regression analyses. For the assessment of changes in stunting by key socioeconomic variables, we used the modified PR dataset from 2011 with the province variable added and merged it with the KR and IR File. Likewise, the 2016 data file with the merged KR, PR, and IR files was created and appended with the 2011 merged file.
We expressed the dependent variables (stunting and MAD) as dichotomous variables with stunting as either stunted or not stunted, and MAD as children fed or not fed with MAD. We initially ran the descriptive analysis to assess the change in distribution of all variables from 2011 to 2016. Next, using the 2016 dataset, we conducted the bivariate analysis to examine the association between the outcomes with selected explanatory variables. We used the chi-square test to detect associations between each of the explanatory variables with the outcomes.
We used logistic regression analysis to assess the association between stunting and MAD with each independent variable separately. We then regressed stunting and MAD on the child-instrinsic, maternal, health and environment, and socioeconomic variables separately. We also regressed stunting on the IYCF variables as well.
All data were analyzed using Stata version 15.1. Standard Stata analytic commands were used for all analyses. All estimates are weighted. The “svy” command was used to account for the complex survey design (stratification, clustering, and sample weights) and for estimation of summary estimates across all variables. A p-value of less than 0.05 was considered significant.
6 Regular nutrition programs include Growth Monitoring and Promotion, Biannual Vitamin A Supplementation, and IFA supplementation to pregnant and lactating women.

13
3 TRENDS IN OUTCOME AND EXPLANATORY VARIABLES, 2011-2016
We selected a total of 42 independent variables for assessing the determinants of stunting among children age 0-59 months. For MAD, there were 33 variables. A detailed distribution of these variables for 2011 and 2016 of the households with children measured for anthropometry (stunting) is shown in Appendix Table A2. Table 3 shows the distribution of those explanatory variables that showed a significant change in previous 5 years. Nepal continues to be a high-burden country with a stunting prevalence of 36% in 2016, despite the decline from 40% in 2011, which was a reduction of 5 percentage points. The prevalence of overweight/obesity (BMI ≥25) among women has increased by 6 percentage points from 2011 to 2016. A similar trend was shown for anemia in women with an increase of 8 percentage points.
Progress in IYCF practices has been uneven in Nepal. Early initiation of breastfeeding has improved over the years from 44% in 2011 to 54% in 2016, which was an increase of 10 percentage points in the last 5 years. However, within the same period, exclusive breastfeeding (EBF) practices have decreased, with an almost 3 percentage point reduction in the EBF rate (see Appendix Table A2). In 2011, four in five children (78%) were fed according to the recommended times of minimum meal frequency. The practice decreased by 10 percentage points in 2016. Trends in the rate of minimum dietary diversity in children during the study period showed improvement with a percentage point increase of 15 in 2016. Overall, IYCF practices have improved between 2011 and 2016, as reflected in the composite indicator MAD, which increased by 12%.
A total of 19% of households treated their water for drinking in 2016 as compared to 13% in 2011. In 2016, there was a decrease in open defection of more than 25 percentage points with 23% of households practicing open defecation. In 2016, almost 23 percentage points more women went to a health facility for delivery as compared to 2011. There has been an almost 20 percentage point increase in the rate of four or more ANC visits between 2011 and 2016. Households with severe food insecurity dropped by almost 11 points, although households with mild food insecurity increased by almost 11 points from 2011 to 2016.

14
Table 3 Distribution and patterns of covariates in study population, Nepal DHS 2011-2016
2011 2016 Percentage
point change
2016-2011 p-value1 Characteristics % N % N
Stunting No 59.7 1,419 64.4 1,512 4.6 * Yes 40.3 957 35.7 838 -4.6
Minimum acceptable diet No 76.0 1,094 64.3 962 -11.8 *** Yes 24.0 345 35.8 535 11.8
Mother’s BMI Underweight (<18.5) 19.6 464 19.2 450 0.4
*** Normal (18.5-24.9) 71.1 1,683 65.2 1,530 5.9 Overweight/obese (≥25) 9.3 221 15.6 366 -6.3
Mother’s anemia status Anemic 38.1 892 45.7 1,067 7.6 ** Non-anemic 61.9 1,450 54.3 1,267 -7.6
Early initiation of breastfeeding Child was breastfed within 1 hr. of birth 43.7 423 55.4 544 11.7 ** Child was not breastfed within 1 hr. of birth 56.3 545 44.6 438 -11.7
Minimum meal frequency Child was not fed meal with recommended minimum
number of times 21.7 153 31.5 236 9.7 ** Child was fed meal with recommended minimum number of times 78.3 553 68.6 513 -9.7
Minimum dietary diversity Child was not fed with minimum dietary diversity 71.0 502 55.7 417 -15.3 *** Child was fed with minimum dietary diversity 29.0 205 44.3 332 15.3
Treatment of water before drinking No treatment done 87.4 2,076 81.3 1,907 -6.1 ** Treatment done 12.6 300 18.7 439 6.1
Open defecation Open defecation free 51.3 1,219 77.4 1,819 26.1 *** Open defecation 48.7 1,157 22.6 530 -26.1
Place of delivery Home/other 65.7 1,549 42.8 1,001 -22.9 *** Health facility 34.4 810 57.2 1,340 22.9
ANC visit None 16.8 317 5.5 106 11.3
*** 1-3 34.4 647 25.5 489 8.7 4 or more 48.8 919 68.9 1,320 -19.9
Household food security Food secure 43.1 1,024 40.9 961 2.2
*** Mild food insecurity 12.3 292 22.7 534 -10.4 Moderate food insecurity 23.3 553 25.8 606 -2.5 Severe food insecurity 21.3 507 10.6 248 10.8
*** p<0.001, **p<0.01, *p<0.05 1 p-value is the result of a chi-square test of independence between covariate and survey year.

15
4 STUNTING IN CHILDREN AGE 0-59 MONTHS
4.1 Pattern and Distribution of Stunting in 2011 and 2016
Figure 4 shows changes in the distribution of height-for-age z-score (HAZ) from 2011 to 2016 that reflect a parallel rightward shift. The distribution pattern may indicate that the change was observed across the entire distribution, and the rightward shift may indicate that the severity of stunting has also decreased during this period. The significance test to determine any difference in HAZ scores between the two surveys was significant, which indicated possible change between 2011 and 2016 (z=2.602 with the two-tailed p-value 0.009).
Figure 4 Distribution of child height-for-age z-score (HAZ), Nepal DHS 2011-2016
Figure 5 shows patterns of the HAZ score by age of children in 2011 and 2016. The figure indicates how growth of a child falters as their age progresses. The green line shows the 2016 distribution of the HAZ score, while the orange line for 2011 with the shaded area around the lines represents the 95% confidence interval (CI). From the age when child is born (zero month) until the child reaches age 23 months, there is a consistent decline in growth with both the 2011 and 2016 data. Both years’ data show similar patterns for growth faltering until age 23 months, although the growth shows further decline in 2011 and a flattening pattern for 2016 for children close to age 60 months. The graph also shows overlapping confidence intervals of the 2011 and 2016 data for much of the age distribution.

16
Figure 5 Distribution of child height-for-age z-score (HAZ) by age of children, Nepal DHS 2011-2016
Note: “lpoly” command is used to smooth the line for HAZ score by age of children for 2011 and then another line is added using “lpolyci and addplot.”
4.2 Socioeconomic Inequalities in Stunting in 2011 and 2016
The WHO has emphasized that governments should have an explicit, robust commitment to equity, which is crucial to the inclusive growth of a country (WHO 2019). As part of the SDG II, the SUN Movement, the International Conference on Nutrition II (ICN2) Framework for Action, and the WHO MIYCN Plan, Nepal is committed to addressing the factors that influence inequity in malnutrition and ensuring equality for interventions that assure no child will be left behind. Our analysis of the trends of stunting by selected key socioeconomic and sociodemographic variables between 2011 and 2016 is presented in Table 4.

17
Table 4 Trends in stunting across key explanatory variables, Nepal DHS 2011-2016
Characteristics
2011 2016 Percentage point change
2016-2011 p-value % N % N
Age of child (in months) 0-11 17.8 82 16.1 75 -1.8
***
12-17 28.6 76 31.9 74 3.3 18-23 41.9 90 42.3 118 0.4 24-35 52.2 250 45.0 200 -7.3 36-47 53.5 270 39.6 188 -13.9 48-59 42.0 188 40.3 183 -1.6
Sex of child Male 41.2 497 35.5 436 -5.7 * Female 39.3 459 35.8 402 -3.5
Province Province 1 37.0 187 33.1 123 -3.9
*
Province 2 39.9 200 36.6 235 -3.3 Province 3 33.4 104 29.7 105 -3.7 Province 4 35.8 93 28.7 52 -7.1 Province 5 42.4 157 37.8 168 -4.6 Province 6 58.4 92 54.7 82 -3.7 Province 7 46.0 124 35.4 73 -10.6
Household wealth quintile Poorest 56.2 341 49.1 237 -7.0
* Poorer 45.1 218 38.0 194 -7.1 Middle 35.1 194 35.5 189 0.5 Richer 30.0 122 32.5 166 2.6 Richest 25.1 82 16.4 51 -8.7
Ecological zone Mountain 53.1 100 46.5 76 -6.7
*** Hill 41.8 392 32.3 278 -9.5 Terai 37.2 465 36.5 484 -0.6
Caste/ethnicity Brahmin/Chhetri 36.9 268 33.8 218 -3.1
*
Terai/Madhesi other 45.8 105 41.9 199 -3.9 Dalit 46.9 203 39.2 133 -7.7 Newar 30.8 19 21.4 15 -9.4 Janajati 40.6 316 32.3 213 -8.3 Muslim 30.9 45 37.5 61 6.6
Mother’s education No education 47.4 534 45.7 372 -1.7
Primary 41.4 193 36.7 173 -4.7 Some secondary 32.0 148 31.7 179 -0.4 SLC or higher 25.3 81 22.8 114 -2.5
Household size 4 or less 39.2 261 29.0 205 -10.2 *** More than 4 40.7 695 38.5 633 -2.2
Household food security Food secure 33.1 339 29.2 280 -3.9
Mild food insecurity 39.5 115 35.7 191 -3.8 Moderate food insecurity 45.2 250 41.5 252 -3.7 Severe food insecurity 49.8 252 46.3 115 -3.5
Nutrition intervention program district1 Group A 42.0 116 34.6 82 -7.4
Group B 40.2 365 36.6 304 -3.7 Group C 47.9 110 38.3 82 -9.6 Group D 38.0 366 34.6 366 -3.4
1 This variable is created to categorize all districts of Nepal according to nutrition interventions/programs/projects. Districts in Group A received MIYCN, HFP, MCH/FP, EHA, and Nutrition Governance; those in Group B received MIYCN, MSNP, IMAM, MNP, and CCG; while those in Group C had overlapping district with Group A and Group B interventions. Districts under Group D received regular nutrition programs by the government. *** p<0.001, **p<0.01, *p<0.05 The p-value is the result of a chi-square test of independence between covariate and survey year. Stunting has declined between the two surveys among boys (6 percentage points) and among children age 24-47 months (7-14 percentage points), but not among girls or children of other age groups. There was a statistically significant reduction in stunting between 2011 and 2016 of 11 percentage points in

18
Province 7 (Sudurpashchim Province). Stunting has significantly decreased among poorest households. The Hill ecological zone experienced a significant decline in stunting from 42% to 32%. Stunting decreased among the Janajati (8 percentage points) caste/ethnicity group.
For mother’s education, the declines were significant, falling by 5 percentage points among women with primary education. A significant reduction of 10 percentage points was seen among households with four or fewer members. Stunting has declined by 4 percentage points among households with moderate food insecurity. Stunting also declined in districts with Group A and C nutrition interventions, with the largest reduction (10 percentage points) observed in Group C.
4.3 Understanding the Factors behind Stunting in Children (age 0-59 months) in Nepal using DHS 2016 Data
As described in the methodology section, we adopted a modification of the widely used UNICEF Conceptual Framework, which identifies immediate, basic, and underlying causes of undernutrition in children. In this section, we focus on exploring the association of 42 different explanatory variables (categorized as child-instrinsic, maternal, IYCF practices, health and environment, and socioeconomic situation-related characteristics) with stunting as the outcome.
4.3.1 Association of child-intrinsic factors with stunting
Table 5 shows that current age and weight at birth are strongly associated with stunting among children in Nepal (p<0.001). The likelihood of stunting increases with the rise in a child’s age. Sixteen percent of children age 0-11 months are stunted, with the proportion of stunted children increasing to 32% among children age 12-17 months. The proportion of stunting continues to increase until age 35 months, when the proportion of stunting gradually decreases among older children. The proportion of stunting is higher among small birthweight children (47%) than normal and large birthweight children (25%-28%). There is no significant difference in stunting between male and female children.
Table 5 Distribution of stunting across child-intrinsic factors, Nepal DHS 2016
Characteristics % N p-value
Age of child (in months) 0-11 16.1 75
***
12-17 31.9 74 18-23 42.3 118 24-35 45.0 200 36-47 39.6 188 48-59 40.3 183
Sex of child Male 35.5 436 Female 35.8 402
Weight of child at birth Small (<2.5 kg) 46.9 83
*** Normal (2.5-3.49 kg) 28.4 236 Large (≥3.5 kg) 25.2 109
*** p<0.001, **p<0.01, *p<0.05 4.3.2 Association of maternal factors with stunting
Six of eight maternal factors are associated with stunting as shown in Table 6. No significant association with stunting is detected for woman’s age and anemia in women. Child stunting is more common among children born to underweight women (BMI less than 18.5) than those born to normal and overweight women. Almost 45% of children are stunted among underweight women as compared to 24% of children born to overweight/obese women with a BMI greater than 25. The height of women is strongly

19
associated with stunting, with the prevalence of stunting higher among children of women with a height less than 145 cm (59%) than among children of women with a height greater than 145 cm.
Table 6 Distribution of stunting across maternal factors, Nepal DHS 2016
Characteristics % N p-value
Mother’s age 15-24 years 32.6 325
25-34 years 37.2 423 35-49 years 41.5 90
Mother’s BMI Underweight (<18.5) 44.9 192
*** Normal (18.5-24.9) 36.3 489 Overweight/obese (≥25) 24.1 79
Mother’s height Less than 145 cm 58.8 154 *** 145 cm or more 32.7 682
Mother’s anemia Anemic 35.8 382 Non-anemic 35.3 448
Birth interval Less than 3 years 46.0 311
*** 3 years or more or no preceding interval 32.9 255
Birth order First born 30.4 272
*** 2-4 37.4 473 5 or more 48.3 93
Mother’s dietary diversity Less than 5 food groups 38.4 624 *** 5 or more food groups 29.5 213
Mother’s smoking status Smoking 47.8 62 ** Non-smoking 34.9 776
*** p<0.001, **p<0.01, *p<0.05 4.3.3 Association of infant and young child feeding factors with stunting
Analysis of NDHS data shows significant associations of stunting with factors related to breastfeeding but not with those related to complementary feeding. A higher proportion of stunting (30%) is found among the group of children who were not exclusively breastfed.

20
Table 7 Distribution of stunting across infant and young child feeding factors, Nepal DHS 2016
Characteristics % N p-value
Early initiation of breastfeeding Child was breastfed within 1 hr. of birth 25.4 110 Child was not breastfed within 1 hr. of birth 29.1 157
Exclusive breastfeeding Child was exclusively breastfed -- -- ** Child was not exclusively breastfed 29.9 240
Minimum meal frequency Child was fed meal with recommended
minimum number of times 27.8 65
Child was not fed meal with recommended minimum number of times 33.5 171
Minimum dietary diversity Child was fed with minimum dietary diversity 30.3 100
Child was not fed with minimum dietary diversity 32.8 136
Minimum acceptable diet Child was fed with recommended minimum
acceptable diet 31.2 76
Child was not fed with recommended minimum acceptable diet 32.0 160
*** p<0.001, **p<0.01, *p<0.05 -- indicates that a figure is based on fewer than 25 unweighted cases and has been suppressed. Note: For early initiation of breastfeeding, the analysis is done among last-born children who were born in the 2 years preceding the survey. For exclusive breastfeeding, analysis is restricted to youngest children under age 2 who are living with their mother. For complementary feeding-related indicators, the analysis is restricted to the youngest children age 6-23 months living with their mother.
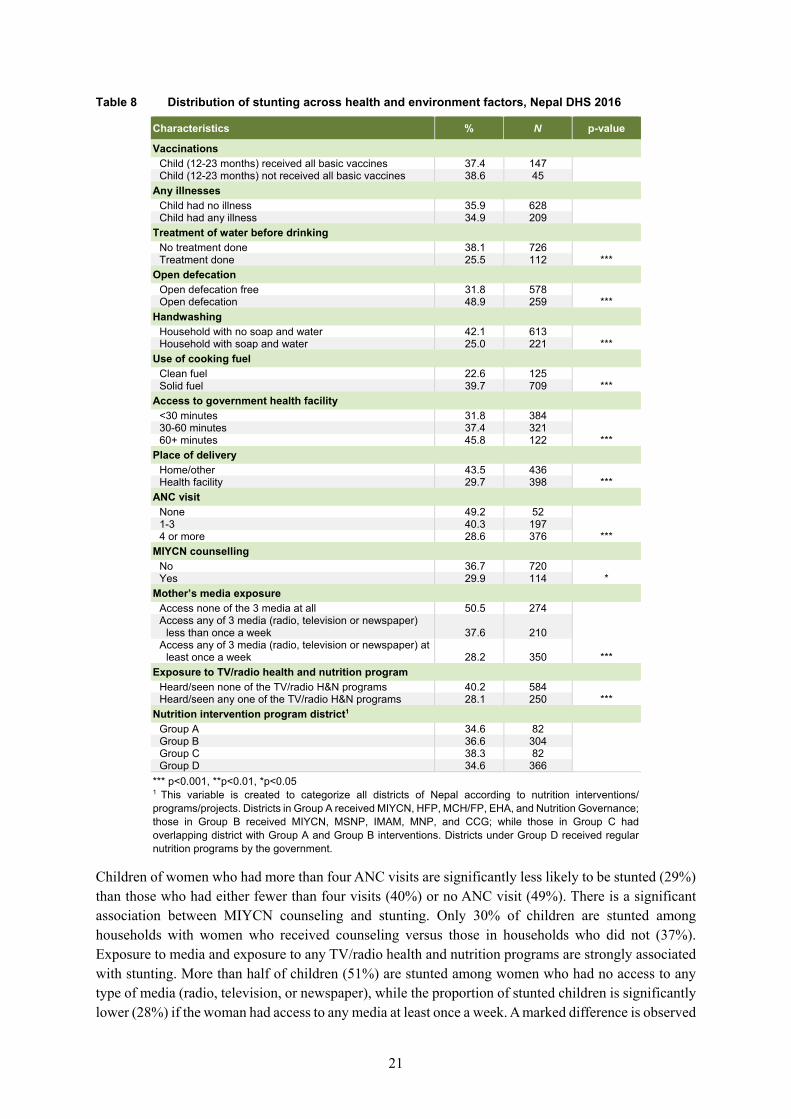
4.3.4 Association of health and environment factors with stunting
Table 8 shows the association of stunting with health and environment factors. Households that treated water before drinking have significantly lower proportion of stunted children (25%). Similarly, households not practicing open defecation have fewer stunted children (32%). Children in households with facilities for washing hands with soap or water are significantly less likely to experience stunting (25%), compared to those without soap and water (42%). Use of cooking fuel is also significantly associated with stunting, with less stunting in households that used clean fuel (22%) versus solid fuel (40%). The proportion of stunted children is significantly less among women who delivered at health facilities (29%) than among women who delivered at home or elsewhere (44%). Households with more than a 60-minute trip to reach the government health facility also have more stunted children.
21
Table 8 Distribution of stunting across health and environment factors, Nepal DHS 2016
Characteristics % N p-value
Vaccinations Child (12-23 months) received all basic vaccines 37.4 147
Child (12-23 months) not received all basic vaccines 38.6 45 Any illnesses
Child had no illness 35.9 628 Child had any illness 34.9 209
Treatment of water before drinking No treatment done 38.1 726
*** Treatment done 25.5 112 Open defecation
Open defecation free 31.8 578 *** Open defecation 48.9 259
Handwashing Household with no soap and water 42.1 613
*** Household with soap and water 25.0 221 Use of cooking fuel
Clean fuel 22.6 125 *** Solid fuel 39.7 709
Access to government health facility <30 minutes 31.8 384
*** 30-60 minutes 37.4 321 60+ minutes 45.8 122
Place of delivery Home/other 43.5 436
*** Health facility 29.7 398 ANC visit
None 49.2 52
*** 1-3 40.3 197 4 or more 28.6 376
MIYCN counselling No 36.7 720
* Yes 29.9 114 Mother’s media exposure
Access none of the 3 media at all 50.5 274
***
Access any of 3 media (radio, television or newspaper) less than once a week 37.6 210
Access any of 3 media (radio, television or newspaper) at least once a week 28.2 350
Exposure to TV/radio health and nutrition program Heard/seen none of the TV/radio H&N programs 40.2 584
*** Heard/seen any one of the TV/radio H&N programs 28.1 250 Nutrition intervention program district1
Group A 34.6 82
Group B 36.6 304 Group C 38.3 82 Group D 34.6 366
*** p<0.001, **p<0.01, *p<0.05
1 This variable is created to categorize all districts of Nepal according to nutrition interventions/ programs/projects. Districts in Group A received MIYCN, HFP, MCH/FP, EHA, and Nutrition Governance; those in Group B received MIYCN, MSNP, IMAM, MNP, and CCG; while those in Group C had overlapping district with Group A and Group B interventions. Districts under Group D received regular nutrition programs by the government.
Children of women who had more than four ANC visits are significantly less likely to be stunted (29%) than those who had either fewer than four visits (40%) or no ANC visit (49%). There is a significant association between MIYCN counseling and stunting. Only 30% of children are stunted among households with women who received counseling versus those in households who did not (37%). Exposure to media and exposure to any TV/radio health and nutrition programs are strongly associated with stunting. More than half of children (51%) are stunted among women who had no access to any type of media (radio, television, or newspaper), while the proportion of stunted children is significantly lower (28%) if the woman had access to any media at least once a week. A marked difference is observed

22
for stunting between women who had heard or seen any one health or nutrition program on TV or radio as compared to those who had not seen a program.
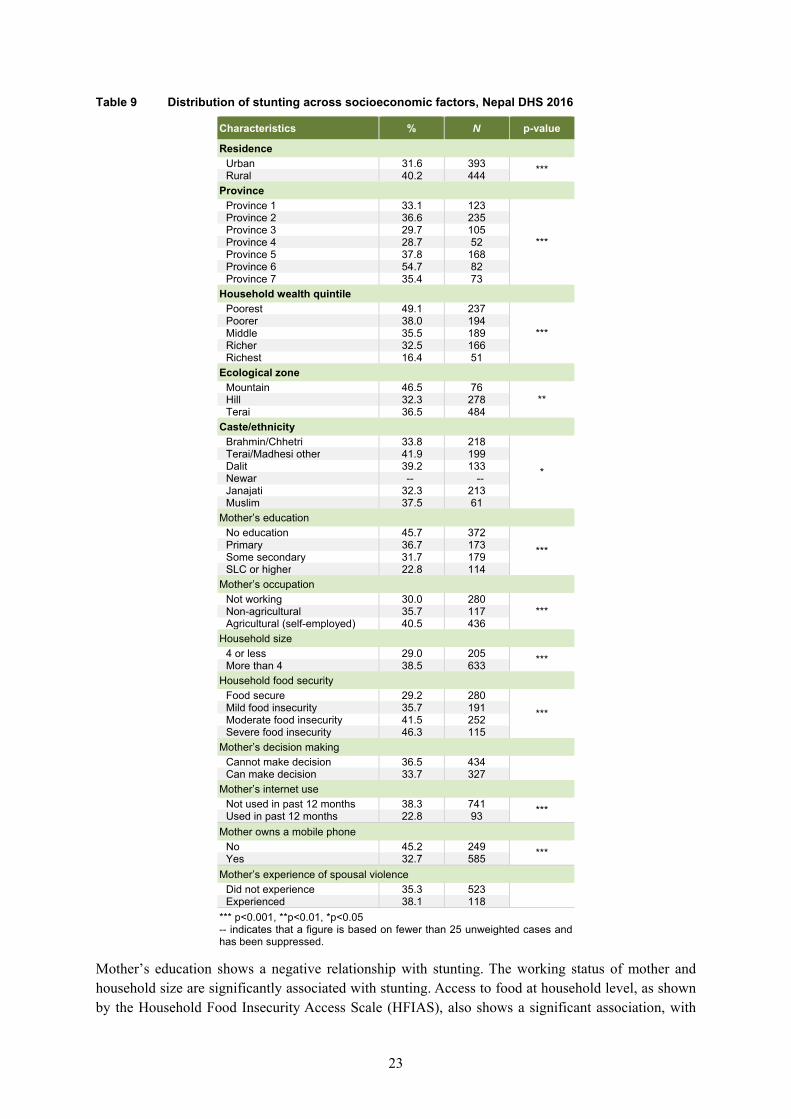
4.3.5 Association of socioeconomic status factors with stunting
There is a significant association between stunting and the covariates of residence, province, wealth quintile, ecological zone, women’s education, women’s occupation, household size, household food security, Internet use by women, and women owning a mobile phone. There is no statistically significant association with caste/ethnicity, women’s ability for decision making, and experience of spousal violence. A significant higher proportion of stunted children is found in rural areas. Substantially high stunting prevalence is found in Province 6 (Karnali Province) compared to the other provinces. Province 4 (Gandaki Province) has the lowest prevalence. A negative relationship is observed between stunting and household wealth quintile, with a gradual decline across quintiles. There is markedly less stunting among the richest quintile compared to other wealth quintiles. Fewer stunted children are from the Hill region, compared to the Terai and Mountain regions.
23
Table 9 Distribution of stunting across socioeconomic factors, Nepal DHS 2016
Characteristics % N p-value
Residence Urban 31.6 393 *** Rural 40.2 444
Province Province 1 33.1 123
***
Province 2 36.6 235 Province 3 29.7 105 Province 4 28.7 52 Province 5 37.8 168 Province 6 54.7 82 Province 7 35.4 73
Household wealth quintile Poorest 49.1 237
*** Poorer 38.0 194 Middle 35.5 189 Richer 32.5 166 Richest 16.4 51
Ecological zone Mountain 46.5 76
** Hill 32.3 278 Terai 36.5 484
Caste/ethnicity Brahmin/Chhetri 33.8 218
*
Terai/Madhesi other 41.9 199 Dalit 39.2 133 Newar -- -- Janajati 32.3 213 Muslim 37.5 61
Mother’s education No education 45.7 372
*** Primary 36.7 173 Some secondary 31.7 179 SLC or higher 22.8 114
Mother’s occupation Not working 30.0 280
*** Non-agricultural 35.7 117 Agricultural (self-employed) 40.5 436
Household size 4 or less 29.0 205 *** More than 4 38.5 633
Household food security Food secure 29.2 280
*** Mild food insecurity 35.7 191 Moderate food insecurity 41.5 252 Severe food insecurity 46.3 115
Mother’s decision making Cannot make decision 36.5 434 Can make decision 33.7 327
Mother’s internet use Not used in past 12 months 38.3 741 *** Used in past 12 months 22.8 93
Mother owns a mobile phone No 45.2 249 *** Yes 32.7 585
Mother’s experience of spousal violence Did not experience 35.3 523 Experienced 38.1 118
*** p<0.001, **p<0.01, *p<0.05 -- indicates that a figure is based on fewer than 25 unweighted cases and has been suppressed.
Mother’s education shows a negative relationship with stunting. The working status of mother and household size are significantly associated with stunting. Access to food at household level, as shown by the Household Food Insecurity Access Scale (HFIAS), also shows a significant association, with

24
severe food insecure households having the highest, and food secure households having the lowest prevalence of stunting. Use of a mobile phone or the Internet have a positive association with stunting, with a higher proportion of stunting among mothers who did not use Internet in the previous 12 months.
4.4 Determinants of Child Stunting
In this section, we examine the potential determinants of stunting. In Table 10, Model I shows the unadjusted odds ratios (uOR) from separate bivariate logistic regressions. Model II reports the adjusted odds ratios (aOR) for stunting from a separate multiple logistic regression for each group of the conceptual framework: child-intrinsic factors, maternal factors, infant and young child feeding factors, health and environment factors, and socioeconomic factors. For example, in the child-intrinsic factors model, we include independent variables such as age, sex, and weight of the child. Table 10 shows only the subset of independent variables that show significant associations with stunting in Model II. No variables in the full model for infant and young child feeding factors were significantly associated with stunting and so these data are not shown in Table 10. Appendix Table A3 presents results of the five full models with significant and nonsignificant variables.
Model I shows a significant association with a range of factors. Among maternal factors, mother’s age and birth order appear to be positively associated while mother’s height, dietary diversity, and non-smoker status appear to be negatively associated with stunting, but none of these factors remain significant in Model II. The case is similar for several health and environment factors (lack of water treatment, open defecation, solid cooking fuel, lack of facility delivery or ANC, and no exposure to health and nutrition programming on TV/radio) and socioeconomic factors (rural residence, caste/ethnicity, household food insecurity, and lack of internet use and mobile phone). The child-intrinsic factor, sex of child; the maternal factor, mother’s anemia; all infant and young child feeding factors; the health and environment factors, vaccinations, any illnesses, nutrition intervention program district, and MYCN counseling; and the socioeconomic factors, women’s decision making and experience of spousal violence are not presented as they do not show any significant association in either Model I or Model II (see Appendix Table A3).
In Model II for child-instrinsic factors, age of the child is positively associated with stunting while weight of the child at birth is negatively associated with stunting. Mother’s BMI (aOR 0.75 and 0.42 for normal and overweight, respectively) and long birth interval (aOR 0.63) are negatively associated with stunting after controlling for other maternal factors. Among health and environment factors, receiving all basic vaccines and poor access to government health facility are positively associated with stunting while handwashing with soap and water, and mother’s media exposure are negatively associated with stunting. In the model with socioeconomic factors, the strongest association with stunting is seen for Province 6, Karnali Province (aOR 1.73), mother’s work in a non-agricultural occupation (aOR 1.94), and household sized of more than four (aOR 1.41). Household wealth quintile and mother’s education are negatively associated with stunting, after controlling for other factors in this model.

25
Table 10 Association of stunting and child-instrinsic, maternal, infant and young child feeding, health and environment and socioeconomic factors. Results from separate multiple logistic regressions, Nepal DHS 2016
Characteristics
Model I Model II
uOR 95% CI aOR 95% CI
Child-instrinsic factors model Age of child (in months)
0-11 Ref 12-17 2.44*** 1.62-3.67 2.01** 1.17-3.45 18-23 3.82*** 2.55-5.73 3.52*** 2.17-5.69 24-35 4.26*** 3.04-5.98 3.97*** 2.56-6.19 36-47 3.42*** 2.41-4.85 2.62*** 1.67-4.11 48-59 3.53*** 2.38-5.22 2.68*** 1.62-4.45
Weight of child at birth Small (<2.5 kg) Ref Normal (2.5-3.49 kg) 0.45*** 0.31-0.65 0.46*** 0.32-0.67 Large (≥3.5 kg) 0.38*** 0.25-0.58 0.37*** 0.24-0.57
Only covariates with a significant association are shown. The full model in Model II controls for the following additional child-instrinsic variable: sex of child. Maternal factors model Mother’s BMI
Underweight (<18.5) Ref Normal (18.5-24.9) 1.27* 1-1.6 0.75* 0.58-0.96 Overweight/obese (≥25) 1.45 0.99-2.12 0.42*** 0.28-0.62
Birth interval Less than 3 years Ref 3 years or more or no preceding birth interval 0.54*** 0.46-0.72 0.63*** 0.49-0.81
Only covariates with a significant association are shown. The full model in Model II controls for the following additional maternal variables: mother’s age, anemia status, height, dietary diversity, and smoking status; birth interval; and birth order. Health and environment factors model Vaccinations
Child (12-23) not received all basic vaccines Ref Child (12-23) received all basic vaccines 0.95 0.57-1.59 2.28*** 1.74-2.99
Handwashing Household with no soap and water Ref Household with soap and water 0.45*** 0.37-0.56 0.64*** 0.5-0.82
Access to government health facility <30 minutes Ref 30-60 minutes 1.24* 0.99-1.53 1.24 0.98-1.57 60+ minutes 1.75*** 1.28-2.4 1.60* 1.11-2.31
Mother’s media exposure Access none of the 3 media at all Ref Access any of 3 media (radio, television or
newspaper) less than once a week 0.59*** 0.45-0.77 0.68* 0.49-0.93 Access any of 3 media (radio, television or
newspaper) at least once a week 0.39*** 0.3-0.48 0.55*** 0.39-0.72 Only covariates with a significant association are shown. The full model in Model II controls for the following additional health and environment variables: child’s experience of any illness; household’s water treatment, open defecation, and cooking fuel; nutrition intervention district; mother’s place of delivery, ANC, MIYCN counseling, and exposure to TV/radio health and nutrition programming.
Continued…)

26
Table 10—Continued
Characteristics
Model I Model II
uOR 95% CI aOR 95% CI
Socioeconomic factors model Province
Province 1 Ref Province 2 1.17 0.85-1.6 0.65 0.4-1.07 Province 3 0.85 0.55-1.33 1.03 0.69-1.53 Province 4 0.82 0.52-1.29 1.10 0.67-1.81 Province 5 1.23 0.82-1.85 0.96 0.62-1.48 Province 6 2.44*** 1.69-3.54 1.73* 1.12-2.65 Province 7 1.11 0.75-1.63 0.84 0.56-1.27
Household wealth quintile Poorest Ref Poorer 0.63** 0.47-0.85 0.77 0.54-1.1 Middle 0.57*** 0.42-0.77 0.55** 0.37-0.82 Richer 0.50*** 0.37-0.67 0.51** 0.33-0.79 Richest 0.20*** 0.14-0.3 0.34*** 0.19-0.61
Mother’s education No education Ref Primary 0.69** 0.54-0.88 0.76 0.55-1.04 Some secondary 0.55*** 0.42-0.71 0.82 0.59-1.14 SLC or higher 0.35*** 0.26-0.47 0.56* 0.34-0.91
Mother’s Occupation Not working Ref Non-agricultural 1.31 0.96-1.79 1.94*** 1.31-2.85 Agricultural (self-employed) 1.61*** 1.3-1.98 1.32 0.99-1.75
Household size 4 or less Ref More than 4 1.55*** 1.22-1.93 1.41* 1.06-1.87
Only covariates with a significant association are shown. The full model in Model II controls for the following additional socioeconomic variables: residence; ecological zone; caste/ethnicity; household food security; and mother’s internet use, mobile phone ownership, decision making, and experience of spousal violence. *** p<0.001, **p<0.01, *p<0.05
Figures 6-9 present graphics of the key determinants of stunting from Model II that shows that the odds of stunting is highest among children age 24-35 months (child-intrinsic factors model), while the odds of stunting is lowest among children from the richest wealth quintile (socioeconomic factors model).

27
Figure 6 Key child-intrinsic determinants of stunting in children age 0-59 months; adjusted odds ratios (ORs) with 95% confidence intervals (CIs), Nepal DHS 2016
Note: Only covariates with a significant association are shown. The full model controls for the following additional child-instrinsic variable: sex of child. Figure 7 Key maternal determinants of stunting in children age 0-59 months; adjusted odds ratios
(ORs) with 95% confidence intervals (CIs), Nepal DHS 2016
Note: Only covariates with a significant association are shown. The full model controls for the following additional maternal variables: mother’s age, anemia status, height, dietary diversity, and smoking status; birth interval; and birth order.
0.0 1.0 2.0 3.0 4.0 5.0 6.0 7.0
Child 12-17 months
Child 18-23 months
Child 24-35 months
Child 36-47 months
Child 48-59 months
Normal weight of child at birth
Large weight of child at birth
Odds Ratio
ORLower CIUpper CI
0.0 1.0 2.0 3.0 4.0 5.0 6.0 7.0
Mother's BMI 18.5-24.9
Mother's BMI >25
Birth interval ≥3 years
Odds Ratio
ORLower CIUpper CI

28
Figure 8 Key health and environment determinants of stunting in children age 0-59 months; adjusted odds ratios (ORs) with 95% confidence intervals (CIs), Nepal DHS 2016
Note: Only covariates with a significant association are shown. The full model controls for the following additional health and environment variables: child’s experience of any illness; household’s water treatment, open defecation, and cooking fuel; nutrition intervention district; mother’s place of delivery, ANC, MIYCN counseling, and exposure to TV/radio health and nutrition programming.
0.0 1.0 2.0 3.0 4.0 5.0 6.0 7.0
Received all vaccines
All basic vaccines received
Household with soap and water
Access to HF (60+ minutes)
Access any of 3 media by women(less than a week)
Access any of 3 media at least oncea week
Odds Ratio
ORLower CIUpper CI

29
Figure 9 Key socioeconomic determinants of stunting in children age 0-59 months; adjusted odds ratios (ORs) with 95% confidence intervals (CIs), Nepal DHS 2016
Note: Only covariates with a significant association are shown. The full model controls for the following additional socioeconomic variables: residence; ecological zone; caste/ethnicity; household food security; and mother’s internet use, mobile phone ownership, decision making, and experience of spousal violence.
0.0 1.0 2.0 3.0 4.0 5.0 6.0 7.0
Province 6
Middle
Richer
Richest
SLC or higher
Non-agricultural
More than 4household size
Odds Ratio
ORLower CIUpper CI


31
5 MINIMUM ACCEPTABLE DIET IN CHILDREN AGE 6-23 MONTHS
In 2008, WHO, UNICEF, and USAID published a set of indicators that assess IYCF practices at the household level. The MAD, a composite indicator, is one of the core indicators identified to assess IYCF practices at the population level. This indicator includes minimum dietary diversity (quality aspect of complementary food), as well as minimum meal frequency (quality aspect of complementary food). The indicator is calculated for both breastfed and non-breastfed children. Studies have shown a strong association between inappropriate IYCF practices and stunting in children. This indicator includes both the quantitative and qualitative aspects of complementary feeding for breastfed and non-breastfed children.
5.1 Socioeconomic Inequalities in Minimum Acceptable Diet in 2011 and 2016
The trends for MAD disaggregated by different socioeconomic variables are presented in Table 11. The trend analysis indicates improvement in MAD for children age 6-23 months across all covariates. MAD has significantly improved in both the 6-11 (p<0.01) and 12-23-month (p<0.001) age groups. Improvement in MAD is greater in female children (13 percentage points) than male children (11 percentage points). Provinces 5 and 6 show the largest improvement among all provinces (22 to 25 percentage points).
Significant improvement in MAD is restricted to children in the poorest (17 percentage points) and poorer (14 percentage points) wealth quintiles. All ecological zones show improvement in MAD among children. The Mountain Zone shows the largest improvement of 20 percentage points as compared to the Hill (14 percentage points) and Terai (10 percentage points) zones.
MAD has significantly improved among all ethnic groups except the Newar and Muslim groups. The improvement in MAD is significant among women with no education and with higher education. Households with food security show greater improvement in MAD compared to the food insecure households. MAD increased in all nutrition intervention districts except those in Group D.

32
Table 11 Trends in minimum acceptable diet among children age 6-23 months by key explanatory variables, Nepal DHS 2011-2016
Characteristics
2011 2016 Percentage point change
2016-2011 p-value % N % N
Age of child (in months) 6-11 14.0 68 22.4 112 8.4 ** 12-23 29.1 277 42.4 423 13.3 ***
Sex of child Male 23.9 170 34.4 279 10.6 ** Female 24.1 175 37.3 256 13.2 ***
Province Province 1 31.0 94 34.3 91 3.3 Province 2 5.3 -- 20.0 76 14.7 *** Province 3 35.1 70 44.0 106 8.9 Province 4 43.3 66 53.2 67 9.9 Province 5 21.2 49 42.8 118 21.7 *** Province 6 14.6 -- 39.8 34 25.2 *** Province 7 24.8 34 35.6 43 10.9
Household wealth quintile Poorest 13.7 48 30.7 93 17.1 *** Poorer 19.3 57 33.7 110 14.4 *** Middle 21.1 68 28.1 96 7.1 Richer 33.9 85 41.6 132 7.6 Richest 40.4 86 50.5 105 10.1
Ecological zone Mountain 22.3 27 42.7 42 20.4 ** Hill 32.1 189 46.3 266 14.3 *** Terai 17.7 129 27.7 227 10.0 **
Caste/ethnicity Brahmin/Chhetri 36.9 158 52.4 200 15.5 *** Terai/Madhesi other -- -- 23.6 72 16.6 *** Dalit 16.1 37 32.6 68 16.5 *** Newar -- -- -- -- 6.8 Janajati 24.6 117 34.9 151 10.3 * Muslim 9.9 10 21.4 23 11.6
Mother’s education No education 11.0 66 23.7 107 12.7 *** Primary 21.3 57 29.7 88 8.5 Some secondary 38.4 178 41.2 218 2.9 SLC or higher 42.1 44 56.6 121 14.5 *
Household size 4 or less 28.7 112 42.7 169 14.0 *** More than 4 22.3 233 33.3 366 11.0 ***
Household food security Food secure 30.5 182 43.5 286 13.0 *** Food insecure 19.4 163 29.8 249 10.4 ***
Nutrition intervention program district1 Group A 35.1 64 54.7 85 19.6 ** Group B 11.5 61 29.7 153 18.2 *** Group C 22.3 29 38.6 59 16.4 * Group D 32.1 192 35.5 237 3.4
*** p<0.001, **p<0.01, *p<0.05 1 This variable is created to categorize all districts of Nepal according to nutrition interventions/programs/projects. Districts in Group A received MIYCN, HFP, MCH/FP, EHA, and Nutrition Governance; those in Group B received MIYCN, MSNP, IMAM, MNP, and CCG; while those in Group C had overlapping district with Group A and Group B interventions. Districts under Group D received regular nutrition programs by the government. -- indicates that a figure is based on fewer than 25 unweighted cases and has been suppressed.

33
Figure 10 Minimum acceptable diet by province, Nepal DHS 2016
Overall, improvement in MAD is observed across in all provinces. There is, however, a wide variation observed in levels of MAD among provinces in 2016, as highlighted in Figure 10. More than 50% of children received MAD in Province 5, while this figure is only 18% children in Province 2.
The 2011 and 2016 data show gradual improvement in MAD as a child grows older, as seen in Figure 11. The figure shows that in both years, more children above age 1 were fed according to recommended practices than children less than 1 year. Across the age distribution, MAD is significantly higher in 2016 than in 2011.
Figure 11 Distribution of minimum acceptable diet in children across age, Nepal DHS 2016
5.2 Understanding the Factors behind Minimum Acceptable Diet in Children Age 6-23 in Nepal
5.2.1 Association of child-instrinsic factors with MAD
MAD is significantly associated with children’s age. A notably higher proportion of children age 12-23 months were fed according to recommended practices when compared to children age 6-11 months. The other two child-instrinsic variables (sex and weight at birth) do not show a significant association.

34
Table 12 Distribution of minimum acceptable diet across child-instrinsic factors, Nepal DHS 2016
Characteristics % N p-value
Age of child (in months) 6-11 22.4 112
*** 12-23 42.4 423 Sex of child
Male 34.4 279 Female 37.3 256
Weight of child at birth Small (<2.5 kg) 37.7 46
Normal (2.5-3.49 kg) 39.6 237 Large (≥3.5 kg) 40.6 118
*** p<0.001, **p<0.01, *p<0.05 5.2.2 Association of maternal factors with MAD
All maternal characteristics except mother’s anemia status show significant association with MAD as shown in Table 13. Children of mothers age 25-34 are more likely to have received MAD compared to other age groups. More children received MAD if their mothers had a birth interval of 3 years or more as compared to those with a birth interval of fewer than 3 years. Birth order is also significantly associated, with more children who are the first-born receiving MAD compared to children of a higher birth order. A significantly higher proportion of children of mothers who consumed more diverse food (five or more) were fed per the recommendations than children of mothers who did not.
Table 13 Distribution of minimum acceptable diet across maternal factors, Nepal DHS 2016
Characteristics % N p-value
Mother’s age 15-24 years 32.1 248
** 25-34 years 40.7 260 35-49 years 31.7 27
Mother’s anemia Anemic 30.8 109
Non-anemic 35.4 138 Birth interval
Less than 3 years 24.3 95 *** 3 years or more 39.1 191 Birth order
First born 40.5 248 *** 2-4 35.4 232
5 or more 19.5 23 Mother’s dietary diversity
Less than 5 food groups 17.9 134 *** 5 or more food groups 53.7 401 *** p<0.001, **p<0.01, *p<0.05
5.2.3 Association of health and environment factors with MAD
The results related to the association of MAD with health and environment factors are presented in Table 14. Twenty-one percent of children in households with open defecation fed their children according to the recommended feeding practice, significantly less than the 40% among children in households without open defecation. Use of cooking fuel also shows an association, with children in households with clean fuels more likely to be fed MAD than children in household using solid fuels.

35
Table 14 Distribution of minimum acceptable diet across health and environment factors, Nepal DHS 2016
Characteristics % N p-value
Any illnesses Child had any illness 36.6 371
Child had no illness 34.0 164 Time to obtain drinking water
Water on premises 35.5 334
Less than 30 minutes 36.8 120 30 minutes or longer 28.4 27
Open defecation Open defecation free 39.8 469 *** Open defecation 20.8 66
Handwashing Household with no soap and water 32.4 297 ** Household with soap and water 41.3 238
Use of cooking fuel Clean fuel 46.1 155 *** Solid fuel 31.8 327
Access to government health facility <30 minutes 40.1 101
30-60 minutes 41.1 167 60+ minutes 39.2 93
Place of delivery Home/other 29.7 153 ** Health facility 39.1 382
ANC visit No -- --
Yes 36.0 515 Nutrition intervention program district1
Group A 54.7 85
*** Group B 29.7 153 Group C 38.6 59 Group D 35.5 237
MIYCN counseling No 32.7 392 *** Yes 48.5 143
Mother’s media exposure Access none of the 3 media at all 23.4 80
*** Access any of 3 media (radio, television or
newspaper) less than once a week 31.3 107 Access any of 3 media (radio, television or
newspaper) at least once a week 43.0 348 Exposure to TV/radio health and nutrition program
Heard/seen none of the TV/radio H&N programs 47.3 247 *** Heard/seen any one of the TV/radio H&N programs 46.9 288
1 This variable is created to categorize all districts of Nepal according to nutrition interventions/programs/projects. Districts in Group A received MIYCN, HFP, MCH/FP, EHA, and Nutrition Governance; those in Group B received MIYCN, MSNP, IMAM, MNP, and CCG; while those in Group C had overlapping district with Group A and Group B interventions. Districts under Group D received regular nutrition programs by the government. *** p<0.001, **p<0.01, *p<0.05 -- indicates that a figure is based on fewer than 25 unweighted cases. Results for such groups are not reported.
A significantly higher proportion of children who reside in Group A nutrition intervention districts (55%) were fed MAD compared to children in other districts (30%-39%). Likewise, a higher proportion of MAD is observed among children whose mothers had received the MIYCN counselling compared to those who did not. Mother’s exposure to media is strongly associated, with more children whose mothers had access to any of three media (radio/television/ newspaper) at least once a week receiving

36
MAD than children of mothers who did not. Similar results are found for children of mothers who had exposure to any one of the TV/radio health and nutrition programs.
There is no observed association between MAD and any illness in children in previous 2 weeks, time to obtain drinking water, access to government health facility, or mother’s ANC visitation.
5.2.4 Association of socioeconomic status factors with MAD
Table 15 shows that province, household wealth quintile, ecological zone, caste/ethnicity, household food security, and mother’s education, working status, decision making, internet use, and mothers owning a mobile phone are significantly associated with MAD.

37
Table 15 Distribution of minimum acceptable diet across socioeconomic status factors, Nepal DHS 2016
Characteristics % N p-value
Residence Urban 36.6 293
Rural 35.0 242 Province
Province 1 34.3 91
***
Province 2 20.0 76 Province 3 44.0 106 Province 4 53.2 67 Province 5 43.2 118 Province 6 39.8 34 Province 7 35.6 43
Household wealth quintile Poorest 30.7 93
*** Poorer 33.7 110 Middle 28.1 96 Richer 41.6 132 Richest 50.5 105
Ecological zone Mountain 42.7 42
*** Hill 46.3 266 Terai 27.7 227
Caste/ethnicity Brahmin/Chhetri 52.4 200
***
Terai/Madhesi other 23.6 72 Dalit 32.6 68 Newar -- -- Janajati 34.9 151 Muslim 21.4 23
Mother’s education No education 23.7 107
*** Primary 29.7 88 Some secondary 41.2 218 SLC or higher 56.6 121
Mother’s occupation Not working 30.2 204
*** Non-agricultural 57.2 101 Agricultural (self-employed) 35.9 229
Household size 4 or less 42.7 169 ** More than 4 33.3 366
Household food security1 Food secure 43.5 286 *** Food insecure 29.8 249
Mother’s decision-making Cannot make decision 31.8 261 ** Can make decision 41.8 240
Mother’s internet use Used in past 12 months 49.3 136 *** Not used in past 12 months 32.8 399
*** p<0.001, **p<0.01, *p<0.05
1 The categorization of household food security is recoded as food secure and food insecure due to small sample size. Food Insecure includes mild, moderate and severe food insecurity. -- indicates that a figure is based on fewer than 25 unweighted cases. Results for such groups are not reported.
5.3 Determinants of MAD
Table 16 below shows the results of the unadjusted (Model I) and four separate adjusted (Model II) multiple logistic regressions for MAD in children age 6-23 months. The four adjusted models correspond to the components of the conceptual framework: child-intrinsic factors, maternal factors, health and environment factors, and socioeconomic factors. Only significant findings are presented

38
here, with the complete findings shown in Appendix Table A4. Figures 12-15 show the adjusted odds ratios from Model II for significant determinants.
Controlling for other child-instrinsic factors, the odds of MAD are higher among children age 12-23 months than among children age 6-11 months (aOR 3.67). In the model for maternal factors, children of mothers age 35-49 have higher odds of MAD than children of mothers age 15-25 (aOR3.29). Similarly, children of mothers who consumed five or more food groups have higher odds of being fed with MAD compared with children of mothers who consumed fewer than five food groups (aOR 5.55).
Controlling for other health and environment factors, children from households with open defecation have lower odds of MAD compared to children from open defecation free households (aOR 0.62). Children from Group B, C, and D districts have lower odds of MAD compared to children from district Group A (aORs 0.45, 0.56, and 0.50, respectively).
Table 16 Association of minimum acceptable diet and child-instrinsic, maternal, health and environment, and socioeconomic factors. Results from multiple logistic regression, Nepal DHS 2016
Characteristics
Model I Model II
uOR 95% CI aOR 95% CI
Child-instrinsic factors model Age of child (in months)
6-11 Ref 12-23 2.55*** 1.95-3.34 3.67*** 2.29-5.87
Only covariates with a significant association are shown. The full model in Model II controls for the following additional child-instrinsic variables: sex of child, weight of child at birth. Maternal factors model Mother’s age
15-24 years Ref 25-34 years 1.45** 1.13-1.87 1.30 0.80-2.11 35-49 years 0.98 0.57-1.69 3.29* 1.25-8.64
Mother’s dietary diversity Less than 5 food groups Ref 5 or more food groups 5.31*** 4.17-6.77 5.55*** 3.74-8.25
Only covariates with a significant association are shown. The full model in Model II controls for the following additional maternal variables: birth interval; birth order, and mother’s anemia. Health and environment factors model Open defecation
Open defecation free Ref Open defecation 0.40*** 0.28-0.56 0.62** 0.43-0.89
Nutrition intervention program district1 Group A Ref Group B 0.35*** 0.24-0.52 0.45*** 0.29-0.70 Group C 0.52** 0.32-0.85 0.56* 0.32-0.97 Group D 0.46*** 0.31-0.67 0.50*** 0.34-0.75
MIYCN counseling No Ref Yes 1.94*** 1.45-2.59 1.51** 1.11-2.06
Exposure to TV/radio health and nutrition program Heard/seen none of the TV/radio health and
nutrition programs Ref Heard/seen any one of the TV/radio health
and nutrition programs 2.31*** 1.80-2.95 1.59** 1.15-2.21
Only covariates with a significant association are shown. The full model in Model II controls for the following additional health and environment variables: household’s time to drinking water, handwashing, cooking fuel and access to government health facility; child’s illness, ANC visits, place of delivery, and mother’s media exposure.
(Continued…)

39
Table 16—Continued
Characteristics
Model I Model II
uOR 95% CI aOR 95% CI
Socioeconomic factors model Province
Province 1 Ref Province 2 0.48*** 0.31-0.74 0.91 0.33-2.53 Province 3 1.50 0.93-2.44 2.31 0.93-5.73 Province 4 2.18*** 1.47-3.23 3.17** 1.35-7.44 Province 5 1.46 0.97-2.20 1.48 0.72-3.08 Province 6 1.26 0.81-1.97 1.01 0.45-2.27 Province 7 1.06 0.62-1.83 0.61 0.23-1.63
Household wealth quintile Poorest Ref Poorer 1.15 0.76-1.73 2.03 0.99-4.17 Middle 0.88 0.59-1.32 2.76** 1.31-5.83 Richer 1.61* 1.04-2.48 2.76* 1.21-6.27 Richest 2.30*** 1.48-3.58 1.99 0.68-5.78
Ecological zone Mountain Ref Hill 1.16 0.69-1.96 0.44 0.19-1.04 Terai 0.51* 0.31-0.87 0.26** 0.10-0.71
Caste/ethnicity Brahmin/Chhetri Ref Terai/Madhesi other 0.28*** 0.18-0.44 0.40 0.14-1.13 Dalit 0.44*** 0.29-0.66 0.68 0.31-1.51 Newar 0.52* 0.30-0.90 0.11*** 0.03-0.40 Janajati 0.49*** 0.34-0.70 0.45* 0.24-0.85 Muslim 0.25*** 0.12-0.49 0.59 0.14-2.46
Mother’s education No education Ref Primary 1.05 0.60-1.84 0.89 0.42-1.89 Some secondary 2.16** 1.33-3.48 1.94 0.99-3.81 SLC or higher 3.83*** 2.23-6.57 3.96** 1.57-10.01
Only covariates with a significant association are shown. The full model in Model II controls for the following additional socioeconomic variables: residence, household size and food security; and mother’s internet use, mobile phone ownership, decision making, and experience of spousal violence. 1 This variable is created to categorize all districts of Nepal according to nutrition interventions/programs/projects. Districts in Group A received MIYCN, HFP, MCH/FP, EHA, and Nutrition Governance; those in Group B received MIYCN, MSNP, IMAM, MNP, and CCG; while those in Group C had overlapping district with Group A and Group B interventions. Districts under Group D received regular nutrition programs by the government. *** p<0.001, **p<0.01, *p<0.05
Children of mothers who were counseled on MIYCN have higher odds of MAD than children whose mothers were not counseled on MIYCN (aOR 1.51). Moreover, if the mother had heard/seen any TV or radio health and nutrition programs, their children have higher odds of being fed MAD than children whose mother had no exposure to such programs (aOR1.59).
Among socioeconomic factors, children from Province 4 (Gandaki Province) have higher odds of MAD than children from Province 1 (aOR 3.17). Children from households in the middle and richer wealth quintiles have higher odds of MAD than children from the poorest households (aOR 2.76), as do children of mothers who have higher education (aOR 3.96). Children from the Terai have lower odds of being fed MAD than children from the Mountain zone (aOR 0.26). Similarly, children from the Newar and Janajati groups have lower odds of being fed MAD than children from the Brahmin/Chhetri groups (aOR 0.11 and aOR 0.45 respectively).

40 Figu
re 1
2 K
ey c
hild
-inst
rinsi
c de
term
inan
ts o
f min
imum
acc
epta
ble
diet
in c
hild
ren
age
6-23
mon
ths;
adj
uste
d od
ds ra
tios
(OR
s) w
ith 9
5% c
onfid
ence
inte
rval
s (C
Is),
Nep
al D
HS
2016
N
OTE
: Onl
y co
varia
tes
with
a s
igni
fican
t ass
ocia
tion
are
show
n. T
he fu
ll m
odel
in M
odel
II c
ontro
ls fo
r th
e fo
llow
ing
addi
tiona
l var
iabl
es: m
othe
r’s a
ge; b
irth
inte
rval
; birt
h or
der;
child
’s il
lnes
s; h
ouse
hold
’s
cook
ing
fuel
and
acc
ess
to g
over
nmen
t hea
lth fa
cilit
y; m
othe
r’s m
edia
exp
osur
e; h
ouse
hold
siz
e an
d fo
od s
ecur
ity; m
othe
r’s in
tern
et u
se, m
obile
pho
ne o
wne
rshi
p, d
ecis
ion
mak
ing,
and
exp
erie
nce
of s
pous
al
viol
ence
.
0.0
1.0
2.0
3.0
4.0
5.0
6.0
7.0
8.0
9.0
10.0
11.0
Child
12-
23 m
onth
s
Fem
ale
child
Nor
mal
wei
ght o
f chi
ld a
t birt
h
Larg
e w
eigh
t of c
hild
at b
irth
Odds
Rat
io
ORLo
wer
CI
Uppe
r CI

41 Figu
re 1
3 K
ey m
ater
nal d
eter
min
ants
of m
inim
um a
ccep
tabl
e di
et in
chi
ldre
n ag
e 6-
23 m
onth
s; a
djus
ted
odds
ratio
s (O
Rs)
with
95%
con
fiden
ce in
terv
als
(CIs
), N
epal
D
HS
2016
N
ote:
Onl
y co
varia
tes
with
a s
igni
fican
t ass
ocia
tion
are
show
n. T
he fu
ll m
odel
con
trols
for t
he fo
llow
ing
addi
tiona
l mat
erna
l var
iabl
es: b
irth
inte
rval
; birt
h or
der,
and
mot
her’s
ane
mia
.
0.0
1.0
2.0
3.0
4.0
5.0
6.0
7.0
8.0
9.0
10.0
11.0
Mot
her a
ge 3
5-49
5 or
mor
e W
DDS
Odds
Rat
io
ORLo
wer
CI
Uppe
r CI

42 Figu
re 1
4 K
ey h
ealth
and
env
ironm
ent d
eter
min
ants
of m
inim
um a
ccep
tabl
e di
et in
chi
ldre
n ag
e 6-
23 m
onth
s; a
djus
ted
odds
ratio
s (O
Rs)
with
95%
con
fiden
ce in
terv
als
(CIs
), N
epal
DH
S 20
16
N
ote:
Onl
y co
varia
tes
with
a s
igni
fican
t ass
ocia
tion
are
show
n. T
he fu
ll m
odel
con
trols
for t
he fo
llow
ing
addi
tiona
l hea
lth a
nd e
nviro
nmen
t var
iabl
es: h
ouse
hold
’s ti
me
to d
rinki
ng w
ater
, han
dwas
hing
, coo
king
fu
el a
nd a
cces
s to
gov
ernm
ent h
ealth
faci
lity;
chi
ld’s
illn
ess,
AN
C v
isits
, pla
ce o
f del
iver
y, a
nd m
othe
r’s m
edia
exp
osur
e.
0.0
1.0
2.0
3.0
4.0
5.0
6.0
7.0
8.0
9.0
10.0
11.0
ODF
Grou
p B
Dist
ricts
Grou
p C
Dist
ricts
Grou
p D
Dist
ricts
MIY
CN c
ouns
ellin
g
Hear
d/se
en a
ny T
V/ra
dio
H&
N pr
ogra
m
Odds
Rat
io
ORLo
wer
CI
Uppe
r CI

43 Figu
re 1
5 K
ey s
ocio
econ
omic
det
erm
inan
ts o
f min
imum
acc
epta
ble
diet
in c
hild
ren
age
6-23
mon
ths;
adj
uste
d od
ds ra
tios
(OR
s) w
ith 9
5% c
onfid
ence
inte
rval
s (C
Is),
Nep
al D
HS
2016
N
ote:
Onl
y co
varia
tes
with
a s
igni
fican
t ass
ocia
tion
are
show
n. T
he fu
ll m
odel
con
trols
for t
he fo
llow
ing
addi
tiona
l soc
ioec
onom
ic v
aria
bles
: res
iden
ce, h
ouse
hold
siz
e an
d fo
od s
ecur
ity; a
nd m
othe
r’s in
tern
et
use,
mob
ile p
hone
ow
ners
hip,
dec
isio
n m
akin
g, a
nd e
xper
ienc
e of
spo
usal
vio
lenc
e.
0.0
1.0
2.0
3.0
4.0
5.0
6.0
7.0
8.0
9.0
10.0
11.0
Prov
ince
4
Mid
dle
wea
lth q
uint
ile
Rich
er w
ealth
qui
ntile
Tera
i
New
ar
Jana
jati
SLC
or h
ighe
r
Odds
Rat
io
ORLo
wer
CI
Uppe
r CI


45
6 DISCUSSION
6.1 Stunting
The study shows that, on average, children’s anthropometric status has improved over the past 5 years, with notable differences across socioeconomic groups in trends and present nutritional status. In recent years, there have been impressive improvements in the nutritional status of children in South Asian countries (Black et al. 2013; Stevens et al. 2012; UNICEF, WHO, and World Bank 2018). Despite these positive trends, children in Nepal remain alarmingly undernourished, although the prevalence of stunting is less than that of other neighboring countries such as India and Bangladesh (UNICEF 2018a). The parallel rightward shift of the HAZ curve implies that the progress was uniform across the entire age distribution. Age was found to be one of the predictors for stunting in children. Although the increase of stunting among children age 12-17 months shows the importance of continuing the intensity of integrated nutrition interventions, the gradual increment in stunting as the child ages also indicates the critical importance of interventions beyond 1,000 days. It is also interesting to note that the rate of stunting has significantly decreased among the 24-35- and 36-47-months age groups. It might suggest that the interventions aimed at 1,000 days show an impact at a later age of the children.
For the first time, this study has evaluated the trends of stunting by provinces, which will be useful for context-specific decision making in the new federal structure. In all provinces, the prevalence of stunting has decreased in the last 5 years, but the reduction was significant in province 7 (Sudurpashchim Province) only. In addition, there is a large variation in stunting prevalence across provinces. The recent focus on emphasizing the variability in stunting across the country is key to addressing this inequity (Menon et al. 2018; WHO 2018). This highlights the importance of identifying and addressing key determinants by geography to reduce inequalities and the overall stunting burden in Nepal. Since 2011, integrated nutrition programs and projects with high-impact nutrition interventions (such as Community MIYCN counseling, nutrition-sensitive agriculture interventions, nutrition governance, WASH (water, sanitation, and hygiene) interventions coupled with intensive community mobilization) have been implemented in Province 7 (Sudurpashchim Province). In addition, other development activities are also concentrated in the region. This entails the fact that if evidence-based programs or projects are implemented in an area with a focus on convergence of interventions at the household level, it can have a desirable synergistic impact. Nevertheless, this requires greater understanding of the province-specific determinants of stunting. This also calls for further discussion about the possibility that the larger decline in Province 7 (Sudurpashchim Province) could be related to higher rates of stunting at an earlier time as compared to Province 1 or Province 4 (Gandaki Province) where the stunting rate was much lower.
A significant reduction in the rate of stunting among the poor population and the Dalit and Janajati groups is consistent with recent government efforts of policy coherence across the sectors (National Planning Commission 2012), intensive nutrition interventions that targeted disadvantaged communities, and the scaling-up of community nutrition programs with the aim of reducing the gaps and reaching the unreached. Also consistent with this policy aim, this study found the Group A and B nutrition intervention districts witnessed the largest reduction in stunting. In 2013, the Government of Nepal enforced the Multi-Sector Nutrition Plan, which provided the framework for implementation of large-scaled integrated projects. As a result, there was increased engagement, interest, and investment of donors and partners in nutrition. Many nutrition interventions were scaled-up in the country with the involvement of many concerned sectors (Department of Health Services 2017). Recent supportive

46
policies and scaling-up of effective nutrition interventions and programs that strengthen community outreach for quality nutrition services and improve the health and nutrition behaviors may be influential in narrowing the gaps. Coordination mechanisms between different sectors for multi-sector coherent action enhanced programs at the national and subnational levels (Cunningham et al. 2017).
There is emerging evidence (Ahmed et al. 2012; Department of Health Services 2017; Harding et al. 2017; National Planning Commission 2017) and interest (SAARC 2014; UNICEF 2018b) in the role of adolescent and maternal nutrition for stunting reduction in the region. This reinforces the lifecycle approach to nutrition programming. Our study shows that stunting is associated with birth interval and the weight of child at birth. Since the weight of child at birth is influenced by maternal factors such as maternal BMI, number of pregnancies, birth interval, and anemia (Headey, Hoddinott, and Park 2016), Nepal’s effort to strengthen accessibility to maternal, neonatal, and child health and nutrition services should be reflected in the country’s nutrition policies and programming.
In South Asia, women’s empowerment is associated with a child’s nutritional status (Cunningham et al. 2015). Our study shows that greater women’s participation in the workforce, integrated nutrition services that target the most vulnerable population and disadvantaged communities, improved accessibility to information and communication technology (ICT), and exposure to media for women are associated with reduced odds of stunting in Nepal. These findings, which are consistent with other studies (Kjeldsberg et al. 2018; Shroff et al. 2009; Smith et al. 2003) in the region, support the policies of global nutrition organizations such as USAID (USAID 2014), the World Bank (Shekar et al. 2017), and UN organizations (FAO and WHO 2014). In addition, the focus on improving women’s health with strategies that improve health-care-seeking behavior of women through behavior change communication programs seems to be effective at the community level. In these interventions, the role of ICT is critical, given women’s increasing access to mobile phones. Ongoing and new innovative approaches to nutrition service delivery aimed at the most vulnerable and poor populations should be documented, explored, and scaled-up by the government. Such projects have yielded encouraging results in many parts of the world (Graziose et al. 2018; Huda et al. 2018; Patel et al. 2018).
The Government of Nepal has prioritized women empowerment programs that are designed to improve women’s physical and financial autonomy. A study done in Nepal shows that control over income by women is positively associated with lower rates of stunting (Malapit et al. 2015). Women’s empowerment also reduces family size. Nepal has made remarkable progress in reducing its fertility rate over the past decade. Our findings show that household size is one of the determinants of stunting in Nepal with a high rate of stunting among households with more than five members. These results support the importance of addressing the underlying determinants of stunting through a multi-pronged, cross-sector approach. Other determinants of stunting from our findings include access to health facility, and residence in Province 6 (Karnali Province), while handwashing and household wealth are determinants of less stunting. Implementation of a multi-sector approach to integrated, nutrition-specific interventions may contribute to addressing the factors associated with the high rate of stunting in Nepal. The policy environment in Nepal is conducive to multi-sector action, and these findings highlight the need for integrated interventions that address malnutrition at the community and household level. With Province 6 (Karnali Province) emerging as one of the key determinants of stunting, nutritional planning and interventions should be tailored to the specific geography with socioeconomic and cultural realities taken into account.

47
6.2 Minimum Acceptable Diet
This study analyzed DHS 2011 and 2016 data from Nepal to assess the change in MAD over the past 5 years, and to further explore the determinants of MAD. While the analysis reveals interesting patterns for WHO-recommended practices over the years, it also uncovers important gaps that exist in meeting the recommended MAD criteria. Between 2011 and 2016, there have been notable improvements in MAD. However, our findings show better improvement in children age 12-23 months compared to children age 6-11 months. This finding, which is consistent with studies in Nepal (Na et al. 2017) and Ethiopia (Adhena et al. 2018), highlights the importance of timely initiation of complementary feeding and improving both the minimum meal frequency and minimum dietary diversity among children age 6-11 months.
Between 2011 and 2016, our findings show that the recommended practice of MAD improved in the following groups: Provinces 2, 5, and 6; the poorest and poorer wealth quintiles; disadvantaged caste/ethnic groups (Dalit, Terai/Madhesi other caste, and Janajati); children of women with no education; and households with moderate and severe food insecurity. These positive findings may be attributed to the government’s current focus on high-impact, nutrition-specific programs that are integrated and coordinated across sectors. Examples of such programs include Suaahara, the EU-UNICEF Partnership for MSNP, and the AFSP. The programs include maternal, infant, and young child nutrition counseling in their intervention package, which is integrated with health system strengthening, agriculture, and WASH interventions and is supported by mobilized frontline workers who work in the community to target the 1,000-days mothers and their families with consistent, coherent messages that influence the MIYCN practices, especially among the disadvantaged groups (Cunningham et al. 2017; Dahal, Sharma, and Chitekwe 2017; Ministry of Agricultural Development 2016). During implementation, these programs have enhanced the institutional capacity across different sectors and, more importantly, they have strengthened multi-sector coordination for joint planning, implementation, and monitoring of the integrated nutrition interventions (National Planning Commission 2017; Pomeroy-Stevens et al. 2016; Webb et al. 2016). Although the outcome is very positive in reducing inequities among the vulnerable and disadvantaged groups, a detailed understanding and documentation of program and project processes would be a helpful reference and allow replication by other programs and projects.
The fact that the highest rate of improvement is observed in Group A followed by Groups B and C may indicate that the results and impact may be better if the nutrition programs or interventions are scaled-up with a strong emphasis on behavior change communication through different channels to reach the 1,000-days mothers and their families. In all these districts, a strong component of the programs is the scaling-up of MIYCN counseling through frontline workers, which was then integrated with other nutrition-specific interventions across sectors. This helped in reaching the households in marginalized, disadvantaged communities with the appropriate MIYCN messages through personal communication, mobilization of frontline workers and women groups, and context- and culture-specific radio programs (USAID 2018). The association of covariates, namely MIYCN counseling, exposure to health and nutrition programming on TV/Radio, and residence in districts with Group B, C and D nutrition programming with the improved MAD practices also reinforce the importance of scaling-up behavior change communication interventions that use diverse communication channels to promote change at the household level. Similar approaches have been effective in other countries in improving the appropriate MIYCN knowledge and practices (Hoddinott et al. 2018; Osendarp and Roche 2016; Singh et al. 2018).
48
The key predictors for the recommended MAD from the final model were child 12-23 months age and female child, normal and large weight of child at birth, five or more women’s dietary diversity, 30 minutes to obtain drinking water, open defecation free, household with soap and water, Group B, C and D nutrition intervention program districts, MIYCN counseling-Yes, Exposure to TV/Radio health and nutrition program, Rural residence, Middle or Richer household wealth quintile, residence in Terai ecological zone or in Province 4 (Gandaki Province), and women’s education (SLC or higher), while Newar or Janjati caste/ethnic groups are associated with not practicing MAD.
Over the years, a consistent finding (Joshi et al. 2012; Khanal, Sauer, and Zhao 2013) has shown that younger children are less likely to meet the recommended MAD practices, which leaves these children at greater risk of micronutrient deficiencies. Our study reinforces this finding. This indicates a need to provide a nutritious diet to children in terms of quantity and quality, and also highlights the importance of timely initiation of complementary feeding. Our results support the understanding that if women consume a minimum of diverse foods, their children will have greater odds of meeting MAD than children whose mothers do not consume a minimum of diverse foods. Similar results were found in a study by Nguyen et al. (2013).
Having a nutrition intervention program in the district was another predictor for MAD with all district groups (B, C, and D) having lower odds of meeting recommended practices than Group A. This shows that an area benefits with nutritional improvement from integrated nutrition interventions with an enhanced multi-sector coordination structure in place, and through community- and household-focused behavior-change communication strategies. These include districts where IYCF practices are well integrated and targeted to reach all 1,000-days beneficiaries, including mothers-in-law and husbands as part of the household approach, and additional attention to disadvantaged communities. Our findings related to improved MAD practices among the higher wealth quintiles and among children of women with higher education are consistent with studies from neighboring countries (Campbell et al. 2018; Na et al. 2018).
There are spatial variations in terms of MAD practices in Nepal. Although rural areas and Province 4 (Gandaki Province) had greater odds of meeting recommended practices in comparison to urban and other provinces, the Terai Region was 64% less likely to meet the practice compared to other ecological zones. Moreover, the Newar and Janajati groups had lower odds of meeting the recommended practices. These findings suggest that determinants of IYCF practices are complex, with variations in MAD practices by province, residence, and ecological zone serving as reminders that the sociocultural diversity of Nepal may play a complex role in determining MAD practices. It is important to support quantitative results with qualitative insights gleaned from focus groups and other methods in order to better understand the origin of cultural practices and to tailor innovative strategies to the specific locale, and all socio-ethnic and socioeconomic groups. The findings support the positive role played by the media and MIYCN counseling because some study locales had greater exposure to the media and access to counseling services.
6.3 Limitations of the Study
This study assessed the determinants for stunting and the MAD based on the DHS data sets, which are cross-sectional surveys. The findings can only show association between any two variables, and not the causality. For most of the explanatory variables, DHS collects information retrospectively from respondents on practices, behaviors, and events. Such information may be subject to recall and social desirability bias. Some practices such as exclusive breastfeeding, dietary diversity, and women’s dietary

49
practices are based on the practices of the previous 24 hours and, as such, may not be an accurate measure of common practice.
For the analysis purpose in this study, all the districts are grouped based on the type of programs or interventions being implemented. One of the limitations of this study is that while we would have liked to do a detailed analysis based on the comprehensive information on the scale and coverage of the programs and interventions of districts in this report, we did not look for all the specificities as it was beyond the scope of this work. In addition, we couldn't find an exhaustive documentation about all the programs and interventions in all the districts of the country. Government or partners might look at these aspects through a separate study.
6.4 Policy and Programmatic Implications
A multi-sector approach is key for improved nutrition outcome. In Nepal, there is a range of determinants for stunting and MAD in children. The key determinants of stunting are increasing age of child, low birthweight of child, not receiving all basic vaccines, soap and water not available in the household, access to a government health facility, lack of access to media, province, lack of wealth, mothers’ lack of education, mothers’ non-agricultural occupation, and household size. Similarly, the age and weight of the child, women’s dietary diversity score, time to obtain drinking water, open defecation free, handwashing with soap and water, MIYCN counseling, province, residence, wealth quintile, caste/ethnicity, women’s education, and nutrition-intensive program in the district are determinants of MAD. Our findings reveal the multi-sector nature of nutrition, and the need for any solution to stunting must also be multi-sector. It is important for the government to view nutrition policy through a multi-sector lens with multi-sector planning, implementation, and evaluation of nutrition programs at all the levels. Given the country’s recent transition to a federal structure, this approach needs to be enhanced at the local level.
Multi-sectoral actions composed of both nutrition-specific as well as nutrition-sensitive interventions with convergence of integrated interventions at the targeted households for targeted beneficiaries should be taken into consideration by the local level while they plan and implement such programs. While it is important to scale-up these programs, it is essential to devise appropriate strategies for improving the coverage of interventions, especially with a focus on reaching the beneficiaries who are in real need.
A blanket approach is not the answer. While the integrated package of interventions yields the highest impact, the universal approach is not necessarily the appropriate answer to addressing the context-specific determinants of stunting and feeding practices throughout Nepal. It is crucial for federal, state, and local governments to adapt the approach of service delivery to their own realities and context. For instance: Province 2’s context is entirely different from Province 6 (Karnali Province), despite the fact that both have high stunting rates. Therefore, it is important to understand each context and the local determinants in order to package the interventions and determine the best delivery to beneficiaries.
The need for a lifecycle approach to nutrition programming. The results show that there are different determinants of stunting and feeding practices that target women, children, and caretakers. In concurrence with the UNICEF conceptual framework, nutritional programming should address the various levels of determinants with a focus on women, children, and adolescent girls so that the intergenerational cycle of chronic malnutrition can be broken.
The importance of tailoring intensive approaches for sustainable reduction in the gap. The findings show that when integrated interventions are tailored to the needs of the various targeted groups, places,

50
and context, overall achievement may be higher and, more importantly, inequity gaps may be reduced. Given the diversity of Nepal, the approaches for service delivery must be tailored to reach the most disadvantaged and vulnerable groups. Based on the evidence, local, state, and federal authorities need to plan nutrition actions so that equity is enhanced across all socioeconomic and geographic domains.
6.5 Conclusion
Nepal has reduced the prevalence of stunting and improved the recommended complementary feeding practices, especially among the disadvantaged groups in the past 5 years. Yet, disparities exist across different socioeconomic and socio-geographic areas. Current determinants of stunting and feeding practices show that there is a need to strengthen the multi-sector approach to nutrition across sectors: health, WASH, agriculture, and education. Recent efforts that incorporated policy coherence across sectors and implementation of large-scale integrated nutrition interventions that focused on the life-cycle approach and reaching disadvantaged groups have begun reducing the gaps. As a socioeconomically and geographically diverse country, Nepal needs a tailored approach with intensive nutrition interventions that reach the underserved with an integrated package of nutrition-specific and nutrition-sensitive interventions. This will help the country achieve its 2030 target of reducing stunting in children and realizing the goal of all Nepalese children reaching their full potential.

51
REFERENCES
Adhena, B. M., D. T. Yemane, A. B. Bekele, and A. A. Tasew. 2018. “Determinants of Minimum Acceptable Diet among 6–23 Months Age Children in Ethiopia: A Multilevel Analysis of the Ethiopian Demographic Health Survey.” bioRxiv 393678. https://doi.org/10.1101/393678.
Ahmed, T., M. Mahfuz, S. Ireen, A. S. Ahmed, S. Rahman, M. M. Islam, N. Alam, et al. 2012. “Nutrition of Children and Women in Bangladesh: Trends and Directions for the Future.” Journal of Health, Population, and Nutrition 30 (1): 1-11.
Black, R. E., C. G. Victora, S. P. Walker, Z. A. Bhutta, P. Christian, M. De Onis, M. Ezzati, et al. 2013. “Maternal and Child Undernutrition and Overweight in Low-Income and Middle-Income Countries.” The Lancet 382 (9890): 427-451. https://doi.org/10.1016/S0140-6736(13)60937-X.
Campbell, R. K., V. Aguayo, Y. Kang, L. Dzed, V. Joshi, J. Waid, S. D. Gupta, N. Haselow, and K. P. West Jr. 2018. “Infant and Young Child Feeding Practices and Nutritional Status in Bhutan.” Maternal & Child Nutrition 14 (3): e12580. https://doi.org/10.1111/mcn.12580.
Cunningham, K., D. Headey, A. Singh, C. Karmacharya, and P. P. Rana. 2017. “Maternal and Child Nutrition in Nepal: Examining Drivers of Progress from the Mid-1990s to 2010s.” Global Food Security 13: 30-37. https://doi.org/10.1016/j.gfs.2017.02.001.
Cunningham, K., M. Ruel, E. Ferguson, and R. Uauy. 2015. “Women's Empowerment and Child Nutritional Status in South Asia: A Synthesis of the Literature.” Maternal & Child Nutrition 11 (1): 1-19. https://doi.org/10.1111/mcn.12125.
Dahal, P., A. Sharma, and S. Chitekwe. 2017. “A Journey to Multi-Sector Nutrition Programming in Nepal: Evolution, Processes and Way Forward.” Field Exchange 54: 77-79. www.ennonline.net/fex/54/multisectornutritionnepal.
Department of Health Services. 2017. Annual Report Department of Health Services 2072/73 (2015/16). Kathmandu, Nepal: Department of Health Services, Ministry of Health, Government of Nepal. http://dohs.gov.np/wp-content/uploads/2017/06/DoHS_Annual_Report_2072_73.pdf.
FAO and FHI360. 2016. Minimum Dietary Diversity for Women: A Guide for Measurement. Rome, Italy: FAO.
FAO and WHO. 2014. “Conference Outcome Document: Framework for Action.” In Second International Conference of Nutrition (ICN2), Rome/Italy.
Graziose, M. M., S. M. Downs, Q. O’Brien, and J. Fanzo. 2018. “Systematic Review of the Design, Implementation and Effectiveness of Mass Media and Nutrition Education Interventions for Infant and Young Child Feeding.” Public Health Nutrition 21 (2): 273-287. https://doi.org/10.1017/S1368980017002786
Harding, K. L., V. M. Aguayo, G. Namirembe, and P. Webb. 2017. “Determinants of Anemia among Women and Children in Nepal and Pakistan: An Analysis of Recent National Survey Data.” Maternal & Child Nutrition 14 (suppl 4): e12478. https://doi.org/10.1111/mcn.12478.

52
Headey, D., J. Hoddinott, and S. Park. 2016. “Drivers of Nutritional Change in Four South Asian Countries: A Dynamic Observational Analysis.” Maternal & Child Nutrition 12(s1): 210-218. https://doi.org/10.1111/mcn.12274.
Hoddinott, J., A. Ahmed, N. I. Karachiwalla, and S. Roy. 2018. “Nutrition Behaviour Change Communication Causes Sustained Effects on IYCN Knowledge in Two Cluster-Randomised Trials in Bangladesh.” Maternal & Child Nutrition 14 (1): e12498. https://doi.org/10.1111/mcn.12498.
Huda, T. M., T. T. Ashraful Alam, M. M. Hasan, J. Khan, M. M. Rahman, A. B. Siddique, S. El Arifeen, and M. J. Dibley. 2018. “Mobile-Based Nutrition Counseling and Unconditional Cash Transfers for Improving Maternal and Child Nutrition in Bangladesh: Pilot Study.” JMIR mHealth and uHealth 6 (7): e156. https://doi.org/ 10.2196/mhealth.8832.
Joshi, N., K. E. Agho, M. J. Dibley, U. Senarath, and K. Tiwari. 2012. “Determinants of Inappropriate Complementary Feeding Practices in Young Children in Nepal: Secondary Data Analysis of Demographic and Health Survey 2006.” Maternal & Child Nutrition 8: 45-59. https://doi.org/10.1111/j.1740-8709.2011.00384.x.
Khanal, V., K. Sauer, and Y. Zhao. 2013. “Determinants of Complementary Feeding Practices among Nepalese Children Aged 6–23 Months: Findings from Demographic and Health Survey 2011.” BMC Pediatrics 13 (131): 1-13. https://doi.org/10.1186/1471-2431-13-131.
Kjeldsberg, C., N. Shrestha, M. Patel, D. Davis, G. Mundy, and K. Cunningham. 2018. “Nutrition-Sensitive Agricultural Interventions and Gender Dynamics: A Qualitative Study in Nepal.” Maternal & Child Nutrition 14 (3): e12593. https://doi.org/10.1111/mcn.12593.
Malapit, H. J. L., S. Kadiyala, A. R. Quisumbing, K. Cunningham, and P. Tyagi. 2015. “Women’s Empowerment Mitigates the Negative Effects of Low Production Diversity on Maternal and Child Nutrition in Nepal.” The Journal of Development Studies 51 (8): 1097-1123. https://doi.org/10.1080/00220388.2015.1018904.
Menon, P., D. Headey, R. Avula, and P. H. Nguyen. 2018. “Understanding the Geographical Burden of Stunting in India: A Regression-Decomposition Analysis of District-Level Data from 2015-16.” Maternal & Child Nutrition 14 (4): e12620. https://doi.org/10.1111/mcn.12620.
Ministry of Agricultural Development. 2016. Beneficiary Results Assessment Survey Report: Agriculture and Food Security Project. Kathmandu, Nepal: Ministry of Agricultural Development, Government of Nepal. http://afsp.gov.np/downloadfile/MTR%20Impact%20Assessment%20Report_1506329060.pdf.
Ministry of Health - MOH/Nepal, New ERA/Nepal, and ICF. 2017. Nepal Demographic and Health Survey 2016. Kathmandu, Nepal: MOH/Nepal, New ERA, and ICF. http://dhsprogram.com/pubs/pdf/FR336/FR336.pdf.
Ministry of Health and Population. 2015a. Health Sector Strategy for Addressing Maternal Undernutrition: Nepal. Kathmandu, Nepal: Department of Health Services, MoHP, Government of Nepal.

53
Ministry of Health and Population. 2015b. Nepal Health Sector Programme (NHSP III) 2015–2020. Kathmandu, Nepal: Ministry of Health and Population, Government of Nepal. http://nhsp.org.np/wp-content/uploads/2015/01/NHSP-3-Results-Framework_jan25.pdf.
Ministry of Health and Population. 2017. Strategy for Infant and Young Child Feeding: Nepal 2016. Kathmandu, Nepal: Child Health Division, Department of Health Services, MoHP, Government of Nepal.
Ministry of Health Population - MOHP/Nepal, New ERA/Nepal, and ICF International. 2012. Nepal Demographic and Health Survey 2011. Kathmandu, Nepal: MOHP/Nepal, New ERA, and ICF International. http://dhsprogram.com/pubs/pdf/FR257/FR257.pdf.
Na, M., V. M. Aguayo, M. Arimond, P. Dahal, B. Lamichhane, R. Pokharel, S. Chitekwe, and C. P. Stewart. 2017. “Trends and Predictors of Appropriate Complementary Feeding Practices in Nepal: An Analysis of National Household Survey Data Collected between 2001 and 2014.” Maternal & Child Nutrition 14 (s4): e12564.
Na, M., V. M. Aguayo, M. Arimond, A. Narayan, and C. P. Stewart. 2018. “Stagnating Trends in Complementary Feeding Practices in Bangladesh: An Analysis of National Surveys from 2004-2014.” Maternal & Child Nutrition 14 (s4): e12624.
National Planning Commission. 2012. Multi-Sector Nutrition Plan for Accelerating the Reduction of Maternal and Child Under-Nutrition in Nepal 2013-2017. Kathmandu, Nepal: National Planning Commission, Government of Nepal. http://www.nnfsp.gov.np/PublicationFiles/e3ccdbda-e8ab-4b20-80c2-3f65e19e0fd4.pdf.
National Planning Commission. 2014. Annual Development Program to Be Implemented in the Districts for FY 2071/72. Kathmandu, Nepal: National Planning Commission, Government of Nepal. https://www.npc.gov.np/images/category/bhag2071-72_grand_final.pdf.
National Planning Commission. 2017. Multi-Sector Nutrition Plan II 2018–2022. Kathmandu, Nepal: National Planning Commission, Government of Nepal.
Nguyen, P. H., R. Avula, M. T. Ruel, K. K. Saha, D. Ali, L. M. Tran, E. A. Frongillo, P. Menon, and R. Rawat. 2013. “Maternal and Child Dietary Diversity Are Associated in Bangladesh, Vietnam, and Ethiopia, 2.” The Journal of Nutrition 143 (7): 1176-1183. https://doi.org/10.3945/jn.112.172247.
Osendarp, S. J., and M. L. Roche. 2016. “Behavioral Change Strategies for Improving Complementary Feeding and Breastfeeding.” In Hidden Hunger, 184-192. Basel, Switzerland: Karger Publishers.
Patel, A., P. Kuhite, A. Puranik, S. S. Khan, J. Borkar, and L. Dhande. 2018. “Effectiveness of Weekly Cell Phone Counselling Calls and Daily Text Messages to Improve Breastfeeding Indicators.” BMC Pediatrics 18 (1): 337.
Pomeroy-Stevens, A., M. B. Shrestha, M. Biradavolu, K. Hachhethu, R. Houston, I. Sharma, and J. Wun. 2016. Pathways to Better Nutrition in Nepal. Arlington, VA: Strengthening Partnerships, Results, and Innovations in Nutrition Globally (SPRING) project.
SAARC. 2014. South Asia Regional Framework for Nutrition. Kathmandu, Nepal: South Asian Association of Regional Cooperation (SAARC).

54
Shekar, M., J. Kakietek, J. Dayton Eberwein, and D. Walters. 2017. An Investment Framework for Nutrition: Reaching the Global Targets for Stunting, Anemia, Breastfeeding, and Wasting: The World Bank.
Shroff, M., P. Griffiths, L. Adair, C. Suchindran, and M. Bentley. 2009. “Maternal Autonomy Is Inversely Related to Child Stunting in Andhra Pradesh, India.” Maternal & Child Nutrition 5 (1): 64-74.
Singh, A., R. D. Klemm, G. Mundy, P. P. Rana, B. Pun, and K. Cunningham. 2018. “Improving Maternal, Infant and Young Child Nutrition in Nepal Via Peer Mobilization.” Public Health Nutrition 21 (4): 796-806.
Smith, L. C., U. Ramakrishnan, A. Ndiaye, L. Haddad, and R. Martorell. 2003. “The Importance of Women's Status for Child Nutrition in Developing Countries: International Food Policy Research Institute (IFPRI) Research Report Abstract 131.” Food and Nutrition Bulletin 24 (3): 287-288.
Stevens, G. A., M. M. Finucane, C. J. Paciorek, S. R. Flaxman, R. A. White, A. J. Donner, M. Ezzati, and N. I. M. S. Group. 2012. “Trends in Mild, Moderate, and Severe Stunting and Underweight, and Progress Towards MDG 1 in 141 Developing Countries: A Systematic Analysis of Population Representative Data.” The Lancet 380 (9844): 824-834. https://doi.org/10.1016/S0140-6736(12)60647-3.
UNICEF. 1991. “Conceptual Framework of the Causes of Malnutrition.” New York: UNICEF.
UNICEF. 2018a. Child Stunting, Hidden Hunger, and Human Capital in South Asia: Implications for Sustainable Development Post 2015. Kathmandu, Nepal: UNICEF.
UNICEF. 2018b. Stop Stunting: Power of Maternal Nutrition. Scaling up the Nutritional Care of Women in South Asia. Kathmandu, Nepal: UNICEF.
UNICEF, WHO, and World Bank. 2018. Levels and Trends in Child Malnutrition: UNICEF/WHO/World Bank Group Joint Child Malnutrition Estimates: Key Findings of the 2017 Edition. Washington, DC: World Bank Group.
United Nations. 2015. “Transforming Our World: The 2030 Agenda for Sustainable Development. A/Res/70/1.” In Resolution adopted by the General Assembly. New York, NY.
USAID. 2014. Multi-Sectoral Nutrition Strategy 2014–2025. Washington, DC: USAID.
USAID. 2018. SUAAHARA II Good Nutrition Program: Annual Survey Year One (2017). AID-367-A-16-00006. Kathmandu, Nepal: SUAAHARA, USAID.
Webb, P., S. Ghosh, R. Shrestha, G. Namirembe, S. Gurung, D. Sapkota, W. F. Bell, et al. 2016. “Measuring Nutrition Governance: An Analysis of Commitment, Capability, and Collaboration in Nepal.” Food and Nutrition Bulletin 37 (suppl 4): S170-S182.
WHO. 2014. Comprehensive Implementation Plan on Maternal, Infant and Young Child Nutrition. Geneva, Switzerland: World Health Organization. http://apps.who.int/iris/bitstream/handle/10665/113048/WHO_NMH_NHD_14.1_eng.pdf.
WHO. 2015. The WHO Child Growth Standards. 2013. Geneva, Switzerland: World Health Organization.

55
WHO. 2018. Reducing Stunting in Children: Equity Considerations for Achieving the Global Nutrition Targets 2025. Geneva, Switzerland: World Health Organization. https://www.who.int/nutrition/publications/severemalnutrition/reducing-stunting-children-equity/en/.


57
APPENDICES
Appendix Table A1 District categorization
Group A Group B Group C Group D
District District District District Taplejung Bardiya Sankhuwasabha Bara Bhojpur Dang Rasuwa Rautahat Solukhumbu Dhanusha Gorkha Siraha Dolakha Dolpa Nawalparasi Udaypur Sindhupalchowk Humla Rupandehi Sindhuli Lamjung Jajarkot Bajura Khotang Myagdi Jumla Achham Terhathum Baglung Kalikot Dadeldhura Jhapa Parbat Kanchanpur Illam Syangja Kapilvastu Panchthar Darchula Mahottari Kaski Bajhang Makwanpur Tanahu Nuwakot Morang Dhading Baitadi Mugu Kavre Doti Okhaldhunga Chitwan Palpa Banke Parsa Rolpa Rukum Salyan Saptari Dailekh Sarlahi Surkhet Sunsari Pyuthan Arghakhanchi Ramechhap Kailali Gulmi Kathmandu Lalitpur Bhaktapur Dhankuta

58
Appendix Table A2 Trends in the distribution in study population of covariates for stunting, Nepal DHS 2011-2016
Characteristics
2011 2016 Percentage
point change
2016-2011 p-value % N 95% CI % N 95% CI
Stunting No 59.7 1,419 56.9-62.6 64.4 1,512 61.9-66.8 -4.6 * Yes 40.3 957 37.4-43.2 35.7 838 33.3-38.1 4.6
Age of child (in months) 0-11 19.5 463 17.5-21.6 19.8 465 18.0-21.2 -0.3
12-17 11.2 266 9.6-13.0 9.8 231 8.6-11.2 1.4 18-23 9.1 216 7.8-10.6 11.9 279 10.5-13.4 -2.8 24-35 20.2 479 18.3-22.2 18.9 445 17.3-20.7 1.2 36-47 21.2 504 19.2-23.5 20.3 476 18.5-22.2 1.0 48-59 18.9 448 17.3-20.5 19.3 454 17.8-20.9 -0.5
Sex of child Male 50.8 1,207 48.4-53.2 52.2 1,227 50.1-54.3 -1.4 Female 49.2 1,169 46.8-51.6 47.8 1,122 45.7-49.9 1.4
Weight of child at birth Small (<2.5 kg) 11.5 98 9.1-14.5 12.3 178 10.5-14.4 -0.8
* Normal (2.5-3.49 kg) 52.1 444 47.7-56.4 57.7 833 54.6-60.7 -5.6 Large (≥3.5 kg) 36.4 311 31.9-41.2 30.0 433 27.0-33.2 6.4
Mother’s age 15-24 years 41.9 995 39.3-44.5 42.4 997 39.5-45.4 -0.5
25-34 years 46.3 1,100 43.3-49.3 48.4 1,136 45.7-51.0 -2.1 35-49 years 11.8 281 10.0-13.9 9.2 216 7.7-11.0 2.6
Mother’s BMI Underweight (<18.5) 19.6 464 17.0-22.5 19.2 450 16.8-21.9 0.4
*** Normal (18.5-24.9) 71.1 1,683 67.8-74.1 65.2 1,530 62.3-68.0 5.9 Overweight/obese (≥25) 9.3 221 7.6-11.4 15.6 366 13.6-17.8 -6.3
Mother’s height Less than 145 cm 11.8 280 9.8-14.2 11.2 262 9.5-13.1 0.7 145 cm or more 88.2 2,087 85.8-90.2 88.8 2,083 86.9-90.5 -0.7
Mother’s anemia status Anemic 38.1 892 34.4-42.0 45.7 1,067 42.5-48.9 -7.6 ** Non-anemic 61.9 1,450 58.1-65.6 54.3 1,267 51.1-57.5 7.6
Birth interval Less than 3 years 49.5 762 45.2-53.8 46.5 676 43.0-50.1 3.0 3 years or more 50.5 778 46.2-54.8 53.5 777 50.0-57.0 -3.0
Birth order First born 35.1 833 32.5-37.8 38.0 893 35.7-40.4 -3.0
*** 2-4 51.9 1,232 49.3-54.4 53.7 1,262 51.4-56.1 -1.9 5 or more 13.1 310 10.9-15.6 8.2 194 6.7-10.1 4.8
Mother’s dietary diversity Less than 5 food groups na na na 69.2 1,625 66.2-72.1 na 5 or more food groups na na na 30.8 724 28.0-33.8 na
Mother smoking status Smoking 12.0 284 9.8-14.5 5.5 129 4.3-7.1 6.5 *** Non-smoking 88.0 2,092 85.5-90.2 94.5 2,220 92.9-95.7 -6.5
Early initiation of breastfeeding Child was breastfed within 1 hr.
of birth 43.7 423 38.9-48.7 55.4 544 51.6-59.2 -11.7 *** Child was not breastfed within 1 hr. of birth 56.3 545 51.3-61.1 44.6 438 40.8-48.4 11.7
Exclusive breastfeeding Child was exclusively breastfed 18.6 171 15.2-22.6 15.7 151 13.4-18.4 2.9
Child was not exclusively breastfed 81.4 749 77.4-84.8 84.3 810 81.6-86.7 -2.9
Minimum meal frequency Child was not fed meal with
recommended minimum number of times 21.7 153 17.6-26.5 31.5 236 27.8-35.4 -9.7 ** Child was fed meal with recommended minimum number of times 78.3 553 73.5-82.4 68.6 513 64.6-72. 9.7
(Continued…)

59
Appendix Table A2—Continued
Characteristics
2011 2016 Percentage
point change
2016-2011 p-value % N 95% CI % N 95% CI
Minimum dietary diversity Child was not fed with minimum
dietary diversity 71.0 502 65.8-75.8 55.7 417 51.6-59.7 15.3 *** Child was fed with minimum dietary diversity 29.0 205 24.3-34.2 44.3 332 40.3-48.4 -15.3
Minimum acceptable diet Child was not fed with minimum
acceptable diet 74.1 523 69.1-78.5 67.5 506 63.4-71.4 6.6 * Child was fed with minimum acceptable diet 25.9 183 21.5-30.9 32.5 243 28.6-36.6 -6.6
Vaccinations Child (12-23 months) received
all basic vaccines 26.4 628 23.8-29.2 24.9 584 22.9-26.9 1.6 Child (12-23 months) not
received all basic vaccines 73.6 1,748 70.8-76.2 75.2 1,765 73.1-77.1 -1.6 Any illnesses
Child had no illness 70.6 1,678 68.2-73.0 74.4 1,749 72.2-76.5 -3.8 * Child had any illness 29.4 698 27.0-31.8 25.6 601 23.5-27.8 3.8 Treatment of water before drinking
No treatment done 87.4 2,076 84.4-89.8 81.3 1,907 78.3-84.0 6.1 ** Treatment done 12.6 300 10.2-15.6 18.7 439 16.0-21.7 -6.1 Open defecation
Open Defecation Free 51.3 1,219 45.2-57.4 77.4 1,819 73.0-81.3 -26.1 *** Open Defecation 48.7 1,157 42.6-54.9 22.6 530 18.7-27.0 26.1 Handwashing
Household with no soap and water 63.6 1,499 58.8-68.1 62.2 1,456 58.4-65.9 1.4
Household with soap and water 36.5 860 31.9-41.2 37.8 885 34.1-41.7 -1.4 Use of cooking fuel
Clean fuel 14.0 330 11.5-16.9 23.61 553 20.5-27.1 -9.6 *** Solid fuel 86.0 2,028 83.1-88.5 76.39 1,788 72.9-79.6 9.6 Access to government health facility
<30 minutes na na na 51.8 1,208 46.9-56.6 na 30-60 minutes na na na 36.8 859 32.3-41.5 na 60+ minutes na na na 11.4 267 9.1-14.3 na
Place of delivery Home/other 65.7 1,549 62.0-69.2 42.8 1,001 39.2-46.4 22.9 *** Health facility 34.4 810 30.8-38.1 57.2 1,340 53.6-60.8 -22.9
ANC visit None 16.8 317 13.7-20.4 5.5 106 4.4-6.9 11.3
*** 1-3 34.4 647 30.8-38.1 25.5 489 22.8-28.5 8.8 4 or more 48.8 919 44.4-53.3 68.9 1,320 65.7-72.0 -20.1
MIYCN counseling No na na na 83.8 1,960 81.2-86.0 na Yes na na na 16.3 380 14.0-18.8 na
Mother’s media exposure Access none of the 3 media at
all 14.8 351 11.8-18.4 23.1 544 20.2-26.4 -8.4
***
Access any of three media (radio, television or newspaper) less than once a week 30.7 729 27.2-34.4 23.8 560 21.4-26.5 6.9
Access any of three media (radio, television or newspaper) at least once a week 54.5 1,296 49.5-59.5 53.0 1,246 49.5-56.5 1.5
Exposure to TV/radio health and nutrition program Heard/seen none of the
TV/radio health and nutrition programs 65.3 1,551 70.2-70.1 61.6 1,446 58.0-65.0 3.7
Heard/seen any one of the TV/radio health and nutrtion programs 34.7 825 29.9-39.9 38.4 903 35.0-42.0 -3.7
(Continued…)

60
Appendix Table A2—Continued
Characteristics
2011 2016 Percentage
point change
2016-2011 p-value % N 95% CI % N 95% CI
Nutrition intervention program district Group A 11.7 277 8.3-16.1 10.1 237 7.7-13.1 1.6
Group B 38.2 908 30.4-46.6 35.4 832 29.7-41.6 2.8 Group C 9.6 229 7.3-12.6 9.2 216 6.3-13.2 0.4 Group D 40.5 963 33.0-48.5 45.3 1,064 39.0-51.8 -4.8
Province Province 1 21.2 499 17.4-25.4 15.7 368 13.9-17.8 5.4
*
Province 2 21.0 494 15.3-28.1 27.5 643 24.5-30.6 -6.5 Province 3 13.1 309 10.2-16.7 15.2 355 12.4-18.3 -2.0 Province 4 11.0 259 8.0-15.0 7.7 180 6.4-9.2 3.3 Province 5 14.7 346 11.3-18.9 18.9 442 16.6-21.4 -4.2 Province 6 7.7 182 5.54-10.6 6.3 148 5.5-7.3 1.4 Province 7 11.4 269 9.8-13.3 8.8 205 7.4-10.4 2.6
Household wealth quintile Poorest 25.6 608 21.7-29.9 20.6 483 17.6-23.9 5.0
Poorer 20.3 482 17.6-23.3 21.7 510 19.3-24.4 -1.4 Middle 23.3 554 19.5-27.7 22.7 532 20.2-25.3 0.7 Richer 17.1 406 14.5-20.1 21.7 510 18.6-25.2 -4.6 Richest 13.7 326 10.9-17.1 13.4 314 10.9-16.2 0.4
Ecological zone Mountain 7.9 188 6.9-9.1 7.0 163 4.8-10.0 1.0
Hill 39.5 938 35.9-43.1 36.6 860 31.9-41.6 2.9 Terai 52.6 1,250 48.7-56.5 56.4 1,325 51.5-61.2 -3.8
Caste/ethnicity Brahmin/Chhetri 30.7 727 26.4-35.2 27.4 644 24.1-30.9 3.3
*
Terai/Madhesi other 9.4 230 6.5-13.5 20.3 474 16.3-24.9 -10.9 Dalit 18.2 433 14.1-23.1 14.4 338 11.9-17.4 3.8 Newar 2.7 63 1.8-4.1 3.1 72 2.1-4.5 -0.4 Janajati 33.0 779 27.6-38.8 27.9 658 24.4-31.8 5.0 Muslim 6.2 146 2.8-13.3 7.0 163 4.3-11.1 -0.8
Mother’s education No education 47.4 1,119 42.2-52.8 34.6 812 31.5-37.9 12.8
*** Primary 19.7 461 17.1-22.6 20.1 471 17.8-22.6 -0.4 Some secondary 19.4 459 16.6-22.5 24.0 560 21.6-26.6 -4.6 SLC or higher 13.5 319 11.1-16.3 21.3 498 18.8-24.0 -7.8
Mother’s occupation Not working 28.1 667 23.8-32.7 39.9 937 36.0-43.9 -11.8
*** Non-agricultural 12.0 285 10.0-14.3 14.1 332 12.3-16.2 -2.1 Agricultural (Self-employed) 59.9 1,424 55.2-64.5 46.0 1,080 42.0-50.0 14.0
Household size 4 or less 28.1 667 25.4-31.0 30.1 708 27.3-33.1 -2.1 More than 4 71.9 1,709 69.0-74.6 69.9 1,641 66.9-72.7 2.1
Household food security Food secure 43.1 1,024 39.0-47.3 40.9 961 37.7-44.2 2.2
*** Mild food insecurity 12.3 292 10.3-14.6 22.7 534 20.3-25.3 -10.4 Moderate food insecurity 23.3 553 20.2-26.7 25.8 606 23.2-28.6 -2.5 Severe food insecurity 21.3 507 18.0-25.1 10.6 248 8.7-12.7 10.8
Mother’s decision making Cannot make decision 47.3 437 42.6-52.0 55.1 1,196 51.9-58.3 -7.8 ** Can make decision 52.7 487 48.0-57.4 44.9 974 41.8-48.1 7.8
Mother’s internet use Not used in past 12 months na na na 17.3 406 15.0-19.9 na Used in past 12 months na na na 82.7 1,943 80.2-85.0 na
Mother owns a mobile phone No na na na 23.5 551 79.5-85.6 na Yes na na na 76.5 1,798 14.4-20.5 na
Mother’s experience of spousal violence Did not experience 78.3 1,458 74.8-81.5 82.8 1,490 79.5-85.6 -4.5
Experienced 21.7 404 18.6-25.2 17.2 310 14.4-20.5 4.5 na = not available *** p<0.001, **p<0.01, *p<0.05 1 p-value is the result of a chi-square test of independence between covariate and survey year.

61
Appendix Table A3 Association of stunting and child-instrinsic; maternal, infant, and young child feeding; health and environment; and socioeconomic factors. Results from separate multiple logistic regressions, Nepal DHS 2016
Characteristics
Model I Model II
uOR 95% CI aOR 95% CI
Child-instrinsic factors model Age of child (in months)
0-11 Ref 12-17 2.44*** 1.62-3.67 2.01** 1.17-3.45 18-23 3.82*** 2.55-5.73 3.52*** 2.17-5.69 24-35 4.26*** 3.04-5.98 3.97*** 2.56-6.19 36-47 3.42*** 2.41-4.85 2.62*** 1.67-4.11 48-59 3.53*** 2.38-5.22 2.68*** 1.62-4.45
Sex of child Male Ref Female 1.01 0.84-1.24 0.84 0.65-1.08
Weight of child at birth Small (<2.5 kg) Ref Normal (2.5-3.49 kg) 0.45*** 0.31-0.65 0.46*** 0.32-0.67 Large (≥3.5 kg) 0.38*** 0.25-0.58 0.37*** 0.24-0.57
Maternal factors model Mother’s age
15-24 years Ref 25-34 years 1.22 0.97-1.55 1.18 0.92-1.50 35-49 years 1.46* 1.01-2.12 1.14 0.72-1.81
Mother’s BMI Underweight (<18.5) Ref Normal (18.5-24.9) 1.27* 1-1.6 0.75* 0.58-0.96 Overweight/obese (≥25) 1.45 0.99-2.12 0.42*** 0.28-0.62
Mother’s anemia Anemic Ref Non-anemic 0.98 0.8-1.19 1.08 0.88-1.33
Mother’s height Less than 145 cm Ref 145 cm or more 0.34*** 0.25-0.48 0.35 0.25-0.49
Birth interval Less than 3 years Ref 3 years or more or no preceding birth interval 0.54*** 0.46-0.72 0.63*** 0.49-0.81
Birth order First born Ref 2-4 1.37** 1.1-1.71 1.01 0.78-1.30 5 or more 2.14*** 1.48-3.06 1.30 0.78-2.15
Mother’s dietary diversity Less than 5 food groups Ref 5 or more food groups 0.67*** 0.53-0.85 0.79 0.61-1.02
Mother smoking status Smoking Ref Non-smoking 0.58** 0.39-0.87 0.68 0.44-1.05
Infant and young child feeding factors model Early initiation of breastfeeding
Child was breastfed within 1 hr. of birth Ref Child was not breastfed within 1 hr. of birth 1.30 0.92-1.84 1.34 0.93-1.94
Exclusive breastfeeding Child was exclusively breastfed Ref Child was not exclusively breastfed 0.75 1.31-3.67 0.43 0.08-2.2
Minimum Meal Frequency Child was not fed with minimum meal frequency Ref Child was fed with minimum meal frequency 1.39 0.96-2.03 1.60 0.99-2.57
Minimum Dietary Diversity Child was not fed with minimum dietary diversity Ref Child was fed with minimum dietary diversity 0.93 0.64-1.35 1.04 0.55-1.97
Minimum Acceptable Diet Child was not fed with minimum acceptable diet Ref Child was fed with minimum acceptable diet 1.00 0.67-1.49 0.78 0.36-1.7
(Continued…)

62
Appendix Table A3—Continued
Characteristics
Model I Model II
uOR 95% CI aOR 95% CI
Health and environment factors model Vaccinations
Child (12-23 months) received all basic vaccines Ref
Child (12-23 months) had not received all basic vaccines 0.95 0.57-1.59 2.28*** 1.74-2.99
Any illnesses Child had no illness Ref Child had any illness 0.95 0.76-1.18 1.02 0.79-1.31
Treatment of water before drinking No treatment done Ref Treatment done 0.56*** 0.39-0.78 0.92 0.64-1.32
Open defecation Open defecation free Ref Open defecation 2.06*** 1.58-2.67 1.29 0.94-1.76
Handwashing Household with no soap and water Ref Household with soap and water 0.45*** 0.37-0.56 0.64*** 0.5-0.82
Use of cooking fuel Clean fuel Ref Solid fuel 2.25*** 1.66-3.05 1.21 0.89-1.64
Nutrition Intervention Program District Group A Ref Group B 1.08 0.75-1.57 0.94 0.66-1.33 Group C 1.17 0.77-1.76 1.19 0.78-1.81 Group D 0.99 0.7-1.42 1.03 0.74-1.44
Access to government health facility <30 minutes Ref 30-60 minutes 1.24* 0.99-1.53 1.24 0.98-1.57 60+ minutes 1.75*** 1.28-2.4 1.60* 1.11-2.31
Place of delivery Home/other Ref Health facility 0.55*** 0.44-0.67 0.95 0.74-1.24
ANC visit None Ref 1-3 0.69 0.41-1.18 0.97 0.59-1.58 4 or more 0.41*** 0.26-0.65 0.72 0.45-1.15
MIYCN counseling No Ref Yes 0.74 0.55-1.01 0.96 0.72-1.31
Mother’s media exposure Access none of the 3 media at all Ref Access any of 3 media (radio, television or
newspaper) less than once a week 0.59*** 0.45-0.77 0.68* 0.49-0.93 Access any of 3 media (radio, television or
newspaper) at least once a week 0.39*** 0.3-0.48 0.55*** 0.39-0.72 Exposure to TV/radio health and nutrition program
Heard/seen none of the TV/radio health and nutrition programs Ref
Heard/seen any one of the TV/radio health and nutrition programs 0.58*** 0.47-0.73 0.92 0.69-1.23
(Continued…)

63
Characteristics
Model I Model II
uOR 95% CI aOR 95% CI
Socioeconomic factors model Residence
Urban Ref Rural 1.46*** 1.17-1.81 1.08 0.85-1.38
Province Province 1 Ref Province 2 1.17 0.85-1.6 0.65 0.4-1.07 Province 3 0.85 0.55-1.33 1.03 0.69-1.53 Province 4 0.82 0.52-1.29 1.10 0.67-1.81 Province 5 1.23 0.82-1.85 0.96 0.62-1.48 Province 6 2.44*** 1.69-3.54 1.73* 1.12-2.65 Province 7 1.11 0.75-1.63 0.84 0.56-1.27
Household wealth quintile Poorest Ref Poorer 0.63** 0.47-0.85 0.77 0.54-1.1 Middle 0.57*** 0.42-0.77 0.55** 0.37-0.82 Richer 0.50*** 0.37-0.67 0.51** 0.33-0.79 Richest 0.20*** 0.14-0.3 0.34*** 0.19-0.61
Ecological zone Mountain Ref Hill 0.55*** 0.38-0.8 0.91 0.63-1.33 Terai 0.66* 0.47-0.95 1.43 0.93-2.2
Caste/ethnicity Brahmin/Chhetri Ref Terai/Madhesi other 1.41* 1.06-1.88 1.52 0.89-2.59 Dalit 1.26 0.9-1.77 1.10 0.7-1.73 Newar 0.53 0.25-1.14 0.62 0.25-1.56 Janajati 0.94 0.7-1.25 0.80 0.56-1.15 Muslim 1.18 0.79-1.75 1.10 0.62-1.98
Mother’s education No education Ref Primary 0.69** 0.54-0.88 0.76 0.55-1.04 Some secondary 0.55*** 0.42-0.71 0.82 0.59-1.14 SLC or higher 0.35*** 0.26-0.47 0.56* 0.34-0.91
Mother’s occupation Not working Ref Non-agricultural 1.31 0.96-1.79 1.94*** 1.31-2.85 Agricultural (self-employed) 1.61*** 1.3-1.98 1.32 0.99-1.75
Household size 4 or less Ref More than 4 1.55*** 1.22-1.93 1.41* 1.06-1.87
Household food security Food secure Ref Mild food insecurity 1.35* 1.06-1.71 0.87 0.62-1.23 Moderate food insecurity 1.73*** 1.33-2.23 1.08 0.75-1.56 Severe food insecurity 2.10*** 1.4-3.13 1.30 0.81-2.08
Mother’s internet use Used in past 12 months Ref Not used in past 12 months 2.11*** 1.56-2.84 1.06 0.71-1.6
Mother owns a mobile phone No Ref Yes 0.59*** 0.47-0.73 0.84 0.62-1.13
Mother’s decision making Cannot make decision Ref Can make decision 0.88 0.72-1.09 1.12 0.87-1.44
Mother’s experience of spousal violence Did not experience Ref Experienced 1.13 0.84-1.51 0.92 0.66-1.28
*** p<0.001, **p<0.01, *p<0.05

64
Appendix Table A4 Association of minimum acceptable diet and child-instrinsic; maternal; health and environment; and socioeconomic factors. Results from separate multiple logistic regressions, Nepal DHS 2016
Characteristics
Model I Model II
uOR 95% CI aOR 95% CI
Child-instrinsic factors model Age of child (in months)
6-11 Ref 12-23 2.55*** 1.95-3.34 3.67*** 2.29-5.87
Sex of child Male Ref Female 0.97 0.66-1.43 1.07 0.68-1.67
Weight of child at birth Small (<2.5 kg) Ref Normal (2.5-3.49 kg) 1.08 0.68-1.73 0.89 0.46-1.71 Large (≥3.5 kg) 1.13 0.69-1.85 1.09 0.51-2.30
Maternal factors model Mother’s age
15-24 years Ref 25-34 years 1.45** 1.13-1.87 1.30 0.80-2.11 35-49 years 0.98 0.57-1.69 3.29* 1.25-8.64
Birth interval Less than 3 years Ref 3 years or more or no preceding birth
interval 2.06*** 1.53-2.79 0.98 0.572-1.67 Birth order
First born Ref 2-4 0.77 0.58-1.00 0.73 0.44-1.21 5 or more 0.35*** 0.21-0.60 0.38 0.13-1.14
Mother’s anemia Anemic Ref Non-anemic 1.23 0.85-1.78 1.15 0.77-1.73
Mother’s dietary diversity Less than 5 food groups Ref 5 or more food groups 5.31*** 4.17-6.77 5.55*** 3.74-8.25
Health and environment factors model Time to obtain drinking water
Water on premises Ref Less than 30 minutes 1.06 0.77-1.45 1.14 0.81-1.62 30 minutes or longer 0.72 0.40-1.30 0.85 0.47-1.51
Open defecation Open defecation free Ref Open defecation 0.40*** 0.28-0.56 0.62** 0.43-0.89
Handwashing Household with no soap and water Ref Household with soap and water 1.47** 1.15-1.89 0.94 0.69-1.29
Use of cooking fuel Clean fuel Ref Solid fuel 0.55*** 0.41-0.73 0.74 0.54-1.04
Access to government health facility <30 minutes Ref 30-60 minutes 1.02 0.79-1.32 1.01 0.74-1.36 60+ minutes 0.82 0.53-1.25 0.69 0.43-1.12
Any illnesses Child had any illness Ref Child had no illness 0.89 0.69-1.16 0.95 0.71-1.27
ANC No ANC Ref 1-3 ANC visits 0.68 0.26-1.73 0.50 0.19-1.30 4+ ANC visits 1.35 0.60-3.02 0.77 0.32-1.88
Place of delivery Home/other Ref Health facility 1.48** 1.09-2.03 0.88 0.62-1.24
(Continued…)

65
Appendix Table A4—Continued
Characteristics
Model I Model II
uOR 95% CI aOR 95% CI
Nutrition Intervention Program District Group A Ref Group B 0.35*** 0.24-0.52 0.45*** 0.29-0.70 Group C 0.52** 0.32-0.85 0.56* 0.32-0.97 Group D 0.46*** 0.31-0.67 0.50*** 0.34-0.75
MIYCN counseling No Ref Yes 1.94*** 1.45-2.59 1.51** 1.11-2.06
Mother’s media exposure Access none of the 3 media at all Ref Access any of 3 media (radio,
television, or newspaper) less than once a week 1.50* 1.00-2.24 1.10 0.70-1.74
Access any of 3 media (radio, television, or newspaper) at least once a week 2.48*** 1.75-3.51 1.46 0.93-2.29
Mother’s exposure to TV/radio health and nutrition program Heard/seen none of the TV/radio
health and nutrition programs Ref Heard/seen any one of the TV/radio
health and nutrition programs 2.31*** 1.80-2.95 1.59** 1.15-2.21 Socioeconomic factors model Residence
Urban Ref Rural 0.94 0.71-1.22 1.58 0.93-2.68
Province Province 1 Ref Province 2 0.48*** 0.31-0.74 0.91 0.33-2.53 Province 3 1.50 0.93-2.44 2.31 0.93-5.73 Province 4 2.18*** 1.47-3.23 3.17** 1.35-7.44 Province 5 1.46 0.97-2.20 1.48 0.72-3.08 Province 6 1.26 0.81-1.97 1.01 0.45-2.27 Province 7 1.06 0.62-1.83 0.61 0.23-1.63
Household wealth quintile Poorest Ref Poorer 1.15 0.76-1.73 2.03 0.99-4.17 Middle 0.88 0.59-1.32 2.76** 1.31-5.83 Richer 1.61* 1.04-2.48 2.76* 1.21-6.27 Richest 2.30*** 1.48-3.58 1.99 0.68-5.78
Ecological zone Mountain Ref Hill 1.16 0.69-1.96 0.44 0.19-1.04 Terai 0.51* 0.31-0.87 0.26** 0.10-0.71
Caste/ethnicity Brahmin/Chhetri Ref Terai/Madhesi other 0.28*** 0.18-0.44 0.40 0.14-1.13 Dalit 0.44*** 0.29-0.66 0.68 0.31-1.51 Newar 0.52* 0.30-0.90 0.11*** 0.03-0.40 Janajati 0.49*** 0.34-0.70 0.45* 0.24-0.85 Muslim 0.25*** 0.12-0.49 0.59 0.14-2.46
Mother’s education No education Ref Primary 1.05 0.60-1.84 0.89 0.42-1.89 Some secondary 2.16** 1.33-3.48 1.94 0.99-3.81 SLC or higher 3.83*** 2.23-6.57 3.96** 1.57-10.01
Household size 4 or less Ref More than 4 0.66*** 0.51-0.85 1.10 0.69-1.74
Household food security Food secure Ref Food insecure 0.55*** 0.43-0.71 0.76 0.45-1.30
(Continued…)

66
Appendix Table A4—Continued
Characteristics
Model I Model II
uOR 95% CI aOR 95% CI
Mother’s decision making Cannot make decision Ref Can make decision 1.54** 1.12-2.11 1.05 0.67-1.66
Mother’s internet use Used in past 12 months Ref Not used in past 12 months 0.50*** 0.38-0.67 1.29 0.68-2.45
Mother owns a mobile phone No Ref Yes 1.79*** 1.35-2.38 0.82 0.43-1.55
Mother’s experience of spousal violence Did not experience Ref Experienced 0.53 0.27-1.02 0.67 0.32-1.41
*** p<0.001, **p<0.01, *p<0.05