child progress report guidance for teachers
TRANSCRIPT

Child Progress Report Guidance for Teachers The Child Report provides information about a child’s knowledge, skills, and behaviors across a range of developmental domains1 that are aligned with California’s early learning and development foundations.2 Educators may use the results to guide individual instruction and modify curriculum; they may also share them with families and other providers in order to better understand and plan support for each child’s learning and development. Along with a system for organizing ongoing observation notes and completing the Desired Results Developmental Profile (DRDP) (2015), the Child Report provides teachers, service providers, and families with information about a child’s development, indicating areas of strength and areas for further support.
What information is displayed on the Child ProgressReport? • The Child Report displays the child’s domain ratings for the DRDP (2015) for the assessment period,
indicated at the top of the page.
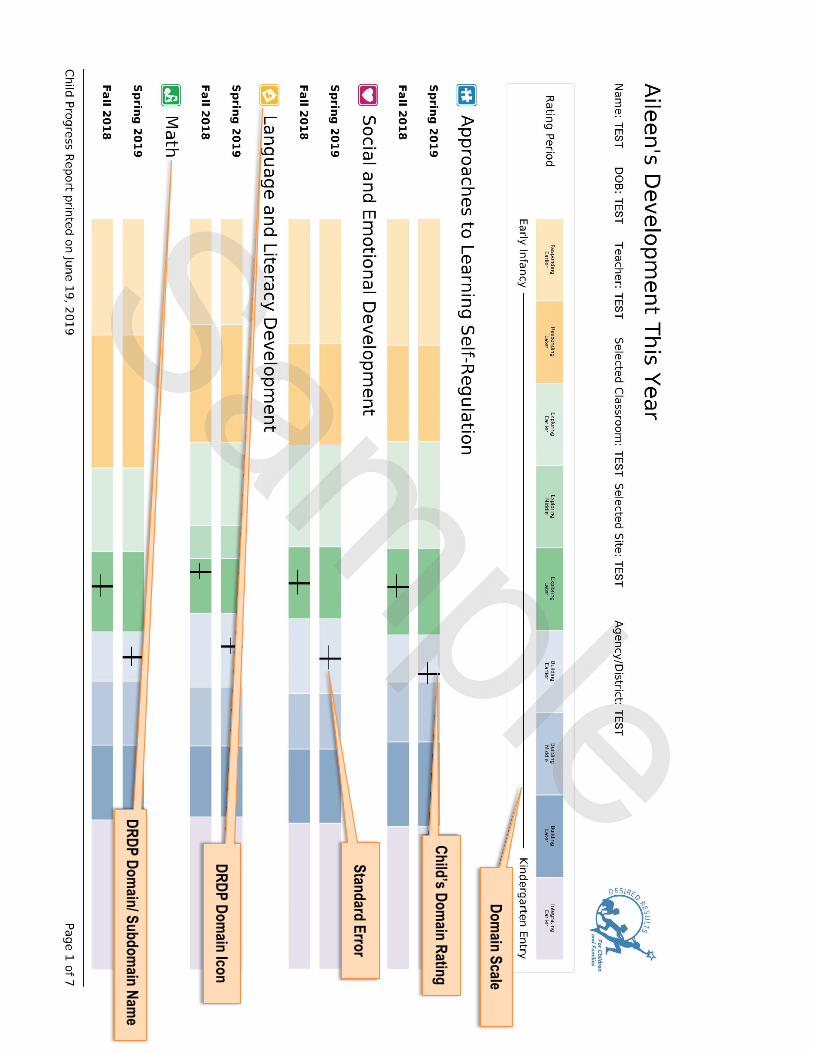
• A color-coded legend of the developmental levels of the DRDP (2015) is displayed at the top of the page. Not all developmental levels are available in each domain.
• The infant and toddler report displays each of the five domains assessed in the DRDP (2015) Infant/Toddler Views.
• The preschool report displays whichever of the domains that are assessed in the DRDP (2015) Preschool Views. Depending on the view selected, it may break out the Language and Literacy Development domain into Language and Literacy subdomains and display ratings for each separately. The Cognition domain breaks down into Math and Science. The Physical Development – Health domain breaks down into the Physical Development and Health subdomains.
What are the features of the Child ProgressReport? A domain scale portrays the developmental progression of knowledge, skills, and behaviors encompassed by the collection of measures included in each DRDP (2015) domain.3 When looking at the measures on the DRDP (2015) instrument, each level appears to be an equal developmental distance from the other. However, as children grow and develop, some knowledge and skills take more time to master than others. These differences in development are expected and are represented by differing widths of the developmental levels in the domain scale; these widths are the same for all children. The location of the marker on each domain scale is unique to each child.
The child’s ratings for each measure in the domain are statistically transformed to create the overall domain scaled score, by calculating an estimate of that child’s developmental level in that domain based on their ratings on each individual measure in the domain. For example, all measures in the Social and Emotional Development (SED) domain are used to calculate the domain scaled score for SED. The vertical line on each domain scale indicates the child’s scaled score along the domain scale.
The standard error line is the horizontal line through the domain scaled score. Statisticians refer to the level of precision as “standard error.” The standard error line represents the range on which one can be confident that a child’s true level of development lies. All standardized instruments have standard errors. This provides an indication of the precision of the domain score. The size of the standard error depends on a number of factors, including the number of measures that are available to be rated. A larger standard error line does not indicate a problem with a teacher’s ratings. The DRDP (2015) domain icon represents the developmental domain from the DRDP (2015) and generally represents the associated domain in the California Department of Education’s early learning and development foundations.
The DRDP domain/subdomain name represents the abbreviation and full name of the DRDP (2015) domains and subdomains.
Child Report Guidance for Teachers – ©2019 California Department of Education Page 1 of 5

1 Wherever the term domain is presented, it also refers to the subdomain. 2 For more information about California Early Learning and Development Foundations, visit http://
www.cde.ca.gov/sp/cd/re/cddpublications.asp 3 The domain scale is statistically derived from the distribution of response patterns for the
measures in that domain. 4 For more information about standard error, see the Child Report Technical Guidance document.
Child Report Guidance for Teachers – ©2019 California Department of Education Page 2 of 5
Domain Scale
DRDP Domain/ Subdom
ain Name
DRDP Domain Icon
Standard Error
Child’s Domain Rating

Understanding the domain scale All of the levels for each measure follow a progression from early infancy (on the left), to kindergarten entry (on the right), like on the DRDP (2015) instrument. The DRDP (2015) instrument represents the developmental levels as equal intervals.
Developmental Domain: SED — Social and Emotional Development
SED 4: Relationships and Social Interactions with Peers Child becomes increasingly competent and cooperative in interactions with peers and develops friendships with several peers
Mark the latest developmental level the child has mastered:
Responding Exploring Building Integrating Earlier Later Earlier Later Earlier Middle Later Earlier � � � � � � � �
Shows awareness of Shows interest in other Plays alongside Interacts in simple ways Participates in brief Participates in Initiates sustained Organizes or other people, including children children
other children, rarely with familiar peers as interacting with them they play side by side
episodes of cooperative play with one or two
extended episodes of cooperative play
episodes of cooperative play (including pretend
participates in planning cooperative play
peers, especially those with whom child
(including pretend play) with one or two friends
play), particularly with friends
activities with several peers, particularly with
regularly plays friends
Figure 1. Developmental progression for a sample measure.
A group of measures forms each domain. Each domain scale reflects the psychometric transformation of the developmental levels of the measures within that domain into a scale that is based on the data collected during the calibration studies of the DRDP (2015).
SED 1 SED 2 SED 3 SED 4 SED 5
SED Domain
Figure 2. Measures form a domain.
Developmental levels on a domain scale that are represented with greater widths will typically take longer for children to master than developmental levels that are represented with lesser widths. The domain scale represents an overall developmental progression; however, it may take more or less time for an individual child to master a level.
Early Infancy Kindergarten Entry
Wider Thinner
Figure 3. Developmental levels are represented by different widths.
If a child stays in a particular level for what appears to be an extended period of time, it is important to consider that the child may still have made gains within that domain. A teacher’s observation notes, participation in classroom learning activities, and ongoing curriculum data (and other documents) can provide additional information about a child’s learning and development.
Child Report Guidance for Teachers (01/29/16) – ©2015 California Department of Education Page 4 of 5

The variation between developmental levels within and across each domain scale means that a child who demonstrates mastery at the Exploring Later level in one domain, for example, will not necessarily demonstrate mastery at Exploring Later in every other domain. Even when a child’s ratings are both at the Exploring Later level across two domains, the vertical domain rating line may not be in the same place on each of the domain scales.
Early Infancy Kindergarten Entry
Exploring Later
ATL-REG Approaches to Learning–Self-Regulation
SED Social and Emotional Development
Exploring Later
Figure 4. Placement of the developmental levels is unique to each domain.
How can the information in the Child Report be used? The Child Report assists in understanding children’s development and curriculum planning by:
• Highlighting broad areas of strength and areas that may require further support for an individual child. ê Domain markers that are further to the left indicate earlier levels of development; domain markers further to the right indicate later levels of development.
• Providing an at-a-glance view of a child’s learning and development related to a child’s overall progress toward California’s early learning and development foundations.
ê When looking at the location of the domain rating, consider whether it is near the early end of the level or the later end of the level and then consider whether to focus instructional planning within the current level or at the next level.
ê The standard error line indicates whether a given child’s current level of development squarely falls within one level on the domain scale or whether the child is likely to be transitioning to the next developmental level and assists with focusing instructional planning
• Displaying the different developmental distances of the levels and giving teachers more information about how much difficulty is associated with each level.
ê Developmental levels on a domain scale that are represented with greater widths will typically take longer for children to master than developmental levels that are represented with lesser widths.
How should the information in the Child Report not be used? • It should not be used to determine eligibility for preschool, transitional kindergarten, or
kindergarten. • The information is not intended to be the only source of information that teachers or
service providers use in understanding children’s development. • It should not be used to determine the developmental age for a child.
For more information about the DRDP (2015) refer to www.desiredresults.us and www.draccessreports.org.
Child Report Guidance for Teachers (01/29/16) – ©2015 California Department of Education Page 5 of 5