child labor in transition in vietnam - united...
TRANSCRIPT

Child Labor in Transition in Vietnam
Eric Edmonds and Carrie Turk
February 2002

Child Labor in Transition in Vietnam*
Eric Edmonds Department of Economics
Dartmouth College
and
Carrie Turk Vietnam Country Office
The World Bank Short Summary: Vietnam experienced a dramatic decline in child labor during the 1990s. The aim of this study is to explore in detail this decline and to document the heterogeneity across households in both levels of child labor and in the incidence of this decline in child labor. Our results suggest embedding efforts against child labor within an overall anti-poverty program.
Abstract: Vietnam experienced a dramatic decline in child labor during the 1990s. The aim of this study is to explore in detail this decline and to document the heterogeneity across households in both levels of child labor and in the incidence of this decline in child labor. We find a strong correlation between living standards improvements and child labor so that much of the variation in declines in child labor can be explained by variation in living standards improvements. Ethnic minority children and the children of recent migrants appear to remain particularly vulnerable even by the late 1990s. Children of all ethnicities in the Central Highlands appear to have missed many of the improvements in the 1990s while children in the rural Mekong and in Provincial Towns have experienced the largest declines in child labor. Our results suggest embedding efforts against child labor within an overall anti-poverty program. We notice that the opening or closing of household enterprises seems to be associated with increases in child labor. Hence, attention should be devoted to the activities of children in the government's current program to stimulate non-farm enterprises.
* We are grateful to Paul Glewwe and participants of the Development Strategy Institute, Ministry of Planning and Investment, and World Bank Conference on Economic Growth and Household Welfare in Vietnam for helpful comments. The contents of this paper do not reflect the viewpoint of the World Bank. Correspondence to Edmonds at [email protected]. Correspondence to Turk at [email protected].

2
I. Introduction
Child labor1 is endemic in most of the world’s poorer countries. As a response to chronic
poverty and idiosyncratic shocks, poor children around the world are withdrawn from school, if
they are attending, and are required to make an economic contribution to the household. This may
have a positive effect, in allowing the household and children within the household to maintain
essential basic consumption in times of real hardship. A moderate amount of work in safe
conditions can allow children to develop useful skills and a sense of responsibility. Child labor may
also have negative effects, diminishing a child’s human capital accumulation, creating an enduring
poverty trap for (potentially) generations and exposing children to harmful situations that restrict
their physical, psychological, and emotional development. There are clearly documented problems
in outlawing all forms of child labor (Crawford, 2000). Such prohibitions, if enforced, can cause
severe hardship for households who are barely surviving and drive the economic contributions of
children underground into illegal and exploitative areas of work. At the same time, there is also a
need to safeguard children from abuses to protect them from harmful situations, to ensure their
education and to uphold their basic rights as children.
The incidence of child labor appears to be negatively correlated with living standards.
Using a cross-section of countries from 1995, Krueger (1997) shows that child labor virtually
disappears once a country's GDP per capita reaches $5,000. He finds that 80% of the international
variation in child labor can be exp lained by GDP per capita alone. Vietnam does not appear to be
an exception to this relationship. Driven by rural and other reforms in the late 1980’s and early
1990’s Vietnam enjoyed rapid economic growth of over 6% per annum over the last decade. This in

3
turn generated impressive reductions in the incidence of poverty, with the poverty headcount falling
from 58% to 37% between 1993 and 1998 (World Bank et al). Edmonds (2001) documents that the
probability that a child (ages six to fifteen) works in agriculture, a family operated business, or
wage employment drops by 28% between 1993 and 1998. He shows that 94% of the drop in child
labor for rural households at the poverty line in 1993 can be explained with improvements in
household economic status.2
Not all households benefit equally from improvements in living standards. The aim of this
study is to explore in detail the decline in child labor that Vietnam experienced during the 1990s
and to document the heterogeneity across households in both levels of child labor and in the
incidence of this decline in child labor. Our primary aim is to develop a set of indicators to help
direct policy to children who remain vulnerable despite general improvements in living standards.
We find that even after controlling for time invariant household characteristics, we still
observe substantial heterogeneity across households in the amount by which child labor has
declined in Vietnam in the nineties. Decreases in the probability that children participate in any
type of economic activity have been largest in provincial towns, minor cities, the southeast, and the
rural Mekong river delta. Declines in the fraction of children working have been the smallest in
urban areas, the south central coast, and the Central Highlands.
In addition to geographic indicators, we consider other observable household characteristics
associated with variation in the decline in the probability a child works. Ethnic minorities appear to
work more than non-ethnic minorities, but most of this additional work can be explained by time
1 In much of the literature on child labor, distinctions are made between children “working” and child “labor”. The former is often used to describe situations where children’s economic contribution is not harmful to their overall development while child “labor” describes situations where a child’s opportunities for development are being constrained by their work. In this paper we use the terms “labor” and “work” interchangeably. 2 Glewwe and Jacoby (1998), in looking at retrospective school enrollment and labor market information in the 1993 VNLSS, argue that schooling declined and formal labor market participation rates increased in Vietnam from 1986 to 1991. Unfortunately, there is no data available to link these patterns to changes in household economic status.

4
invariant household characteristics. Ethnic minorities constitute 14% of the population of Vietnam,
but represent 29% of the poor. They have less access to infrastructure, social services and other
resources (Baulch et al 2001). Girls experience smaller reductions in child labor than do boys.
Older children experience greater reductions, but that appears to be because older children were
more apt to work in 1993. Both a past migration history or the actual departure of a household head
are associated with higher levels of child labor, and migrant households experience smaller declines
in child labor than do non-migrant households. The creation of a new household business seems to
be associated with smaller declines in child labor, although households that had a household
business in 1993 experience larger reductions in child labor than other households.
Taken together, the results of this paper paint an optimistic picture for child labor in
Vietnam. Children are doing better in 1998 than in 1993. Although there is substantial
heterogeneity across households and regions in the amount by which they have reduced their child
labor, we do not find any observable household characteristics that clearly indicate a failure to
participate in the declines in child labor that we observe between 1993 and 1998. There is still
ample scope for policy to help improve the well-being of children and there are groups of children
who remain vulnerable even in the context of rising living standards. Some of the worst forms of
child labor are not easily captured with household surveys. Nevertheless, for the average child in
Vietnam who is represented in the VNLSS, there is every reason to be optimistic about their future.
II. The Child Labor Environment in the 1990s
A. Recent Trends in Child Labor
In this paper, we rely on the Vietnam Living Standards Surveys (VNLSS). There are two
nationally representative rounds of the VNLSS. The first round conducted in 1992/93 interviewed
4800 households, collecting data on a wide variety of household characteristics and activities. The
second round took place in 1997/98 and followed a similar questionnaire and field design. The

5
1997/98 round of the VNLSS was designed to be a nationally representative, stand-alone cross-
sectional survey sampling 5999 households, but it also revisited 4305 households from the first
round of the VNLSS. When our analysis is based on nationwide comparisons, we treat the two
rounds of the VNLSS as separate, nationally representative (when appropriately weighted) cross-
sectional surveys. We complete our descriptive work with regression analysis where we limit our
sample to the panel households that appear in both rounds of the survey.
There are limitations associated with using the VNLSS to investigate patterns and trends in
child labor. First, some of the most exploitative forms of child labor, such as child prostitution, are
likely to be hidden because they are illegal. Second, the VNLSS collects little information on
working conditions. Whether or not work is harming the development of a child lies partly in the
nature of the work and the exposure to physically hazardous and/or psychologically stressful
conditions. Because the VNLSS does not attempt to document working conditions and the data on
hours worked in agriculture is not comparable between rounds, our quantitative analysis focuses on
participation in work rather than working conditions. We supplement our analysis by drawing on a
growing body of qualitative studies that examine issues around child labor. Third, some of the
children who are laboring are likely to be hidden. Street children3, for example, are often not part of
households and are therefore likely to be omitted from household surveys. Households of
unregistered migrants are less likely to be included in the VNLSS (World Bank et al, 1999), though
studies suggest that their children are more likely to work for a living (SCF (UK) 1999).
The VNLSS may also miss the labor activities of children who have left their household.
Children who have been “trafficked” overseas are very likely to be working but, since they no
longer reside in Vietnam, will not show up in household survey data. Likewise, there is a case

6
study literature documenting children leaving their parental home to stay and work with other
families for periods of time, either in exchange for board, lodging, and education or to work for a
wage as a domestic helper (SCF (UK), 1997; VN-Sweden MRDP, 1999). The work of these
children may not be adequately captured by the data because these children very often remain both
unregistered in the host family (survey respondents may not consider the child when listing
household residents or members) and absent from the family home (SCF Sweden et al, 2000).
Fortunately, it is possible to assess the scale of this missing children problem with the
VNLSS data. The 1993 survey collects a household roster of all individuals in the household at the
time of the survey, and the 1998 survey asks about the location of each of those members. Of the
children ages 10 and under (and thus between 5 and 15 in 1998) in the 1993 survey, 92% are still in
the household in 1998. Of this missing 8%, 10% died. 56% of the dead are boys (in other
countries, boys have been found to have slightly higher mortality rates). Of the surviving 421
children present in the household in 1993 but not in 1998, 365 (or 87%) moved out when their
family moved. For the remaining 56 children, 31 (55%) are female. 11 of these females left the
household for marriage (9 boys of the 25 boys left the household for marriage). Thus, out of 6003
sampled children between the ages of 0 and 10 in 1993 in panel households, a total of 36 appear to
have left the household for reasons other than death, parental movements, or marriage. The reasons
given for migration of these 36 children are evenly split between employment, schooling, and other.
9 out of the 20 girls report leaving home for employment whereas only 3 out of the 16 boys do.
However, 8 of the 16 boys report leaving for "other" reasons (only 4 girls report other). Thus,
although departing one's household for work is undoubtedly an important event in the lives of those
children being sent away, this experience does not appear to be an integral part of the childhood
3 The term “street children” here is used to describe children who are working on the streets and who live on the street (with or away from their families) or who live in basic shelter away from their families or who return at night to live

7
experience of either the average boy or the average girl and is unlikely to substantively alter our
conclusions.
The VNLSS surveys present several ways to define child labor. We present these in table 1.
For each household member, age 6 and older, the VNLSS asks whether the person works for pay
outside of the household (“works for wages outside of household”), works for the household in
agriculture (“works in agr. for hh”), and works for the household in self-employment or a household
run business (“works in bus. for hh”). Collectively, we refer to these three work categories as
traditional work. The survey also asks whether a person performs household work and chores such
as cleaning, cooking, washing, shopping, collecting water or wood, and building or maintaining the
house, its surroundings, or furniture. Collectively, we refer to this set of activities as household
work.4 The VNLSS collects data on participation in each of these activities for the last seven days
and in the last twelve months. Throughout this paper, we focus on participation in the last seven
days.
Table 1: Participation in Child Labor (in last 7 days) by Type of Work for Children 6-15 (%)
1992/93 1997/98 Mean S.E. Mean S.E.
Works for wages outside of household 2.3 0.3 1.3 0.2 Works in Agr. in Hh 25.6 1.6 19.3 1.7 Works in Bus. in Hh 4.4 0.6 2.6 0.4 Works in Traditional Work 30.7 1.5 22.0 1.6 Works in Household Work 52.8 1.2 53.0 1.6 Works 62.1 1.3 56.8 1.5Population means weighted to reflect samp ling probabilities. Standard errors corrected for clustered sample design. The 1992/93 data are from a sample of 6071 children 6-15 representing a population of 16,340,704. The 1997/98 data are from a sample of 7071 children 6-15 representing a population of 19,117,671.
with their families off the street. This is a mixed group of children with different vulnerabilities. 4 We are missing household work information for 47 children (0.4% of our total sample). 6 of these children report working in traditional work. Thus, throughout this paper when we consider participation in traditional work will we have 41 more children than when we consider work participation across all categories and 47 more children than when we consider work participation in household work. Because we are missing household hours for these 47 children, all hours worked observations contain 47 less children than does hours in traditional work.

8
Table 1 documents the economic activities of children 6-15 in both rounds of the VNLSS.
The outstanding feature of table 1 is that a majority of children in Vietnam are engaged in some
form of economic activity within the last seven days. This is true in both the 1993 and the 1998
rounds of the VNLSS. However, participation rates declines by 9% between the survey years from
62% to 57%. This decline is composed of a large (28%) decline in participation in traditional work
and a small (0.4%), statistically insignificant increase in participation in household work.5 For the
components of traditional work, children are most likely to be engaged in agricultural work within
the household. The participation rate in agriculture within the household in 1993 is 26%. This
declines to 19% in 1998, a 25% reduction relative to the 1993 level. Work outside of the household
and work for a household business are rare with participation rates of 2% and 4% respectively in
1993. However, both these categories experience large, statistically significant percentage
reductions. Work outside of the household declines by 44%. Work in a household business
declines by 42%.
B. The Economic and Policy Context
These changes in child labor are taking place in a rapidly evolving economic and policy
environment. The rural reforms of the late 1980’s returned responsibility for agricultural
production to the autonomous farming household and this reform is correlated with impressive
growth in agricultural output. Over the 1990’s agricultural GDP grew by nearly 5% per annum,
prompting a rise of 60% in farm incomes between 1993 and 1998 (World Bank, 2000). The
industrial sector has also been expanding rapidly, growing at 13% per year between 1993 and 1998.
Policies that promoted capital- intensive industries and protected domestic markets have meant that
5 When we discuss changes in child labor through time, we will either consider percentage point changes which are calculated by subtracting the 1998 participation rate from the 1993 participation rate (i.e., the fraction of children working in traditional work drops by 8.7 percentage points) or percentage changes that are calculated by dividing the percentage point decline by the 1993 base (i.e., we find a 28% decline in participation in child labor).

9
industrial employment over this period grew relatively slowly (at approximately 4% per annum over
the same period). The introduction of a new Enterprise Law in 2000 and recent announcements that
the Government of Vietnam intends to embark on further reforms to create a stronger environment
for enterprise and international trade suggest that a more labor intensive sector may develop rapidly
over the coming years. Recent estimates based on GSO data suggest that 300,000 new jobs were
created in the private sector during 2000 (World Bank estimates based on GSO data).
1. Education
Government policies in the post-Independence period have demonstrated a commitment to
achieving universal primary education and to protecting children from exploitative situations.
Vietnam entered the 1990’s with net enrollment rates in primary school of 86% (Government of
Vietnam, National Literacy Committee estimates). This emphasis on the provis ion of education was
reinforced in 1991 by the introduction of the Law on the Universalisation of Education and in the
1992 Constitution, which asserts that primary education is both free and compulsory. Though it is
the case that tuition fees are not charged for primary education, many sources have described the
burdensome nature of a whole range of other costs associated with educating children (Actionaid,
1999; Oxfam GB, 1997; World Bank, 1999).
These studies suggest that the costs have become more onerous over the 1990s and that they are an
important cause of interrupted education. Recent estimates using VNLSS data suggest that the costs
of educating one student at primary level are equivalent to nearly 5% of non-food expenditure for a
household in the lowest quintile of the population and that their primary school costs have risen
between 1993-1998 (Government of Vietnam – Donor Working Group, 2000). Households in the
lowest quintile are well below the poverty line. As such, any non-food expend iture diverts funds
from basic consumption needs (World Bank et al, 1999). Much of the qualitative literature on child
labor and working children in Vietnam tracks a path from household economic difficulties to
10
withdrawing children from school to, shortly afterwards, scaling up the economic activity of
children as a strategy for coping with hardship (SCF(UK), 1998; SCF(UK), 1999; VN-Sweden
MRDP, 1999).
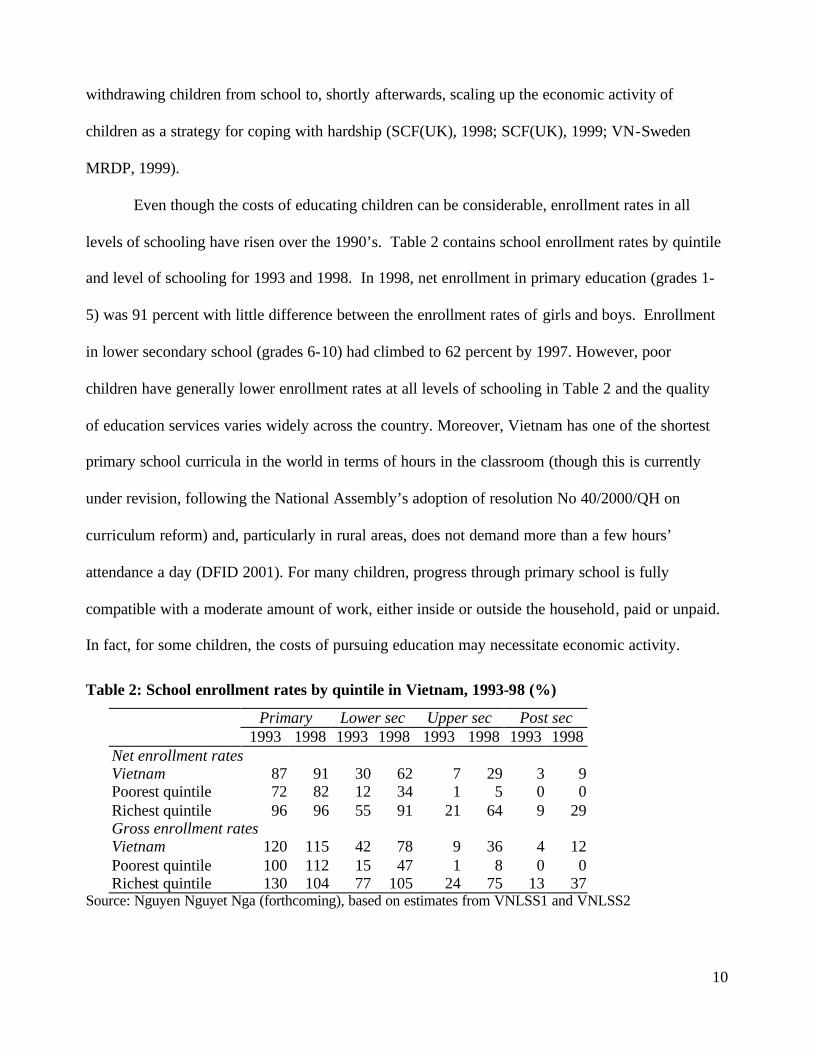
Even though the costs of educating children can be considerable, enrollment rates in all
levels of schooling have risen over the 1990’s. Table 2 contains school enrollment rates by quintile
and level of schooling for 1993 and 1998. In 1998, net enrollment in primary education (grades 1-
5) was 91 percent with little difference between the enrollment rates of girls and boys. Enrollment
in lower secondary school (grades 6-10) had climbed to 62 percent by 1997. However, poor
children have generally lower enrollment rates at all levels of schooling in Table 2 and the quality
of education services varies widely across the country. Moreover, Vietnam has one of the shortest
primary school curricula in the world in terms of hours in the classroom (though this is currently
under revision, following the National Assembly’s adoption of resolution No 40/2000/QH on
curriculum reform) and, particularly in rural areas, does not demand more than a few hours’
attendance a day (DFID 2001). For many children, progress through primary school is fully
compatible with a moderate amount of work, either inside or outside the household, paid or unpaid.
In fact, for some children, the costs of pursuing education may necessitate economic activity.
Table 2: School enrollment rates by quintile in Vietnam, 1993-98 (%)
Primary Lower sec Upper sec Post sec 1993 1998 1993 1998 1993 1998 1993 1998 Net enrollment rates Vietnam 87 91 30 62 7 29 3 9 Poorest quintile 72 82 12 34 1 5 0 0 Richest quintile 96 96 55 91 21 64 9 29 Gross enrollment rates Vietnam 120 115 42 78 9 36 4 12 Poorest quintile 100 112 15 47 1 8 0 0 Richest quintile 130 104 77 105 24 75 13 37
Source: Nguyen Nguyet Nga (forthcoming), based on estimates from VNLSS1 and VNLSS2
11
A child only has so much available time, and time spent working may reduce time in school,
time studying, or leisure time. A vast descriptive literature suggests that low levels of work are
compatible with continued school enrollment, but as hours worked increase, schooling and work
become incompatible. Even if school enrollment is compatible with child labor, work may still
affect a child's human capital accumulation. First, a working child may be enrolled in school, but it
is not clear that we observe time spent in class with enrollment information. Second, physically
being in school is only a necessary, not sufficient, condition for learning. Work may limit the
child's energy for school, or it may limit the child's ability to develop skills outside of the
classroom. Third, even if working has no effect on schooling whatsoever, leisure is important in a
child's development. Play enables a child to develop both its social and creative thinking skills. It
is possible that this cost to a child could be even greater than the lack of general skill accumulation.
Of course, the types of general skill that a child learns in school are not the only types of skill that
are useful to a child. A child may use the skills it develops while working throughout its life. Thus,
the relationship between schooling and child labor is very difficult to analyze. This fact is further
complicated because we cannot separate whether a child works because it does not attend school or
the child does not attend school because it works.
With this in mind, we look at school enrollment rates in 1993 and 1998 for different work
categories. We can say nothing about the quality of time spent in school for working children, and
we do not observe the working child's consumption of leisure. With these caveats, it seems useful
to consider school enrollment rates by the type of work performed by a child. We also consider
whether school enrollment rates differ by type of work through time. This is in table 3:

12
Table 3: School Enrollment by Age and Type of Work in Last 7 Days
All Ages Ages 6-11 Ages12-13 Ages 14-15 1993 1998 1993 1998 1993 1998 1993 1998 Doesn't Work 83.3 92.3 83.7 92.9 88.3 93.3 67.0 85.8Works for wages (outside) 15.9 7.5 46.2 39.9 32.4 16.2 4.5 4.0Works in Agr in Hh 63.0 74.7 89.8 93.3 66.3 80.6 34.0 58.3Works in Bus in Hh 48.9 59.7 86.8 90.1 58.8 62.9 28.1 51.4Works in Traditional Work 59.3 70.2 89.5 92.6 63.2 76.9 30.9 53.3Works in Household work 72.5 86.3 88.8 96.0 72.1 88.2 43.0 72.4Works 71.8 84.7 89.2 95.5 70.7 86.7 41.6 69.6
In table 3, each cell is calculated by stratifying the sample by the each row. Hence, in the first row,
we compute school enrollment rates for all children that do not work. In the third row, we compute
school enrollment rates for all children that work in agriculture for their household. Any individual
child can appear in multiple rows. For example, if a child works in agriculture and a household
business, it is counted in both rows. The first two columns calculate school enrollment rates by year
for all ages. The remaining columns compute school enrollment rates for children 6-11, 12-13, and
14-15.
Several interesting traits appear in table 3. First, school enrollment rates are generally
highest for nonworking children. 88% of 12-13 year olds who do not work are enrolled in school in
1993, but only 71% of 12-13 year olds that work attend school in 1993. The only exception to this
is for primary school age children (6-11). In this group, children who work report slightly higher
enrollment rates, but this difference in enrollment rates for primary school age children is not
statistically significant. Second, in both 1993 and 1998, children are least likely to attend school if
they work outside of the household (only 8% of children in this group enroll in school in 1998) or if
they work in a household run business. For a majority of children, it is possible to both enroll in
school and work in agriculture or in household work. For children above the age of 11, however,
children that work in any type of traditional work have enrollment rates that are below (statistically)

13
enrollment rates for children who do not work. Third, between 1993 and 1998, school enrollment
rates increase across all rows of table 3 except for those children who work outside of the
household. School enrollment rates are actually lower for children who work outside of the
household in 1998, but this lower rate of school enrollment is only statistically significant at the
10% level for one age group: 12-13. Fourth, outside of ages 6-11, school enrollment rates increase
between 1993 and 1998 by more for working children than nonworking children. Part of this may
be attributable to the fact that school enrollment rates are bounded at 1, and they start off very close
to 1 for non-workers in 1993. In addition, work could be becoming more compatible with
schooling in 1998. One mechanism for this increase in the compatibility between schooling and
working might be that a reduction in hours worked accompanies the reduction in work participation
rates that we observe in this paper. Hence, in the VNLSS data we observe that older children who
work are less likely to be enrolled in school than children that do not work, and we see that children
who work become more likely to be enrolled in school through time.
2. Legislation
Vietnam was the second country in the world, and the first country in Asia, to sign the
International Convention on the Rights of the Child in 1990. Article 32 of the Convention
underscores the need for Governments to “recognize the right of the child to be protected from
economic exploitation and from performing any work that is likely to be hazardous to or interfere
with the child’s education, or to be harmful to the child’s health or physical, mental, spiritual, moral
or social development”. The Government of Vietnam has acted on this through a number of
legislative and regulatory measures, seeking to maintain an uneasy balance between allowing
children to contribute to their own survival in times of hardship and safeguarding the rights of
children to physical and intellectual development. Of particular importance are the Law on Child
Protection, Care and Education (1991); the 1992 Constitution of the Socialist Republic of Vietnam

14
(especially Article 65); the Labor Code (1994); many Decrees and Circulars which clarify specific
issues in connection to child labor; and Decision No 134/1999/QD-TTg which approves the
Program of Action to protect vulnerable children in the 1999-2002 period.
The outcome of these laws, decrees, regulations and instructions is a regulatory framework
that outlines the key definitions and priorities in relation to child labor. A child is a person under the
age of 18 (according to the Constitution), but Articles 119-122 of the Labor Code specify conditions
under which adolescents or juniors (15-18 year-olds) may work legally. Restrictions that apply to
the employment of 15-18 year-olds include:
• Not working more than 7 hours per day or 42 hours per week;
• Working under dangerous conditions 6 ; and,
• Being forced to work or being involved in abusive or exploitative work.
Junior employees between the ages of 15 and 18 are entitled by law to the same wage as
an adult, provided they are performing the same work. Children under the age of 15 are allowed to
work in a very restricted range of activities specified by MOLISA (Circular No 21/1999/TT-
BLDTBXH), but are not permitted to work more than 4 hours per day or 24 hours per week, must
be over the age of 12, and may only work with written consent of their parents or sponsors. The
employer is obliged to ensure the child’s schooling. Children under the age of 13 can be employed
legally if they are being trained in certain occupations identified by the MOLISA (Decree No
90/CP).
The Government of Vietnam ratified the ILO Convention No 182 on the Worst Forms Of
Child Labor in November 2000. As such the Government of Vietnam has indicated its commitment
6 Defined by Circular 09/TTLB, 13.4.95, issued by the Ministry of Labor, Invalids and Social Affairs and the Ministry of Health, specifies 13 harmful situations and 81 forbidden occupations.

15
to eliminating “the worst forms of child labor” as defined in Article 3 of Convention 182 and is in
the process of drafting a plan to implement the requirements of Convention 182 (MOLISA, 2001).
Vietnamese tradition accords an important role for children within the households and, in
common with many cultures, a moderate amount of work within the household can be considered
positive for the physical, intellectual and personal development of children. This is legal as long as
it is not harmful, dangerous or exploitative and it does not interfere with the completion of primary
education (Institute of Labor Studies and University of Wollongong, 2000).
III. Winners and Losers Among Child Laborers in the Nineties
The allocation of child time is an important component of a household's decision-making
process. The household must weigh the value of child time spent in many activities including
schooling, wage work, work inside the household, and work in household chores or other
components of household production. The value of child time in any of these activities may
depend on both child and household attributes. In this section we consider how observable child
and household characteristics are associated with the degree to which a household benefits from
improved living standards in Vietnam in the 1990s.
A. Child Attributes: Age and Gender
The types of work that a child can perform vary with the child's age and may vary with the
child's gender. A child age 6 is a less capable worker in most activities than is a child age 15. Sex-
typing of economic and household activities can lead to different age/gender distributions of the
activities of children. If boys and girls perform different types of activities, it is possible that they
have been differentially affected by the changes that Vietnam has experienced in the 1990s. In this
section, we consider changes in child labor by gender, then discuss gender differences by age.
Table 4 presents participation rates in various types of economic activities by gender. Girls
are more likely to work than are boys in both rounds of the VNLSS. In traditional work, higher

16
participation rates appear to be driven by greater participation by girls in the household business.
Also, girls are more apt to participate in household work, and this extra participation in household
work than boys. Most of the large gender differences in participation in any form of work
("works") appear to owe substantially higher participation rates of girls in household work. The
reduction (in percentage terms) in participation rates between the two rounds of the VNLSS is
larger for boys, although the decline in levels of participation are nearly identical for boys and girls.
Table 4: Participation in Child Labor (in last 7 days) by Gender for Children 6-15
1992/93 1997/98 Mean S.E. Mean S.E.
Boys Works for wages outside of household 2.2 0.3 1.2 0.2 Works in Agr. in Hh 25.4 1.7 19.1 1.9 Works in Bus. in Hh 3.6 0.5 2.5 0.5 Works in Traditional Work 29.9 1.6 21.6 1.9 Works in Household Work 45.2 1.6 46.8 1.8 Works 57.9 1.6 52.5 1.8Girls Works for wages outside of household 2.4 0.4 1.4 0.3 Works in Agr. in Hh 25.9 1.7 19.4 1.7 Works in Bus. in Hh 5.3 0.7 2.7 0.5 Works in Traditional Work 31.6 1.5 22.4 1.6 Works in Household Work 60.7 1.3 59.6 1.6 Works 66.5 1.3 61.3 1.6
However, the activities of boys and girls differ with their age. Hence, while there may be
little difference between the way boys and girls as groups benefit from the growth in Vietnam in the
1990s, there may be important by age differences. Figure 1 presents child labor participation rates

17
by age and gender.7 Throughout this paper, we examine figures similar to figure 1. Hence, it is
important that the interpretation of figure 1 is clear. Figure 1A considers participation in all
categories of work. Figure 1B only considers participation in traditional forms of work (the
difference between the two being household work).
Figure 1: Participation in Work by Age and Gender A. All Work Categories
6 7 8 9 10 11 12 13 14 15
0.1
0.2
0.3
0.4
0.5
0.6
0.7
0.8
0.9
Age
Probability Working (All Categories)
Boys 1993 Girls 1993 Boys 1998 Girls 1998
7 Though the sample sizes in the VNLSS are relatively large, when we separate children by age and by gender, the number of children that we observe of a given age and gender becomes relatively small. Hence, we smooth our estimates of child labor participation rates using a nonparametric (local) regression smoother. The lines are local regression lines estimated with an Epanechnikov kernel and a bandwidth of .9. With such a small bandwidth, these regression lines look only slightly smoother than just the raw, by age, sample means. Later, when we bifurcate the sample by household characteristics where the number of children at a given age is very small, we use a larger bandwidth, and this regression procedure imposes more smoothing.

18
B. Traditional Work
6 7 8 9 10 11 12 13 14 15
0.1
0.2
0.3
0.4
0.5
0.6
0.7
Age
Probability Working in Traditional Work
Boys 1993 Girls 1993 Boys 1998 Girls 1998
Each line in figure 1 connects the participation rates by age for the group indicated in the legend.
The vertical axis is labeled the "Probability of Working". It has the interpretation of being the
fraction of children at a given age in a given group (e.g., boys 1993) who are working or of being
the probability, upon observing a child at the indicated age in the given group, of finding that the
child works. When multiplied by 100 these are identical to the labor participation rates in the
tables.
The large drop in the probability that a child works as well as the improvements experienced
by each gender is evident in these pictures. However, there are some interesting age/gender
differences evident in figure 1. In figure 1A (all work categories), the largest drop in work
probabilities appear between the ages of 8 to 10. These are primary school ages. The decline in
work is smaller in older age groups, particularly for girls. However, for traditional work, the
decline in labor participation is greatest for older (post-primary school) ages. In figure 1B, girls
after the age of 11 are more likely to engage in traditional work than are boys although the

19
differences are very small. Both boys and girls experience a similarly large drop in participation
rates in traditional work between 1993 and 1998. The magnitude of this drop (percentage point)
increases with age. Since older children are substantially more likely to work in traditional work in
1993, it makes sense that they should experience the largest reductions over time.
The interpretation of these gender differences is complex. Boys and girls may have different
economic opportunities open to them, and the value of their time outside of work may vary
dramatically. Within the household, members may not agree on how to allocate child time. It is
particularly important to recognize that the benefits from any particular decision may not accrue to
those bearing the costs associated with that decision. This repeatedly emerges as a theme in studies
on children in Vietnam. It is common, for example, to see one child (often a girl) withdrawn from
school and set to work in order to allow the other children to carry on their education (SCF (UK)
(1999)). Since an important part of the difference in work participation between boys and girls lies
in their contribution to household work it is likely that the gender division of labor and gender-
based inequities in decision-making within the household are important determining factors. We
return to this issue in the conclusions.
There also appear to be gender differences in hours worked. Figure 2 examines the
distribution of hours worked in nonagricultural traditional work for children that work. The
questionnaires from the 1993 and 1998 VNLSS are virtually identical with respect to child labor
except for a substantive change in the way hours worked in agriculture is collected. Consequently,
we can only compare hours worked in wage work and work for the household business
("nonagricultural traditional work").

20
Figure 2: Distribution of Hours Worked in Nonagricultural Traditional Work
1.5 2 2.5 3 3.5 4
0.1
0.2
0.3
0.4
0.5
0.6
Logarithm of Hours in Nonagricultural Work, Conditional on Working
Density
24 hours → ← 42 Hours
Boys 1993 Girls 1993 Boys 1998 Girls 1998
Figure 2 contains nonparametric estimates of the density of the logarithm of hours worked in the
last week.8 We separately estimate the densities for 1993 and 1998 and boys and girls. Focusing
first on the 1993 density estimates, we observe that the density of time spent working for girls is
more concentrated than for boys. This is evident by the higher peak in excess of 42 hours of work
in the last week. We find a greater mass of boys working less than 24 hours in 1993 and a greater
fraction of girls working about 42 hours per week.
The distribution of hours worked changes significantly in 1998. For both boys and girls, we
observe a drop in the mass of workers working in excess of 42 hours. We see an increase in the
mass of boys who are working close to 24 hours per week. For girls, we see the emergence of two
clear mass points in the 1998 distribution. The largest subset of girls work more than 42 hours per
week (although the fraction of girls working 42 hours declines between the two years). However, in
8 Density estimates are kernel densities estimated with a Gaussian kernel and a bandwidth chosen by Silverman's rule of thumb (1986).

21
1998, we see a mass of girls working slightly less than 24 hours per week as well. We have no t
corrected the pictures in 1998 to reflect the fact that the probability of observing a child working in
nonagricultural work is lower in 1998. Hence, the type of children pictured in the 1993 distribution
might be different than the children remaining in the 1998 picture. Nevertheless, to the extent that
the children working in nonagricultural work in 1993 and 1998 are comparable, the picture in figure
2 is consistent with many girls shifting their work from a large number of hours in 1993 to
relatively few hours in 1998.
Figure 2 shows that a considerable number of those children, particularly girls, that work
outside of agriculture are working hours above the legal limits set out in the Labor Code. 45% of
these children are working in enterprises with five or less employees, but these legal limits are still
relevant as indicators of what Vietnamese society and legislators have decided is acceptable within
the specific social, cultural and economic context of Vietnam. The mean child who is working in
nonagricultural traditional work in 1998 is still working 34 hours per week, above the legal
maximum set by the Ministry of Labor, Invalids and Social Affairs (MOLISA) for children under
the age of 15 years. These children could be described as vulnerable in the sense that their working
arrangements might be restricting their wellbeing and interfering with their basic rights as identified
in Article 32 of the International Convention of the Rights of the Child. The second peak at above
42 hours per week is especially worrying, since this exceeds by some margin the legal limits
established for the 15-18 year age group and in our data, only 15% of the children who work more
than 42 hours are even enrolled in school. A study of working children in Ho Chi Minh City (Viet
Nam Youth Institute, 1999) corroborates this pattern, indicating that working hours for girls peaked
at a higher level than for boys and at levels above the maximum limit set by law.

22
B. Residential Location
The distribution of improvements in living standards has been different across rural and
urban areas of Vietnam (Glewwe and Nguyen 2000). For that reason alone, we might expect to see
differences in the improvements in the child labor situation across rural and urban areas (or in even
greater geographic detail). However, children also engage in different types of economic activities
in rural and urban areas. Table 5 describes the types of activities undertaken by children of
different gender and ages in Ho Chi Minh City, and table 6 considers the activities of children in
rural Vietnam.

23
Table 5: Starting Age of Work of Children In Different Occupations (Ho Chi Minh City)
Children’s Age
6 7 8 9 10 11 12 13 14 15 16 17 Selling Lottery Tickets Peeling Onions (at home) Making Match Boxes (at home) Weaving Mats and Baskets (at home) Scavenging at the Dumpsite Making shoes (support workers – local) Bobbin Fillers (at weaving enterprises) Catching Grasshoppers Making Ball-Point Pens (boys) Making Lanterns Classifying Waste Plastic (at home) Making Operating Parts of Lamps Recycling Glass Making Ball-Point Pens (girls) Making Chains Silk-Screen Printing Making Bag Wheels Selling Noodle Soup Making Nem Chua (Fermented Pork) Making Furniture & Wooden Art Products Making Scales Recycling Glue Making Chalk Recycling Plastic (boys) Making Shoes (migrant support
workers) Making Plastic Sandals Making Bicycle Tyres Sorting\Recycling Plastic (at
factories – girls) Dyeing Materials Catching
Locusts 6 7 8 9 10 11 12 13 14 15 16 17
Source: Save the Children (UK) (1999)

24
Table 6: Starting Age of Work of Children In Different Occupations (Rural North Central Region)
Children’s Age 4 5 6 7 8 9 10 11 12 13 14 15 … Looking after younger siblings Sweep house and yard Watch house Washes dishes Feed chickens Collect pig feed Catch crabs, shrimp and snails Dig up worms for ducks Wash clothes Cook food for humans Cook food for pigs Feed pigs Fetch fuelwood Boil water Dry paddy Process cassava Tend cows and buffalos Collect grass Fetch water Collect cattle manure Harvest rice Transplant rice Weed and irrigate crops Plough and harrow fields Collect firewood from forest Mill and husk paddy Wage labor Go
fishing Migrate
4 5 6 7 8 9 10 11 12 13 14 15 … Source: Save the Children (UK) (1997)
Both tables are taken from participatory research with working children in different
locations of Vietnam. The scope of activities open to children in rural areas at earlier ages is much
greater. Thus because of both the nature of the economic change in Vietnam and differences in the

25
activities of children between rural and urban areas, it is important to examine differences in child
labor improvements by geographic area. We begin considering rural and urban differences. Then,
we refine our discussion to consider differences across the ten main geographic regions in Vietnam.
Table 7: Participation in Child Labor (in last 7 days) by Residential Location for Children 6-15
1992/93 1997/98 Mean S.E. Mean S.E.
Urban Works for wages outside of household 2.8 0.5 1.7 0.5 Works in Agr. in Hh 7.1 2.2 2.8 1.4 Works in Bus. in Hh 5.4 1.1 1.6 0.4 Works in Traditional Work 14.9 2.5 6.1 1.5 Works in Household Work 44.3 3.3 40.5 2.6 Works 48.7 3.4 42.2 2.6Rural Works for wages outside of household 2.2 0.3 1.2 0.2 Works in Agr. in Hh 29.8 1.8 22.7 2.0 Works in Bus. in Hh 4.2 0.6 2.8 0.5 Works in Traditional Work 34.3 1.7 25.3 1.9 Works in Household Work 54.7 1.3 55.7 1.8 Works 65.1 1.4 59.8 1.8 Table 7 considers participation in each of the different work categories by geographic
location. Participation rates are much higher in rural areas than in urban areas. This is true in both
traditional work and household work. The extra participation in traditional work appears to be
primarily in agriculture as children seem to have similar levels of participation in wage work or in
household businesses in both urban and rural areas. The reduction in work participation rates
through time is slightly greater in percentage terms in urban areas, although that appears to be
largely because the probability that a child worked in urban areas in 1993 was smaller. One place
where there is a notable difference in the changes in child labor through time between rural and
urban areas is in the probability that a child works in a household business. Participation rates in a
household business for a child in an urban area drops by 70% to 0.02 between 1993 and 1998. In
rural areas, the incidence of working in a household business drops by 34%. This larger decline in

26
urban areas occurs despite generally higher participation rates in household businesses in urban
areas in 1993. This may be the result of increases in rural, nonfarm enterprises9. We return to this
issue below.
The description of child work in tables 5 and 6 suggest that there are important differences
associated with age in the allocation of child time between urban and rural areas. Thus, we consider
work participation rates by age. Figure 3 replicates the methodology that we employed in figure 1
(by age and gender pictures). Each line in figure 3 represents a separate regression for each urban
and rural region as well as each round of the survey.
Figure 3: Participation in Work by Age and Location A. All Work Categories
6 7 8 9 10 11 12 13 14 15
0.1
0.2
0.3
0.4
0.5
0.6
0.7
0.8
0.9
Age
Probability Working (all categories)
Urban 1993 Rural 1993 Urban 1998 Rural 1998
9 Vijverberg and Haughton (2001) examines the growth and survival of household enterprises in more depth.

27
B. Traditional Work
6 7 8 9 10 11 12 13 14 150
0.1
0.2
0.3
0.4
0.5
0.6
0.7
Age
Probability Working in Traditional Work
Urban 1993 Rural 1993 Urban 1998 Rural 1998
Children in rural areas are much more likely to work, at every age, than are children in urban
areas. Considering all forms of work (figure 3A), urban-rural differences in work probabilities
appear largest for children age 8 to 11. It is this same group where we observe the largest
reductions in work probabilities for rural areas between the 1993 and 1998 rounds of the VNLSS.
Urban areas appear to experience an approximately uniform reduction in work probabilities
between 1993 and 1998. Consequently, for children ages 8 to 11, rural-urban differences appear to
decrease between 1993 and 1998, while for older children they appear almost unchanged.
When we consider traditional work (figure 3B), the evidence looks different. Here, the
probability of working appears to decline more for older children in both rural and urban areas.
Older children are much more likely to engage in traditional work, so it is not surprising that they
would experience greater reductions in the probability of working in traditional work. As with all

28
forms of work, children in rural households are more likely to engage in traditional work at every
age past 6. However, the largest reductions in traditional work appear to take place among older,
urban children. Recent work on poverty in Vietnam shows how per capita expenditures in urban
areas have risen twice as fast (by 9.9 percent per annum) over the 1993-1998 period as per capita
expenditures in rural areas which rose at 5.4 percent per annum (World Bank et al, 1999). Given
the strong correlation between household economic status and child labor participation documented
by Edmonds (2001), these large reductions in traditional work for older, urban children are likely
the result of the relatively high economic growth rates in urban areas.
Comparing households in different settings is difficult, because it is not unreasonable to
argue that households in rural areas are fundamentally different than households in urban settings.
The consequences of improvements in standards of living may be very different in the two different
environments. Nevertheless, we wish to be able to compare improvements in child labor in one
geographic region to another or in cities to towns to the countryside. In order to make this
comparison, we employ a linear regression framework where we can control for many of the
differences across households in Vietnam. In each regression, our dependent variable is an
indicator that is 1 if a child works (in all work or in traditional work) and 0 otherwise. We estimate
each regression using the linear probability model and control for differences associated with a
child's age, gender, and the year of observation in each regression. 10
In table 8, we consider how changes in child labor vary across the 10 main administrative
regions of Vietnam. In addition to the age, gender, and year controls, we also control for time
invariant household characteristics by including household fixed effects. These househo ld fixed
effects control for factors such as the remoteness of a household's location, its ethnicity, the
10 Age and gender differences are controlled for by a quadratic in age and gender plus all interactions. Standard errors are corrected for commune (psu) / survey round clustering and arbitrary heteroskedasticity.

29
household's size (but not changes in household size), the education of the head of the household, or
any other household traits that do not change over time. Throughout this study, our regression
results aim to document differences in declines in child labor across observable household
characteristics. Our results should not be interpreted as the impact of any given characteristic on
child labor. For example, the largest declines in child labor are in the Mekong River Delta. If we
picked up a household from the Central Highlands and moved it to the Mekong River Delta, we do
not have any reason to believe that the Central Highlands household would experience the same
decline in child labor as other households in the Mekong.
Table 8: Regional Differences in the Decline in Child Labor
Linear Probability Model, Household Fixed Effects Results
Dependent Variable: All Work Traditional Work Coef. s.e. Coef. s.e.
Change in Rural Mekong River Delta -0.250 (0.033) ** -0.181 (0.023)**
Changes Relative to the Rural Mekong
Urban Areas
Major Urban 0.191 (0.078) ** -0.024 (0.034)
Minor Cities 0.029 (0.056) -0.027 (0.050)
Provincial Towns -0.023 (0.063) -0.026 (0.036)
Rural Areas
N. Mt & Midlands 0.077 (0.041) * -0.020 (0.047)
Red River 0.143 (0.050) ** 0.066 (0.041)
N Central Coast 0.048 (0.051) 0.131 (0.051)**
S Central Coast 0.207 (0.051) ** 0.073 (0.061)
Central Highlands 0.287 (0.095) ** 0.079 (0.074)
Southeast 0.038 (0.059) 0.083 (0.038)**
Adjusted R2 0.432 0.410
* is significant at 10%. ** is significant at 5%. Standard errors in parenthesis. All regressions include a quadratic in age and gender, a constant, a year effect, and household fixed effects. Standard errors are corrected for arbitrary heteroskedasticity and the cluster / time design of the survey.
In table 8, we show the change in child labor that occurs in the rural Mekong River Delta
and the additional changes (relative to the Mekong) that occur in other administrative regions.
Thus, in column 1, the probability that a child works in any type of work declines by .25 (or 25
percentage points) in the rural Mekong River Delta after controlling for household fixed effects and

30
child attributes. On the other hand, the probability in major urban areas that a child works in any
type of work declines by only .059 (5.9 percentage points: -.250+.191). For all forms of work
(column 1), we find that most areas of Vietnam decrease their child labor by less than the rural
Mekong River Delta. The particularly large declines in child labor in the rural Mekong may stem in
part from Vietnam's integration into world rice markets (Edmonds and Pavcnik 2001). The only
place that experiences larger reductions than the Mekong is in provincial towns. However, for
traditional work, major urban areas, minor cities, and provincial towns all decrease the probability
that their children work by more than the rural Mekong River Delta.
We can calculate the percentage point change for each of the regions in table 8 in both all
work and traditional work for every region. We present these changes graphically in figure 4:
Figure 4: Reductions in the Probability that a Child Works (in last 7 days) by Region, Household Fixed Effects Results
-10
-5
0
5
10
15
20
25
30
Maj
or U
rban
Min
or C
itie
s
Tow
ns
N. M
t &
Mid
land
s
Red
Riv
er
N C
entr
al C
oast
S C
entr
al C
oast
Cen
tral
Hig
hlan
ds
Mek
ong
Riv
er
Sout
heas
tDec
line
in P
roba
bilit
y th
at a
chi
ld W
orks
(x1
00)
Work Traditional Work

31
Provincial towns have experienced the largest reductions in both categories of work. On the other
hand, we find an increase in the probability that a child works in the rural Central Highlands. The
Central Highlands is the second poorest region in Vietnam with more than half the population living
below the poverty line in 199811. The incidence of “hunger poverty” barely fell at all in the period
between the two surveys and the poverty gap index shows poverty to be deeper here than elsewhere
in the country (Government of Vietnam, 1999; World Bank et al, 1999). School enrollment rates
are lower in the Central Highlands than elsewhere in the country for all levels of education (Nga,
forthcoming). The difference that we observe between traditional work and household work
implies that this increase in work probabilities in the Central Highlands is driven by participation in
household work, but there is an active labor market associated with the coffee plantations in the
rural Central Highlands, and it is possible that this influences the results here. This could be the case
if increased demand for adult labor shifts the burden of househo ld work on to children. Also, the
rural Central Highlands is a destination for migrant agricultural workers (including children) during
the coffee harvest (SCF(UK), 1997) and this may also contribute to the unusual result here. There
is also a concentration of ethnic minorities in the rural Central Highlands. Later, we find that the
slight increase in children who work in the Central Highlands is not the result of the greater
presence of minorities in the Central Highlands.
C. Other Household Characteristics
1. Living Standards
The effect of improvements in living standards on child labor has received substantial recent
attention. Ample qualitative studies suggest that improvements in living standards in Vietnam have
enabled children to work less. Interviews with working children in a range of different situations
and locations identify the strong causal link between poverty and child labor. Though these studies
11 The poverty headcount and the incidence of food poverty here are calculated based on VNLSS consumption data.
32
do not really permit authoritative quantification, they do indicate that the primary reason for leaving
home to find work is grinding poverty for at least three quarters of the respondents. Very often this
is tied in discussion to the need to assist families in paying of debts and servicing debt interest
payments. These debts have often been acquired in response to a health crisis or other shock in the
household (ILO/IPEC, 2000; Bond and Hayter, 1998) or to invest in housing (Youth Research
Institute et al, 1999).
The experiences of households in the VNLSS appear consistent with this qualitative
literature. In the VNLSS, we measure household living standards with the logarithm of per capita
expenditure. There are two justifications for looking at expenditure rather than income. First, most
households do not participate exclusively in formal labor markets. Hence, calculating income is
very difficult. Second, while income is variable, households tend to try and smooth consumption
through time, and the expenditure measure in the VNLSS is designed to approximate household
consumption. In the extreme, the permanent income hypothesis suggests that households consume
their permanent income so that consumption represents the household's information about the
income path before it.
Edmonds (2001) studies the relationship between living standards and child labor in the
VNLSS, and his results are reproduced here. First (using nonparametric regression techniques), he
calculates participation rates in traditional work across the entire range of the per capita expenditure
distribution. His estimates for children in rural (A) and urban (B) households are in figure 5.
Actual participation rates in 1993 are at the top of each picture (marked with a 'o'), and 1998
participation rates are at the bottom of each picture (labeled with a '*'). Second, using the VNLSS,
Edmonds calculates by how much living standards improve for each household between 1993 and
1998. He then uses the cross-sectional relationship between child labor and living standards from
1993 (the 'o' line) to predict what child labor should be in 1998 based only on improvements in

33
living standards. This prediction is the middle line in both graphs of figure 5 and is marked with a
square. The vertical line in figure 5 is the 1993 poverty line.
Figure 5: Living Standards and the Decline in Child Labor A. Rural Households
6.6 6.7 6.8 6.9 7 7.1 7.2 7.3 7.4 7.5 7.6
0.2
0.25
0.3
0.35
0.4
Logarithm of Per Capita Expenditure
Pro
babi
lity
Wor
king
in T
radi
tiona
l Wor
k
1998 1993 Predicted 1998
source: Edmonds(2001)

34
B. Urban Households
6.6 6.7 6.8 6.9 7 7.1 7.2 7.3 7.4 7.5 7.6
0.1
0.15
0.2
0.25
0.3
0.35
0.4
Logarithm of Per Capita Expenditure
Pro
babi
lity
Wor
king
in T
radi
tiona
l Wor
k
1998 1993 Predicted 1998
Generated for this study based on the methodology in Edmonds (2001)
Most of the decline in child labor experienced in Vietnam in the 1990s can be explained by
improvements in living standards. For rural households at the poverty line, living standards can
explain most (94%) of the drop in child labor. Improvements in living standards do less well for
households below the poverty line in 1993. In urban households, living standards improvements
can explain 91% of the decline in child labor in urban households at the poverty line in 1993, and
they can account for 67% of the fall in child labor experienced in households that are within one
standard deviation (of 1993 per capita expenditure) of the poverty line. Above the poverty line,
living standards improvements also explain most of the drop in child labor in urban households.
Improvements in living standards vary a great deal across households in Vietnam, and in the

35
remainder of this paper, we consider how improvements in child labor vary across different
subgroups of the population.
2. Migration
Many case studies highlight migrants as a particularly vulnerable group in Vietnam. A
participatory poverty assessment in Ho Chi Minh City (SCF (UK) 1999) illustrated the multiple
disadvantages faced by migrants, particularly those who lack official registration. Official
registration can be important in determining the access of migrant children to mainstream education
and the access of migrant families to subsidized health care and credit facilities (World Bank et al
1999). Migrants are often moving as a result of economic circumstances, so we expect children in
migrant households to be more apt to need to work. In addition, the process of migration itself may
influence the likelihood that a child works because of the disruption in the child's life associated
with the move.
Figure 6 considers the relationship between work participation and whether or not the
household head has ever moved. We define a household where the head has ever moved as a
"migrant" household.12 Households that have moved are more likely to have children work in both
traditional and all forms of work in both 1993 and 1998. When we consider work as traditional and
household work (figure 6A), we find that participation rates in child work are very similar in-
migrant and nonmigrant households for all ages in 1993. In fact, for children age ten and above, the
probability that a child works appears virtually identical across migrant and non-migrant
households. In 1998, however, we observe much larger differences between migrant and non-
migrant households. This difference owes to large declines in the probability that a child works in
12 In practice, most households that report the head having ever moved report doing so within the last 5 years. Hence, using a more narrow definition does not affect our conclusions.

36
non-migrant households. Further, the distinction between migrant and non-migrant households
appears to increase especially for ages 11-14 (part of the group that looks identical in 1993).
Figure 6: Participation in Work by Age and Migration Status of Head A. All Work Categories
6 7 8 9 10 11 12 13 14 15
0.1
0.2
0.3
0.4
0.5
0.6
0.7
0.8
0.9
Age of Child
Probability Working
Ever Moved 1993 Never Moved 1993 Ever Moved 1998 Never Moved 1998
Figure 6B presents the probability that a child works in traditional work by age and migration. We
observe declines in the probability that the child works in traditional for both types of households
much as we have seen throughout this paper. In traditional work, we observe greater drops in
participation in traditional work for non-migrant children between the ages of 10 and 13.
Interestingly, for 15 year olds, migrant households actually have a slightly reduced probability of
working in traditional work.

37
B. Traditional Work
6 7 8 9 10 11 12 13 14 15
0.1
0.2
0.3
0.4
0.5
0.6
0.7
Age of Child
Probability Working in Traditional Work
Ever Moved 1993 Never Moved 1993 Ever Moved 1998 Never Moved 1998
Of course, heads that have moved are likely substantively different than heads who have
never moved. Hence, we return to our regression methodology described in the context of table 8.
These results are in table 9. Columns 1-4 focus on participation in all forms of work as in figure 6A
and columns 5 and 6 are for participation in traditional work only. To gauge the relative changes in
child labor for households who heads have ever moved in 1993, we include a variable that is the
interaction of head ever moved before 1993 and a variable to indicate that an observation is from
1998. Hence, the interpretation of the first row in table 9 is the change in child labor participation
experienced by a household where a head ever moved before 1993 relative to the change in child
labor experience by households where the head has never moved. Thus a positive regression
coefficient indicates smaller declines in child labor for households where the head moved and a
negative coefficient indicates larger declines for ever-movers.

38
Table 9: Adult Migration History and Child Labor (in last 7 days) Linear Probability Results
Dependent Variable: All Work Traditional Work (1) (2) (3) (4) (5) (6)
Head Ever Moved*1998 0.017 -0.011 -0.003 -0.028 (0.019) (0.013) (0.022) (0.020) Father Resident 0.028 -0.036
(0.038) (0.028) Mother Resident -0.016 0.038 (0.046) (0.037) Head Move 0.059** 0.034 * (0.020) (0.020) Commune Effects No Yes No No No NoHousehold Effects No No Yes Yes Yes YesRegion*Time Effects No Yes Yes Yes Yes Yes
Adjusted R2 0.260 0.372 0.431 0.432 0.410 0.410
* is significant at 10%. ** is significant at 5%. Standard errors in parenthesis. Standard errors are corrected for arbitrary heteroskedasticity and the cluster / time design of the survey. All regressions include a quadratic in age and gender, a constant, and a year effect. Head ever moved is an indicator for if the head in 1993 reported ever having moved. It is interacted with the year effect for 1998. Hence it has the interpretation of being the extra change in child labor in households where the head had moved before 1993 in addition to the general decline in the population.
After controlling for child characteristics, we find in column 1 of table 9 that households
where the head has ever moved experience smaller declines in child labor. However, households
with a head who has moved may be located in different areas than households where the head has
never moved. For example, there may be more people who have moved in cities than in remote
rural areas. Hence, in column 2, we control for differences in the residential location of ever
movers with commune fixed effects. We also control for differences across regions in the declines
in child labor with region * time effects (these are the regression coefficients in table 8). After
controlling for differences in the location of movers, our results change. In column 2, we observe
greater reductions in ever-mover households. Controlling for household differences (in column 3),
attenuates the relationship between ever movers and child labor further. Hence, most of the
differences in figure 6 appear to owe more to differences in the location of households with heads
who have moved rather than being something intrinsic about moving itself. We observe a similar
result for traditional work in column 5.

39
In general, the VNLSS does not capture households that move between 1993 and 1998.
However, we do observe households where 1 or more members have departed or returned. In
columns 4 (all work) and 6 (traditional work), we examine the effect on child labor of having the
residency patterns of parents or the household head change. We observe a substantially smaller
decline in child labor in households where the head has changed between rounds of the VNLSS.
This smaller decline in child labor appears to be in both household work and traditional work,
because we observe a significant, but slightly smaller effect of changes in the head on traditional
work. It is obviously not clear whether this additional work in households that have migrant heads
is directly attributable to the departure of the head or if there are common factors that cause both.
3. Enterprise Ownership
Whether or not a household owns a business is likely to influence the economic activities of
children. It is easier for a child to work inside its home than for an outside employer, so we might
expect to see more child labor in households with home enterprises. Further, it is often easier for
children to begin to contribute to home enterprises at an earlier age than it is for a child to perform
the manual labor of agriculture. On the other hand, generally richer households can afford to start
home enterprises. Wealthier households often enjoy better access to formal financial services and
information, both of which are important in the establishment of household enterprises (World
Bank, 1999). We consider three issues here. First, are households with home enterprises more
likely to have children work? Second, are changes in child labor different in households with and
without a home enterprise? Third, are changes in child labor associated with changes in home
enterprises?

40
Figure 7: Participation in Work by Age and Household Enterprises A. All Work Categories
6 7 8 9 10 11 12 13 14 150.1
0.2
0.3
0.4
0.5
0.6
0.7
0.8
0.9
Age of Child
Probability Working i
Owns Bus 1993 Not Own 1993 Owns Bus 1998 Not Own 1998
B. Traditional Work
6 7 8 9 10 11 12 13 14 15
0.1
0.2
0.3
0.4
0.5
0.6
0.7
Age of Child
Probability Working in Traditional Work
Owns Bus 1993 Not Own 1993 Owns Bus 1998 Not Own 1998
Figure seven considers the probability that a child works by whether the household operates
its own enterprise. As we have seen in every picture, we see uniformly lower probabilities that a

41
child works in 1998 for both traditional and all work participation rates. There are two interesting
characteristics that are unique to figure 7. First, in both work categories and years, children in
households without a household business work more than children in households with a household
business. This is difficult to explain, but we suspect (and find supporting evidence in the next
paragraph) that this result is attributable to the fact that households with family businesses live in
richer areas and are richer on average than households that do not operate a family business.
Second, in 1998, the difference between households with and without a family business is greater in
traditional work than in all work. This suggests that children that are performing generally less
traditional work in households with a business must be contributing more household work in 1998
than are children in households without business. This extra household work in households with
businesses in 1998 appears especially large for children between the ages of 9 and 13.
Much of the extra decline in child labor associated with the ownership of a household
business appears to come from the location of household enterprises. In table 10, we return to the
regression approach employed in table 9. In columns 1 and 4 for all work and traditional work
respectively, we control for age, gender, and year of survey differences. We find greater declines in
child labor in nonfarm, rural households and in households that own a business. In fact, the
probability that a child works in all work categories is a statistically significant 6.6 percentage
points lower in a rural, nonfarm household that own a business works than in a rural farm
household. As in figure 7, the incidence of traditional work is even lower. However, once we
control for commune differences and region*time differences, we actually observe slightly higher,
but not significantly different than zero, rates of participation in both all work and traditional work.

42
Table 10: Enterprise Ownership and Child Labor (in last 7 days) Linear Probability Results
Dependent Variable: All Work Traditional Work (1) (2) (3) (4) (5) (6)
Nonfarm, Rural HH -0.031 -0.023 -0.074** -0.056** (0.023) (0.015) (0.018) (0.016) Owns Business -0.035 ** 0.009 0.039** -0.040** 0.005 0.036*
(0.014) (0.010) (0.017) (0.014) (0.011) (0.020) Commune Effects No Yes No No Yes NoHousehold Effects No No Yes No No YesRegion*Time Effects No Yes Yes No Yes Yes
Adjusted R2 0.263 0.372 0.432 0.199 0.353 0.410
* is significant at 10%. ** is significant at 5%. Standard errors in parenthesis. Standard errors are corrected for arbitrary heteroskedasticity and the cluster / time design of the survey. All regressions include a quadratic in age and gender, a constant, and a year effect. While we cannot reject the hypothesis that the differences in child labor associated with
enterprise ownership observed in figure 7 stem from differences in the location of enterprises, we
find strong evidence that changes in household enterprise status are associated with changes in the
economic activities of children. In column 3 and 6 of table 10, we control for household differences
with household fixed effects, and we also include a variable that indicates whether a household
owns a business. With the household fixed effect, the coefficient on this variable is interpreted as
how a change in whether the household owns a business is associated with changes in child labor.
In both traditional work and household work, creating a new household business between rounds of
the VNLSS is associated with smaller reductions in the probability that a child works. The effect of
owning a household business is slightly larger for all work than for traditional work. Thus, the
creation of a household business seems to lead to more work (relative to a child in a household that
did not create a business) for children in both traditional and household work.
The changes in household businesses that take place between 1993 and 1998 involve both
openings and closings. Thus, the finding that creating a household business leads to more work
relative to a child in a household that did not open a business also implies that closing a household
business is associated with a larger decline in the probability that a child works. In figure 8, we

43
compare children in households that open and close a family business between the 1993 and 1998
rounds of the VNLSS to children in households that had no change in the family business.
Figure 8A compares children in households with businesses that closed between 1993 and
1998 (more precisely, the household reported at least one enterprise in 1993 and did not report any
enterprises in 1998) to children in households that did not change their household enterprise status.
Figure 8B compares children in households with businesses that opened (no enterprise reported in
1993; at least one enterprise reported in 1998) to children in households that did not change.
Figure 8: Participation in Traditional Work by Age and Household Enterprise Change A. Close Business
6 7 8 9 10 11 12 13 14 15
0.1
0.2
0.3
0.4
0.5
0.6
0.7
0.8
Age
Probability Working (Trad Work)
No Change in Business 1993Business Enders 1993 No Change in Busines 1998 Business Enders 1998

44
B. Open Business
6 7 8 9 10 11 12 13 14 150
0.1
0.2
0.3
0.4
0.5
0.6
0.7
Age
Probability Working (Trad Work)
No Change in Business 1993Business Starters 1993 No Change in Busines 1998 Business Starters 1998
Two interesting trends emerge from figure 8. First, (in figure 8A) households whose
businesses end between 1993 and 1998 experience larger reductions in the probability that children
12-15 participate in traditional work than households without a change in enterprise status.
Younger children appear to experience approximately the same drop in households that close and
do not close businesses. This large drop in child labor for older children in households that close
their business appears to come from the fact that these older children in 1993 are more likely to be
working in traditional work. We believe a potential explanation for this higher level of work is that
these older children are working in order to help in the household business. We are surprised that
children in households who closed businesses have lower work probabilities than the general
population. Households owning businesses in 1993 are generally wealthier (in 1993 and 1998) than
households who do not, and it is possible that this explains why they have lower work probabilities
in 1998 than the general population. This would then imply that the closure of the household
enterprise was not a permanent, negative shock to household well-being. Second, we observe (in

45
figure 8B) that children in households that open enterprises between 1998 and 1993 experience
smaller drops in child labor between 1998 and 1993. In 1993, households that open enterprises
between 1993 and 1998 and households that have no change in enterprises between 1993 and 1998
appear to have very similar probabilities of having a child work in 1993. However, children in
households that open enterprises work more in 1998. This is true at every age but it appears largest
for ages 12 and 13. This trend takes place despite the fact that households that create new
enterprises are generally better-off than households who do not. Hence, households in new
businesses appear to rely on family labor to help with the business.
4. Ethnicity
Recent analysis of poverty in Vietnam illustrates that consumption poverty among ethnic
minority groups is declining far more slowly than for the majority population (World Bank et al
1999, Baulch et al 2001). Social indicators for ethnic minority groups also lag behind. Because we
know that reductions in child labor in general have been closely associated with improvements in
per capita expenditures it is important to examine how child labor has moved for those groups
whose poverty appears to be particularly intractable. The unusual trends observed in the rural
Central Highlands (figure 4), where a concentration of ethnic minorities lives raise the possibility
that child labor for ethnic minorities is not reducing as rapidly as for the majority. The question of
this section is whether there is any evidence that children in minority households have reduced their
child labor by less than the majority ethnic groups.

46
Figure 9: Participation in Work by Age and Ethnicity A. All Work Categories
6 7 8 9 10 11 12 13 14 15
0.1
0.2
0.3
0.4
0.5
0.6
0.7
0.8
0.9
Age of Child
Probability Working
Ethnic Minority 1993 Non-minority 1993 Ethnic Minority 1998 Non-minority 1998
B. Traditional Work
6 7 8 9 10 11 12 13 14 150
0.1
0.2
0.3
0.4
0.5
0.6
0.7
0.8
Age of Child
Probability Working in Traditional Work
Ethnic Minority 1993 Non-minority 1993 Ethnic Minority 1998 Non-minority 1998
In both traditional work and household work, ethnic minorities tend to work more than non-
minority groups. In the "all work" category, we observe a slight increase in the probability that

47
ethnic minority children above age 11 work between 1993 and 1998. For traditional work in figure
9B, we see that ethnic minority children in 1998 work more than non-minority children in 1993.
However, we do not observe an increase in the probability that children work between 1993 and
1998 in traditional work. Thus, part of the increase between 1998 and 1993 in "all work" must stem
from increases in household work.
The differences between ethnic minorities and others in the 'all work' category appears to be
largely the result of differences in the geographic location of ethnic minorities. However, in
traditional work, we find differences between ethnic minorities and others even when we control for
household fixed effects. Our linear regression results are in table 11.
Table 11: Ethnic Minorities and Child Labor (in last 7 days) Linear Probability Results
Dependent Variable: All Work Traditional Work (1) (2) (3) (4) (5) (6)
Ethnic Minority*1998 0.117 ** 0.028 0.017 0.124 ** 0.063** 0.084*
(0.033) (0.022) (0.035) (0.044) (0.027) (0.046) 1998 -0.100 ** -0.195 ** -0.252 ** -0.135 ** -0.163** -0.189** (0.024) (0.028) (0.033) (0.024) (0.020) (0.024) Commune Effects No Yes No No Yes NoHousehold Effects No No Yes No No YesRegion*Time Effects No Yes Yes No Yes Yes
Adjusted R2 0.264 0.372 0.432 0.197 0.352 0.411
* is significant at 10%. ** is significant at 5%. Standard errors in parenthesis. Standard errors are corrected for arbitrary heteroskedasticity and the cluster / time design of the survey. All regressions include a quadratic in age and gender, a constant, and a year effect. Ethnic Minority is a dummy variable that is 1 if the household was identified as a minority household in the VNLSS in 1993. It is interacted (row 1) with the 1998 indicator so that the reported coefficient has the interpretation of being the extra change in the probability a child works in a minority household relative to the decline experienced by non-minority households. We report two variables in table 11. The 1998 indicator reports the average decline in child labor
across all households between 1993 and 1998. The coefficient on 'ethnic minority*1998' reports the
extra increment experienced by ethnic minorities. In column 1, we control for child attributes and
find that child labor appears to increase in "all work" for ethnic minorities between 1993 and 1998.
In traditional work (column 4), we observe a 13.5 point decline in child labor in non-minority
households between 1993 and 1998 but only a 1.1 point decline for minorities. In columns 2 and 5,

48
we control for community fixed effects and region * time effects. In all work, we are unable to
reject the hypothesis that minorities experience the same decline as the rest of the population.
However, we still observe a statistically significant, smaller decline in child labor in traditional
work for minority households. In columns 3 and 6, we control for household fixed effects. This
further attenuates minority and non-minority differences in all work. However, we still observe
significantly smaller declines in traditional work for minority households. Interestingly, in the
region * time effects (not pictured in table 11), for both traditional work and "all work", controlling
for a household's minority status does not change the fact that households in the Central Highlands
experience smaller improvements in child labor than do households in the rural Mekong.
IV. Conclusion
This paper demonstrates overwhelming evidence of a reduction in child labor over the
1990’s. This holds true for rural and urban areas, for all regions of the country except the rural
Central Highlands, for all kinds of work, for all age groups (except for ethnic minorities age 10 and
above) and for both sexes. The survey of qualitative work presented here suggests that rising living
standards have been important in driving this reduction in child labor, and the quantitative results of
this and other studies are consistent with these qualitative findings. In 1998, girls are more likely to
work than boys in all age groups and the difference between the sexes becomes slightly wider with
age. Children in rural areas are much more likely to work than urban children and this difference is
particularly remarkable for children participating in traditional work. Ethnic minority children are
more likely than non-minority children to work at all ages and in all work categories.
The evidence from qualitative and quantitative work is that children still working are doing
so because their families are too poor to support the basic needs of the family without the economic
contribution of the children. This link between poverty and child labor is clearly very important in
shaping appropriate policy responses and public action. It indicates, first, that a future development

49
path that puts equitable growth and poverty reduction at its core (such as the Government of
Vietnam has recently articulated in its Socioeconomic Development Strategy 2001-2010) is likely
to generate further reductions in child labor. Secondly, it demonstrates that at the household level,
there should be concern surrounding the hardship that could confront poor families - including their
children - if attempts are made to eliminate child labor without due consideration to the
consequences for household income. This underscores the need for Government responses to child
labor to be formulated in a participatory way which involves all stakeholders at appropriate times,
including working children and their families. Mechanisms to involve vulnerable children in
planning are not well developed within Government, though there have been some interesting
innovations piloted by non-Governmental organizations.
These trends identified from the analysis of the VNLSS data are undeniably positive in
terms of child welfare. But it would be misleading to suggest either that the problem of child labor
will completely evaporate as the economy continues to grow over the next decade or that child labor
has reduced to the extent of becoming a non-problem for policymakers. Economic growth over the
1990’s has not delivered benefits evenly across all groups of children and households and there are
a number of concerns remaining despite the general pattern of improvement.
First, though the trends indicate that working children have reduced the number of hours
they work during the 1993-1998 period, there is clear evidence (Fig 1) that there is a group of child
laborers, with many girls, involved in traditional work who are still working hours well in excess of
the legal maximum set for their age group (24 hours per week). Indeed, these under-15 year olds are
working hours well in excess of the legal maximum (42 hours) for an older category of 15-18 year
olds. The fact that they are working outside legal limits suggests that enforcement of child labor
regulations is not influencing their work patterns and must raise the question of whether other
safeguards designed to protect young workers are effectively enforced. The VNLSS tells us little

50
about this, but other studies suggest that these safeguards may not be enforced (Institute of Labor
Studies and University of Wollongong, 2000). As the environment for enterprise development
improves and more competition is introduced, working conditions may become an issue of
importance. Limited information on labor standards and working conditions is publicly available.
MOLISA conducts regular Labor Force Surveys, but these alone may be unable to pick up potential
problems of deteriorating labor standards – particularly for children – as industrial growth
continues.
Secondly, at every age group girls are more likely to work than boys (fig 2). In particular,
the evidence is that they bear a greater burden of household work at every age than do their male
counterparts. The literature on women in Vietnam illustrates clearly that this is a pattern which
continues into adulthood and which sees women shouldering heavy daily workloads (World Bank et
al, 1999; Population Council, 1999). Although net enrollment rates in primary school are similar for
boys and girls for the country as a whole, there is a disparity in the lowest expenditure quintile of
the population (where 80% of girls are enrolled in school against 84% of boys). It appears that girls
may be more vulnerable than boys under situations of economic stress.
Actions to address gender-based inequities in decision-making within the household are
likely to be fundamental for reducing the domestic workload of girls. This, in turn, is likely to
require longer-term attitudinal change by both men and women to overcome gender-based
stereotyping of roles and responsibilities. More immediately, there is scope for further research into
the vulnerabilities of girls in poor households and for an assessment of specific interventions that
might reduce their work burden.
Thirdly, ethnic minority children work more than non-minority children at all ages.
Qualitative studies suggest that concerns raised over differences in work patterns for boys and girls
may be particularly acute in ethnic minority areas and that the burden of work inside the household

51
for girls is likely to be more onerous and more likely to interfere with education for girls than for
boys (VN-Sweden MRDP, 1999; Duong Van Thanh, 1997). For traditional work, ethnic minority
children have experienced smaller reductions in the likelihood of working than have non-minority
children. Other work shows how ethnic minority children suffer multiple disadvantages. They are
more likely to live in poverty, have less access to health and education services (World Bank et al,
1999 and World Bank, 1999), are more likely to be malnourished and are less likely to survive
childhood (Ministry of Health, 2000). Their parents are less likely to have access to information and
are more likely to be isolated from broader policy- and decision-making processes (World Bank et
al, 1999). Addressing child labor among ethnic minority groups is unlikely to be effective if many
other deprivations they face are not simultaneously addressed. These are critical areas for public
action that should form part of the ethnic minority development plans that the Government of
Vietnam has undertaken to formulate over coming years (Socialist Republic of Vietnam, 2001).
Fourthly, some of the patterns observed raise the question whether Government of Vietnam
development strategies for the next 10 years might exacerbate some forms of child labor. The
Government of Vietnam’s Socioeconomic Development Strategy to the year 2010 implies that
rural-urban migration is likely to increase (the urban population is predicted to increase to 30-33%
by 2010, a rate of increase beyond natural population growth). Though VNLSS data is likely to
exclude much of the unregistered migrant community in urban areas, we still find in this paper that
children of migrants are more likely to work than average. This is strongly reinforced by other
studies (SCF (UK), 1999; Caseley and Buom, no date). Children of migrants demand particular
attention in the future if a concerted program of support to child laborers is to be developed as
Vietnam becomes more urbanized. In particular it will be important to ensure that children of
migrants are not denied access to basic services on account of their residential status (as SCF (UK)
1999 documents).

52
Fifthly, government strategies (MARD, 2000; Communist Party of Vietnam, 2000) envisage
a shift in the rural economy that places far greater emphasis on off- farm activities and employment
generation. This is widely accepted as being an important step in raising agricultural productivity
and incomes and reducing rural poverty (World Bank, 2000) and, by extension, child wellbeing.
Our analysis shows that children in households that start new enterprises work more than do
children in households without enterprises or with stable, long-term enterprises. It is necessary that
agencies concerned with child welfare remain vigilant to possible changes in the profile of child
labor as rural livelihoods become more dependent on off- farm sources of income.
A sixth area of concern relates to education. Though enrollment rates in primary education
are high for a country of this level of per capita GDP and are good for both non-working and most
categories of working children (table 3), children who work outside the household emerge very
clearly as a group who are educationally at risk. These children need to be targeted carefully under
the Government of Vietnam’s Education For All initiative. Children’s ability to combine work and
education may be undermined as full-day primary schooling is introduced over the next few years.
Education may well become less compatible with working while simultaneously becoming more
expensive if the costs of extending the hours of education are borne privately. It is too early to
anticipate what the impact of this change might be on child labor, but careful monitoring will be
important.
Finally, there are categories of child labor which defy easy monitoring but which are both
harmful – falling within the ILO description of the “worst forms of child labor” – and, reportedly on
the rise. Though there are no clear estimates for example of the number of children involved in the
commercial sex industry, some studies indicate that the sex industry is expanding rapidly and as
53
many as one third of commercial sex workers are children13 (ILO/IPEC, 2000). Street children and
underage domestic workers are vulnerable to abuse because of the nature of their work and are
likely to be neglected or underrepresented in current data collection. The scale of child labor in
these areas is really very difficult to assess given current information but reports suggest that it is on
the rise (Bond and Hayter, 1998; Youth Research Institute et al, 1999; Swedish SCF et al, 2000).
There have also been reports that children working in gold mines are both unregistered (and
unenumerated) and “forced” to stay through practices of withholding wages (SCF (UK) 1997). It
will be important to generate more reliable indications of the extent of these very harmful and
exploitative forms of child labor if effective action is to be designed and implemented.
Works Cited
ActionAid Vietnam (1999) Ha Tinh: A Participatory Poverty Assessment Hanoi: ActionAid. Asian Development Bank (2000). Vietnam Agricultural Sector Program Interim Report. By
ANZDEC Limited with IFPRI and Lincoln Internaitonal for ADB TA 3223-VIE. Hanoi. Baulch, Bob, Truong Thi Kim Chuyen, Dominique Haughton, Jonathon Haughton (2001) Ethnic
Minority Development in Vietnam: a socioeconomic perspective Paper presented at MPI-World Bank workshop “Economic Growth and Household Welfare: Policy Lessons from Vietnam”. Hanoi.
Besler, Patrik (2000). Vietnam: On the Road to Labor-Intensive Growth? Policy Research Working Paper 2389: World Bank.
Bond, Tim and David Hayter (1998). A Review on Child Labor, Street Children, Child Prostitution and Trafficking, Disability, the Family. Hanoi: UNICEF.
Caseley, Jonathon and Nguyen Van Buom (no date) Survey on the Situation of Street Children in Hanoi. Hanoi: Youth Research Institute
Communist Party of Vietnam (2000). Draft Socio-Economic Development Strategy 2001-2010. Hanoi.
Crawford, Sheena (2000). The Worst Forms of Child Labor. A Guide to Understanding the New Convention. University of Edinburgh mimeo.
Deaton, Angus (1997). Analysis of Household Surveys. Baltimore: Johns Hopkins Univerisity Press.
DFID (2001), Providing Quality Basic Education for All Paper prepared for the Poverty Task Force. Hanoi, September.
13 “Children” here are defined as people under 18 since Vietnam’s laws expressly forbid the involvement of those under the age of 18 in the sex industry. One study calculates that nearly 90% of sex workers are children (quoted in Bond and Hayter, 1998).

54
Duong Van Thanh (1997). Girls’ Work and Girls’ Education In Vietnam. Hanoi: UNICEF Edmonds, Eric (2001). "Will Child Labor Decline with Improvements in Living Standards? A Case
Study for Vietnam." Dartmouth College Mimeo. Edmonds, Eric and Nina Pavcnik (2001). "Does Globalization Increase Child Labor: Evidence
from Vietnam." Dartmouth College Mimeo. Fan, Jianqing (1992). "Design-adaptive Nonparametric Regression." Journal of the American
Statistical Association. 87(420), 998-1004. Government of Vietnam (1999). Overcoming Challenges to Achieve Efficient and Sustainable
Socio-economic Development. Government Report to the Consultative Group Meeting. Hanoi: Socialist Republic of Vietnam.
Government of Vietnam – Donor Working Group (2000). Vietnam: Managing Public Resources Better. Public Expenditure Review 2000. Hanoi: Vietnam Development Information Centre.
Glewwe, Paul and Hanan Jacoby (1998). “Schooling Enrollment and Completion in Vietnam: An Investigation of Recent Trends.” in Household Welfare and Vietnam’s Transition. Washington, D.C.: The World Bank.
Glewwe, Paul and Phong Nguyen (2000). "Economic Mobility in Vietnam in the 1990s." Mimeo. ILO (1999). Convention No 182 concerning the prohibition and immediate action for the
elimination of the worst froms of child labor. Geneva: ILO ILO/IPEC (2000). Children in Prostitution in Southern Viet Nam. Hanoi: unpublished draft Institute of Labor Science and Social Affairs and University of Wollongong (2000). A Study on
Child Labor. Hanoi: Labor and Social Affairs Publishing House. Krueger, Alan (1997). "International Labor Standards and Trade," in Michael Bruno and Boris
Pleskovic (eds.) Annual World Bank Conference on Development Economics, 1996 (Washington, D.C.: The World Bank, 1997), pp. 281-302.
Ministry of Agriculture and Rural Development (2000). Strategy of Agriculture and Rural Development 2001-2010. Hanoi.
Ministry of Health (2000). Strategic Orientations on Health Care and Protection for People in Mountainou and Remote Areas, 2001-2010. Hanoi.
Ministry of Labor, Invalids and Social Affairs (2001). Draft National Plan of Action on Implementation of ILO’s Convention 182. Hanoi.
Ministry of Labor, Invalids and Social Affairs, UNICEF and Vietnam Committee for the Protection and Care of Children (2000). Analysis and Evaluation of Legislation and Policies on Care and Protection of Children in Especially difficult Circumstances (2nd edition). Hanoi.
Nguyen Nguyet Nga (forthcoming). Vietnam: Trends in the Education Sector. Hanoi: World Bank. Oxfam GB (1997). The Way to School in Duyen Hai: Education Issues in a Mekong Delta District.
Hanoi. Population Council (1999). Changes in Work and Fertility Patterns in Households During
Vietnam’s Post Doi Moi Period, 1994-1999. Hanoi: Population Council. Save the Children Sweden and University of Social Sciences and Humanities (2000). Children in
Domestic Service in Hanoi. Hanoi: National Political Publishing House. Save the Children Fund (UK) (1997). From Housework to Goldmining: Child Labor in Rural
Vietnam. Hanoi. Save the Children Fund (UK) (1998). Child Labor in Ho Chi Minh City. Hanoi. Save the Children Fund (UK) (1999). Ho Chi Minh City: A Participatory Poverty Assessment.
Hanoi: World Bank. Social Work Centre for Youth of Vietnam Central Youth Association and Radda Barnen (1999)
Children in the “Shadows”. Hanoi: National Political Publishing House. Socialist Republic of Vietnam (2001). Interim Poverty Reduction Strategy Paper. Hanoi.

55
Silverman, Robert (1986). Density Estimation. London: Chapman & Hall. Vietnam – Sweden Mountain Rural Development Program (1999). Lao Cai: A Participatory
Poverty Assessment. Hanoi: World Bank. Viet Nam Youth Institute. (1999). Children in Paid Work in Ho Chi Minh City. Hanoi Vijverberg, Wim and Jonathon Haughton. (2001) Household Enterprises in Vietnam: Survival,
Growth and Living Standards. University of Texas at Dallas and IZA, Bonn. World Bank et al (1999). Vietnam: Attacking Poverty Joint report of the Government of Vietnam–
Donor-NGO Poverty Working Group. Hanoi: World Bank. World Bank (1999). Vietnam Voices of the Poor: Synthesis of Participatory Poverty Assessments.
Hanoi: World Bank. World Bank (2000). Entering the 21st Century: Pillars of Development Hanoi: World Bank Youth Research Institute and Radda Barnen (1999). Possibilities of Reuniting Street Working
Children with their Families. Hanoi: National Political Publishing House