chikahisa sumi director, regional office for asia ... - mier · chikahisa sumi. director, regional...
TRANSCRIPT

Chikahisa SumiDirector, Regional Office for Asia and the Pacific
International Monetary Fund


A more gradual monetary policy normalization
Fiscal stance remains neutral
Moderate inflation in both AEs and EMDEs Oil baseline projection is raised from last year but
remains weak Upward revision for nonfuel commodities price
projections
0
2
4
6
8
2010 2011 2012 2013 2014 2015 2016 2017 2018 2019 2020
Real GDP Growth
Emerging Market and Developing EconomiesWorldAdvanced Economies
(percent YOY)
Risks to the Global Outlook
ASSUMPTIONS
Source: International Monetary Fund, World Economic Outlook, October 2017. 2

World AdvancedEconomies U.S. U.K. Japan Euro
Area Germany CanadaOther
Advanced Asia
2016 3.2 1.7 1.5 1.8 1.0 1.8 1.9 1.5 2.2
2017 3.6 2.2 2.2 1.7 1.5 2.1 2.0 3.0 2.6
Revision from Jul.
20170.1 0.2 0.1 0.0 0.2 0.2 0.2 0.5 0.3
Revision from Apr.
20170.1 0.2 -0.1 -0.3 0.3 0.4 0.4 1.1 0.3
2018 3.7 2.0 2.3 1.5 0.7 1.9 1.8 2.1 2.5
Revision from Jul.
20170.1 0.1 0.2 0.0 0.1 0.2 0.2 0.2 0.1
Revision from Apr.
20170.1 0.0 -0.2 0.0 0.1 0.3 0.3 0.1 0.1
Source: International Monetary Fund, World Economic Outlook, October 2017. 3
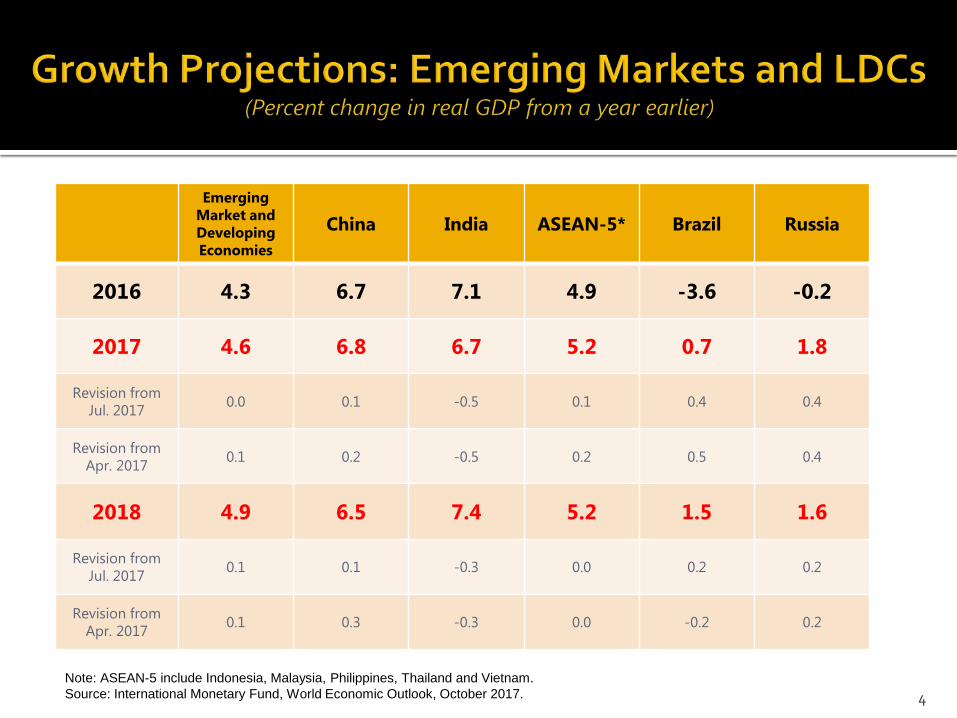
Emerging Market and Developing Economies
China India ASEAN-5* Brazil Russia
2016 4.3 6.7 7.1 4.9 -3.6 -0.2
2017 4.6 6.8 6.7 5.2 0.7 1.8
Revision from Jul. 2017 0.0 0.1 -0.5 0.1 0.4 0.4
Revision from Apr. 2017 0.1 0.2 -0.5 0.2 0.5 0.4
2018 4.9 6.5 7.4 5.2 1.5 1.6
Revision from Jul. 2017 0.1 0.1 -0.3 0.0 0.2 0.2
Revision from Apr. 2017 0.1 0.3 -0.3 0.0 -0.2 0.2
Note: ASEAN-5 include Indonesia, Malaysia, Philippines, Thailand and Vietnam. Source: International Monetary Fund, World Economic Outlook, October 2017. 4

0
1
2
3
4
5
6
7
8
9
Asia Euro area Latin America andthe Caribbean
Middle East andNorth Africa
United States
April 2017 WEO October 2017 WEO
2017 Inflation Forecast(Percent)
Source: IMF World Economic Outlook. 5
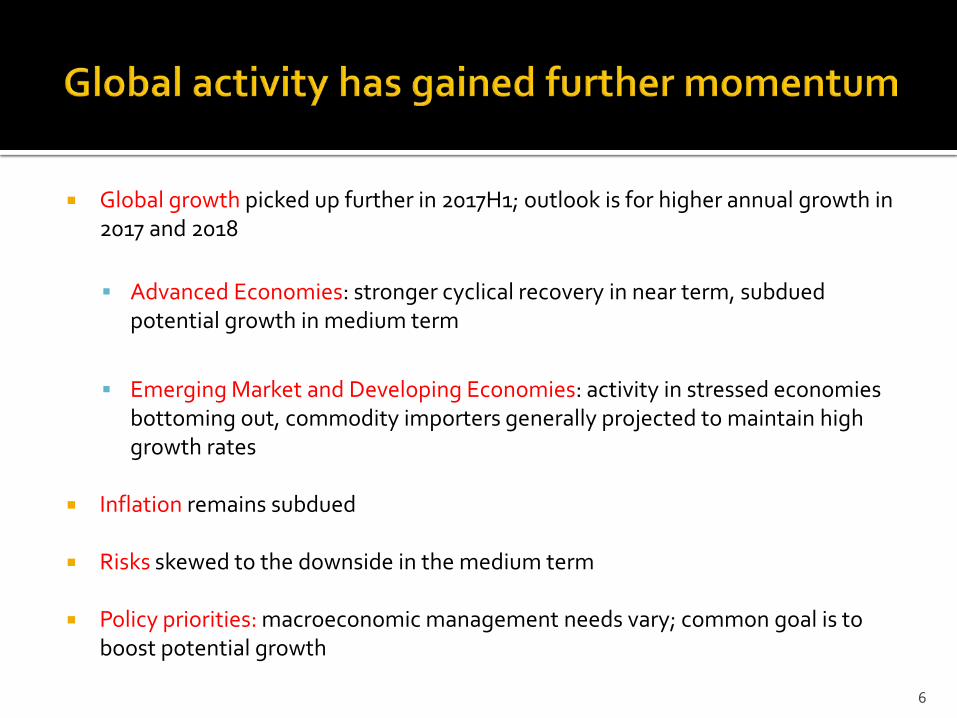
Global growth picked up further in 2017H1; outlook is for higher annual growth in 2017 and 2018
Advanced Economies: stronger cyclical recovery in near term, subdued potential growth in medium term
Emerging Market and Developing Economies: activity in stressed economies bottoming out, commodity importers generally projected to maintain high growth rates
Inflation remains subdued
Risks skewed to the downside in the medium term
Policy priorities: macroeconomic management needs vary; common goal is to boost potential growth
6

ADVANCED ECONOMIES
Cyclical rebound; varying degrees of post-crisis repair;
Demographic trends
EMERGING MARKET AND DEVELOPING ECONOMIES
Rebalancing in China Adjustment to lower commodity prices Geopolitical and political factors
Weak productivity growth
Ongoing forces…
…overlaid on…
7


• Asia is in a favorable position: growth is revised up.
• However, the sustainability of the pickup is still not clear.
• While Asia is more resilient, medium-term vulnerabilities have increased.
• The “window for reforms” is now.
Growth Projections: Selected Asia(Percent change from a year earlier)
World Asia China India Japan Korea
Australiaand New Zealand ASEAN
Small States
2016 3.2 5.4 6.7 7.1 1.0 2.8 2.6 4.8 3.2
2017 3.6 5.6 6.8 6.7 1.5 3.0 2.4 5.1 3.7
Revision fromApr. 2017
0.2 0.1 0.2 -0.5 0.3 0.3 -0.5 0.2 0.1
2018 3.7 5.5 6.5 7.4 0.7 3.0 2.9 5.1 4.4
Revision from Apr. 2017
0.1 0.1 0.3 -0.3 0.1 0.1 0.2 0.0 -0.2
9

5459 61
55 54
0
10
20
30
40
50
60
70
2014 2015 2016 2017 2018
Asia: Contribution to Global Growth(Percent, PPP)
Source: IMF World Economic Outlook.10

-20
-10
0
10
20
30
40
Jul-1
1Ma
r-12
Nov-
12Ju
l-13
Mar-1
4No
v-14
Jul-1
5Ma
r-16
Nov-
16Ju
l-17
Jul-1
1Ma
r-12
Nov-
12Ju
l-13
Mar-1
4No
v-14
Jul-1
5Ma
r-16
Nov-
16Ju
l-17
To the United States To Euro area To Japan To China
Selected Asia: Exports to Major Destinations(Year-over-year percent change)
Sources: Haver Analytics; CEIC Data Co. Ltd.; and IMF staff calculations.Note: Selected Asia includes China, Hong Kong SAR, Japan, Korea, Malaysia, Taiwan Province of China, Thailand, the Philippines, Singapore, and Vietnam. Indonesia is excluded due to data lags.
11
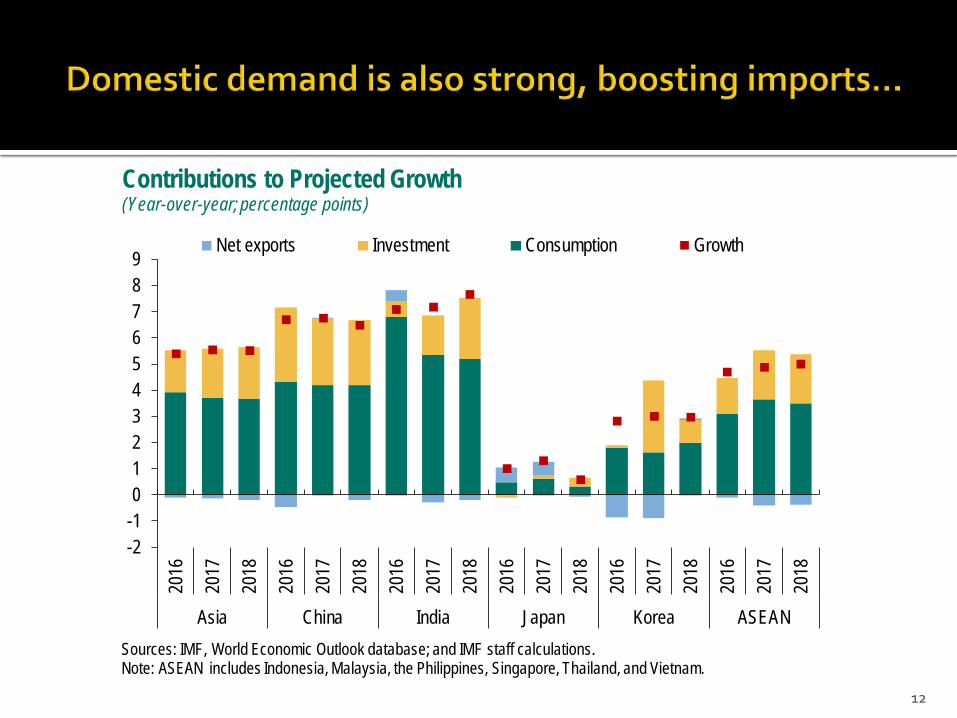
-2-10123456789
2016
2017
2018
2016
2017
2018
2016
2017
2018
2016
2017
2018
2016
2017
2018
2016
2017
2018
Asia China India Japan Korea ASEAN
Net exports Investment Consumption Growth
Contributions to Projected Growth(Year-over-year; percentage points)
Sources: IMF, World Economic Outlook database; and IMF staff calculations.Note: ASEAN includes Indonesia, Malaysia, the Philippines, Singapore, Thailand, and Vietnam.
12

-2-1012345678
Asia China India Japan Korea ASEAN
2015 2016 2017 (Projection) 2018 (Projection)
Asia: Current Account Balances(Percent of GDP)
Sources: IMF, World Economic Outlook database; and IMF staff calculations and projections.Note: ASEAN includes Indonesia, Malaysia, the Philippines, Singapore, Thailand, and Vietnam. 13

-40
-30
-20
-10
0
10
20
30
40
50
60
Aug 15 Dec 15 Apr 16 Aug 16 Dec 16 Apr 17 Aug 17
Africa & Middle East Emerging Europe Latin America Emerging Asia
Sources: National Sources; Bloomberg Finance L.P.; and Institute of International Finance.
Total Portfolio Flows(Billions of U.S. dollars)
14
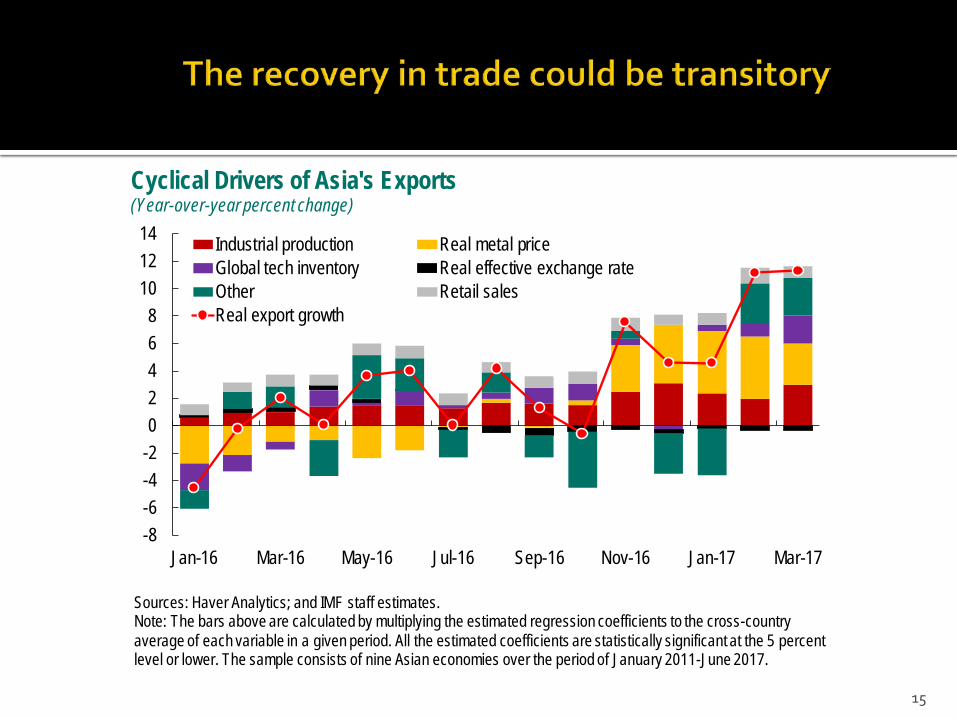
-8-6-4-202468
101214
Jan-16 Mar-16 May-16 Jul-16 Sep-16 Nov-16 Jan-17 Mar-17
Industrial production Real metal priceGlobal tech inventory Real effective exchange rateOther Retail salesReal export growth
Sources: Haver Analytics; and IMF staff estimates.Note: The bars above are calculated by multiplying the estimated regression coefficients to the cross-country average of each variable in a given period. All the estimated coefficients are statistically significant at the 5 percent level or lower. The sample consists of nine Asian economies over the period of January 2011-June 2017.
Cyclical Drivers of Asia's Exports (Year-over-year percent change)
15

•Tighter global financial conditions, amid high leverage.
• Geopolitical tensions.
• Inward looking policies.
• Sharp adjustment in China over the medium term.
• Climate change and natural disasters.
16
9
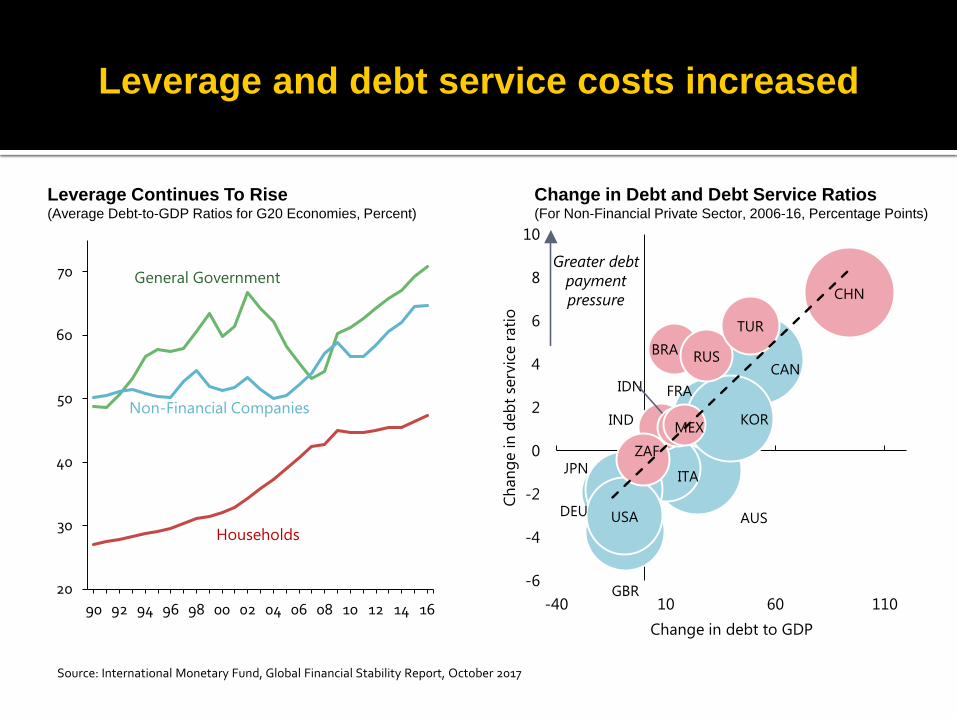
Leverage Continues To Rise(Average Debt-to-GDP Ratios for G20 Economies, Percent)
Leverage and debt service costs increased
Change in Debt and Debt Service Ratios(For Non-Financial Private Sector, 2006-16, Percentage Points)
20
30
40
50
60
70
90 92 94 96 98 00 02 04 06 08 10 12 14 16
General Government
Non-Financial Companies
HouseholdsAUS
CANFRA
DEU
ITAJPN
KOR
GBR
USA
BRA
CHN
IND
IDN
MEX
RUS
ZAF
TUR
-6
-4
-2
0
2
4
6
8
10
-40 10 60 110
Chan
ge in
deb
t ser
vice
ratio
Change in debt to GDP
Greater debtpaymentpressure
Source: International Monetary Fund, Global Financial Stability Report, October 2017

Credit above trend
-15
-10
-5
0
5
10
15
20
1996 1997 1998 2000 2001 2003 2004 2005 2007 2008 2010 2011 2013 2014 2015
EM Asia EMs AEs
Credit Gap(Percent, PPP weighted)
Source: Bank for International Settlements. 18
0
50
100
150
200
250
300
350
1986 1989 1992 1995 1998 2001 2004 2007 2010 2013 2016
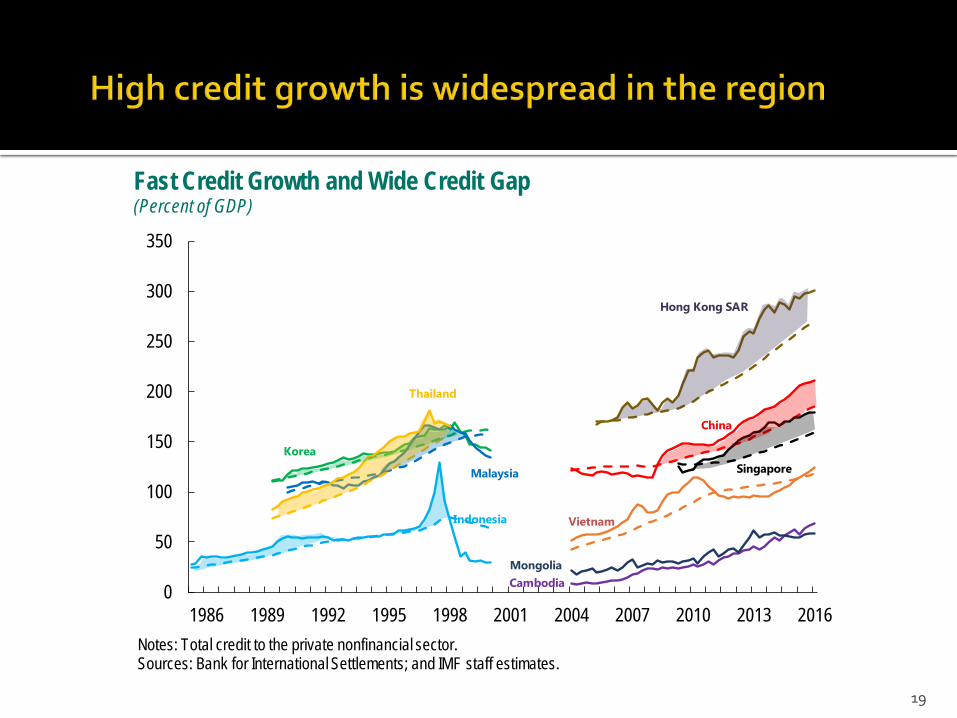
Fast Credit Growth and Wide Credit Gap (Percent of GDP)
Notes: Total credit to the private nonfinancial sector.Sources: Bank for International Settlements; and IMF staff estimates.
China
Hong Kong SAR
Indonesia
Korea
Thailand
Malaysia
Vietnam
MongoliaCambodia
Singapore
19

0
20
40
60
80
100
120
140
160
180
2007 2008 2009 2010 2011 2012 2013 2014 2015 2016
Private Public
Selected Asia: Private and Public Debt(Percent of GDP)
Sources: Bank for International Settlements; IMF Wolrd Economic Outlook; and IMF staff calculations.Note: Selected Asia is PPPGDP weighted by Australia, China, Hong Kong SAR, Japan, Korea, India, Indonesia, Malaysia, New Zealand, Singapore, and Thailand.
20

0
20
40
60
80
100
120
140
Austr
alia
China
Hong
Kon
g SAR Ind
ia
Indon
esia
Japa
n
Kore
a
Malay
sia
New
Zeala
nd
Sing
apor
e
Thail
and
All c
ount
ries AE EMs
EM A
sia
1996 Q4 2016 Q4
Households Credit (Percent of GDP)
Note: For green bars: Advanced Economies, 1999Q4; Indonesia, 2001Q4; Malaysia, 2006Q1; China, 2006Q1; India, EM Asia, 2007Q2; EMs, All Countries, 2008Q1.Sources: Bank for International Settlements; and IMF staff calculations.
Adva
nced
Econ
omies
21
10
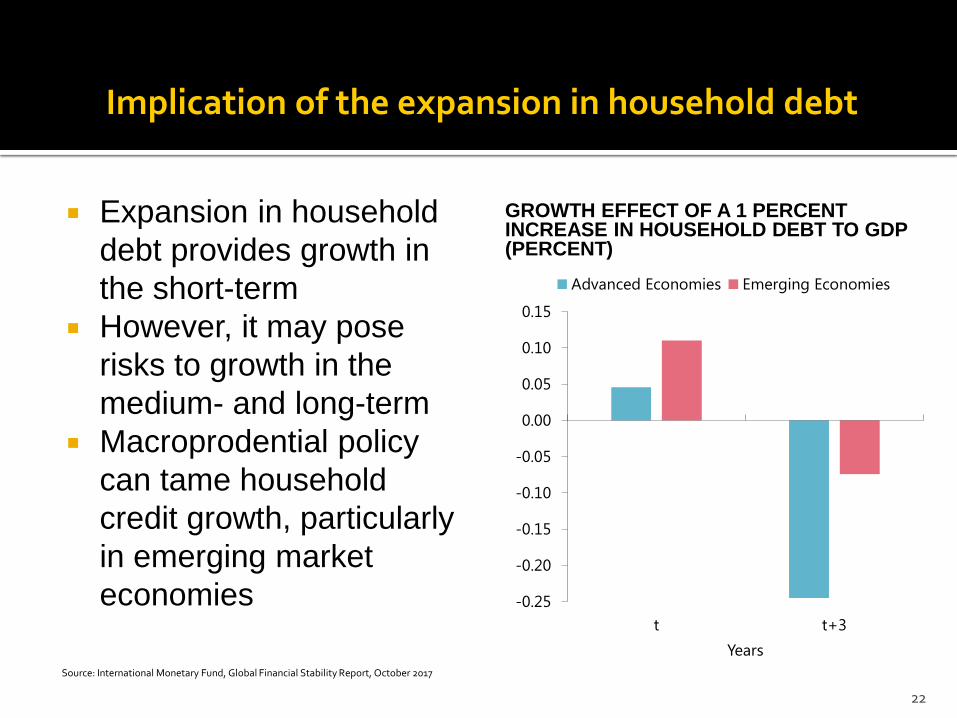
Implication of the expansion in household debt
Source: International Monetary Fund, Global Financial Stability Report, October 2017
GROWTH EFFECT OF A 1 PERCENT INCREASE IN HOUSEHOLD DEBT TO GDP(PERCENT)
-0.25
-0.20
-0.15
-0.10
-0.05
0.00
0.05
0.10
0.15
t t+3Years
Advanced Economies Emerging Economies
Expansion in household debt provides growth in the short-term
However, it may pose risks to growth in the medium- and long-term
Macroprodential policy can tame household credit growth, particularly in emerging market economies
22
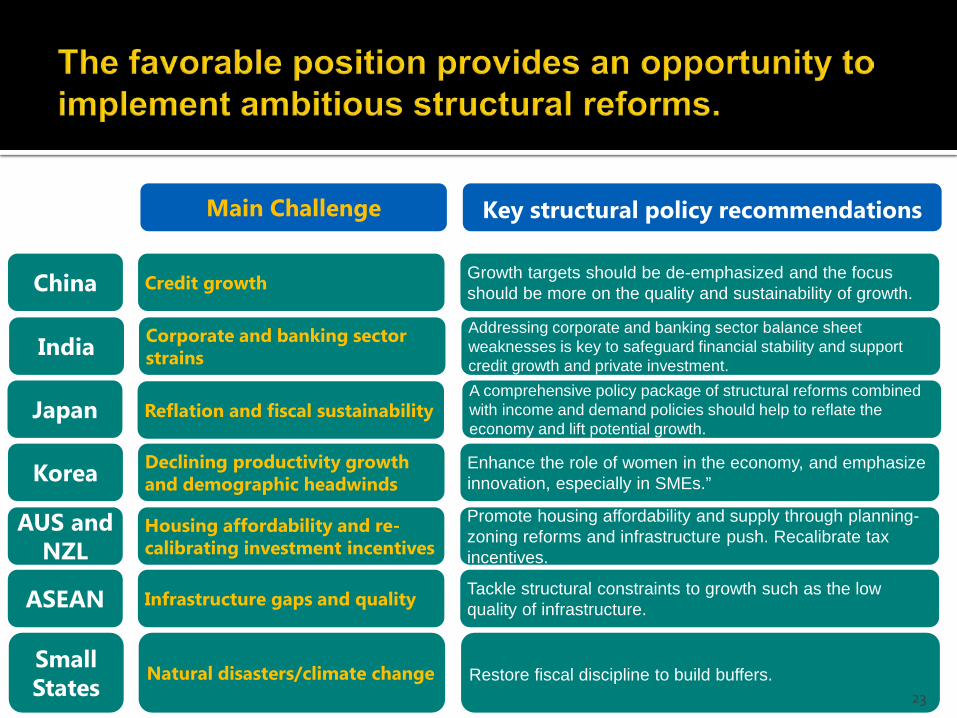
Key structural policy recommendationsMain Challenge
China Growth targets should be de-emphasized and the focus should be more on the quality and sustainability of growth. Credit growth
JapanA comprehensive policy package of structural reforms combined with income and demand policies should help to reflate the economy and lift potential growth.
Reflation and fiscal sustainability
IndiaAddressing corporate and banking sector balance sheet weaknesses is key to safeguard financial stability and support credit growth and private investment.
Corporate and banking sector strains
AUS and NZL
Promote housing affordability and supply through planning-zoning reforms and infrastructure push. Recalibrate tax incentives.
Housing affordability and re-calibrating investment incentives
ASEAN Tackle structural constraints to growth such as the low quality of infrastructure. Infrastructure gaps and quality
Korea Enhance the role of women in the economy, and emphasize innovation, especially in SMEs.”
Declining productivity growth and demographic headwinds
SmallStates Restore fiscal discipline to build buffers.Natural disasters/climate change
23

Malaysian Institute of Economic ResearchNational Economic Outlook Conference
November 21, 2017