chief executive officer’s report – february 2018 · pdf file ·...
TRANSCRIPT

Report for Information
Chief Executive Officer’s Report – February 2018 Update Date: February 15, 2018 To: TTC Board From: Chief Executive Officer
Summary
The Chief Executive Officer’s Report is submitted each month to the TTC Board, for information. Copies of the report are also forwarded to each City of Toronto Councillor, the City Deputy Manager, and the City Chief Financial Officer, for information. The report is also available on the TTC’s website.
Financial Summary
Each monthly Chief Executive Officer’s Report includes a variety of financial details on TTC budgets and projects. These details are provided for information only, there are no financial impacts associated with the Board’s receipt of this report.
Equity/Accessibility Matters
The TTC strives to deliver a reliable, safe, clean, and welcoming transit experience for all of its customers, and is committed to making its transit system barrier free and accessible to all. This is at the forefront of TTC’s new Corporate Plan 2018-2022. The TTC strongly believes all customers should enjoy the freedom, independence, and flexibility to travel anywhere on its transit system. The TTC measures, for greater accountability, its progress towards achieving its desired outcomes for a more inclusive and accessible transit system that meets the needs of all its customers. This progress includes the TTC’s Easier Access Program, which is on track to making all subway stations accessible by 2025. It also includes the launch of the Family of Services pilot and improved customer service through better on-time service delivery with improved shared rides, and same day bookings to accommodate Family of Service Trips. These initiatives outlined in this report and in TTC’s Multi-Year Accessibility Plan will help TTC achieve its vision of a seamless, barrier free transit system that makes Toronto proud.
Decision History The Chief Executive Officer’s Report, which was created in 2012 to better reflect the Chief Executive Officer’s goal to completely modernize the TTC from top to bottom, was transformed to be more closely aligned with the TTC’s seven strategic objectives – safety, customer, people, assets, growth, financial sustainability, and reputation. In 2018, with the launch of the new Corporate Plan, this report will undergo progressive changes to align and reflect our reporting metrics to the TTC’s continued transformation.
Issue Background For each strategic objective, updates of current and emerging issues and multi-year performance are now provided, along with a refreshed performance dashboard that reports on the customer experience. This information is intended to keep the reader completely up-to-date on the various initiatives underway at the TTC that, taken together, will help the TTC achieve its vision of a transit system that makes Toronto proud.
Contact Vince Cosentino, Director - Statistics 416-393-3961 [email protected]
Signature
Richard J. Leary Chief Executive Officer (Acting)
Attachments Attachment 1 - Chief Executive Officer’s Report – February 2018 Update
Chief Executive Officer’s Report
Toronto Tr ansit Com mission February 2018 Update

Toronto Transit Commission CEO’s Report – February 2018 Update 1
Table of Contents 1. TTC Performance Scorecard and Critical Projects Dashboard 2
2. CEO Commentary 9
3.1 Safety & Security 19 3. Performance Update
3.2 Customer 25 3.3 People 60 3.4 Assets 63 3.5 Financials 74
Our Vision: A transit system that makes Toronto proud.
About the cover: We’re excited about the future of the TTC, as we unveil our new Corporate Plan and the TTC Way.
Toronto Transit Commission CEO Report – February 2018 Update 2
1. TTC Performance Scorecard & Critical Projects Dashboard

Toronto Transit Commission CEO’s Report – February 2018 Update 3
TTC Performance Scorecard
Ongoing Trend Indicators:
Favourable Mixed Unfavourable *Represents current 12-month average of actual results
Key Performance Indicator Description Latest
Measure Current Target Current Status
Ongoing Trend
Page
Safety and Security
Lost Time Injuries Injuries per 100 Employees Dec 2017 5.31 3.65* 20
Customer Injury Incidents Injury Incidents per 1M Boardings Dec 2017 0.71 1.15* 21
Offences against Customers Offences per 1M Boardings Dec 2017 0.73 1.00 22
Offences against Staff Offences per 100 Employees Dec 2017 3.14 3.69* 23
Customer: Ridership TTC Ridership Dec 2017 49.6M 50.3M 26
TTC Ridership 2017 y-t-d to Dec 533.2M 543.8M NA 26
PRESTO Ridership Dec 2017 9.0M 11.0M 27
PRESTO Ridership 2017 y-t-d to Dec 75.3M 78.2M NA 27
Wheel-Trans Ridership Dec 2017 390K 492K 28
Wheel-Trans Ridership 2017 y-t-d to Dec 4.2M 4.7M NA 28
Customer: Satisfaction Customer Satisfaction Score Q4 2017 79% 77% 29
Customer: Environment
Station Cleanliness Audit Score Q4 2017 75.4% 75% 35
Ongoing Trend Indicators:
Favourable Mixed Unfavourable *Represents current 12-month average of actual results
Key Performance Indicator Description Latest
Measure Current Target Current Status
Ongoing Trend
Page
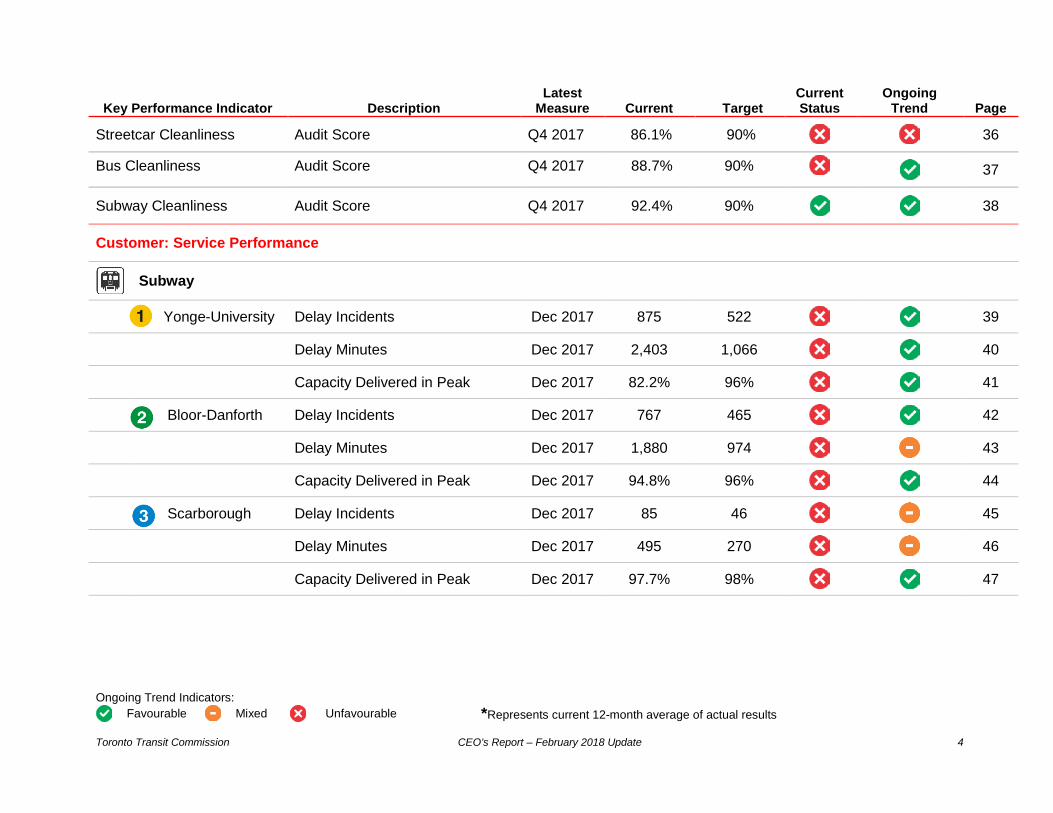
Streetcar Cleanliness Audit Score Q4 2017 86.1% 90% 36
Bus Cleanliness Audit Score Q4 2017 88.7% 90% 37
Subway Cleanliness Audit Score Q4 2017 92.4% 90% 38
Customer: Service Performance
Subway
Yonge-University Delay Incidents Dec 2017 875 522 39
Delay Minutes Dec 2017 2,403 1,066 40
Capacity Delivered in Peak Dec 2017 82.2% 96% 41
Bloor-Danforth Delay Incidents Dec 2017 767 465 42
Delay Minutes Dec 2017 1,880 974 43
Capacity Delivered in Peak Dec 2017 94.8% 96% 44
Scarborough Delay Incidents Dec 2017 85 46 45
Delay Minutes Dec 2017 495 270 46
Capacity Delivered in Peak Dec 2017 97.7% 98% 47
Toronto Transit Commission CEO’s Report – February 2018 Update 4

Key Performance Indicator Description Latest
Measure Current Target Current Status
Ongoing Trend
Page
Sheppard Delay Incidents Dec 2017 66 37 48
Delay Minutes Dec 2017 221 91 49
Capacity Delivered in Peak Dec 2017 99.7% 98% 50
Streetcar On-Time Departure Dec 2017 52.9% 90% 51
Short Turns Dec 2017 1,510 3,045 52
Bus On-Time Departure Dec 2017 75.2% 90% 53
Short Turns Dec 2017 2,973 4,656 54
Wheel-Trans % Within 10 Minutes of Schedule Dec 2017 81.3% 90% 55
Customer: Amount of Service
Streetcar Weekly Service Hours Dec 2017 17.0K 21.3K 56
Bus Weekly Service Hours Dec 2017 139.4K 141.0K 57
Subway Weekly Service Hours Oct 2017 9.7K 9.8K 57
Operator Efficiency Crewing Efficiency Dec 2017 87.05% 87.15% 59
Ongoing Trend Indicators:
Favourable Mixed Unfavourable *Represents current 12-month average of actual results Toronto Transit Commission CEO’s Report – February 2018 Update 5

Ongoing Trend Indicators:
Favourable Mixed Unfavourable *Represents current 12-month average of actual results Toronto Transit Commission CEO’s Report – February 2018 Update 6
Latest Current Ongoing Key Performance Indicator Description Measure Current Target Status Trend Page
People
Employee Absence Absenteeism Rate Dec 2017 8.45% 7.44%* 61
Assets: Vehicle Reliability
Subway 325,051 300,000 T1 Mean Distance Between Failures Dec 2017 64 km km 466,311 600,000 TR Mean Distance Between Failures Dec 2017 65 km km
Streetcar 2,177 6,000 CLRV Mean Distance Between Failures Dec 2017 km km 66
1,177 6,000 ALRV Mean Distance Between Failures Dec 2017 km km 67
19,865 35,000 New Streetcar Mean Distance Between Failures Dec 2017 68 km km 17,757 12,000 Bus Mean Distance Between Failures Dec 2017 69 km km 15,375 12,000 Wheel-Trans Mean Distance Between Failures Dec 2017 km km 70

Ongoing Trend Indicators:
Favourable Mixed Unfavourable *Represents current 12-month average of actual results Toronto Transit Commission CEO’s Report – February 2018 Update 7
Key Performance Indicator Description Latest
Measure Current Target Current Status
Ongoing Trend
Page
Assets: Equipment Availability
Elevators Percent Available Dec 2017 97.3% 98% 71
Escalators Percent Available Dec 2017 97.5% 97% 72
Financials
TTC Revenue Actual vs. Budget 2017 y-t-d to Nov $1,121M $1,123M Section 3.5
TTC Operating Expenditure Actual vs. Budget 2017 y-t-d to Nov $1,559M $1,646M Section 3.5
Wheel-Trans Revenue Actual vs. Budget 2017 y-t-d to Nov $6.9M $7.6M Section 3.5
W-T Operating Expenditure Actual vs. Budget 2017 y-t-d to Nov $120M $137M Section 3.5
Capital Expenditure – Base Actual vs. Budget 2017 y-t-d to Nov $792M $1,071M Section 3.5
Capital Expenditure – TYSSE Actual vs. Budget 2017 y-t-d
to Nov $280M $527M Section 3.5
Capital Expenditure – SSE Actual vs. Budget 2017 y-t-d to Nov $47M $79M Section 3.5

Toronto Transit Commission CEO Report – February 2018 Update 8
Critical Projects Dashboard Current as of November 2017 | Next Update in March 2018 CEO Report The dashboard below provides a snapshot in time (updated quarterly) of the health status for major projects that comprise the TTC project portfolio. The projects have been included in the dashboard due to their magnitude, complexity and/or strategic significance. Collectively, the dashboard comprises over 50% of the base capital program and 100% of the fully funded expansion projects. CEO Reports for March, May, September, and November include an updated dashboard as well as one-page project performance updates for each project listed in the dashboard. Exception reporting for projects with a yellow ‘Y’ or red ‘R’ status is provided in the CEO Commentary (see Section 2 of this CEO Report).
Project Strategic Objective
Outlook to CompletionActual ProjectedCost (millions) Schedule
Sched
ule
CostSco
peStart Date End Date
RiskBudget LTD % Cost % Approved Revised
Vehicles: Purchase of Buses * Assets $1,271 $370 29% $1,266 100% Ongoing Q4 2019 Q1 2018 G G G G
Facilities: McNicoll Bus Garage Growth $181 $20 11% $181 100% Q4 2012 Q2 2020 Q2 2020 G G G G
Management Systems: VISION (CAD/AVL) Customer $115 $15 13% $115 100% Q1 2014 Q4 2020 Q1 2020 Y G G G
Vehicles: Purchase of New Streetcars Assets $1,187 $594 50% $1,187 100% Q2 2009 Q4 2019 Q4 2019 R G G R
Facilities: Leslie Barns Growth $523 $493 94% $523 100% 2008 Q4 2017 Q4 2017 G G G G
Track: Surface Track * Assets $598 $253 42% $598 100% Ongoing Q4 2017 Q2 2018 Y G G Y
Vehicles: Purchase of Subway Cars Assets $1,167 $1,129 97% $1,167 100% Q2 2011 Q4 2016 Q2 2017 G G G G
Stations: Easier Access III Assets $774 $285 37% $776 100% 2006 Q4 2025 Q4 2025 Y G G Y
Facilities: TR / T1 Rail Yard Accommodation ** Assets $973 $198 20% $966 99% 2010 Post 2026 Post 2026 G G G G
Track & Tunnels: Subway Track * Assets $557 $168 30% $540 97% Ongoing Q2 2018 Q2 2018 G G G G
Signals: Automatic Train Control (ATC Line 1-YUS) Assets $563 $363 64% $563 100% Q2 2009 Q4 2019 Q4 2019 G G G G
Toronto-York Spadina Subway Extension (TYSSE) Growth $3,184 $2,633 83% $3,184 100% Q2 2008 Q4 2017 Q4 2017 G G G G
Scarborough Subway Extension*** Growth $3,305 $64 2% $3,305 100% Q4 2013 Q4 2023 Q2 2026 R Y R R
PRESTO Customer $44 $45 102% $48 108% Q4 2012 Q4 2017 Q4 2019 Y Y Y Y
SAP Financial Su $63 $39 61% $63 100% Q1 2014 Q3 2019 Q3 2019 R Y Y Y
Project Strategic Objective
Actual Projected
Streetcar Fleet & Facilities
Sched
ule
CostSco
pe
Expansion
Start Date End Date
Risk
Bus Fleet & Facilities
Budget
Management Systems
Subway Fleet & Infrastructure
*These projects are ongoing in nature. Performance data reflects the 10-year funding envelope. **The scope is not sufficiently defined to establish a complete budget or schedule. The cost and schedule above reflect known/approved scope, which will be reset when the scope is better known. ***The cost and schedule will be reset at Stage Gate 3.

Ongoing Trend Indicators:
Favourable Mixed Unfavourable *Represents current 12-month average of actual results Toronto Transit Commission CEO’s Report – February 2018 Update 9
2. CEO Commentary
Over the last five years, we have created a strong foundation for the future. This plan puts us in the best possible position to tackle our current and future challenges.

Toronto Transit Commission CEO’s Report – February 2018 Update 10
CEO Commentary and Current Issues General Overview How information is presented in the CEO’s Report continues to evolve. With Board approval last month of the TTC’s next five-year Corporate Plan, we have taken all five of the plan’s critical paths, plus the cornerstone of safety and security, and highlighted where we stand on specific areas of each critical path. Further down in the report, you will note that in addition to the KPI trend and targets presented, commentary around results, analysis and an action plan are presented. While just six weeks into 2018, it is proving to be a busy and challenging year. I want to thank the board for their approval in January of the next Corporate Plan, but also the Ridership Growth Strategy – a strategy that will guide the TTC in building and sustaining its ridership. In a separate report, staff will present an explanation of the events of January 30 when a series of incidents made for a particularly bad morning rush hour for customers. As important as understanding is, what we’re doing to ensure such a morning doesn’t happen again is even more important. PRESTO continues to rollout across the system. More than 100 entrances have our new modern paddle-style fare gates and we are on track to complete the fare gate construction at every subway station entrance by early summer. Our PRESTO adoption is at 18% and we continue to see an increase of adult and senior customers transitioning from a regular adult or senior Metropass to a TTC Monthly Pass on PRESTO. There is further detail in the project update section of my commentary however, one area we mentioned at the last board meeting was regarding the back end system having an issue with reporting gate event errors in a timely manner. This issue is impacting the ability of maintenance staff to react quickly to problems with fare gates. PRESTO fare payments are not impacted by this issue. Interim measures are in place and staff are working with the fare gate supplier to address this defect. Bombardier has come to the table with a revised plan where a second production line has opened in Kingston with its first production car being delivered in Q3 this year. While Bombardier remains confident they can still deliver all 204 new streetcars by the end of 2019, the TTC will continue to hold them to account. This measure, however, is a positive step in the right direction.

Toronto Transit Commission CEO’s Report – February 2018 Update 11
The King Street Pilot continues to see growth in ridership, improved reliability and faster travel times – the three measures the TTC is monitoring to assess route performance. As new streetcars are delivered, they are deployed to King St. Today, at peak, we are running 20 new streetcars on the 504 King and 514 Cherry routes, combined. Finally, the first of many planned weekend subway closures this year occurred on February 3-4. Automatic Train Control, state of good repair and, significantly, work at Eglinton Station for the Eglinton Crosstown will be evident to Torontonians this year. We appreciate everyone’s patience as we undertake the critical work necessary to improve reliability and expand the network Critical Path 1: Financial Sustainability Ridership in 2017 was down 0.6%, or 3.4 million rides, over 2016. We know that ridership has flatlined since 2014, a problem many large transit systems in North America face today. The new Ridership Growth Strategy will assist us in addressing this problem and grow ridership once again. More details on 2017 ridership and revenue will appear in the March CEO Report. Related to financial sustainability, the TTC continues to work closely with the City on a number of fronts, including, of course long-term budgeting, but also on shared services, like SAP. Critical Path 2: People A safe and healthy workplace is foundational at the TTC. Our minimum expectation is for every employee to go home at the end of their work day healthy. When that doesn’t happen, we have programs and staff dedicated to helping employees get back to work as quickly and safely as possible. Absenteeism was up in December and has been for five of the past six months. Some long-term absences can be attributed to a spike in suicide events on the subway late last year. These are complex cases of trauma and employees receive support from all areas of the organization to assist in their recovery and ultimate return to work.
Toronto Transit Commission CEO’s Report – February 2018 Update 12
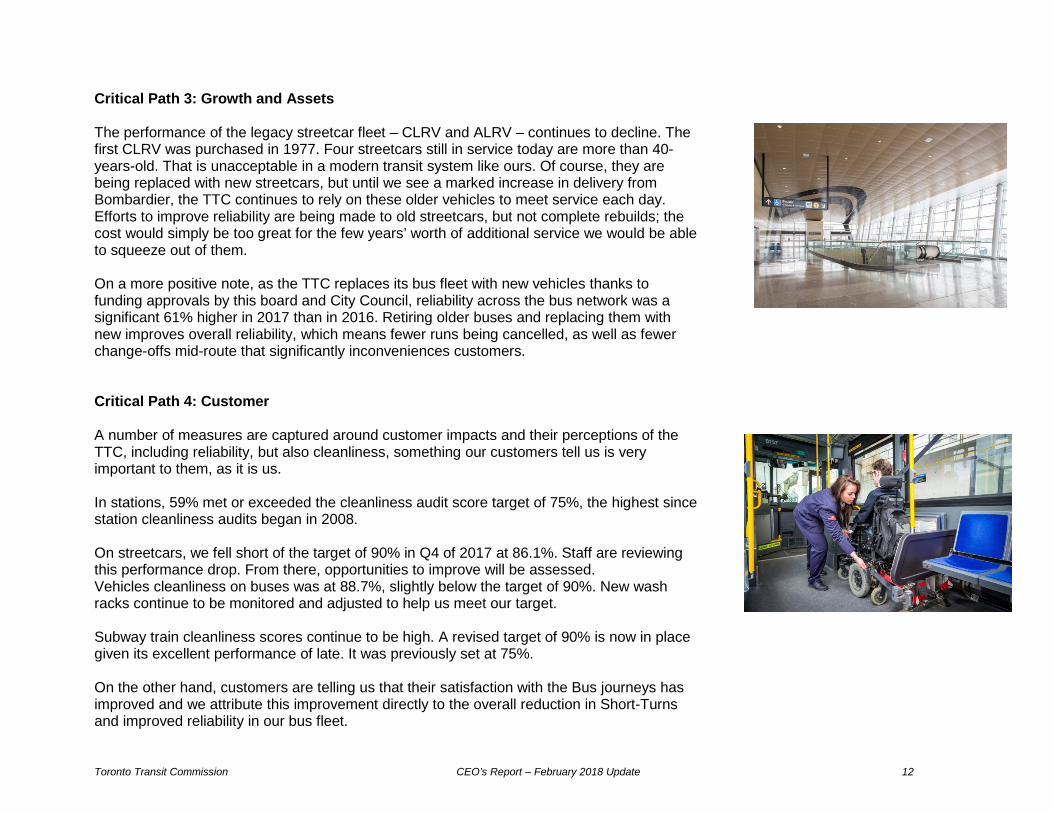
Critical Path 3: Growth and Assets The performance of the legacy streetcar fleet – CLRV and ALRV – continues to decline. The first CLRV was purchased in 1977. Four streetcars still in service today are more than 40-years-old. That is unacceptable in a modern transit system like ours. Of course, they are being replaced with new streetcars, but until we see a marked increase in delivery from Bombardier, the TTC continues to rely on these older vehicles to meet service each day. Efforts to improve reliability are being made to old streetcars, but not complete rebuilds; the cost would simply be too great for the few years’ worth of additional service we would be able to squeeze out of them. On a more positive note, as the TTC replaces its bus fleet with new vehicles thanks to funding approvals by this board and City Council, reliability across the bus network was a significant 61% higher in 2017 than in 2016. Retiring older buses and replacing them with new improves overall reliability, which means fewer runs being cancelled, as well as fewer change-offs mid-route that significantly inconveniences customers. Critical Path 4: Customer A number of measures are captured around customer impacts and their perceptions of the TTC, including reliability, but also cleanliness, something our customers tell us is very important to them, as it is us. In stations, 59% met or exceeded the cleanliness audit score target of 75%, the highest since station cleanliness audits began in 2008. On streetcars, we fell short of the target of 90% in Q4 of 2017 at 86.1%. Staff are reviewing this performance drop. From there, opportunities to improve will be assessed. Vehicles cleanliness on buses was at 88.7%, slightly below the target of 90%. New wash racks continue to be monitored and adjusted to help us meet our target. Subway train cleanliness scores continue to be high. A revised target of 90% is now in place given its excellent performance of late. It was previously set at 75%. On the other hand, customers are telling us that their satisfaction with the Bus journeys has improved and we attribute this improvement directly to the overall reduction in Short-Turns and improved reliability in our bus fleet.

Toronto Transit Commission CEO’s Report – February 2018 Update 13
Critical Path 5: Partnerships Toronto Hydro & TTC’s power systems teams have just completed two major milestones providing secondary power feeds to two critical subway traction power substations; one at TYSSE Finch West station and the second for the new Wilson Yard substation. These secondary feeds, part of a new TTC substation design, ensure that traction power is available in the event of a failure of one of the power lines feeding the substation and an automatic trip switch makes the transfer of power seamless to the TTC. Building in redundancy to the subway power supply is important for both TTC and Toronto Hydro and strengthens the resiliency of subway operations. TTC and Toronto Hydro’s partnership on these complex projects is essential to their success. Cornerstone: Safety The annual rate of offenses against customers was down in 2017 over 2016 by 2.5%. Programs like the SafeTTC app and the #ThisIsWhere awareness campaign that supports the app was launched in 2017. It enables the TTC to monitor and act quickly when incidents are reported directly by customers via the app. Since the app went live, it has been downloaded more than 3,500 times. In addition, 1,120 reports have been sent to Transit Control via the app. Of those, 55 have resulted in investigations being opened, and three arrests being made. Delivery of Major Projects Referring to the Critical Projects Dashboard on page 8, the following section provides details of the status of major projects and includes exception reporting for projects with yellow ‘Y’ and red ‘R’ status indicators. VISION No change in overall status
Schedule Cost Scope Overall RiskY G G G
In preparation for the VISION implementation, training initiatives are in full effect. Operator training has commenced at Mount Dennis Division and is scheduled to start at Arrow Road Division on January 22. Supervisor training for Mount Dennis, Arrow Road, and Roncesvalles Divisions is scheduled to start in February, 2018.

Toronto Transit Commission CEO’s Report – February 2018 Update 14
Streetcar Transportation CIS operations are scheduled to move to the Operations Control Centre at Hillcrest Complex by the end of February, 2018. Vehicle testing will start in March, 2018, and upon successful completion, the rollout will begin at Mount Dennis and Arrow Road Divisions in Q2 2018.
New Streetcars
Change in schedule status and overall status
Schedule Cost Scope Overall R G G R
Schedule is at risk due to known manufacturing issues that are being addressed. TTC continues to work as business partners with Bombardier. However, the TTC’s ability to mitigate this risk is limited.
Year\Month 1 2 3 4 5 6 7 8 9 10 11 12 Total
2014 0 0 0 0 0 0 0 2 0 0 1 0 3 2015 0 1 1 0 1 1 0 1 2 0 1 3 11 2016 1 1 0 1 2 1 1 1 1 1 2 4 16 2017 0 2 1 1 2 3 1 2 1 5 2 7 27
2018
Delivered 11 16 17 21 65
In-Service 12 16 15 21 64
As of this writing, 58 new vehicles are now in service. I will update the Board on the most up-to-date information from Bombardier, as of the date of the meeting.
Surface Track
No change in overall status
Schedule Cost Scope Overall RiskY G G Y
The performance scorecard above has not changed since last month but continues to be in my commentary due to the highlighted risk.

Toronto Transit Commission CEO’s Report – February 2018 Update 15
The track construction schedule is continuously being reviewed with stakeholders such as the City and the Engineering, Construction and Expansion Department. Opportunities to couple work to minimize community disruptions will result in potential schedule changes. As a result, the project status is yellow. An example of this is the original construction schedule for the planned rehabilitation work at Roncesvalles and Russell Carhouses. These schedules were revised to include work at Roncesvalles in 2018 and work at Russell in 2020. This revision is due to the continued late delivery of the new LFLRV and the opportunities to bundle work with the Roncesvalles/King/Queen intersection and the planned ECE Carhouse modifications. While the schedules have changed, the revisions help with operational needs and minimize impact to the surrounding community. Easier Access Phase III (Accessibility) No change in overall status
Schedule Cost Scope Overall RiskY G G Y
I am pleased to report good progress across all current projects. Coxwell Station elevators were put into service on December 31, 2017. Of the 75 subway stations, 44 are accessible including the 6 new stations and Spadina (which is accessible on Line 2 only). Scarborough Subway Extension No change in overall status
Schedule Cost Scope Overall RiskR Y R R
Work continues to progress design towards Stage Gate 3, expected in fall of 2018. At this time, the project will provide initial cost inputs from the TTC team (includes detailed costs for the Scarborough Centre station, tunnel, Kennedy station, systems, property and utilities). Further work is underway by the new Chief Project Manager with key stakeholders within TTC and the City to define the activities, approval process and timelines to arrive at the final Class 3 Cost Estimate, Level 3 Project Schedule, and associated Risk Analysis.
Toronto Transit Commission CEO’s Report – February 2018 Update 16
As requested by City Council, a report will be presented at the first opportunity to the Executive Committee, TTC Board and City Council, which is expected to be Q1 of 2019. PRESTO No change in overall status
Schedule Cost Scope Overall Y Y Y Y
The 2018 schedule and adoption plan is being finalized with PRESTO. This includes the implementation of single use tickets (LUMs) in Q2 2108 and the two hour transfer in Q3 2018 as well a number of other key deliverables to support adoption. Work continues at a number of stations to install PRESTO equipment and vending machines and is expected to be completed in Q3 2018. This includes converting the remaining fare line equipment to new paddle style fare gates. The fare gates have a back-end system to remotely monitor and report the status of all fare gates to maintenance staff. One component (data concentrators) of the back end system is having an issue with forwarding some fare gate events in a timely manner. This issue is impacting the ability of maintenance staff to react quickly to problems with fare gates. PRESTO fare payments are not impacted by this issue. Staff has implemented interim measures and is working with the fare gate supplier to address this defect. SAP Change in schedule status and overall status
Schedule Cost Scope Overall R Y Y Y
In January, the TTC hired an experienced SAP Program Lead from the City of Toronto, who will continue efforts on the following key SAP initiatives:
• Re-baseline scope, prioritize resources and remaining deliverables, to achieve a Go Live date for Wave 1 between Q3 and Q4 2018 (includes the Payroll & Human Resource functions as well as foundational elements of Finance);
• Establish a SAP Shared Services Steering Committee with the City of Toronto for improved program integration, collaboration and transparency;
Toronto Transit Commission CEO’s Report – February 2018 Update 17
• Re-assess and refine the SAP program scope for Waves 2-6 to realign it to TTC business needs in support of our new 5 Year Corporate Plan; and
• Build the business case for additional funding to support the rollout of Waves 2 -6.
TTC staff will report to the Board in Q2 2018 on an updated budget and delivery schedule in accordance with the updated business case.
Richard J. Leary Chief Executive Officer (Acting) Toronto Transit Commission

Toronto Transit Commission CEO’s Report – February 2018 Update 18
Page intentionally left blank

Toronto Transit Commission CEO’s Report – February 2018 Update 19
3.1 Safety & Security
Toronto Transit Commission CEO’s Report – February 2018 Update 20
Safety and Security Lost-Time Injuries
1
2
3
4
5
6
12014
2 3 4 5 6 7 8 9 10 11 12 12015
2 3 4 5 6 7 8 9 10 11 12 12016
2 3 4 5 6 7 8 9 10 11 12 12017
2 3 4 5 6 7 8 9 10 11 12
Inju
ries
per 1
00 E
mpl
oyee
s
Actual 12-Month Average
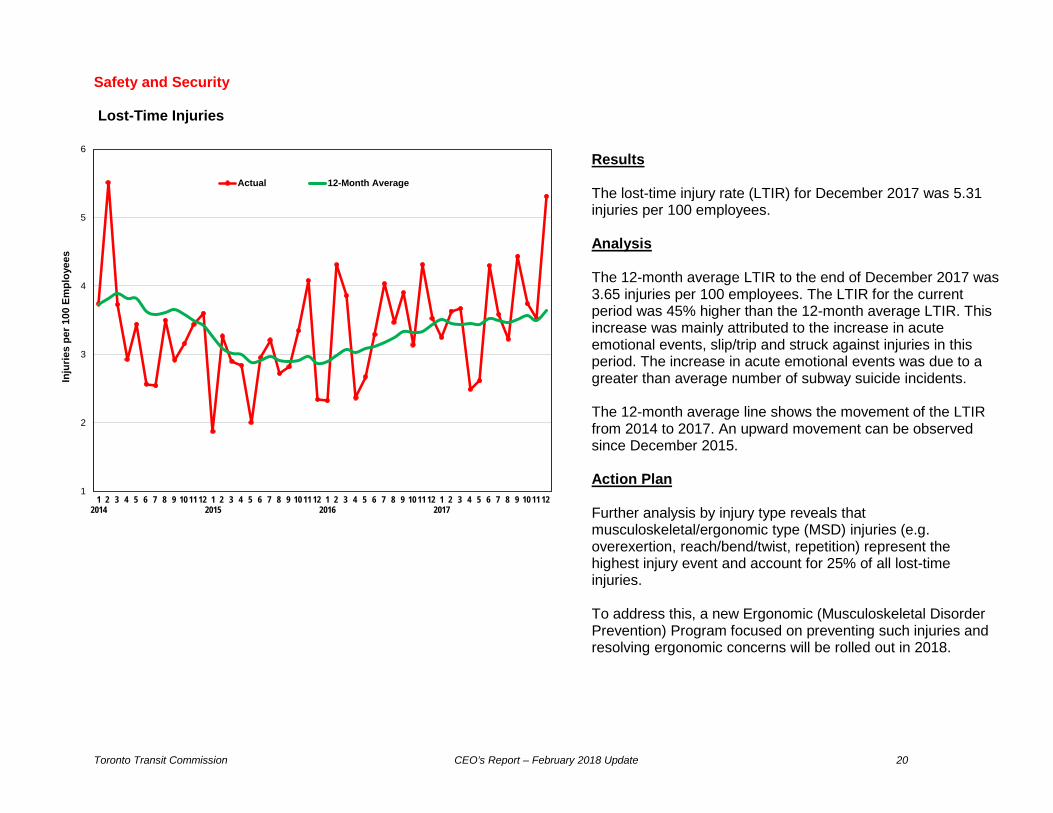
Results The lost-time injury rate (LTIR) for December 2017 was 5.31 injuries per 100 employees. Analysis The 12-month average LTIR to the end of December 2017 was 3.65 injuries per 100 employees. The LTIR for the current period was 45% higher than the 12-month average LTIR. This increase was mainly attributed to the increase in acute emotional events, slip/trip and struck against injuries in this period. The increase in acute emotional events was due to a greater than average number of subway suicide incidents. The 12-month average line shows the movement of the LTIR from 2014 to 2017. An upward movement can be observed since December 2015. Action Plan Further analysis by injury type reveals that musculoskeletal/ergonomic type (MSD) injuries (e.g. overexertion, reach/bend/twist, repetition) represent the highest injury event and account for 25% of all lost-time injuries. To address this, a new Ergonomic (Musculoskeletal Disorder Prevention) Program focused on preventing such injuries and resolving ergonomic concerns will be rolled out in 2018.

Toronto Transit Commission CEO’s Report – February 2018 Update 21
Customer Injury Incidents
0.0
0.5
1.0
1.5
2.0
2.5
12014
2 3 4 5 6 7 8 9 10 11 12 12015
2 3 4 5 6 7 8 9 10 11 12 12016
2 3 4 5 6 7 8 9 10 11 12 12017
2 3 4 5 6 7 8 9 10 11 12
Inju
ry In
cide
nts
per 1
Mill
ion
Vehi
cle
Boa
rdin
gs
Actual 12-Month Average
Results
The customer injury incident rate for December 2017 was 0.71 injury incidents per 1 million vehicle boardings.
Analysis
The 12-month average customer injury incident rate to the end of December 2017 was 1.15 injury incidents per 1 million vehicle boardings. The customer injury incident rate for the current period was 38% lower than the 12-month average rate.
Action Plan The 12-month average line shows the movement of the customer injury incident rate from 2014 to 2017. The observed reduction in the moving average customer injury incident rate can partly be attributed to the introduction of the Station Management Model with an increased focus on ensuring a safe, clean, and secure system for customers and also the ongoing actions taken as part of the Safe Service Action Plan, initiated in 2015, to reinforce good safety behaviours and improve safety performance. Incidents by mode are currently being assessed to more effectively focus resources into continually reducing future incidents.
Toronto Transit Commission CEO’s Report – February 2018 Update 22
Offences Against Customers
0.0
0.2
0.4
0.6
0.8
1.0
1.2
Jan Feb Mar Apr May Jun Jul Aug Sep Oct Nov Dec
Offe
nces
per
1 M
illio
n Ve
hicl
e B
oard
ings
2017 Target 2017 Actual 2016 Trend2015 Trend 2014 Trend
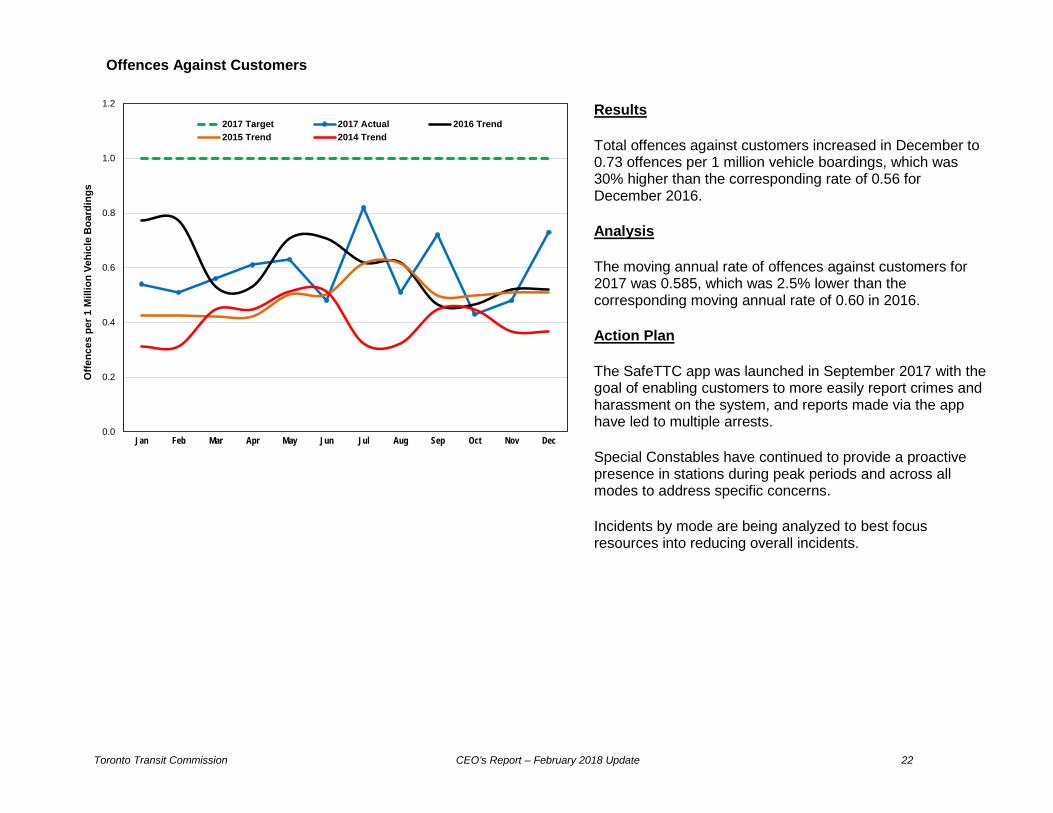
Results
Total offences against customers increased in December to 0.73 offences per 1 million vehicle boardings, which was 30% higher than the corresponding rate of 0.56 for December 2016.
Analysis
The moving annual rate of offences against customers for 2017 was 0.585, which was 2.5% lower than the corresponding moving annual rate of 0.60 in 2016.
Action Plan
The SafeTTC app was launched in September 2017 with the goal of enabling customers to more easily report crimes and harassment on the system, and reports made via the app have led to multiple arrests.
Special Constables have continued to provide a proactive presence in stations during peak periods and across all modes to address specific concerns.
Incidents by mode are being analyzed to best focus resources into reducing overall incidents.

Toronto Transit Commission CEO’s Report – February 2018 Update 23
Offences Against Staff
0.0
1.5
3.0
4.5
6.0
7.5
12014
2 3 4 5 6 7 8 9 10 11 12 12015
2 3 4 5 6 7 8 9 10 11 12 12016
2 3 4 5 6 7 8 9 10 11 12 12017
2 3 4 5 6 7 8 9 10 11 12
Offe
nces
per
100
Em
ploy
ees
(Ann
ualiz
ed)
Actual 12-Month Average
Results
Total offences against staff decreased in December to 3.07 offences per 100 employees, which was 43% lower than the corresponding rate of 5.35 for December 2016.
Analysis
Year-over-year decreases in crimes against employees have been observed in the last 6 consecutive periods.
The moving annual rate of offences against staff for 2017 was 3.68, which was 17% lower than the corresponding moving annual rate of 4.43 for 2016.
Action Plan
The Transit Enforcement Department has identified the modes and routes where these offences are occurring, and continue to deploy Special Constable teams to these areas to support have continued their data-driven deployment model along surface routes to support operating personnel as part of the B.U.S.S.T.O.P. Program.
Incidents by mode are being analyzed to best focus resources into reducing overall incidents.

Toronto Transit Commission CEO’s Report – February 2018 Update 24
Page intentionally left blank

Toronto Transit Commission CEO’s Report – February 2018 Update 25
3.2 Customer

Toronto Transit Commission CEO’s Report – February 2018 Update 26
Customer: Ridership TTC Ridership
9.0
9.5
10.0
10.5
11.0
11.5
Jan Feb Mar Apr May Jun Jul Aug Sep Oct Nov Dec
Aver
age
Wee
kly
Rid
ersh
ip (M
illio
ns)
2017 Budget 2017 Actual 2016 Trend
2015 Trend 2014 Trend
Results Ridership in December was 49.6M, which was 0.7M (1.4%) below the budget of 50.3M. Ridership for 2017 was 533.2M, which was 10.6M (1.9%) below the budget of 543.8M. In terms of year-over-year growth, the 2017 ridership of 533.2M was 3.4M (0.6%) below the 2016 comparable ridership of 536.6M. Analysis Ridership has flatlined since 2014 and this is due to a variety of factors, including slowing employment growth, City growth and congestion, changes in customer mobility, and growth in digital ride-hailing services. Action Plan To re-establish sustained ridership growth, a new Ridership Growth Strategy is being developed for implementation beginning in 2018.

Toronto Transit Commission CEO’s Report – February 2018 Update 27
PRESTO Ridership
0.0
0.5
1.0
1.5
2.0
2.5
Jan Feb Mar Apr May Jun Jul Aug Sep Oct Nov Dec
Aver
age
Wee
kly
Rid
ersh
ip (M
illio
ns)
2017 Budget 2017 Actual 2016 Trend
2015 Trend 2014 Trend
Results Ridership using the PRESTO Farecard (e-purse; period pass) in December was 9.0M, which was 2.0M (18.2%) below the budget of 11.0M. Ridership for 2017 was 75.3M, which was 2.9M (3.7%) below the budget of 78.2M. The year-end variance is mainly attributable to less-than-anticipated sales of Period Passes. In terms of year-over-year growth, the 2017 ridership of 75.3M was 46.5M (161%) above the 2016 comparable ridership of 28.8M. Analysis The PRESTO component of total TTC ridership continues to grow rapidly. PRESTO ridership increased 46.5M (161%) in 2017 compared with 2016. Adoption of PRESTO by TTC customers continues to increase month-over-month; the adoption rate in December 2017 was 18.2%. Action Plan The PRESTO adoption rate is expected to accelerate throughout 2018 in conjunction with the phasing-out of legacy fare media and the commensurate uptake of PRESTO-based fare media. Note: PRESTO ridership is included in TTC ridership totals.
Toronto Transit Commission CEO’s Report – February 2018 Update 28
Wheel-Trans Ridership
40
55
70
85
100
115
Jan Feb Mar Apr May Jun Jul Aug Sep Oct Nov Dec
Aver
age
Wee
kly
Rid
ersh
ip (T
hous
ands
)
2017 Budget 2017 Actual 2016 Trend
2015 Trend 2014 Trend
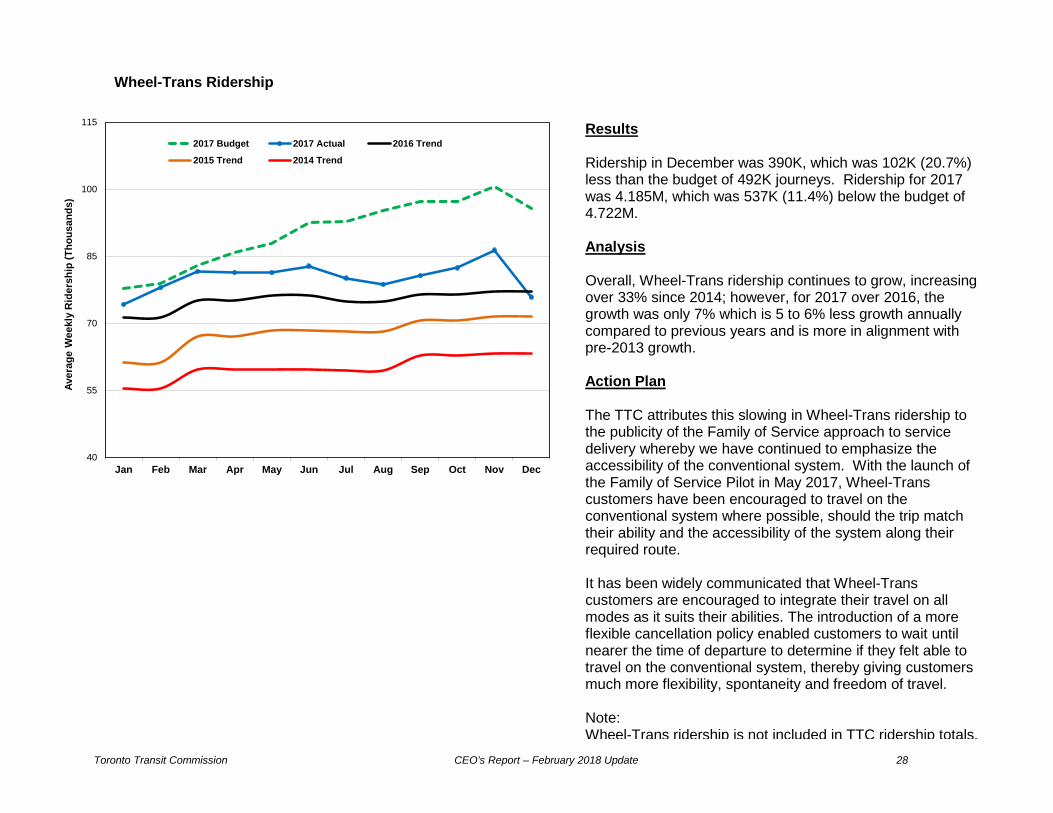
Results Ridership in December was 390K, which was 102K (20.7%) less than the budget of 492K journeys. Ridership for 2017 was 4.185M, which was 537K (11.4%) below the budget of 4.722M. Analysis Overall, Wheel-Trans ridership continues to grow, increasing over 33% since 2014; however, for 2017 over 2016, the growth was only 7% which is 5 to 6% less growth annually compared to previous years and is more in alignment with pre-2013 growth. Action Plan The TTC attributes this slowing in Wheel-Trans ridership to the publicity of the Family of Service approach to service delivery whereby we have continued to emphasize the accessibility of the conventional system. With the launch of the Family of Service Pilot in May 2017, Wheel-Trans customers have been encouraged to travel on the conventional system where possible, should the trip match their ability and the accessibility of the system along their required route. It has been widely communicated that Wheel-Trans customers are encouraged to integrate their travel on all modes as it suits their abilities. The introduction of a more flexible cancellation policy enabled customers to wait until nearer the time of departure to determine if they felt able to travel on the conventional system, thereby giving customers much more flexibility, spontaneity and freedom of travel. Note: Wheel-Trans ridership is not included in TTC ridership totals.

Toronto Transit Commission CEO’s Report – February 2018 Update 29
Customer: Satisfaction Customer Satisfaction Score
65
70
75
80
85
1st Quarter 2nd Quarter 3rd Quarter 4th Quarter
Cus
tom
er S
atis
fact
ion
Scor
e (%
)
2017 Actual 2016 Actual 2015 Actual 2014 Actual
Results Nearly eight in ten customers have high perceptions of overall customer satisfaction in Q4 2017 (79%), closing out the year with the highest ever annual average score of 80%. This yearly score is significantly higher (statistically) than all previous yearly scores (2012: 73%; 2013: 75%; 2014: 72%; 2015: 77%; 2016: 77%). Analysis Perceptions of overall customer satisfaction are driven by numerous service reliability attributes that are measured across the different modes. The top four key drivers across all three modes are: trip duration, comfort of ride, wait time and level of crowding in vehicle. These four metrics have remained steady for subway. However, perceptions of bus riders have improved year-over-year on satisfaction with trip duration (Q4 2016: 78%; Q4 2017: 83%) and wait time (Q4 2016:

Toronto Transit Commission CEO’s Report – February 2018 Update 30
57%; Q4 2017: 65%). For streetcar riders, a dip was experienced between this wave and last for overall customer satisfaction (Q3 2017: 82%; Q4 2017: 71%) and satisfaction with trip duration (Q3 2017: 84%; Q4 2017: 76%). More customers across subway/bus/streetcar and among both frequent/occasional users in Q4 2017 (37%) believe that the TTC has improved over a two-year period than did last year (Q4 2016: 28%). Pride in the TTC and what it means for Toronto remained consistent, (Q 12017: 71%; Q2 2017: 73%, Q3 2017: 71%; Q4 2017: 75%). Perceptions of value for money remained consistent, with just over two-thirds indicating they received average/excellent/good value for money on their last trip (Q1 2017: 90%; Q2 2017: 93%; Q3 2017: 93%; Q4 2017: 93%). Customer: Charter The Customer Charter is designed to track promises and improvements that benefit customers, while holding TTC’s management to account if they’re not met. The progress against these commitments is reported to the TTC Board quarterly and posted on ttc.ca. 2017 Customer Charter The 2017 Customer Charter included 38 time-bound commitments. In 2017, 22 of 38 Charter commitments were met, with highlights including:
a) We opened the Line 1 Toronto-York Spadina Subway Extension with six new fully accessible modern stations including two new TTC bus Terminals, three new TTC commuter parking lots with 2800 spaces, and direct transit connections with GO Rail, GO Bus, York Region Transit buses including Viva. The stations feature modern architecture with sustainable design features including LED lighting, bird-friendly glass, green and cool roofs, and landscaping designed to manage water run-off. Other station amenities include Wi-Fi, covered bicycle storage, new PRESTO fare gates, and new self-service PRESTO machines in service. The bus network along the corridors has been redesigned to serve the new stations.
b) We rolled out our new Wheel-Trans eligibility processes and expanded eligibility criteria;
we also introduced a Wheel-Trans Family of Services pilot that allows for spontaneity and freedom of travel which includes improved same-day booking availability for short trips to access TTC accessible vehicles and stations. New Wheel-Trans No-Show and Late

Toronto Transit Commission CEO’s Report – February 2018 Update 31
Cancellation Policies were also introduced that are more flexible, including allowing for same-day cancellations.
c) We installed 200 passenger information displays in shelters to provide real time
information on vehicle arrivals and we kept customers informed by adopting consistent, customer friendly language for communicating service status information.
d) All entrances at 43 subway stations now have new PRESTO-enabled fare gates. e) We worked with Bike Share Toronto to incorporate docking stations at a minimum of five
TTC stations. This offers our customers a great solution for the first and last mile of their journey.
f) We introduced a new 'Customer Service Agent' role to provide a better and more
engaging service level at eight subway stations to replace the Collector. g) We now have Wi-Fi available at 100% of stations. h) We reduced delays by 10% on all subway lines (incidents and minutes). i) We completed 30% of Line 3 train interior refurbishments. j) We added service during off-peak periods to 15 busy routes, to reduce crowding and
improve travel time. k) We revised the schedules on 10 bus routes to improve service reliability. l) We reduced streetcar short turns to less than in 2016. m) We ensured the 514 Cherry route is serviced by new, fully accessible streetcars.
The commitments that were not met include:
a) Launching an Anti-harassment campaign to raise awareness of and combat harassment on the TTC in Q2; the campaign was launched in Q3.
b) Launching a Safety and Security app as another tool for customer report related incidents
in Q2; the app was launched in Q3. c) Expanding the bike repair stop network by an additional 10 stations in Q2; due to delays
in securing funding, we expect to achieve this in summer of 2018.

Toronto Transit Commission CEO’s Report – February 2018 Update 32
d) Installing time-saving signal priority technology at 15 intersections to speed up bus travel
time in Q2; we continue to have a number of technical issues with firmware etc., 6 have been installed in Q2.
e) Starting construction on four priority bus lanes, to reduce delays and improve travel time
in Q3; construction on Eastbound Steeles at Don Mills and Lake Shore at Browns lane will start in spring of 2018; construction on Lawrence (westbound) at Dufferin is expect to start in summer of 2018; construction on Keele (northbound) at Finch is being postponed for a 5-year period.
f) Installing new high-capacity bike parking racks at 25 subway stations in Q3; we expect to
achieve this in summer of 2018. g) Piloting solar-powered passenger information displays to provide real time information on
vehicle arrivals at stops without utility power in Q3; we achieved this commitment in Q4. h) Putting into service 20 new redesigned and accessible buses as part of an effort to
diversify and modernize the TTC Wheel-Trans fleet in Q4; 11 vehicles were delivered as the end of 2017, to date we have received 16 vehicles with the remaining 4 scheduled to be received by the 2nd week of February 2018.
i) Working with the Bombardier to have a minimum of 40 additional new low-floor,
accessible streetcars on property in Q4; an additional 29 new streetcars were on property at the end of Q4 2017, shortage of cars is being supplemented by running buses on streetcar routes and operating older streetcars longer than planned.
j) Reducing delays by 10% on all subway lines (incidents and minutes) in Q4; the number of
incidents in Q4 were reduced by only 3.5% and the number of delay minutes were reduced by only 1.8%. Extreme cold weather in Q4 2017 resulted in increases in incidents and delay minutes mainly due to door issues on Lines 1, 2 & 3; signal and track circuit issues on Lines 1 & 2; and, switch issues on Line 3. The weather also negatively impacted the trains on Line 3 with a significant increase in door issues. Passenger related security issues in Q4 2017 also resulted in increases in the number of incidents and delay minutes with a 43.2% increase in the number of passenger assault incidents; a 22.7% increase in delay minutes due to disorderly customers; and, a 38.3% increase in delay minutes due to other passenger security issues versus Q4 2016. The introduction of Automatic Train Control on Line 1 also resulted in additional delays and incident minutes that would not have been present in Q4 2016.

Toronto Transit Commission CEO’s Report – February 2018 Update 33
k) Launching an improved and redesigned customer-friendly website in Q4; we expect to deliver an improved and redesigned customer-friendly website in Q2 of 2018. The delay in delivery is due to the length of time it took to complete the purchasing process.
l) Converting an additional 3000 bus poles to the new design to bring total to 6000 in Q4;
we completed 2767 new routes in 2017. There were several route changes throughout the year and large amount of temporary stops were under construction which added challenges to meet the pre-set amount.
m) Consulting with customers and other stakeholders to revise service in three
neighbourhoods (Kingston/Lawrence/Morningside; Junction; and Rexdale/Airport) in Q4; we completed initial consultation for Kingston/Lawrence/Morningside and Junction. However, we were not able to fit in consultation for the Rexdale/Airport area. We have started the background review. We anticipate consultation will happen later in 2018.
n) Widening and lengthening 300 curbside bus stops to make them accessible to customers
with disabilities and, compatible with our higher-capacity, articulated buses in Q4; we modified about 65 stops in 2017. We decided to defer construction on the remaining 235 stops to the start of the 2018 construction season to avoid work during the winter, which would have posed construction challenges and customer safety issues related to the need for temporary stops.
o) Starting phasing out legacy fare media With the PRESTO rollout nearing completion in
Q4; we expect to achieve this in mid-2018. p) Having 300+ new buses in service to replace aging buses in Q4; a total of 341 new buses
were received in 2017, with 270 in service by end of 2017.
For further details on the TTC customer charter, visit ttc.ca.
Toronto Transit Commission CEO’s Report – February 2018 Update 34
Customer: Fares PRESTO The PRESTO rollout continues across the TTC. The priorities for 2018 will be to:
• Complete the remaining subway station entrances that do not yet have the new fare gates with PRESTO
• Complete the installation of the new PRESTO Fare Vending Machines and new Self-Serve Reload Machines at all subway station entrances
• Increase PRESTO card adoption • Continue to introduce new pass products on PRESTO (i.e. the new 12 Month Pass (MDP
equivalent)), Fair Pass as well as student and post-secondary student monthly passes • Introduce cross-boundary payment on TTC buses that travel north of Steeles and into
Mississauga, a daily maximum on PRESTO, two hour time-based transfer on PRESTO and limited use paper PRESTO card
• Stop selling and stop accepting TTC tickets, tokens and passes • Ongoing software upgrades to enhance the performance of PRESTO card readers and
the fare gates

Toronto Transit Commission CEO’s Report – February 2018 Update 35
Customer: Environment
Station Cleanliness
68
71
74
77
80
1st Quarter 2nd Quarter 3rd Quarter 4th Quarter
Cle
anlin
ess
Audi
t Sco
re (%
)
2017 Target 2017 Actual 2016 Trend2015 Trend 2014 Trend
Results
The average station score met target, coming in at 75.44%, up from 74.45% in Q3 (up 0.99%); and up from 72.58% in Q1 (up 2.86%).
Analysis
Forty-one of 69 stations (59%) met or exceeded the target of 75%, the highest number of stations for any one quarter since audits began back in 2008, the previous high was 40 in Q3 & Q4 of 2015 following significant overtime and resources utilized to get stations ready for and maintained during the Pan Am Games.
Another 20 stations (29%) scored above 70%, for a total of 61 of 69 stations (88%) scoring 70% or better. The only time this number of stations scored 70% or better was back in 2015 in Q3 (40 at target or above, and another 23 above 70%) and Q4 (40 at target or above, and 21 above 70%).
The total number of stations that met or exceeded target in each quarter has risen from 28 (41% of stations) in Q1 to 41 (59%) in Q4.

Toronto Transit Commission CEO’s Report – February 2018 Update 36
Customer: Environment Vehicle Cleanliness – Streetcar
84
86
88
90
92
1st Quarter 2nd Quarter 3rd Quarter 4th Quarter
Cle
anlin
ess
Audi
t Sco
re (%
)
2017 Target 2017 Actual
Results
The streetcar cleanliness audit score decreased in Q4 2017 to 86.1% and performance remained below target. Analysis The performance scores takes into account pre-service, in service and post service audit results. As a result, the score is impacted by changes in in-service operating conditions. In Q4 of 2017, extreme cold temperatures and significant precipitation (snow) impacted exterior washes and cleanliness of interiors. Vehicles are not exterior washed in temperatures below minus 10 degrees C. Snow and freezing temperatures also resulted in accumulation of salt deposits on floors, stepwells and seats. All of these factors contributed to the decline in Q4's score.

Toronto Transit Commission CEO’s Report – February 2018 Update 37
Vehicle Cleanliness – Bus
84
86
88
90
92
1st Quarter 2nd Quarter 3rd Quarter 4th Quarter
Cle
anlin
ess
Audi
t Sco
re (%
)
2017 Target 2017 Actual 2016 ActualResults The bus cleanliness audit score in Q4-2017 was 88.7%, which is marginally below the target of 90%. Analysis
The performance scores takes into account pre-service, in service and post service audit results. As a result, the score is impacted by changes in in-service operating conditions.
Q4 results were slightly higher than Q1 of 2017 which experience similar extreme cold temperatures and precipitation (snow) which impacts exterior washes and cleanliness of interiors. Vehicles are not exterior washed in temperatures below minus 10 degrees C. Facilities with outdoor storage were mostly affected (Eglinton & Birchmount Garage). Interior cleanliness is also affected due to accumulation of salt deposits on floors and stepwells.
Action Plan All locations are experiencing issues with cleaning the exterior back surfaces and Bus Maintenance Engineering staff is working towards solutions.

Toronto Transit Commission CEO’s Report – February 2018 Update 38
Vehicle Cleanliness – Subway
85
87
89
91
93
95
1st Quarter 2nd Quarter 3rd Quarter 4th Quarter
Cle
anlin
ess
Audi
t Sco
re (%
)
2017 Target 2017 Actual 2016 Actual
Results The average rating of 92.4% in Q4-2017 is 0.3% point less than Q3-2017 and 0.7% point less than the highest established result of 93.1% in Q2-2017. The Department has recorded a score of greater than 90% in 5 quarters and as a result, have elevated our target to 90%. Analysis The areas identified for improvement in Q3-2016 were the walls and ceilings; both were successfully addressed in consecutive quarters (Q4-2016 to Q4-2017). Previous quarterly results identified the floors as an area where further improvements can be achieved. In Q3-2017, all but one line audit sample identified floors as an area for continued improvements. In Q4-2017, floors and the exterior cleanliness of our vehicles recorded the lowest scores due to the colder winter inclement weather conditions. Action Plan On Line 1-YUS, exterior washes were affected due to facility constraints at Wilson, and construction at Davisville. Currently, the floors are addressed every 14 days during the Floor Wash cycle. Exterior vehicle cleanliness is an area where further improvements can be made on all lines when weather conditions are more favourable. Note: The target for this measure has been changed to 90%, a target more reflective of the ongoing level of performance and consistent with the targets for Bus and Streetcar.

Toronto Transit Commission CEO’s Report – February 2018 Update 39
Customer: Service Performance Subway Line 1: Delay Incidents
0
250
500
750
1,000
1,250
Jan Feb Mar Apr May Jun Jul Aug Sep Oct Nov Dec
Num
ber o
f Del
ay In
cide
nts
2017 Target 2017 Actual 2016 Trend2015 Trend 2014 Trend
Results The number of delay incidents increased from November by 13% to 875 and remained higher than the goal of 522 incidents. Analysis Although passenger incidents showed a slight decline in December, they still accounted for 325 incidents, close to 40% of all delay incidents. The remaining incidents can be attributed to increased rolling stock and subway infrastructure issues. In each category there was an 80% increase in comparison to November 2017. As the temperature decreased throughout December, and eventually reached and remained in an extreme cold weather zone, the number of incidents increased. Action Plan In comparison to 2014, rolling stock incidents decreased by 30.2% and subway Infrastructure incidents have improved by 44.5%. Nevertheless, both groups continue to work hard to reduce the numbers. Subway infrastructure is reviewing their winter operations plan for areas of improvement, including a new pre-service inspection of vital switches in all train yards to ensure they are prepared for service. Rail Cars and Shops have modified the mainline storage plan which will allow for more maintenance time in the yard. Note: The 2017 target is based on a 30% or more reduction in delay incidents from the 2014 monthly average baseline.
Toronto Transit Commission CEO’s Report – February 2018 Update 40
Line 1: Delay Minutes
0
500
1,000
1,500
2,000
2,500
Jan Feb Mar Apr May Jun Jul Aug Sep Oct Nov Dec
Num
ber o
f Del
ay M
inut
es
2017 Target 2017 Actual 2016 Trend2015 Trend 2014 Trend
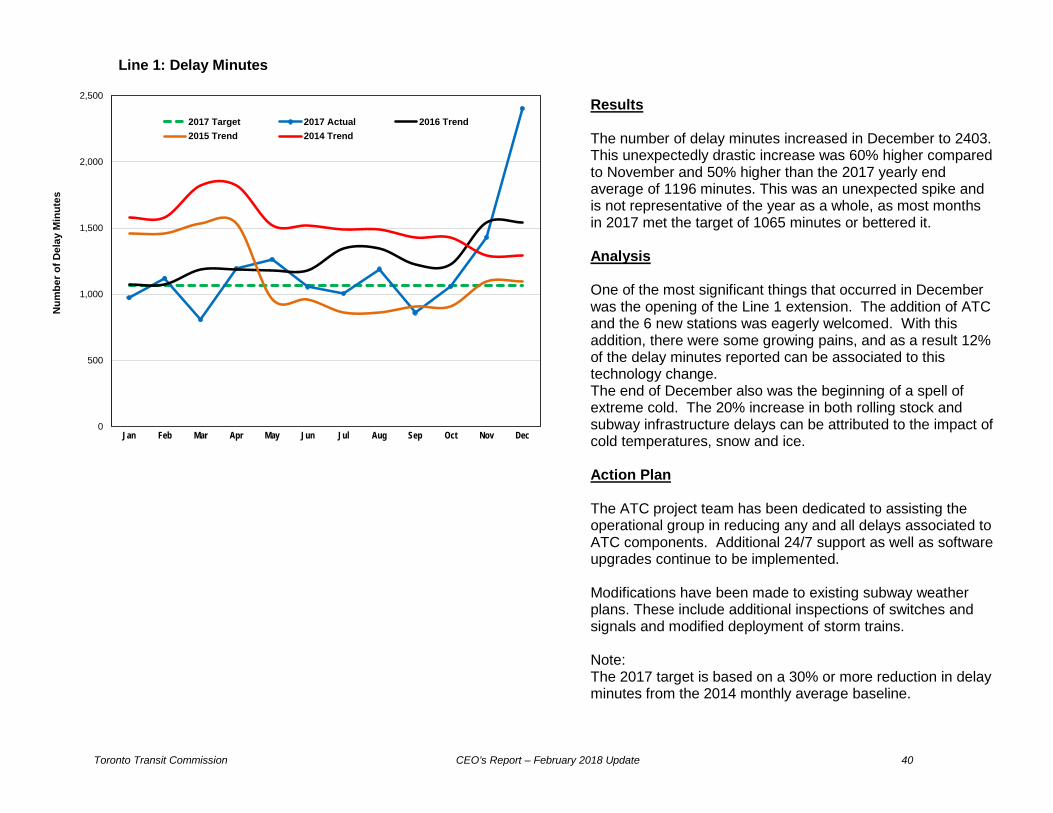
Results The number of delay minutes increased in December to 2403. This unexpectedly drastic increase was 60% higher compared to November and 50% higher than the 2017 yearly end average of 1196 minutes. This was an unexpected spike and is not representative of the year as a whole, as most months in 2017 met the target of 1065 minutes or bettered it. Analysis One of the most significant things that occurred in December was the opening of the Line 1 extension. The addition of ATC and the 6 new stations was eagerly welcomed. With this addition, there were some growing pains, and as a result 12% of the delay minutes reported can be associated to this technology change. The end of December also was the beginning of a spell of extreme cold. The 20% increase in both rolling stock and subway infrastructure delays can be attributed to the impact of cold temperatures, snow and ice. Action Plan The ATC project team has been dedicated to assisting the operational group in reducing any and all delays associated to ATC components. Additional 24/7 support as well as software upgrades continue to be implemented. Modifications have been made to existing subway weather plans. These include additional inspections of switches and signals and modified deployment of storm trains. Note: The 2017 target is based on a 30% or more reduction in delay minutes from the 2014 monthly average baseline.
Toronto Transit Commission CEO’s Report – February 2018 Update 41
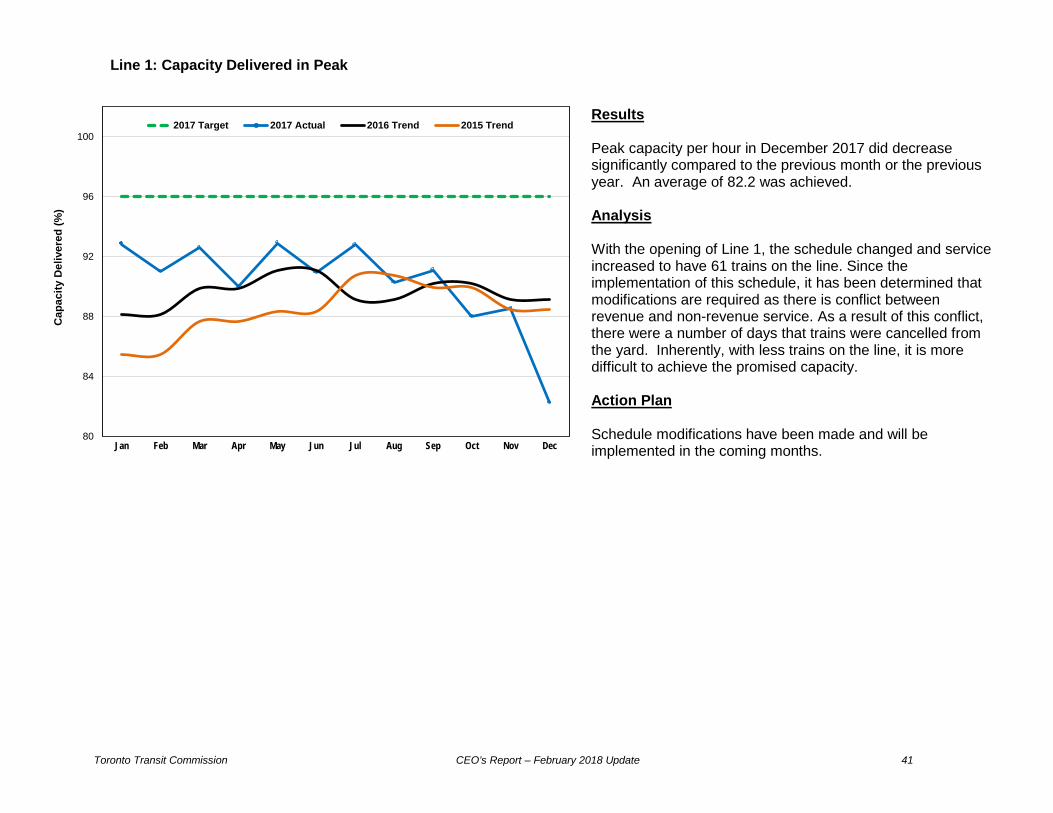
Line 1: Capacity Delivered in Peak
80
84
88
92
96
100
Jan Feb Mar Apr May Jun Jul Aug Sep Oct Nov Dec
Cap
acity
Del
iver
ed (%
)
2017 Target 2017 Actual 2016 Trend 2015 Trend
Results Peak capacity per hour in December 2017 did decrease significantly compared to the previous month or the previous year. An average of 82.2 was achieved. Analysis With the opening of Line 1, the schedule changed and service increased to have 61 trains on the line. Since the implementation of this schedule, it has been determined that modifications are required as there is conflict between revenue and non-revenue service. As a result of this conflict, there were a number of days that trains were cancelled from the yard. Inherently, with less trains on the line, it is more difficult to achieve the promised capacity. Action Plan Schedule modifications have been made and will be implemented in the coming months.
Toronto Transit Commission CEO’s Report – February 2018 Update 42
Line 2: Delay Incidents
0
250
500
750
1,000
1,250
Jan Feb Mar Apr May Jun Jul Aug Sep Oct Nov Dec
Num
ber o
f Del
ay In
cide
nts
2017 Target 2017 Actual 2016 Trend2015 Trend 2014 Trend
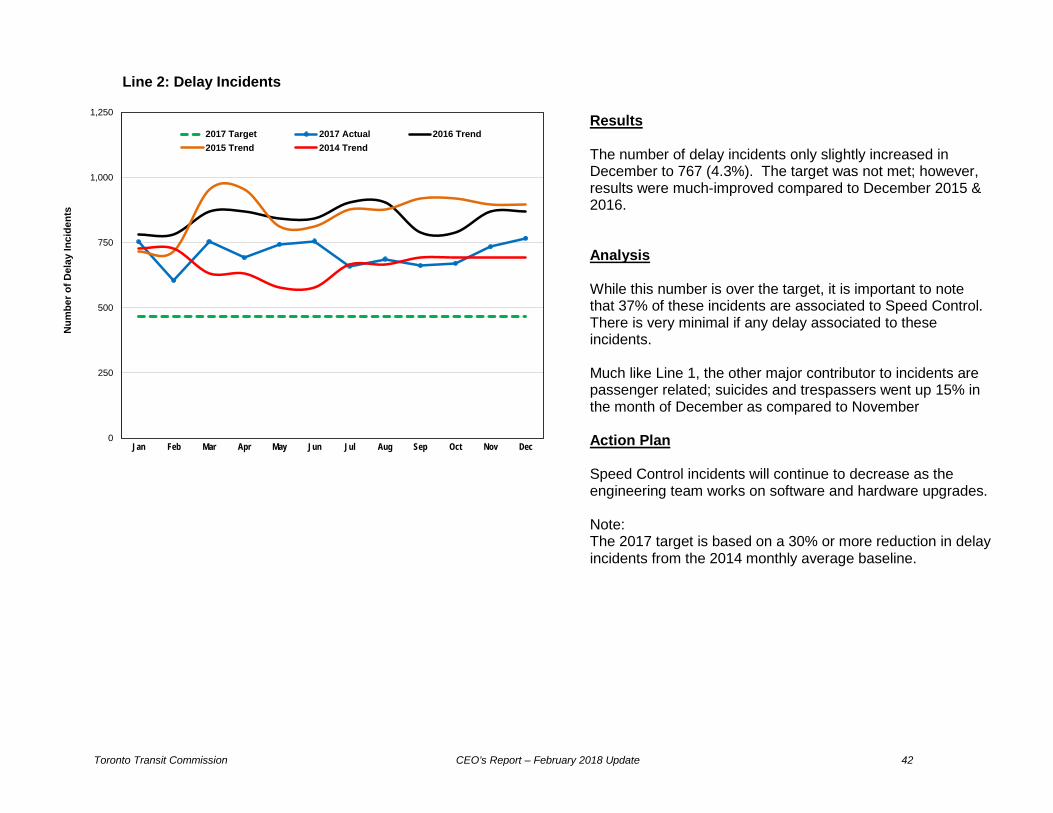
Results The number of delay incidents only slightly increased in December to 767 (4.3%). The target was not met; however, results were much-improved compared to December 2015 & 2016. Analysis While this number is over the target, it is important to note that 37% of these incidents are associated to Speed Control. There is very minimal if any delay associated to these incidents. Much like Line 1, the other major contributor to incidents are passenger related; suicides and trespassers went up 15% in the month of December as compared to November Action Plan Speed Control incidents will continue to decrease as the engineering team works on software and hardware upgrades. Note: The 2017 target is based on a 30% or more reduction in delay incidents from the 2014 monthly average baseline.

Toronto Transit Commission CEO’s Report – February 2018 Update 43
Line 2: Delay Minutes
0
500
1,000
1,500
2,000
2,500
Jan Feb Mar Apr May Jun Jul Aug Sep Oct Nov Dec
Num
ber o
f Del
ay M
inut
es
2017 Target 2017 Actual 2016 Trend2015 Trend 2014 Trend
Results The number of delay minutes increased in December to 1880 (33.4%); this is the second highest number of delay minutes incurred since 2014. Analysis The major contributor to this increase was the number of suicides that occurred on Line 2. There were 5 incidents in December resulting in 535 minutes, almost 30% of all minutes. Had these tragic events not occurred, delay minutes would have been less than what was experienced in November 2017 or the previous December 2016. There were 177 minutes of rolling stock delays, accounting for 9% of the overall; however this was down slightly in comparison with November which is commendable when considering the extreme cold weather conditions that the Rail Cars and Shops team had to contend with. Action Plan The TTC supports mental health awareness and will be bringing this topic of discussion to its employees in 2018. With broader understanding and education, the organization can hope to make any efforts possible to prevent these incidents from occurring. Note: The 2017 target is based on a 30% or more reduction in delay minutes from the 2014 monthly average baseline.

Toronto Transit Commission CEO’s Report – February 2018 Update 44
Line 2: Capacity Delivered in Peak
80
84
88
92
96
100
Jan Feb Mar Apr May Jun Jul Aug Sep Oct Nov Dec
Cap
acity
Del
iver
ed (%
)
2017 Target 2017 Actual 2016 Trend 2015 Trend
Results The last 4 months remain stable with a slight improvement in December. Note: Capacity delivered is the actual train count divided by the scheduled train count for each hour at sampled locations. Data are based on weekday service from Monday to Friday.

Toronto Transit Commission CEO’s Report – February 2018 Update 45
Line 3: Delay Incidents
0
30
60
90
120
150
Jan Feb Mar Apr May Jun Jul Aug Sep Oct Nov Dec
Num
ber o
f Del
ay In
cide
nts
2017 Target 2017 Actual 2016 Trend2015 Trend 2014 Trend
Results The number of incidents increased from 50 in November, 2017 to 85 in December. Delay incidents on Line 3 had been in significant decline for a number of months and had showing numbers better than the target prior to this. Analysis The Line 3 increase in incidents is mostly related to the cold weather and precipitation that was experienced during this time. The SRT equipment is aging and has vulnerabilities to these elements. Action Plans To reduce some of the exposure to the elements, a change to the overnight storage plan was trialed which kept each train moving throughout the night, keeping its components in a more moderate temperature range. In addition, the train profile was changed in a similar manner to how extreme summer temperatures are handled. Note: The 2017 target is based on a 30% or more reduction in delay incidents from the 2014 monthly average baseline.

Toronto Transit Commission CEO’s Report – February 2018 Update 46
Line 3: Delay Minutes
0
300
600
900
1,200
1,500
Jan Feb Mar Apr May Jun Jul Aug Sep Oct Nov Dec
Num
ber o
f Del
ay M
inut
es
2017 Target 2017 Actual 2016 Trend2015 Trend 2014 Trend
Results The number of delay minutes increased in December to 495 as compared to 117 in November. Despite the challenging month, results were still improved compared to December 2016, which experienced 699 delay minutes. Analysis Weather was the main factor that caused this increase in delay. Action Plan Changes to the train profile as well as modifications to the train storage overnight are continuing to be trialed. Thus far these changes have produced successful results and it is anticipated that delays will decrease, particularly as they relate to rolling stock. Note: The 2017 target is based on a 30% or more reduction in delay minutes from the 2014 monthly average baseline.

Toronto Transit Commission CEO’s Report – February 2018 Update 47
Line 3: Capacity Delivered in Peak
80
84
88
92
96
100
Jan Feb Mar Apr May Jun Jul Aug Sep Oct Nov Dec
Cap
acity
Del
iver
ed (%
)
2017 Target 2017 Actual 2016 Trend 2015 Trend
Results Line 3 experienced challenges in December 2017 due to the cold temperatures and precipitation. Despite this, target was only narrowly missed, achieving 97.7 percent of 98 percent goal. Note: Capacity delivered is the actual train count divided by the scheduled train count for each hour at sampled locations. Data are based on weekday service from Monday to Friday.
Toronto Transit Commission CEO’s Report – February 2018 Update 48
Line 4: Delay Incidents 0
30
60
90
120
150
Jan Feb Mar Apr May Jun Jul Aug Sep Oct Nov Dec
Num
ber o
f Del
ay In
cide
nts
2017 Target 2017 Actual 2016 Trend2015 Trend 2014 Trend
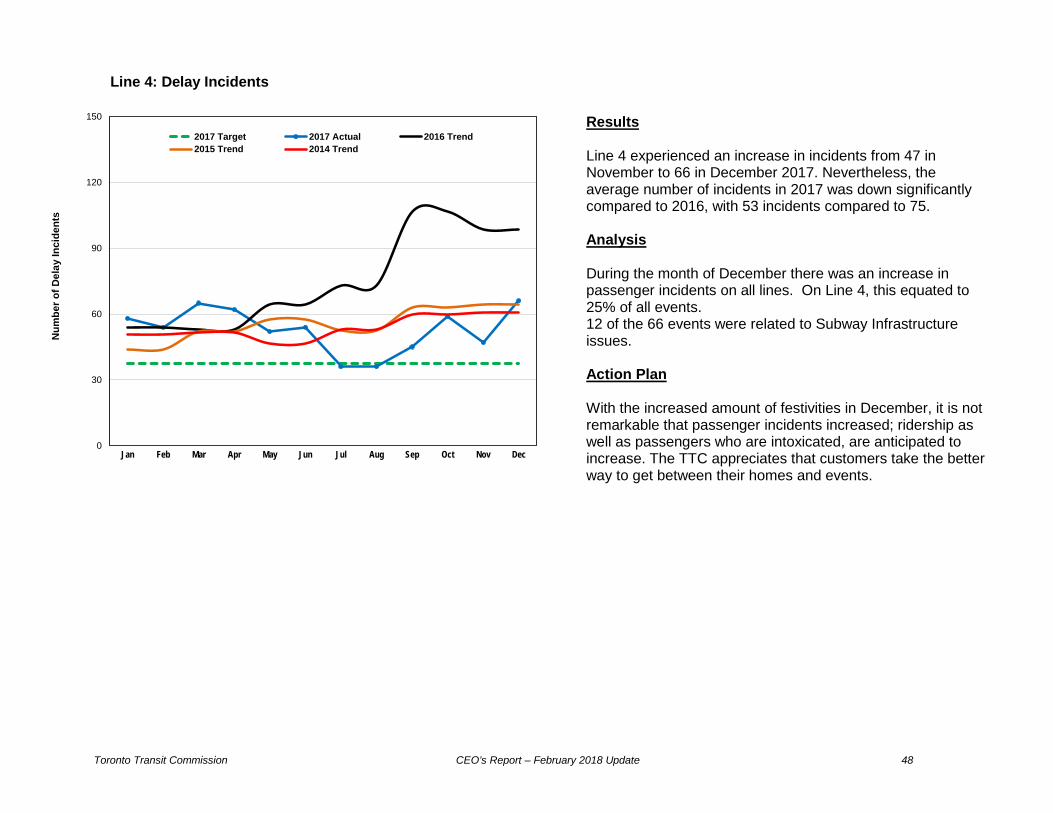
Results Line 4 experienced an increase in incidents from 47 in November to 66 in December 2017. Nevertheless, the average number of incidents in 2017 was down significantly compared to 2016, with 53 incidents compared to 75. Analysis During the month of December there was an increase in passenger incidents on all lines. On Line 4, this equated to 25% of all events. 12 of the 66 events were related to Subway Infrastructure issues. Action Plan With the increased amount of festivities in December, it is not remarkable that passenger incidents increased; ridership as well as passengers who are intoxicated, are anticipated to increase. The TTC appreciates that customers take the better way to get between their homes and events.
Toronto Transit Commission CEO’s Report – February 2018 Update 49
Line 4: Delay Minutes
0
100
200
300
400
500
Jan Feb Mar Apr May Jun Jul Aug Sep Oct Nov Dec
Num
ber o
f Del
ay M
inut
es
2017 Target 2017 Actual 2016 Trend2015 Trend 2014 Trend
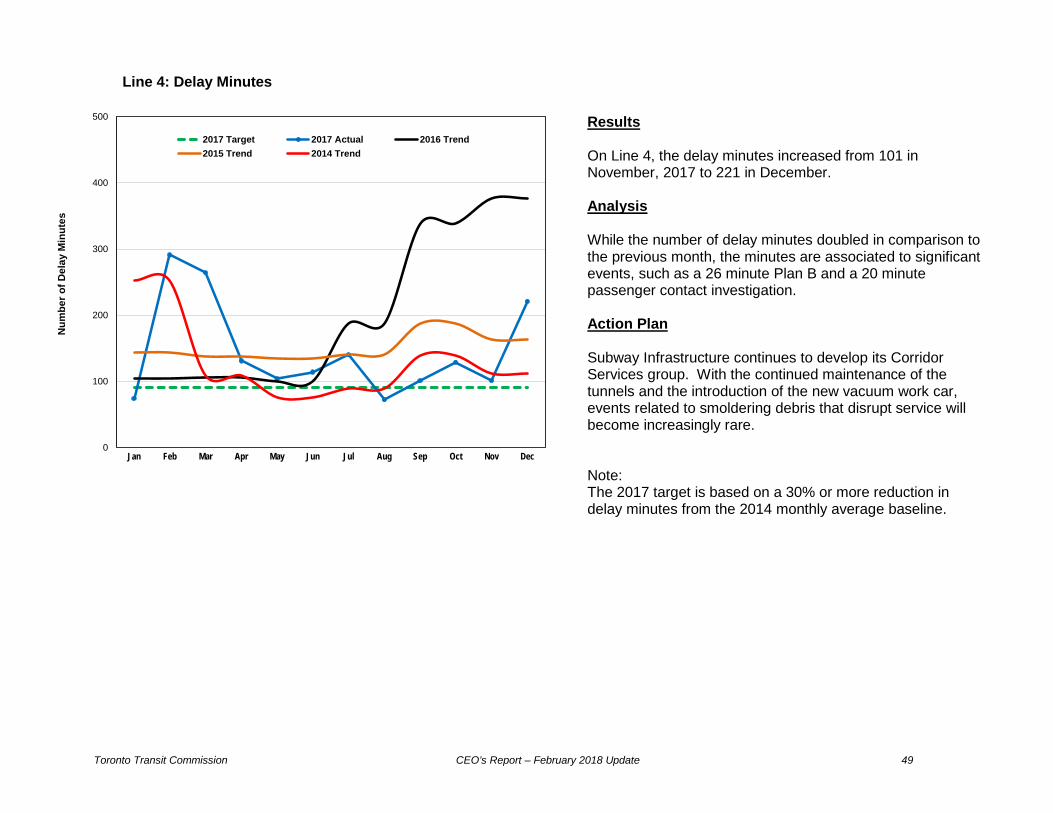
Results On Line 4, the delay minutes increased from 101 in November, 2017 to 221 in December. Analysis While the number of delay minutes doubled in comparison to the previous month, the minutes are associated to significant events, such as a 26 minute Plan B and a 20 minute passenger contact investigation. Action Plan Subway Infrastructure continues to develop its Corridor Services group. With the continued maintenance of the tunnels and the introduction of the new vacuum work car, events related to smoldering debris that disrupt service will become increasingly rare. Note: The 2017 target is based on a 30% or more reduction in delay minutes from the 2014 monthly average baseline.

Toronto Transit Commission CEO’s Report – February 2018 Update 50
Line 4: Capacity Delivered in Peak
95
96
97
98
99
100
Jan Feb Mar Apr May Jun Jul Aug Sep Oct Nov Dec
Cap
acity
Del
iver
ed (%
)
2017 Target 2017 Actual 2016 Trend 2015 Trend
Results On Line 4 the daily average number of trains per hour during peak service periods was 99.7% of what was scheduled. Overall performance achieved target for the eighth time this year. The implementation of the One Person Train Operation (OPTO) has proven to be valuable. Note: Capacity delivered is actual train count divided by the scheduled train count for each hour at sampled locations. Data are based on weekday service from Monday to Friday.

Toronto Transit Commission CEO’s Report – February 2018 Update 51
Streetcar On-Time Performance
25
40
55
70
85
100
Jan Feb Mar Apr May Jun Jul Aug Sep Oct Nov Dec
On-
Tim
e D
epar
ture
s (%
)
2017 Target 2017 Actual2016 Trend 2015 Trend
Results The multi-year view clearly shows improved progress in on time performance since 2015 despite being below overall target. Performance in December increased to 52.9%. Performance remained below target, however. Analysis 2017 On-Time Departures (OTD) continue to reflect the scheduling/measuring challenges noted in previous reports. 2017 has remained below 2016 OTD achievements due to the aging legacy fleet, which is now more susceptible to colder climates and the reduction in the spare ratio. Action Plan Over the same period, LFLRV routes have maintained performance and proven more resilient to the colder climate. In addition, the planned 2018 route improvements are underway to ensure an upward trend in the OTD measure. Note: This KPI measures adherence to scheduled (-1 to +5 minutes) departure times from end terminals.

Toronto Transit Commission CEO’s Report – February 2018 Update 52
Streetcar - Short Turns
0
3,000
6,000
9,000
12,000
15,000
Jan Feb Mar Apr May Jun Jul Aug Sep Oct Nov Dec
Num
ber o
f Sho
rt T
urns
2017 Target 2017 Actual 2016 Trend2015 Trend 2014 Trend
Results This multi-year view clearly illustrates the year-over-year reductions in short turns which have achieved an all-time low below the target in 2017. The number of short turns increased in December to 1,510; performance continued to remain below target (favourable), however. Analysis With the return to regular routing along all streetcar service lines, short turns have significantly decreased. The route management strategies have continued to meet and exceed the target – being less than last year. Action Plan This trend will continue to improve with the ongoing King Street Pilot and further delivery of new streetcars from Bombardier in 2018. Note: Data are based on all seven days of service from Sunday to Saturday.
Toronto Transit Commission CEO’s Report – February 2018 Update 53
Bus On-Time Performance 55
65
75
85
95
Jan Feb Mar Apr May Jun Jul Aug Sep Oct Nov Dec
On-
Tim
e D
epar
ture
s (%
)
2017 Target 2017 Actual2016 Trend 2015 Trend
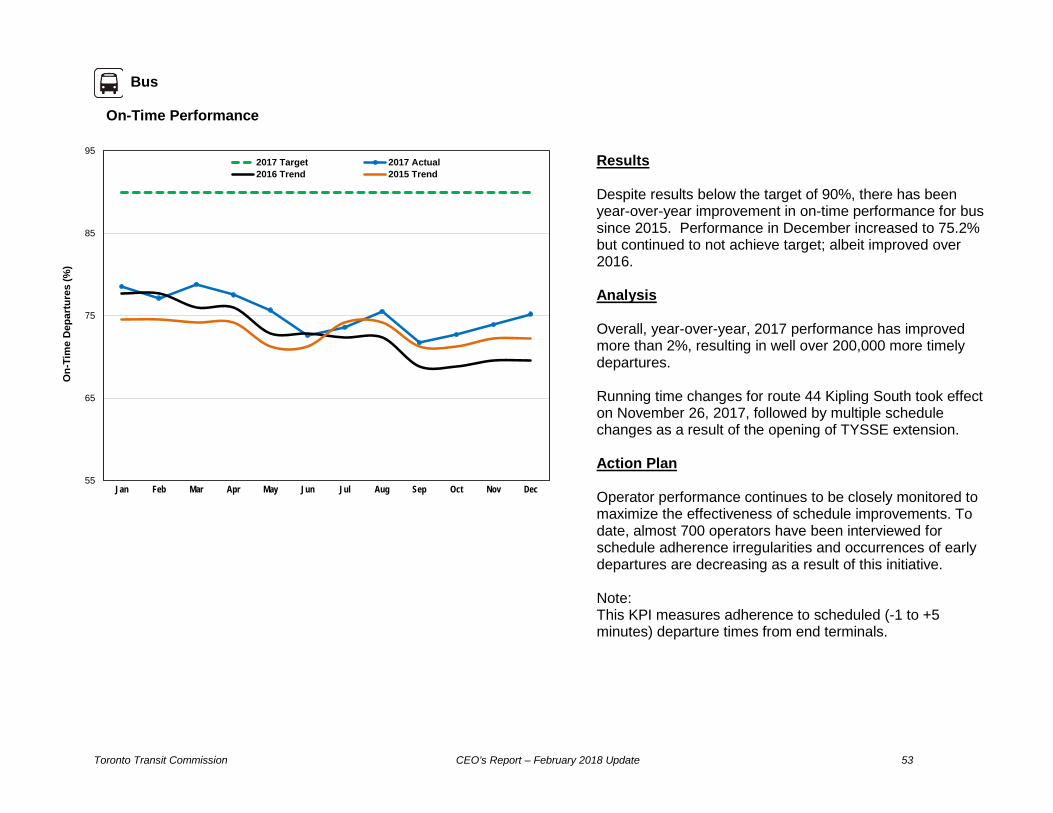
Results Despite results below the target of 90%, there has been year-over-year improvement in on-time performance for bus since 2015. Performance in December increased to 75.2% but continued to not achieve target; albeit improved over 2016. Analysis Overall, year-over-year, 2017 performance has improved more than 2%, resulting in well over 200,000 more timely departures. Running time changes for route 44 Kipling South took effect on November 26, 2017, followed by multiple schedule changes as a result of the opening of TYSSE extension. Action Plan Operator performance continues to be closely monitored to maximize the effectiveness of schedule improvements. To date, almost 700 operators have been interviewed for schedule adherence irregularities and occurrences of early departures are decreasing as a result of this initiative. Note: This KPI measures adherence to scheduled (-1 to +5 minutes) departure times from end terminals.

Toronto Transit Commission CEO’s Report – February 2018 Update 54
Bus - Short Turns 0
2,500
5,000
7,500
10,000
12,500
Jan Feb Mar Apr May Jun Jul Aug Sep Oct Nov Dec
Num
ber o
f Sho
rt T
urns
2017 Target 2017 Actual 2016 Trend2015 Trend 2014 Trend
Results This multi-year view illustrates continuous reductions in the number of short turns from 2014 to today, resulting in greatly improved customer experience. The number of short turns in December increased to 2,973; performance continued to remain below target (favourable), however.
Analysis
Short turns in 2017 have continued to trend lower than in 2016 as a result of schedule improvements and increased utilization of Run-as-Directed (RAD) bus deployments, which has reduced the need for service adjustments.
Note: Data are based on all seven days of service from Sunday to Saturday.
Toronto Transit Commission CEO’s Report – February 2018 Update 55
Wheel-Trans Punctuality
80
83
86
89
92
95
Jan Feb Mar Apr May Jun Jul Aug Sep Oct Nov Dec
With
in 1
0 M
inut
es o
f Sch
edul
e (%
)
2017 Target 2017 Actual 2016 Trend2015 Trend 2014 Trend
Results
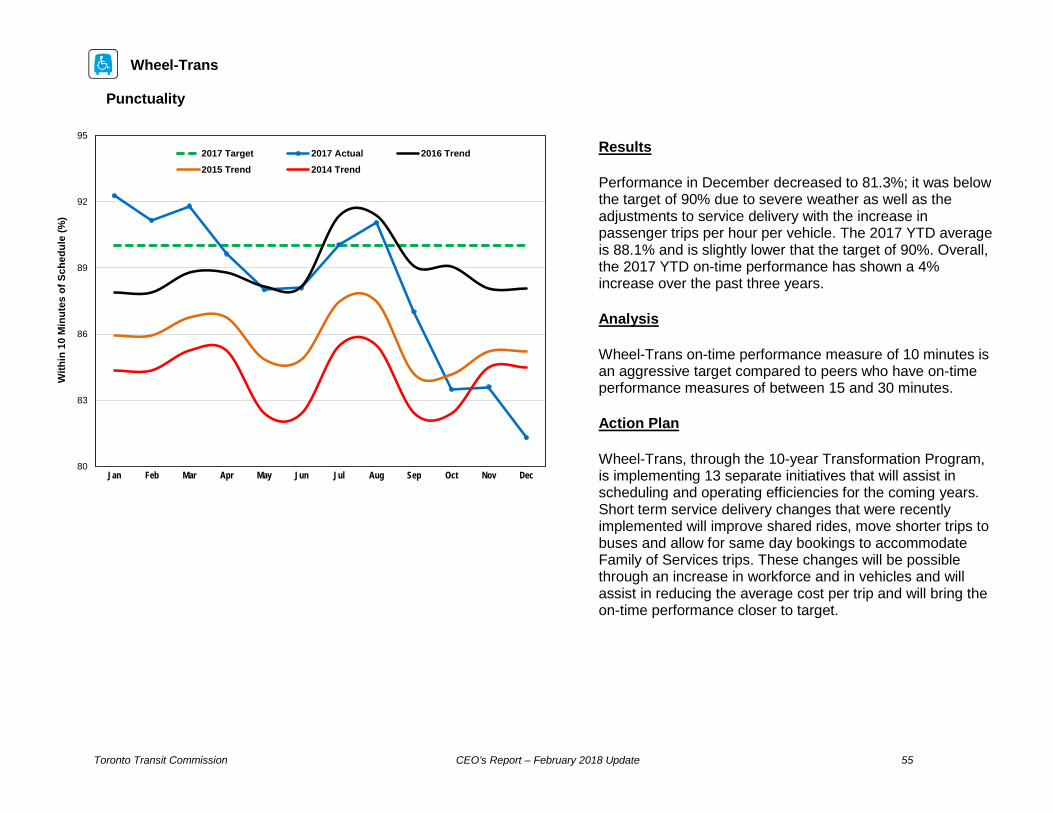
Performance in December decreased to 81.3%; it was below the target of 90% due to severe weather as well as the adjustments to service delivery with the increase in passenger trips per hour per vehicle. The 2017 YTD average is 88.1% and is slightly lower that the target of 90%. Overall, the 2017 YTD on-time performance has shown a 4% increase over the past three years.
Analysis
Wheel-Trans on-time performance measure of 10 minutes is an aggressive target compared to peers who have on-time performance measures of between 15 and 30 minutes.
Action Plan
Wheel-Trans, through the 10-year Transformation Program, is implementing 13 separate initiatives that will assist in scheduling and operating efficiencies for the coming years. Short term service delivery changes that were recently implemented will improve shared rides, move shorter trips to buses and allow for same day bookings to accommodate Family of Services trips. These changes will be possible through an increase in workforce and in vehicles and will assist in reducing the average cost per trip and will bring the on-time performance closer to target.

Toronto Transit Commission CEO’s Report – February 2018 Update 56
Customer: Amount of Service Streetcar - Weekly Service Hours
15,000
17,000
19,000
21,000
23,000
25,000
Num
ber o
f Veh
icle
Hou
rs O
pera
ted
Board Period
Actual Scheduled Budget
Results In the December 2017 Board Period, 21,257 streetcar weekly hours were budgeted for service while 18,823 streetcar weekly hours were scheduled to operate which represents a -11.45% variance. Analysis The variance between budgeted and scheduled service can be attributed to the reduction of the streetcar fleet. To illustrate the decrease in streetcar availability, the table bellows shows the budgeted vs the scheduled AM peak streetcars over the last year and a half.
Date
Budgeted Streetcars
for AM Peak Service
Scheduled
Streetcars for AM Peak Service
June 2016 170 167 October 2016 202 179 January 2017 189 169 April 2017 190 170 July 2017 200 156 November 2017 200 166
Of the 18,823 streetcar weekly hours scheduled to operate, 17,033 streetcar weekly hours were actually delivered which represents a variance of -9.5%. The extreme cold weather in December was the main reason for this. Streetcars were not available for service and therefore substituted with buses.

Toronto Transit Commission CEO’s Report – February 2018 Update 57
Bus - Weekly Service Hours
130,000
135,000
140,000
145,000
150,000
155,000
Num
ber o
f Veh
icle
Hou
rs O
pera
ted
Board Period
Actual Scheduled Budget
Results In the December 2017 Board Period, 141,001 bus weekly hours were budgeted for service while 140,187 bus weekly hours were scheduled to operate which represents a -0.58% variance. Of the 140,187 bus weekly hours scheduled to operate, 139,422 weekly hours were actually delivered which represents a variance of -0.55%.
Toronto Transit Commission CEO’s Report – February 2018 Update 58
Subway - Weekly Service Hours
7,000
8,000
9,000
10,000
11,000
12,000
Num
ber o
f Veh
icle
Hou
rs O
pera
ted
Board Period
Actual Scheduled Budget
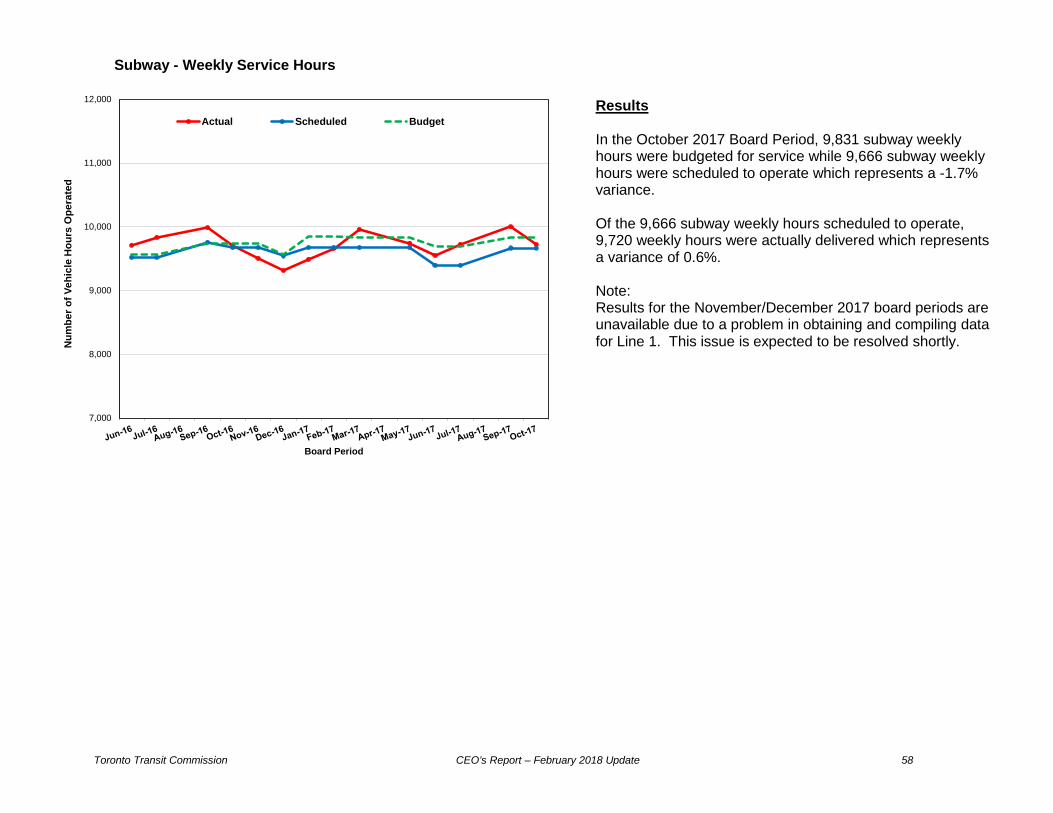
Results In the October 2017 Board Period, 9,831 subway weekly hours were budgeted for service while 9,666 subway weekly hours were scheduled to operate which represents a -1.7% variance. Of the 9,666 subway weekly hours scheduled to operate, 9,720 weekly hours were actually delivered which represents a variance of 0.6%. Note: Results for the November/December 2017 board periods are unavailable due to a problem in obtaining and compiling data for Line 1. This issue is expected to be resolved shortly.

Toronto Transit Commission CEO’s Report – February 2018 Update 59
Operator Crewing Efficiency
86.7
86.9
87.1
87.3
87.5
87.7
Jan Feb Mar Apr May Jun Jul Aug Sep Oct Nov Dec
Cre
win
g Ef
ficie
ncy
(%)
2017 Target 2017 Actual 2016 Trend2015 Trend 2014 Trend
Results Operator crewing efficiency remained unchanged in December at 87.05%; performance remained below target. Analysis Crewing efficiency has been below target due to the large numbers of buses replacing streetcars, resulting in longer driving distances to streetcar routes from bus divisions. Note: Crewing efficiency is defined as the ratio of scheduled hours to pay hours.

Toronto Transit Commission CEO’s Report – February 2018 Update 60
3.3 People

Toronto Transit Commission CEO’s Report – February 2018 Update 61
People Employee Absence
5
6
7
8
9
10
12014
2 3 4 5 6 7 8 9 10 11 12 12015
2 3 4 5 6 7 8 9 10 11 12 12016
2 3 4 5 6 7 8 9 10 11 12 12017
2 3 4 5 6 7 8 9 10 11 12
Abse
ntee
ism
Rat
e (%
)
Actual 12-Month Average
Results The absenteeism rate in December 2017 increased to 8.45%; the overall absence rate has been above the 12-month average for five of the past six months. Action Plan Staff continues to manage absence with a focus on reducing the number of complex absence cases and the duration of these absences. In 2018, renewed focus will be placed on determining the root cause of absence and the increasing absence rate for the TTC. Opportunities to enhance opportunity to continue efforts in management of absences will be sought through ongoing collective bargaining, and staff is monitoring the anticipated impacts of Bill 148 on the organization’s attendance levels. At the Group Level, in the Service Delivery Group, an attendance management project team was established in 2017 to focus on employees with concerning absence levels. .

Toronto Transit Commission CEO’s Report – February 2018 Update 62
Fitness for Duty Update Random Testing Program Summary (May 8, 2017 to February 2, 2018) Total employees who were non-compliant or refused testing: 35
Random Testing Summary – Unionized Employees Test Category 2018 2017 Total* %
Compliant 167 1,381 1,548 98.0% Non-Compliant (drug, alcohol, refusal) 3 29 32 2.0% Totals 170 1,410 1,580 100%
*Currently 10 drug test results have yet to be reported as they are still undergoing laboratory analysis or have been cancelled.
Random Testing Summary – Staff (non-unionized) Employees Test Category 2018 2017 Total* %
Compliant 23 270 293 99.0% Non-Compliant (drug, alcohol, refusal) 0 3 3 1.0% Totals 23 273 296 100%
*Currently 2 drug test results have yet to be reported as they are still undergoing laboratory analysis or have been cancelled.
Breakdown of Non-Compliant Tests
Test Category 2018 2017 Total % Drug 3 24 27 77.1% Alcohol 0 5 5 14.3% Refusal 0 3 3 8.6% Totals 3 32 35 100%
Breakdown of Non-Compliant Drug and Alcohol Tests* Substance Type 2018 2017 Total %
Oxycodone 0 1 1 3.1% Opiates 0 2 2 6.3% Marijuana 1 15 16 50.0% Cocaine 1 6 7 21.9%
Amphetamines 0 1 1 3.1% Alcohol 0 5 5 15.6% Totals* 2 30 32 100%
*One drug test result was positive for two different drugs Table reflects data up to January 12, 2018. Data updated quarterly; next update will be as of April 20, 2018
Breakdown of Other Policy Violations
Policy Category Total Alcohol Non-Compliant for 0.02 – 0.039 2 Three Safety Sensitive Flags 3 Totals 5

Toronto Transit Commission CEO’s Report – February 2018 Update 63
3.4 Assets
The TTC is surprising and delighting customers and Torontonians with a sneak peek of Kusama's iconic dots in few-of-a-kind installations designed by the artist especially for the TTC.

Toronto Transit Commission CEO’s Report – February 2018 Update 64
Assets: Vehicle Reliability
Subway
T1 Train: Mean Distance Between Failures (MDBF)
0
100,000
200,000
300,000
400,000
500,000
600,000
700,000
Jan Feb Mar Apr May Jun Jul Aug Sep Oct Nov Dec
Mea
n D
ista
nce
Bet
wee
n Fa
ilure
s (K
m)
2017 Target 2017 Actual 2016 Trend2015 Trend 2014 Trend
Results The MDBF in December achieved target for the first time in four months. Analysis In December, there were 10 delay incidents. The top 2 offending systems were the Passenger Door and Brake systems each with 3 delay incidents greater than or equal to 5 minutes. This was followed by the new Automatic Train Control system with 2 delay incidents, then the Propulsion and Cab Door Systems each with 1 delay incident greater than or equal to 5 minutes. Action Plan Passenger door unlock mechanism link pins are being jointly investigated between TTC technical staff and Bombardier. Automatic Train Control system was introduced in December, and all incidents are thoroughly investigated with the OEM and system wide testing continues with positive results. Revision ‘E’ cab doors modification has been completed across the fleet with significant improvement on reliability on cab doors. Any failure incidents of this nature will be monitored and investigated for potential improvements. In addition, the passenger door system has received numerous modifications to the control units; fleet retrofits of the new modifications are in progress. Issues related to the propulsion system are under investigation by Bombardier engineering. The brake system continues to receive numerous modifications/improvements to the electronic controls; fleet retrofits of the new modifications and validation testing of the proposed upgrades are in progress, with anticipated improvements in future periods.
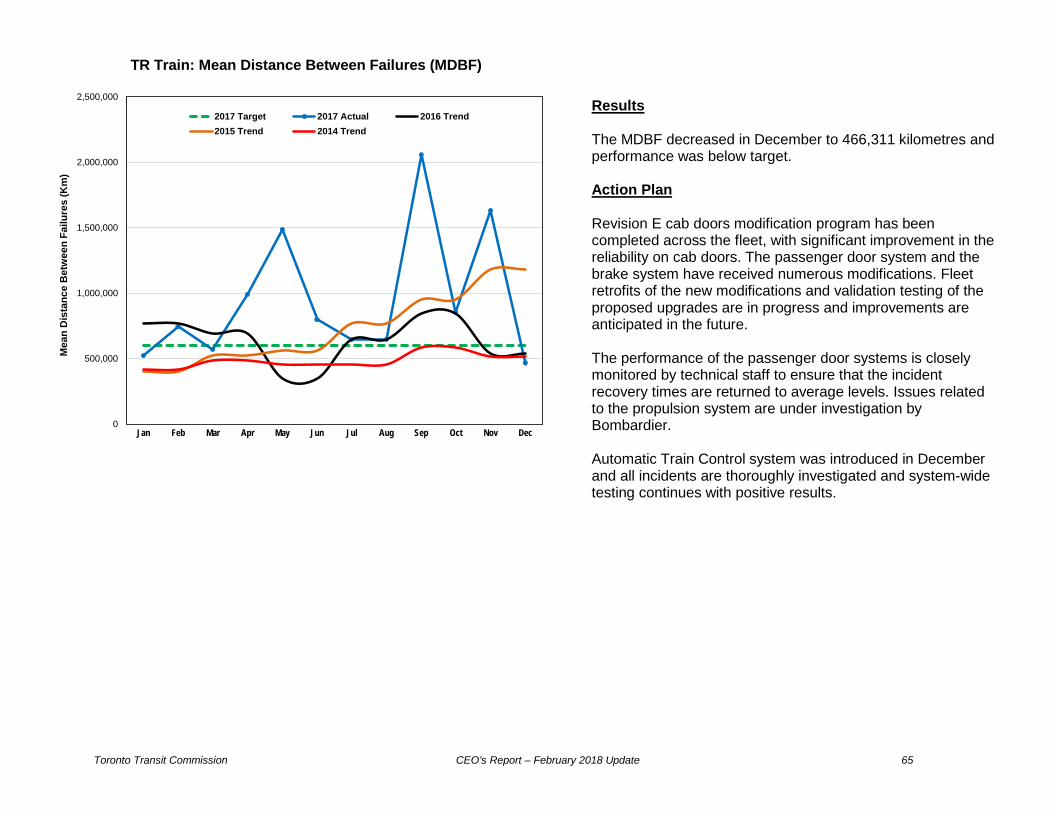
Toronto Transit Commission CEO’s Report – February 2018 Update 65
TR Train: Mean Distance Between Failures (MDBF)
0
500,000
1,000,000
1,500,000
2,000,000
2,500,000
Jan Feb Mar Apr May Jun Jul Aug Sep Oct Nov Dec
Mea
n D
ista
nce
Bet
wee
n Fa
ilure
s (K
m)
2017 Target 2017 Actual 2016 Trend2015 Trend 2014 Trend
Results The MDBF decreased in December to 466,311 kilometres and performance was below target. Action Plan Revision E cab doors modification program has been completed across the fleet, with significant improvement in the reliability on cab doors. The passenger door system and the brake system have received numerous modifications. Fleet retrofits of the new modifications and validation testing of the proposed upgrades are in progress and improvements are anticipated in the future. The performance of the passenger door systems is closely monitored by technical staff to ensure that the incident recovery times are returned to average levels. Issues related to the propulsion system are under investigation by Bombardier. Automatic Train Control system was introduced in December and all incidents are thoroughly investigated and system-wide testing continues with positive results.

Toronto Transit Commission CEO’s Report – February 2018 Update 66
Streetcar CLRV Streetcar: Mean Distance Between Failures (MDBF)
0
2,000
4,000
6,000
8,000
10,000
Jan Feb Mar Apr May Jun Jul Aug Sep Oct Nov Dec
Mea
n D
ista
nce
Bet
wee
n Fa
ilure
s (K
m)
2017 Target 2017 Actual 2016 Trend
2015 Trend 2014 Trend
Results The MDBF increased in December to 2,177 kilometres, falling marginally below the target of 6,000 kilometres and last year’s Period 12 results. Analysis Trending of CLRV fleet reliability since 2014 shows a steady decline in MDBF. This is a result of expectations with the replacement of new vehicles. The first CLRV was received in 1977 and the entire 196-vehicle order was received over several years. By the end of 2017, the total number of CLRVs remaining in the fleet was 141. Four of the remaining vehicles are over 41 years of age. The CLRV fleet was designed for a life span of 30 years. Life extension projects throughout the life of the vehicle allowed them to be kept beyond this life expectancy. Now, with more than 40 years of life, parts obsolescence and deterioration of body and structure, the ability to continue to refurbish these vehicles has greatly diminished. Action Plan With the delay of the LFLRV order, staff implemented State of Good Repair (SOGR) programs for this fleet in 2017. This has resulted in stabilizing and some minor improvements in the reliability of this fleet which can be seen in the 2016 vs 2017 MDBF. Staff will continue with SOGR programs in 2018 with the aim to make minor improvements to reliability.

Toronto Transit Commission CEO’s Report – February 2018 Update 67
ALRV Streetcar: Mean Distance Between Failures (MDBF) 0
1,500
3,000
4,500
6,000
7,500
Jan Feb Mar Apr May Jun Jul Aug Sep Oct Nov Dec
Mea
n D
ista
nce
Bet
wee
n Fa
ilure
s (K
m)
2017 Target 2017 Actual 2016 Trend2015 Trend 2014 Trend
Results The MDBF decreased in December to 1,177 kilometres. Overall performance remained below target. Analysis Period 12 MDBF showed a further decline in reliability of the ALRV fleet in comparison to periods 10 and 11. Overall trending in comparison to 2016 however has been positive. This has been the result of decommissioning some of the more problematic vehicles and reducing the frequency of these vehicles in service. The first ALRV was received in 1984 and the age of the fleet is approximately 34 years. By the end of 2017, 43 of the original 52 ALRV fleet remained in service. Like the CLRV, the ALRVs were designed to remain in service for 25-30 years. Action Plan Minor rebuilds have allowed the ALRVs to continue past their original life cycle.

Toronto Transit Commission CEO’s Report – February 2018 Update 68
New Streetcar: Mean Distance Between Failures (MDBF)
0
10,000
20,000
30,000
40,000
Jan Feb Mar Apr May Jun Jul Aug Sep Oct Nov Dec
Mea
n D
ista
nce
Bet
wee
n Fa
ilure
s (K
m)
2017 Target 2017 Actual 2016 Trend
Results The MDBF increased in December to 19,865 kilometres. Action Plan Slight improvements have been achieved due to ongoing efforts by Bombardier and suppliers to correct component reliability such as the door system. TTC staff is continuing to work with Bombardier and suppliers to improve various vehicle systems and resolve manufacturing and design issues. As vehicle delivery continues and technical and production issues are resolved, it is expected that this fleet will continue to improve in reliability.

Toronto Transit Commission CEO’s Report – February 2018 Update 69
Bus: Mean Distance Between Failures (MDBF)
0
5,000
10,000
15,000
20,000
25,000
Jan Feb Mar Apr May Jun Jul Aug Sep Oct Nov Dec
Mea
n D
ista
nce
Bet
wee
n Fa
ilure
s (K
m)
2017 Target 2017 Actual 2016 Trend2015 Trend 2014 Trend
Results The MDBF decreased in December to 17,757 kilometres. However, performance continued to achieve target and the average performance in 2017 was 61% higher than that in 2016. Action Plan This multi-year view shows positive, progressive growth and improvements in mean distance between failures which can be attributed to programs implemented within bus maintenance since 2014, reaching above target for the full 12 months of 2017. Garage technical staff continues to focus their efforts on quality of repairs and mentoring of coach technicians. Data analysis of repeaters has played a major role in reducing these numbers. Cooling System Maintenance programs on the 8100-8396 and 9000-9152 series buses are 85.3% and 65% complete, respectively. Heating System Maintenance programs for the 1200-1829 series buses are 100% complete. Operator seat overhaul on Nova LFS60 & Orion VII 7900-7979, 8000-8099 - new seat replacement is 100% complete on both. Bus maintenance staff continued efforts to complete the State of Good Repair (SOGR) program on buses, as well as perform post-repair circle checks to improve bus pull-out to minimize disruptions to service.
The following table summarizes total new TTC bus deliveries from 2017 to 2020: Year Type of Bus Total Garage 2015 Nova 79 Queensway 34
Arrow Road 45 2016 Nova 134 Queensway 2
Arrow Road 132 2017 Nova 342 Eglinton 309
Birchmount 33 2018 Nova 325 Birchmount 95
Arrow Road 230 (CAD AVL) 2019 TBD 260 TBD 2020 TBD 120 TBD

Toronto Transit Commission CEO’s Report – February 2018 Update 70
Wheel-Trans: Mean Distance Between Failures (MDBF)
2,000
5,000
8,000
11,000
14,000
17,000
Jan Feb Mar Apr May Jun Jul Aug Sep Oct Nov Dec
Mea
n D
ista
nce
Bet
wee
n Fa
ilure
s (K
m)
2017 Target 2017 Actual 2016 Trend2015 Trend 2014 Trend
The following table summarizes the total existing Wheel-Trans bus fleet in 2017 and new bus deliveries in 2018 and 2019:
Year Type of Bus Total 2017 Friendly
Promaster 199 13
2018 Friendly Promaster
161 80
2019 Friendly Promaster
161 80
Results The MDBF increased in December to 15,375 kilometres. Overall performance continued to achieve target. Action Plans Positive progressive growth can be seen from 2014 to 2017 resulting in a higher level of customer service for Wheel-Trans customers and greater efficiencies of the fleet since 2014. Staff initiated multiple projects to improve reliability, such as replacing and modifying emergency release handles, replacing batteries to dual purpose AGM, rebuilding and replacing drivers’ seats and modifying positive battery cable.
New RAM ProMaster procurement in 2017 (13 buses) and 2018 (67 buses) are some of the initiatives aimed to support an increase in the MDBF in 2018. Efforts to improve reliability also continue through the following projects:
• Replacing/modifying emergency release handles from pull type to D-ring style, first-generation Friendly’s W100-W214;
• Replacing batteries from marine deep cycle AGM to dual purpose AGM on the entire fleet;
• Replacing DPF’s on the entire Friendly Fleet; • Rebuilding/replacing driver’s seats, second-generation
Friendly’s W215-W300 (Ford seat); • Modifying positive battery cable, second-generation
Friendly’s W215-W300 (to prevent electrical shorts); • Continuing with the State of Good Repair (SOGR) program
and conducting detailed analysis of repeater buses to reduce RCCO's .

Toronto Transit Commission CEO’s Report – February 2018 Update 71
Assets: Equipment Availability Elevators
95
96
97
98
99
100
Jan Feb Mar Apr May Jun Jul Aug Sep Oct Nov Dec
Avai
labi
lity
(%)
2017 Target 2017 Actual 2016 Trend2015 Trend 2014 Trend
Results December availability was below target for only the second time in 2017 Analysis Performance in December was attributable to the elevator overhaul at Kennedy Station and an outage in Kipling Station due to a water-main break affecting elevator service.

Toronto Transit Commission CEO’s Report – February 2018 Update 72
Escalators 95
96
97
98
99
100
Jan Feb Mar Apr May Jun Jul Aug Sep Oct Nov Dec
Avai
labi
lity
(%)
2017 Target 2017 Actual 2016 Trend2015 Trend 2014 Trend
Results The availability was on target for December. Action Plans Maintenance activities were completed as planned and scheduled.

Toronto Transit Commission CEO’s Report – February 2018 Update 73
Page intentionally left blank
Toronto Transit Commission CEO’s Report – February 2018 Update 74
3.5 Financials

Toronto Transit Commission CEO’s Report – February 2018 Update 75
Financials This section provides detailed information about the TTC and Wheel-Trans Operating Budgets. In addition, progress on the Commission’s Capital Program and specific information about selected capital projects is also provided. 2017 Year-End Results The preparation of year-end results for the TTC Operating, Wheel-Trans Operating, and TTC Capital Budgets is in progress. Final results will be included in the Chief Executive Officer’s Report for March 2018. 2017 Year-to-Date Results Consistent with previous years, the year-to-date results to the end of Period 11 were previously reported in the January 2018 Chief Executive Officer’s Report. Further details are available at the following link: http://www.ttc.ca/About_the_TTC/Commission_reports_and_information/Commission_meetings/2018/January_18/Reports/1_Chief_Executive_Officers_Report-January__2018_Update_%283%29.pdf

Toronto Transit Commission CEO’s Report – February 2018 Update 76
Page intentionally left blank

Toronto Transit Commission CEO’s Report – February 2018 Update 77

Toronto Transit Commission CEO’s Report – February 2018 Update 78
For further information on TTC performance, projects, and service, please see www.ttc.ca Richard J. Leary Chief Executive Officer (Acting) Toronto Transit Commission