chicago department of public health -- ryan white part a ... chicago... · chicago department of...
TRANSCRIPT

Chicago Department of Public Health -- Ryan White Part A Quality Management Program Early Intervention Services (EIS)
Page 1 of 17
Chicago Eligible Metropolitan Area (EMA) Number of client charts reviewed: 222
The dashboards below are visual displays of quality indicators set by Ryan White standards and performance measures. The purpose of the dashboard is to provide consolidated data so the information can be monitored at a glance. While not on a single page, the information below highlights the indicators in the following manner:
Red: <60 Orange:
60-69 Yellow: 70-79
Lite Green: 80-89
Green: 90-100
Gray: Not judged a performance measure
Unacceptable Poor Fair Good Excellent
There are twenty EIS agencies funded by the Chicago Department of Public Health’s (CDPH) Ryan White Part-A program.
Fifteen of the agencies were newly funded for EIS for 2015. The data presented in the tables below were abstracted
during the quality management reviews of the EIS agencies. Four (4) of the 20 EIS agencies were previously funded prior
to March 1, 2015 and are indicated with an asterisk. The measurement review periods were March 1, 2014 – February
28, 2015 for agencies funded before March 1, 2015 (previously funded) and March 1, 2015 – August 31, 2015 for
agencies funded beginning March 1, 2015 (newly funded).
While patient eligibility varied according to some of the performance indicators, the four main components for early
intervention services (EIS) includes: (1) HIV Testing and Counseling, (2) Health Education & Literacy Training, (3) Linkage
to Care and (4) referrals. The clinical quality management site reviews were conducted from September through
October 2015.
The Chicago EMA aggregate rate for the required four major components for EIS was 65%. However, it is important to
note that the fifteen newly EIS funded agencies were only funded for less than a year at the time of the site review.
Therefore, the site review served as a technical assistance visit, rather than the normal site review visit. Performance
rates varied between prior and newly funded agencies and within individual agencies. For example, as noted in table A,
depending on the performance measure the rate varied from 0 – 100% regardless of the length of time the agency had
been funded.
Demographics
As shown in the figures below, of the 222 charts reviewed, most were Black males of non-Hispanic ethnicity.
(The mean age was 36 years old)

Chicago Department of Public Health -- Ryan White Part A Quality Management Program Early Intervention Services
N/A = Not Applicable Page 2 of 17
Major Areas Reviewed:
EIS Services EMA Mean
HIV Testing & Counseling 83%
Health Education & Literacy Training 51%
Linkage/Retention to Care 69%
Referral Services 57%
Total 65%
Total Aggregate Score for the required EIS components (majored areas reviewed) = 65%
A: Documentation of signed consent forms by the client that he/she received a copy of
Total EMA Aggregate Rate = 84%
Client rights and responsibilities
Consent for treatment
Release of information
Confidentiality policy
Grievance procedures
A (n=4) 100% 100% 100% 100% 100%
C (n=15) 100% 100% 100% 100% 100%
D (n=10) 100% 100% 56% 100% 100%
E (n=14) 0% 100% 100% 100% 64%
F (n=15) 33% 100% 100% 80% 33%
G (n=3) 67% 67% 67% 67% 67%
H (n=11) 55% 91% 80% 91% 73%
I (n=14) 100% 100% 14% 100% 93%
J (n=14)* 100% 100% 100% 100% 100%
K (n=14)* 79% 0% 57% 100% 100%
L (n=15) 87% 93% 93% 100% 93%
N (n=4) 0% 100% 75% 75% 0%
M (n=10) 100% 100% 100% 90% 100%
O (n=13) 77% 85% 69% 77% 85%
P (n=15)* 80% 100% 100% 93% 67%
Q (n=11) 100% 100% 100% 100% 100%
R (n=10)* 100% 90% 67% 90% 100%
T (n=9) 44% 100% 89% 67% 0%
U (n=13) 100% 100% 100% 100% 100%
V (n=8) 100% 100% 100% 100% 100%
EMA Mean 76% 91% 83% 92% 79%
*= funded prior to 3/1/15

Chicago Department of Public Health -- Ryan White Part A Quality Management Program Early Intervention Services
N/A = Not Applicable Page 3 of 17
B: Documentation of HIV testing Total EMA Aggregate Rate= 83%
Confirmed HIV status
Documentation that the meaning of a positive HIV test was explained to the patient
Referral for medical case management discussed and provided
Referral for appointment with medical provider discussed and provided
A (n=4) 100% 100% 75% 100%
C (n=15) 100% 67% 40% 93%
D (n=10) 100% 50% 10% 90%
E (n=14) 79% 79% 21% 100%
F (n=15) 93% 93% 60% 100%
G (n=3) 100% 67% 67% 100%
H (n=11) 82% 64% 30% 100%
I (n=14) 100% 79% 29% 93%
J (n=14)* 100% 100% 100% 100%
K (n=14)* 100% 93% 50% 86%
L (n=15) 100% 87% 93% 93%
N (n=4) 100% 80% 100% 100%
M (n=10) 50% 0% 0% 50%
O (n=13) 100% 77% 77% 77%
P (n=15)* 93% 80% 80% 87%
Q (n=11) 91% 100% 100% 100%
R (n=10)* 100% 90% 90% 100%
T (n=9) 100% 100% 89% 100%
U (n=13) 100% 100% 100% 92%
V (n=8) 100% 100% 88% 100%
EMA Mean 94% 80% 65% 93%
*= funded prior to 3/1/15

Chicago Department of Public Health -- Ryan White Part A Quality Management Program Early Intervention Services
N/A = Not Applicable Page 4 of 17
C: Documentation of Initial Intake
Total EMA Aggregate Rate= 51%
Date of first EIS services visit at this agency:
Documentation of a Completed initial intake assessment during first contact with the client
A (n=4) 0% 0%
C (n=15) 13% 13%
D (n=10) 10% 0%
E (n=14) 7% 7%
F (n=15) 100% 80%
G (n=3) 33% 33%
H (n=11) 45% 45%
I (n=14) 0% 14%
J (n=14)* 100% 100%
K (n=14)* 93% 92%
L (n=15) 100% 100%
N (n=4) 40% 30%
M (n=10) 100% 75%
O (n=13) 100% 85%
P (n=15)* 27% 20%
Q (n=11) 100% 91%
R (n=10)* 100% 90%
T (n=9) 44% 44%
U (n=13) 8% 8%
V (n=8) 38% 38%
EMA Mean 53% 48%
*= funded prior to 3/1/15

Chicago Department of Public Health -- Ryan White Part A Quality Management Program Early Intervention Services
N/A = Not Applicable Page 5 of 17
D: Documentation of Service Plan Signed by the…
Total EMA Aggregate Rate = 61%
Client Medical
case manager
Medical social
worker
EIS specialist
LTC specialist
Other
Provider [physician or
nurse practitioner
clinical nurse specialist]
Complete service plan
A (n=4) 0% 0% 0% 0% 0% 0% 0% 0%
C (n=15) 47% 56% NA NA NA NA 91% 100%
D (n=10) 10% NA NA NA NA NA 10% 10%
E (n=14) 36% NA NA NA NA NA 64% 93%
F (n=15) 0% 33% 25% 31% 18% NA 36% 40%
G (n=3) 0% 0 0 0 0 0 0 0%
H (n=11) 9% 20% 30% 13% NA NA 36% 36%
I (n=14) 14% 50% 57% NA NA NA 100% 86%
J (n=14)* 50% 73% NA NA NA NA 100% 100%
K (n=14)* 29% 23% 31% Not Asked Not Asked 54% N/A 36%
L (n=15) 40% 50% 44% 100% N/A N/A 100% 87%
N (n=4) 0% 70% NA NA NA NA 80% 90%
M (n=10) 0% 0% 0% 0% 0% 0% 0% 0%
O (n=13) 31% 38% 8% 9% NA NA 10% 23%
P (n=15)* 0% 73% 56% 50% 17% 17% 69% 73%
Q (n=11) 55% 100% N/A 89% 100% N/A 100% 100%
R (n=10)* 0% NA NA Not Asked Not Asked 20% N/A 60%
T (n=9) 56% 71% NA 33% NA 67% 71% 78%
U (n=13) 0% 92% NA NA NA NA 100% 92%
V (n=8) 100% 83% NA 60% NA NA 100% 100%
EMA Mean 24% 52% 28% 39% 27% 23% 63% 60%
*= funded prior to 3/1/15; Z=the aggregate rate is based on the service plan signed (by the client and at least one staff type) and completed plan.
Due to revisions in the data collection forms, certain items were ‘Not Asked’ for the two Pilot certain agencies.

Chicago Department of Public Health -- Ryan White Part A Quality Management Program Early Intervention Services
N/A = Not Applicable Page 6 of 17
E1: Documentation of Health Education and Literacy Training (E1, E2)
Total EMA Aggregate Rate = 51%
Risk reduction education on:
Adherence counseling about HIV medications and treatment
Labs and their meaning
Hep B Hep C STD/STI TB
Condom use/sexual risk management
IDU/drug or alcohol use
A (n=4) 100% 100% 0% 0% 25% 0% 50% 75%
C (n=15) 100% 73% 67% 67% 80% 67% 100% 93%
D (n=10) 80% 60% 33% 0% 67% 33% 80% 78%
E (n=14) 100% 86% 38% 38% 54% 46% 77% 57%
F (n=15) 100% 93% 67% 67% 80% 67% 87% 80%
G (n=3) 67% 33% 33% 33% 33% 33% 0% 0%
H (n=11) 91% 73% 9% 18% 45% 10% 73% 67%
I (n=14) 100% 86% 14% 0% 7% 21% 29% 29%
J (n=14)* 100% 93% 36% 36% 43% 36% 71% 50%
K (n=14)* 100% 93% 93% 79% 71% 71% 79% 71%
L (n=15) 100% 100% 53% 60% 87% 33% 93% 77%
N (n=4) 100% 90% 30% 30% 50% 20% 60% 40%
M (n=10) 25% 25% 0% 0% 0% 0% 0% 0%
O (n=13) 38% 62% 31% 23% 23% 15% 15% 23%
P (n=15)* 93% 80% 33% 33% 57% 29% 73% 57%
Q (n=11) 100% 91% 18% 45% 82% 9% 91% 64%
R (n=10)* 100% 80% 30% 30% 70% 60% 40% 43%
T (n=9) 100% 88% 38% 38% 75% 38% 63% 75%
U (n=13) 92% 100% 50% 50% 75% 46% 77% 69%
V (n=8) 100% 88% 50% 75% 75% 50% 100% 88%
EMA Mean 89% 80% 36% 36% 55% 34% 63% 57%
*= funded prior to 3/1/15

Chicago Department of Public Health -- Ryan White Part A Quality Management Program Early Intervention Services
N/A = Not Applicable Page 7 of 17
E2: Documentation of Health Education and Literacy Training
HIV Rx
side effects
Nutrition Oral
health/ hygiene
Exercise
Tobacco cessation
[only if tobacco
use]
Importance of early
initiation of treatment
Alternative therapy
Legal issues
How to cope with living
with HIV
Disclosure
A (n=4) 100% 50% 50% 50% 50% 25% 0% 0% 25% 25%
C (n=15) 67% 40% 27% 27% 87% 80% 27% 33% 80% 40%
D (n=10) 60% 20% 10% 0% 38% 30% 0% 0% 10% 0%
E (n=14) 100% 50% 21% 21% 80% 71% 7% 14% 71% 23%
F (n=15) 80% 62% 8% 25% 56% 58% 8% 15% 87% 87%
G (n=3) 33% 67% 0% 0% 33% 0% 0% 0% 0% 0%
H (n=11) 73% 27% 45% 9% 0% 30% 0% 13% 20% 18%
I (n=14) 64% 79% 14% 7% 21% 57% 7% 8% 43% 33%
J (n=14)* 100% 93% 79% 57% 77% 71% 50% 64% 93% 100%
K (n=14)* 93% 100% 86% 79% Not Asked
86% 21% 14% 50% 57%
L (n=15) 93% 92% 18% 30% 62% 60% 0% 50% 73% 100%
N (n=4) 0% 0% 0% 0% 0% 0% 0% 0% 0% 0%
M (n=10) 80% 60% 70% 10% 63% 70% 0% 0% 80% 60%
O (n=13) 54% 62% 46% 62% 38% 50% 46% 40% 54% 62%
P (n=15)* 73% 80% 47% 20% 60% 60% 0% 40% 53% 60%
Q (n=11) 100% 55% 55% 0% 45% 64% 0% 18% 82% 82%
R (n=10)* 100% 30% 10% 10% Not Asked
60% 0% 0% 40% 22%
T (n=9) 75% 63% 75% 13% 43% 63% 13% 50% 63% 63%
U (n=13) 77% 92% 69% 38% 54% 85% 23% 92% 92% 85%
V (n=8) 100% 75% 75% 25% 63% 88% 0% 38% 100% 100%
EMA Mean 76% 60% 40% 23% 48% 57% 11% 26% 57% 52%
*= funded prior to 3/1/15 Due to revisions in the data collection forms, certain items were ‘Not Asked’ for the two pilot agencies.
Chicago Department of Public Health -- Ryan White Part A Quality Management Program Early Intervention Services
N/A = Not Applicable Page 8 of 17
*=
funded prior to 3/1/15;
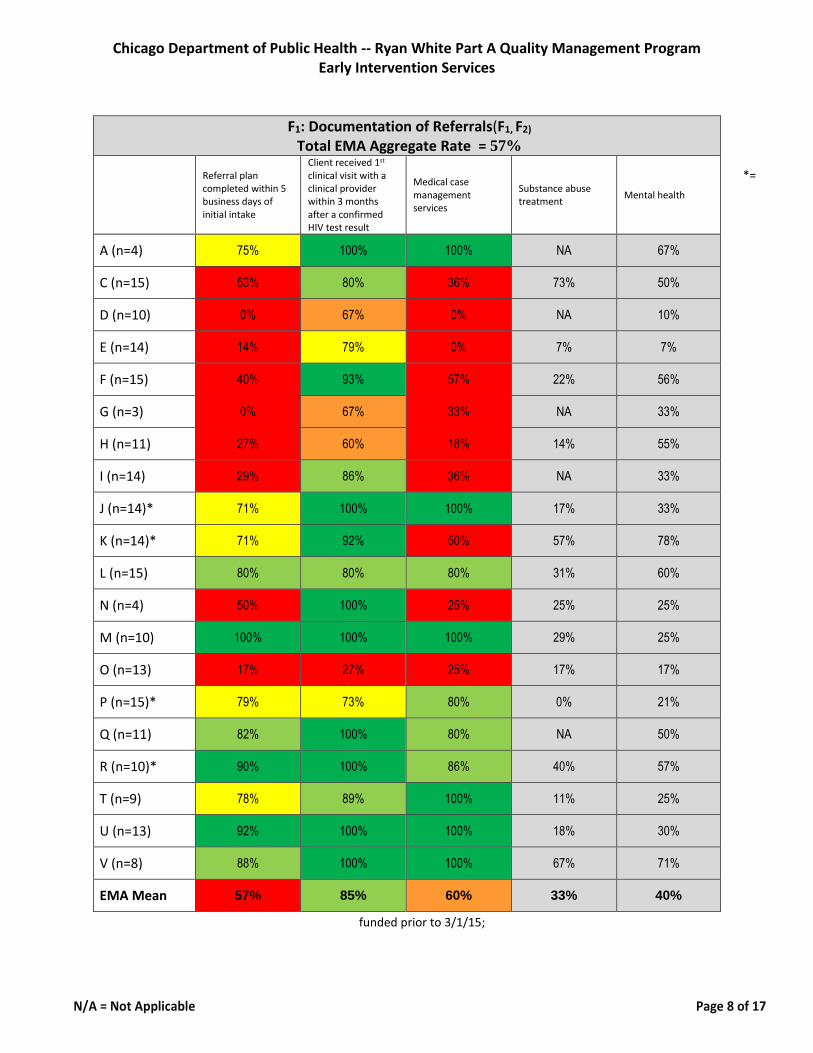
F1: Documentation of Referrals(F1, F2) Total EMA Aggregate Rate = 57%
Referral plan completed within 5 business days of initial intake
Client received 1st clinical visit with a clinical provider within 3 months after a confirmed HIV test result
Medical case management services
Substance abuse treatment
Mental health
A (n=4) 75% 100% 100% NA 67%
C (n=15) 53% 80% 36% 73% 50%
D (n=10) 0% 67% 0% NA 10%
E (n=14) 14% 79% 0% 7% 7%
F (n=15) 40% 93% 57% 22% 56%
G (n=3) 0% 67% 33% NA 33%
H (n=11) 27% 60% 18% 14% 55%
I (n=14) 29% 86% 36% NA 33%
J (n=14)* 71% 100% 100% 17% 33%
K (n=14)* 71% 92% 50% 57% 78%
L (n=15) 80% 80% 80% 31% 60%
N (n=4) 50% 100% 25% 25% 25%
M (n=10) 100% 100% 100% 29% 25%
O (n=13) 17% 27% 25% 17% 17%
P (n=15)* 79% 73% 80% 0% 21%
Q (n=11) 82% 100% 80% NA 50%
R (n=10)* 90% 100% 86% 40% 57%
T (n=9) 78% 89% 100% 11% 25%
U (n=13) 92% 100% 100% 18% 30%
V (n=8) 88% 100% 100% 67% 71%
EMA Mean 57% 85% 60% 33% 40%

Chicago Department of Public Health -- Ryan White Part A Quality Management Program Early Intervention Services
N/A = Not Applicable Page 9 of 17
F2: Documentation of Referrals
Medical care Specialty care Dental care Partner notification
Referrals monitored
Other supportive services
A (n=4) 75% 33% 75% 33% 75% 0%
C (n=15) 80% 50% 8% 23% 73% 43%
D (n=10) 20% 0% 0% 0 20% 10%
E (n=14) 64% 29% 14% 0% 21% 21%
F (n=15) 92% 40% 13% 14% 82% 86%
G (n=3) 67% 0% 33% 0% 0% 33%
H (n=11) 55% 13% 44% 0% 27% 29%
I (n=14) 100% 50% 17% 17% 42% 42%
J (n=14)* 100% 36% 56% 30% 92% 67%
K (n=14)* 79% Not Asked Not Asked 14% 21% 10%
L (n=15) 93% 50% 18% 54% 93% 63%
N (n=4) 0% 0% 0% 0% 0% 0%
M (n=10) 90% 20% 75% 0% 60% 0%
O (n=13) 25% 17% 8% 8% 8% 17%
P (n=15)* 53% 33% 36% 0% 50% 23%
Q (n=11) 82% 33% 13% 0% 88% 57%
R (n=10)* 78% Not Asked Not Asked 14% 50% 50%
T (n=9) 89% 67% 0% 33% 86% 33%
U (n=13) 67% 33% 58% 17% 92% 17%
V (n=8) 100% 57% 38% 29% 100% 88%
EMA Mean 70% 33% 28% 22% 54% 34%
*= funded prior to 3/1/15; Y=aggregate rate includes medical, dental and specialty care plus referrals monitored. Due to revisions in the data collection forms, certain items were ‘Not Asked’ for the two pilot agencies.

Chicago Department of Public Health -- Ryan White Part A Quality Management Program Early Intervention Services
N/A = Not Applicable Page 10 of 17
G: Documentation of Medical Assessment/Evaluation Total EMA Aggregate Rate = 96%
Medical assessment/evaluation completed &
signed by a credentialed medical provider Completed medical assessment/evaluation
A (n=4) 100% 100%
C (n=15) 100% 100%
D (n=10) 100% 100%
E (n=14) 100% 100%
F (n=15) 100% 100%
G (n=3) 100% 100%
H (n=11) 100% 100%
I (n=14) 100% 100%
J (n=14)* 100% 100%
K (n=14)* 86% 86%
L (n=15) 100% 100%
N (n=4) 100% 100%
M (n=10) 50% 50%
O (n=13) 100% 100%
P (n=15)* 93% 93%
Q (n=11) 100% 100%
R (n=10)* 100% 100%
T (n=9) 89% 89%
U (n=13) 100% 100%
V (n=8) 100% 100%
EMA Mean 96% 96%
*= funded prior to 3/1/15

Chicago Department of Public Health -- Ryan White Part A Quality Management Program Early Intervention Services
N/A = Not Applicable Page 11 of 17
H1: Documentation of Completed Current Risk Assessment (H1, H2, H2) Total EMA Aggregate Rate = 63%
Completion of risk assessment during the review period
Current HIV risk factors:
MSM Heterosexual IDU Unprotected
sex
Victim of sexual assault
Victim of domestic violence
A (n=4) 50% 100% 100% 100% 50% 0 0
C (n=15) 93% 50% 50% 55% 64% 8% 8%
D (n=10) 20% 63% 30% 40% 67% 0 0
E (n=14) 57% 21% 29% 21% 50% 0 0
F (n=15) 67% 57% 33% 33% 50% 0 0
G (n=3) 67% 33% 0% 0% 0% 0 0
H (n=11) 73% 78% 80% 33% 89% 0 0
I (n=14) 36% 67% 40% 40% 75% 43% 43%
J (n=14)* 93% 100% 80% 25% 71% 15% 15%
K (n=14)* 86% 64% 45% 20% 82% 33% 50%
L (n=15) 100% 100% 88% 75% 73% 0 0
N (n=4) 90% 83% 29% 33% 33% 0 0
M (n=10) 50% 25% 0% 0% 0% 0 0
O (n=13) 54% 77% 29% 22% 67% 14% 0
P (n=15)* 87% 50% 82% 0% 56% NA 8%
Q (n=11) 91% 90% 50% 63% 82% 9% 0
R (n=10)* 70% 80% 33% 40% 70% 0 0
T (n=9) 88% 60% 60% 0% 50% 38% 25%
U (n=13) 77% 64% 42% 0% 75% 0 0
V (n=8) 100% 100% 50% 43% 75% 0 0
EMA Mean 72% 68% 48% 32% 59% 23% 7%
*= funded prior to 3/1/15; c=aggregate rate includes completion of risk assessment, MSM, heterosexual and unprotected sex.

Chicago Department of Public Health -- Ryan White Part A Quality Management Program Early Intervention Services
N/A = Not Applicable Page 12 of 17
H2: Documentation of Current Risk Assessment
Ever tested for STD/STIs
Ever diagnosed
with an STD/STI?
If yes, specify which one [counts not rates]
Syphilis Chlamydia Gonorrhea If treated, was the partner(s)
tested?
A (n=4) 100% 50% 2 - 1 -
C (n=15) 100% 50% 7 4 4 0
D (n=10) 100% 67% 8 5 4 0
E (n=14) 86% 29% 1 - - -
F (n=15) 80% 27% 4 - - -
G (n=3) 100% 67% 2 - - -
H (n=11) 91% 70% 4 1 1 -
I (n=14) 29% 17% 2 1 1 -
J (n=14)* 100% 14% 1 - 1 -
K (n=14)* 77% 20% 1 - - -
L (n=15) 93% 50% 4 2 - -
N (n=4) 0% 0% 0 0 0 0
M (n=10) 90% 20% 1 1 - -
O (n=13) 45% 36% 3 4 4 1
P (n=15)* 87% 33% 1 3 - -
Q (n=11) 100% 64% 5 0 - -
R (n=10)* 80% 86% 5 4 5 -
T (n=9) 88% 38% 1 0 - -
U (n=13) 100% 17% 2 3 2 -
V (n=8) 100% 7% 1 1 1 -
EMA Mean 82% 38% 3% 2% 2% 1%
*= funded prior to 3/1/15;

Chicago Department of Public Health -- Ryan White Part A Quality Management Program Early Intervention Services
N/A = Not Applicable Page 13 of 17
H3: Documentation of Current Risk Assessment:
Hep B? If yes, treated?
Hep C? If yes, treated?
TB? If yes, treated?
Substance use - any of the following: [counts not rates]
IDU Crack/ cocaine
Marijuana Methamphetamines
Alcohol Tobacco use
A (n=4) 100% 100% 100% 100% 75% 100% 1 3 3 - 3 4
C (n=15) 100% 80% 93% 40% 93% 75% 6 8 5 4 8 11
D (n=10) 100% 75% 70% 0% 80% 0% 7 6 7 7 9 9
E (n=14) 93% 05% 93% 40% 79% 43% 3 5 7 2 9 10
F (n=15) 67% 50% 87% 83% 67% 0% - - 4 - 7 6
G (n=3) 100% 100% 67% N/A 67% 50% - - 1 - 2 2
H (n=11) 91% 0% 91% 0% 73% 33% 1 1 1 - 3 4
I (n=14) 64% 0% 43% N/A 50% 0% 2 2 3 2 4 5
J (n=14)* 100% N/A 100% N/A 86% 0% - - 3 - 6 7
K (n=14)* 86% 20% 86% 86% 57% N/A 1 - 2 - 4 -
L (n=15) 93% 14% 93% 33% 87% 0% - 2 7 2 6 9
N (n=4) 100% 40% 80% 17% 50% 0% 2 1 1 1 4 7
M (n=10) 0% 0% 0% 0% 0% 0% - - - - - -
O (n=13) 36% 36% 36% 36% 9% 0% - 4 2 2 7 7
P (n=15)* 93% 50% 93% 38% 80% 57% - 5 4 - 11 11
Q (n=11) 82% 14% 82% 14% 73% 0% 4 1 2 - 6 5
R (n=10)* 78% 60% 70% 70% 60% 25% 1 2 2 - 5 -
T (n=9) 100% N/A 100% N/A 100% 100% - - 4 - 6 4
U (n=13) 92% 60% 92% 60% 92% 40% - 3 3 1 10 11
V (n=8) 100% 25% 100% 0% 100% 25% 3 4 6 3 6 5
EMA Mean 84% 43% 79% 39% 69% 29% 3% 3% 4% 3% 6% 7%
*= funded prior to 3/1/15; e= Total Aggregate Rate for Documentation of Risk Assessment (H1, H2, H2) = 63%

Chicago Department of Public Health -- Ryan White Part A Quality Management Program Early Intervention Services
N/A = Not Applicable Page 14 of 17
I: Documentation of Linkage/ Retention in Care Total EMA Aggregate Rate = 69%
Client received 1st clinical visit with a clinical
provider within 3 months after
a confirmed HIV test result
2 medical appointments
within the review period - 90 days apart.
Reasons the patient did not
have at least two medical
visits
Follow-up telephone calls,
letters &/or home visit) for missed appointments
Client successfully
retained 3 months
Client successfully
retained 6 months
A (n=4) 100% 100% 100% 100% 100% NA
C (n=15) 80% 93% 71% 60% 73% NA
D (n=10) 67% 30% 20% 86% 57% NA
E (n=14) 79% 64% 70% 92% 63% NA
F (n=15) 93% 73% 100% 89% 89% NA
G (n=3) 67% 33% 0% 0% 0% NA
H (n=11) 60% 36% 63% 63% 14% NA
I (n=14) 86% 57% 44% 43% 56% NA
J (n=14)* 100% 93% 91% 100% 93% 62%
K (n=14)* 92% 50% 27% 46% 46% 46%
L (n=15) 80% 73% 100% 100% 82% NA
N (n=4) 100% 70% 100% 100% 83% NA
M (n=10) 100% 0% 0% 0% 0% NA
O (n=13) 27% 17% 0% 0% 0% NA
P (n=15)* 73% 67% 70% 92% 79% 64%
Q (n=11) 100% 82% 100% 100% 100% 67%
R (n=10)* 100% 80% 67% 71% 71% 71%
T (n=9) 89% 78% 100% 100% 83% NA
U (n=13) 100% 92% 100% 100% 100% NA
V (n=8) 100% 100% 67% 100% 100% NA
EMA Mean
85% 64% 65% 72% 64% 61%
*= funded prior to 3/1/15;

Chicago Department of Public Health -- Ryan White Part A Quality Management Program Early Intervention Services
N/A = Not Applicable Page 15 of 17
The low rate of case closures may be due to the large number of newly funded agencies shown in table J. Most (80%) of the agencies had been funded/in operation for less than 12 months and the clients would not be eligible for case closure.
J: Documentation of Case Closure Total EMA Aggregate Rate = 30%
Case closure
Reason for case closure: [counts not rates]
Met milestone
Deceased
Incarcerated/sentenced to prison exceeding 90 day
Relocated out of service area
Assisted living/nursing home
Discontinued services
Lost to follow-up
No Reason
A (n=4) NA NA NA NA NA NA NA NA NA
C (n=15) NA NA NA NA NA NA NA NA NA
D (n=10) NA NA NA NA NA NA NA NA NA
E (n=14) NA NA NA NA NA NA NA NA NA
F (n=15) NA NA NA NA NA NA NA NA NA
G (n=3) NA NA NA NA NA NA NA NA NA
H (n=11) NA NA NA NA NA NA NA NA NA
I (n=14) NA NA NA NA NA NA NA NA NA
J (n=14)* 69% 4 0 0 0 0 0 0 0
K (n=14)* 0% 0 0 0 0 0 0 0 0
L (n=15) NA NA NA NA NA NA NA NA NA
N (n=4) NA NA NA NA NA NA NA NA NA
M (n=10) NA NA NA NA NA NA NA NA NA
O (n=13) NA NA NA NA NA NA NA NA NA
P (n=15)* 0% 0 0 0 0 0 0 0 0
Q (n=11) NA NA NA NA NA NA NA NA NA
R (n=10)* 50% 3 1 0 0 0 0 0 0
T (n=9) NA NA NA NA NA NA NA NA NA
U (n=13) NA NA NA NA NA NA NA NA NA
V (n=8) NA NA NA NA NA NA NA NA NA
EMA Mean 30% 3.00 1.00 1.00 1.00 1.00
*= funded prior to 3/1/15
Chicago Department of Public Health -- Ryan White Part A Quality Management Program Early Intervention Services
N/A = Not Applicable Page 16 of 17
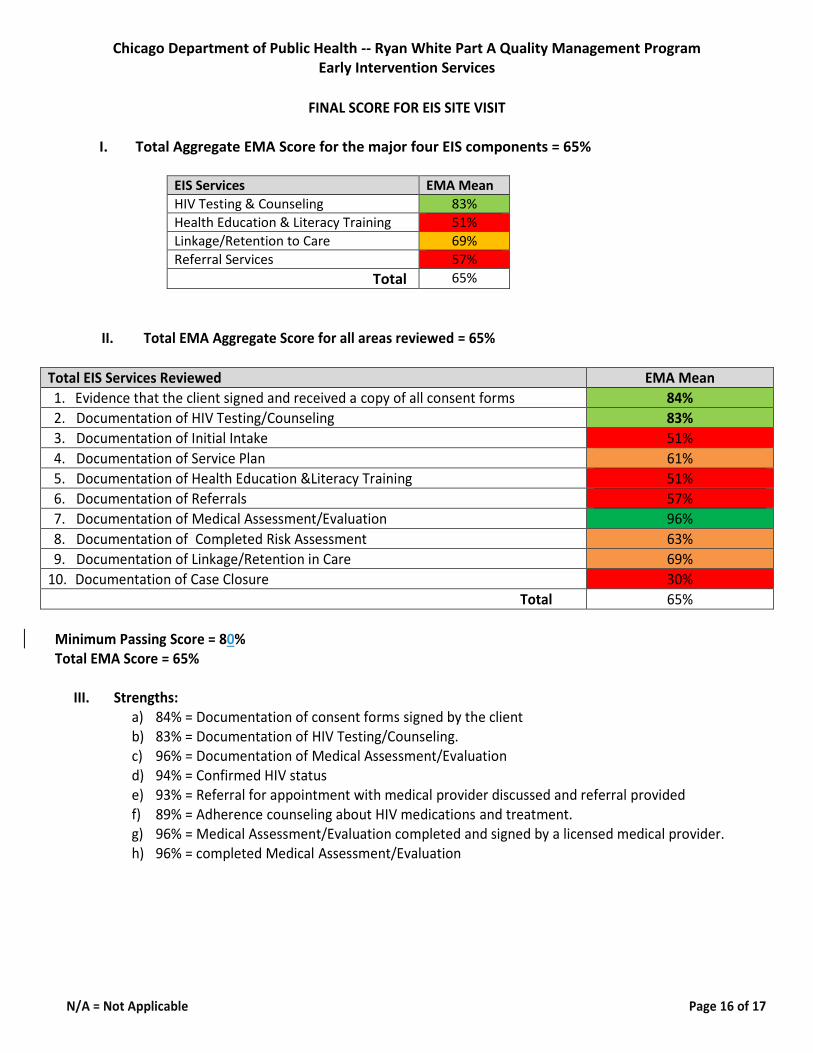
FINAL SCORE FOR EIS SITE VISIT
I. Total Aggregate EMA Score for the major four EIS components = 65%
EIS Services EMA Mean
HIV Testing & Counseling 83%
Health Education & Literacy Training 51%
Linkage/Retention to Care 69%
Referral Services 57%
Total 65%
II. Total EMA Aggregate Score for all areas reviewed = 65%
Total EIS Services Reviewed EMA Mean
1. Evidence that the client signed and received a copy of all consent forms 84%
2. Documentation of HIV Testing/Counseling 83%
3. Documentation of Initial Intake 51%
4. Documentation of Service Plan 61%
5. Documentation of Health Education &Literacy Training 51%
6. Documentation of Referrals 57%
7. Documentation of Medical Assessment/Evaluation 96%
8. Documentation of Completed Risk Assessment 63%
9. Documentation of Linkage/Retention in Care 69%
10. Documentation of Case Closure 30%
Total 65%
Minimum Passing Score = 80% Total EMA Score = 65%
III. Strengths: a) 84% = Documentation of consent forms signed by the client b) 83% = Documentation of HIV Testing/Counseling. c) 96% = Documentation of Medical Assessment/Evaluation d) 94% = Confirmed HIV status e) 93% = Referral for appointment with medical provider discussed and referral provided f) 89% = Adherence counseling about HIV medications and treatment. g) 96% = Medical Assessment/Evaluation completed and signed by a licensed medical provider. h) 96% = completed Medical Assessment/Evaluation

Chicago Department of Public Health -- Ryan White Part A Quality Management Program Early Intervention Services
N/A = Not Applicable Page 17 of 17
IV. Areas of Quality Improvement (areas 70% & below)
1. Documentation of initial intake a) 53% = Documented the date of the first EIS visit at the agency. b) 48% = Completion of initial intake assessment during first contact with the client.
2. Documentation of Service Plan a) 24% = of service plans were signed by the client b) 39% = of service plans were signed by the provider c) 60% = complete service plan
3. Documentation of Health Education % Literacy Training a) 51% = documentation of complete Health education and literacy provided to the clients
4. Documentation Referrals a) 57% = Referral plan was completed within 5 business days of the initial intake. b) 70% = Documentation that the client was referred for medical care. c) 23% = was referred for dental care d) 54% = evidence that the referrals were monitored.
5. Documentation of Complete Risk Assessment a) 72% = Complete Risk Assessment.
6. Documentation of Linkage/Retention in Care a) 64% = Two medical appointment s within the review period 90 days apart. b) 65% = reasons the client did not have at least two medical visits. c) 72% = follow-up telephones calls, letters and/or home visit for missed appointment. d) 64% = Client successfully retained in care for 3 month
*All items below 80% are areas for quality improvement.
V. Quality improvement plan for agencies with a total score of 60 and below:
All Delegate Agencies will receive 1-2 mandatory EIS trainings (TBA).
Agencies with a total score of 60 and below will require individual technical assistance.
EIS will be one of the service categories selected for the annual site review for 2017