chi square control charts - the institute for perception...
TRANSCRIPT

www.ifpress.com
Chi Square Control Charts
The Institute for Perception
+001 804 675 2980
Rotterdam, The NetherlandsJuly 26th, 2010
Presented By:
Dr. John M. Ennis

2
An Image with a Defect
3
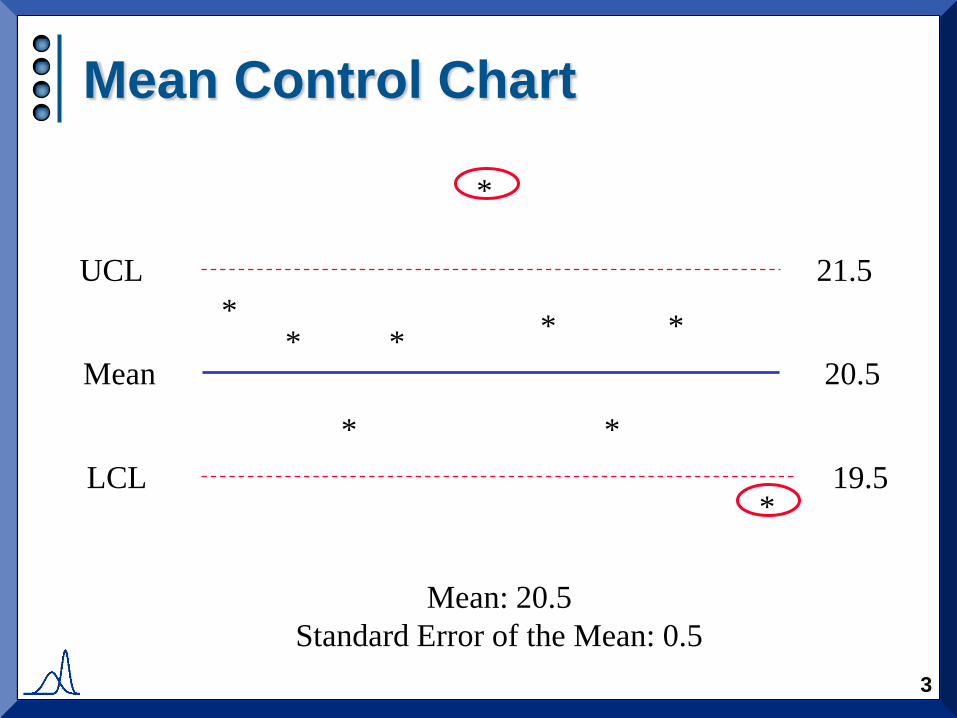
Mean Control Chart
**
*
*
*
*
*
*
*
UCL 21.5
Mean 20.5
LCL 19.5
Mean: 20.5
Standard Error of the Mean: 0.5

4
Multiple Sensory Descriptors
Descriptive and consumer panel ratings data
Highly multivariate
Correlated assessments
Assumption of homogenous assessors
Test with Dirichlet Multinomial model
5
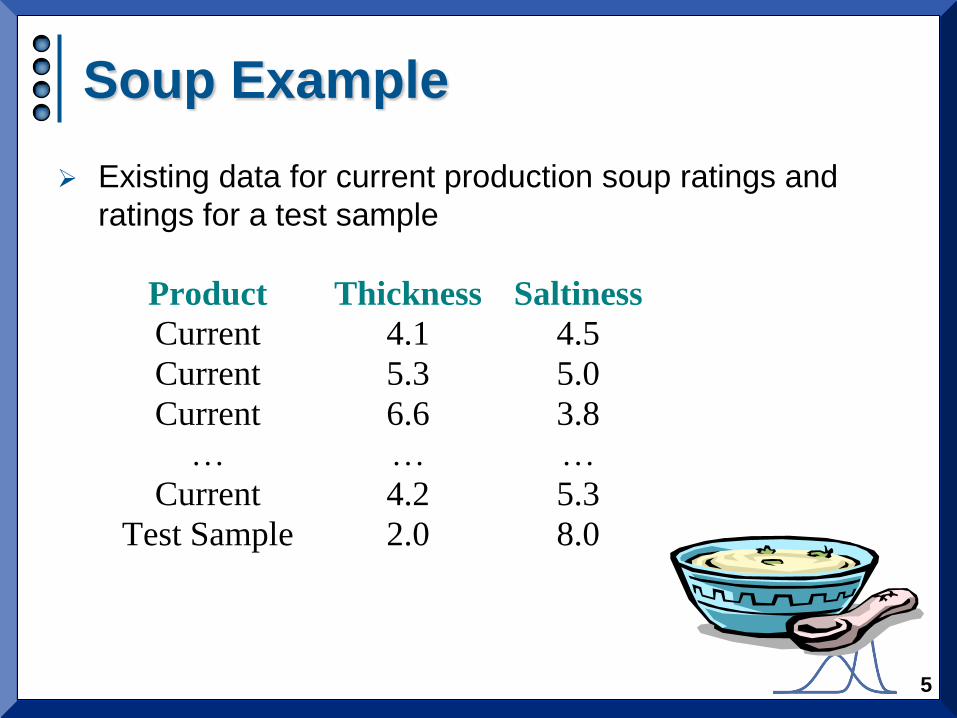
Soup Example
Existing data for current production soup ratings and
ratings for a test sample
Product Thickness Saltiness
Current 4.1 4.5
Current 5.3 5.0
Current 6.6 3.8
… … …
Current 4.2 5.3
Test Sample 2.0 8.0
6
Thickness Rating
Salt
ines
s R
ati
ng
0 2 4 6 8 10 12
02
46
810
12
T
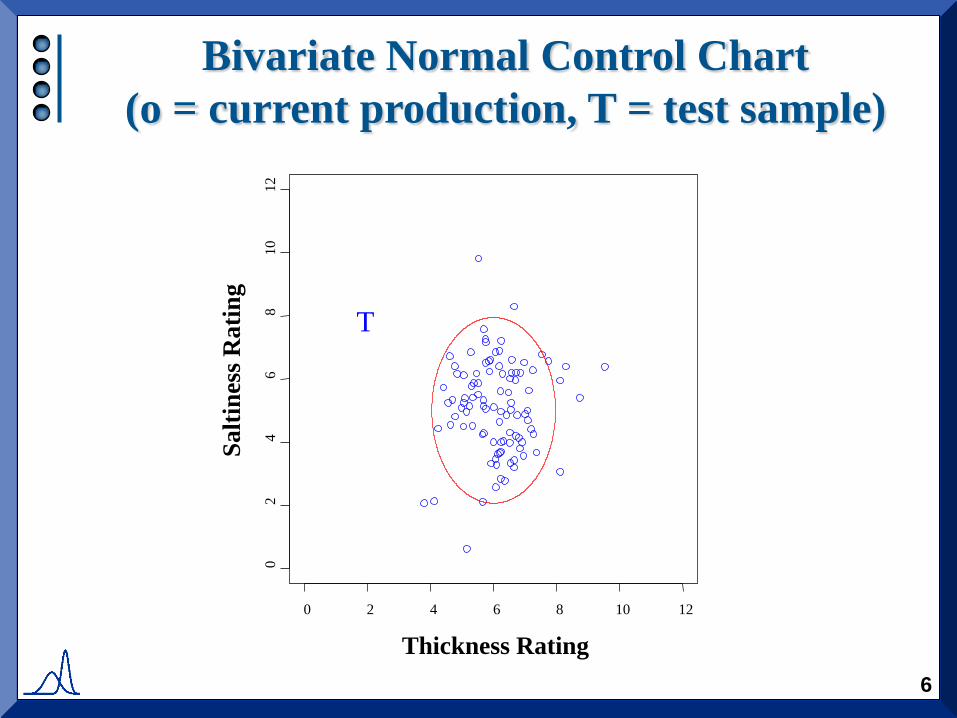
Bivariate Normal Control Chart
(o = current production, T = test sample)

7
Comments
Product X rated low on thickness and high on saltiness
95% contour for the bivariate normal suggests it not typical
Can we get a measure of departure from the current process?
Thickness Rating
Sa
ltin
es
s R
atin
g
0 2 4 6 8 10 12
02
46
81
01
2
XXT

8
Beverage Example
Ratings on sweetness, sourness and carbonation
available for current production and a test product
Is the test product within specification?
Construct a star plot with confidence limits

9
Star Plot Control Chart
Sweetness
Sourness
Carbonation

10
Comments
Star plots are univariate plots of more than one attribute
No account made of attribute correlations or the
multivariate nature of the data
Questions:
Product inside acceptance region means it should be accepted?
Product outside acceptance region means it should be rejected?

11
Conversion to Standard Form
For univariate normal variables,
The analogous Cholesky transformation exists for
multivariate normal variables
ZX
z A x
AA V
1 ( )t

12
Why Transform the Data?
Standard distributions desired for testing
Similar to calculating z-scores and using normal tables
In standard form results are more meaningful and
easier to interpret

13
Equal Likelihood Contours
For a non standard normal, contours of equal likelihood
are ellipses
For a standard normal, contours are circles
Points falling outside these contours are not typical
14
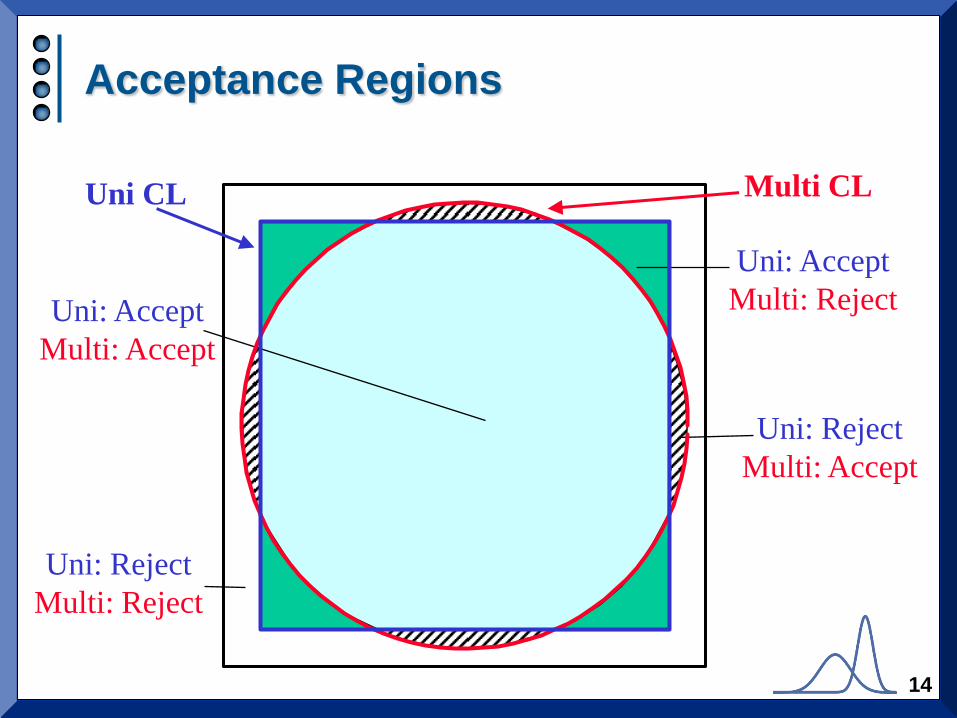
Acceptance Regions
Uni: Accept
Multi: Reject
Uni: Reject
Multi: Accept
Uni: Accept
Multi: Accept
Uni: Reject
Multi: Reject
Uni CL Multi CL

15
Bivariate Normal Control Chart
Thickness Rating
Salt
ines
s R
ati
ng
0 2 4 6 8 10 12
02
46
810
12
T
16
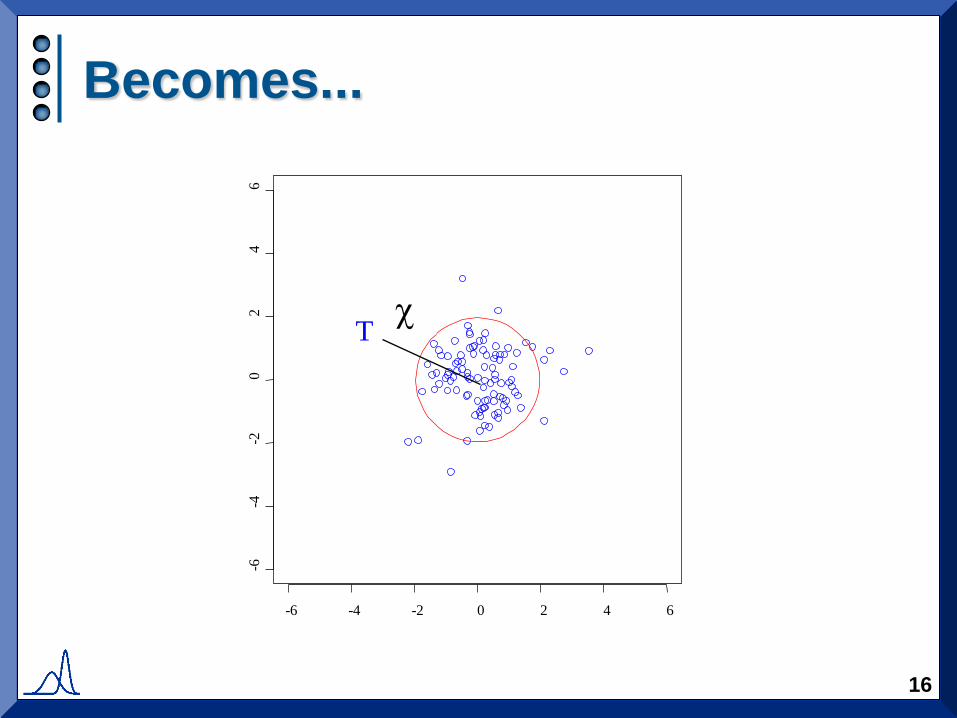
Becomes...
Thickness Rating
Sa
ltin
ess
Rati
ng
-6 -4 -2 0 2 4 6
-6-4
-20
24
6
T
17
Statistics: Multivariate vs Univariate
Products may fail a multivariate QC test and pass a
univariate test or the opposite
Need to take into account correlations among attributes
Need to take into account accumulated evidence of
deviance from a standard
18
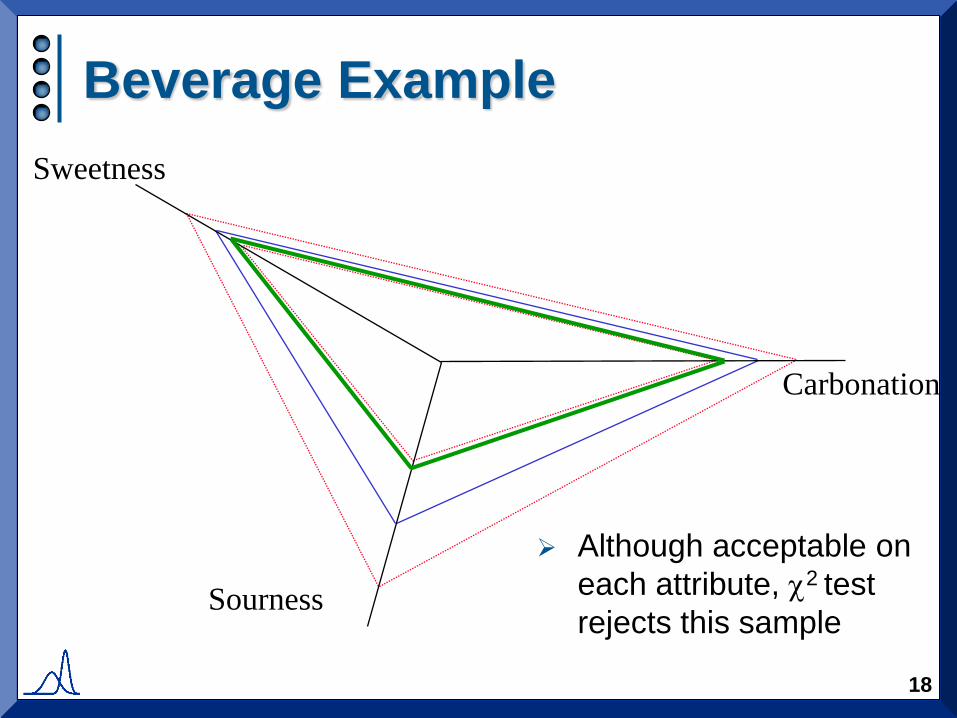
Beverage Example
Sweetness
Sourness
Carbonation
Although acceptable on
each attribute, 2 test
rejects this sample
www.ifpress.com
Presented By:
Chi Square Control Charts
Dr. John M. Ennis
The Institute for Perception
+001 804 675 2980
Rotterdam, The NetherlandsJuly 26th, 2010