chester profile - pw - 2014-03-26
DESCRIPTION
Profile of chesterTRANSCRIPT
Integrated Strategic Needs Assessment
PopulationA l id t i h d i th UK d h d t d i t d d t t i th UK f i d f
Cheshire West & Chester Locality ProfileDemographics: Chester
Contains Ordnance Survey data © Crown copyrightand database right 2013. License No 100049046
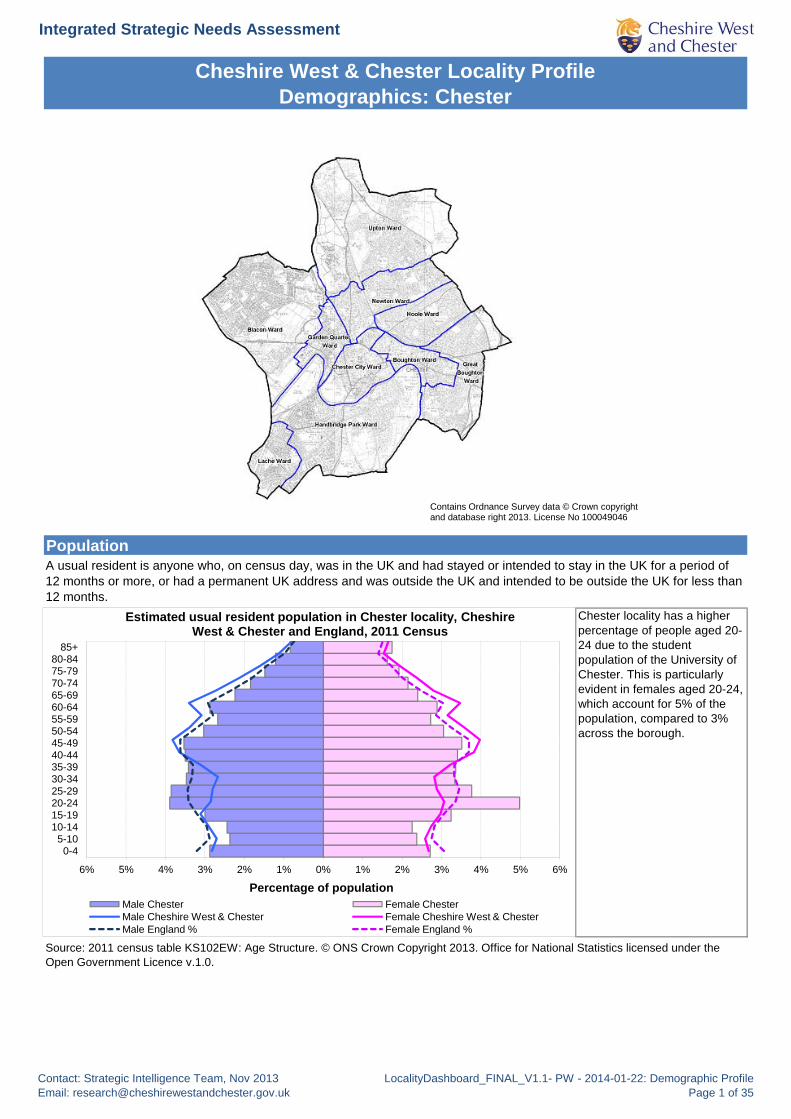
Chester locality has a higher percentage of people aged 20-24 due to the student population of the University of Chester. This is particularly evident in females aged 20-24, which account for 5% of the population, compared to 3% across the borough.
A usual resident is anyone who, on census day, was in the UK and had stayed or intended to stay in the UK for a period of 12 months or more, or had a permanent UK address and was outside the UK and intended to be outside the UK for less than 12 months.
Source: 2011 census table KS102EW: Age Structure. © ONS Crown Copyright 2013. Office for National Statistics licensed under the Open Government Licence v.1.0.
6% 5% 4% 3% 2% 1% 0% 1% 2% 3% 4% 5% 6%
0-45-10
10-1415-1920-2425-2930-3435-3940-4445-4950-5455-5960-6465-6970-7475-7980-84
85+
Percentage of population
Estimated usual resident population in Chester locality, Cheshire West & Chester and England, 2011 Census
Male Chester Female ChesterMale Cheshire West & Chester Female Cheshire West & ChesterMale England % Female England %
Contact: Strategic Intelligence Team, Nov 2013Email: [email protected]
LocalityDashboard_FINAL_V1.1- PW - 2014-01-22: Demographic ProfilePage 1 of 35
Integrated Strategic Needs Assessment
Cheshire West & Chester Locality ProfileDemographics: Chester
Index of multiple deprivation 2010
Cheshire West and Chester has a less deprived population profile compared to England but there are some areas of the borough experiencing relatively high deprivation.
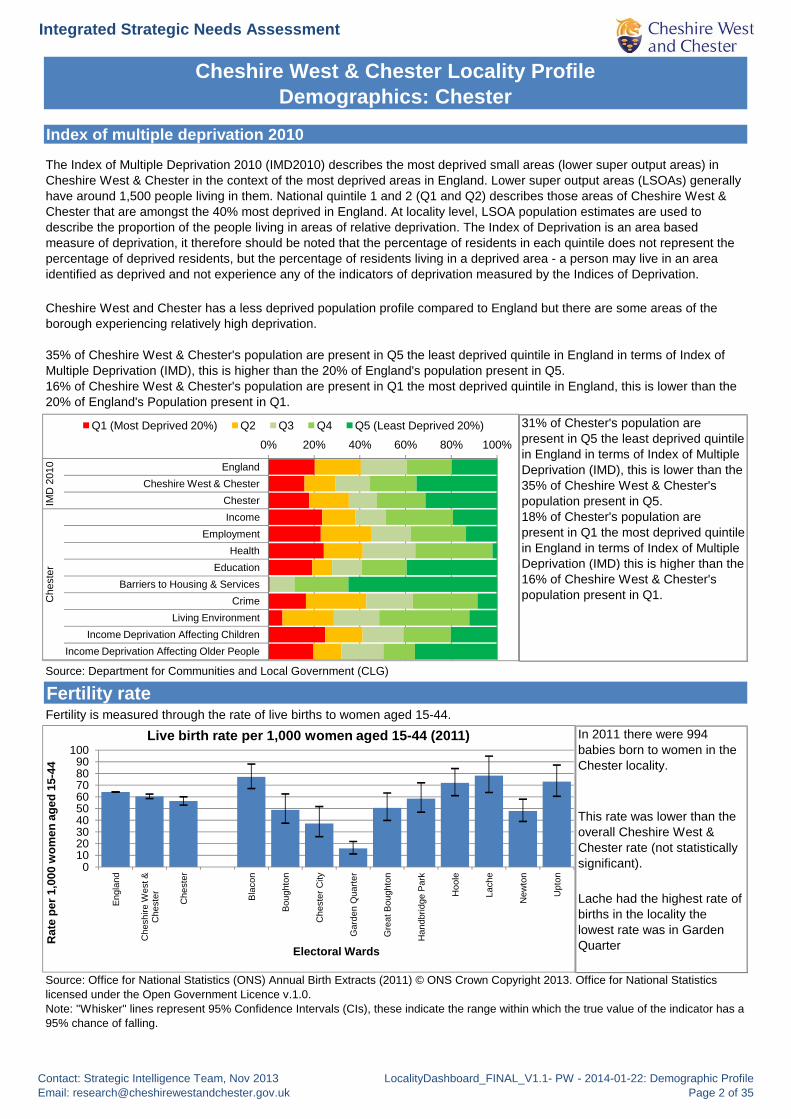
35% of Cheshire West & Chester's population are present in Q5 the least deprived quintile in England in terms of Index of Multiple Deprivation (IMD), this is higher than the 20% of England's population present in Q5.16% of Cheshire West & Chester's population are present in Q1 the most deprived quintile in England, this is lower than the 20% of England's Population present in Q1.
31% of Chester's population are present in Q5 the least deprived quintile in England in terms of Index of Multiple Deprivation (IMD), this is lower than the 35% of Cheshire West & Chester's population present in Q5.18% of Chester's population are present in Q1 the most deprived quintile in England in terms of Index of Multiple Deprivation (IMD) this is higher than the
The Index of Multiple Deprivation 2010 (IMD2010) describes the most deprived small areas (lower super output areas) in Cheshire West & Chester in the context of the most deprived areas in England. Lower super output areas (LSOAs) generally have around 1,500 people living in them. National quintile 1 and 2 (Q1 and Q2) describes those areas of Cheshire West & Chester that are amongst the 40% most deprived in England. At locality level, LSOA population estimates are used to describe the proportion of the people living in areas of relative deprivation. The Index of Deprivation is an area based measure of deprivation, it therefore should be noted that the percentage of residents in each quintile does not represent the percentage of deprived residents, but the percentage of residents living in a deprived area - a person may live in an area identified as deprived and not experience any of the indicators of deprivation measured by the Indices of Deprivation.
0% 20% 40% 60% 80% 100%
EnglandCheshire West & Chester
ChesterIncome
EmploymentHealth
IMD
201
0
Q1 (Most Deprived 20%) Q2 Q3 Q4 Q5 (Least Deprived 20%)
Fertility rate
In 2011 there were 994 babies born to women in the Chester locality.
This rate was lower than the overall Cheshire West & Chester rate (not statistically significant).
Lache had the highest rate of births in the locality the lowest rate was in Garden Quarter
Source: Office for National Statistics (ONS) Annual Birth Extracts (2011) © ONS Crown Copyright 2013. Office for National Statistics licensed under the Open Government Licence v.1.0. Note: "Whisker" lines represent 95% Confidence Intervals (CIs), these indicate the range within which the true value of the indicator has a 95% chance of falling.
Fertility is measured through the rate of live births to women aged 15-44.
Deprivation (IMD) this is higher than the 16% of Cheshire West & Chester's population present in Q1.
Source: Department for Communities and Local Government (CLG)
EducationBarriers to Housing & Services
CrimeLiving Environment
Income Deprivation Affecting ChildrenIncome Deprivation Affecting Older People
Che
ster
0102030405060708090
100
Eng
land
Che
shire
Wes
t &C
hest
er Che
ster
Bla
con
Bou
ghto
n
Che
ster
City
Gar
den
Qua
rter
Gre
at B
ough
ton
Han
dbrid
ge P
ark
Hoo
le
Lach
e
New
ton
Upt
on
Rat
e pe
r 1,0
00 w
omen
age
d 15
-44
Electoral Wards
Live birth rate per 1,000 women aged 15-44 (2011)
Contact: Strategic Intelligence Team, Nov 2013Email: [email protected]
LocalityDashboard_FINAL_V1.1- PW - 2014-01-22: Demographic ProfilePage 2 of 35
Integrated Strategic Needs Assessment
Cheshire West & Chester Locality ProfileDemographics: Chester
Life expectancy at birth
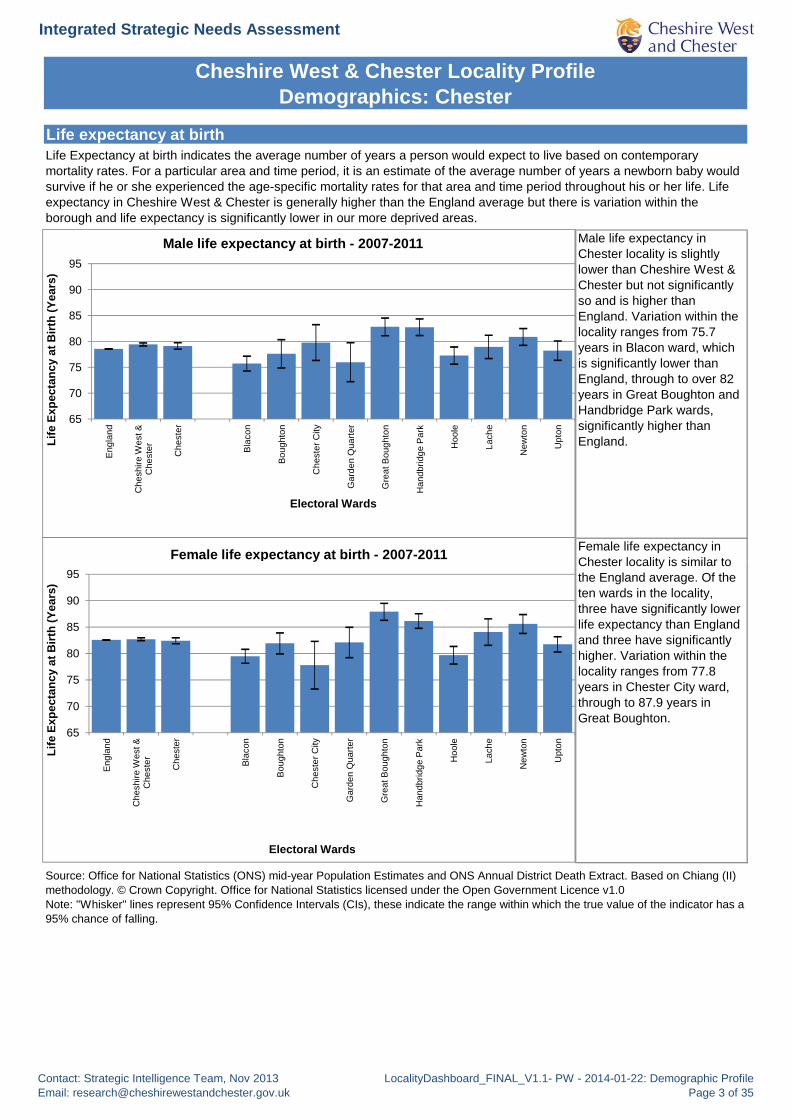
Male life expectancy in Chester locality is slightly lower than Cheshire West & Chester but not significantly so and is higher than England. Variation within the locality ranges from 75.7 years in Blacon ward, which is significantly lower than England, through to over 82 years in Great Boughton and Handbridge Park wards, significantly higher than England.
Female life expectancy in Chester locality is similar to
Life Expectancy at birth indicates the average number of years a person would expect to live based on contemporary mortality rates. For a particular area and time period, it is an estimate of the average number of years a newborn baby would survive if he or she experienced the age-specific mortality rates for that area and time period throughout his or her life. Life expectancy in Cheshire West & Chester is generally higher than the England average but there is variation within the borough and life expectancy is significantly lower in our more deprived areas.
65
70
75
80
85
90
95
Eng
land
Che
shire
Wes
t &C
hest
er Che
ster
Bla
con
Bou
ghto
n
Che
ster
City
Gar
den
Qua
rter
Gre
at B
ough
ton
Han
dbrid
ge P
ark
Hoo
le
Lach
e
New
ton
Upt
on
Life
Exp
ecta
ncy
at B
irth
(Yea
rs)
Electoral Wards
Male life expectancy at birth - 2007-2011
Female life expectancy at birth - 2007-2011 Chester locality is similar to the England average. Of the ten wards in the locality, three have significantly lower life expectancy than England and three have significantly higher. Variation within the locality ranges from 77.8 years in Chester City ward, through to 87.9 years in Great Boughton.
Source: Office for National Statistics (ONS) mid-year Population Estimates and ONS Annual District Death Extract. Based on Chiang (II) methodology. © Crown Copyright. Office for National Statistics licensed under the Open Government Licence v1.0Note: "Whisker" lines represent 95% Confidence Intervals (CIs), these indicate the range within which the true value of the indicator has a 95% chance of falling.
65
70
75
80
85
90
95
Eng
land
Che
shire
Wes
t &C
hest
er Che
ster
Bla
con
Bou
ghto
n
Che
ster
City
Gar
den
Qua
rter
Gre
at B
ough
ton
Han
dbrid
ge P
ark
Hoo
le
Lach
e
New
ton
Upt
onLife
Exp
ecta
ncy
at B
irth
(Yea
rs)
Electoral Wards
y
Contact: Strategic Intelligence Team, Nov 2013Email: [email protected]
LocalityDashboard_FINAL_V1.1- PW - 2014-01-22: Demographic ProfilePage 3 of 35

Integrated Strategic Needs Assessment
Cheshire West & Chester Locality ProfileDemographics: Chester
Language and ethnicity
Main language and proficiency in English (people aged 3 and over)
Ethnic groupEthnic group classifies people according to their own perceived ethnic group and cultural background. Minority ethnic groups are all ethnic groups other than white British
4% of the population of Chester locality do not have English as their main language. This is the largest locality proportion, but is lower than the England figure of 8%. 84% of these people can speak English 'Very Well' or 'Well', slightly higher than the Borough.
Source: 2011 census table QS205EW: Proficiency in English. © ONS Crown Copyright 2013. Office for National Statistics licensed under the Open Government Licence v.1.0.
0%1%2%3%4%5%6%7%8%9%
England Cheshire West &
Chester
Chester Ellesmere Port Northwich & Winsford
Rural
Perc
enta
ge o
f peo
ple
(age
d 3
and
over
)
Neighbourhood Locality
Percentage of people for whom English is not their main language, by how well they can speak it
Cannot speak English at all
Cannot speak English well
Can speak English well
Can speak English very well
5.3% of people in Cheshire West & Chester are of ethnic minority groups. The largest group is White Other, followed by Asian. The overall England is figure is 20.2%.
9.2% of people in Chester locality are of ethnic minority groups. This is the highest locality figure.
are all ethnic groups other than white British.
Source: 2011 census table KS201EW: Ethnic group. © ONS Crown Copyright 2013. Office for National Statistics licensed under the Open Government Licence v.1.0.
0%1%2%3%4%5%6%7%8%9%
White Irish White Gypsy/ Traveller
White Other Mixed Asian Black Other
Perc
enta
ge o
f peo
ple
Percentage of people who are from an ethnic minority (by ethnic group)
England Cheshire West & Chester Chester
Contact: Strategic Intelligence Team, Nov 2013Email: [email protected]
LocalityDashboard_FINAL_V1.1- PW - 2014-01-22: Demographic ProfilePage 4 of 35

Integrated Strategic Needs Assessment
Income deprivation affecting children (0-16) index
Cheshire West & Chester Locality Profile Starting Well: Chester
Contains Ordnance Survey data © Crown copyrightand database right 2013. License No 100049046
25% of Chester locality children aged 0-16 live in Q1 (most deprived) areas in terms of Income deprivation affecting children, this compares to 17% of Cheshire West & Chester's children. 63% of children in Blacon ward and 58% in Lache ward reside in Q1 (most deprived).
The Income Deprivation Affecting Children Index of the Index of Multiple Deprivation 2010 (IMD2010) describes the most deprived areas in Cheshire West & Chester in the context of the most deprived areas in England. Therefore national quintile 1 and 2 (Q1 and Q2) describes those areas of Cheshire West & Chester that are amongst the 40% most deprived in England. Locality figures have been calculated based on resident populations.
Source: Department for Communities and Local Government (CLG)
0%
20%
40%
60%
80%
100%
Eng
land
Che
shire
Wes
t &C
hest
er Che
ster
Bla
con
Bou
ghto
n
Che
ster
City
Gar
den
Qua
rter
Gre
at B
ough
ton
Han
dbrid
ge P
ark
Hoo
le
Lach
e
New
ton
Upt
on
Electoral Wards
Income deprivation affecting children aged 0-16Quintile 1 - Most Deprived 20% Nationally Q2 Q3 Q4 Quintile 5 - Least Deprived 20% Nationally
Contact: Strategic Intelligence Team, Nov 2013Email: [email protected]
LocalityDashboard_FINAL_V1.1- PW - 2014-01-22: Starting Well ProfilePage 5 of 35

Integrated Strategic Needs Assessment
Cheshire West & Chester Locality Profile Starting Well: Chester
Low birthweight births
Chester locality has a slightly lower proportion of low birth weight births compared to Cheshire West & Chester and England but the difference is not statistically significant. Hoole has a significantly lower proportion than England, other wards are not significantly different
Low birth weight is measured as the percentage of liveborn babies weighing less than 2500g (5lbs 8oz) at birth. It is an indicator of poor population health and has individual risk of infant mortality and poor health into adulthood.
0%2%4%6%8%
10%12%14%16%18%20%
Eng
land
Che
shire
Wes
t &C
hest
er Che
ster
Bla
con
Bou
ghto
n
Che
ster
City
Gar
den
Qua
rter
Gre
at B
ough
ton
Han
dbrid
ge P
ark
Hoo
le
Lach
e
New
ton
Upt
on
Perc
enta
ge o
f all
live
birt
hs
Electoral Wards
Low birthweight births (<2500g) 2007-2011
6%
7%
8%
9%
2001-2003 2002-2004 2003-2005 2004-2006 2007-2009 2008-2010 2009-2011Perc
enta
ge o
f Birt
hs
Low birthweight births (<2500g) - 3yr pooled trend
England Cheshire West & Chester
Infant mortality
During the five year period 2007-2011, there were on average 16 infant deaths a year in Cheshire West and Chester, similar to the England rate. Numbers of deaths are relatively small and so care needs to be taken with interpretation. At locality level numbers become even smaller and less meaningful, there is no significant difference in any of the locality rates compared to England.
Source: Office for National Statistics (ONS) Annual Birth Extracts (2001-2011) © ONS Crown Copyright 2013. Office for National Statistics licensed under the Open Government Licence v.1.0.Note: "Whisker" lines represent 95% Confidence Intervals (CIs), these indicate the range within which the true value of the indicator has a 95% chance of falling.
Infant mortality is measured as the number of infant deaths under 1 year of age per 1000 live births. Infant mortality is an indicator of the general health of an entire population. It reflects the relationship between causes of infant mortality and upstream determinants of population health such as economic, social and environmental conditions. Deaths occurring during the first 28 days of life (the neonatal period) in particular, are considered to reflect the health and care of both mother and newborn (Public Health England, 2013).
Source: Office for National Statistics (ONS) Annual Birth and Death Extracts (2001-2011) © ONS Crown Copyright 2013. Office for National Statistics licensed under the Open Government Licence v.1.0.Note: "Whisker" lines represent 95% Confidence Intervals (CIs), these indicate the range within which the true value of the indicator has a 95% chance of falling.
g
0
2
4
6
8
10
England Cheshire West &Chester
Chester Ellesmere Port
Northwich & Winsford
Rural
Rat
e pe
r 1,0
00 li
ve b
irths
Neighbourhood Localities
Infant mortality 2007-2011
Contact: Strategic Intelligence Team, Nov 2013Email: [email protected]
LocalityDashboard_FINAL_V1.1- PW - 2014-01-22: Starting Well ProfilePage 6 of 35
Integrated Strategic Needs Assessment
Cheshire West & Chester Locality Profile Starting Well: Chester
Child safeguarding
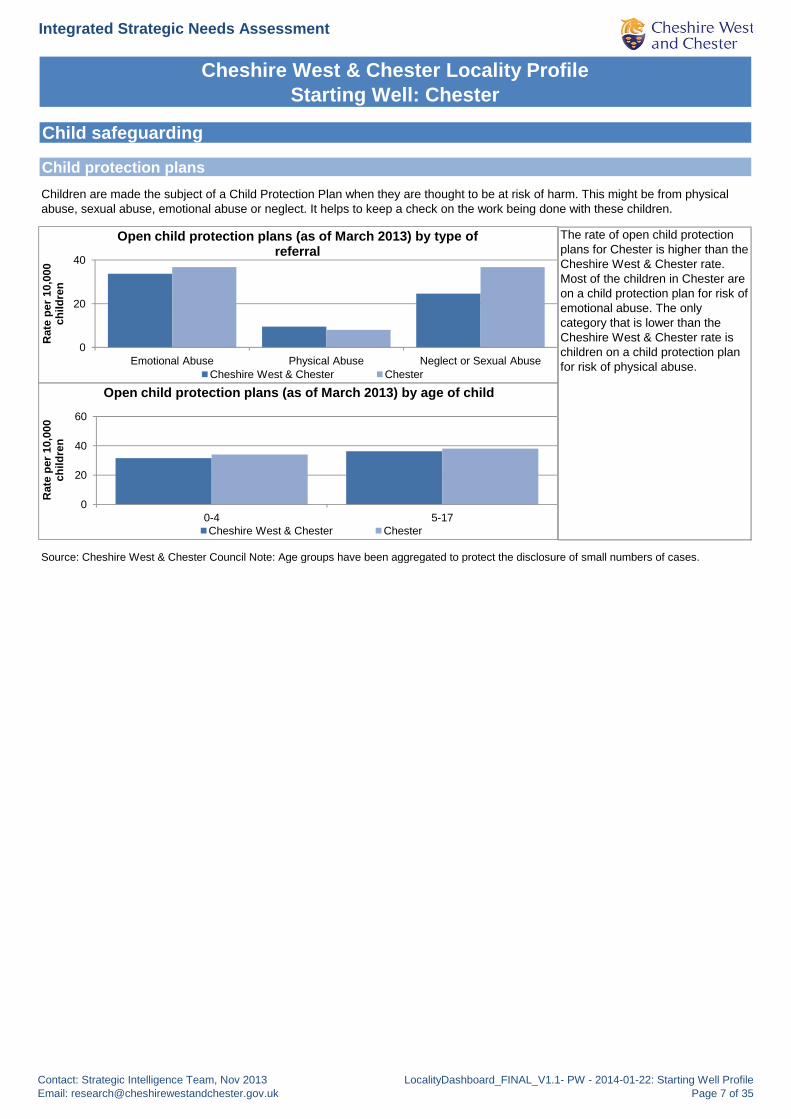
Child protection plansChildren are made the subject of a Child Protection Plan when they are thought to be at risk of harm. This might be from physical abuse, sexual abuse, emotional abuse or neglect. It helps to keep a check on the work being done with these children.
Source: Cheshire West & Chester Council Note: Age groups have been aggregated to protect the disclosure of small numbers of cases.
The rate of open child protection plans for Chester is higher than the Cheshire West & Chester rate. Most of the children in Chester are on a child protection plan for risk of emotional abuse. The only category that is lower than the Cheshire West & Chester rate is children on a child protection plan for risk of physical abuse.
0
20
40
Emotional Abuse Physical Abuse Neglect or Sexual Abuse
Rat
e pe
r 10,
000
child
ren
Open child protection plans (as of March 2013) by type of referral
Cheshire West & Chester Chester
0
20
40
60
0-4 5-17
Rat
e pe
r 10,
000
child
ren
Open child protection plans (as of March 2013) by age of child
Cheshire West & Chester Chester
g g p gg g p
Contact: Strategic Intelligence Team, Nov 2013Email: [email protected]
LocalityDashboard_FINAL_V1.1- PW - 2014-01-22: Starting Well ProfilePage 7 of 35
Integrated Strategic Needs Assessment
Cheshire West & Chester Locality Profile Starting Well: Chester
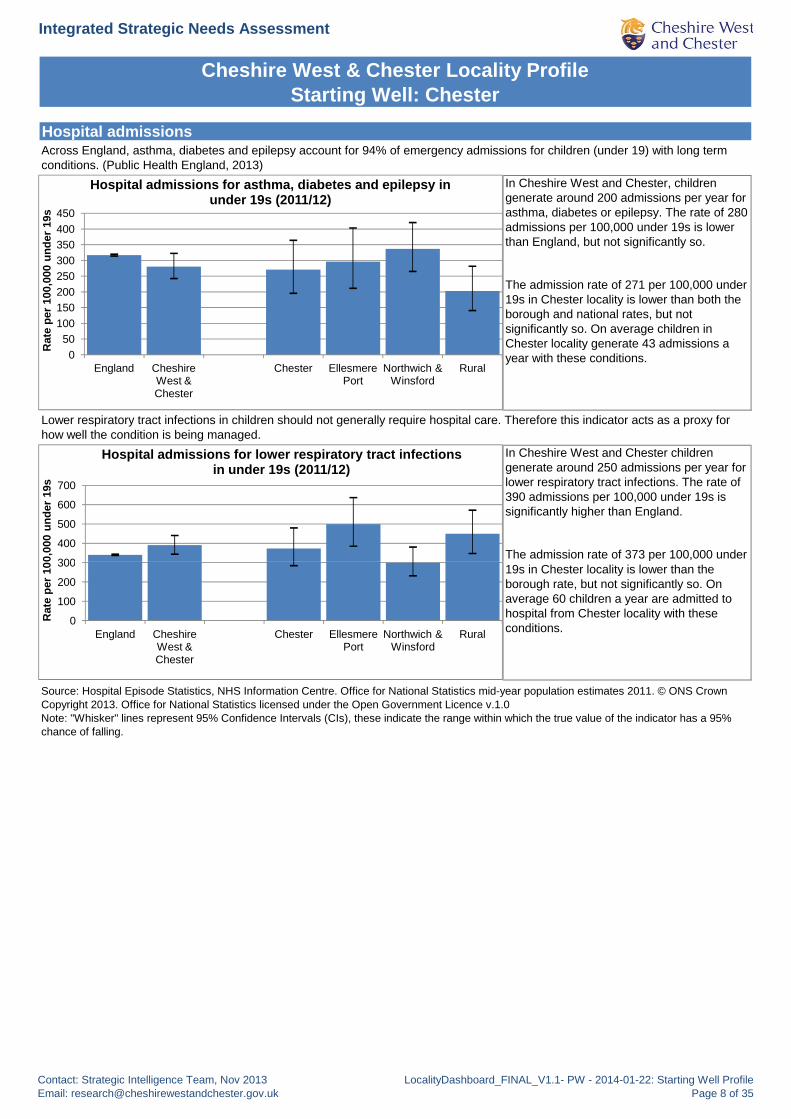
Hospital admissionsAcross England, asthma, diabetes and epilepsy account for 94% of emergency admissions for children (under 19) with long term conditions. (Public Health England, 2013)
The admission rate of 271 per 100,000 under 19s in Chester locality is lower than both the borough and national rates, but not significantly so. On average children in Chester locality generate 43 admissions a year with these conditions.
In Cheshire West and Chester, children generate around 200 admissions per year for asthma, diabetes or epilepsy. The rate of 280 admissions per 100,000 under 19s is lower than England, but not significantly so.
The admission rate of 373 per 100,000 under
In Cheshire West and Chester children generate around 250 admissions per year for lower respiratory tract infections. The rate of 390 admissions per 100,000 under 19s is significantly higher than England.
Lower respiratory tract infections in children should not generally require hospital care. Therefore this indicator acts as a proxy for how well the condition is being managed.
050
100150200250300350400450
England Cheshire West &Chester
Chester Ellesmere Port
Northwich & Winsford
Rural
Rat
e pe
r 100
,000
und
er 1
9s
Hospital admissions for asthma, diabetes and epilepsy in under 19s (2011/12)
300
400
500
600
700
0,00
0 un
der
19s
Hospital admissions for lower respiratory tract infections in under 19s (2011/12)
Source: Hospital Episode Statistics, NHS Information Centre. Office for National Statistics mid-year population estimates 2011. © ONS Crown Copyright 2013. Office for National Statistics licensed under the Open Government Licence v.1.0Note: "Whisker" lines represent 95% Confidence Intervals (CIs), these indicate the range within which the true value of the indicator has a 95% chance of falling.
19s in Chester locality is lower than the borough rate, but not significantly so. On average 60 children a year are admitted to hospital from Chester locality with these conditions.0
100
200
300
England Cheshire West &Chester
Chester Ellesmere Port
Northwich & Winsford
Rural
Rat
e pe
r 10
Contact: Strategic Intelligence Team, Nov 2013Email: [email protected]
LocalityDashboard_FINAL_V1.1- PW - 2014-01-22: Starting Well ProfilePage 8 of 35
Integrated Strategic Needs Assessment
Cheshire West & Chester Locality Profile Starting Well: Chester
Childhood injuries
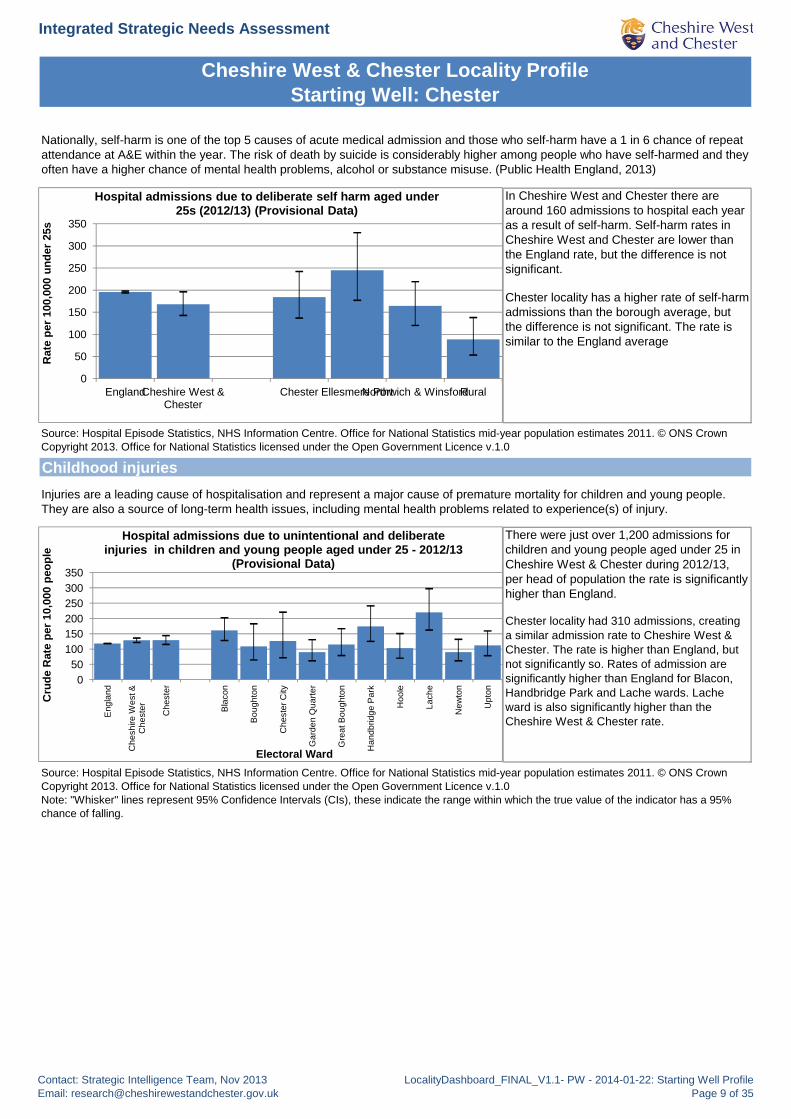
In Cheshire West and Chester there are around 160 admissions to hospital each year as a result of self-harm. Self-harm rates in Cheshire West and Chester are lower than the England rate, but the difference is not significant.
There were just over 1,200 admissions for children and young people aged under 25 in Cheshire West & Chester d ring 2012/13
Injuries are a leading cause of hospitalisation and represent a major cause of premature mortality for children and young people. They are also a source of long-term health issues, including mental health problems related to experience(s) of injury.
Source: Hospital Episode Statistics, NHS Information Centre. Office for National Statistics mid-year population estimates 2011. © ONS Crown Copyright 2013. Office for National Statistics licensed under the Open Government Licence v.1.0
Chester locality has a higher rate of self-harm admissions than the borough average, but the difference is not significant. The rate is similar to the England average
Nationally, self-harm is one of the top 5 causes of acute medical admission and those who self-harm have a 1 in 6 chance of repeat attendance at A&E within the year. The risk of death by suicide is considerably higher among people who have self-harmed and they often have a higher chance of mental health problems, alcohol or substance misuse. (Public Health England, 2013)
ple
Hospital admissions due to unintentional and deliberate injuries in children and young people aged under 25 - 2012/13
(Provisional Data)
0
50
100
150
200
250
300
350
EnglandCheshire West &Chester
Chester Ellesmere PortNorthwich & WinsfordRural
Rat
e pe
r 100
,000
und
er 2
5s
Hospital admissions due to deliberate self harm aged under 25s (2012/13) (Provisional Data)
Cheshire West & Chester during 2012/13, per head of population the rate is significantly higher than England.
Chester locality had 310 admissions, creating a similar admission rate to Cheshire West & Chester. The rate is higher than England, but not significantly so. Rates of admission are significantly higher than England for Blacon, Handbridge Park and Lache wards. Lache ward is also significantly higher than the Cheshire West & Chester rate.
Source: Hospital Episode Statistics, NHS Information Centre. Office for National Statistics mid-year population estimates 2011. © ONS Crown Copyright 2013. Office for National Statistics licensed under the Open Government Licence v.1.0Note: "Whisker" lines represent 95% Confidence Intervals (CIs), these indicate the range within which the true value of the indicator has a 95% chance of falling.
050
100150200250300350
Eng
land
Che
shire
Wes
t &C
hest
er Che
ster
Bla
con
Bou
ghto
n
Che
ster
City
Gar
den
Qua
rter
Gre
at B
ough
ton
Han
dbrid
ge P
ark
Hoo
le
Lach
e
New
ton
Upt
onCru
de R
ate
per 1
0,00
0 pe
op
Electoral Ward
(Provisional Data)
Contact: Strategic Intelligence Team, Nov 2013Email: [email protected]
LocalityDashboard_FINAL_V1.1- PW - 2014-01-22: Starting Well ProfilePage 9 of 35

Integrated Strategic Needs Assessment
Cheshire West & Chester Locality Profile Starting Well: Chester
Lone parent households / Workless households
9.8% of households in Cheshire West and Chester are lone parent households, lower than the national figure of 10.6%.
9.5% of households in Chester locality are lone parent households. This is lower than the borough and national averages. Blacon ward has the highest percentage (16.4%) of lone parent households, Lache ward has the second highest (13.8%). Both wards are higher than the borough and England percentages. Garden Quarter ward has the lowest percentage of lone parent households (4.9%).
In Chester locality 12.6% of households with dependent children are workless. This is higher than the borough but lower than the national average. The
A lone-parent household is a household that comprises a lone-parent family and no other person. A dependent child is any person aged 0 to 15 in a household (whether or not in a family) or a person aged 16 to 18 in full-time education and living in a family with his or her parent(s) or grandparent(s). It does not include any people aged 16 to 18 who have a spouse, partner or child living in the household. A workless household is one where none of the adults are in employment.
0%
5%
10%
15%
20%
25%
d & r n n y r n k e e n nntag
e of
all
s w
ith d
epen
dent
hi
ldre
n
Workless households with dependent children
0%2%4%6%8%
10%12%14%16%18%
Eng
land
Che
shire
Wes
t &C
hest
er Che
ster
Bla
con
Bou
ghto
n
Che
ster
City
Gar
den
Qua
rter
Gre
at B
ough
ton
Han
dbrid
ge P
ark
Hoo
le
Lach
e
New
ton
Upt
on
Perc
enta
ge o
f all
hous
ehol
ds
Electoral Wards
Lone parent households by child status
With dependent children None-dependent children
highest ward percentage is Blacon (21.2%) and the lowest is Great Boughton (4.2%).
For lone parent households with dependent children the workless percentage raises to 35.2%, higher than the borough but lower than the national average. Chester City ward has the highest percentage (44%) and Great Boughton ward the lowest (15.4%).
Source: 2011 census tables KS105EW Household composition, KS106EW Adults not in employment and dependent children and persons with long-term health problems or disability for all households and KS107EW Lone parent households with dependent children. © ONS Crown Copyright 2013. Office for National Statistics licensed under the Open Government Licence v.1.0.
Eng
land
Che
shire
Wes
t &C
hest
er Che
ste r
Bla
con
Bou
ghto
n
Che
ster
City
Gar
den
Qua
rter
Gre
at B
ough
ton
Han
dbrid
ge P
ark
Hoo
le
Lach
e
New
ton
Upt
on
Perc
eho
useh
olds ch
Electoral Wards
0%
10%
20%
30%
40%
50%
Eng
land
Che
shire
Wes
t &C
hest
er Che
ster
Bla
con
Bou
ghto
n
Che
ster
City
Gar
den
Qua
rter
Gre
at B
ough
ton
Han
dbrid
ge P
ark
Hoo
le
Lach
e
New
ton
Upt
on
Perc
enta
ge o
f all
lone
pa
rent
hou
seho
lds
with
de
pend
ent c
hild
ren
Electoral Wards
Workless lone parent households with dependent children
Contact: Strategic Intelligence Team, Nov 2013Email: [email protected]
LocalityDashboard_FINAL_V1.1- PW - 2014-01-22: Starting Well ProfilePage 10 of 35

Integrated Strategic Needs Assessment
Cheshire West & Chester Locality Profile Starting Well: Chester
Teenage conceptionMost teenage pregnancies are unplanned and around half end in an abortion. For many teenagers bringing up a child is extremely difficult and often results in poor outcomes for both the teenage parent and the child, in terms of the baby’s health, the mother’s emotional health and well-being and the likelihood of both the parent and child living in long-term poverty. Research evidence shows that teenage pregnancy is associated with poorer outcomes for both young parents and their children. Teenage mothers are less likely to finish their education, are more likely to bring up their child alone and in poverty and have a higher risk of poor mental health than older mothers. Infant mortality rates for babies born to teenage mothers are around 60% higher than for babies born to older mothers. The children of teenage mothers have an increased risk of living in poverty and poor quality housing and are more likely to have accidents and behavioural problems. (Public Health England, 2013)
Based on national quartiles from 2009-2011 wardconception data. Where Quartile 1 is the worst 25% of wards nationally
The rate of under 18 conceptions in Cheshire West and Chester was 30.7 per 1,000 females aged 15-17. This is significantly lower than England.
Source: Calculated from Ward Conceptions, 2009-2011. © ONS Crown Copyright 2013. Office for National Statistics licensed under the Open Government Licence v.1.0.
The rate of 34.3 per 1,000 in Chester locality is higher than the England and borough rate, but not significantly so. The rate increased by 33% between 2001-03 and 2007-09, although has since decreased by 16%.
0
10
20
30
40
Engl
and
Che
shire
W
est &
Che
ster
Che
ster
Elle
smer
e Po
rt
Nor
thw
ich
& W
insf
ord
Rur
al
Rat
e pe
r 1,0
00
fem
ales
age
d 15
-17 Teenage conception rate (2009-2011)
0
20
40
60
2001-03 2003-05 2005-07 2007-09 2009-2011
Rat
e pe
r 1,0
00
fem
ales
age
d 15
-17
Teenage conception trend
England Cheshire West & Chester Chester
Contains Ordnance Survey data © Crown copyrightand database right 2013. License No 100049046
Contact: Strategic Intelligence Team, Nov 2013Email: [email protected]
LocalityDashboard_FINAL_V1.1- PW - 2014-01-22: Starting Well ProfilePage 11 of 35

Integrated Strategic Needs Assessment
Cheshire West & Chester Locality Profile Starting Well: Chester
Healthy weight in childhood
Excess weight (overweight and obesity) in children often leads to excess weight in adults, and this is recognised as a major determinant of premature mortality and avoidable ill health. Figures are based on the percentage of primary school age children in their Reception Year (aged 4-5 years) recorded as obese in the school years 2009/2010 to 2011/12.
NICE guidelines define children as overweight if their Body Mass Index (BMI) is more than or equal to 85th percentile but less than the 95th percentile. Children with a BMI over the 95th percentile are defined as obese. More detail is available within the ‘Children’s Centre Dashboard’ which can be found in the ‘Starting Well’ section of the ISNA.
Prevalence of obese children aged 4-5 - national quartiles (2009/10 to 2011/12)
Based on national quartiles from 2009/10-2011/12 MSOA data. Where Quartile 1 is the worst 25% of MSOAS nationally
Almost one in ten Cheshire West and Chester children in their school reception year were obese in the period 2009/10 to 2011/12. This is lower than the national rate, but not significantly so.
Source: Calculated from National Obesity Observatory Middle Super Output Area (MSOA) data (2009/10 to 2011/12 combined).
In Chester locality 7.7% were obese. This is the lowest locality rate within the borough, and significantly lower than the national rate. MSOA rates within the locality ranged from 4.2% of children in Chester Centre MSOA to 13.3% in North Blacon MSOA.
0%
5%
10%
15%
2007/08 2008/09 2009/10 2010/11 2011/12
Perc
enta
ge o
f ch
ildre
n
Percentage of children who are obeseReception Year (aged 4-5) trend
England Cheshire West & Chester Chester
0%5%
10%15%20%
Eng
land
Che
shire
Wes
t &C
hest
er Che
ster
Bou
ghto
n H
all &
Hoo
le P
ark
Che
ster
Cen
tre
Che
ster
Hos
pita
l
Che
ster
Sta
tion
Eas
t Hoo
le
Lach
e
New
ton
& U
pton
Nor
th B
laco
n
Sou
th B
laco
n
Sou
th o
f Dee
Perc
enta
ge o
f chi
ldre
n
Midde super output area (MSOA)
Percentage of children who are obeseReception year (aged 4-5) 2009/10 to 2011/12
Contains Ordnance Survey data © Crown copyrightand database right 2013. License No 100049046
Contact: Strategic Intelligence Team, Nov 2013Email: [email protected]
LocalityDashboard_FINAL_V1.1- PW - 2014-01-22: Starting Well ProfilePage 12 of 35

Integrated Strategic Needs Assessment
Cheshire West & Chester Locality Profile Starting Well: Chester
Figures are based on the percentage of primary school age children in Year 6 (aged 10-11 years) recorded as obese in the school years 2009/2010 to 2011/12.
Prevalence of obese children aged 10-11 - national quartiles (2009/10 to 2011/12)
Based on national quartiles from 2009/10-2011/12 MSOA data. Where Quartile 1 is the worst 25% of MSOAs
Contains Ordnance Survey data © Crown copyrightand database right 2013. License No 100049046
Almost one in five Cheshire West and Chester children in school year six were obese in the period 2009/10 to 2011/12. This is higher than the national rate, but not significantly so.
Source: Calculated from National Obesity Observatory Middle Super Output Area (MSOA) data (2009/10 to 2011/12 combined).
Source: HSCIC - Health and Social Care Information Centre Copyright © 2013, Re-used with the permission of the Health and Social Care Information Centre. All rights reserved.Note: "Whisker" lines represent 95% Confidence Intervals (CIs), these indicate the range within which the true value of the indicator has a 95% chance of falling.
In Chester locality 18.5% of children were obese. This is the lowest locality rate within the borough, but not significantly lower than the national rate. MSOA rates within the locality ranged from 13.5% of children in South of Dee MSOA to 25.7% in North Blacon MSOA.
0%
10%
20%
30%
2007/08 2008/09 2009/10 2010/11 2011/12
Perc
enta
ge o
f ch
ildre
n
Percentage of children who are obeseYear 6 trend
England Cheshire West & Chester Chester
0%5%
10%15%20%25%30%35%
Eng
land
Che
shire
Wes
t &C
hest
er Che
ster
Bou
ghto
n H
all &
Hoo
le P
ark
Che
ster
Cen
tre
Che
ster
Hos
pita
l
Che
ster
Sta
tion
Eas
t Hoo
le
Lach
e
New
ton
& U
pton
Nor
th B
laco
n
Sou
th B
laco
n
Sou
th o
f Dee
Perc
enta
ge o
f chi
ldre
n
Middle Super Output Area (MSOA)
Percentage of children who are obeseYear 6 (aged 10-11) 2009/10 to 2010/11
Contact: Strategic Intelligence Team, Nov 2013Email: [email protected]
LocalityDashboard_FINAL_V1.1- PW - 2014-01-22: Starting Well ProfilePage 13 of 35
Integrated Strategic Needs Assessment
Cheshire West & Chester Locality Profile Starting Well: Chester
Education
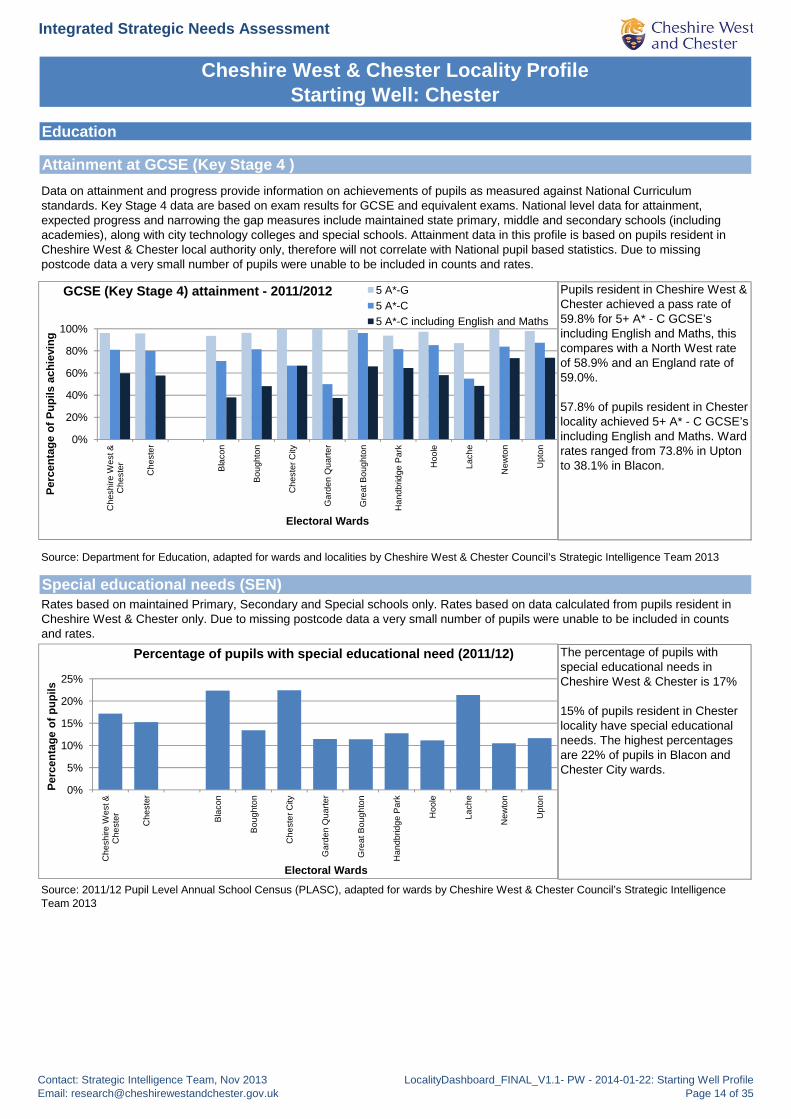
Pupils resident in Cheshire West & Chester achieved a pass rate of 59.8% for 5+ A* - C GCSE’s including English and Maths, this compares with a North West rate of 58.9% and an England rate of 59.0%.
57.8% of pupils resident in Chester locality achieved 5+ A* - C GCSE’s including English and Maths. Ward rates ranged from 73.8% in Upton to 38.1% in Blacon.
Data on attainment and progress provide information on achievements of pupils as measured against National Curriculum standards. Key Stage 4 data are based on exam results for GCSE and equivalent exams. National level data for attainment, expected progress and narrowing the gap measures include maintained state primary, middle and secondary schools (including academies), along with city technology colleges and special schools. Attainment data in this profile is based on pupils resident in Cheshire West & Chester local authority only, therefore will not correlate with National pupil based statistics. Due to missing postcode data a very small number of pupils were unable to be included in counts and rates.
Source: Department for Education, adapted for wards and localities by Cheshire West & Chester Council’s Strategic Intelligence Team 2013
Attainment at GCSE (Key Stage 4 )
0%
20%
40%
60%
80%
100%
Che
shire
Wes
t &C
hest
er Che
ster
Bla
con
Bou
ghto
n
Che
ster
City
Gar
den
Qua
rter
Gre
at B
ough
ton
Han
dbrid
ge P
ark
Hoo
le
Lach
e
New
ton
Upt
on
Perc
enta
ge o
f Pup
ils a
chie
ving
Electoral Wards
GCSE (Key Stage 4) attainment - 2011/2012 5 A*-G5 A*-C5 A*-C including English and Maths
The percentage of pupils with special educational needs in Cheshire West & Chester is 17%
15% of pupils resident in Chester locality have special educational needs. The highest percentages are 22% of pupils in Blacon and Chester City wards.
p , p y g g
Rates based on maintained Primary, Secondary and Special schools only. Rates based on data calculated from pupils resident in Cheshire West & Chester only. Due to missing postcode data a very small number of pupils were unable to be included in counts and rates.
Source: 2011/12 Pupil Level Annual School Census (PLASC), adapted for wards by Cheshire West & Chester Council’s Strategic Intelligence Team 2013
Special educational needs (SEN)
0%
5%
10%
15%
20%
25%
Che
shire
Wes
t &C
hest
er Che
ster
Bla
con
Bou
ghto
n
Che
ster
City
Gar
den
Qua
rter
Gre
at B
ough
ton
Han
dbrid
ge P
ark
Hoo
le
Lach
e
New
ton
Upt
on
Perc
enta
ge o
f pup
ils
Electoral Wards
Percentage of pupils with special educational need (2011/12)
Contact: Strategic Intelligence Team, Nov 2013Email: [email protected]
LocalityDashboard_FINAL_V1.1- PW - 2014-01-22: Starting Well ProfilePage 14 of 35

Integrated Strategic Needs Assessment
Cheshire West & Chester Locality Profile Starting Well: Chester
13% of pupils resident in Cheshire West & Chester are eligible for free school meals.
14% of pupils resident in Chester locality are eligible for free school meals. The highest percentage is 31% of pupils in Lache ward, followed by 26% of pupils in Blacon Ward.
Source: 2011/12 Pupil Level Annual School Census (PLASC), adapted for wards by Cheshire West & Chester Council’s Strategic Intelligence Team 2013
Free school meal provisionRates based on maintained Primary, Secondary and Special schools only. Rates based on data calculated from pupils resident in Cheshire West & Chester only. Due to missing postcode data a very small number of pupils were unable to be included in counts and rates.
0%5%
10%15%20%25%30%35%
Che
shire
Wes
t &C
hest
er Che
ster
Bla
con
Bou
ghto
n
Che
ster
City
Gar
den
Qua
rter
Gre
at B
ough
ton
Han
dbrid
ge P
ark
Hoo
le
Lach
e
New
ton
Upt
on
Perc
enta
ge o
f pup
ils
Electoral Wards
Percentage of pupils eligible for free school meals (2011/12)
Contact: Strategic Intelligence Team, Nov 2013Email: [email protected]
LocalityDashboard_FINAL_V1.1- PW - 2014-01-22: Starting Well ProfilePage 15 of 35
Integrated Strategic Needs Assessment
Cheshire West & Chester Locality Profile Living and Working Well: Chester
Contains Ordnance Survey data © Crown copyrightand database right 2013. License No 100049046
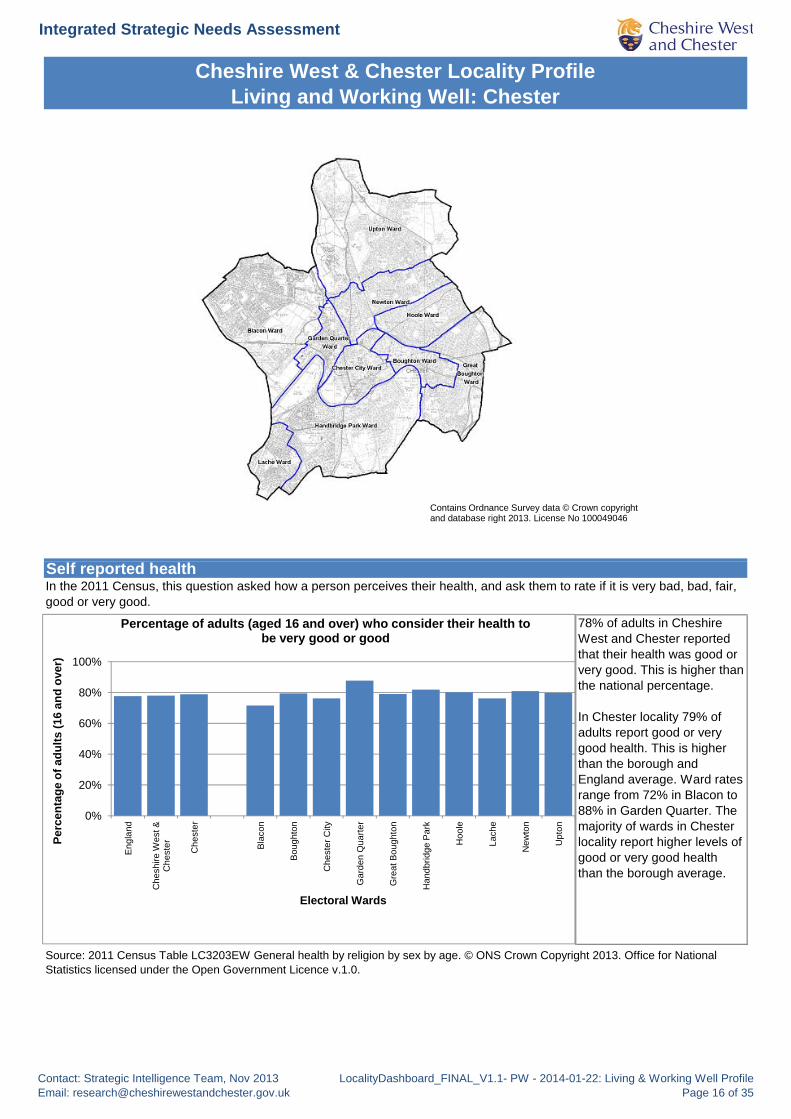
Self reported health
78% of adults in Cheshire West and Chester reported that their health was good or very good. This is higher than the national percentage.
In Chester locality 79% of adults report good or very good health. This is higher than the borough and England average. Ward rates range from 72% in Blacon to 88% in Garden Quarter. The majority of wards in Chester locality report higher levels of good or very good health than the borough average.
Source: 2011 Census Table LC3203EW General health by religion by sex by age. © ONS Crown Copyright 2013. Office for National Statistics licensed under the Open Government Licence v.1.0.
In the 2011 Census, this question asked how a person perceives their health, and ask them to rate if it is very bad, bad, fair, good or very good.
0%
20%
40%
60%
80%
100%
Eng
land
Che
shire
Wes
t &C
hest
er Che
ster
Bla
con
Bou
ghto
n
Che
ster
City
Gar
den
Qua
rter
Gre
at B
ough
ton
Han
dbrid
ge P
ark
Hoo
le
Lach
e
New
ton
Upt
on
Perc
enta
ge o
f adu
lts (1
6 an
d ov
er)
Electoral Wards
Percentage of adults (aged 16 and over) who consider their health to be very good or good
Contact: Strategic Intelligence Team, Nov 2013Email: [email protected]
LocalityDashboard_FINAL_V1.1- PW - 2014-01-22: Living & Working Well Profile Page 16 of 35
Integrated Strategic Needs Assessment
Cheshire West & Chester Locality Profile Living and Working Well: Chester
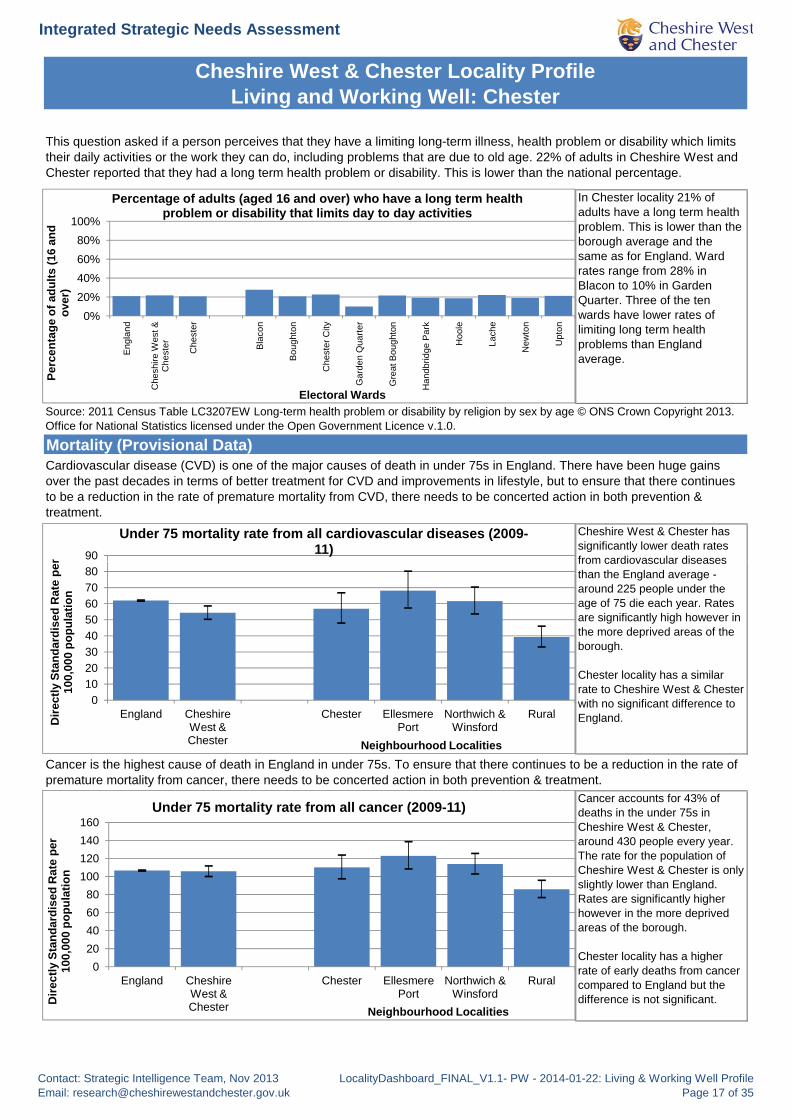
In Chester locality 21% of adults have a long term health problem. This is lower than the borough average and the same as for England. Ward rates range from 28% in Blacon to 10% in Garden Quarter. Three of the ten wards have lower rates of limiting long term health problems than England average.
Mortality (Provisional Data)
Cheshire West & Chester has significantly lower death rates from cardiovascular diseases
Source: 2011 Census Table LC3207EW Long-term health problem or disability by religion by sex by age © ONS Crown Copyright 2013. Office for National Statistics licensed under the Open Government Licence v.1.0.
This question asked if a person perceives that they have a limiting long-term illness, health problem or disability which limits their daily activities or the work they can do, including problems that are due to old age. 22% of adults in Cheshire West and Chester reported that they had a long term health problem or disability. This is lower than the national percentage.
Cardiovascular disease (CVD) is one of the major causes of death in under 75s in England. There have been huge gains over the past decades in terms of better treatment for CVD and improvements in lifestyle, but to ensure that there continues to be a reduction in the rate of premature mortality from CVD, there needs to be concerted action in both prevention & treatment.
90r
Under 75 mortality rate from all cardiovascular diseases (2009-11)
0%20%40%60%80%
100%
Eng
land
Che
shire
Wes
t &C
hest
er Che
ster
Bla
con
Bou
ghto
n
Che
ster
City
Gar
den
Qua
rter
Gre
at B
ough
ton
Han
dbrid
ge P
ark
Hoo
le
Lach
e
New
ton
Upt
on
Perc
enta
ge o
f adu
lts (1
6 an
d ov
er)
Electoral Wards
Percentage of adults (aged 16 and over) who have a long term health problem or disability that limits day to day activities
from cardiovascular diseases than the England average - around 225 people under the age of 75 die each year. Rates are significantly high however in the more deprived areas of the borough.
Chester locality has a similar rate to Cheshire West & Chester with no significant difference to England.
Cancer accounts for 43% of deaths in the under 75s in Cheshire West & Chester, around 430 people every year. The rate for the population of Cheshire West & Chester is only slightly lower than England. Rates are significantly higher however in the more deprived areas of the borough.
Chester locality has a higher rate of early deaths from cancer compared to England but the difference is not significant.
Cancer is the highest cause of death in England in under 75s. To ensure that there continues to be a reduction in the rate of premature mortality from cancer, there needs to be concerted action in both prevention & treatment.
01020304050607080
England Cheshire West &Chester
Chester Ellesmere Port
Northwich & Winsford
RuralDire
ctly
Sta
ndar
dise
d R
ate
per
100,
000
popu
latio
n
Neighbourhood Localities
020406080
100120140160
England Cheshire West &Chester
Chester Ellesmere Port
Northwich & Winsford
Rural
Dire
ctly
Sta
ndar
dise
d R
ate
per
100,
000
popu
latio
n
Neighbourhood Localities
Under 75 mortality rate from all cancer (2009-11)
Contact: Strategic Intelligence Team, Nov 2013Email: [email protected]
LocalityDashboard_FINAL_V1.1- PW - 2014-01-22: Living & Working Well Profile Page 17 of 35

Integrated Strategic Needs Assessment
Cheshire West & Chester Locality Profile Living and Working Well: Chester
Around 60 people under the age of 75 die each year in Cheshire West & Chester from liver disease. Whilst the rate is slightly higher than the England average, the difference is not significant. Rates are significantly higher however in the more deprived areas of the borough.
Chester locality has a similar rate of deaths in under 75s from liver disease to Cheshire West & Chester & to England.
Around 100 people under the age of 75 die each year in Cheshire West and Chester from respiratory disease. Whilst the rate is slightly higher than the England average, the difference is not significant.
Liver disease is one of the top causes of death in England & people are dying from it at younger ages. Most liver disease is preventable and much is influenced by alcohol consumption and obesity prevalence, which are both amenable to public health interventions.
Respiratory disease is one of the top causes of death in England in under 75s and smoking is the major cause of chronic obstructive pulmonary disease (COPD), one of the major respiratory diseases.
0
5
10
15
20
25
30
35
40
England Cheshire West &Chester
Chester Ellesmere Port
Northwich & Winsford
RuralDire
ctly
Sta
ndar
dise
d R
ate
per
100,
000
popu
latio
n
Neighbourhood Localities
Under 75 mortality rate from all liver disease (2009-11)
30354045
ed R
ate
per
latio
n
Under 75 mortality rate from all respiratory disease(2009-11)
Rates are significantly higher however in the more deprived areas of the borough.
Chester locality has a similar rate of deaths in under 75s from respiratory disease to Cheshire West and Chester and to England.
At locality level numbers become even smaller and less meaningful, there is no significant difference in any of the locality rates compared to England.
When suicides are grouped for areas with similar levels of deprivation however, the more deprived areas of the borough have a significantly higher suicide rate than England.
Suicide is a significant cause of death in young adults, and is seen as an indicator of underlying rates of mental ill-health. In Cheshire West and Chester around 30 people die each year as a result of suicide or injury of undetermined intent. Numbers of deaths are relatively small and so care needs to be taken with interpretation. Whilst suicide rates in Cheshire West and Chester are slightly higher than the England average, the difference is not significant.
Source: Office for National Statistics Annual Death Extracts, Office for National Statistics mid-year population estimates 2011. © ONS Crown Copyright 2013. Office for National Statistics licensed under the Open Government Licence v.1.0.Note: "Whisker" lines represent 95% Confidence Intervals (CIs), these indicate the range within which the true value of the indicator has a 95% chance of falling.
05
10152025
England Cheshire West &Chester
Chester Ellesmere Port
Northwich & Winsford
RuralDire
ctly
Sta
ndar
dis
100,
000
popu
Neighbourhood Localities
0
5
10
15
20
England Cheshire West &Chester
Chester Ellesmere Port
Northwich & Winsford
Rural
Dire
ctly
Sta
ndar
dise
d R
ate
per 1
00,0
00
popu
latio
n
Neighbourhood Localities
Suicide rate (2009-11)
Contact: Strategic Intelligence Team, Nov 2013Email: [email protected]
LocalityDashboard_FINAL_V1.1- PW - 2014-01-22: Living & Working Well Profile Page 18 of 35

Integrated Strategic Needs Assessment
Cheshire West & Chester Locality Profile Living and Working Well: Chester
Healthy lifestyle behaviours
The estimated percentage of the population aged 16+ who are obese. Individuals are regarded as obese if they have a body mass index of 30 or more.
The estimated adult obesity rate for Chester locality of 20.2% is significantly better than the England rate of 24.1%.
The estimated percentage of the population aged 16+ that eat healthily. Healthy eating is defined as those who consume 5 or more portions of fruit and vegetables per day. A portion of fruit or vegetables is defined as an 80g serving.
The estimated rate for
0%5%
10%15%20%25%30%35%
Eng
land
Che
shire
Wes
t &C
hest
er Che
ster
Bou
ghto
n H
all &
Hoo
le P
ark
Che
ster
Cen
tre
Che
ster
Hos
pita
l
Che
ster
Sta
tion
East
Hoo
le
Lach
e
New
ton
& U
pton
Nor
th B
laco
n
Sou
th B
laco
n
Sou
th o
f Dee
Estim
ated
Pre
vale
nce
(%)
Middle Super Output Area
Obesity prevalence in adults (2006-08)
0%5%
10%15%20%25%30%35%40%
and
st &
ster ll &
k ntre
pita
l
tion
oole
che
pton co
n
con
Deem
ated
Pre
vale
nce
(%)
Healthy eating (5-a-day) prevalence in adults (2006-08)
The estimated rate for Chester locality of 28.8% is not significantly different to the England rate of 28.7%.
The estimated percentage of the population aged 16+ who are current smokers. Individuals are regarded as smokers if they described themselves as "current cigarette smokers" in the Health Survey for England.
The estimated smoking rate for Chester locality of 21.0% is significantly better than that of the England rate of 22.2%.
Source: Healthy Lifestyle Behaviours: Model Based Estimates for MSOAs. © ONS Crown Copyright 2013. Office for National Statistics licensed under the Open Government Licence v.1.0.Note: "Whisker" lines represent 95% Confidence Intervals (CIs), these indicate the range within which the true value of the indicator has a 95% chance of falling.
0%5%
10%15%20%25%30%35%40%45%
Eng
land
Che
shire
Wes
t &C
hest
er Che
ster
Bou
ghto
n H
all &
Hoo
le P
ark
Che
ster
Cen
tre
Che
ster
Hos
pita
l
Che
ster
Sta
tion
Eas
t Hoo
le
Lach
e
New
ton
& U
pton
Nor
th B
laco
n
Sou
th B
laco
n
Sou
th o
f Dee
Estim
ated
Pre
vale
nce
(%)
Middle Super Output Area
Smoking prevalence in adults (2006-08)
Eng
la
Che
shire
Wes
Che
ster Che
s
Bou
ghto
n H
aH
oole
Par
k
Che
ster
Cen
Che
ster
Hos
p
Che
ster
Sta
t
Eas
t Ho
Lac
New
ton
& U
p
Nor
th B
lac
Sou
th B
lac
Sou
th o
f D
Esti
Middle Super Output Area
Contact: Strategic Intelligence Team, Nov 2013Email: [email protected]
LocalityDashboard_FINAL_V1.1- PW - 2014-01-22: Living & Working Well Profile Page 19 of 35

Integrated Strategic Needs Assessment
Cheshire West & Chester Locality Profile Living and Working Well: Chester
Alcohol consumption
The estimated binge drinking rate for Chester locality of 27.1% is significantly worse than the England rate of 20.0%.
The estimated percentage of the population aged 16+ that binge drink. Binge drinking in adults is defined separately for men and women. Men are defined as having indulged in binge drinking if they had consumed 8 or more units of alcohol on the heaviest drinking day in the previous seven days; for women the cut-off was 6 or more units of alcohol.
Source: Healthy Lifestyle Behaviours: Model Based Estimates for MSOAs. © ONS Crown Copyright 2013. Office for National Statistics licensed under the Open Government Licence v.1.0.Note: "Whisker" lines represent 95% Confidence Intervals (CIs), these indicate the range within which the true value of the indicator has a 95% chance of falling.
Drinkers aged 25 and over who are drinking at increasing or higher risk levels for a sustained period of time are most likely to suffer long-term alcohol-related illness or death. Increasing risk drinkers (who are at an increasing risk of alcohol-related illness) are defined as men who regularly drink more than 3 to 4 units a day or women who regularly drink more than 2 to 3 units a day but less than the higher risk levels. Higher
0%5%
10%15%20%25%30%35%40%45%50%
Eng
land
Che
shire
Wes
t &C
hest
er Che
ster
Bou
ghto
n H
all &
Hoo
le P
ark
Che
ster
Cen
tre
Che
ster
Hos
pita
l
Che
ster
Sta
tion
East
Hoo
le
Lach
e
New
ton
& U
pton
Nor
th B
laco
n
Sou
th B
laco
n
Sou
th o
f Dee
Estim
ated
Pre
vale
nce
(%)
Middle Super Output Area
Binge drinking prevalence in adults (2006-08)
In Cheshire West and Chester 33% of adults are classed as increasing or higher risk drinkers, this is compared to 39% nationally.
36% of adults in Chester locality are increasing or higher risk drinkers, lower than nationally. This ranges from 72% in Blacon ward to 6% in Great Boughton ward. The highest proportion of increasing risk drinkers are in Blacon ward (50%) whilst the highest proportion of higher risk drinkers are in Lache ward (22%).
Source: Alcohol Harm Segmentation Tool, Alcohol Learning Centre © Crown Copyright 2013.
than 3 to 4 units a day or women who regularly drink more than 2 to 3 units a day but less than the higher risk levels. Higher risk drinkers (who have a high risk of alcohol-related illness) are defined as men who regularly drink more than 8 units a day or more than 50 units of alcohol per week or women who regularly drink more than 6 units a day or more than 35 units of alcohol per week.
The alcohol learning centre has developed a social marketing tool which classifies each postcode in the country as one where the majority of adults are classed as lower, increasing or higher risk drinkers.
0%
20%
40%
60%
80%
Eng
land
Che
shire
Wes
t &C
hest
er Che
ster
Bla
con
Bou
ghto
n
Che
ster
City
Gar
den
Qua
rter
Gre
at B
ough
ton
Han
dbrid
ge P
ark
Hoo
le
Lach
e
New
ton
Upt
onPerc
enta
ge o
f pop
ulat
ion
aged
16+
Electoral Wards
Percentage of population by alcohol harm segment Medium % High %
Contact: Strategic Intelligence Team, Nov 2013Email: [email protected]
LocalityDashboard_FINAL_V1.1- PW - 2014-01-22: Living & Working Well Profile Page 20 of 35

Integrated Strategic Needs Assessment
Cheshire West & Chester Locality Profile Living and Working Well: Chester
Hospital admissions
Alcohol
The rate in Chester locality is higher than England but not significantly so. Four wards are significantly higher, whilst a further four are significantly lower than England. Chester City ward has the highest rate, Great Boughton ward has the lowest.
Alcohol Attributable Fractions (AAFs) are used to express the extent to which alcohol contributes to a health outcome, such as alcohol poisoning, non-alcohol poisoning, road traffic injuries, falls, drowning, violence, and other unintentional or intentional injuries. The sum of AAFs for relevant admissions gives a proxy for the number of whole admissions which can be attributed to alcohol. The local rate of hospital admissions due to alcohol harm is significantly lower than the national rate.
0500
1,0001,5002,0002,5003,0003,5004,0004,5005,000
Eng
land
Che
shire
Wes
t &C
hest
er Che
ster
Bla
con
Bou
ghto
n
Che
ster
City
Gar
den
Qua
rter
Gre
at B
ough
ton
Han
dbrid
ge P
ark
Hoo
le
Lach
e
New
ton
Upt
on
Dire
ctly
Sta
ndar
dise
d R
ate
per
100,
000
peop
le
Electoral Wards
Alcohol attributable hospital admissions (2012/13) Provisional Data
2 000
2,500
Rat
e e
Alcohol attributable hospital admissions - 2012/13 monthly trend Provisional Data
Source: Hospital Episode Statistics, NHS Information Centre. Office for National Statistics mid-year population estimates 2011. © ONS Crown Copyright 2013. Office for National Statistics licensed under the Open Government Licence v.1.0Note: "Whisker" lines represent 95% Confidence Intervals (CIs), these indicate the range within which the true value of the indicator has a 95% chance of falling.
0
500
1,000
1,500
2,000
Apr-12 May-12 Jun-12 Jul-12 Aug-12 Sep-12 Oct-12 Nov-12 Dec-12 Jan-13 Feb-13 Mar-13
Dire
ctly
Sta
ndar
dise
d pe
r 100
,000
peo
ple
Cheshire West & Chester Chester
Contact: Strategic Intelligence Team, Nov 2013Email: [email protected]
LocalityDashboard_FINAL_V1.1- PW - 2014-01-22: Living & Working Well Profile Page 21 of 35

Integrated Strategic Needs Assessment
Cheshire West & Chester Locality Profile Living and Working Well: Chester
Economic activity and unemployment
In Cheshire West and Chester 29.8% of people aged 16-74 were economically inactive on census day. This is lower than the England average of 30.1%
In Chester locality 30% of people were economically inactive, lower than the borough and England figures. Within Chester, Hoole ward had the lowest levels of economic inactivity (23.7%) and Garden Quarter the highest (36.7%).
In Cheshire West and Chester 3.3% of people aged 16-74 were unemployed on census day. This is lower than in England where 4% were unemployed.
A person aged 16 to 74 is described as economically inactive if they are not in employment but do not meet the criteria to be classified as 'Unemployed'. This includes those looking for work but not available to start work, as well as anyone not looking for work, or unable to work - for example retired, looking after home/family, permanently sick or disabled.
A person is classified as unemployed if they are not in employment, are available to start work in the next two weeks, and either looked for work in the last four weeks or are waiting to start a new job.
0%5%
10%15%20%25%30%35%40%
Eng
land
Che
shire
Wes
t &C
hest
er Che
ster
Bla
con
Bou
ghto
n
Che
ster
City
Gar
den
Qua
rter
Gre
at B
ough
ton
Han
dbrid
ge P
ark
Hoo
le
Lach
e
New
ton
Upt
on
Perc
enta
ge o
f adu
lts (1
6 to
74)
Electoral Wards
Percentage of adults (aged 16 to 74) who are economically inactive
4.0%
5.0%
6.0%
6 an
d ov
er)
Percentage of adults (aged 16 and over) who are unemployed
In Chester locality 3.3% of people were unemployed at the time of the 2011 Census. Within Chester, Great Boughton ward had the lowest levels of unemployment (2.1%) and Blacon the highest (4.9%).
In Cheshire West and Chester 7.1% of people aged 16-24 were unemployed on census day. This is lower than in England where 7.5% were unemployed.
Chester locality had the lowest percentage of unemployed young people in the Borough (5.2%). Within Chester, Garden Quarter ward had the lowest levels of youth unemployment (1.9%) and Blacon the highest (9.9%).
Source: 2011 Census Table DC6201EW Economic activity by ethnic group by sex by age. © ONS Crown Copyright 2013. Office for National Statistics licensed under the Open Government Licence v.1.0.
Source: 2011 Census Table LC6302EW Economic activity by hours worked by long-term health problem or disability. © ONS Crown Copyright 2013. Office for National Statistics licensed under the Open Government Licence v.1.0.
0.0%
1.0%
2.0%
3.0%
Eng
land
Che
shire
Wes
t &C
hest
er Che
ster
Bla
con
Bou
ghto
n
Che
ster
City
Gar
den
Qua
rter
Gre
at B
ough
ton
Han
dbrid
ge P
ark
Hoo
le
Lach
e
New
ton
Upt
on
Perc
enta
ge o
f adu
lts (1
6
Electoral Wards
0%2%4%6%8%
10%12%
Eng
land
Che
shire
Wes
t &C
hest
er Che
ster
Bla
con
Bou
ghto
n
Che
ster
City
Gar
den
Qua
rter
Gre
at B
ough
ton
Han
dbrid
ge P
ark
Hoo
le
Lach
e
New
ton
Upt
on
Perc
enta
ge o
f you
ng p
eopl
e (1
6-24
)
Electoral Wards
Percentage of young people (aged 16 to 24) who are unemployed
Contact: Strategic Intelligence Team, Nov 2013Email: [email protected]
LocalityDashboard_FINAL_V1.1- PW - 2014-01-22: Living & Working Well Profile Page 22 of 35
Integrated Strategic Needs Assessment
Cheshire West & Chester Locality Profile Living and Working Well: Chester
Business counts
Enterprise count (overall businesses) & unit count (workplaces)
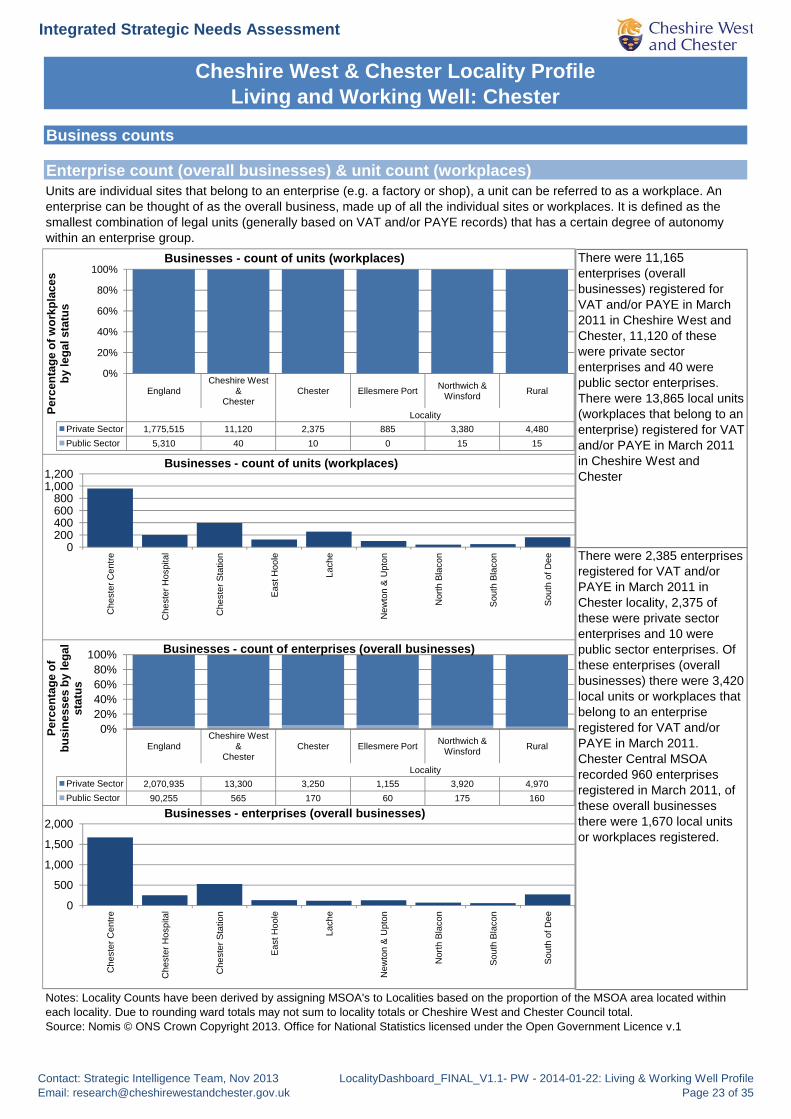
There were 11,165 enterprises (overall businesses) registered for VAT and/or PAYE in March 2011 in Cheshire West and Chester, 11,120 of these were private sector enterprises and 40 were public sector enterprises.There were 13,865 local units (workplaces that belong to an enterprise) registered for VAT and/or PAYE in March 2011 in Cheshire West and Chester
There were 2,385 enterprises
Units are individual sites that belong to an enterprise (e.g. a factory or shop), a unit can be referred to as a workplace. An enterprise can be thought of as the overall business, made up of all the individual sites or workplaces. It is defined as the smallest combination of legal units (generally based on VAT and/or PAYE records) that has a certain degree of autonomy within an enterprise group.
0200400600800
1,0001,200
tre tal
on ole he on on on ee
Businesses - count of units (workplaces)
EnglandCheshire West
&Chester
Chester Ellesmere Port Northwich & Winsford Rural
LocalityPrivate Sector 1,775,515 11,120 2,375 885 3,380 4,480Public Sector 5,310 40 10 0 15 15
0%
20%
40%
60%
80%
100%
Perc
enta
ge o
f wor
kpla
ces
by le
gal s
tatu
s
Businesses - count of units (workplaces)
pregistered for VAT and/or PAYE in March 2011 in Chester locality, 2,375 of these were private sector enterprises and 10 were public sector enterprises. Of these enterprises (overall businesses) there were 3,420 local units or workplaces that belong to an enterprise registered for VAT and/or PAYE in March 2011. Chester Central MSOA recorded 960 enterprises registered in March 2011, of these overall businesses there were 1,670 local units or workplaces registered.
Notes: Locality Counts have been derived by assigning MSOA's to Localities based on the proportion of the MSOA area located within each locality. Due to rounding ward totals may not sum to locality totals or Cheshire West and Chester Council total. Source: Nomis © ONS Crown Copyright 2013. Office for National Statistics licensed under the Open Government Licence v.1
0
500
1,000
1,500
2,000
Che
ster
Cen
tre
Che
ster
Hos
pita
l
Che
ster
Sta
tion
Eas
t Hoo
le
Lach
e
New
ton
& U
pton
Nor
th B
laco
n
Sou
th B
laco
n
Sou
th o
f Dee
Businesses - enterprises (overall businesses)
Che
ster
Cen
t
Che
ster
Hos
pit
Che
ster
Sta
tio
East
Hoo
Lach
New
ton
& U
pto
Nor
th B
laco
Sou
th B
laco
Sou
th o
f De
EnglandCheshire West
&Chester
Chester Ellesmere Port Northwich & Winsford Rural
LocalityPrivate Sector 2,070,935 13,300 3,250 1,155 3,920 4,970Public Sector 90,255 565 170 60 175 160
0%20%40%60%80%
100%
Perc
enta
ge o
f bu
sine
sses
by
lega
l st
atus
Businesses - count of enterprises (overall businesses)
Contact: Strategic Intelligence Team, Nov 2013Email: [email protected]
LocalityDashboard_FINAL_V1.1- PW - 2014-01-22: Living & Working Well Profile Page 23 of 35

Integrated Strategic Needs Assessment
Cheshire West & Chester Locality Profile Living and Working Well: Chester
Skills & qualifications
In England 22.5% of people aged 16+ do not have any qualifications, compared to 21.0% in Cheshire West & Chester.
Within Chester locality, 19.5% of adults do not have any qualifications. The ward with the highest percentage of unqualified people is Blacon (32.3%), the lowest percentage is Garden Quarter (7.5%).
In Cheshire West & Chester 36.4% of adults have a level 3 or higher qualification, compared to 32.7% in England.
Level 3 qualifications or above include A Levels, BTEC Diplomas, HND or a foundation degree, or a bachelors degree or higher.
Source: 2011 Census Table QS501EW Highest Level of Qualification. © ONS Crown Copyright 2013. Office for National Statistics licensed under the Open Government Licence v.1.0.
0%5%
10%15%20%25%30%35%
Eng
land
Che
shire
Wes
t &C
hest
er Che
ster
Bla
con
Bou
ghto
n
Che
ster
City
Gar
den
Qua
rter
Gre
at B
ough
ton
Han
dbrid
ge P
ark
Hoo
le
Lach
e
New
ton
Upt
on
Perc
enta
ge o
f adu
lts
(16
and
over
)
Electoral Wards
Percentage of adults (aged 16 and over) who have no qualifications
40%50%60%
f adu
ltsve
r)
Percentage of adults (aged 16 and over) who have a level 3 or above qualification
Within Chester locality, 39% of adults have Level 3+ qualifications. The ward with the highest percentage is Handbridge Park (49.7%), the lowest percentage is Blacon (20.2%).
Source: 2011 Census Table QS501EW Highest Level of Qualification. © ONS Crown Copyright 2013. Office for National Statistics licensed under the Open Government Licence v.1.0.
0%10%20%30%40%
Eng
land
Che
shire
Wes
t &C
hest
er Che
ster
Bla
con
Bou
ghto
n
Che
ster
City
Gar
den
Qua
rter
Gre
at B
ough
ton
Han
dbrid
ge P
ark
Hoo
le
Lach
e
New
ton
Upt
on
Perc
enta
ge o
f(1
6 an
d ov
Electoral Wards
Contact: Strategic Intelligence Team, Nov 2013Email: [email protected]
LocalityDashboard_FINAL_V1.1- PW - 2014-01-22: Living & Working Well Profile Page 24 of 35

Integrated Strategic Needs Assessment
Cheshire West & Chester Locality Profile Living and Working Well: Chester
Working age benefit claimants
050
100150200250300350400450500
Eng
land
Che
shire
Wes
t &C
hest
er
Che
ster
Med
ian
Sou
th
Bla
con
L5
Sou
th
Bla
con
L4
Che
ster
S
tatio
n L2
Che
ster
C
entra
l L1
Lach
e P
ark
L1
Rat
e pe
r 1,0
00 p
eopl
eag
ed 1
6-64
Five HIGHEST LSOAs in Locality
People aged 16-64 who claim key benefits (as of November 2012)
50
100
150
200
Rat
e pe
r 1,0
00 p
eopl
eag
ed 1
6-64
People aged 16-64 who claim key benefits
Source: DWP Tabulation Tool, Working Age Client Group Data. Licensed under the Open Government Licence v.1.0.Note: "Whisker" lines represent 95% Confidence Intervals (CIs), these indicate the range within which the true value of the indicator has a 95% chance of falling.
0May-01 May-02 May-03 May-04 May-05 May-06 May-07 May-08 May-09 May-10 May-11 May-12 May-13
England Cheshire West & Chester Chester Median
Contact: Strategic Intelligence Team, Nov 2013Email: [email protected]
LocalityDashboard_FINAL_V1.1- PW - 2014-01-22: Living & Working Well Profile Page 25 of 35

Integrated Strategic Needs Assessment
Cheshire West & Chester Locality Profile Living and Working Well: Chester
Claimants of job seekers allowance
0%2%4%6%8%
10%12%14%
Eng
land
Che
shire
Wes
t &C
hest
er
Che
ster
Med
ian
Sou
th
Bla
con
L4
Sou
th
Bla
con
L5
Che
ster
C
entra
l L1
Che
ster
S
tatio
n L2
Upt
on &
W
estle
a L1
Perc
enta
ge o
f peo
ple
aged
16-
64
Five HIGHEST LSOAs in Locality
People aged 16-64 who claim job seekers allowance
0.0%
1.0%
2.0%
3.0%
4.0%
May-01 May-02 May-03 May-04 May-05 May-06 May-07 May-08 May-09 May-10 May-11 May-12 May-13
Perc
enta
ge o
f peo
ple
aged
16-
64
People aged 16-64 who claim job seekers allowance
England Cheshire West & Chester Chester MedianSource: DWP Tabulation Tool, Working Age Client Group Data. Licensed under the Open Government Licence v.1.0.Note: "Whisker" lines represent 95% Confidence Intervals (CIs), these indicate the range within which the true value of the indicator has a 95% chance of falling.
England Cheshire West & Chester Chester Median
Contact: Strategic Intelligence Team, Nov 2013Email: [email protected]
LocalityDashboard_FINAL_V1.1- PW - 2014-01-22: Living & Working Well Profile Page 26 of 35
Integrated Strategic Needs Assessment
Cheshire West & Chester Locality Profile Living and Working Well: Chester
Crime
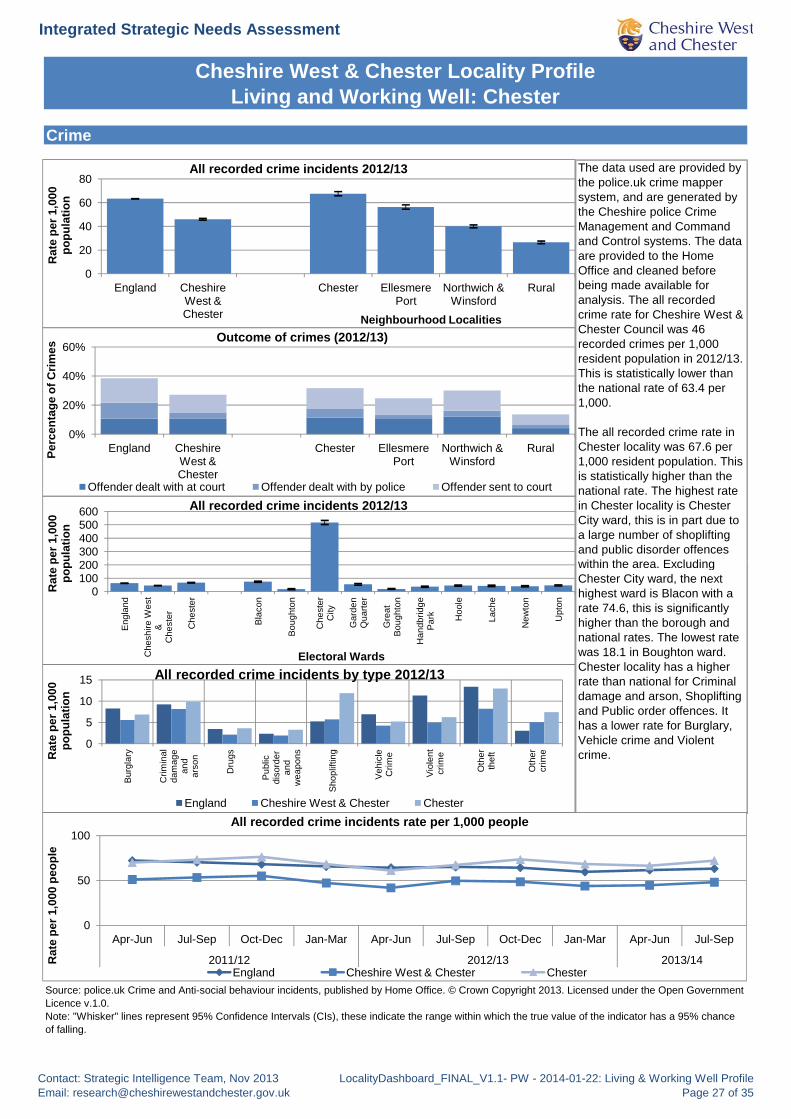
The data used are provided by the police.uk crime mapper system, and are generated by the Cheshire police Crime Management and Command and Control systems. The data are provided to the Home Office and cleaned before being made available for analysis. The all recorded crime rate for Cheshire West & Chester Council was 46 recorded crimes per 1,000 resident population in 2012/13. This is statistically lower than the national rate of 63.4 per 1,000.
The all recorded crime rate in Chester locality was 67.6 per 1,000 resident population. This is statistically higher than the national rate. The highest rate in Chester locality is Chester City ward, this is in part due to a large number of shoplifting and public disorder offences
ithi th E l di
0
20
40
60
80
England Cheshire West & Chester
Chester Ellesmere Port
Northwich & Winsford
Rural
Rat
e pe
r 1,0
00
popu
latio
n
Neighbourhood Localities
All recorded crime incidents 2012/13
200300400500600
per 1
,000
ul
atio
n
All recorded crime incidents 2012/13
0%
20%
40%
60%
England Cheshire West &Chester
Chester Ellesmere Port
Northwich & Winsford
RuralPerc
enta
ge o
f Crim
es
Outcome of crimes (2012/13)
Offender dealt with at court Offender dealt with by police Offender sent to court
Source: police.uk Crime and Anti-social behaviour incidents, published by Home Office. © Crown Copyright 2013. Licensed under the Open Government Licence v.1.0.Note: "Whisker" lines represent 95% Confidence Intervals (CIs), these indicate the range within which the true value of the indicator has a 95% chance of falling.
within the area. Excluding Chester City ward, the next highest ward is Blacon with a rate 74.6, this is significantly higher than the borough and national rates. The lowest rate was 18.1 in Boughton ward. Chester locality has a higher rate than national for Criminal damage and arson, Shoplifting and Public order offences. It has a lower rate for Burglary, Vehicle crime and Violent crime.
0
50
100
Apr-Jun Jul-Sep Oct-Dec Jan-Mar Apr-Jun Jul-Sep Oct-Dec Jan-Mar Apr-Jun Jul-Sep
2011/12 2012/13 2013/14Rat
e pe
r 1,0
00 p
eopl
e
All recorded crime incidents rate per 1,000 people
England Cheshire West & Chester Chester
0
5
10
15
Bur
glar
y
Crim
inal
dam
age
and
arso
n
Dru
gs
Pub
licdi
sord
eran
dw
eapo
ns
Sho
plift
ing
Veh
icle
Crim
e
Vio
lent
crim
e
Oth
erth
eft
Oth
ercr
imeRat
e pe
r 1,0
00
popu
latio
n
All recorded crime incidents by type 2012/13
England Cheshire West & Chester Chester
0100200
Eng
land
Che
shire
Wes
t &
Che
ster
Che
ster
Bla
con
Bou
ghto
n
Che
ster
City
Gar
den
Qua
rter
Gre
atB
ough
ton
Han
dbrid
geP
ark Hoo
le
Lach
e
New
ton
Upt
on
Rat
e p
pop
Electoral Wards
Contact: Strategic Intelligence Team, Nov 2013Email: [email protected]
LocalityDashboard_FINAL_V1.1- PW - 2014-01-22: Living & Working Well Profile Page 27 of 35

Integrated Strategic Needs Assessment
Cheshire West & Chester Locality Profile Living and Working Well: Chester
Deliberate fire incidents (2012/13)
In Chester locality there were 86 deliberate fires, 14% of which were primary fires, this was the smallest proportion of deliberate primary fires in the borough. The overall deliberate fire rate of 11.4 per 10,000 people was lower than the borough rate. There has been a fall of 39% in the overall number of deliberate fires in the Chester locality, the lowest fall in the borough. The number of deliberate primary fires fell by 71%, faster than in any other locality.
In 2012/13 there were 418 deliberate fires in Cheshire West and Chester. 83 (19%) were classified as Primary Fires, these are large fires that affect dwellings, non domestic buildings, vehicles, refuse containers or are large grass fires. The overall deliberate fire rate was 12.7 per 10,000 people. There has been an overall fall in the number of deliberate fires of 50% between 2009/10 and 2012/13. Primary fires have fallen faster than secondary fires, though both have shown a decrease.
0
10
20
30
2009/10 2010/11 2011/12 2012/13
Rat
e pe
r 10,
000
popu
latio
n
Trend of deliberate fire incidents
0
5
10
15
20
Cheshire West & Chester
Chester Ellesmere Port Northwich & Winsford
Rural
Rat
e pe
r 10,
000
popu
latio
n
Neighbourhood Localities
Deliberate fire incident rate 2012/13
Deliberate Primary Fires Deliberate Secondary (Small) Fires
Source: Cheshire Fire & Rescue Service, Fire Incident Data (2012/13)
Number of Fire Incidents (2010/11 to 2012/13)
Source: Cheshire Fire & Rescue Service, Fire Incident Data (2009-2013)
2009/10 2010/11 2011/12 2012/13Cheshire West & Chester Chester
Contains Ordnance Survey data © Crown copyright
Contact: Strategic Intelligence Team, Nov 2013Email: [email protected]
LocalityDashboard_FINAL_V1.1- PW - 2014-01-22: Living & Working Well Profile Page 28 of 35

Integrated Strategic Needs Assessment
Cheshire West & Chester Locality Profile Living and Working Well: Chester
House prices
The median price for a house in Cheshire West and Chester was £160,000 in 2012/13. This is £20,000 lower than the national median.
The median price for a property in Chester locality is £165,000. This is 3% higher than the borough median but 8% lower than the national.
The median price for a semi detached house is £181,000 which is 10% higher than the national median. Properties are cheapest in Blacon ward, where and a terraced house costs £91,500. The highest median price for a semi detached house was £231,000 in Boughton ward.
£0
£100,000
£200,000
£300,000
Eng
land
Che
shire
Wes
t &C
hest
er Che
ster
Bla
con
Bou
ghto
n
Che
ster
City
Gar
den
Qua
rter
Gre
at B
ough
ton
Han
dbrid
ge P
ark
Hoo
le
Lach
e
New
ton
Upt
on
Electoral Wards
Median house price by ward (2012/13)
£50,000
£100,000
£150,000
£200,000
£250,000
£300,000Median house price by type - 2012/13
£231,000 in Boughton ward.
Source: Price Paid Data, Land Registry. © Crown Copyright 2013. Licensed under the Open Government Licence v.1.0.
£0All Detached Semi Detached Terraced
England Cheshire West & Chester Chester
£0
£50,000
£100,000
£150,000
£200,000
Jul-S
ep
Oct
-Dec
Jan-
Mar
Apr-
Jun
Jul-S
ep
Oct
-Dec
Jan-
Mar
Apr-
Jun
Jul-S
ep
Oct
-Dec
Jan-
Mar
Apr-
Jun
Jul-S
ep
Oct
-Dec
Jan-
Mar
Apr-
Jun
Jul-S
ep
2009/10 2010/11 2011/12 2012/13 2013/14
Median house price trend
England Cheshire West & Chester Chester
Contact: Strategic Intelligence Team, Nov 2013Email: [email protected]
LocalityDashboard_FINAL_V1.1- PW - 2014-01-22: Living & Working Well Profile Page 29 of 35

Integrated Strategic Needs Assessment
Cheshire West & Chester Locality Profile Living and Working Well: Chester
Warm homes
Fuel poverty
Energy consumption
A household is in fuel poverty if, in order to maintain a satisfactory heating regime, it needs to spend more than 10% of its income on all household fuel use.
Source: Fuel Poverty Index 2011, Department for Energy and Climate Change (DECC)Note: "Whisker" lines represent 95% Confidence Intervals (CIs), these indicate the range within which the true value of the indicator has a 95% chance of falling.
0%
5%
10%
15%
20%
25%
Eng
land
Che
shire
Wes
t &C
hest
er Che
ster
Bou
ghto
n H
all &
Hoo
le P
ark
Che
ster
Cen
tre
Che
ster
Hos
pita
l
Che
ster
Sta
tion
East
Hoo
le
Lach
e
New
ton
& U
pton
Nor
th B
laco
n
Sou
th B
laco
n
Sou
th o
f Dee
Perc
enta
ge o
f Hou
seho
lds
in
Fuel
Pov
erty
Middle Super Output Area (MSOA)
Fuel poverty (10% definition)
16 00018,000tt
Average household gas consumption (KWh/year)
Source: Domestic Energy Consumption (2005-2011), Neighbourhood Statistics. © Crown Copyright 2013. Licensed under the Open Government Licence v.1.0.
02,0004,0006,0008,000
10,00012,00014,00016,000
Eng
land
Che
shire
Wes
t &C
hest
er Che
ster
Bou
ghto
n H
all &
Hoo
le P
ark
Che
ster
Cen
tre
Che
ster
Hos
pita
l
Che
ster
Sta
tion
East
Hoo
le
Lach
e
New
ton
& U
pton
Nor
th B
laco
n
Sou
th B
laco
n
Sou
th o
f Dee
Gas
Con
sum
ptio
n in
Kilo
wa
Hou
rs p
er y
ear
Middle Super Output Area (MSOA)
3,000
3,200
3,400
3,600
3,800
4,000
4,200
Eng
land
Che
shire
Wes
t &C
hest
er Che
ster
Bou
ghto
n H
all &
Hoo
le P
ark
Che
ster
Cen
tre
Che
ster
Hos
pita
l
Che
ster
Sta
tion
Eas
t Hoo
le
Lach
e
New
ton
& U
pton
Nor
th B
laco
n
Sou
th B
laco
n
Sou
th o
f Dee
Elec
tric
ity C
onsu
mpt
ion
in
Kilo
wat
t Hou
rs p
er y
ear
Middle Super Output Area (MSOA)
Average household electricity consumption (KWh/year)
Contact: Strategic Intelligence Team, Nov 2013Email: [email protected]
LocalityDashboard_FINAL_V1.1- PW - 2014-01-22: Living & Working Well Profile Page 30 of 35
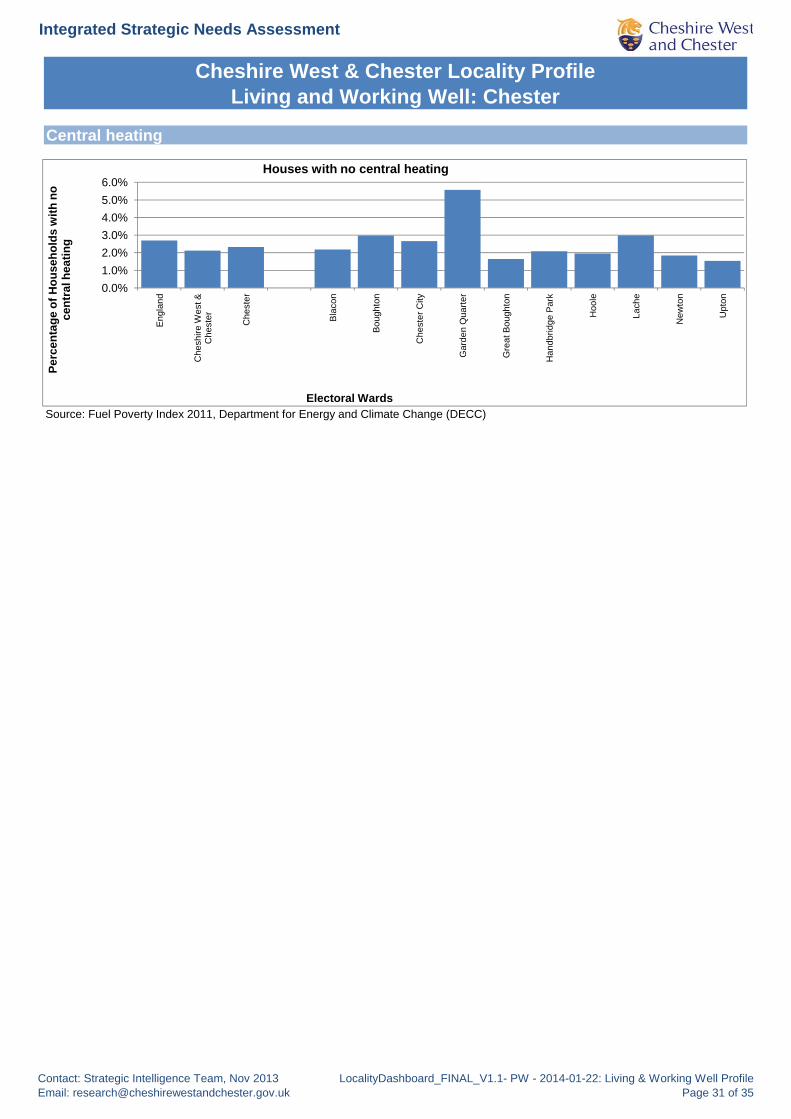
Integrated Strategic Needs Assessment
Cheshire West & Chester Locality Profile Living and Working Well: Chester
Central heating
Source: Fuel Poverty Index 2011, Department for Energy and Climate Change (DECC)
0.0%1.0%2.0%3.0%4.0%5.0%6.0%
Eng
land
Che
shire
Wes
t &C
hest
er Che
ster
Bla
con
Bou
ghto
n
Che
ster
City
Gar
den
Qua
rter
Gre
at B
ough
ton
Han
dbrid
ge P
ark
Hoo
le
Lach
e
New
ton
Upt
on
Perc
enta
ge o
f Hou
seho
lds
with
no
cent
ral h
eatin
g
Electoral Wards
Houses with no central heating
Contact: Strategic Intelligence Team, Nov 2013Email: [email protected]
LocalityDashboard_FINAL_V1.1- PW - 2014-01-22: Living & Working Well Profile Page 31 of 35
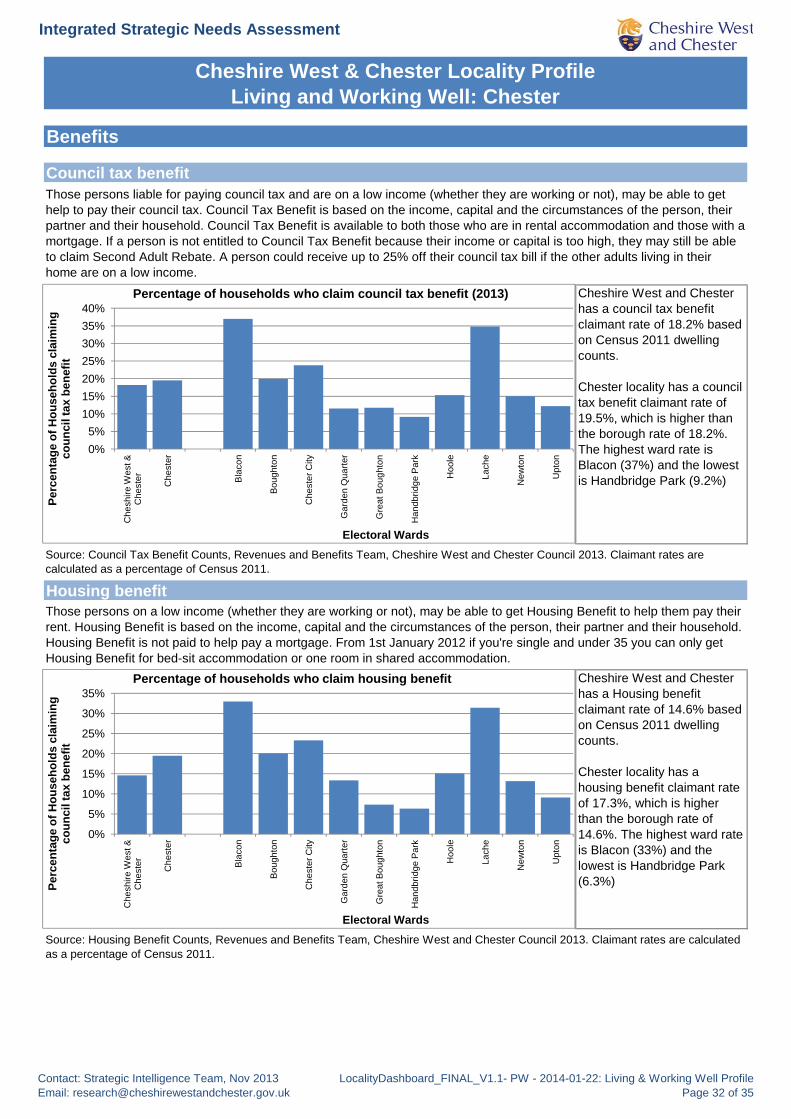
Integrated Strategic Needs Assessment
Cheshire West & Chester Locality Profile Living and Working Well: Chester
Benefits
Council tax benefit
Cheshire West and Chester has a council tax benefit claimant rate of 18.2% based on Census 2011 dwelling counts.
Chester locality has a council tax benefit claimant rate of 19.5%, which is higher than the borough rate of 18.2%. The highest ward rate is Blacon (37%) and the lowest is Handbridge Park (9.2%)
Source: Council Tax Benefit Counts, Revenues and Benefits Team, Cheshire West and Chester Council 2013. Claimant rates are
Those persons liable for paying council tax and are on a low income (whether they are working or not), may be able to get help to pay their council tax. Council Tax Benefit is based on the income, capital and the circumstances of the person, their partner and their household. Council Tax Benefit is available to both those who are in rental accommodation and those with a mortgage. If a person is not entitled to Council Tax Benefit because their income or capital is too high, they may still be able to claim Second Adult Rebate. A person could receive up to 25% off their council tax bill if the other adults living in their home are on a low income.
0%5%
10%15%20%25%30%35%40%
Che
shire
Wes
t &C
hest
er Che
ster
Bla
con
Bou
ghto
n
Che
ster
City
Gar
den
Qua
rter
Gre
at B
ough
ton
Han
dbrid
ge P
ark
Hoo
le
Lach
e
New
ton
Upt
on
Perc
enta
ge o
f Hou
seho
lds
clai
min
g co
unci
l tax
ben
efit
Electoral Wards
Percentage of households who claim council tax benefit (2013)
Housing benefit
Cheshire West and Chester has a Housing benefit claimant rate of 14.6% based on Census 2011 dwelling counts.
Chester locality has a housing benefit claimant rate of 17.3%, which is higher than the borough rate of 14.6%. The highest ward rate is Blacon (33%) and the lowest is Handbridge Park (6.3%)
Source: Housing Benefit Counts, Revenues and Benefits Team, Cheshire West and Chester Council 2013. Claimant rates are calculated as a percentage of Census 2011.
calculated as a percentage of Census 2011.
Those persons on a low income (whether they are working or not), may be able to get Housing Benefit to help them pay their rent. Housing Benefit is based on the income, capital and the circumstances of the person, their partner and their household. Housing Benefit is not paid to help pay a mortgage. From 1st January 2012 if you're single and under 35 you can only get Housing Benefit for bed-sit accommodation or one room in shared accommodation.
0%
5%
10%
15%
20%
25%
30%
35%
Che
shire
Wes
t &C
hest
er Che
ster
Bla
con
Bou
ghto
n
Che
ster
City
Gar
den
Qua
rter
Gre
at B
ough
ton
Han
dbrid
ge P
ark
Hoo
le
Lach
e
New
ton
Upt
on
Perc
enta
ge o
f Hou
seho
lds
clai
min
g co
unci
l tax
ben
efit
Electoral Wards
Percentage of households who claim housing benefit
Contact: Strategic Intelligence Team, Nov 2013Email: [email protected]
LocalityDashboard_FINAL_V1.1- PW - 2014-01-22: Living & Working Well Profile Page 32 of 35

Integrated Strategic Needs Assessment
Cheshire West & Chester Locality Profile Ageing Well: Chester
Contains Ordnance Survey data © Crown copyrightand database right 2013. License No 100049046
Income Deprivation Affecting Older People (65+) Index
20% of people aged 65 and over in Chester locality live within Q1 (Most deprived) areas in terms of Income deprivation affecting older people, this compares to 9% of Cheshire West & Chester's population residing in Q1 (most deprived) in terms of Income deprivation affecting older people. 57% of Blacon and 52% of Boughton wards older population reside within Q1 (most deprived) in terms of Income deprivation affecting older people.
Source: Department for Communities and Local Government (CLG)
The Income Deprivation Affecting Older People Index of the Index of Multiple Deprivation 2010 (IMD2010) describes the most deprived areas in Cheshire West & Chester in the context of the most deprived areas in England. Therefore national quintile 1 and 2 (Q1 and Q2) describes those areas of Cheshire West & Chester that are amongst the 40% most deprived in England. Locality figures have been calculated based on resident populations.
0%
20%
40%
60%
80%
100%
Eng
land
Che
shire
Wes
t &
Che
ster Che
ster
Bla
con
Bou
ghto
n
Che
ster
City
Gar
den
Qua
rter
Gre
at B
ough
ton
Han
dbrid
ge P
ark
Hoo
le
Lach
e
New
ton
Upt
on
Perc
enta
ge o
f pop
ulat
ion
Income Deprivation Affecting Older People aged 65+Quintile 1 - Most Deprived 20% Nationally Q2 Q3 Q4 Quintile 5 - Least Deprived 20% Nationally
Contact: Strategic Intelligence Team, Nov 2013Email: [email protected]
LocalityDashboard_FINAL_V1.1- PW - 2014-01-22: Ageing WellPage 33 of 35
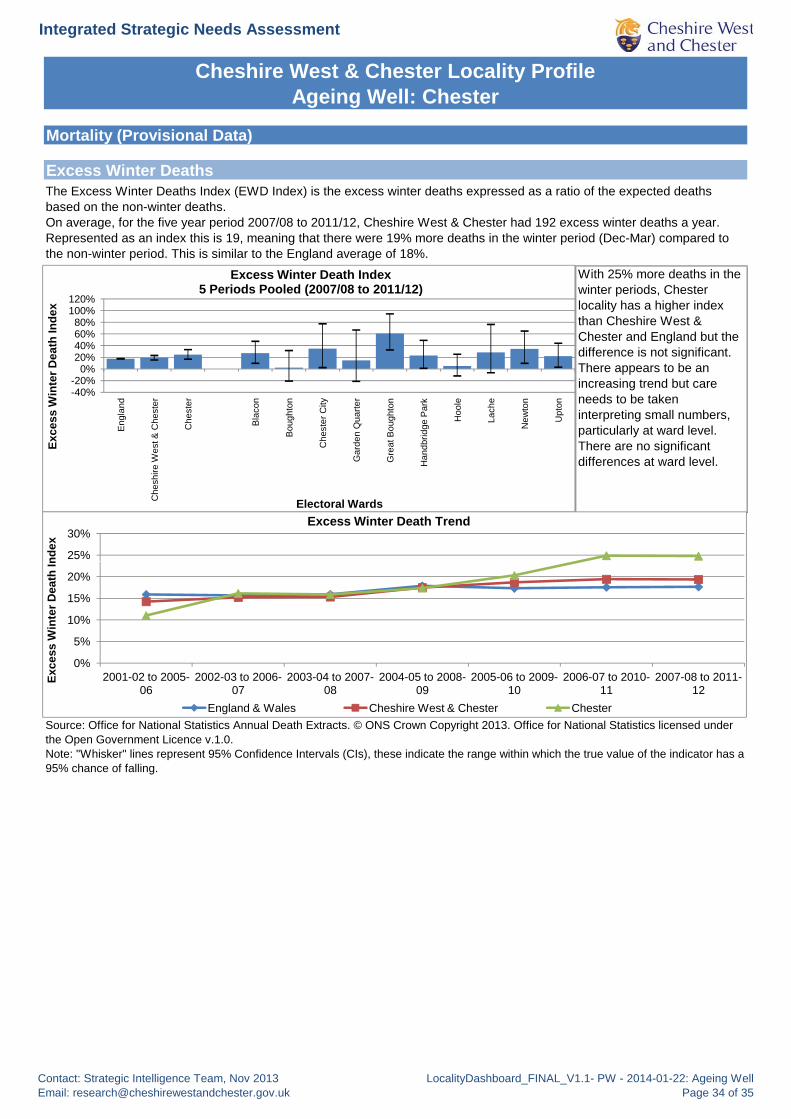
Integrated Strategic Needs Assessment
Cheshire West & Chester Locality Profile Ageing Well: Chester
Mortality (Provisional Data)
Excess Winter Deaths
With 25% more deaths in the winter periods, Chester locality has a higher index than Cheshire West & Chester and England but the difference is not significant. There appears to be an increasing trend but care needs to be taken interpreting small numbers, particularly at ward level. There are no significant differences at ward level.
The Excess Winter Deaths Index (EWD Index) is the excess winter deaths expressed as a ratio of the expected deaths based on the non-winter deaths.On average, for the five year period 2007/08 to 2011/12, Cheshire West & Chester had 192 excess winter deaths a year. Represented as an index this is 19, meaning that there were 19% more deaths in the winter period (Dec-Mar) compared to the non-winter period. This is similar to the England average of 18%.
-40%-20%
0%20%40%60%80%
100%120%
Eng
land
Che
shire
Wes
t & C
hest
er
Che
ster
Bla
con
Bou
ghto
n
Che
ster
City
Gar
den
Qua
rter
Gre
at B
ough
ton
Han
dbrid
ge P
ark
Hoo
le
Lach
e
New
ton
Upt
on
Exce
ss W
inte
r Dea
th In
dex
Electoral Wards
Excess Winter Death Index5 Periods Pooled (2007/08 to 2011/12)
25%
30%
ndex
Excess Winter Death Trend
Source: Office for National Statistics Annual Death Extracts. © ONS Crown Copyright 2013. Office for National Statistics licensed under the Open Government Licence v.1.0.Note: "Whisker" lines represent 95% Confidence Intervals (CIs), these indicate the range within which the true value of the indicator has a 95% chance of falling.
0%
5%
10%
15%
20%
2001-02 to 2005-06
2002-03 to 2006-07
2003-04 to 2007-08
2004-05 to 2008-09
2005-06 to 2009-10
2006-07 to 2010-11
2007-08 to 2011-12
Exce
ss W
inte
r Dea
th In
England & Wales Cheshire West & Chester Chester
Contact: Strategic Intelligence Team, Nov 2013Email: [email protected]
LocalityDashboard_FINAL_V1.1- PW - 2014-01-22: Ageing WellPage 34 of 35

Integrated Strategic Needs Assessment
Cheshire West & Chester Locality Profile Ageing Well: Chester
Hospital Admissions
Falls (Provisional Data)
Older People Living Alone
Chester locality has a significantly higher admission rate than England with Chester City ward and Garden Quarter also having significantly higher rates. These wards however are not generating the highest numbers of admissions. Upton ward and Handbridge had the most with over 50 admissions each in the year.
Provisional data for 2012/13 indicates there were over 1,300 admissions for people aged 65 and over with an injury diagnosis caused by a fall. The rate of admissions for residents in this age group is similar to England.
Lone pensioner households include sheltered accommodation units in establishments where 50% or more have their own kitchens.
Source: Hospital Episode Statistics, NHS Information CentreNote: "Whisker" lines represent 95% Confidence Intervals (CIs), these indicate the range within which the true value of the indicator has a 95% chance of falling.
01,0002,0003,0004,0005,0006,0007,000
Eng
land
Che
shire
Wes
t &
Che
ster Che
ster
Bla
con
Bou
ghto
n
Che
ster
City
Gar
den
Qua
rter
Gre
at B
ough
ton
Han
dbrid
ge P
ark
Hoo
le
Lach
e
New
ton
Upt
on
Dire
ctly
Sta
ndar
dise
d R
ate
per
100,
000
peop
le a
ged
65+
Electoral Wards
Emergency hospital admissions due to falls resulting in injury (2012/13)
Source: 2011 Census Tables KS105EW Household Composition and QS110EW Adult Lifestage. © ONS Crown Copyright 2013. Office for National Statistics licensed under the Open Government Licence v.1.0.
In Cheshire West and Chester 13.2% of households are single pensioner households, this compares to 12.4% in England and Wales.
Great Boughton ward has the highest percentage of both 65+ (18.8%) and 75+ (13.3%) usual residents living alone. This compares to 13.8% (65+) and 8.7% (75+) in Chester locality. Garden Quarter ward has the lowest percentage of lone pensioner households in Chester locality, this ward is close to the University of Chester.
0%2%4%6%8%
10%12%14%16%18%20%
Eng
land
Che
shire
Wes
t &
Che
ster Che
ster
Bla
con
Bou
ghto
n
Che
ster
City
Gar
den
Qua
rter
Gre
at B
ough
ton
Han
dbrid
ge P
ark
Hoo
le
Lach
e
New
ton
Upt
onPerc
enta
ge o
f all
hous
ehol
ds
Electoral Wards
Percentage of households that consist of a pensioner (65+) living alone
Aged 65+ Aged 75+
Contact: Strategic Intelligence Team, Nov 2013Email: [email protected]
LocalityDashboard_FINAL_V1.1- PW - 2014-01-22: Ageing WellPage 35 of 35