chesapeake energy: the transformation … keynote - nape feb2018 - final...chesapeake energy: the...
TRANSCRIPT

CHESAPEAKE ENERGY:
THE TRANSFORMATION AND THE FUTURE
Doug LawlerPresident and Chief Executive Officer

FORWARD-LOOKING STATEMENTS
This presentation includes “forward-looking statements” within the meaning of Section 27A of the Securities Act of 1933 and Section 21E of the Securities Exchange Act of
1934. Forward-looking statements are statements other than statements of historical fact. They include statements that give our current expectations, guidance or forecasts of
future events, production and well connection forecasts, estimates of operating costs, anticipated capital and operational efficiencies, planned development drilling and expected
drilling cost reductions, general and administrative expenses, capital expenditures, the timing of anticipated asset sales and proceeds to be received therefrom, projected cash
flow and liquidity, our ability to enhance our cash flow and financial flexibility, plans and objectives for future operations, and the assumptions on which such statements are
based. Although we believe the expectations and forecasts reflected in the forward-looking statements are reasonable, we can give no assurance they will prove to have been
correct. They can be affected by inaccurate or changed assumptions or by known or unknown risks and uncertainties.
Factors that could cause actual results to differ materially from expected results include those described under “Risk Factors” in Item 1A of our annual report on Form 10-K and
any updates to those factors set forth in Chesapeake’s subsequent quarterly reports on Form 10-Q or current reports on Form 8-K (available at http://www.chk.com/investors/
sec-filings). These risk factors include: the volatility of oil, natural gas and NGL prices; the limitations our level of indebtedness may have on our financial flexibility; our inability
to access the capital markets on favorable terms; the availability of cash flows from operations and other funds to finance reserve replacement costs or satisfy our debt
obligations; our credit rating requiring us to post more collateral under certain commercial arrangements; write-downs of our oil and natural gas asset carrying values due to low
commodity prices; our ability to replace reserves and sustain production; uncertainties inherent in estimating quantities of oil, natural gas and NGL reserves and projecting
future rates of production and the amount and timing of development expenditures; our ability to generate profits or achieve targeted results in drilling and well operations;
leasehold terms expiring before production can be established; commodity derivative activities resulting in lower prices realized on oil, natural gas and NGL sales; the need to
secure derivative liabilities and the inability of counterparties to satisfy their obligations; adverse developments or losses from pending or future litigation and regulatory
proceedings, including royalty claims; charges incurred in response to market conditions and in connection with our ongoing actions to reduce financial leverage and complexity;
drilling and operating risks and resulting liabilities; effects of environmental protection laws and regulation on our business; legislative and regulatory initiatives further regulating
hydraulic fracturing; our need to secure adequate supplies of water for our drilling operations and to dispose of or recycle the water used; impacts of potential legislative and
regulatory actions addressing climate change; federal and state tax proposals affecting our industry; potential OTC derivatives regulation limiting our ability to hedge against
commodity price fluctuations; competition in the oil and gas exploration and production industry; a deterioration in general economic, business or industry conditions; negative
public perceptions of our industry; limited control over properties we do not operate; pipeline and gathering system capacity constraints and transportation interruptions; terrorist
activities and/or cyber-attacks adversely impacting our operations; potential challenges by SSE’s former creditors of our spin-off of in connection with SSE’s recently completed
bankruptcy under Chapter 11 of the U.S. Bankruptcy Code; an interruption in operations at our headquarters due to a catastrophic event; the continuation of suspended
dividend payments on our common stock; the effectiveness of our remediation plan for a material weakness; certain anti-takeover provisions that affect shareholder rights; and
our inability to increase or maintain our liquidity through debt repurchases, capital exchanges, asset sales, joint ventures, farmouts or other means.
In addition, disclosures concerning the estimated contribution of derivative contracts to our future results of operations are based upon market information as of a specific date.
These market prices are subject to significant volatility. Our production forecasts are also dependent upon many assumptions, including estimates of production decline rates
from existing wells and the outcome of future drilling activity. Expected asset sales may not be completed in the time frame anticipated or at all. We caution you not to place
undue reliance on our forward-looking statements, which speak only as of the date of this presentation, and we undertake no obligation to update any of the information
provided in this presentation, except as required by applicable law. In addition, this presentation contains time-sensitive information that reflects management’s best judgment
only as of the date of this presentation.
We use certain terms in this presentation such as “Resource Potential,” “Net Reserves” and similar terms that the SEC’s guide lines strictly prohibit us from including in filings
with the SEC. These terms include reserves with substantially less certainty, and no discount or other adjustment is included in the presentation of such reserve numbers. U.S.
investors are urged to consider closely the disclosure in our Form 10-K for the year ended December 31, 2016, File No. 1-13726 and in our other filings with the SEC, available
from us at 6100 North Western Avenue, Oklahoma City, Oklahoma 73118. These forms can also be obtained from the SEC by calling 1-800-SEC-0330.
2CHK: The Transformation & The Future

UNCONVENTIONAL TRAILBLAZER
The Early Years
CHK: The Transformation & The Future 3

PRODUCTION AND DEBT
CHK: The Transformation & The Future 4
Entered
Barnett
Entered
Haynesville
1989 – 2000
Oklahoma
focused E&P
Entered
Niobrara
Entered
Utica
Entered
Eagle Ford
Entered
Fayetteville
Entered
Marcellus
Entered
Permian

COMPLEXITY ACROSS ALL ASPECTS OF THE COMPANY
Companies CHK owned or invested in:
As of 12/31/2012
CHK: The Transformation & The Future 5
$21.25 billion Total leverage
45,400 gross wellsInterests
7 joint venturesWith 5 different companies
10 VPPS
12,000 employees
Governance challenges Leads to activist investors

CHK: The Transformation & The Future
The Transformation
6
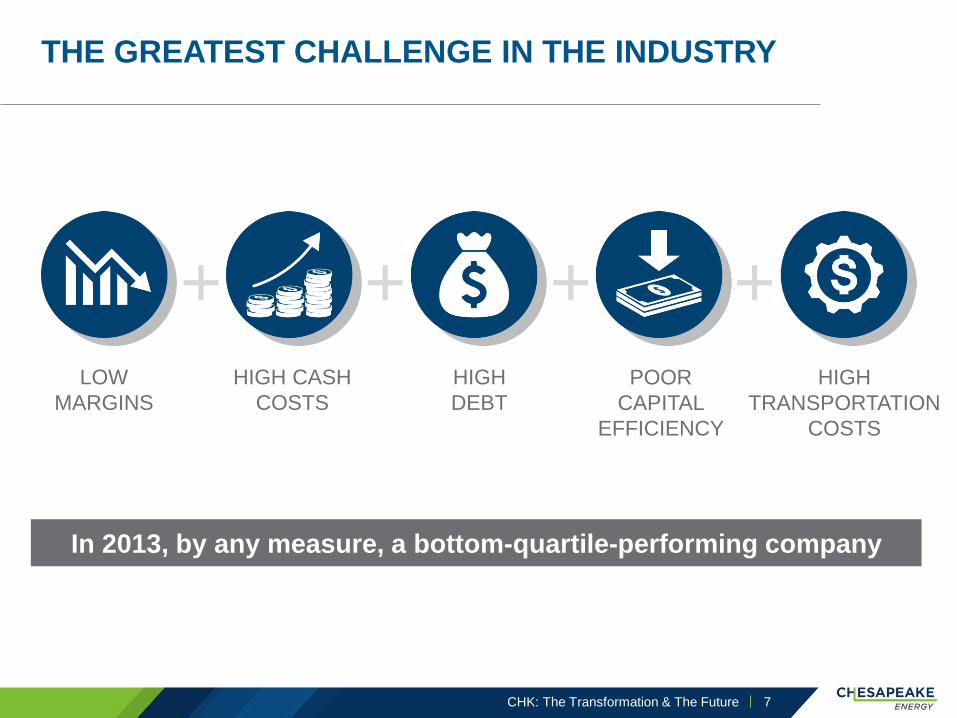
THE GREATEST CHALLENGE IN THE INDUSTRY
CHK: The Transformation & The Future 7
In 2013, by any measure, a bottom-quartile-performing company
HIGH CASH
COSTS
HIGH
DEBT
POOR
CAPITAL
EFFICIENCY
HIGH
TRANSPORTATION
COSTS
LOW
MARGINS
+ + + +

CHK: The Transformation & The Future 8

BUSINESS STRATEGIES
> Financial discipline
> Profitable and
efficient growth from
captured resources
> Exploration
> Business development
CORE VALUES
> Integrity and trust
> Respect
> Transparency and
open communication
> Commercial focus
> Change leadership
CHK: The Transformation & The Future 9

THE TRANSFORMATION BEGINS
CHK: The Transformation & The Future 10
Focused on Value
TRANSFORMATION TEAMS:
Organizational Structure
Financial & Corporate Planning
Capital Efficiency
Portfolio Characterization
Affiliated/Subsidiary Evaluation
Cash Costs
Marketing & GP&T
Performance Evaluation
Field Operations
Focused on Volume
#2 most active driller in the U.S.
Peak rig count = 180
#1 driller of horizontal shale wells
in the world
~11mm net acres under lease
(U.S. onshore)
23 years of production growth

BEST-IN-CLASS EH&S PERFORMANCE
CHK: The Transformation & The Future
(1) 2013 NOV count is 1,929 due to how NOVs were uploaded/managed in KMI database
11
80% improvement 97% improvement 98% improvement
PROTECTING THE
ENVIRONMENTReportable Spills
304
214
191
133
72
61
2012 2013 2014 2015 2016 2017
1.47
0.48
0.31
0.51
0.38
0.05
2012 2013 2014 2015 2016 2017
PROTECTING OUR
EMPLOYEESTotal Recordable
Incident Rate
1,929
371
184126 29
2013 2014 2015 2016 2017
REGULATORY
COMPLIANCE LEADERNotice of Regulatory Violations
Incident Count (1)

$0.00
$2.00
$4.00
$6.00
$8.00
$10.00
$12.00
$14.00
$16.00
0
100
200
300
400
500
600
700
800
2012 2013 2014 2015 2016 2017E
Cap
ex (
$ b
illi
on
s)
Ne
t P
rod
uc
tio
n (
mb
oe
/d)
Equivalent Production and Capex
CAPITAL EFFICIENCY DEFINED
(1) Absolute production that is not adjusted for asset sales
CHK: The Transformation & The Future 12

$0.00
$1.00
$2.00
$3.00
$4.00
$5.00
$0
$200
$400
$600
$800
$1,000
$1,200
$1,400
2012 2013 2014 2015 2016 2017E
LO
E (
$/b
oe
)
LO
E (
$ m
illi
on
s)
Production Expense
CASH COST LEADERSHIP
Sources: S&P Capital IQ, Company Filings, LOE defined as Oil, natural gas and NGL production expenses
Cash Costs: Not including GP&T costs
CHK: The Transformation & The Future 13

CASH COST LEADERSHIP
$-
$0.50
$1.00
$1.50
$2.00
$2.50
$-
$100
$200
$300
$400
$500
$600
2012 2013 2014 2015 2016 2017E
G&
A (
$/b
oe
)
G&
A (
$ m
illi
on
s)
G&A
CHK: The Transformation & The Future 14

OPTIMIZING DOWNSTREAM COMMITMENTS
CHK: The Transformation & The Future 15
$8.55
$7.98
~$7.28
2015 2016 2017E
GP&T/BOE ($)
2017E 2018E 2019E 2020E 2021E AverageThereafter
GP&T Commitment ($ millions)
$1,339
$1,096 $1,062$990
$894
$372
$1.20/boe reduction In cash cost structure
~$6.7 billion reduction In midstream and marketing
commitments since 2014

$53
$665
$338
$1,300 $1,250 $1,300
$0
$500
$1,000
$1,500
$2,000
$2,500
$3,000
2015 2016 2017 2018 2019 2020 2021 2022 2023 2025 2026 2027
Revolving Credit Facility
Unsecured
Secured
$2,047$1,868
$1,161
$ m
illi
on
s
Revolving Credit Facility
Unsecured
Secured
2018 O
UT
LO
OK
(3)
$500
$1,500
$1,800 $1,700$1,500
$1,100
$396
$0
$500
$1,000
$1,500
$2,000
$2,500
$3,000
2015 2016 2017 2018 2019 2020 2021 2022 2023 2025 2026 2027
#REF!
Convertibles
$2,245
$1,015
Convertibles(2)
Other Senior Notes
$ m
illi
on
s
2015 O
UT
LO
OK
$781mmRevolving Credit Facility (1)
DEBT MATURITY PROFILE
(1) As of 12/31/2017
(2) Recognizes earliest investor put option as maturity for the 2.75% 2035, 2.5% 2037 and 2.25% 2038 Contingent Convertible Senior Notes
(3) As of 02/05/2018
CHK: The Transformation & The Future 16
$9.2 billionSenior Notes & Term Loan (1)
7.10%WACD

EVOLUTION OF THE TRANSFORMATION
• Created best-in-class Code of Conduct
and Supplier Code of Conduct
• Established risk-based compliance
program
• A leader in cash cost structure and
capital efficiency
• Set the company on a path to achieve
production growth while aiming toward
cash flow neutrality in 2018
CHK: The Transformation & The Future 17
Where We Have Been
~$11.2 billion Since 2012, reduced total
leverage (~50% decrease)
~$6.7 billion Reduced midstream and
marketing commitments
since 2014 (~42% decrease)
~$3.2 billion Reduced debt maturities
due between 2018 – 2020
(~75% decrease)

The Future
CHK: The Transformation & The Future 18

PREMIER, DIVERSIFIED ASSET BASE
CHK: The Transformation & The Future 19
World-class
gas assets
˃ Appalachia North
˃ Appalachia South
˃ Gulf Coast
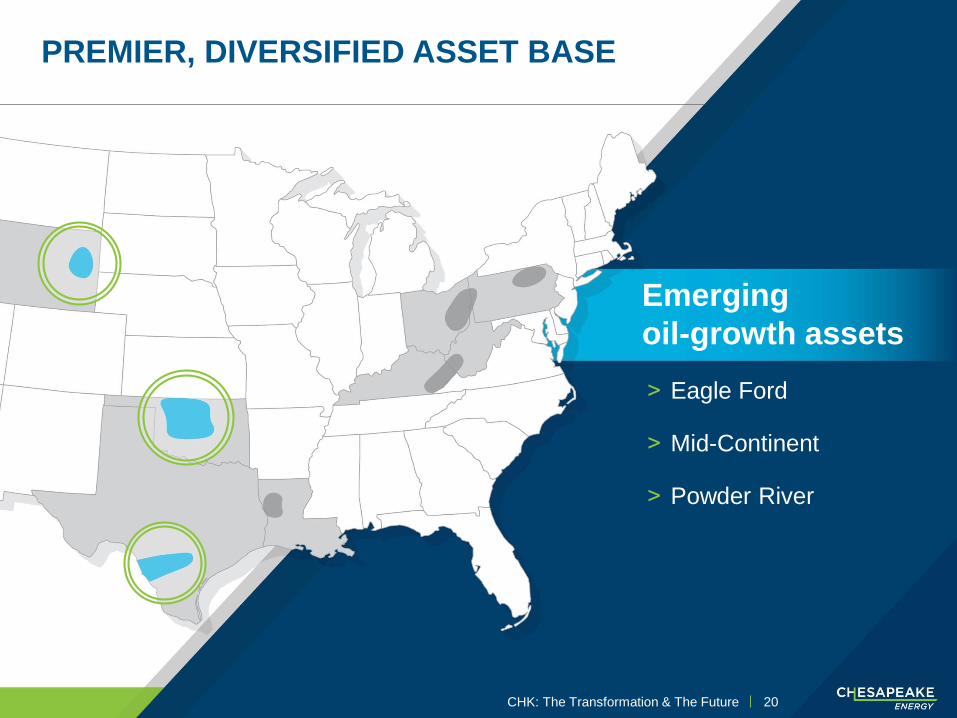
PREMIER, DIVERSIFIED ASSET BASE
CHK: The Transformation & The Future 20
Emerging
oil-growth assets
˃ Eagle Ford
˃ Mid-Continent
˃ Powder River

DEPTH AND CAPABILITY OF THE PORTFOLIO
CHK: The Transformation & The Future 21
35%
65%
Locations
Average IP 60 BOE Production Per Well by First Prod Year
Drilled
Remaining4,950,000 Net Acres
0
50,000
100,000
150,000
200,000APPALACHIA NORTH
0
20,000
40,000
60,000
80,000APPALACHIA SOUTH
0
100,000
200,000
300,000GULF COAST
201720162015201420132012
0
20,000
40,000
60,000EAGLE FORD
0
10,000
20,000
30,000
40,000MID-CONTINENT
0
20,000
40,000
60,000POWDER RIVER
201720162015201420132012

STRATEGIC PRIORITIES
Debt reduction
of $2 – $3 billionultimate goal of net debt
to EBITDA of 2X
Free cash flow neutrality
Margin enhancement
2
3
1
BUSINESS STRATEGIES
Our strategy remains unchanged –
resilient to commodity price volatility
> Financial discipline
> Profitable and efficient growth
from captured resources
> Exploration
> Business development
CHK: The Transformation & The Future 22

RECENT PROGRESS ON OUR PRIORITIES
CHK: The Transformation & The Future 23
593,000 boe per dayQ4 2017 production
Achieved Q4 2017 goal of
100,000 barrels of oil per day
Record EH&S performanceIn 2017
Signed three separate salesagreements totaling
~$500mm Expected to close mid-2018
Monetized a portion of FTSI investment Net proceeds of $78mm and hold ~22mm additional shares
~$3 billion In asset sales in 2016 and 2017

STOCK PRICE PERFORMANCE
CHK: The Transformation & The Future 24
Source: Bloomberg
-100
-75
-50
-25
0
25
50
75
100
Jan-13 Jul-13 Jan-14 Jul-14 Jan-15 Jul-15 Jan-16 Jul-16 Jan-17 Jul-17 Jan-18
CHK NG1 CL1Gas Oil
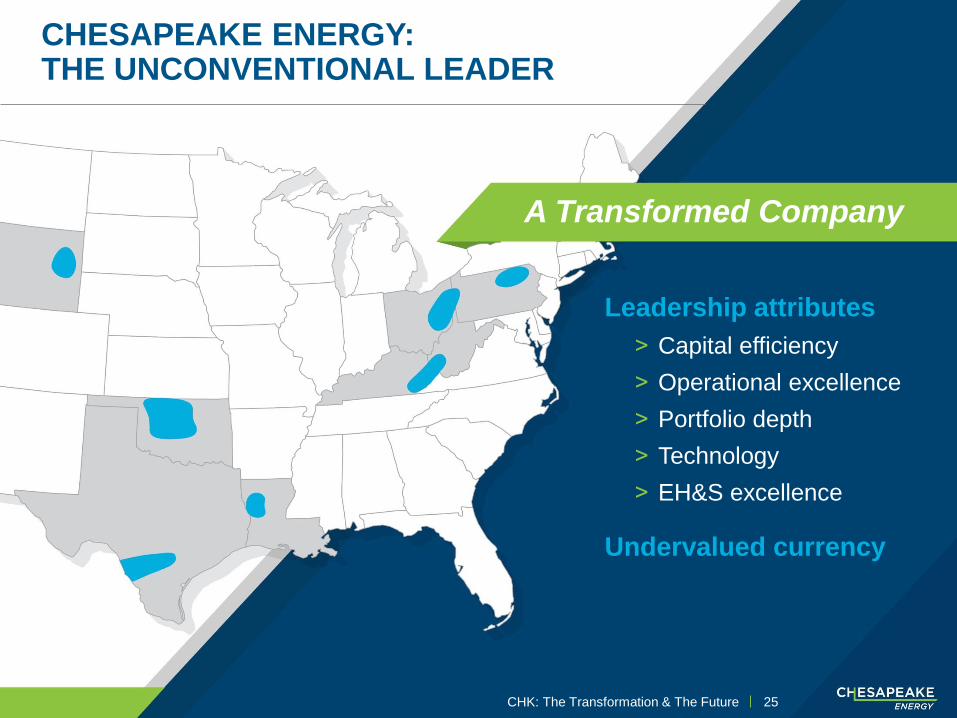
CHESAPEAKE ENERGY: THE UNCONVENTIONAL LEADER
CHK: The Transformation & The Future 25
Leadership attributes
˃ Capital efficiency
˃ Operational excellence
˃ Portfolio depth
˃ Technology
˃ EH&S excellence
Undervalued currency
A Transformed Company

Appendix
CHK: The Transformation & The Future 26

REDUCING TOTAL LEVERAGE AND COMPLEXITY
• Chesapeake continues to simplify the business:
˃ Eliminated finance leases, subsidiary preferred equity
and eight VPPs
˃ Optimizing the capital structure
˃ Reduced interest expense by ~$100mm (2017E vs. 2016)
(1) Updated through 10/31/2017
(2) Includes $441 million legal settlement and $416 million in buyout of midstream obligations
(3) Using Moody’s valuation methodology
CHK: The Transformation & The Future
($mm) 2012 2013 2014 2015 2016 Q3’17 Pro Forma (1)
Credit Facility (1) $418 $405 $0 $0 $0 $643
Term Loan (1) $2,000 $2,000 $0 $0 $1,500 $1,263
Second-Lien Notes (1) $0 $0 $0 $2,425 $2,419 $1,417
Long-Term Bonds (1) $10,647 $10,825 $11,756 $7,281 $6,070 $6,550
Less: Cash ($287) ($837) ($4,108) ($825) ($900) ($9)
Net Debt $12,778 $12,393 $7,648 $8,881 $9,089 $9,864 (2)
VPPs $3,186 $2,454 $1,702 $1,289 $273 $218
Operating and Finance Leases $1,255 $948 $0 $0 $0 $0
Subsidiary Preferred $2,500 $2,310 $1,250 $0 $0 $0
Corporate Preferred (3) $1,531 $1,531 $1,531 $1,531 $886 $835
Total Adjusted Net Leverage $21,250 $19,637 $12,131 $11,701 $10,248 $10,917
-23%
SINCE JAN 2013
~50% reductionIn total net leverage
= $10.3 billion
-48%
27
Includes payments of $857mm for one-time obligations in 2017

$-
$2.00
$4.00
$6.00
$8.00
$10.00
$12.00
$14.00
$16.00
$18.00
A B C CHK D E F G H I J K L M N O P Q
Cash Costs/BOE ($)as of Q3 2017
G&A LOE
LOW-COST OPERATOR
• CHK remains a cash cost leader after halving costs over the last five years
• 80% of its peers have higher cash cost than CHK
Sources: S&P Capital IQ, company filings. Cash costs include production expenses, G&A expenses and expenses associated with stock-based compensation, but exclude restructuring other termination costs,
gathering, processing and transportation expenses and interest expense. G&A expenses include expenses associated with stock-based compensation, but exclude restructuring and other termination costs.
CHK: The Transformation & The Future 28

CAPITAL EFFICIENCY
Source: 2016 10-K filings. Proved reserve F&D costs defined as the sum of the development and exploration costs divided by proved reserves added by extensions, additions and discoveries.
Peer Group includes: APA, AR, APC, COG, COP, CXO, DVN, ECA, EOG, HES, MRO, MUR, NBL, PE, PXD, RRC, SWN and XEC
CHK: The Transformation & The Future 29
0
5
10
15
20
25
30
$/b
oe
2016 Proved F&D Costs6 mcf to 1 boe
0
5
10
15
20
25
30
35
$/b
oe
2016 Proved F&D Costs15 mcf to 1 boe
~$2.35/boe ~$3.40/boe
Operational leadership and technical capabilities
provide peer-leading cost management