chennai floods, 2015 [a satellite and field based...
TRANSCRIPT
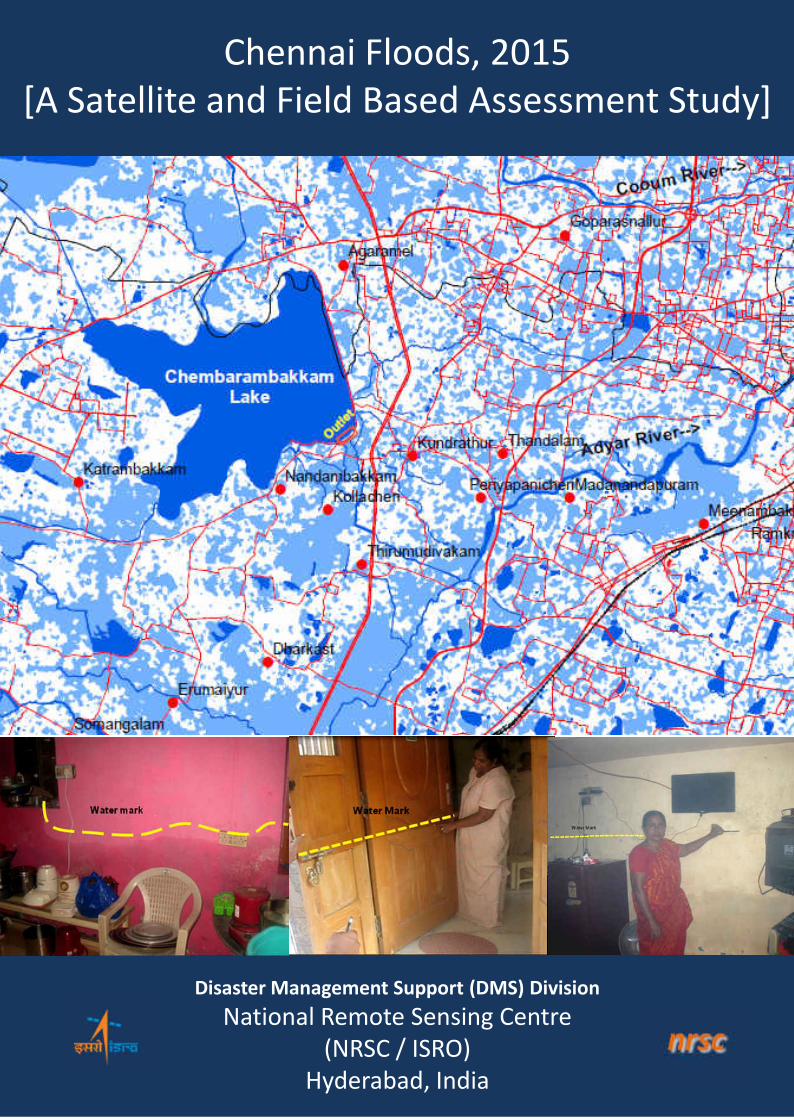
Disaster Management Support (DMS) Division
National Remote Sensing Centre
(NRSC / ISRO)
Hyderabad, India
Chennai Floods, 2015
[A Satellite and Field Based Assessment Study]

Chennai Floods, 2015 [A Satellite and Field Based Assessment Study]
Decision Support Centre (DSC) Disaster Management Support Division (DMSD)
National Remote Sensing Centre, ISRO Balanagar,Hyderabad-500037

P a g e | 2
NATIONAL REMOTE SENSING CENTRE
REPORT / DOCUMENT CONTROL SHEET
1. Security Classification
Official
2. Distribution Official
3. Report / Document version
(a) Issue no. 1 (b) Revision & DATE:
4. Report Type Technical Report
5. Document Control Number
NRSC-RSAA-DMSG-June-2016-TR-863
6. Title Chennai Floods, 2015
[A Satellite and Field Based Assessment Study]
7. Particulars of collation
Pages
34
Figures
34
Tables
-
References
3
8. Author(s) /Project Team
C M Bhatt and Ashish Mishra
9. Affiliation of authors DMSD, DMSG, National Remote Sensing Centre
10. Scrutiny mechanism
Compiled by
DMSD
Reviewed by
Head DMSD
Approved by
Group Director, DMSG
11. Originating unit
Decision Support Centre (DSC),
Disaster Management Support Group,
National Remote Sensing Centre, Hyderabad
12. Sponsor(s) / Name and Address
Disaster Management Support (DMS) Programme, ISRO Headquarters
13. Date of Project Initiation
December, 2015
14. Date of Publication March, 2016
15. Abstract (with Keywords):
Heavy widespread incessant rainfall activity led to waterlogging and flood like
condition in parts of Karnataka, coastal Andhra Pradesh and Tamil Nadu. Tamil
Nadu was one of the worst affected states and Chennai in particular was one of the
worst hit districts. This report provides an overview of the rapid satellite data
analysis and field assessment carried out for the Chennai Floods of December,
2015.
Keywords: Chennai, Adyar, Floods, Satellite, Inundation, Flood Depth and Maps.
P a g e | 3
Contents
Executive Summary
1. Introduction
2. Chennai City
2.1 Population
2.2 Drainage
2.3 Physiogarphy
3. Efforts of DSC
3.1 Tamilnadu Flood Mapping and Monitoring
3.2 Chennai inudation Mapping and Monitoring
4. Efforts of DSC
5. Field Survey
6. Geovisulaization on Bhuvan Portal
7. Results and Discussions
8. Conclusions

P a g e | 4
Executive Summary
South India experienced heavy rains during the month of November and December,
2015 due to the formation of depression over southwest Bay of Bengal and owing to
a strong El Niño. Heavy widespread incessant rainfall activity led to waterlogging and
flood like condition in parts of Karnataka, coastal Andhra Pradesh and Tamil Nadu.
Tamil Nadu was one of the worst affected states and Chennai in particular was one
of the worst hit districts.
Decision Support Centre (DSC) at National Remote Sensing Centre (NRSC), ISRO,
kept a close watch on the flood situation since November, 2015. Emergency
requests for tilting the IRS cameras and tasking of Indian Microwave Satellite RISAT-
1 and activating of International Charter was done to acquire multi-sensor and multi-
date satellite datasets over the affected region. Rapid inundation mapping and
monitoring was carried out and the inundation products were disseminated in near
real time. About 26 inundation maps state, district and detailed inundation maps,
cumulative maps, progression and recession maps were sent to MHA, NDMA, and
Govt. of Tamil nadu to help in relief and rescue operations. Special efforts were put
to map the inundation within the Chennai city and prpepare maps higligting the
settlements affected along Adiyar and Cooum Rivers.
The inundation products and layers were continuously published on Bhuvan and
NDEM (National Database for Emergency Management) web portals. Value added
satellite images showing the status of the flood situation in parts of Chennai district
were also published on NRSC website. An Android based mobile application was
developed by Bhuvan Team to facilitate crowd sourcing. A field survey in
collaboration with Indian Institute of Technology (IIT), Chennai was carried out during
24-26 December, 2015 to have a closer assessment of the catstrophic flood and
collect information on flood water depth marks.
This report describes about the flood event, satellite mapping and monitoring of
floods and field assessment of the inundated areas carried out for Chennai floods of
December, 2015.

P a g e | 5
Chennai Floods, 2015
1.0 Introduction
South India experienced heavy rains during the month of November and December,
2015 due to the formation of depression over southwest Bay of Bengal and owing to
a strong El Niño. Heavy widespread incessant rainfall activity led to waterlogging and
flood like condition in parts of Karnataka, coastal Andhra Pradesh and Tamil Nadu.
Tamil Nadu was one of the worst affected states where rainfall in all but two of the 34
districts in the state has exceeded the normally observed levels, while five districts
have been pounded by over twice the average rainfall received between October
and the end of November, 2015 (Fig-1). Chennai in particular was one of the worst
hit districts in the state which received almost 1,200 mm of rain in November, which
is nearly 300 per cent above the normal observation of 407.4 mm. While rainfall in
the city broke the nearly century-old record for November, the record for the highest
rainfall received in a single day in December was also rewritten. On December 1–2,
2015, the Indian city of Chennai received more rainfall in 24 hours than it had seen
on any day since 1901. The previous record for rainfall in a single day in December
dates back to 1901 when the city received 261.6 mm of rainfall in a span of 24 hours.
On December 1, 2015, the city received around 290 mm of rain in a single day
causing catastrophic flood disaster. The deluge followed a month of persistent
monsoon rains that were already well above normal for the Indian state of Tamil
Nadu.
Fig-1: Tamilnadu rains between October 1 and December 31, 2015. (Source:IMD, Indian Express)
P a g e | 6
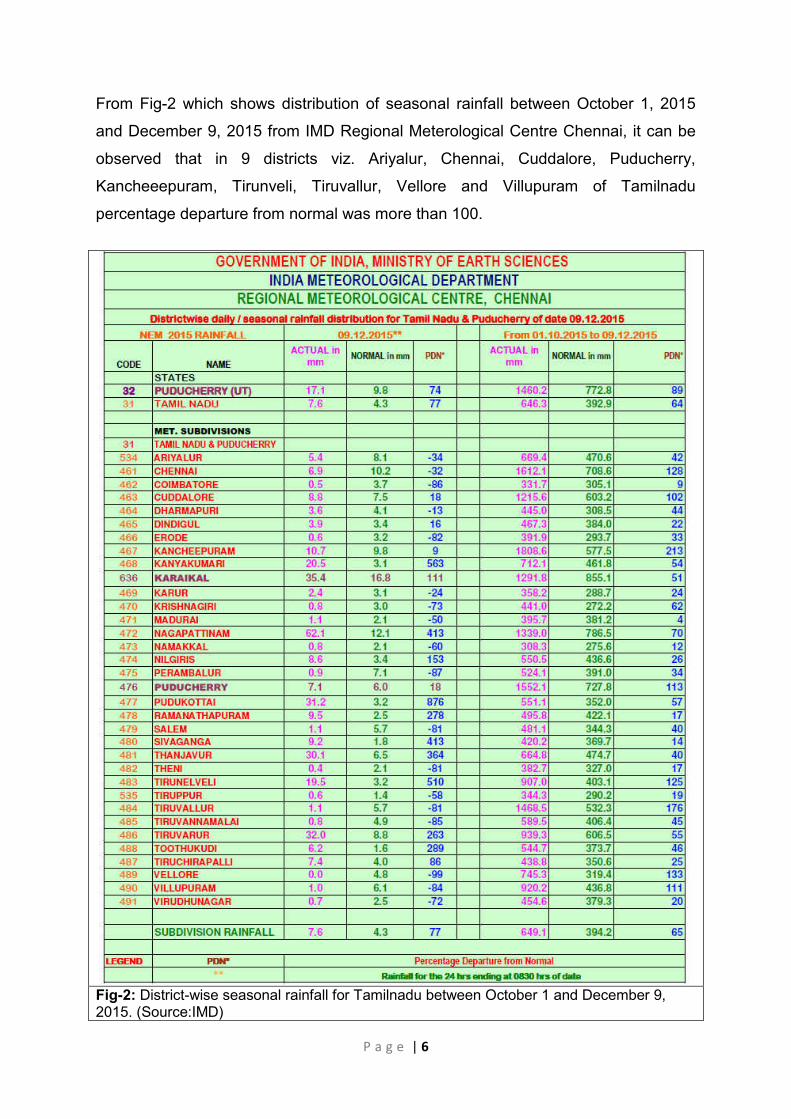
From Fig-2 which shows distribution of seasonal rainfall between October 1, 2015
and December 9, 2015 from IMD Regional Meterological Centre Chennai, it can be
observed that in 9 districts viz. Ariyalur, Chennai, Cuddalore, Puducherry,
Kancheeepuram, Tirunveli, Tiruvallur, Vellore and Villupuram of Tamilnadu
percentage departure from normal was more than 100.
Fig-2: District-wise seasonal rainfall for Tamilnadu between October 1 and December 9, 2015. (Source:IMD)

P a g e | 7
Floods were so severe that the entire city was brought to stand still for many days.
Chennai international airport was also inundated under water and all the flights and
aiport operations were halted upto December 6, 2015. Economic losses to the tune
of $7 billion, more than 400 people losing their lives and 18 lakh being displaced due
to this event was reported (Source:Wikipedia). In an interview published in
Navbharat Times, Director General, National Disaster Response Force (NDRF)
termed it as one of the biggest flood rescue operations carried out by NDRF.
Flooding problem was more aggravated because Chennai is one of the largest
industrial commercial center in South India and in recent decades has experienced
large-scale population growth in Chennai and its suburbs (Krishnamurthy et.al.,
2015). Chennai floods of December, 2015 are a classic example of urban flooding
and the unprecedented flood situation witnessed by the city has again reignited the
problem of urban flooding not only in India but globally. The catastrophic flooding
event also attracted the attentions of experts assembled at Paris during the COP-
21to discuss climate change.
2.0 Chennai
Chennai, the capital city of Tamil Nadu, is located in the North-Eastern
corner of Tamilnadu. The Chennai Metropolitan Area (CMA) comprises the
city of Chennai, 16 municipalities, 20 town panchayats (local governing bodies)
and 214 village panchayats. The extent of CMA is 1189 km2. The CMA falls in
three districts of the Tamil Nadu state i.e. Chennai district (area: 176 km2), and
parts of Thiruvallur district (area: 637 km2) and Kancheepuram district (area: 376
km2).
2.1 Population
As per data released by Govt. of India for Census 2011, Chennai is an Urban
Agglomeration coming under category of Million Plus UA/City. Its total population is
about 8,653,521 and is one of the largest cities of South India
(http://www.census2011.co.in/census/metropolitan/). Chennai has witnessed a
tremendous growth in its manufacturing, retail, health care and IT sector in the last
10 years. It is regarded as India's fourth largest city after Delhi, Mumbai and Kolkata.
Being a major business hub of the state, the population of Chennai has witnessed a
rapid growth in its Population.

P a g e | 8
2.2 Drainage
The City is drained by 2 rivers the Adyar and the Cooum Rivers, besides a number
of major and minor drains through Buckingham Canal into Sea via Ennore Creek and
Kovalam Creek. Cooum runs through the heart of the city whereas Adyar wends its
way through the southern part of the city before entering into the sea. Though the
river Adyar can be traced to a point near Guduvancheri village, it assumes the
appearance of a stream only after it receives the surplus water from the
Chembarambakkam tank as wells as the drainage of the areas in the south-west of
Chennai. Cooum River starts from Kesavaram Anicut in Kesavaram village built
across Kortaliyar River. The surplus from Cooum tank joins this course at about 8
kms. lower down and this point is actually the head of Cooum River which is located
at 48 kms. west of Chennai.
2.3 Physiography
Chennai is a low-lying area and the land surface is almost flat like a pancake. The
elevation variation within Chennai district varies between 0 to 11m, with mean
elevation being about 6m (Fig-3). The even topography of the land throughout the
district renders sub-divisions into natural regions rather difficult. Most of the localities
are just at sea-level and drainage in such areas remains a serious problem.Chennai
City has experienced major flooding during 1943, 1976, 1985, 1996 and 2005
Fig-3: Elevation variation within suburbs of Chennai (SRTM DEM) and within Chennai District (Carto DEM)

P a g e | 9
3.0 Efforts of DSC
3.1 Tamilnadu Flood Mapping and Monitoring
At NRSC/ISRO, Decision Support Centre (DSC) kept a close watch on the flood
situation due to heavy incessant rains in Tamil nadu since November, 2015. Rapid
inundation mapping and monitoring was carried out and the inundation products
were disseminated in near real time to MHA, NDMA, and Govt. of Tamil nadu to help
in relief and rescue operations. About 26 inundation maps state, district and detailed
inundation maps, cumulative maps, progression and recession maps were sent. Fig-
4 shows flood inundation map for part of Tamilnadu state based on satellite data
analysis of 03-December-2015.
Fig-4: Flood inundation map for part of Tamilnadu state based on satellite data analysis of 03-December-2015. (c) NRSC/ISRO, 2015
3.2 Chennai Inundation Mapping and Monitoring
RISAT-1 satellite data of 03, 04 & 06-December-2015 was acquired and analyzed to
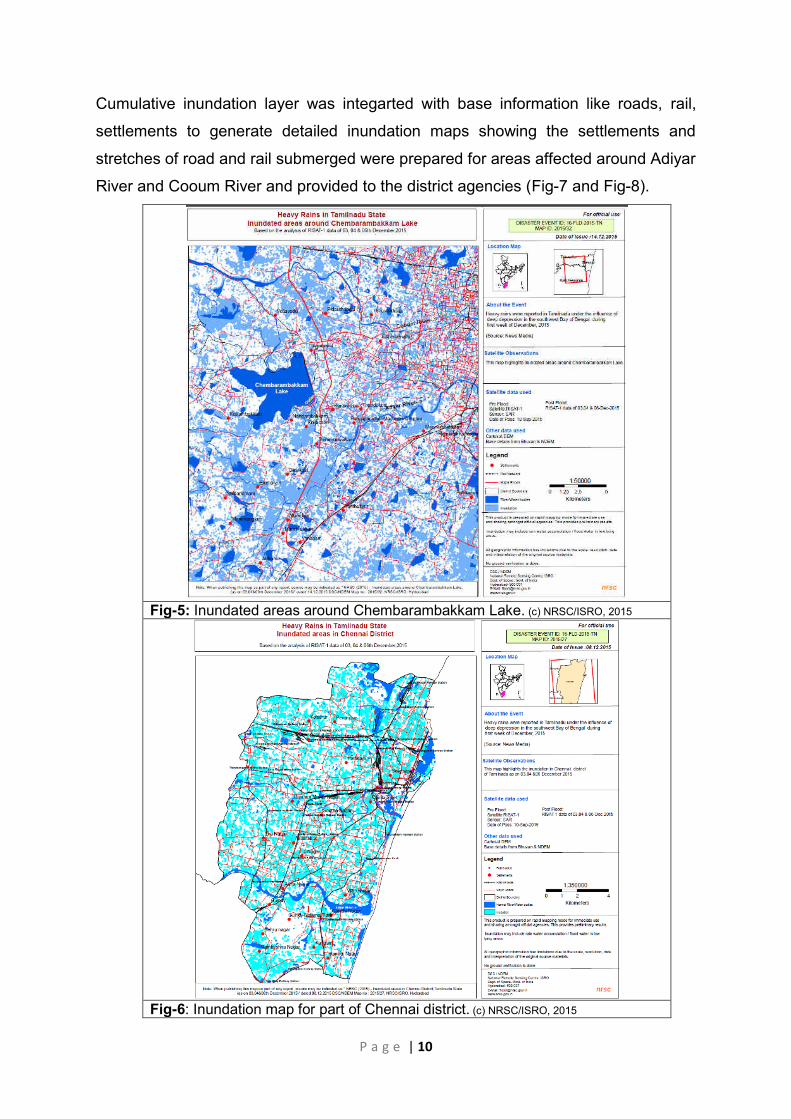
generate a cumulative inundation layer. Maps showing inundation in areas adjoining
Chembarambakkam Lake and Chennai district were prepared (Fig-5 and Fig-6).
P a g e | 10
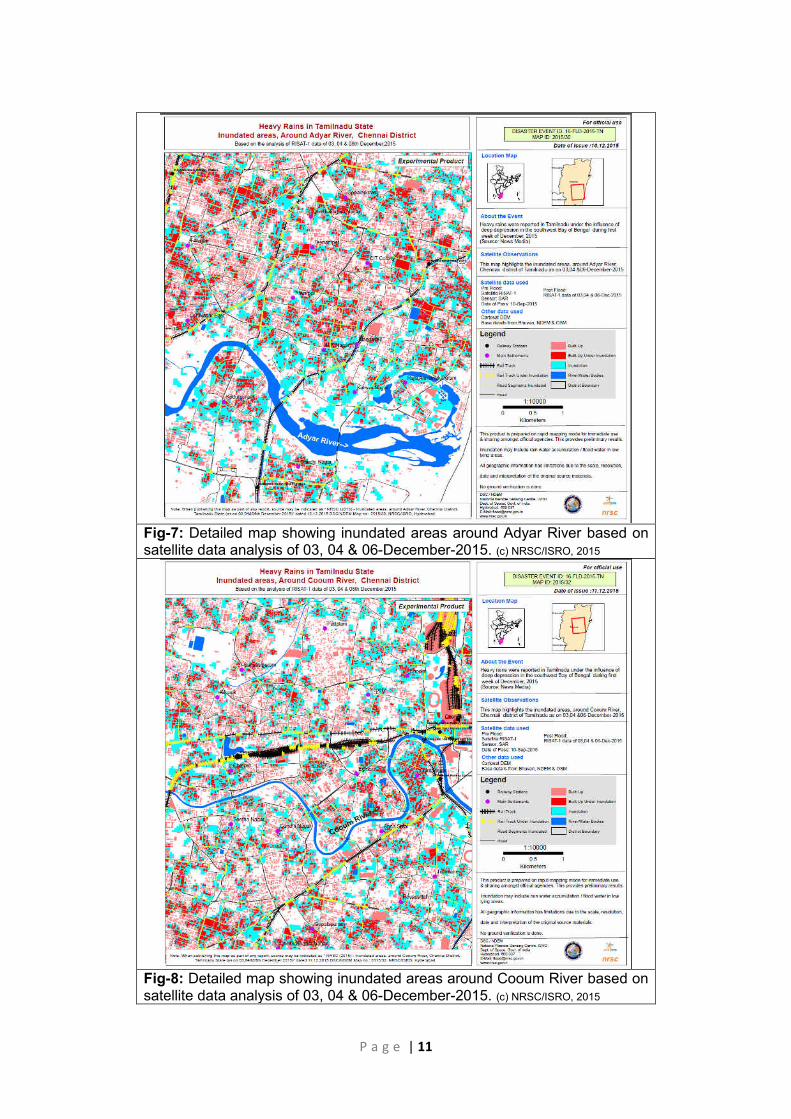
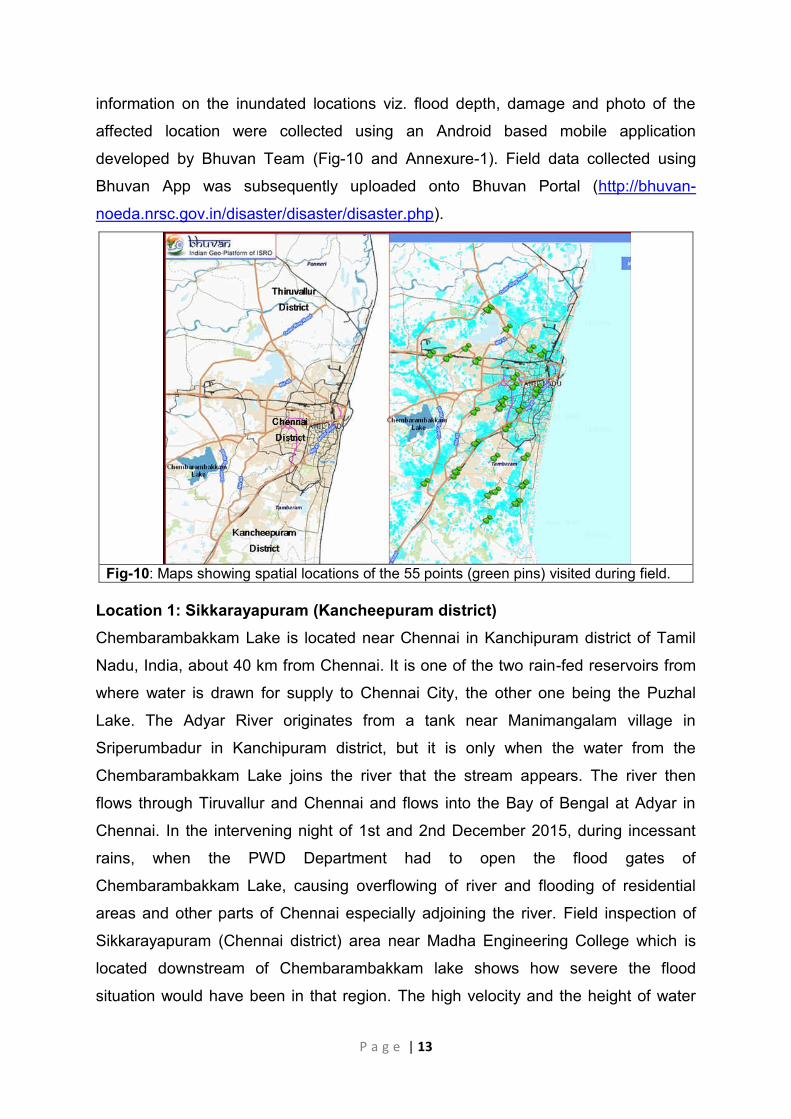
Cumulative inundation layer was integarted with base information like roads, rail,
settlements to generate detailed inundation maps showing the settlements and
stretches of road and rail submerged were prepared for areas affected around Adiyar
River and Cooum River and provided to the district agencies (Fig-7 and Fig-8).
Fig-5: Inundated areas around Chembarambakkam Lake. (c) NRSC/ISRO, 2015
Fig-6: Inundation map for part of Chennai district. (c) NRSC/ISRO, 2015
P a g e | 11
Fig-7: Detailed map showing inundated areas around Adyar River based on satellite data analysis of 03, 04 & 06-December-2015. (c) NRSC/ISRO, 2015
Fig-8: Detailed map showing inundated areas around Cooum River based on satellite data analysis of 03, 04 & 06-December-2015. (c) NRSC/ISRO, 2015

P a g e | 12
The inundation products and layers were continuously published on ISRO's
geovisulaization portal "Bhuvan" (www.bhuvan.nrsc.gov.in) and NDEM (National
Database for Emergency Management) web portals. Value added satellite images
showing the status of the flood situation in parts of Chennai district were also
published on NRSC website (www.nrsc.gov.in) (Fig-9). An Android based mobile
application was developed by Bhuvan Team to facilitate crowd sourcing.
Fig-9: Cartosat image 4-December-2015 showing inundated areas in part of Vadapurambakkam (Chennai District) (c) NRSC/ISRO, 2015
4.0 Field Survey
NRSC, DMSD team in collaboration with Indian Institute of Technology (IIT), Madras,
Chennai carried out a field investigation during 24-26 December, 2015 to have a
closer assessment of the catstrophic floods, validate the satellite based inundation
layer and collect information on flood water depth marks. During this field survey 14
Chennai municipal corporation zones (Manali, Royapuram, Anna Nagar, Teynampet,
Alandur, Adyar, Ambattur, Tondiarpet, Kodambakkam, Perungudi, Sholinganallur,
Valasaravakkam, Madhavaram and Thiru. Vi. Ka. Nagar) and also regions adjoining
to Chennai district falling in Kancheepuram and Thiruvallur districts were surveyed.
During field survey about 55 locations affected by flooding were visted and
P a g e | 13
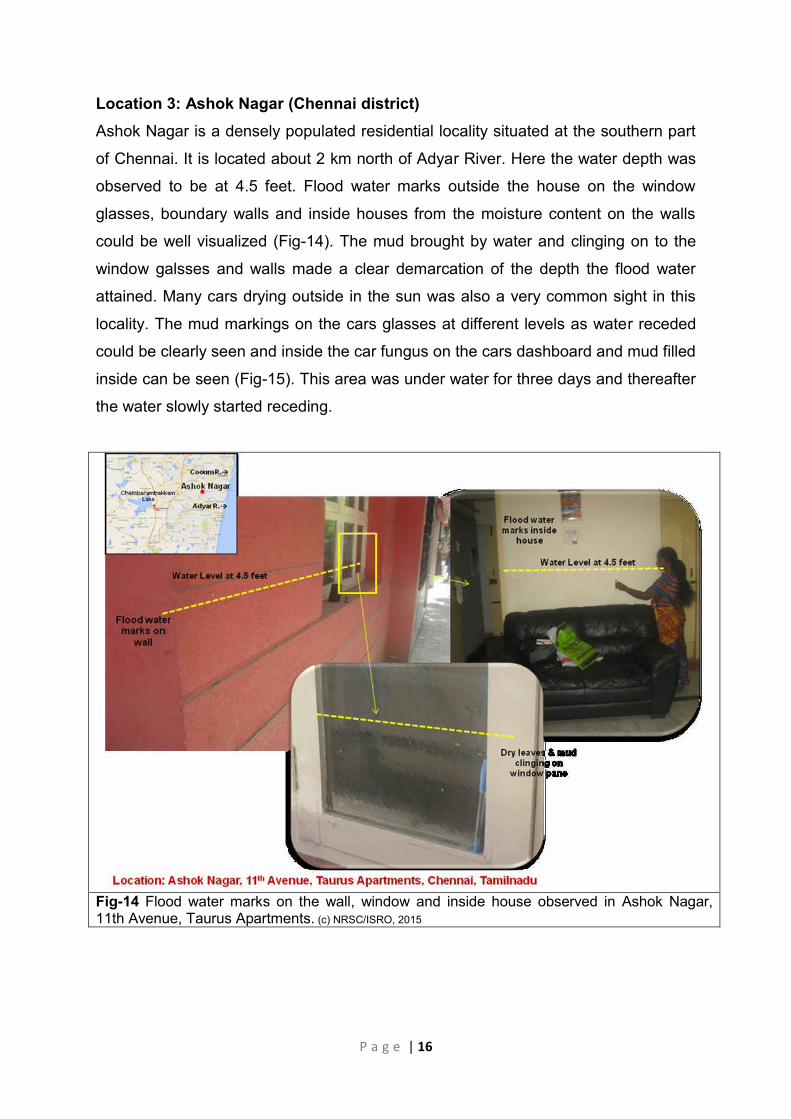
information on the inundated locations viz. flood depth, damage and photo of the
affected location were collected using an Android based mobile application
developed by Bhuvan Team (Fig-10 and Annexure-1). Field data collected using
Bhuvan App was subsequently uploaded onto Bhuvan Portal (http://bhuvan-
noeda.nrsc.gov.in/disaster/disaster/disaster.php).
Fig-10: Maps showing spatial locations of the 55 points (green pins) visited during field.
Location 1: Sikkarayapuram (Kancheepuram district)
Chembarambakkam Lake is located near Chennai in Kanchipuram district of Tamil
Nadu, India, about 40 km from Chennai. It is one of the two rain-fed reservoirs from
where water is drawn for supply to Chennai City, the other one being the Puzhal
Lake. The Adyar River originates from a tank near Manimangalam village in
Sriperumbadur in Kanchipuram district, but it is only when the water from the
Chembarambakkam Lake joins the river that the stream appears. The river then
flows through Tiruvallur and Chennai and flows into the Bay of Bengal at Adyar in
Chennai. In the intervening night of 1st and 2nd December 2015, during incessant
rains, when the PWD Department had to open the flood gates of
Chembarambakkam Lake, causing overflowing of river and flooding of residential
areas and other parts of Chennai especially adjoining the river. Field inspection of
Sikkarayapuram (Chennai district) area near Madha Engineering College which is
located downstream of Chembarambakkam lake shows how severe the flood
situation would have been in that region. The high velocity and the height of water

P a g e | 14
which would have passed through the area could be well imagined from the
demages caused to the electricity poles, hoardings along roadside and road
connectivity in that area (Fig-11). A closer look at the electric poles shows the mud
marks indicates that the flood water at this location reached about 20 feet high on
December 2, 2015 (Fig-12).
Fig-11: Flood damage to road and electric poles suffere due to gushing flood water at Sikkarayapuram (Kancheepuram district), near Madha Engineering College. (c) NRSC/ISRO, 2015
Fig-12 Layers of dried mud marks clinging to electric pole indicating height water attained on December 2, 2015 at Sikkarayapuram (Kancheepuram district) near, near Madha Engineering College. (c) NRSC/ISRO, 2015

P a g e | 15
Location 2: Manapakkam (Chennai district)
Manapakkam area is located 0.65km north of Adyar River and is one of the worse
affected locations. During field inspection of the Sri Ram Chandra Mission (SRCM)
world headquarters located in Manapakkam it was observed that the flood water
depth in this area was about 11.5 feet. The website of SRCM mentions about
occurrence of unparalled damage to the centre due to the flood waters
(https://www.sahajmarg.org/chennai-floods). The centre staff told that water had
entered the centre in the night of December 1, 2015 and the area was under water
for almost 10 days and the water had to be drained out using pumps. The water
marks left on the wall and pillars were clear enough to tell that everything would have
submerged under 11.5 feet of water and on pillars the high water marks and marks
left with recession were very much visible (Fig-13). Severe damage to books,
kitchen, and meditation hall and furniture items was visible on inspection of the area.
Fig-13 Flood water marks on the wall of meditation hall (right) and mission books damaged due to flood waters (left) observed in SRCM Headquarters, Manapakkam. (c) NRSC/ISRO, 2015
P a g e | 16
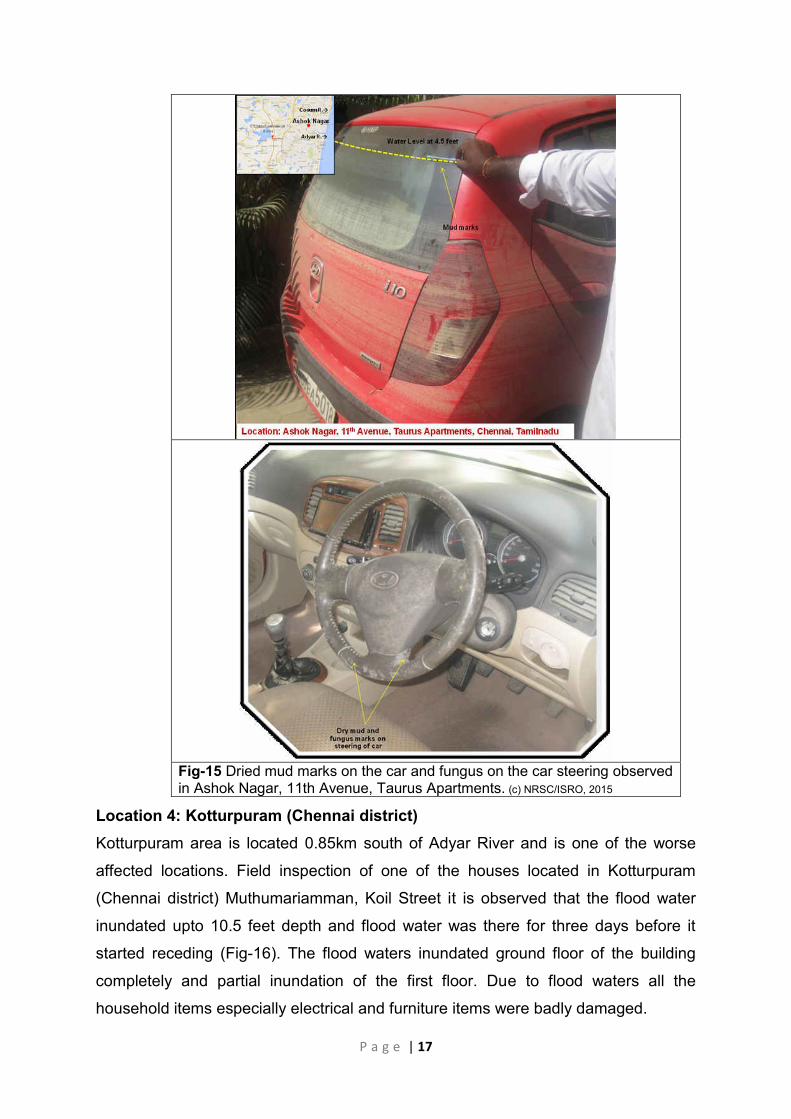
Location 3: Ashok Nagar (Chennai district)
Ashok Nagar is a densely populated residential locality situated at the southern part
of Chennai. It is located about 2 km north of Adyar River. Here the water depth was
observed to be at 4.5 feet. Flood water marks outside the house on the window
glasses, boundary walls and inside houses from the moisture content on the walls
could be well visualized (Fig-14). The mud brought by water and clinging on to the
window galsses and walls made a clear demarcation of the depth the flood water
attained. Many cars drying outside in the sun was also a very common sight in this
locality. The mud markings on the cars glasses at different levels as water receded
could be clearly seen and inside the car fungus on the cars dashboard and mud filled
inside can be seen (Fig-15). This area was under water for three days and thereafter
the water slowly started receding.
Fig-14 Flood water marks on the wall, window and inside house observed in Ashok Nagar, 11th Avenue, Taurus Apartments. (c) NRSC/ISRO, 2015
P a g e | 17
Fig-15 Dried mud marks on the car and fungus on the car steering observed in Ashok Nagar, 11th Avenue, Taurus Apartments. (c) NRSC/ISRO, 2015
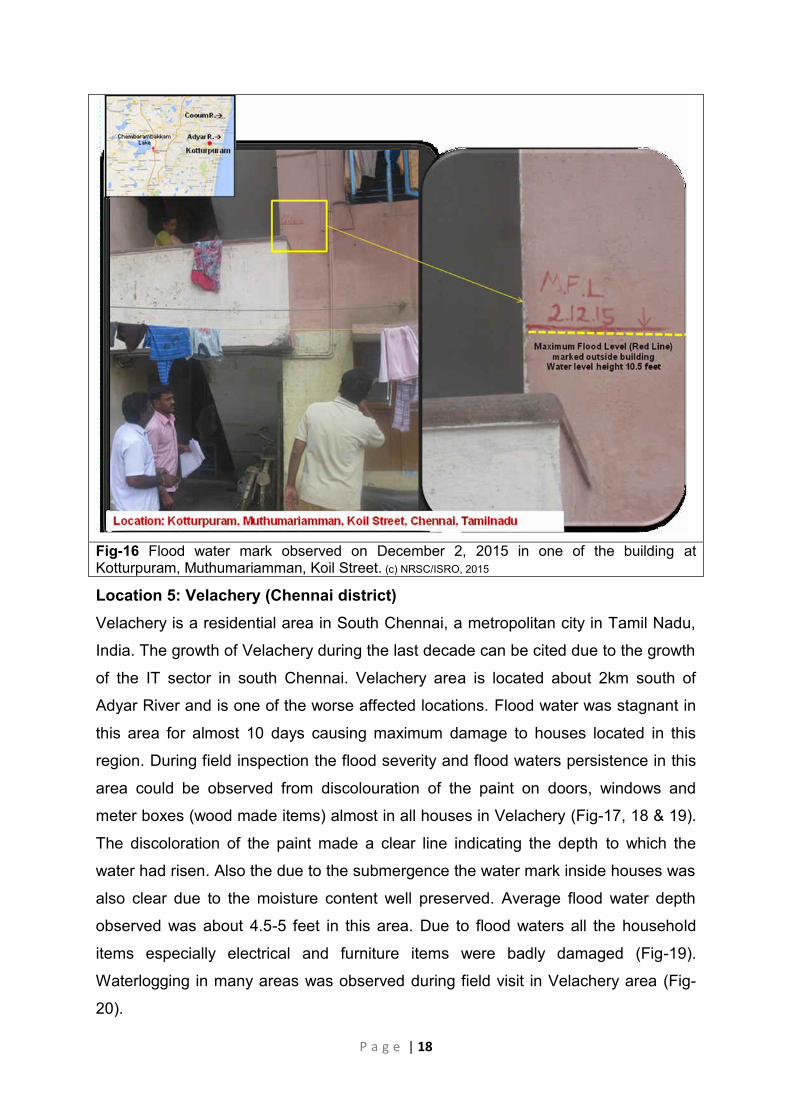
Location 4: Kotturpuram (Chennai district)
Kotturpuram area is located 0.85km south of Adyar River and is one of the worse
affected locations. Field inspection of one of the houses located in Kotturpuram
(Chennai district) Muthumariamman, Koil Street it is observed that the flood water
inundated upto 10.5 feet depth and flood water was there for three days before it
started receding (Fig-16). The flood waters inundated ground floor of the building
completely and partial inundation of the first floor. Due to flood waters all the
household items especially electrical and furniture items were badly damaged.
P a g e | 18
Fig-16 Flood water mark observed on December 2, 2015 in one of the building at Kotturpuram, Muthumariamman, Koil Street. (c) NRSC/ISRO, 2015
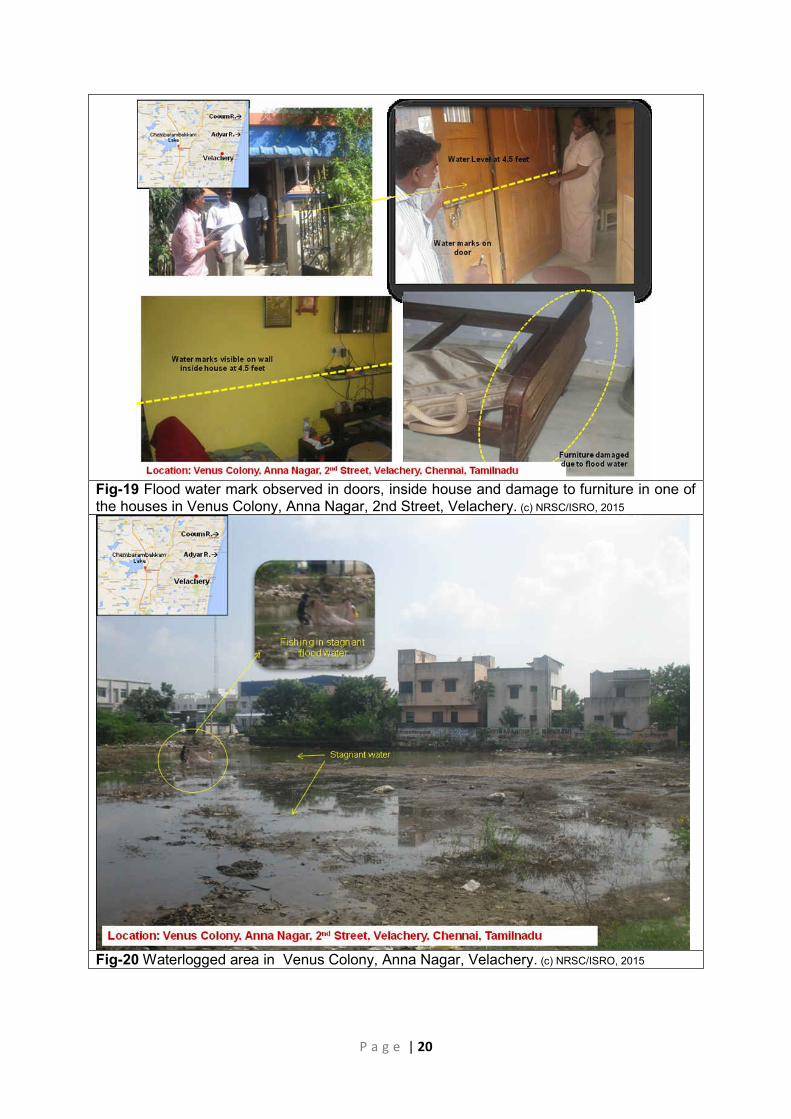
Location 5: Velachery (Chennai district)
Velachery is a residential area in South Chennai, a metropolitan city in Tamil Nadu,
India. The growth of Velachery during the last decade can be cited due to the growth
of the IT sector in south Chennai. Velachery area is located about 2km south of
Adyar River and is one of the worse affected locations. Flood water was stagnant in
this area for almost 10 days causing maximum damage to houses located in this
region. During field inspection the flood severity and flood waters persistence in this
area could be observed from discolouration of the paint on doors, windows and
meter boxes (wood made items) almost in all houses in Velachery (Fig-17, 18 & 19).
The discoloration of the paint made a clear line indicating the depth to which the
water had risen. Also the due to the submergence the water mark inside houses was
also clear due to the moisture content well preserved. Average flood water depth
observed was about 4.5-5 feet in this area. Due to flood waters all the household
items especially electrical and furniture items were badly damaged (Fig-19).
Waterlogging in many areas was observed during field visit in Velachery area (Fig-
20).

P a g e | 19
Fig-17 Flood water mark observed in doors, windows and electric metre box due to discolouration in one of the houses at Plot 1, Venus Colony, Anna Nagar, 3rd Main Road, Velachery. (c) NRSC/ISRO, 2015
Fig-18 Flood water mark observed in doors, windows and electric metre box due to discolouration in one of the houses at Plot 30, Venus Colony, Anna Nagar, 2nd Street, Velachery. (c) NRSC/ISRO, 2015
P a g e | 20
Fig-19 Flood water mark observed in doors, inside house and damage to furniture in one of the houses in Venus Colony, Anna Nagar, 2nd Street, Velachery. (c) NRSC/ISRO, 2015
Fig-20 Waterlogged area in Venus Colony, Anna Nagar, Velachery. (c) NRSC/ISRO, 2015
P a g e | 21
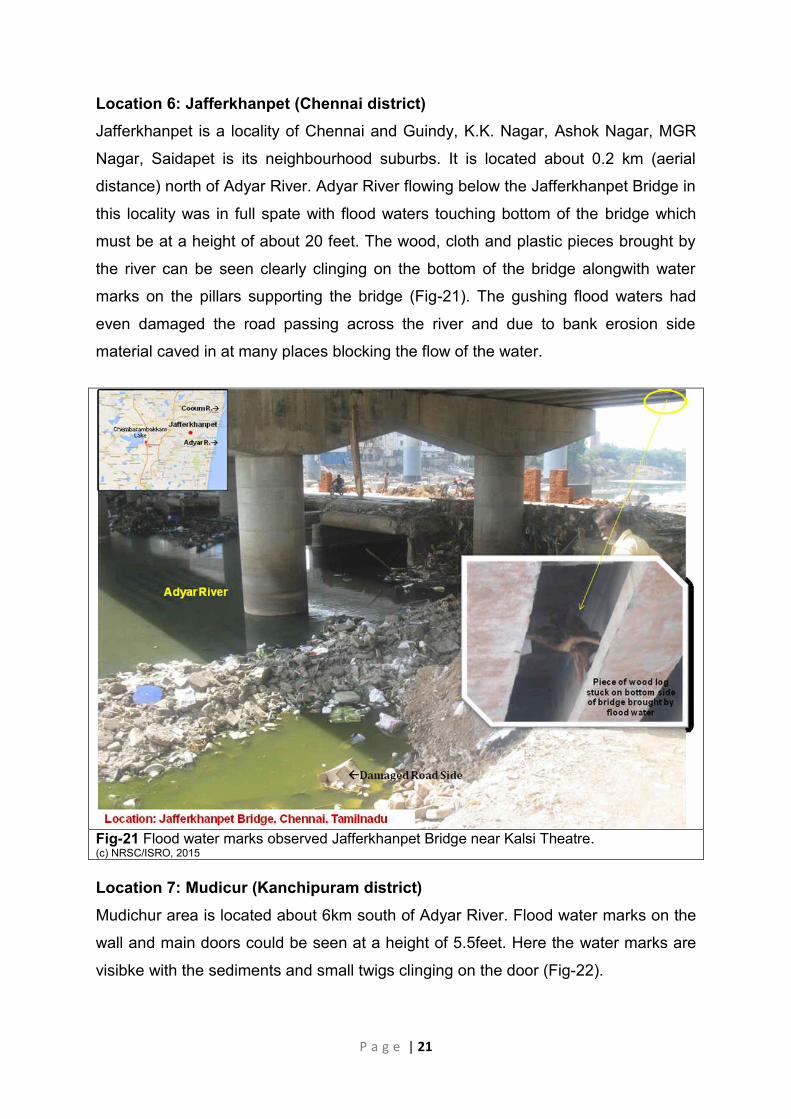
Location 6: Jafferkhanpet (Chennai district)
Jafferkhanpet is a locality of Chennai and Guindy, K.K. Nagar, Ashok Nagar, MGR
Nagar, Saidapet is its neighbourhood suburbs. It is located about 0.2 km (aerial
distance) north of Adyar River. Adyar River flowing below the Jafferkhanpet Bridge in
this locality was in full spate with flood waters touching bottom of the bridge which
must be at a height of about 20 feet. The wood, cloth and plastic pieces brought by
the river can be seen clearly clinging on the bottom of the bridge alongwith water
marks on the pillars supporting the bridge (Fig-21). The gushing flood waters had
even damaged the road passing across the river and due to bank erosion side
material caved in at many places blocking the flow of the water.
Fig-21 Flood water marks observed Jafferkhanpet Bridge near Kalsi Theatre. (c) NRSC/ISRO, 2015 Location 7: Mudicur (Kanchipuram district)
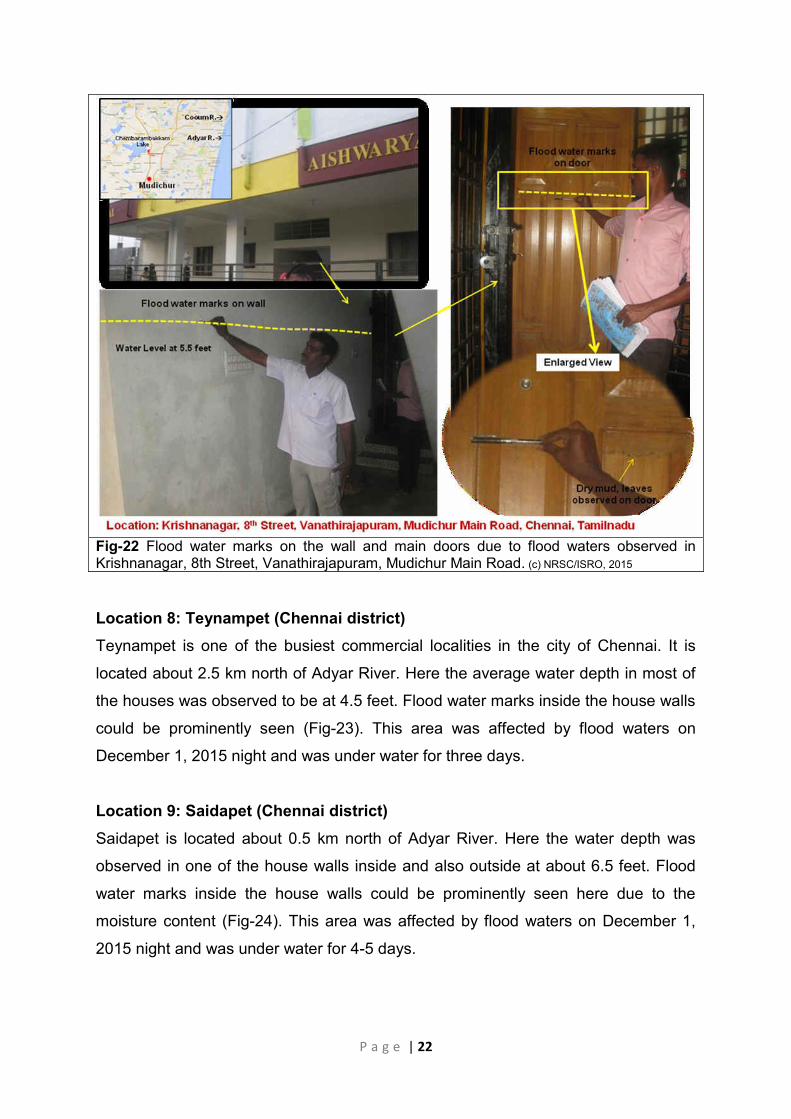
Mudichur area is located about 6km south of Adyar River. Flood water marks on the
wall and main doors could be seen at a height of 5.5feet. Here the water marks are
visibke with the sediments and small twigs clinging on the door (Fig-22).
P a g e | 22
Fig-22 Flood water marks on the wall and main doors due to flood waters observed in Krishnanagar, 8th Street, Vanathirajapuram, Mudichur Main Road. (c) NRSC/ISRO, 2015
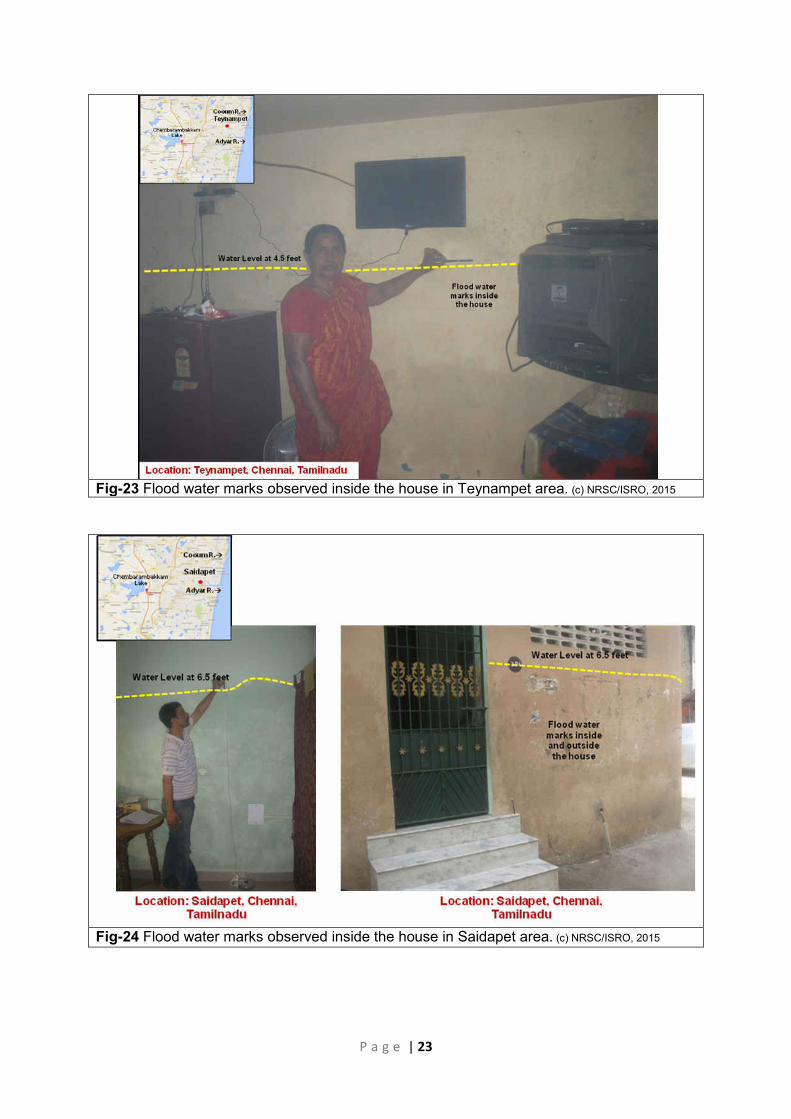
Location 8: Teynampet (Chennai district)
Teynampet is one of the busiest commercial localities in the city of Chennai. It is
located about 2.5 km north of Adyar River. Here the average water depth in most of
the houses was observed to be at 4.5 feet. Flood water marks inside the house walls
could be prominently seen (Fig-23). This area was affected by flood waters on
December 1, 2015 night and was under water for three days.
Location 9: Saidapet (Chennai district)
Saidapet is located about 0.5 km north of Adyar River. Here the water depth was
observed in one of the house walls inside and also outside at about 6.5 feet. Flood
water marks inside the house walls could be prominently seen here due to the
moisture content (Fig-24). This area was affected by flood waters on December 1,
2015 night and was under water for 4-5 days.
P a g e | 23
Fig-23 Flood water marks observed inside the house in Teynampet area. (c) NRSC/ISRO, 2015
Fig-24 Flood water marks observed inside the house in Saidapet area. (c) NRSC/ISRO, 2015
P a g e | 24
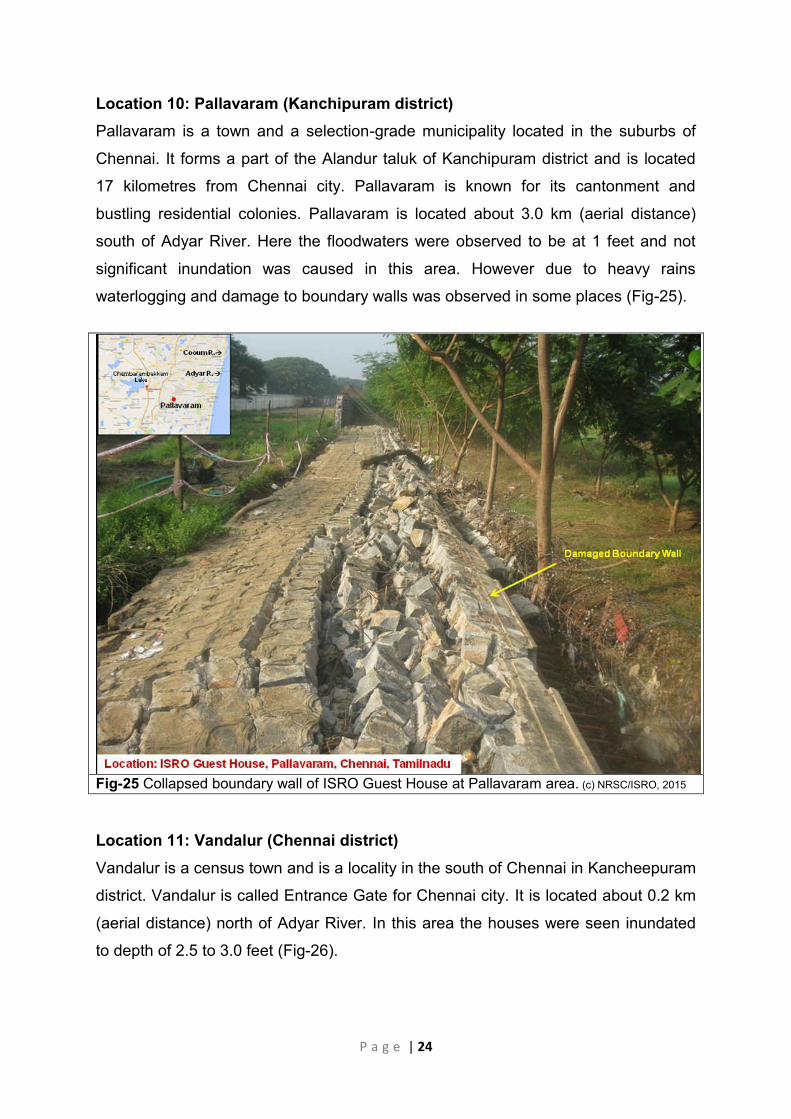
Location 10: Pallavaram (Kanchipuram district)
Pallavaram is a town and a selection-grade municipality located in the suburbs of
Chennai. It forms a part of the Alandur taluk of Kanchipuram district and is located
17 kilometres from Chennai city. Pallavaram is known for its cantonment and
bustling residential colonies. Pallavaram is located about 3.0 km (aerial distance)
south of Adyar River. Here the floodwaters were observed to be at 1 feet and not
significant inundation was caused in this area. However due to heavy rains
waterlogging and damage to boundary walls was observed in some places (Fig-25).
Fig-25 Collapsed boundary wall of ISRO Guest House at Pallavaram area. (c) NRSC/ISRO, 2015
Location 11: Vandalur (Chennai district)
Vandalur is a census town and is a locality in the south of Chennai in Kancheepuram
district. Vandalur is called Entrance Gate for Chennai city. It is located about 0.2 km
(aerial distance) north of Adyar River. In this area the houses were seen inundated
to depth of 2.5 to 3.0 feet (Fig-26).

P a g e | 25
Fig-26 Flood water marks observed inside the house in Saidape area. (c) NRSC/ISRO, 2015
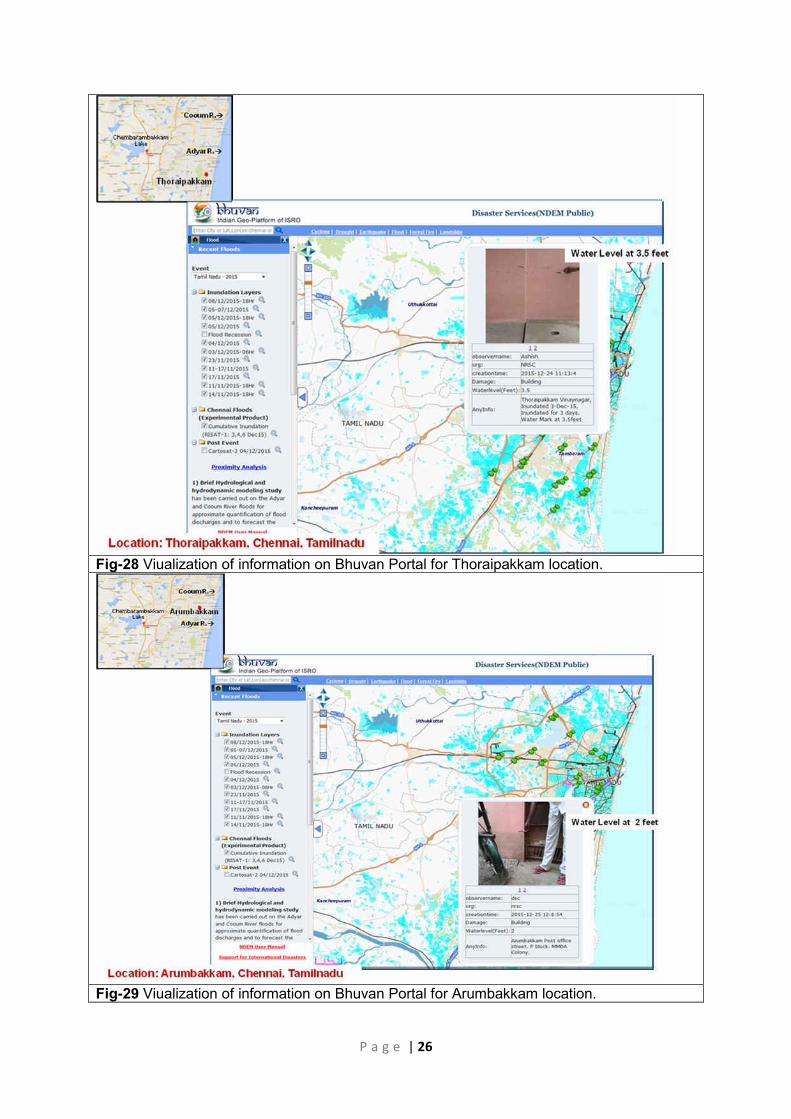
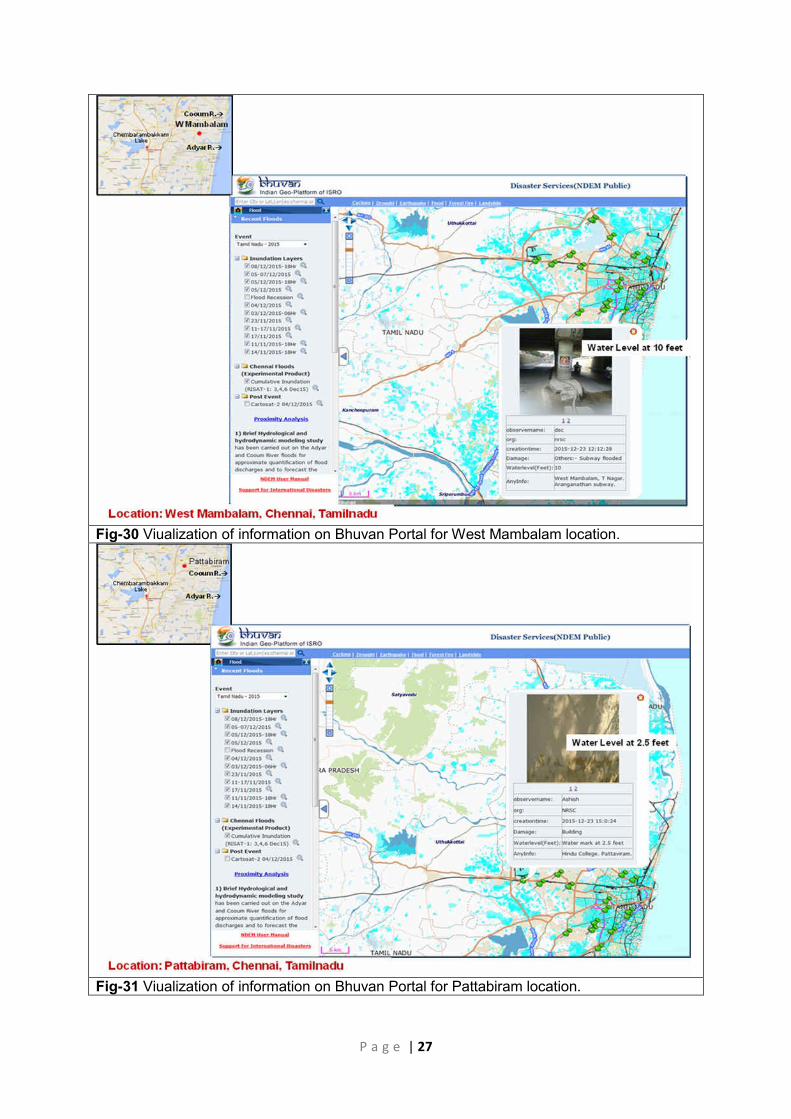
5.0 Geovisulaization on Bhuvan Portal
The locatons visited on ground (Fig-10) and the information collected on the flood
depth and damage using Bhuvan App was uploaded onto ISRO’s Bhuvan Portal for
spatial visualization and wider access (Fig-27 to Fig 31).
Fig-27 Viualization of information on Bhuvan Portal for Sithalapakkam location.
P a g e | 26
Fig-28 Viualization of information on Bhuvan Portal for Thoraipakkam location.
Fig-29 Viualization of information on Bhuvan Portal for Arumbakkam location.
P a g e | 27
Fig-30 Viualization of information on Bhuvan Portal for West Mambalam location.
Fig-31 Viualization of information on Bhuvan Portal for Pattabiram location.
P a g e | 28
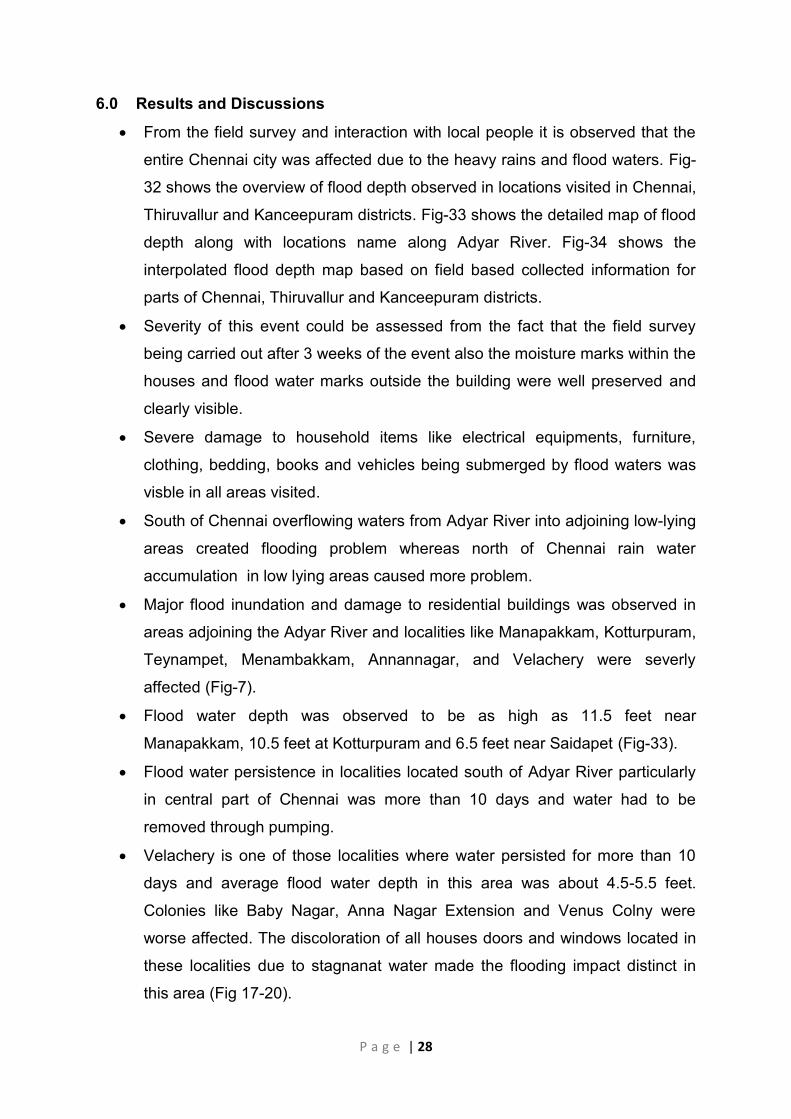
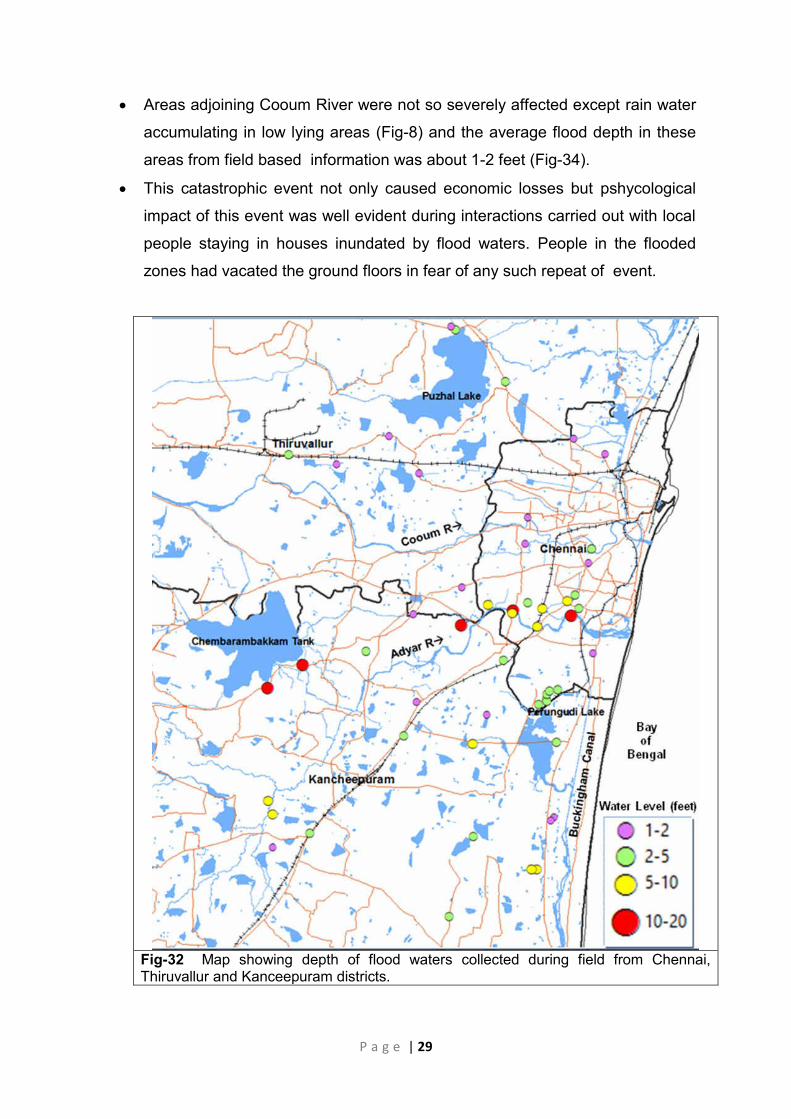
6.0 Results and Discussions
From the field survey and interaction with local people it is observed that the
entire Chennai city was affected due to the heavy rains and flood waters. Fig-
32 shows the overview of flood depth observed in locations visited in Chennai,
Thiruvallur and Kanceepuram districts. Fig-33 shows the detailed map of flood
depth along with locations name along Adyar River. Fig-34 shows the
interpolated flood depth map based on field based collected information for
parts of Chennai, Thiruvallur and Kanceepuram districts.
Severity of this event could be assessed from the fact that the field survey
being carried out after 3 weeks of the event also the moisture marks within the
houses and flood water marks outside the building were well preserved and
clearly visible.
Severe damage to household items like electrical equipments, furniture,
clothing, bedding, books and vehicles being submerged by flood waters was
visble in all areas visited.
South of Chennai overflowing waters from Adyar River into adjoining low-lying
areas created flooding problem whereas north of Chennai rain water
accumulation in low lying areas caused more problem.
Major flood inundation and damage to residential buildings was observed in
areas adjoining the Adyar River and localities like Manapakkam, Kotturpuram,
Teynampet, Menambakkam, Annannagar, and Velachery were severly
affected (Fig-7).
Flood water depth was observed to be as high as 11.5 feet near
Manapakkam, 10.5 feet at Kotturpuram and 6.5 feet near Saidapet (Fig-33).
Flood water persistence in localities located south of Adyar River particularly
in central part of Chennai was more than 10 days and water had to be
removed through pumping.
Velachery is one of those localities where water persisted for more than 10
days and average flood water depth in this area was about 4.5-5.5 feet.
Colonies like Baby Nagar, Anna Nagar Extension and Venus Colny were
worse affected. The discoloration of all houses doors and windows located in
these localities due to stagnanat water made the flooding impact distinct in
this area (Fig 17-20).
P a g e | 29
Areas adjoining Cooum River were not so severely affected except rain water
accumulating in low lying areas (Fig-8) and the average flood depth in these
areas from field based information was about 1-2 feet (Fig-34).
This catastrophic event not only caused economic losses but pshycological
impact of this event was well evident during interactions carried out with local
people staying in houses inundated by flood waters. People in the flooded
zones had vacated the ground floors in fear of any such repeat of event.
Fig-32 Map showing depth of flood waters collected during field from Chennai, Thiruvallur and Kanceepuram districts.

P a g e | 30
Fig-33 Detailed view of flood water depth observed in areas adjoining Adyar River.
Fig-34 Flood depth map based on field data collected for parts of Chennai, and adjoining areas.
P a g e | 31
7.0 Conclusions
From the field experience and also interaction with local population it has
been observed that the urbanization and encroachments of river banks,
marshy, low-lying areas especially Adyar River has aggravated the flooding
problem. The narrow and constrained river with no flood plains left could not
carry the discharges and water simply occupied the adjoining low-lying areas.
A study carried out by Chandan et.al. (2014) on analysis of land use
change pattern in past 4 decades shows that the total urban area has been
increased by more than 20 times mainly from the conversion of grazing,
agricultural and open areas to urban impervious surface. They have observed
that Vegetation cover has dramatically decreased from 70.47% in 1991 to
35.53% in 2013, whereas the non-vegetation i.e. built up, paved areas etc.
have increased 29.53% in 1991 to 64.47% in 2013.
Chennai floods have once again highlighted the urban flooding problem and
has stressed the fact that the urbanization needs to be done keeping in
account the geomorphology, hydrology and land use of the area.
Flat topography of Chennai area makes difficult for the flood waters to drain
out quickly and hence there is a need for proper drainage management.
Management of reservoirs, revival of wetlands which act as as a ‘sponge’ to
absorb the excess water and resizing of the storm water drains keeping in
account the present and projected population should be taken as mitigative
measures.
Based on 2015 floods experience flood hazard plain zoning needs to be done
for future expansion of the city and assessing the threat to habitation living in
various municipal zones for better prpeparedness.
Acknowledgements:
The authors gratefully acknowledge the valuable guidance and support provided by
Director NRSC and Deputy Director, RSA. The support provided by NRSC Data
Centre (NDC) team in planning and providing satellite data on emergency mode is
thankfully acknowledged. Special thanks are due to Dr. Balaji Narasimhan,
Associate Professor, Department of Civil Engineering, IIT Madras, Chennai and his
Team for all the help provided to carry out the field work.
P a g e | 32
References:
Krishnamurthy, R. and Desouza, K.C. 2015. City profile: Chennai, India. Cities. 42
(A): 118-129. doi:10.1016/j.cities.2014.09.004
Wheater, H.S. 2002. Progress in and prospects for fluvial flood modelling. Philos
Trans Roy Soc A: Math Phys Eng Sci, 360 (1796) (2002), pp. 1409–1431
Chandan, M. C., Bharath H. Aithal and Ramachandra,, T.V.(2014). Quantifying
urbanisation using geospatial and spatial metrics - A case study of Madras.
Lake 2014- Conference on Conservation and Sustainable Management of
Wetland Ecosystems in Western Ghats, 13-November- 2014 (Symposium
Web: http://ces.iisc.ernet.in/energy)

P a g e | 33
Annexure 1 : List of locations for which information on flood depth, flood persistence and field photograph of flood water marks was collected during field visit
Location
Water Level (feet)
Inundated On
Flood Persistence District
Teynampet (Alamman Kovil Street) 4.5 1-Dec-15 4 days Chennai
Arumbakkam (Post Office Street) 2.0 2-Dec-15 3 days Chennai
Ashok Nagar (Taurus Apartments) 4.5 2-Dec-15 3 days Chennai
Jafferkhanpet (Bridge) 12.0 1-Dec-15 3 days Chennai
VGP Selvanagar Extn (Plot 79) 2.5 1-Dec-15 4 days Chennai
Anna Nagar (Venus Colony, Plot-1) 4.5 1-Dec-15 7 days Chennai Annai Indranagar (Vanchinathan Street)) 3.0 1-Dec-15 4 days Chennai
Tharamani (Babynagar) 3.0 1-Dec-15 3days Chennai
Adyar (Antariksha Vihar) 1.0 1-Dec-15 3 days Chennai
Nandanam (Turn Bulls Street) 3.5 1-Dec-15 4 days Chennai West Mambalam (Arangnathan Subway) 10.0 2-Dec-15 3 days Chennai
Thousand Lights (Middle School) 1.0 1-Dec-15 5 days Chennai
Thousand lights (Police Quarters) 3.0 1-Dec-15 3 days Chennai
Choolaimedu 2.5 1-Dec-15 3 days Chennai
Anna Nagar (Shanti Colony) 2.0 1-Dec-15 3 days Chennai
Thirumullaivoyal (KK Nagar) 1.5 1-Dec-15 3 days Chennai
Sholinganallur (Anna Street) 2.0 3-Dec-15 2 days Chennai
Vyasarpadi 1.5 2-Dec-15 8 days Chennai
Thoraipakkam (Vinay Nagar) 3.5 3-Dec-15 3 days Chennai
Sholinganallur (Sacred Heart School) 2.0 3-Dec-15 2 days Chennai OMR Rajiv Gandhi Salai (Satyabhama University) 6.0 16-Nov-15 20 days Chennai
OMR Road 6.0 16-Nov-15 20 days Chennai
Mambakkam 3.3 1-Dec-15 3 days Chennai Ekkaduthangal (Jawahar Nehru Street) 5.5 2-Dec-15 4 days Chennai
Samayapurathu Mariamman 7.0 3-Dec-15 3 days Chennai
Saidapet (Salavaiyalar Colony) 6.5 1-Dec-15 4 days Chennai Kotturpuram (Muthumariamna Kovil Street) 10.5 1-Dec-15 3 days Chennai
Valsaravakkam (Kamraj Street) 1.0 1-Dec-15 2 days Chennai
Manapakkam (SRCM Hqtrs) 11.5 1-Dec-15 10 days Chennai
Chrompet (Radha Nagar) 3.5 1-Dec-15 3 days Chennai
Vardharajapuram (Krishna Nagar) 6.0 1-Dec-15 3 days Chennai
Anna Nagar (Venus Colony Plot 30) 4.5 1-Dec-15 7 days Chennai
Tharamani (Bharathi Nagar) 2.5 1-Dec-15 3 days Chennai
T Nagar (Thomas Road) 5.5 1-Dec-15 4 days Chennai
Vandalur (Mooggambigai Koil Street) 2.5 1-Dec-15 7 days Kancheepuram
Mudichur 5.5 1-Dec-15 3 days Kancheepuram

P a g e | 34
Mannivakalam. 1.0 1-Dec-15 3 days Kancheepuram
Echankadu (.Anna Nagar) 7.0 1-Dec-15 5 days Kancheepuram
Thandalam 5.0 2-Dec-15 4 days Kancheepuram
Sithalapakkam (Skylar Avenue) 2.5 2-Dec-15 4 days Kancheepuram Sikkarayapuram (Madha Engg College) 20.0 1-Dec-15 3 days Kancheepuram
Sirukulathur 12.0 1-Dec-15 3 days Kancheepuram
Kundrathur 1.0 1-Dec-15 2 days Kancheepuram
Pallavaram (ISRO Guest House) 2.0 1-Dec-15 2 days Kancheepuram
Madipakkam (Sabari Salai) 1.0 1-Dec-15 2 days Kancheepuram
Ambattor (Sivananda Nagar) 1.5 1-Dec-15 3 days Thiruvallur
Avadi (TNHB Road) 2.0 1-dec-15 3 days Thiruvallur
Erukkancheri (AP Arasu Street) 1.0 1-Derc-15 3 days Thiruvallur
Pattabhiram (Hindu College) 2.5 1-Dec-15 2 days Thiruvallur
Puzhal (GNT Road) 2.5 10-Nov-15 20 days Thiruvallur
Alandur (VOC Nagar Street) 2.5 2-Dec-15 4 days Thiruvallur
Redhills 4.0 10-Nov-15 20 days Thiruvallur
Gandhi Nagar 2.0 10-Nov-15 20 days Thiruvallur
Information presented is based on data observed and collected form intraction with local people during field survey

Head
Disaster Management Support Division
National Remote Sensing Centre (NRSC), ISRO
Balanagar, Hyderabad – 500 625
For more details, please contact