chennai, december 22- 23, 2008 co-chairs · chennai, december 22- 23, 2008 ... india on december 22...
TRANSCRIPT

1
International Marketing Conference on
Creating, Communicating, and Delivering Value
Co-sponsored by the Kotler-Srinivasan Center for Research in Marketing,
Great Lakes Institute of Management, Chennai,
and
North American Society for Marketing Education in India
Chennai, December 22- 23, 2008
Co-Chairs:
V. “Seenu” Srinivasan, Stanford University
S.Sriram, Great Lakes Institute Of Management,Chennai.

2
Dear Marketing Colleagues:
We warmly welcome you to the International Marketing Conference on Creating,
Communicating, and Delivering Value in Growing Markets. This conference held in
Chennai, India on December 22 and 23, 2008 is cosponsored by the Kotler-Srinivasan Center for
Research in Marketing at the Great Lakes Institute of Management, Chennai and the North
American Society for Marketing Education in India (NASMEI).
During the two days of the conference approximately fifty research papers in marketing will be
presented by researchers from all over the world. This document contains the extended abstracts.
If you wish to receive additional details on the research including the full length paper, if
available, please contact the author(s) directly.
Our thanks to Professor Pradeep Chintagunta, President of NASMEI and other NASMEI board
members for cosponsoring the conference and hosting the dinner at the end of the first day, and
Professor Bala V. Balachandran, Founder and Honorary Dean of Great Lakes Institute of
Management for cosponsoring the conference. We also thank Mr. G.R.K. Reddy of MARG
constructions, Chennai and Mr. B.V.R. Mohan Reddy, Chairman and CEO of InfoTech,
Hyderabad for providing financial assistance.
We thank Mr. Sankaran, Mr. Prabhakaran and Mr. Subaash of Great Lakes Administration and
the student team headed by Mr. Ipinder Singh with members Bharat Sawhney, Jimish Shah,
Niyati Kamthan, Prakash Randheer, Rahul Prakash, Ranjith Shankar, Ravi Shastry, Riyaz Vohra,
Surya Sarkar, Vidya Shankar, and Upasana Jani for their administrative assistance.
We are especially grateful to Dr. Taruna Gupta of Great Lakes for her tremendous contributions
in putting together this conference.
We hope you have a wonderful learning experience.
V. Srinivasan S. Sriram
Adams Distinguished Prof. of Mgmt Executive Director & Prof. Mktg.&Strategy
Graduate School of Business Great Lakes Institute of Management
Stanford University, Stanford, CA, USA Chennai, India
CO-CHAIR CO-CHAIR

3
I am pleased that the Kotler-Srinivasan Center for Research in Marketing will sponsor the
next International Marketing Conference at Great Lakes, Chennai on December 22-23, 2008 co-
sponsored by the North American Society for Marketing Education in India.
India is making great progress in developing a growing and vibrant market economy. As
an economy matures, so must the concept and practice of marketing mature. I see marketing as
evolving through five stages:
1. Selling stage. (The idea of setting up selling systems involving distribution, sales
people and advertising).
2. 4P stage. (The idea of integrating the marketing tools).
3. STP stage. (The idea of refining the market targets and branding).
4. Customer Relationship stage. (The idea of building a loyal customer base).
5. Co-creation stage. (The idea of involving customers in developing products and
communications).
Many Indian companies are still stuck in practicing marketing as if it is the same as
selling (stage one). Their marketing is all about promotion and personal selling (One P
marketing – stage 2). More sophisticated Indian companies have made marketing responsible for
preparing an integrated 4P marketing plan (stage 3). Still more sophisticated Indian companies
are refining their market segmentation, targeting, and positioning (STP - stage 4).
Please note that many companies in the West are struggling to implement effective
practices in customer relationship management (stage 4). Only a few are experimenting with
stage 5. My expectation is that stage 5 will become the norm in ten years where companies work
closely with their customers to co-create the products, value propositions, and communications
together.
I look forward to reading the fine papers selected for presentation at the 2008 conference.
Philip Kotler, Ph.D.
S. C. Johnson Distinguished Professor of International Marketing
Kellogg School of Management
Northwestern University
Evanston, Illinois

4
My dear colleagues and friends of marketing,
At the outset, let me welcome you all on behalf of Great Lakes Institute of Management and its
extended family. As a committed Indian I have carried within me the dream, yearning with
passion, compassion, and impatience for great results throughout my long and variegated
academic career living in the U.S. for over 40 years. This dream is to take India back to where it
was centuries ago as the richest and wisest civilization in the entire world especially in higher
education. Execution of this dream started in a humble way in 1973 with Mr. N.S. Ramaswamy
at the creation of IIM, Bangalore to be followed most actively in 1991 after the economic
liberalization of Rao-Manmohan Singh Governments when I as Director of the UNDP Project
launched the PGPM program at Management Development Institute (MDI) at Gurgaon in 1993.
Later in 1996, I started planning for an independent private MBA Institution with Rajat Gupta,
the then Head of McKinsey, our Kellogg school with Deepak Jain, and Wharton with Jagmohan
Singh Raju and the first batch of full time MBAs started in 2001 at the Indian School of
Business. This is now benchmarked as the trendsetter for one-year program for experienced
students. Since I come from Tamil Nadu and have grown up in Chennai, I recognized the need
for a high quality one year program in Tamil Nadu. Thus, I started in 2003, with my passion for
institution building for management education with the support of Tamil Nadu Government and
industry leaders like Dr. Ratan Tata, Jamshyd Godrej, and others Great Lakes Institute of
Management. With just seven months of planning, knowing both the time and the location is
right, the first batch of one year experienced MBAs started in April 2004. In a strategy meeting
with the Board in Bangalore, we decided to focus on marketing as the paramount need for India
and to build on the experience from U.S. and the developed world and thus we created Chairs in
marketing with endowments from Godrej Group and by K.B. Chandrasekar of KBC Group,
California. That is when I decided besides the two chairs let us create a ―Forum for Creating,
Communicating, and Delivering Enhanced Values for the Marketing Community.‖ That
passionate vision gave birth to "Kotler-Srinivasan Center for Research in Marketing" inaugurated
by the Legendary Marketing Messiah, Phil Kotler himself in July 2006 and the Super Srinivasan
of Stanford known for his pioneering research in various areas. Both of them are known to me,
Kotler as a colleague with whom I have published from 1973 and, of course, my beloved brother
from his birth. Both represent the creation, communication and delivery of value by research
and book publications. This forum will be the focal point of our commitment to marketing,
exceeding and excelling in marketing knowledge creation and distribution and added value
enhancements by special programs, executive education, curriculum and other related scholastic
activities. While we are actively searching for the chairs, I am pleased to inform you based on
consultation with Prof.
Srinivasan, Prof. Kotler and the Donor Mr. K.B. Chandrasekar, that we are recommending to
nominate Prof. M.J. Xavier who has been recruited to Great Lakes as a Senior Professor of
Marketing since November as the "K.B. Chandrasekar Distinguished Professor of Marketing."

5
We are also pleased to inform you that besides Prof. Xavier and Prof. Sriram who are in the area
of Marketing, we have also recruited Dr. R. Bharadhwaj, Ph.D. (Maryland) and currently with
IIT Chennai and Prof. Swaminathan from IFMR to join this core group of Marketing at Great
Lakes. With the new Campus to be inaugurated soon and this group of scholars in Marketing, I
am confident we will take Marketing and Sales to newer levels of academic excellence.
I am pleased that NASMEI with its mission for marketing education in India is joining hands
with Great Lakes and the K-S Marketing Center in hosting this year's two day conference,
sponsored by Great Lake and NASMEI with financial assistance from Mr. G.R.K. Reddy of
Marg Constructions, Chennai and Mr. B.V.R. Mohan Reddy, Chairman and CEO of Infotech,
Hyderabad. I am quite impressed and overwhelmed with the schedule and the quality of
presenters. This ideally echoes with our mission of creating, distributing and delivering
enhanced value. I am pleased to inform you that we have just launched our permanent
residential campus in the picturesque East Coast Road on the way to Pondicherry 5 kms. from
the cultural historic center of Mahabalipuram. This new campus will have the Platinum Rating
for Green campus that is energy efficient, eco-friendly, and using biodegradable recycled
materials and that will be the first for a business school, emphasizing our social value
conscience. With the launching of our Ph.D. program with Yale, the K-S center in the new
campus, and the new research journal, we are on a mission to grow with quality and world class
research performance. I need your support and help with the doctoral program and the proposed
new journal in Marketing.
My yesterday is my experience. Today is my experiment and tomorrow is my expectations. I
confidently feel with your help, I can leverage my yesterday's experience, exploiting today's
experiments' good results in achieving our tomorrow's expectations and even excel and exceed.
Won't you join me in this noble crusade of building India and marketing India, Indianness, and
Indian values? With a global mindset and Indian roots with values, we will reach and be
recognized with your help. I welcome you all now and for-ever.
JAI HIND; JAI GREAT LAKES: God Bless You All;
Respectfully;
Bala. V. Balachandran:
Founder & Honorary Dean, Great Lakes Institute of Management and J.L.Kellogg Distinguished
Professor of Accounting, Information Management and Decision Sciences, Northwestern
University.

6
On behalf of the North American Society for Marketing Education in India (NASMEI), I would
like to welcome you all to this conference. NASMEI is honored to be associated with an event
such as this which brings together world-class academic research and researchers. As academic
marketers, the goals of creating, communicating and delivering value, the main themes of this
conference, are central to our pursuits. These three dimensions take on an added importance and
significance in these uncertain and trying times. It is the belief of those of us at NASMEI that a
conference such as this one helps in three related ways. The first is in facilitating a
communication between researchers about what we currently know regarding the various
dimensions of value; and the second is in enabling the creation of new collaborations that can
help us advance our knowledge and thinking in these critical areas. Third, it ensures that we are
on the cutting edge of research in these important areas.
NASMEI is also very grateful to the Kotler-Srinivasan Center and to the Great Lakes Institute of
Management for all the support and input towards the organizing and hosting of this conference.
The society would also like to convey its sincerest thanks to V. ―Seenu‖ Srinivasan and to S.
Sriram for doing all the hard work related to putting together an event like this. ―Seenu‖ is also a
founding member of NASMEI and has played a vital role in its success over the years.
Finally, on a more personal note, once again I regret not being able to attend this conference.
I wish you the very best for an outstanding conference.
On behalf of NASMEI,
Pradeep K. Chintagunta
President

7
MONDAY DEC 22, 2008
Session Time EVENT DETAILS Opening session
8:45 am to 9.30 am MARIGOLD HALL
Welcome Address Professor Bala V. Balachandran Founder & Honorary Dean, Great Lakes Institute of Management and J.L. Kellogg Distinguished Professor of Accounting, Information Management and Decision Sciences, Northwestern University
Keynote Address Professor Dipak Jain, Dean, Kellogg School of Management, Northwestern University and Sandy and Morton Goldman Professor of Entrepreneurial Studies
“Marketing Scholars and Scholarship: The Journey Ahead”
Track A: GULMOHAR HALL Track B: LOTUS HALL
Session M1 9.30 am to 11.00 am M1A: Brands-I M1B: Services Marketing
Refreshment Break 11.00 am to 11.30 am MARIGOLD HALL Session M2 11.30 am to 1.00 pm M2A: Brands-II M2B: New Products-I
Lunch Break 1.00 pm to 2.00 pm MARIGOLD HALL
Session M3 2.00 pm to 3.30 pm M3A: Brands-III M3B: New Products-II
Refreshment Break 3.30 pm to 4.00 pm MARIGOLD HALL Session M4 4.00 pm to 5.30 pm M4A: Consumer
Behavior - I M4B: Customer Loyalty
Dinner 7:30 pm to 9:30 pm MARIGOLD HALL
TUESDAY DEC 23, 2008
Session Time Track A: Gulmohar
Hall
Track B: Lotus Hall
Session T1 9.00 am to 10.30 am T1A: Consumer Behavior-II T1B: Market Research
Refreshment Break
10:30 am to 11.00 am MARIGOLD HALL
Session T2 11.00 am to 12.30 pm T2A: Marketing Communication T2B:Value Creation
Lunch Break 12.30 pm to 1.30 pm MARIGOLD HALL Session T3 1.30 pm to 3.00 pm T3A: Consumer Behavior – III T3B: Marketing General-I
Refreshment Break
3.00 pm to 3.30 pm MARIGOLD HALL
Session T4 3.30 pm to 5.00 pm T4A: Retailing T4B: Marketing General- II
Closing Session
5.00 pm to 5.30 pm MARIGOLD HALL
8
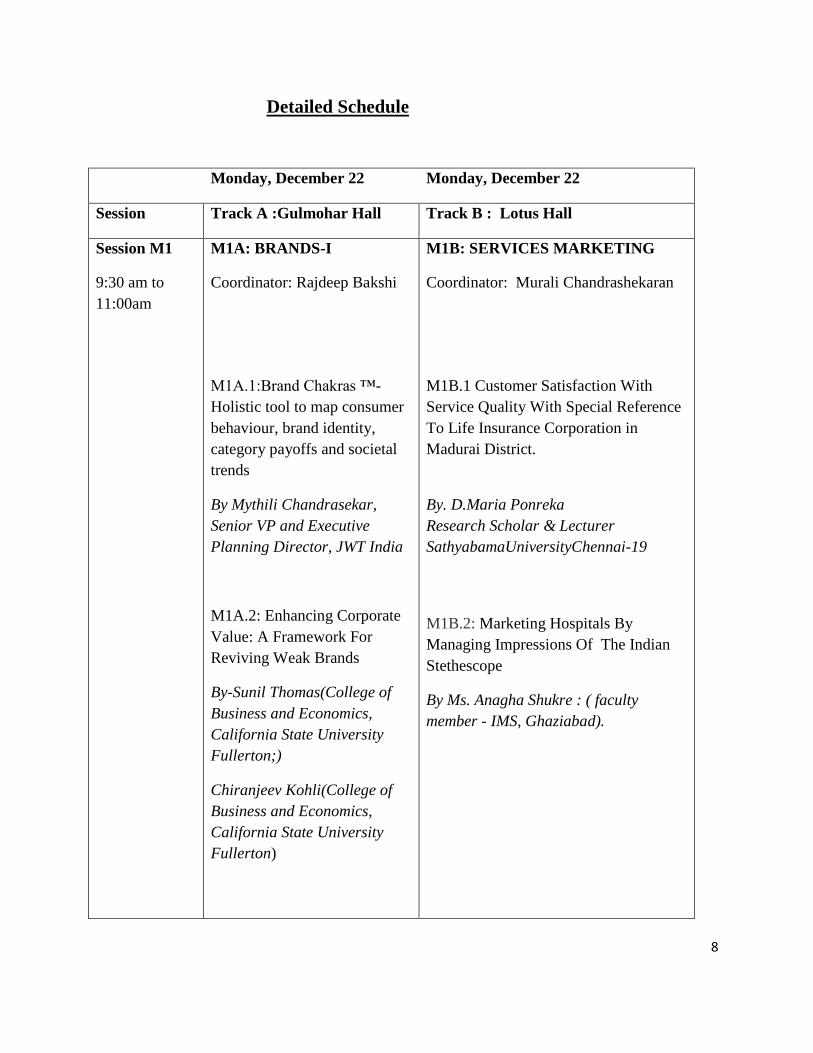
Detailed Schedule
Monday, December 22 Monday, December 22
Session Track A :Gulmohar Hall Track B : Lotus Hall
Session M1
9:30 am to
11:00am
M1A: BRANDS-I
Coordinator: Rajdeep Bakshi
M1A.1:Brand Chakras ™-
Holistic tool to map consumer
behaviour, brand identity,
category payoffs and societal
trends
By Mythili Chandrasekar,
Senior VP and Executive
Planning Director, JWT India
M1A.2: Enhancing Corporate
Value: A Framework For
Reviving Weak Brands
By-Sunil Thomas(College of
Business and Economics,
California State University
Fullerton;)
Chiranjeev Kohli(College of
Business and Economics,
California State University
Fullerton)
M1B: SERVICES MARKETING
Coordinator: Murali Chandrashekaran
M1B.1 Customer Satisfaction With
Service Quality With Special Reference
To Life Insurance Corporation in
Madurai District.
By. D.Maria Ponreka
Research Scholar & Lecturer
SathyabamaUniversityChennai-19
M1B.2: Marketing Hospitals By
Managing Impressions Of The Indian
Stethescope
By Ms. Anagha Shukre : ( faculty
member - IMS, Ghaziabad).

9
M1A.3: The Financial
Determinants Affecting the
Worth of Brand - An Indian
Perspective
By Rajdeep Bakshi
Faculty Member International
School of Business and Media
Kolkata, India
M1B.3: Channel Configuration and
Value Capture in Real Estate Markets
By Kristin Rotte
University of New South Wales
Australian School of Business
Murali Chandrashekaran
University of New South Wales
Australian School of Business

10
Session M2
11:30 am to
1:00 pm
M2A: Brands-II
Coordinator: Tanmay
Chattopadhyay
M2A.1: Decomposing Brands
by Usage and Exploring
Brand-Usage Networks
By Mukesh Bhargava
Kim B. Serota)
OaklandUniversity,Rochester,
Michigan, USA.
M2A.2 Cultural Effect On
Managing Brand In India‖
By Bodhisatta Bhattacharyya
IFIM Business School; works
in the capacity of Manager at
SITAR (A Govt.of India
Society)., Bangalore;
Dr.Nilanjan Sengupta
Professor at IFIM Business
School
Dr. Mousumi S. Bhattacharya
Professor at IFIM Business
School;
M2B: NEW PRODUCTS-I
Coordinator: Rajesh Sethi
M2B.1: Catch-up and Slowdown:
Globalization and Market Penetration of
New Products
By Deepa Chandrasekaran,(Lehigh
University Gerard J. Tellis, University
of Southern California)
M2B.2 What Makes Born-Globals
Innovative? A Customer Relationship
Perspective
By G.M. Naidu(Professor Emeritus
University of Wisconsin-Whitewater)
Kim Daekwan (Florida State University)
Choton Basu(Global Business Resource
Center University of Wisconsin-
Whitewater)
Tamer S. Cavusgil(Georgia State
University)

11
M2A.3: Consumer
imperfection in observation ---
Is it a boon for manufacturers?
: The case of automobile sector
in India
By TanmayChattopadhyay
Marketing Manager,
Amararaja Batteries Ltd.,
Hyderabad &Doctoral
Student, Department of
Management,Birla Institute of
Technology, Mesra
Shraddha Shivani,
Associate Professor,
Department of Management,
Birla Institute of Technology,
Mesra, Ranchi , Jharkhand
Mahesh Krishnan,Sales and
Marketing Director,Goodyear
India Ltd.,Faridabad,Haryana
M2B.3:The Role of Micro-Politics in
the Development of New-to-the-Firm
Products
By Rajesh Sethi,(Clarkson University,
Potsdam, NY, )
Zafar Iqbal,( Depaul University,
Chicago, IL),
Anju Sethi,( Clarkson University,
Potsdam, NY,)
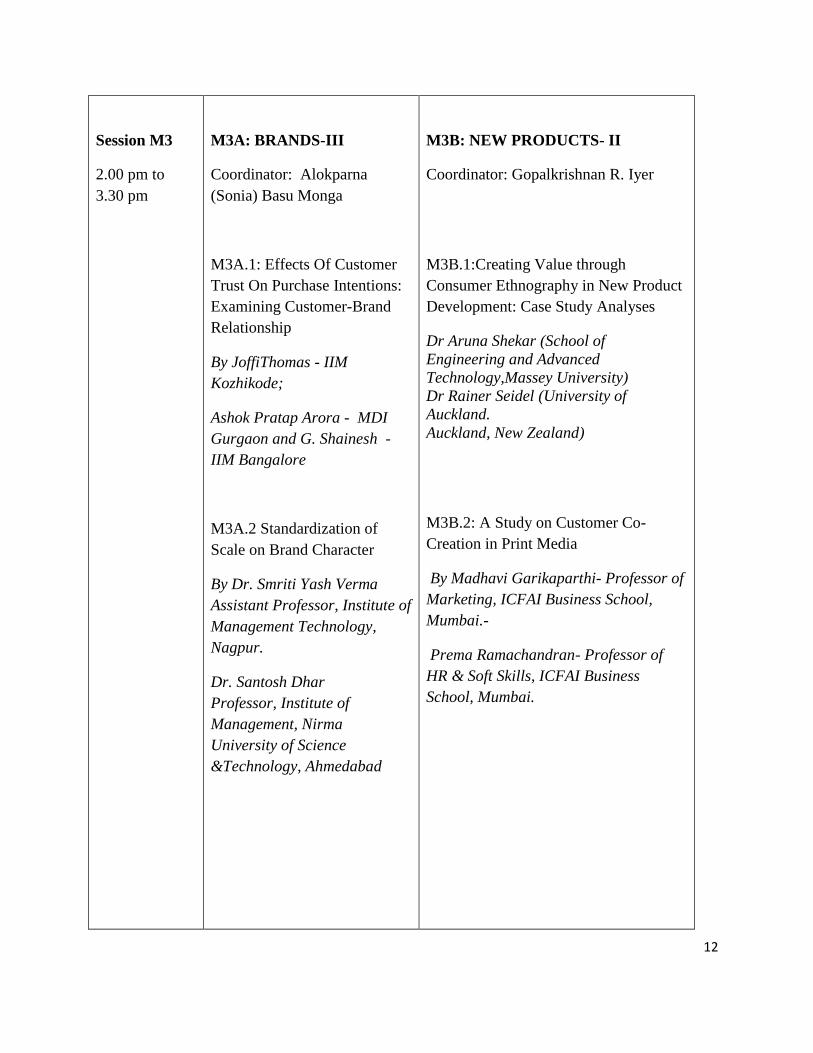
12
Session M3
2.00 pm to
3.30 pm
M3A: BRANDS-III
Coordinator: Alokparna
(Sonia) Basu Monga
M3A.1: Effects Of Customer
Trust On Purchase Intentions:
Examining Customer-Brand
Relationship
By JoffiThomas - IIM
Kozhikode;
Ashok Pratap Arora - MDI
Gurgaon and G. Shainesh -
IIM Bangalore
M3A.2 Standardization of
Scale on Brand Character
By Dr. Smriti Yash Verma
Assistant Professor, Institute of
Management Technology,
Nagpur.
Dr. Santosh Dhar
Professor, Institute of
Management, Nirma
University of Science
&Technology, Ahmedabad
M3B: NEW PRODUCTS- II
Coordinator: Gopalkrishnan R. Iyer
M3B.1:Creating Value through
Consumer Ethnography in New Product
Development: Case Study Analyses
Dr Aruna Shekar (School of
Engineering and Advanced
Technology,Massey University)
Dr Rainer Seidel (University of
Auckland.
Auckland, New Zealand)
M3B.2: A Study on Customer Co-
Creation in Print Media
By Madhavi Garikaparthi- Professor of
Marketing, ICFAI Business School,
Mumbai.-
Prema Ramachandran- Professor of
HR & Soft Skills, ICFAI Business
School, Mumbai.

13
M3A3: What Makes Brands
Elastic? The Influence of
Brand Concept and Styles of
Thinking on Brand Extension
Evaluation
By Alokparna (Sonia) Basu
Monga, (University of South
Carolina,) Deborah Roedder
John,( University of
Minnesota,)
M3B.3 Appropriateness and
Appropriability of Marketing
Innovations
By Gopalkrishnan R. Iyer, Ph.D.
Florida Atlantic University
R. Krishnan, Ph.D.
Professor of Marketing
University Of Miami
Arun Sharma, Ph.D.
University Of Miami

14
Session M4
4:00 pm to
5:30 pm
M4A:CONSUMER
BEHAVIOR-I
Coordinator: Srinivas
Durvasula
M4A.1: An Empirical Analysis
of Recommender Systems and
Market Diversity
By Daniel Fleder and Kartik
Hosanagar, Operations &
Information Management(The
Wharton School, University of
Pennsylvania)
M4A.2: An investigation into
the impact of information
loading on purchase behaviour
By Mathew Parackal
Department of Marketing,
University of Otago, New
Zealand
M4B:CUSTOMER LOYALTY
Coordinator: B. Ramaseshan
M4B.1:Examining Mediating Role of
Attitudinal Loyalty and Nonlinear
Effects in Satisfaction-Behavioral
Intentions Relationship
By Anand K. Jaiswal
Assistant Professor of Marketing
Indian Institute of Management,
Vastrapur, Ahmedabad, India
Rakesh Niraj
Assistant Professor of Marketing
USC Marshall School of Business
M4B.2:Mobile Phone Choice, Corporate
Image And Customer Loyalty
By Dr.P. Ganesan,
Associate Professor, VIT Business
School, VIT University, Vellore
Ms.Amritha Jain, Student, VIT
Business School, VIT University,Vellore

15
M4A.3: Validation of
Consumer Behavior Measures:
A Comparison of Alternative
Approaches
By Srinivas Durvasula
(Professor and Edward
A.Brennan Chair in
Marketing,Marquette
University);
Subhash Sharma(James F.
Kane Professor of
Business,University of South
Carolina);
M4B.3 Performance of Loyalty
Programs in Small Businesses: Some
Australian Evidence
By B. Ramaseshan, Curtin University of
Technology, Perth (Australia)
Megan Johnston, Hismelt Corporation,
Perth (Australia)

16
Tuesday, December 23
Track A: Gulmohar Hall
Tuesday, December 23
Track B: Lotus Hall
Session T1
9.00 am to
10:30 am
T1A:CONSUMER
BEHAVIOR-II
Coordinator: Ashwani Monga
T1A.1 The Impact of Social
Contagion on What Brand to
Buy, How to Buy and Whom
to Buy From: Evidence from
High-Tech Durable Goods
Market
By.Ramkumar Janakiraman (
Mays Business School, Texas
A&M University
Rakesh Niraj (Marshall School
of Business, University of
Southern California)
T1A.2: Acculturation to the
Global Consumer Culture: A
Comparison of Young
Consumers in Nigeria and the
United States
By Steven Lysonski
Professor and Miles Research
Scholar, Marquette University
Srinivas Durvasula
Professor and Edward A.
Brennan Chair in Marketing,
Marquette University
T1B: MARKET RESEARCH
Coordinator: V. ―Seenu‖ Srinivasan
T1B.1: Intention Conviction,
Measurement, and the Prediction of
Consumer Behavior
By Murali Chandrashekaran,
(University of New South Wales)
Kristin Rotte, University of New South
Wales
Frank Kardes, (University of
Cincinnati)
Maria Cronley, (Miami University)
T1B.2: Value Creation through Better
Targetability: Genetic Algorithms for
Dual Objective Segmentation
By P.V. (Sundar) Balakrishnan
Professor of Marketing, Business
Administration Program, University of
Washington, Bothell, WA
Subodha Kumar,Assistant Professor of
MIS,University of Washington, Seattle,
WA

17
Idris Odunewu Marquette Univ
T1A.3: Seeking Bargains: Is
that Worth My Time?
By Ritesh Saini,(GeorgeMason
University)
Raghunath S. Rao,(University
of Texas)
Ashwani Monga, (University of
South Carolina),
T1B.3: Assessing Presidential Priorities:
A Comparison of Three Methods
By V. “Seenu” Srinivasan, (Adams
Distinguished Professor of
Management,Graduate School of
Business, Stanford University)
Alex Makarevich, Doctoral Candidate
in Sociology, Stanford University

18
Session T 2:
11.00 am to
12:30 pm
T2A: MARKETING
COMMUNICATION
Coordinator: Subhadip Roy
T2A.1:Communicating Value:
Persuasion: Role of Affective
and Cognitive bases of
Attitude Functions
By Srividya Raghavan,
Assistant professor and
Doctoral Candidate, Icfai
Business School, Hyderabad
T2A.2 :Information and
Emotive Content in Chinese
Print Advertising:A Scale
Revalidation Analysis
By Rajendar K. Garg
Indiana University of
Pennsylvania
T2A.3: Content analysis of
TVC‘s featuring Celebrities
By Subhadip Roy (ICFAI
Institute for Management
Teachers,Hyderabad)
Alan D’ Souza(Mudra Institute
of Communication Research,
Ahmedabad)
Mari Sudha(Mudra Institute
of Communication Research)
T2B: VALUE CREATION
Coordinator: Kanika Meshram
T2B.1: Value Creation
By N.Jayaraman(Consultant;)
T2B.2: IPL as a Value Creator for its
Stake-holders
By S. Manoharan- Assistant Professor,
IFIM Business School
Dr. Rajendra Nargundkar-
Dean,Continuing Education, IFIM
Business School.
T2B.3: Creating value through seniors‘
social networks in third places
By Kanika Meshram,
Assoc. Prof. Alison Dean
University of Newcastle, Australia

19
Session T3:
1:30 pm to
3.00 pm
T3A: CONSUMER
BEHAVIOR - III
Coordinator: Gautam
Ramdurai
T3A.1: Sticky Choices in
Unfiltered Sets
By A. V. Muthukrishnan
(Hong Kong University of
Science and Technology,
Clearwater Bay, Kowloon,
Hong Kong, China),
Luc Wathieu
ESMT European School of
Management and Technology,
Schlossplatz ,Berlin, Germany,
T3A.2: An evaluation of
microblogging as a marketing
communication Platform
By Gautam Ramdurai(Ogilvy
& Mather Advertising)
T3B: MARKETING GENERAL – 1
Coordinator: Ranjan Banerjee
T3B.1: Exploring the Dynamics of
Trade Show Effectiveness
By Srinath Gopalakrishna, Professor of
Marketing, David and July O’Neal MBA
Professor, (University of Missouri,
Columbia),
Shrihari Sridhar,(Doctoral Candidate in
Marketing, University of Missouri,
Columbia)
Gary L. Lilien, Distinguished Research
Professor of Management Science, Penn
State University, University Park, PA
T3B.2:Influence Of Personality Traits
On Goal Orientation And Performance
Of Salespeople- A conceptual Analysis.
By Binu Markose
PhD Research Scholar
Dept. of Management Studies
Indian Institute of Technology Madras
Chennai – 600 036.
Dr. S. Jayachandran
Professor (Marketing Management)
Dept. of Management Studies Indian

20
Institute of Technology Madras Chennai
T3B.3: Quality And Quantity-The Case
For Multiple Channels
By Ranjan Banerjee, Carlson School of
Management), Kersi Antia, Wisconsin
School of Business),
Shantanu Dutta, Marshall School of
Business
Session T4:
3:30 pm to
5.00 pm
T4A: RETAILING
Coordinator: D.Malmarugan
T4A.1: An Integrative Model
Of Package Size Propensity.
By Amit K Ghosh
Associate Professor
Cleveland State University
T4A.2 : Factors That Add
Value At The Supplier-
Customer Interface:A Case Of
The Fresh Vegetables And
Fruits Industry.
By Ms .K .Suma Rao( PES
School of Engineering
(PESSE), Bangalore.
T4B: MARKETING GENERAL – II
Coordinator: V.J. Sivakumar
T4B.1: The Trend towards Marketing
‗Green Energy‘
By Dr. R. Venkatesh, Faculty Member,
IBS, Chennai
T4B.2: When two is company, is three a
crowd?
ByProf Rajan Mani,
IBS,Chennai

21
T4A.3: A Study On Shopping
Styles In Garment Purchase
and Comparison of Multibrand
& Exclusive Brand Retail
Outlets.
By Prof.D.Malmarugan
(Associate Professor Sadar
Vallbhbhai Patel Institute of
Textiles Management)
T4B.3: Ambush Marketing:Attack and
Counter-Attack Strategies”
By Dr. V.J. Sivakumar, M.Sc., M.B.A.,
Ph.D.
22
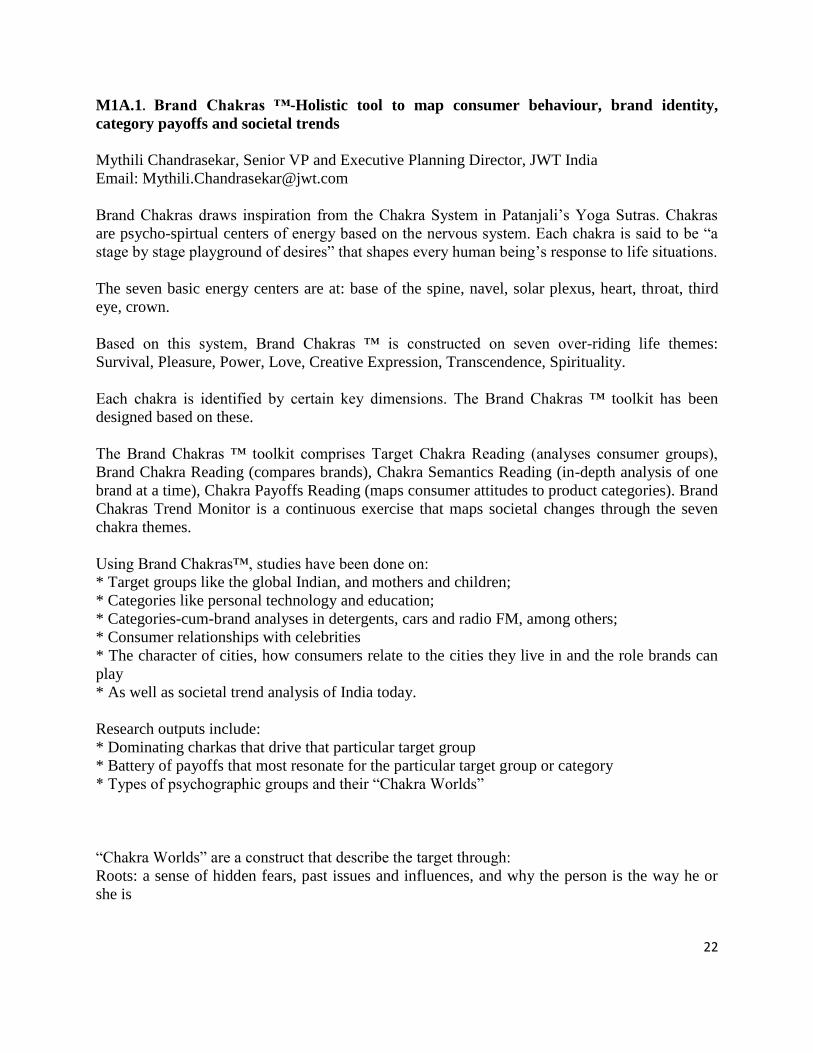
M1A.1. Brand Chakras ™-Holistic tool to map consumer behaviour, brand identity,
category payoffs and societal trends
Mythili Chandrasekar, Senior VP and Executive Planning Director, JWT India
Email: [email protected]
Brand Chakras draws inspiration from the Chakra System in Patanjali‘s Yoga Sutras. Chakras
are psycho-spirtual centers of energy based on the nervous system. Each chakra is said to be ―a
stage by stage playground of desires‖ that shapes every human being‘s response to life situations.
The seven basic energy centers are at: base of the spine, navel, solar plexus, heart, throat, third
eye, crown.
Based on this system, Brand Chakras ™ is constructed on seven over-riding life themes:
Survival, Pleasure, Power, Love, Creative Expression, Transcendence, Spirituality.
Each chakra is identified by certain key dimensions. The Brand Chakras ™ toolkit has been
designed based on these.
The Brand Chakras ™ toolkit comprises Target Chakra Reading (analyses consumer groups),
Brand Chakra Reading (compares brands), Chakra Semantics Reading (in-depth analysis of one
brand at a time), Chakra Payoffs Reading (maps consumer attitudes to product categories). Brand
Chakras Trend Monitor is a continuous exercise that maps societal changes through the seven
chakra themes.
Using Brand Chakras™, studies have been done on:
* Target groups like the global Indian, and mothers and children;
* Categories like personal technology and education;
* Categories-cum-brand analyses in detergents, cars and radio FM, among others;
* Consumer relationships with celebrities
* The character of cities, how consumers relate to the cities they live in and the role brands can
play
* As well as societal trend analysis of India today.
Research outputs include:
* Dominating charkas that drive that particular target group
* Battery of payoffs that most resonate for the particular target group or category
* Types of psychographic groups and their ―Chakra Worlds‖
―Chakra Worlds‖ are a construct that describe the target through:
Roots: a sense of hidden fears, past issues and influences, and why the person is the way he or
she is

23
Core Emotional Essence: the key themes that drive the person‘s life, and responses to situations,
what the person seeks the most
Key Strategies: ways in which the person tries to cope, dominant behaviour patterns that brands
need to respond to
Fruits: what the person hopes to or manages to achieve, and roles brands can play
The paper for NASMEI – Great Lakes seminar will demonstrate the Chakra Payoffs Reading
Tool through outputs from some of the qualitative studies.
Mother India: From Children as Responsibility to Children as Opportunity – a study on SEC A,B
mothers and their children (8 to 16 year olds) to examine changing notions of motherhood
today. Findings include dominating chakras, battery of payoffs, and three types of mothers and
their Chakra Worlds.
The Yin Yang of Technology Payoffs – a study among 25 – 35 year old early adopters working
in technology companies, which attempted to answer the question what are the deeper payoffs
that consumers seek and are getting from technology, both in their personal lives and their work
lives. Findings include dominating chakras, battery of payoffs mapped into a model, five types of
relationships with technology and Chakra World of the early adopter.
The Call for Dronacharya: a study among graduate and post graduate students to elicit what they
want from their education providers. Findings include types of students and their Chakra Worlds,
battery of payoffs mapped into a model, and what they seek from faculty.
An overview of how Brand Chakras can be used to analyse societal trends: some glimpses from
Chakra Watch, a seven part newspaper column that looked at India through the seven charkas.
For further information:
www.brandchakras.com
www.chakrawatch.blogspot.com

24
M1A.2: Enhancing Corporate Value:A Framework For Reviving Weak Brands
Sunil Thomas- College of Business and Economics, California State University Fullerton;
Email: [email protected].
Chiranjeev Kohli- College of Business and Economics, California State University Fullerton;
Email: [email protected].
Strong brands are a company‘s most valuable assets. However, over time, many brands
become weak, resulting in a significant loss of equity and value for the company. Many once
famous brands, such as Oldsmobile, PanAm, and Woolworth met untimely deaths. Many others
may continue to languish. In today‘s market, new product introductions are both expensive and
risky. As such, it is worthwhile to evaluate brands that may be losing ground, and to make a
concerted effort to revive them. There is, however, a dearth of studies that focus on this topic.
We deconstruct brand equity to investigate the leading causes of brand decline and suggest
guidelines to avoid brand demise, and ways to revitalize struggling brands. We reviewed
academic literature and trade publications on this topic, examined case studies of brands that
died or were revitalized, and conducted in-depth interviews with practitioners who were
knowledgeable about these brands. We make a distinction between sudden death and steady
decline, and offer insights into assessing the viability of reviving a brand in steady decline, and
suggest various approaches that can be used to strengthen these brands.

25
M1A.3 : The Financial Determinants Affecting the Worth of Brand - An Indian Perspective
Rajdeep Bakshi
Faculty Member International School of Business and Media Kolkata, India
Email: [email protected]
The paper attempts to focus on the exorbitant prices at which brand transfers have taken place in
the Indian markets. The paper also tries to analyze by adopting the procedure of literature
review, why companies are interested in procuring brands of others. The review of the literature
reflects the fact that brands are tools for the competitive advantage for the company. The key
findings of the literature review are the demand for acquiring brand of one company by the other.
Brands have financial value leading to the rise intangible component in business. The financial
worth of brand has made bankers to consider brands as collaterals. Understanding that brand
have financial value the practice of brand valuation began in the late 1980‘s. Presently as per
Indian Accounting Standards 26 the financial value of brand can be included in the company‘s
balance sheet only if it has been acquired form another company. The primary data collected
from 249 respondents form Kolkata have been treated by the technique of factor analysis using
the method of Principal component analysis with Varimax method of rotation and Kaiser
Normalization. The treatment revealed a set of six factors. The reduced factors explained 70.33
percent of the total variance. To ensure validity of factor analysis the KMO and the Bratlett list
of Sphericity was conducted. In was interesting to note that the score of the KMO test is 0.553
and the value of significance for the BLS test is 0.00001 indicating that the factor analysis was
able to produce acceptable results. Based on the factors deduced and associated mathematical
computation a method is suggested through the simplified expression (A) presented below for
the purpose of computation of the value of the brand. Let there be k (k= 1, 2…n) be the number
of brands under the brand umbrella. If there is one brand then by restricting the value of k to 1
the value of the brand can be determined using the expression.

26
M1B.1: Customer Satisfaction With Service Quality With Special Reference To Life
Insurance Corporation In Madurai District.
D.MARIA PON REKA
Research Scholar & Lecturer
Sathyabama University,
Chennai -119
E-mail : [email protected]
Insurance is the best form of fortification against risk that has been formulated by man.
Since its emergence , insurance has become unavoidable to every aspect of human life
from health disorders to building properties, from household articles to multimillion –
dollar projects . The insurance industry in India was opened up to private sector
participation in the year 2000. Because of the entry of private players in the insurance
market , LIC has lost 26% market share to the private players although both , market size
and the insurance premium being collected , are on the rise . In 2007, LIC accounted for
74.18% of the total insurance market in India. In view of the increasing competition , this
paper attempts to understand the dimensions of service quality , which helps ensuring
maximum customer satisfaction , and hence helps LIC to acquire a larger share in the
market. The study was done on a stratified random sampling design.
METHODOLOGY
The Data
This research is based on both primary and secondary data. The questionnaire has been finalized
after a pilot study, consisted of 101 sample respondents. The secondary information has been
collected from the internet, government agencies, and publications. By using the stratified
random sampling technique, the data was collected from 101 sample respondents, residing in and
around Madurai district. 22 questions or statements related to service quality dimensions based
on past literatures. The respondents were asked to rate each statement on the Likert scale of 1 to
7 (1 = strongly disagree, 7 = strongly agree).
TECHNIQUES OF ANALYSIS
Descriptive Statistics
The descriptive statistics has been used to find out the mean and standard deviation of each
SERVQUAL statement on both perception as well as expectation.
Factor Analysis
The purpose of using the factor analysis in this context is to identify and analyse the important
factors on the quality of service in the insurance sector as perceived by the insured s of
LIC.
FINDINGS & INTERPRETATION

27
The mean and standard deviation of LIC data revealed that LIC is good at Reliability ,
Assurance , and Empathy features than at Tangibles , Responsiveness features of the life
insurance service.These features are based on the standard SERVQUAL dimensions.
Through factor analysis , the factors identified with new names which influence the
quality of service rendered by the LIC in Madurai district are Individualized attention,
Performance, Tangibles, Trustworthiness and Courtesy.

28
M1B.2: Marketing Hospitals By Managing Impressions Of The Indian Stethoscope
Ms. Anagha Shukre: (faculty member - IMS, Ghaziabad).
Email: [email protected];
1.Introduction And Need Of Study :
*Impression management is a growing field where in one studies the self-presentational
approach of individuals and the organizations. It is a process by which one attempts to control
the impressions the others form of them. It has applications in building interpersonal skills,
relations and interactions amongst teams and departments within an organization and outside it,
as well. Many healthcare services and premier hospitals in India are consumer centric. With the
gamut of activities like the introduction of free consultation cards, organizing camps for free
check ups and free tests for most common types of diseases, the focus has been on the
consumers, creating and enhancing value based services, thereby influencing the consumers and
thus managing the impressions the consumers form. These services are often blamed to be even
over-treating their patients. However, the focus needs to change now, as it is the choice of the
doctors, which determines the flow of traffic to the hospitals. The hospital is known by the
doctor and then the hospital gains from it. The services of a hospital too are very strongly
determined by how good the doctor is in terms of treating his patients. Also, it has been observed
that the doctor‘s advice and suggestions are mostly paid attention to by the consumers. Many
convenience goods like chewing gums, toothbrushes, soaps use the ‗doctors‘ recommendations‘
formula to promote themselves. In the healthcare market where the word of mouth is highly
predominant over many other factors of the promotion mix, hospitals cannot afford to ignore the
impressions the doctors form of such hospitals - their work places.
2.Objectives:
To identify factors which a doctor rates for a hospital he chooses to work for,
To find out reasons necessary for creating and managing impressions of the doctors who are
experts in their fields, which the hospital needs to take care of,
To understand how the hospitals can sell themselves better to these medical experts,
3.Research Methodology
The study used an exploratory design and was conducted in three stages. In the first stage,
existing literature drawn from the domains of marketing and human resources was reviewed.
Sources included journals, books, periodicals, newspapers and on line articles. As a part of the
second stage, a pilot survey was conducted which included an half hour open ended interview
with twenty doctors from across their specialization areas. The interview focused on the
objectives listed above. Based on the content analysis and the screening, the first objective
resulted into seven factors, out of which four factors were broken down further into sub-items.
The four parameters were also ranked using weighted average. The second objective resulted
into five factors and the third objective into six major areas. The seven factors include:1The turn
over of the patients in the hospital,2Technology/medical aids used 3.Infrastructure 4.Supportive
Management 5.Accredition 6.Referral panel/credibility of doctor 7.Self- growth/learning

29
The four factors along with their sub–items include:
1.Infrastructure:
Operation and maintenance of equipments; Punctuality of support staff
Durability of materials ;Quality of materials used; Spacing in corridors and doorways; Adequate
number of lifts ;General Tidiness/cleanliness; Safety and security of self; Easy access and
approach to the hospital; Separate parking lots to doctors; Ready to use library; Associated
pharmacy.
2.Referral Panel/credibility of a doctor
Word of mouth from peers and friends;Academic background ;Research papers/
Conferences/seminars attended and conducted;Awards and memberships.
3.Technology/medical aids used
Latest equipments competent with the western world
Live chat sessions
Tele medicines
On line help to patients
4.Accredition
Recognition by govt. recognized bodies
Affiliation to united nations‘ governing bodies
Health summits/exchange programs undertaken by the hospital
The no. of expert areas in the hospital
Knowledge management support/literature services

30
M1B.3: Channel Configuration and Value Capture in Real Estate Markets
Kristin rotte
University of New South Wales
Australian School of Business
Email: [email protected]
Murali Chandrashekaran
University of New South Wales
Australian School of Business
Email: [email protected]
This research focuses on the effect of the channel configuration on value outcomes in real estate
markets. In particular, we examine the dynamics when the buyer and seller are represented by
the same agent, or by individual agents who work for the same real estate company. These ‗dual
agency‘ situations, where the same agent (or company) has an interest in both sides of the
transaction, occur frequently (over one in four houses in the US are co-brokered within same
firm and over one in five houses are listed and sold by same agent). Given the obvious conflict
of interest considerations, many policy makers have advocated outlawing this practice and
numerous lawsuits have recently dealt with this issue.
To assess whether any systematic effects of dual agency occur, we advance, and test using
Multiple Listing Service data, an anchoring-and-adjustment model of price convergence in which
the real estate agent influences the initial sale price anchor as well as the subsequent adjustment
to this anchor that lead to a final sale price. The proposed model that incorporates two sources of
heterogeneity: (a) among agents in where they anchor buyers and the extent of anchor adjustment
they help generate when formulating a final sale price, and (b) among sellers and buyers,
respectively, in the extent to which they approach the sale from ‗above‘ and ‗below‘ the anchor
price.
Focusing squarely on the potential impact of dual agency on real estate prices, we develop
models that trace a house from the original price that is set by the seller to the final sale price of
the house. Extending the extant hedonic price perspective, the proposed consumer-based models
explicitly incorporate the notion that tensions exist in the process: sellers approach the sale from
‗above‘ the latent value of the house, buyers adopt an initial price anchor with the help of the
agent and approach the sale from ‗below‘ this anchor, and agents help ‗converge‘ the two parties
on a final sale price. We label this the ABC pricing model, and investigate the impact of dual
agency within this framework. We utilize multiple listing service (MLS) data describing home
sales in a large US city in the Midwest to address our research objectives.
The analysis proceeds in two stages. First, we establish the validity of the ABC model over the
extant hedonic price model in understanding the drivers of the asking price set by the seller and
the final sale price paid by the buyer. Second, on the foundation of the ABC model and armed
with the evidence that the asking price set by the seller captures a significant portion of the
‗latent value‘ of the house (represented by the attributes of the house and location differences),
we develop an ‗anchoring-and-adjustment‘ based process model to answer the key question:

31
Does dual agency help converge the buyer and seller in an unbiased manner or does it harm one
or the other party?
We theorize, and demonstrate that in addition to the above-below tension, the price at which the
buyer is anchored in the process is fundamentally influenced by the agency representation.
Buyers represented by non-dual agents are more likely to anchor around the latent value of the
house, while those represented by dual agents appear to be anchored at the higher asking price of
the house. The results also reveal another source of asymmetry in the process – while the final
sale price paid by buyers represented by non-dual agents evidences a downward adjustment from
the initial anchor, the final sale price paid by buyers represented by dual agents sees no
significant adjustment from the already higher anchor. The ‗higher anchor-no adjustment‘
‗double-whammy‘ results in buyers paying more when represented by dual agents as opposed to
non-dual agents. We conclude the paper with a discussion of key findings, as well as research
and consumer welfare implications.

32
M2A.1: Decomposing Brands by Usage and Exploring Brand-Usage Networks
Mukesh Bhargava ([email protected])
Kim B. Serota ([email protected])
Oakland University, Rochester, Michigan, USA
The importance of creating and managing brand as assets is well documented in the
marketing literature. Brands represent the assets created by marketing investments. Brand health
measures capture the efficacy of past investments and aid future plans. The purpose of this paper
is to demonstrate that asset value is influenced by the ways in which customers use brands.
Most companies manage more than one brand in a product market space. Some of the
brand affiliations are happenstance resulting from mergers and acquisitions (Black and Decker
and Dewalt; Ford and Jaguar; Jaguar and Tata Motors). Many times this is a deliberate strategy
to consolidate the coverage of various segments of the market (Toyota and Lexus; Walt Disney
Pictures and Hong Kong Disneyland). In such situations, usage determines whether the brands
complement, substitute, or extend, and simple brand health measures are not sufficient to capture
the role of the brand in the portfolio.
Brand usage can be defined in terms of the major task definitions that the brands satisfy.
Adapting from the literature on Market Structure Analysis (MSA), we find that knowing brand
usage patterns and observing the nature of asymmetry in use can provide insights about the
strategic role of one brand given the usage of other (portfolio and competing) brands. In this
approach, the basic unit of analysis is brand-usage rather than the brand itself.
Conjoining brands with usage has three important outcomes. First, as George Day, Allan
Shocker, and Rajendra Srivastava have asserted, products should be defined by usage; in their
MSA work brands are recognized as the most narrowly defined level of product. By marrying
brand and usage into a single construct we re-conceptualize MSA in such a way that recognizes
categories and brands are interdependent. Second, brand-usage relationships, which we
operationalize as networks, draw our attention to the links between brand-usages rather than
focusing solely on the brands themselves. The brand-usage links have characteristics that are
relevant for brand strategy. Most importantly, the links show where relationships exist and
whether each relationship is an extension, substitute, complement, or co-optetion. Finally, the
strength of links is a dynamic quality that changes with market forces and consumer behavior;
observing the changing patterns of linkage promotes understanding of where future growth
opportunities and competitive threats may come from.
Brand-usage situations encompass markets where there is a dominant single use (seen in
the extremes of emerging and fully mature categories), as well as multiple uses. Over a period of
time, the needs and usages of both individual brands and clusters of brands evolve to multiple
dominant patterns. These may manifest as different levels of loyalty to one brand or different
combinations of brand purchases satisfying the same or different needs. These two dimensions,
types of usage situation and number of brands being used, lead us to develop a typology of brand
usage:
33
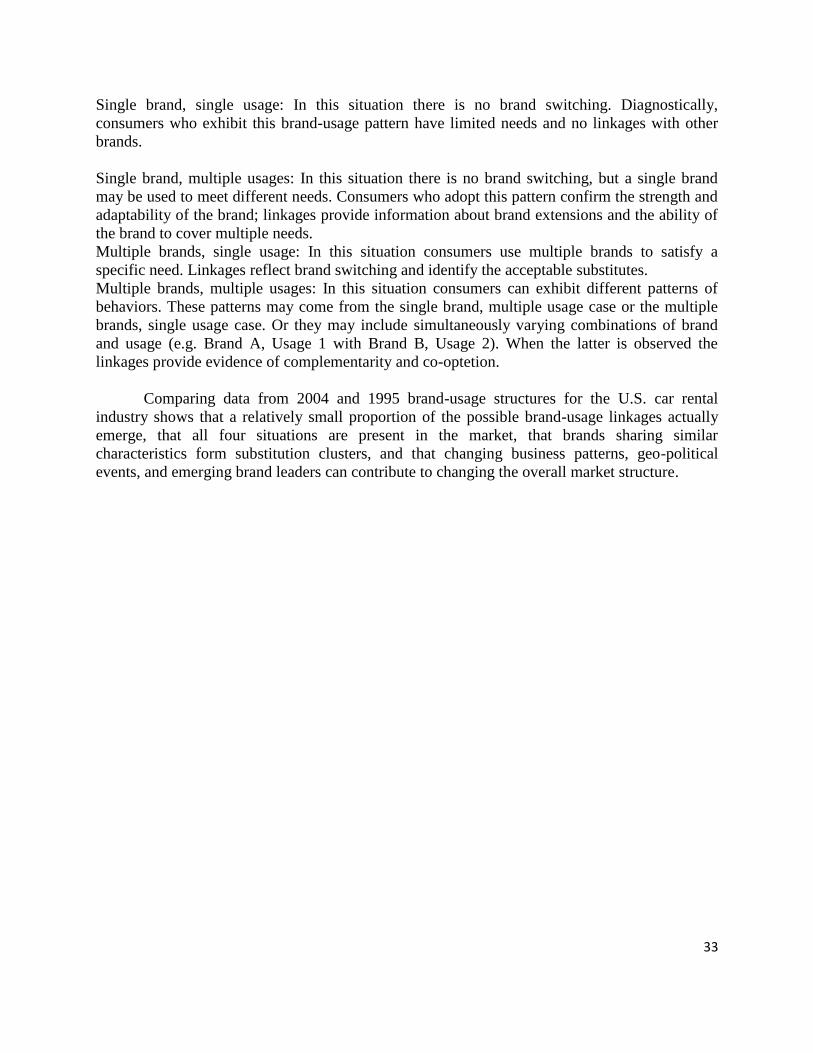
Single brand, single usage: In this situation there is no brand switching. Diagnostically,
consumers who exhibit this brand-usage pattern have limited needs and no linkages with other
brands.
Single brand, multiple usages: In this situation there is no brand switching, but a single brand
may be used to meet different needs. Consumers who adopt this pattern confirm the strength and
adaptability of the brand; linkages provide information about brand extensions and the ability of
the brand to cover multiple needs.
Multiple brands, single usage: In this situation consumers use multiple brands to satisfy a
specific need. Linkages reflect brand switching and identify the acceptable substitutes.
Multiple brands, multiple usages: In this situation consumers can exhibit different patterns of
behaviors. These patterns may come from the single brand, multiple usage case or the multiple
brands, single usage case. Or they may include simultaneously varying combinations of brand
and usage (e.g. Brand A, Usage 1 with Brand B, Usage 2). When the latter is observed the
linkages provide evidence of complementarity and co-optetion.
Comparing data from 2004 and 1995 brand-usage structures for the U.S. car rental
industry shows that a relatively small proportion of the possible brand-usage linkages actually
emerge, that all four situations are present in the market, that brands sharing similar
characteristics form substitution clusters, and that changing business patterns, geo-political
events, and emerging brand leaders can contribute to changing the overall market structure.

34
M2A.2 : “Cultural Effect On Managing Brand In India”
Bodhisatta Bhattacharyya
IFIM Business School; works in the capacity of Manager at SITAR (A Govt.
of India Society)., Bangalore;
Email: [email protected] & [email protected]
Dr.Nilanjan Sengupta
Professor at IFIM Business School,
Email: [email protected]
Dr. Mousumi S. Bhattacharya
Professor at IFIM Business School;
Email: [email protected]
Brands were originally developed as labels of ownership: name, term, design, and symbol.
Broadly a brand name is basic core indicator of the brand, basis for awareness, communication
effects and the measurement of sales. Brand management is the application of marketing
techniques to a specific product, product line, or brand. It seeks to increase the product's
perceived value to the customer and thereby increase brand franchise and equity. An effective
brand management results in a combination of increased sales and price. As brands continue to
expand into global markets, it becomes important to understand the implications of cultural
differences for marketing decisions. The culture is perceived as a combination of values, morals
and laws of the society as a whole and it has a tremendous impact on Human Behaviour.
The present paper will investigate Brand strategies in emerging markets such as India. The
perceptions of local vs global branding strategies with typical Indian examples are also
given.The lesson learnt by MNCs in India on various brand failures are also given in the paper.
The attitude towards the cultural diversity in India is also a factor behind the success of Brands
in India. The adaptability of MNCs thus plays a crucial role in promoting foreign brands in India.
A few examples will be discussed in the main paper.
Harnessing of local brands for the more effective promotion of foreign brands as well as
competing with the existing local brands are also discussed. The role of integration of Brand
Management and Corporate Strategy also plays an important role. The corporate image
sometimes helps in popularizing brands.
Branding Strategy in Indian context comes with the fact that one has to think globally but act
locally.Thus the idea of Glocality emerges.
The present paper has put an effort in understanding the brand management with the diverse
Indian society and the type of the existing economy. The players of various brands have already
adopted some kind of strategy. Our effort is to look in to the same.

35
M2A.3 : Consumer imperfection in observation --- Is it a boon for manufacturers? : The
case of automobile sector in India
Tanmay Chattopadhyay (Corresponding author)
Marketing Manager, Amararaja Batteries Ltd.,
Hyderabad &Doctoral Student, Department of Management,
Birla Institute of Technology, Mesra
Email: [email protected]
Shraddha Shivani,
Associate Professor, Department of Management,
Birla Institute of Technology,Mesra, Ranchi , Jharkhand
Email – [email protected]
Mahesh Krishnan,Sales and Marketing Director,Goodyear India Ltd.,
Faridabad,Haryana
Email: [email protected]
The study explores the relationship between pricing as marketing mix element and brand equity
in an environment where there is an uncertainty of brand attributes. The authors explore the case
of consumers purchasing multiple time automobiles in India.
The authors tests the hypothesis proposed by Swait and his colleagues (1993), which suggested
that a product of high brand equity signals high quality when consumers imperfectly observe
product attributes and also partially extrapolates the theory of Yoo, Donthu and Lee for this
category of consumers. On the basis of exploratory research and stratified sampling techniques,
hypothesis was tested for automobiles consumers in India. The challenge of the study was to
bridge the gap from reports showing that most of India‘s automobile growth is driven by
consumers who are multiple time car buyers and the intuitive reasoning leading us to infer that
multiple time car buyers are not expected to be influenced by factors which influence the first
time buyers as they are expected to be better aware of the features of the category in question.
Car types were stratified into prestige, volume and economy based on their ex showroom price
and survey of respondents conducted through telephone. Statistical tools like Principal
Component Analysis and ordinal logistic regression were done. It was found that there are
primary and secondary cues affecting brand equity and pricing. Brand equity and perceived
quality are impacted by pricing even for multiple time automobile buyers, though intuitively they
are expected to be less affected by pricing.
Pricing is a very important element of marketing mix to impact brand equity even for multiple
time automobile buyers. Pricing has a direct impact on the perceived quality for the product
category. This is an important finding especially for the manufacturers, as in India, consumers
are increasingly having disposable income and hence are altering not only their automobiles, but
also their household consumer durable goods. We believe that this research would help
manufacturers optimally price their products and hence gain maximum mileage on their bottom
line.

36
Effect of interaction of different parameters that are impacted by pricing on brand equity has
been studied. This is also one of the first studies to have been made for multiple time buyers of a
product category.
37
M2B.1: Catch-up and Slowdown: Globalization and Market Penetration of New Products
Deepa Chandrasekaran, Lehigh University [[email protected]]
Gerard J. Tellis, University of Southern California
Is the World Flat? We examine this in the context of consumer adoption of new products, across
several developed and emerging countries. We ask what drives differences in penetration of
products across global markets, and are these differences increasing or decreasing over time?
We examine the market penetration of 15 products across 32 major developed and developing
countries in the period 1950 to 2005, comprising of 7000+ observations. The products include
microwave ovens, dishwashers, freezers, dryers and washing machines, which we term as Work
Products, as they enable consumers to work more efficiently and effectively; CD players, video
cameras, video recorders, MP3 players, DVD players, and digital cameras, which we term as
Entertainment Products, as they provide consumers with enjoyment; and cellular phones,
personal computers, Broadband and Internet, which we term as Communication Products, since
they predominantly facilitate interaction among individuals. We collect data from subscription-
based sources (Euromonitor, World Development Indicators Online, Fast Facts Database),
archival search, and proprietary industry data. We analyze both the variation in and level of
market penetration over time using empirical models.
Over a 50-year period, we find that North America, Japan, Scandinavian countries are consistent
leaders, especially in the adoption of work and entertainment products. The extent of economic,
social and political globalization, and other macro-economic and cultural factors help explain
these differences. However, catch-up is occurring, at least for some categories. Specifically, we
find that Work products are characterized by high levels of mean penetration and convergence in
developed economies, and by low levels of mean penetration and status quo in emerging
economies; Entertainment products are characterized by quick saturation in developed
economies and leapfrogging in emerging economies; Communication products are characterized
by convergence between and among developed and emerging economies. Convergence in wealth
and globalization forces contributes to these dissipating differences. These findings have
implications for the development, entry and pricing of new products.
AREAS: Marketing strategy, Global marketing, New product diffusion

38
M2B.2: What Makes Born- Globals Innovative?A Customer Relationship Perspective
G.M. Naidu
Professor Emeritus
University of Wisconsin-Whitewater
Email: [email protected]
Kim Daekwan
Florida State University
Email: [email protected]
Choton Basu
Global Business Resource Center
University of Wisconsin-Whitewater
Email: [email protected]
Tamer S. Cavusgil
Georgia State University
Email: [email protected]
Born-Globals are a newly emerging form of organization that targets international markets as its
primary source of business from their inception. One of the primary features of Born-Globals is
their innovativeness. However, innovations in Born-Globals are not feasible without
understanding their customers. The current study attempts to make contributions to our
understanding of Born-Globals by exploring how Born-Globals‘s customer orientation leads to
its innovativeness. Specifically, the study conceptualizes that a Born-Global's customer
orientation can be materialized in innovativeness when it fosters environments where the Born-
Global can understand its customers better through good quality relationship with customers,
technological customer relationship management (CRM) capability, and external customer
information management. Our empirical results based on the responses from 154 managers in
India and web survey response of 22 useable surveys for a total of 176 observations show that a
Born-Global‘s customer orientation is an effective enabler of its innovativeness whose effects are
mediated by technological CRM capability and external customer information management.
However, although significantly affected by customer orientation, relationship quality with the
buyer does not influence innovativeness within the Born-Global according to the results. The
results suggest that Born-Globals are poised to maintain their innovativeness more effectively
when understanding customers by using CRM technology and managing customer information
obtained from external sources and that such environments are successfully cultivated by
customer orientation.
Keywords: Born-Globals, Customer Orientation, Innovativeness

39
M2B.3: The Role of Micro-Politics in the Development of New-to-the-Firm Products
Rajesh Sethi, Clarkson University, Potsdam, NY,
Email: [email protected]
Zafar Iqbal, Depaul University, Chicago, IL,
Email: [email protected]
Anju Sethi, Clarkson University, Potsdam, NY,
Email: [email protected]
Many firms hope to develop new products that are novel or unique. Such novel products are
sought after because they create opportunities for growth, improve profitability, and provide
long-term competitive advantage. As such, in recent years, several researchers in marketing and
other areas have attempted to study what facilitates or hinders the development of novel
products. However, missing from most studies on novel new products are considerations of
political dynamics and the problems these dynamics can create.
Yet not all novel products give rise to political dynamics within a firm. When novelty involves
greater newness-to-the firm, political dynamics become more salient because new-to-the-firm
products often have the potential of disrupting the existing operations and resources under the
control of various senior managers. These political dynamics can undermine the effectiveness of
the new product and thus hurt the firm‘s interests. This research focuses on the implications of
the political dynamics set into motion by new-to-the-firm products.
We contend that the development of new-to-the-firm products is often resisted during their
review and evaluation. Resistance manifests itself in the form of opposition to the product and
creation of obstacles in its approval for further development work. Newness to the firm can be
technology newness (e.g., when the project involves new technologies, engineering and design
skills, and production processes) or market newness (e.g., when the product targets new markets
and requires new sales and customer service infrastructure). As such, we examine the effect of
both technology and market newness on resistance encountered during review and evaluation.
Further, we argue that when a product development team sees emerging resistance to its product
and expects that the product may not be approved or may be approved only if the team agrees to
make many changes to it, the team tries to influence events in its favor. We examine the
strategies used by the team in such circumstances to get the product approved. These strategies
tend to have a political undertone. To identify these strategies and to understand their effect, we
draw on the theory of micro-political behaviors that is useful in explaining managerial behaviors
in firms, particularly in situations where resources are scarce and there is conflict and
competition for those scarce resources. The strategies used by managers that are relevant here
are: (1) coalition-building, i.e., building support for and consensus around the product, (2)
project framing, i.e., presenting the product such that it appears to be linked to the existing
products, strategies, and competitive thrusts of the business unit, (3) compromising, i.e.,
modifying the product as a concession to get it approved, and (4) hiding, i.e., secret development
of the new product.
While sometimes new products need to be refined to improve them, the concern is that in the
face of resistance, particularly for new-to-the-firm products, the team can resort to making

40
compromises to let the product see the light of day. However, it is not known how serious the
consequences of such compromises are. For example, do such compromises adversely affect the
market performance of the product? As such, this study also examines how product compromise
influences the product‘s market performance.
Currently, most firms develop new products using the Stage-Gate process (a registered
trademark of Product Development Institute Inc.) – which is a methodology for improving and
controlling new product development (Cooper 2001; 1998). The Stage-Gate process prescribes
the use of several sequential gate review meetings to control and direct new product
development. These gate reviews are conducted by a committee of senior managers from
different functional areas in the firm. If there is resistance to new-to-the-firm products, it mainly
manifests at gate review meetings. Similarly, micro-political strategies used by a product
development team are in anticipation of or in response to resistance encountered at gate reviews.
Thus, the Stage-Gate process is the context in which we examine the research questions of
interest.
Our results based on a survey of 114 product development projects suggest that both market and
technology newness enhance resistance to the product at gate reviews. We also find that
coalition building minimizes resistance to products with market newness. On the other hand,
framing minimizes resistance to products with technology newness, but increases resistance to
market newness. Project resistance, in turn, leads to increased compromise by the team. Hidden
product development work helps minimize compromise in response to resistance at the gates.
Finally, compromise adversely affects the product‘s market performance.
41
M3A.1: Effects Of Customer Trust On Purchase Intentions: Customer-Brand Relationship
Joffi Thomas - IIM Kozhikode;
Email: [email protected];
Ashok Pratap Arora - MDI Gurgaon ;and
G. Shainesh - IIM Bangalore
Trust is a key feature of any relationship and it indicates the strength of a relationship. We
examined the effects of customer trust and perceived value on purchase intentions of potential
customers to better understand customer -brand relationships. The research contributes to theory
by developing and testing a research model, which addressed mainly the following five gaps in
research on trust in customer relationships.
(i) There are only a few empirical studies employing trust to understand customer
relationships in the consumer goods context (Chaudhuri and Holbrook 2001; Delgado-
Ballester and Munuera-Aleman 2001, 2003). As brands are relationship partners in the
consumer goods context (Aggarwal 2004; Fournier 1998), we develop a model to
examine customer - brand relationships in consumer goods context.
(ii) There are three entities in a customer relationship: (i) the firm which provides the
products and services (corporate brand) (ii) the product or service the firm offers (product
brand), and (iii) the sales and service personnel from the firm or its intermediaries which
directly interacts with the customer in delivering the product or service (customer
interface) (Crossby 1987; Hennig-Thurau and Hansen 2000). Customer evaluates the
trustworthiness of these three entities resulting in the development of trust in the three
facets; corporate brand trust, product brand trust and customer interface trust. As the
three facets have not so far been considered in modeling customer relationships their
differential effects on relationship outcomes have not been examined so far in literature.
We examine the differential effects of three trust facets on value and purchase intentions
for potential customers.
(iii)Integrative interdisciplinary review of trust research (Mayer et al. 1995 and McKnight et
al. 2002) has identified the three generic dimensions of trustworthiness evaluations as
ability, benevolence and integrity. These three dimensions have so far not been explicitly
considered in marketing. The study modeled the effects of trustworthiness evaluation on
the three trust facets in the relationship.
(iv) We examined the relationship among trust facets in the proposed research model. As the
three trust facets has not been modeled in customer relationship models, the relationships
among trust facets have not been examined so far in literature.
(v) The partially mediating role of perceived value in customer relationships, which was first
examined by Sirdeshmukh et al. 2002, was re-examined in the research.
As the three generic trustworthiness dimensions and the three trust facets were not so far
examined in literature the measurement scales for the three dimensions for each of the three trust
facets were developed afresh. The scales for trust in three facets, value and purchase intentions
were adapted from existing scales. The reliability and validity of the scales were ensured through
42
qualitative (literature review, in-depth interviews, content analysis, pre-test with experts) and
quantitative methods (exploratory factor analysis, reliability analysis).
Data was collected from the potential customers of four selected closely competing passenger car
brands in the same customer segment. The population was divided into five geographical
clusters based on the sales data of the four brands and in consultation with marketing and brand
managers in the industry. Sample was selected across five clusters; four in Delhi city and one in
Gurgaon city in India. The unit of analysis was an evaluation of a brand by a potential customer.
The three trust facets of corporate brand, product brand and customer interface (dealer) were
evaluated separately by a respondent for each of the four brands in the study.
The proposed model was tested using a dataset which included one hundred and seventy seven
brand evaluations of forty eight potential customers on four competing brands. The model was
examined using path analysis technique. The research was successful in measuring the constructs
and validating the proposed model. The findings of the research, organized around the three sets
of relationships examined in the research model, are given below.
(i) Differential effects of the three trust facets on word of mouth communications: Customer
perceived value fully mediated the effect of corporate brand trust on purchase intentions.
It partially mediated the effect of product brand trust on purchase intentions. The
magnitude of the direct and indirect effect of product brand trust was higher than the
other effects. Thus, product brand trust is established as the primary trust facet for
potential customers. Customer interface trust had no significant influence on purchase
intentions or on customer perceived value. The finding has implication to resource
allocation among the three trust facets in establishing customer relationships.
(ii) Relationship among trust facets: Corporate brand trust was found to have a positive
influence on customer interface trust. No other hypothesized reciprocal effects among the
trust facets were significant. The findings revealed the multiple routes through which
corporate brand trust influenced relationship outcomes.
(iii)Effects of trustworthiness evaluations on the three trust facets: The four trustworthiness
evaluation dimensions of corporate brand ability, product brand integrity, product brand
benevolence and corporate brand benevolence were found to significantly influence trust
facets. This understanding may help in profiling brands and designing programs to
develop trust in a facet. Product brand integrity is conceptualized in the study for the first
time and its significant influence on product brand trust highlights its importance in
customer trustworthiness evaluation.
The adoption of relationship marketing paradigm in marketing and its application in practice
calls for development of tools to monitor and manage customer relationship. The research
contributes to the advancement in trust research and provides a tool for practitioners to monitor
and manage customer relationships.

43
M3A.2 Standardization of Scale on Brand Character
Dr. Smriti Yash Verma
Assistant Professor, Institute of Management Technology, Nagpur.
Email: [email protected]
Dr. Santosh Dhar
Professor, Institute of Management, Nirma University of Science &Technology, Ahmedabad
Key Words: Brand Character, Scale, Brand Management
In the present era wherein life cycles have shortened and products have to acquire and encash
markets at a faster pace, building strong brands is a mandate for innovation in organizations.
Also with brands moving beyond the physical form and name taxonomy, building persona and
character of the brand are the success mantras. A brand strategy can be critical to the success of
an innovation, particularly in the long term. There are times when a firm literally needs to brand
an innovation or lose it. Without a successful branding strategy, an innovation can be short-lived
- diffusing into a confused marketplace with its impact dissipated - or become another forgotten
internal initiative. In such cases, branding can make all the difference. Branding, it should be
emphasized, does not mean simply putting a name and logo on an innovation. Rather, it means
making the brand an integral part of a coherent strategy, supported by actively managed and
adequately funded brand-building programs. At the same time, not all innovations merit such a
program and over-branding can pose business risks (Aaker, 2007).
The brand was always referred to as a series of tactics and never like strategy (Davis and Dunn,
2002). The challenge today is to create a strong and distinctive image (Kohli and Thakor, 1997).
Kapferer (1997) mentioned that the brand is a sign therefore, external whose function is to
disclose the hidden qualities of the product which are inaccessible through contact. Thus, the
brand serves not only to identify a product to distinguish it from the competition but also perform
an economic function in the mind of the consumer. The value of the brand comes from its ability
to gain an exclusive, positive and prominent meaning in the minds of a large number of
consumers. Therefore, branding and brand building should focus on developing brand value.
Building a brand and keeping it alive does not happen automatically or in one colossal effort.
Branding is an ongoing, conscious and cumulative effort to cultivate the unique message that
captures the target market. The challenge is to recognize that the "target market" is rarely a fixed
point. In fact, most markets are in a constant state of flux: shifting, expanding, shrinking and
changing in character. To stay afloat in these turbulent waters, your company's brand must be
able to adapt to shifts in the marketplace ( Donato, 1999). One way to assess brand imagery is to
adopt the personification metaphor: brand as a person. A brand can be described as an
innovative, exciting, or sincere person (Aaker 1997; Batra et al, 1993). Personification has also
been used to describe employees‘ views about organizations (Slaughter et al, 2004), labeled
corporate personality (Furnham and Gunter, 1993) or character (Goffee and Jones, 1998).
However, most empirical work on the personification of brands has been applied to only one
stakeholder group, typically consumers or employees. In the marketing context, the approach has
been applied mainly to product brands (Chun and Davies, 2006). The goal of an organization is
divergence. To diverge in branding is to create a new product category and then to become the

44
first brand within that new category. Ries and Ries (2005) contend that organizations should
strive for divergence and avoid convergence in order to ensure business survival.
Brand character can be defined as a description of the virtual corporate personality and its
attributes, used to express the company values, stance and attitude (Moore,1999) . Brand
character can also be defined as the values and traits that customers come to associate with a
brand and are not merely performance traits. A brand's character is created over time. It is a
summation of the brand's values, marketing communication and performance, which either
confirms or contradicts the brand in the customer's minds. Positive brand character has an impact
on desired customer behavior. Therefore, the brand character should be upholding, built upon
beliefs of the brand shared by all. It must be consistent across all relevant forms of
communication. Brand needs to be designed to appeal to primary customer base. Its attributes
need to be meaningful to them, and the company needs to reflect these traits in every way. It is
especially important not to contradict the intended brand character across various pieces of
collateral, or through the actions of the firm. For a business strategy to succeed, creative work
will increasingly need to build brand characters which both reflect the specific nature of a
product and incorporate a set of values, which are strong and simple enough to cope with more
diverse corporate strategies like geographical or product expansion (Filippo, 1995).
The present study is an attempt to develop a scale to measure the brand character. This will help
organizations especially service organizations wherein tangibility of the offering is less making
measurements difficult. This measurement tool when used can reap results which shall help
organizations design strategy for corporate brief, internal and external communication and
designing brand strategies and tactics in the long run. The study was carried out with a multi-
stage multi-variate randomized design to understand the perceptions of users about the character
of brands. The standard procedure was followed for developing and then standardizing these
scales. The scale development was done in five stages.

45
M3A3: What Makes Brands Elastic? The Influence of Brand Concept and Styles of
Thinking on Brand Extension Evaluation
Alokparna(Sonia) Basu Monga, University of South Carolina,
Email: [email protected]
Deborah Roedder John, University of Minnesota,
Email: [email protected]
Brand extensions are one of the most popular strategies for leveraging brand equity. Many of the
successful new product introductions each year are brand extensions, such as Apple‘s iPhone,
Godiva coffee, and Jeep Strollers. Brand extension success depends heavily on extension fit
(Volckner and Sattler 2006). Consumers tend to respond more favorably to extensions that fit
with their perceptions of the parent brand. However, it is also true that many brands launch
successful extensions that do not follow these rules. These brands are described as being more
―elastic‖ because they are able to launch brand extensions into distant product categories, sharing
few attributes or features in common with existing products, and appealing to different consumer
markets. For example, Ralph Lauren markets a diverse set of offerings under its brand, including
sunglasses, paint, dog leashes, and restaurants.
The prevailing explanation is that the nature of the brand concept associated with the parent
brand (e.g., prestige versus functional; Park, Milberg, and Lawson 1991) determines how elastic
brands are. Brands positioned on the basis of prestige, such as Rolex, are more elastic and can
successfully expand into a variety of product categories, such as clothing and accessories. In
contrast, brands positioned on functional attributes, such as Timex (reliability), are less elastic
and are more successful if they extend to offerings that conform to the functional nature of the
brand.
However, researchers recently report that consumers can influence the elasticity of a brand by
the style of thinking they employ when evaluating brand extensions (Monga and John 2007).
Consumers might use an analytic style of thinking, where they focus on the specific attributes or
products usually associated with the parent brand and try to match these features with those of
the extension. Or, consumers might use a more holistic approach, where they seek out ways to
relate the extension to the parent brand, regardless of whether it conforms to the same attribute or
product category profile as the parent brand. When consumers use a holistic style of thinking,
they are able to perceive higher degrees of brand extension fit and are more accepting of brand
extensions even if they are distant from the parent brand.
In this article, we propose that brand elasticity is jointly determined by characteristics of the
parent brand (prestige versus functional) and consumer styles of thinking. For prestige brands,
we reason that consumer style of thinking has little, if any, effect on brand elasticity. Because
these brands have abstract concepts that can cover a wide variety of product categories, even
analytic thinkers have an accessible way of relating the parent brand and extension. Holistic
thinking provides little or no advantage over analytic thinking. However, for functional brands,
we expect consumer styles of thinking to be of utmost importance. Because these brands have
narrow concepts that are not readily transferable to distant extensions, analytic thinkers are
unable to connect the parent brand and extension. Holistic thinkers, on the other hand, have an
46
advantage in the sense that they are better able to relate the extension to the parent brand, thereby
making the extension a better fit to the parent brand and more acceptable.
We explore these themes in four studies. In the first two studies, we find support for our
predictions about the interaction of parent brand characteristics and consumer styles of thinking.
Specifically, we find that a consumer‘s style of thinking can overcome the difficulties that
functional brands often experience in extending their brands into new categories. Consumers
who think holistically evaluate extensions of functional brands more favorably than do analytic
thinkers. For prestige brands, both analytic and holistic thinkers perceive the brands to be quite
elastic, evaluating brand extensions equally favorably. Thus, our findings identify analytic
thinkers as the roadblock for functional brands wanting to extend into new and different product
categories. In two subsequent studies, we turn our attention to managerial strategies for reducing
analytic thinking among consumers in order to increase evaluations of functional brand
extensions. We find that brand architecture and communication strategies can increase the
elasticity of functional brands for consumers who are analytic thinkers. In particular, distant
extensions are evaluated as favorably by analytic thinkers as they are by holistic thinkers if
managers use sub-brand architecture and elaborative communication strategies.

47
M3B.1: Creating Value through Consumer Ethnography in New Product Development:
Case Study Analyses
Dr Aruna Shekar
School of Engineering and Advanced Technology
Massey University
Email: [email protected]
Dr Rainer Seidel
University of Auckland.
Auckland, New Zealand
New product development (NPD) requires market research methods that provide vivid
information about the end-users in order to guide and direct the development. Focus group
methods have been very popular, but are of value in specific types and areas of new product
development. There is a need to use a combination of techniques and participatory approaches to
get useful information for NPD, rather than depending heavily on consumer opinions or surveys
only.
Focus groups are widely used, have face validity, are quick and easy to use, and gather useful
insights and ideas for new products. One of the criticisms of focus groups and some traditional
methods is that they lack correlation between what people say and what they do (Patton, 2002).
Like any research method, focus groups need to be used appropriately and effectively to meet
certain objectives well. Focus groups used for the purpose of idea generation in NPD, rather than
for market verification, are effective. These can be complemented by observations in-the-field,
so that behaviours discussed in the focus groups can then be experienced first hand.
Focus groups and in-depth interviews are often used before quantitative consumer surveys or
conjoint analysis in NPD. At one time, focus groups were considered to be one of the less costly
market research methods. Today, however, alternate methods (e.g. ethnography, lead user
method, consumer profiling, task analysis, contextual enquiry, diary method and voice of
customer methods) can offer equally rich, and useful information at an overall lower cost.
Ethnography is defined as ―a descriptive, qualitative market research methodology for studying
the customer in relation to his or her environment...‖ (Belliveau, Griffin and Somermeyer, 2002).
It helps identify latent needs, trends in lifestyles and product usage that have implication on
product design. Properly used ethnographic techniques yield excellent insights for product
design. The main point is the value of getting in-depth insight into user-product interactions and
usage context. When exploring product opportunities one can uncover important consumer
attitudes, experiences and needs that may point to emerging trends. These help generate ideas
and improve existing product designs.
To develop a successful new product, it is critical to visualize a consumer for the product.
Visualizing the consumer, helps to provide an intuitive understanding of what he or she does,
what he or she hopes for, and how a new product could meaningfully fit into his or her life
(Wansink, 2000). They are memorable in a way that numbers are not. Consumers these days are
more demanding, have greater choice and have desires for products that relate to their lifestyles.
Studying consumers closely provide opportunities for new products that can address their needs,
wants and desires.

48
Qualitative methods are less about trying to prove something than they are about attempting to
understand something. Quantitative and qualitative methods are often used in the same NPD
study.
By outlining the demographics and psychographics of such a user, a typical profile can be
developed of the appropriate market segment. Consumer profiling and ethnography will be
elaborated in the presentation, through case study examples. What do customers value? To
simply satisfy a customer is not good enough in a highly competitive marketplace. One needs to
go beyond a mere offering of a functional product. Desirability and a ‗match‘ with the user‘s
lifestyle can help differentiate the product. For a customer to desire your product what is needed?
If you ask a customer will they tell you all? Answers to these questions and more are explored.
One example is the development of new crutches, for which we provided diaries to users for a
week to note down their likes/dislikes, their problems as they experienced them (along with
details such as: time, place, task to be done etc.), and also observed, took photos and videotaped
users while using crutches in their natural environment. We gathered valuable information
including the different types of users and their requirements; and some of the current problems
with crutches for youth such as, wanting to fold it to store it in theatres or classrooms, non-slip
and noise-free base and problems on gravel.
The case studies further explain and illustrate how user profiles and ethnographic methods can
unveil opportunities for new product ideas.
The findings can sometimes challenge initial assumptions about product features, the vivid
results can assist with stakeholder ‗buy-in‘ to appreciate the benefits of the results over the cost
of conducting the research. Through the supervision of several recent projects, the author was
able to extract valuable lessons and advantages of conducting ethnographic research – such as
observations of user-product interactions that otherwise may have been missed or seen as
irrelevant by respondents. The presentation concludes with managerial implications on adopting
these practical methods for better design and development of new products.
References:
Belliveau, P., Griffin, A, & Somermeyer, S. (2002). The PDMA toolbook for new product
development. New York, U.S.A.: John Wiley & Sons Inc.
Patton, M. Q. (2002). Qualitative Research and Evaluation Methods (3rd Edition). Thousand
Oaks, California, U.S.A.: Sage Publications, Inc.
Wansink, B. (2000, Summer). New techniques to generate key marketing insights. Marketing
Research, 28–36.
49
M3B.2 A Study on Customer Co-Creation in Print Media
Madhavi Garikaparthi- Professor of Marketing, ICFAI Business School, Mumbai.-
Email: [email protected] or [email protected]
Prema Ramachandran- Professor of HR & Soft Skills, ICFAI Business School, Mumbai.
Email: [email protected]
Introduction: Co-creation refers to creativity where more than one person is involved in
conceptualization and/ or development of activity or plan. Customer co-creation is a concept
where the offering is co-created by the firm and customer. This is increasing due to evolution of
industry and increasing customer awareness. With increasing awareness customers are showing
interest in creating or giving inputs for creating products of their interest. Many industries are
successfully using this concept. Print Media that is also growing tremendously is now showing
interest in involving customer for delivering better value. Globally India has second highest
growth after China. Being cyclically sensitive industry, media grows faster when the economy is
expanding.
Print Media Industry: Indian economy is at present growing significantly and even media
industry is currently going through changing customer profile and interests. Customer has started
seeking knowledge, not just information. A quick review of various news channels and changes
in newspapers show us the changing interests of customers. Print media that was majorly
product-centric (or news centric) today focuses on customer more and is striving to include
customer in every aspect of value delivery.
Indian print media structure is highly fragmented with more concentrated power regional
domination. Only two Indian Newspapers ‗ Times of India‘ and ‗Dainik Jagaran‘ are amongst
the world‘s top 20 newspaper by circulation. The industry primarily comprises of newspaper and
magazine publishing followed by book publishing which is yet to grow to a substantial size. As
per a PWC report, this industry is expected to grow from Rs. 128Bn in 2006 to Rs.232Bn by
2011. That would be a CGAR of 12.6%. This growth rate is also attracting a lot of foreign
investments. There are approximately 1900 news publications for a circulation figure of 220m
only. This also provides immense opportunities for growth in – tapping the reading population,
building pan India presence and leveraging fragmented market.
Objectives: To understand the growing Print media industry. To identify, implement and analyze
the concept of customer co-creation in print media.
Methodology: The study was conducted on DNA (daily News and Analysis) an English daily
newspaper that is owned by Diligent Media Corporation, a joint venture between Dainik Bhaskar
Group and Essel Group. The Newspaper was launched on July 30th 2005. The study included a
(i)Pre-launch survey and (ii) Ongoing customer co-creation efforts which are discussed briefly
below.
Pre-launch Survey: Bhaskar Group though being in industry for long time and knowing the
readers too well, did not want to take the risk with highly captivated and critical market with its
launch of DNA newspaper. In order to capture customer attention careful strategy planning,

50
execution was necessary, as a part of which various marketing and customer co-creation
activities were planned. The survey was conducted throughout Mumbai, covering 11 lakh
households. The main objective here was – getting customer insight and to create marketing
differentiation. The pre-launch activities were executed in four phases – Market assessment;
Questionnaire and survey design; Analysis and design; and commencement coupons and vendor
coupons. In the entire prelaunch activities where customers were involved the company used the
punch line – ‗DNA -The Newspaper You Are Creating‘, conveying people of the importance of
their feedback and level of reader participation in designing process.
Ongoing Efforts: These are regular feedback channels and efforts taken by the organization to
be in touch with the customer requirement and accordingly modify the newspaper. These
included – ongoing calls to subscribers; feedback collection through vendors; and an Interactive
portal.
Findings: Outcome of the pre-launch survey included – 79% of respondents raised their concern
over issues in Mumbai; 78% of respondents wanted their paper to take a bold stand on issues;
64% of women respondents are uncomfortable with too much glamour; 70% of respondents
wanted their paper to have something for the entire family; 70% of respondents would like their
paper to carry lesser ads and more coverage on sports.
Based on the study DNA was introduced and in the initial offer pamphlet, DNA announced
introductory offer of Rs. 2 per day (against the cover price of Rs. 4) and gift worth Rs. 30 for
DNA founder-partners (i.e., customers). To integrate the feedback of customer about contents of
newspaper, DNA came up with Mumbai specific supplements like West Coast. It came up with
variety of supplements to satisfy needs of all the member of family like Me, Kids Yo, After Hrs
and DNA Money. It continues to come out with different changes in the newspaper as per the
feedback collected regularly from customers. As a result of Co-Creation activities, DNA has
increased circulation by 40.33% to 4.21 Lakhs as on 9th March 07, its circulation following the
launch in 2005 was 3 Lakhs. The current readership of DNA is around 6.8Lakhs based on the
Indian Readership Survey conducted in April 2008. Despite being one of the newest player in the
industry DNA is ranked as 8th among the top ten English dailies in India and is the second most
read in Mumbai.
Future Trends: With the help of advance in Technology, number of way of interacting with
customer will increase and cost of interaction will decrease. New Technologies like Virtual
Reality, Artificial Intelligence, VLSI Technology and other easy and fast manufacturing
technologies will take Co-Creation affordable and Efficient. The reach of Internet will also
assure that customers are provided with the easy platform of interaction with company.
However, it is important for the company to keep up its customer co-creation activities to
maintain the edge it created over competitors.

51
M3B.3. Appropriateness and Appropriability of Marketing Innovations
Gopalkrishnan R. Iyer, Ph.D.
Florida Atlantic University
Email: [email protected]
R. Krishnan, Ph.D.
Professor of Marketing
University Of Miami
Email: [email protected]
Arun Sharma, Ph.D.
University Of Miami
Email: [email protected]
The opportunities presented by emerging markets in Asia as well as Eastern and Central Europe
are quite appealing for Western firms attempting to leverage their competitive capabilities and
innovations in these markets. In the same vein, companies from emerging markets are now
entering developed markets. However, we contend that most firms don‘t compete effectively in
global markets. The relative failures of these firms can be explained by their inability to
understand and react to the distinct market characteristics, including marketing institutions and
consumer preferences. In going from developed markets to developing markets, western firms
have been more interested in adapting existing products to these markets and thereby appealing
to small market segments. Interestingly, companies from developing markets follow a similar
path: they appeal to niche market segments using their current low-cost products. A majority of
these companies do not pursue a strategy of innovation from ground-up, specifically targeting the
countries of entry.
We contend that emerging markets call for a distinctly different strategy of innovation and new
product development as compared to established Western markets. In contrast to developed
Western markets, emerging markets are distinctly different in the form and prevalence of market
institutions that impinge on the new product development process as well as the success of new
products. Such institutional factors affect not only the appropriateness of the innovation (i.e., the
extent to which there is a high degree of fit between the innovation and the environment) as well
as the appropriability of the innovation (i.e., the extent to which the innovation can yield
commercial profits to the firm developing the innovation).
On the flip side, the primary experience of companies from emerging markets has been in
previously protected markets. Such experience is of little relevance when dealing in the different
institutional environments presented by Western markets. Therefore, emerging market
companies looking for ways to better compete in global markets need to radically rethink their
strategy.

52
Our research focuses on the characteristics of these markets that affect appropriateness and
appropriability of innovations. We will present a conceptual framework and identify the distinct
strategic drivers of innovation for competing in emerging and developed markets. Our research
shows that these markets call for radically different strategies of new product development and
commercialization.

53
M4A.1: An Empirical Analysis of Recommender Systems and Market Diversity
Daniel Fleder and Kartik Hosanagar
Operations & Information Management
The Wharton School, University of Pennsylvania
Email: {dfleder, kartikh}@wharton.upenn.edu
Media has historically been a "blockbuster" industry, with sales concentrating among a small
number of hits. In recent years, such concentration has begun to decrease: a large percent of sales
in online markets now come from niche goods. This trend has been dubbed the "long tail,"
referring to sales distributions with significant mass beyond the top products. Researchers have
proposed frameworks for explaining what factors contribute to the long tail. On the supply side,
firms offer more products than before. Online firms stock more products because of lower
inventory cost and the ability to pool demand across geography. On the demand side, consumers
have new tools -- search engines and recommender systems -- for sorting through the myriad
choices. However, there have been few empirical studies examining whether and how the supply
and demand factors contribute. In recent work (Fleder & Hosanagar 2007), it is even questioned
how much recommender systems contribute to the long tail at all.
This paper investigates how recommender systems, a demand side driver, contribute to the
diversity in online markets. Specifically, we examine the effects of recommender systems on
products and consumers. At the product level, how do recommender systems affect sales
diversity? At the consumer level, do recommender systems create fragmentation among users?
Recommenders give consumers a new means to filter content and focus on their interests.
Researchers have predicted that such filtering will undesirably fragment consumers. In contrast,
others have argued that recommenders have homogenizing effects because they share
information among users. The question has implications for the use of broad versus narrow
targeted marketing policies and also has broader policy implications.
We use a novel dataset provided by a firm that operates a recommendation service that helps
users discover new music. Users install a free software plugin for the popular Apple iTunes
music player. When a user listens to music in iTunes, the software recommends additional songs
the user can sample and purchase. The dataset records pre and post recommender purchase
behavior. Our analysis reveals that recommenders can contribute towards an increase in sales
volume and diversity. The result of increase in diversity is interestingly not at odds with prior
theoretical work that suggests that recommenders can decrease diversity. We provide several
explanations why that is the case. In terms of consumer fragmentation, we show that users are
becoming more similar. They have more purchases in common and appear closer to one another
in a consumer purchase network. The study helps reconcile the opposing conjectures in the
literature on the impact of recommenders on market diversity. From a methods perspective, the
study delves into several interesting questions related to network data. These questions tied to
selection biases and attrition and our proposed solutions will help generate interesting discussion
at the conference.
54
M4A.2: An Investigation Into The Impact Of Information Loading On Purchase Behaviour
Mathew Parackal
Department of Marketing, University of Otago, New Zealand
Email: [email protected]
Background
Advertising is a million dollar industry. The competition is not just between media (TV versus print) but
also within media (print versus print). One way media companies strategise to take control over the
client‘s advertising dollar is to lock them into long term contracts. Once signed up, little is done by the
client to find out the effectiveness of the campaign, and consequently the media company is not under
pressure to produce effectiveness measurements. The irony is that while media companies undertake
regular marketing research to measure reader and viewership, similar enthusiasm to measure effectiveness
is not always forthcoming. Making advertisement decisions based on media coverage blatantly assumes
that information loading translates into achieving the campaign objective, be it purchase behaviour or
market share. This paper reports a study designed to test this assumption. In the following sections the
methodology employed and the results obtained will be discussed.
Research hypothesis
To test the above assumption two separate types of information loading were tested. In the first,
individuals self-loaded information (Self-loaded) and in the second, information was loaded on to
individuals (Loaded on). A third treatment with no information loading provided the control for the
experiment (Control). Future purchase probability data, a proxy measure of purchase behaviour used in
such experimental studies, was collected after respondents received the experimental conditioning. The
study set out to test the following hypothesis:
H1: The proportion of sample that would purchase the product would be different in the three treatment
groups
Methodology
This study was carried out over the Internet primarily to facilitate the two types of information loading.
Self-loading of information was facilitated through an interface with a search engine. Respondents
assigned to this treatment typed in key words relating to information they wanted to view. The second
type of information loading was facilitated through an interface that organised information as titles on a
menu. Respondents assigned to this treatment used their mouse to click on the titles to view information.
After respondents completed viewing the information they were asked to indicate their probability to
purchase the test product for two time-horizons, six and twelve months. Respondents assigned to the
control treatment indicated their probability to purchase the product without viewing any information.
Probability to purchase was collected on an eleven-point probabilistic scale. The mean produced on this
scale was interpreted as the proportion of the sample that would carry out the behaviour in question. The
test product used in this study was a WAP-capable mobile phone that was new in the market at the time of
the study. The reason for using a new product was to encourage search behaviour among respondents.
The sample for the study was produced by surveying 3000 individuals randomly selected from the New
Zealand electoral roll. Respondents were contacted by their postal address with a request to participate in
a Web-based survey. The letter provided a login name and access code that respondents used to access the
survey site. After sending out two reminder letters the survey produced 403 responses. Response rate
weighted by the percentage of households with Internet access in New Zealand at the time of the survey
was 35%.
Results

55
As the sample was from the general population it included individuals who owned and did not own
mobile phones. They were identified using a question on mobile phone ownership. Of the 403
respondents in the sample, 308 (77%) indicated they owned a mobile phone, 92 (23%) indicated
otherwise, and three did not answer the question. The above hypothesis was tested using the data supplied
by the mobile phone users. There were 14 respondents who abandoned the survey prior to the WAP-
capable mobile phone question, leaving the usable responses for the study at 294. The respondents were
randomly assigned to the three treatment groups. The sizes of the groups were as follows: ―Self-loading‖
= 85; ―Loaded on to individuals‖ = 106 and ―Control‖ = 103. The mean or proportion of the six-month
time horizon for ―Self-loading‖ was 0.17, ― Loaded on to individuals‖ was 0.16, and ―Control‖ was 0.22.
The proportion of the twelve-month time horizon for the two treatment groups was the same at 0.27 and
for ―Control‖ was 0.33. The proportions progressively increased over the two time horizons in all the
treatment groups, which is typical of innovations. ANOVA tests were executed to investigate whether the
means obtained in the treatments were statistically different. For the six-month time horizon, F statistic
produced was 1.51 with an associated p value of 0.22 and for the twelve-month time horizon, F statistic
was 0.96 with an associated p value of 0.38. The evidence suggests that neither of the information loading
types had influence any greater than observed in the control treatment for the stated plan to purchase the
test product.
Conclusion
This study showed that information loading did not affect purchase plans. Therefore, media coverage may
be used when advertising decisions are made for the first time. All subsequent decisions must be based on
the market information. Following the sigmoid or S-curve of advertising may be useful. As per this
theory, the amount of advertising needs to be heavy at the start to inform innovators of the product. Once
innovators become adopters they take on the task of communication, after which the amount of
advertising could be gradually reduced. To use the S-curve of advertising one needs to monitor the
number of innovators and their adoption rate for the product. Marketing research may be used for this
purpose that not only produce information about innovators and their behaviour but also provide current
market information to make reliable marketing decisions.

56
M4A.3.Validation of Consumer Behavior Measures: A Comparison of Alternative
Approaches
Srinivas Durvasula;Professor and Edward A. Brennan Chair in Marketing
Marquette University;
Email: [email protected]
Subhash Sharma;James F. Kane Professor of Business
University of South Carolina;
Email: [email protected]
Introduction and Study Purpose
The key objective of this paper is to compare alternative approaches for examining cross-group
validity of measures used in consumer behavior. Developing and validating measures of
consumer behavior constructs is an important stream of research in marketing. Most measures
are typically developed and validated initially in one country only, such as the United States, and
then applied in other countries after establishing the cross-national properties of those measures.
Typically, the procedure involves validation of the measure followed by examining mean
differences on the measure between countries or between demographic groups within a country.
Without proper validation of measures, we would never know whether the observed differences
are due to true differences between groups on the underlying construct or due to measurement
artifacts. Hence, establishing measure validity is an important first step in theory testing.
An important question then is to find out how to validate measures of underlying constructs? The
answer depends on what measurement theory is used for scale validation. In classical test theory
(CTT), scale validation often involves application of covariance structure analysis. The scale
dimensionality and reliability are first assessed using separate confirmatory factor analyses
within each group. If the results are supportive, then, data from various groups are analyzed
simultaneously to check whether the scales exhibit equality of factor loadings and equality of
intercepts in all of the groups prior to examining group differences. Even though CTT, which is
based on the works of Spearman (1904), is the predominant measurement paradigm in
marketing, it has some shortcomings that have been well documented (Bond and Fox 2001; Fox
and Jones 1998). For example, CTT assumes a linear model, where individual items of a multi-
item measure are linearly related to the construct score and measurement error (Xi = i + i
+i). This assumption is not empirically tested; hence the formula is simply a tautology.
Item response theory of measurement (IRT), on the other hand, makes it possible to empirically
test the form of relationship between individual scale items and the construct score. Proponents
of IRT models argue for these models because they provide estimates of both item and subject
parameters on a common scale, something that is not possible to obtain in CTT. This property is
helpful during scale purification. For example, by comparing the relative locations of item and
person estimates on a common scale, we would be able to determine whether to delete any items,
add new items, or whether the existing items of the measure are sufficient and provide a useful
continuum for all subjects. Among the IRT models, the Rasch model has been extensively
applied in educational and psychological measurement. If a measure meets the assumptions of
the Rasch model, such instrument is said to be uni-dimensional with strong psychometric
properties (Fisher 1974). Considering the various positive features of the Rasch model, at the

57
least, it qualifies for being adopted as a parallel measurement paradigm in marketing. In this
paper we assess the applicability of Rasch model as an alternative to CTT based techniques such
as confirmatory factor analysis.
While IRT models are beginning to find application in marketing (DeJong, Steenkamp, and Fox
2007), they are not yet as popular as CTT based techniques because of the need to have larger
sample sizes, the difficulty of finding statistical software, and the complicatedness involved in
interpreting the results. For those who are critical of CTT based techniques, a different approach
to assess validity of measures is based on Generalizability Theory (GT) or G-Theory. Recently,
Durvasula et al. (2006) as well as Sharma and Weathers (2005) encouraged application of GT in
scale validation because it provides more diagnostic tools for evaluating measure validity. For
example, if a measure is not invariant across groups, we do not know what causes it to vary
across groups. It could be because of variation in subjects' responses, country differences, and/or
country by item interaction. GT explicitly recognizes that several sources (e.g., items, persons,
countries, dimensions, etc.) can contribute to measurement error, and GT makes it possible to
assess the combined effect of these sources and their interactions. The overall generalizability
coefficient indicates whether the measure can be generalized across samples and persons. Like
IRT based techniques, applications of GT are beginning to appear within the consumer behavior
discipline only recently. In this paper we also evaluate validity of measures using GT and discuss
its usefulness to cross-national validation of multi-item scales as compared to CTT and IRT.
Research Method and Results
The handbooks on marketing scales illustrate several examples of multi-item measures (Bearden
and Netemeyer 1999; Bruner, Hensel, and James 2005), both within and across countries. We
selected one measure that has found wide application, which is the consumer ethnocentrism scale
or CETSCALE, for illustration purposes. This scale measures consumer ethnocentrism, which is
the appropriateness and indeed morality of purchasing foreign made products. The consumer
ethnocentrism scale (CETSCALE) has been applied widely within and outside the United States
(Netemeyer, Durvasula, Lichtenstein 1991; Durvasula, Andrews, and Netemeyer 1997). We use
the CETSCALE for the purpose of comparing scale validation results based on CTT, Rasch
Model, and GT. While previous studies compared CTT with IRT or CTT with G-Theory, no
paper has compared all three approaches at the same time. Our paper fills this gap in the
literature.
The data for this study is based on responses to the 17-item CETSCALE. Young adults with
similar educational background and evenly divided by gender provided the data in the U.S.
(n=148), New Zealand (n = 140) and Singapore (n = 200). Results provide moderate support for
the uni-dimensionality of the CETSCALE. Implications for using the three approaches to assess
cross-national applicability of other consumer behavior measures are then discussed.

58
M4B.1 Examining Mediating Role of Attitudinal Loyalty and Nonlinear Effects in
Satisfaction-Behavioral Intentions Relationship
Anand K. Jaiswal
Assistant Professor of Marketing
Indian Institute of Management, Vastrapur, Ahmedabad, India
Email: [email protected]
Rakesh Niraj
Assistant Professor of Marketing
USC Marshall School of Business
Email: [email protected]
Several existing studies have investigated the satisfaction, loyalty and behavioral intentions
relationship. However, two issues in these relationships remain unsettled. One of these relates to
the existence and nature of mediation that attitudinal loyalty may play in the relationship
between satisfaction on one hand and behavioral intentions constructs of interest for marketers,
such as purchase loyalty, willingness to pay more and internal /external complaining responses
on the other. Although loyalty includes both behavioral and attitudinal dimensions, much of
extant literature has focused on behavioral elements of loyalty ignoring attitudinal dimensions of
loyalty as well as its relationship with other constructs (Chaudhuri and Holbrook, 2001; Chiou
and Droge, 2006; Dick and Basu, 1994; Rauyruen and Miller, 2007; Wernerfelt, 1991).
The second issue relates to complex nonlinear nature of these links. Though such complex
nonlinear nature of satisfaction loyalty link is suggested by several researchers, few attempts
have been made to empirically examine nonlinearity (Mittal, Ross and Baldasare, 1998;
Anderson and Mittal, 2000). Moreover, researchers have used divergent functional forms to
model nonlinearity and their findings are often inconclusive (e.g., Anderson and Sullivan, 1993;
Oliva, Oliver, and MacMillan, 1992; Agustin and Singh, 2005).
Utilizing data from collected from 202 online shoppers in India we attempt to address these
issues in this study. We used a two-step structural equation modeling approach for the model
estimation. In order to test latent quadratic nonlinear effects, we chose the Marsh, Wen and Hau
(2004) unconstrained approach, as it offers important advantages such as smaller bias, robustness
and relative ease in implementation. In comparison to other methods such as single indicator
approach of Ping (1995), Marsh, Wen and Hau (2004) technique is closer to classical model by
Kenny and Judd (1984).
Our results provide empirical evidence about the mediating role of attitudinal loyalty in the
relationship between satisfaction, purchase loyalty, willingness to pay more and internal
complaining responses. Our study establishes the superiority of fully mediated model, in which
satisfaction affects purchase loyalty and other behavioral intentions through attitudinal loyalty,
over partially mediated model. We also find partial support for nonlinear effects in the
relationship. Results support nonlinearity in the case of attitudinal loyalty to purchase loyalty and

59
willingness to pay more links. Purchase loyalty and willingness to pay more have diminishing
sensitivity towards attitudinal loyalty.
To summarize our contributions, we add to existing literature by detangling the complex
relationships between satisfaction, attitudinal and purchase loyalty and behavioral intentions
such as willingness to pay more and external and internal complaining responses. In particular,
ours is the first study to examine the nonlinear effects of attitudinal loyalty on multiple
behavioral intentions constructs. Our study also establish the superiority of fully mediated model,
in which satisfaction affects purchase loyalty and other behavioral intentions through attitudinal
loyalty, over partially mediated model.

60
M4B.2: Mobile Phone Choice, Corporate Image And Customer Loyalty
Dr.P. Ganesan,
Associate Professor, VIT Business School, VIT University, Vellore 632014;
Email: [email protected]
Ms.Amritha Jain, Student, VIT Business School, VIT University,Vellore 632 014
Mobile production in India reaches by 107 million in 2011 from 31 million units in 2006
(Gartner-domain-b.com, August 8, 2007). India‘s mobile phone handset market is flooded with
many players. However, Nokia occupies 59.5 per cent market share, followed by Sony Ericsson
with Samsung (7 per cent) and Motorola (5.9 per cent) (Cellular-news, May 16, 2008). Apart
from the price, the features of the handset are the major influencers of the buyers decisions on
the mobile handset product, brand and model of the brand.
The innovations in products and services brought many changes in the lifestyles of the
individuals. Among many in recent decades, mobile phone is an important innovation that
makes the communication between individuals closer to each other being it as a business
communication or other wise. The variety seeking customers in buying mobile phone / handset
influenced by many factors: price, technology, brand name, batter life etc (Goode et al 2005;
Dewenter et al 2007) price, interface, brand and properties (Karjaluoto et al 2005) related to the
mobile handset, however, the company name and reputation (Chen and Palivoda, 2004: Oman
and Williams Jr, 2006) do have determine the customer decision in selecting and buying the
mobile handset.
It is essential for the company which is having and willing to have sizeable market volume and
value in the Indian mobile handset market to understand and aware that apart from the product
related attributes, how the company reputation in the minds of the customer influences their
product choice. Degree of customer loyalty has a tendency to be higher when perceptions of
both corporate reputation and corporate image are strongly favourable (Nha Nguyen and Gaston
Leblanc, 2001). In this context, the present study will attempt to answer the following research
questions:
What product related and non-product related attributes influences the customer in selecting
mobile phone handset? And
Is there any relationship between product related and non-product related attributes, company
reputation, corporate Image, Corporate Reputation and loyalty?
The above said research questions have answered by adopting convenience-sampling method for
the selection of sample for the study. The study area is semi-urban area namely Vellore District,
Tamil Nadu, India. The structured questionnaire was designed by incorporating many features
of mobile phone handset and corporate branding. The corporate branding scales related to
corporate name, image, reputation and loyalty were adopted from the study of Nizar Souiden et
al (2006). The factor analysis, correlation and regression analysis were applied to answer the
research questions stated above.
It was found from the factor analysis that the PCA brought out seven product and non-product
related factors that are influences the product preference or choice of the mobile handsets,
namely, After Sales services with Word of Mouth, Product Basic Features, External Connectivity
61
Features, Product Augmented Features with support, Compatibility Features, Durability of the
Product and Special Offer with additional feature. These seven factors accounted more than 61
per cent of variance with high reliability score of 0.795 (which is closer to the suggested
Cronbach Alpha 0.80).
The bivariate correlation results between the corporate branding dimensions and product and/or
non-product related variables show the expected positive relationship between corporate loyalty
and corporate name, image and reputation. However with product and non-product related
variables are concerned insignificant positive and negative relationship were identified with
corporate loyalty.
Nevertheless, the regression analysis by considering the corporate loyalty as a dependent
variable and independent variables viz., product and non-product factors, corporate name, image
and reputation illustrate that corporate image, corporate reputation, product related factors like
product basic features and external connectivity features are most important influencers of the
corporate loyalty by the customers. The finding of the study is strongly supports the earlier
findings by Ralf Dewenter (2001) and Nizar et al (2006).
The study highlights two important aspects in the influencers on customer decision with respect
to the mobile handsets in India with specific reference to the semi-urban center of India. First,
semi-urban customers (like their counter-parts in urban / city customers) of mobile handset also
give due importance to the corporate or company manufactures the product which are consumer
durable in nature based on company name, image and reputation, not just the brand name of the
product as in the case of fast moving consumer goods. Second, apart from the essential or basic
features of mobile handset, customers also listen to the recommendations of the friends, sales
persons and company‘s employees with after-sales service and model at reduced prices.

62
M4B.3 Performance of Loyalty Programs in Small Businesses: Some Australian Evidence
B. Ramaseshan, Curtin University of Technology, Perth (Australia)
Email: [email protected]
Megan Johnston, Hismelt Corporation, Perth (Australia)
In recent years there has been a proliferation of loyalty programs in different industries.
Consumers are offered various incentives in exchange for repeat business. Customer loyalty is
very important to organizations as it offers substantial benefits in terms of increased revenue,
reduced customer acquisition costs, and lower costs of serving repeat purchasers, leading to
greater profitability (Reichheld, 1996). Customer loyalty has also very powerful influence on a
company‘s performance (Lam, Shankar, Erramalli and Murthy, 2004). Jones and Sasser (1995)
found increased customer loyalty to be the single most important driver of long-term financial
performance. In an attempt to capture some of these benefits, many firms have adopted loyalty
programs aimed at building closer relationships with customers, stimulating product and service
usage, and retaining valued customers (Verhoef, 2003; Kivetz and Simonson, 2003).
Accordingly, researchers have begun to investigate loyalty programs, with only limited and
contradictory published empirical work available at present (Crie et al., 2000; Bolton et al., 2000;
Verhoef, 2003; Lewis, 2004).
Due to the many technological advances today, loyalty programs can be found across a broad
spectrum of industries although a vast majority that employ loyalty programs are large size
firms. The incidence of loyalty programs among small businesses is low. As a consequence
research relating to the cost effectiveness of loyalty programs in small businesses in general and
Australian small businesses in particular is not adequate. Kumar and Reinartz (2006) pointed out
that there is limited empirical evidence on the success or failure of loyalty programs and that it is
particularly difficult to get unbiased information about the performance of firm specific loyalty
programs, partially because proper metrics are not in place, and partially because low
performance is unlikely to be admitted. This research is aimed at evaluating the cost
effectiveness of selected loyalty programs in the context of small businesses in Australia. This
study fills a gap in existing literature to evaluate the cost effectiveness of loyalty program by
employing a simple method at an individual participant level, introducing a time and redemption
liability element. The intent of this research is to assess the extent to which customer loyalty
programs are achieving the desired goals among small businesses.

63
T1A.1 The Impact of Social Contagion on What Brand to Buy, How to Buy and Whom to
Buy From: Evidence from High-Tech Durable Goods Market
Ramkumar Janakiraman 1. Mays Business School, Texas A&M University,
Email: [email protected]
Rakesh Niraj2Marshall School of Business, University of Southern California
Email: [email protected]
Social contagion, also known as peer effects, refers to interpersonal and often informal
communication between consumers, who are independent of the firm. A rich stream of literature
in marketing, economics and sociology has established the importance of social contagion on
consumers‘ choice behavior in several contexts. Most of these studies have focused on the effect
of social contagion on consumers‘ adoption of a new product in general. However, consumers‘
purchase process of a product, entails not only the decision of what to buy (i.e. product choice),
but also the decisions of how to buy (i.e. channel choice) and whom to buy from (i.e. retailer
choice). The underlying reasons of learning from other consumers and social-normative
pressures (Van den Bulte and Stremersch 2004) that makes social contagion effective and
relevant in consumers‘ decision of choice of a product, can also be relevant in consumers‘
decisions of where and how to buy it, especially for complex, high priced and/or high
involvement products. For example, influenced by a neighbor, a consumer might decide to buy
the same brand of computer (e.g. Dell), via the same channel (e.g. online) and from the same
retailer (e.g. Circuit City) as her neighbor.
No study to our knowledge has systematically analyzed the effect of social contagion on
consumers‘ channel and retailer choice, let alone all the three choices simultaneously. Failure to
understand the simultaneous effect of contagion on all the three decisions limits us in our
understanding of the full scope of social contagion on consumers‘ decision making, from a
theoretical perspective. From practice point of view, there are no guidelines for retailers to
understand and benchmark how consumers‘ choice of retailers and the different channels they
employ is driven by firm controlled marketing actions, compared to social contagion that are
outside their control. Besides, ignoring the effects of contagion on consumers‘ retailer and
channel choice behavior can lead to biased estimates of marketing-mix variables, and non-
optimal allocation of marketing resources. The primary purpose of this study is to address the
gap in the literature and to facilitate a holistic understanding of social contagion on consumers‘
choices of brand, channel and retailers, all in a single framework.
Drawing on the literature of social contagion, and consistent with random utility framework,
we propose to develop an individual-level joint model of consumers‘ decisions of what brand of
product to buy, whom to buy it from and how to buy the product, and analyze how each of the
three decisions are influenced by social contagion. In order to get unbiased estimates of the effect
of social contagion on the three choices, one has to address several key econometric challenges.
First, it is important to control for firms‘ marketing actions on consumers‘ choice, failure of
which can overstate the effects of social contagion (Van den Bulte and Lilien 2001). Secondly,
from an institutional feature point of view, one has to develop an econometric model to explicitly
64
account for structural constraints that are prevalent in this industry. For example, some brands
(Dell, for example) sell only directly to consumers, while many other brands (like HP) may be
bought directly from the manufacturer, or remotely using a catalog or online retailer or by
physically visiting one of the many type of retailers that carry this brand. Furthermore, it is also
important to account for the ―reflection problem‖ (Manksi 1993) and the issue of correlated and
unobserved factors in order to properly identify the parameters associated with social contagion.
Finally, the magnitude of social contagion may differ across consumers depending on whether a
consumer is a first time buyer or a repeat purchase buyer. Failure to adequately control for
consumers‘ prior knowledge with the product may again lead to biased estimates of social
contagion. We develop an econometric model to explicitly account for all the challenges
discussed above.
Leveraging a micro-level dataset of purchases of personal computers, we develop brand,
retailer and channel related contagion measures at the individual consumer level and estimate a
joint disaggregate model of the three choices that make up a product purchase process. Our
results indicate a significant effect of social contagion on each of the three choices, and that the
effect of brand related contagion on consumers‘ choice of a brand is greater than the retailer and
channel related contagion on consumers‘ choice of retailers and channels respectively.
Furthermore, we find evidence of a greater effect of contagion on those consumers who are new
to the product category. Our results help develop a holistic understanding of the effects of social
contagion on consumers‘ decision-making.
Key words: Social Contagion, Neighborhood Effects, High Tech Markets, Durable Goods,
Consumer Decision Making

65
T1A.2: Acculturation to the Global Consumer Culture: A Comparison of Young
Consumers in Nigeria and the United States
Steven Lysonski
Professor and Miles Research Scholar, Marquette University
Srinivas Durvasula
Professor and Edward A. Brennan Chair in Marketing, Marquette University
Email: [email protected]
Idris Odunewu
Marquette University
More than two decades ago, Leavitt (1983) argued that a convergence of tastes and preferences
among consumers was inexorably transforming the marketplace. This radical transformation
was envisioned as having an enormous impact on how business, particularly marketing, would
operate. Homogenized tastes, arising from this convergence, meant that firms could focus on
value creating activities geared more to transnational marketing vs. customized marketing.
Transnational marketing means that firms could appeal to global market segments sharing
common tastes. Since that rather bold statement was made by Leavitt, lively debate continues on
the merits of this argument.
While this debate continues, metrics to determine if these common tastes are indeed emerging
have not been well developed. Instead, studies have looked at the presence of global segments
such as teens, the elite and the middle class. What is missing from research is a tool to measure
the extent to which consumers in various countries are being transformed to fit the global
consumer culture. Recently, however, Cleveland and Laroche (2006) developed a scale to
measure acculturation to the global consumer culture. Their approach represents one of the first
to gauge the mindset of the ―transformed‖ global consumer. The scale that Cleveland and
Laroche developed consisted of several dimensions to measure different aspects of such
acculturation such as cosmopolitanism, exposure to marketing activities of MNCs, English
language exposure, social interactions while traveling, global mass media exposure, openness to
and desire to emulate global consumer culture, and self-identification with global consumer
culture. The goal of our research is to determine if this scale is applicable to assess the
acculturation of consumers in Nigeria to the global consumer culture and how this concept is
related to other consumer behavior variables such as attitude towards domestic products (vs.
imports), materialism, and consumer ethnocentrism. Nigeria has become relatively wealthy
because of oil and this wealth has attracted foreign companies to market their products there.
Furthermore, we also wished to examine the extent to which young Nigerians have become
exemplars of this global consumer culture in comparison to young Americans who ostensibly
should already be a part of this culture given the modernity of the United States.
Data collected from a sample of about 150 consumers each in Nigeria and the United States will
be the basis for performing various statistical analyses. Confirmatory factor analyses will be
applied first for examining dimensionality and reliability of various measures. Covariance
structure analysis of item parcels of various measures will then be applied for examining
relationships among acculturation to global consumer culture and other consumer behavior
variables.

66
The paper will be organized as follows. We begin by examining the emergence and
development of consumer culture in light of the acculturation process that is transforming
marketplaces. We then describe the different dimensions that seem to describe this acculturation
process as identified by Cleveland and Laroche (2006). Subsequently, we outline the method
that we used, the variables that we measured and the sample of consumers who provided us the
data. Following a presentation of the results, we provide the conclusions and discuss the
implications of our results for creating and communicating product value to global consumers
segments.
References
Levitt, T. (1983), ―The Globalization of Markets,‖ Harvard Business Review, 61 (May-June),
92-102.
Cleveland, M. and Laroche, M. (2006), ―Acculturation to the Global Consumer Culture: Scale
Development and Research Paradigm,‖ Journal of Business Research, 60, 249-259.

67
T1A.3: Seeking Bargains: Is that Worth My Time?
Ritesh Saini, George Mason University, Email: [email protected]
Raghunath S. Rao, University of Texas, Email: [email protected]
Ashwani Monga, University of South Carolina, Email: [email protected]
Consumers love bargains. The possibility of cheaper products urges people to drive to far-flung
outlet malls; the prospect of getting a discount makes them clip and save coupons; and the
promise of instant savings at the time of purchase is reason enough to sign up for the store-
specific credit card. But how far are consumers willing to go in order to get such bargains?
Consider an example of two stores: Store A sells a shirt for $20 but Store B sells the same shirt
for $10. Would a consumer, who is already in Store A, be willing to take a five-minute drive to
Store B in order to save $10? Furthermore, would the consumer be willing to drive to save $10 if
the price at Store A were $60? Traditional economic theories suggest that consumers should base
this decision simply on how much they value the benefit of $10 versus the cost of a five-minute
drive. However, research on relative thinking suggests that a discount of $10 seems less
appealing if the price is $60 rather than $20. This notion is significant for marketers because it
implies that, given a fixed sales-promotion budget aimed at increasing store traffic, a manager
ought to make discounts more attractive by applying them on products that are priced low rather
than high. We delineate the conditions under which managers ought to do the opposite. We show
when and how a $10 discount can seem more appealing on a price of $60 rather than $20.
Relying on the strength of multidisciplinary research, we rely on a mathematical model to derive
new predictions that we then test in behavioral studies. Our theorizing involves a consideration
of referent thinking, which involves the reference price that one expects to pay. We employ an
analytical model to study how two behavioral tendencies—relative and referent thinking—
interact when they are jointly incorporated into the prospect theory value function. This leads to
novel predictions that are supported in three laboratory experiments, which employ an
infrequently-purchased product category (blankets) and a frequently-purchased product category
(gasoline). An additional study attests to the counter-intuitiveness of our results and provides
evidence that these effects might be occurring without people being aware of them. Specifically,
when a group of participants were given details about one of our experiments and asked to
predict what the results would have been, they suggested a pattern that was consistent with
intuition, but opposite to the results that we actually found.
Overall, our research incorporates psychological findings into a theoretical model to predict
novel effects related to consumers‘ bargain-seeking behavior, which we then confirm in
behavioral studies. The specification of these effects in a model affords wide applicability. For
instance, this model can help understand the effect of other consumer benefits, beyond the
monetary promotions that we studied. It can also be extended to the perception of product
surcharges, such as costs of delivery. Our results offer direct suggestions regarding enhancing
the effectiveness of a fixed sales promotion budget by considering not only product prices, but
also how they differ from expected prices. Finally, recommendations arise in terms of when
promotions ought to be framed in absolute terms ($X off), and when in relative terms (Y% off).

68
T1B.1: Intention Conviction, Measurement, and the Prediction of Consumer Behavior
Murali Chandrashekaran, [email protected]
University of New South Wales
Kristin Rotte, [email protected]
University of New South Wales
Frank Kardes, [email protected]
University of Cincinnati
Maria Cronley, [email protected]
Miami University
Marketing scholars and practitioners work with consumer judgment data to test theories and
make predictions of consumer behavior. In this agenda, behavioral intentions continue to receive
attention from scholars and practitioners alike. The premise is simple: If you want to know what
consumers will do, ask them. And then hope they behave consistent with their intentions. The
empirical research on the intention-behavior link, however, has not produced unambiguous
findings. Even as the literature witnesses an incessant increase in theories and models of
intention and actual behavior, meta-analyses in marketing and psychology continue to indicate
that stated intentions often do not translate to behavior. More recently, Alexander, Lynch and
Wang (2008, JMR) document that the intention-behavior link is especially weak in the case of
predicting initial use of really-new products – consumers appear to be ―poorly calibrated in their
expectations of initial product use‖ (p. 307).
Recent research suggests that consumer intentions are particularly prone to ‗mere measurement‘
effects. Drawing on the thesis that respondents often conform to the demands of a survey
instrument by forming superficial attitudes, or ‗nonattitudes,‘ on the spot (Feldman and Lynch
1988; Converse 1970), Chandon et al (2005) demonstrate that the very act of asking consumers
to report on their behavioral intentions produces an overestimation of the intention-behavior link
(i.e., an increase in the net impact of intentions on behavior. Across three field studies, Chandon
et al find the intention-behavior link is about 58% stronger among surveyed consumers relative
to similar nonsurveyed consumers. This finding, that part of the predictive power of intentions is
an artifact of measurement, undoubtedly has profound implications for social science researchers
in general and managers in particular.
In this research, we theorize and demonstrate that the intention-behavior link is shaped not only
by mere measurement, but also by the latent consumer intention conviction (i.e., the extent to
which a consumer holds his intention with strength and certainty). We start by engaging the
question following question: How do nonattitudes present to the researcher? That is, what are
some properties of nonattitudes that help us distinguish them from attitudes, in general?
Espousing the view that nonattitudes can be distinguished from attitudes by centering on the
conviction dimension of judgments, we employ a judgment decomposition model (e.g.,
Chandrashekaran et al 2007; Grewal et al 2008) to (a) test the simultaneous impact of
independent variables on latent intention magnitude and conviction, and therefore estimate the
extent of latent conviction from revealed intentions, and (b) quantify the extent to which
69
intentions held with low conviction are likely to be discarded. The resulting model is responsive
to research in the area of spontaneous evaluating responding (e.g., Jarvis and Petty 1996) that
contends that respondents evidence heterogeneity in the extent to which their responses qualify
as ‗nonattitudes.‘
We assess the model in a field study, using data from an actual new product concept test in a
B2C setting. The analysis strongly supports the conviction-based model, and demonstrates that
(a) consumers with low levels of model-based intention conviction evidence lower intention-
behavior consistency, relative to those with high levels of intention conviction, and (b) a
predictive model of behavior that fails to account for intention conviction overestimates, on
average, the intention-behavior link by 54% compared to a model that explicitly incorporates
heterogeneity in intention conviction.
The second part of the research develops a behavior model to capture the interplay of conviction
and measurement in shaping the intention-behavior link. The model is assessed in another field
study, set in a B2B context and employing actual adoption behavior data from surveyed
customers and similar nonsurveyed customers. We first replicate the key finding from study 1
that, among surveyed consumers, lack of conviction dampens the intention-behavior link.
Results from the ‗conviction and measurement‘ model then reveal that the impact of mere
measurement on the intention-behavior link hinges on intention conviction. At the aggregate
level, the impact of mere measurement appears to be at least four times smaller than that
suggested by extant research that has ignored the role of conviction. At the individual level,
measurement produces both inflation and deflation on the intention-behavior link; at high levels
of intention conviction, measurement inflates the intention-behavior link and for 25% of the
population (consumers with low levels of intention conviction), mere measurement actually
deflates the intention-behavior link.

70
T1B.2. Value Creation Through Better Targetability: Genetic Algorithms For Dual
Objective Segmentation
P.V. (Sundar) Balakrishnan*
Professor of Marketing, Business Administration Program, University of Washington, Bothell,
WA 98011,
Email:[email protected]
Subodha Kumar,Assistant Professor of MIS,University of Washington, Seattle, WA 98195,
Email: [email protected]
Cluster-based segmentation is employed by marketers in designing marketing strategy in
numerous business domains. The dominant paradigm, the post-hoc segmentation approach,
unlike the earlier a priori segmentation, defines homogeneous clusters based on needs and
benefits (such as from conjoint part-worths data) and then works back to identifying the
segments based on classification variables. Under this current response-based paradigm, a K-
means approach is typically employed to define homogeneous clusters on needs variables which
are then profiled using a Discriminant type analysis on the classification variables. Such an
approach, it is now being increasingly recognized, leads to at least two major problems that make
life difficult for the practitioner.
Two of the most critical factors that are important in effectively and profitably
segmenting the market are identifiability and responsiveness (Krieger and Green, 1996).
Unfortunately, as has been recognized for some time now, a standard K-means approach to
defining homogeneous clusters may result in less than desired identifiability, i.e., market
segments representing distinct groups of customers that are based on specific characteristics (e.g.
sex, age, occupation, and etc.). In addition, there is growing recognition that K-means type
approaches lead only to a local maxima suggesting that the cluster outputs from standard
commercial packages are less robust than previously thought. Dissatisfaction with this K-means
based traditional approaches to segmentation and the need for alternative approaches to thinking
about effective segmentation is starting to burgeon among practitioners and academics.
The increasing focus in value creation through profitably segmenting target markets
requires simultaneously achieving identifiability of value and targetability. This is a
combinatorially difficult tradeoff that requires newer methodologies and efficient heuristics
(Krieger and Green, 1996, Forsyth, Gupta, Haldar, Kaul and Kettle 1999). Balakrishnan, Kumar
and Han (2006) had proposed the use of Genetic Algorithms to address the managerially
important problem of Dual Objective Segmentation. In this talk, we will briefly discuss the
alternative approaches and our proposed implementations. A comparative investigation of our
GA based approach with the Simulated Annealing Heuristics (Brusco, Cradit and Stahl, 2002) is
conducted and the detailed results of the resulting investigation based on a large scale Monte
Carlo simulation will be provided. The approach presented here shows that significant value in
targetability of segments is lost by using traditional post-hoc segmentation approaches. Using
our methodology it is possible to obtain significant improvement in the targetability of segments
(as shown by the variance explained in the background variables) with little diminution in the
variance of the needs or bases variables. Metrics for efficient and effective implementation of
this tradeoff will be presented to address this important managerial problem.

71
T1B.3: Assessing Presidential Priorities: A Comparison of Three Methods
V. ―Seenu‖ Srinivasan, Adams Distinguished Professor of Management,
Graduate School of Business, Stanford University
Email:[email protected]
Alex Makarevich, Doctoral Candidate in Sociology, Stanford University
Two methods are commonly used to assess priorities for the benefits in a product or service
category from individual customers: ratings and constant-sum allocation. A common problem
with the ratings approach is that it does not explicitly capture priorities; it is easy for the
respondent to say that every benefit is important. The traditional constant-sum approach
overcomes this limitation, but with a large number of (ten or more) benefits, it is difficult for the
respondent to divide a constant sum among all the benefits. ASEMAP (pronounced Ace-Map,
Adaptive Self-Explication of Multi-Attribute Preferences) is a new web-based interactive method
for assessing customer priorities. It consists of the respondent first grouping the benefits into
two or more categories of importance (e.g., more important, less important). The respondent
then ranks the benefits in each of the categories from the most important to least important. In
order to estimate quantitative values for the priorities, the computer-based approach breaks down
the attribute importance question into a sequence of constant-sum paired comparison questions.
The paired comparisons are chosen adaptively for each respondent to maximize the information
elicited from each paired comparison question. The respondent needs to be questioned only on a
small subset of all possible paired comparisons. Importances for the benefits are estimated from
the constant-sum paired comparisons by log-linear multiple regression. Unlike ratings and the
traditional constant-sum method applied across all the benefits, the proposed approach provides
standard errors for the priorities.
The empirical context was that of assessing priorities for seventeen issues by the Presidential
candidates for the U.S. election. The study was conducted in summer, 2008 prior to the U.S.
election. In addition to Constant Sum and ASEMAP, a state-of-the-art method called MAXDIFF
was also compared. The ASEMAP method provided a statistically significant and substantially
better predictive validity than the traditional constant sum method and MAXDIFF.

72
T2A.1: Communicating Value: Persuasion: Role of Affective and Cognitive bases of
Attitude Functions
Srividya Raghavan, Assistant professor and Doctoral Candidate,
Icfai Business School, Hyderabad
Email: [email protected]
One of the central functions of a marketer is to reach out to his consumers and marketing
communication is an effective tool for achieving this objective. As observed by Kitchner and
Pelsmacker (2004), ―Marketing communication is the collective term for all communication
functions used in the marketing of a product. The purpose of marketing communication is to add
persuasive value to a product for the consumer‖. In essence, the marketer attempts to ‗persuade‘
the consumer to adopt or trail his ‗offer‘, thereby creating a market for his offerings‘.
Extant literature on persuasion talks about the dual route to attitude change: the routes being
central/elaborate and peripheral/heuristic (Petty and Cacioppo, 1986, Eagly and Chaiken, 1986).
This stream of ―Persuasion‖ literature contends, with supporting empirical evidence, that the
elaborate or central route representing rational information processing causes more persuasion,
resulting in stronger or more enduring attitudes which are also more predictive of behavior.
However, another stream of research that examines the role of affect, talks about relational
elaboration and use of affect as information in the processing of information. This stream of
research which examines the role of affect provides evidence that suggest that perhaps affect can
influence attitudes and behavior faster and more extremely than cognition (Bakamitos, 2001;
Shiv, 1999, Ray and Batra, 1982). Ray and Batra (1982), point to four reasons why affective
(emotional) advertising may be more effective than cognitive (rational) advertising. According to
them ―affective advertising may, in many cases be effective advertising because it is attended to
more, processed more, evaluated more favorably and remembered more.‖ While this seems to
suggest that on the whole affective advertising tends to be more affective for several reasons
cited, this seems in contradiction with the well established Elaboration Likelihood Model that
suggest that emotional advertising works through the peripheral route and therefore is not as
powerful a persuader when compared to rational advertising which operates through the Central
route.
The conflicting results from the two streams of research seem to have diverged at a point where
they are ineffective in enabling decisions regarding the choice of appropriate persuasive appeal
in specific situations. As pointed out by Ray and Batra (1982), one of the agendas of this stream
of research is developing a theoretical understanding of, those situations where the use of
affective executions adds to advertising effectiveness and those where is merely entertains.
Integration hence appears necessary in order to understand the role of affect and cognition in the
persuasion process.
This research is an exposition of the process of persuasion, the attitudes of consumers towards
specific objects (products, brands etc.), the nature of attitudes and the susceptibility of attitudes
to different kinds of appeals, specifically, emotional and rational appeals. The research involves
a discussion of the theories of persuasion (Petty and Cacioppo, 1986; Chaiken, Liberman and
Eagly, 1989) and their inadequacy in explaining the role of emotional and rational messages in
the process of attitude change. Alternatively, the research suggests a method for understanding
the process of persuasion by analyzing the nature and bases of attitudes (Katz, 1960; Edwards,

73
1990; Shavitt, 1990). In this context, the tri-component theory of attitude and the functional
approach to attitudes are explored.
The suggestion that the functional bases of attitudes might be antecedent to the affective or
cognitive leanings of an attitude and that matching or mismatching the communication to this
foundation could explain the susceptibility of attitudes is the moot point of this thesis. The
dominant purpose of the study, from a marketing management standpoint is to demonstrate the
role of attitude bases in the persuasion process so that they can be taken into cognizance in the
creation of effective marketing communications. An object oriented approach to attitude
functions is identified and a conceptual framework is proposed. This framework aims to integrate
the structural approach to persuasion research with the information processing perspective of
persuasion theories.

74
T2A.2 : Information and Emotive Content in Chinese Print Advertising: A Scale
Revalidation Analysis
Rajendar K. Garg
Indiana University of Pennsylvania
Email: [email protected]
While many studies have utilized Resnick and Stern‘s (1977) classification system to assess the
level and efficacy of information content, results have been largely unsatisfactory for a variety of
reasons, such as, higher levels of information content being not necessary for persuasion,
consumers‘ lack of perfect information, product type interaction with information content, the
use, activity, efficiency and potency of information content. Assessment of emotional content in
print advertising although studied extensively elsewhere has been largely ignored in content
analysis. This study tests the efficacy of Resnick and Stern‘s (1977) classification for assessing
information content and revalidates the scales for assessing emotive content across 10 different
product categories. The current goal of this study is to validate the scales for assessing
information and emotive content. The ultimate goal of the project is to assess information and
emotive content in Chinese print advertising and do a cross-cultural comparison with American
print advertising.
While many authors have been involved in content analysis of Chinese print advertising, the
information content of an advertisement has been popularly assessed by using the fourteen
evaluative scales/criteria of Resnick and Stern (1977). Many studies have replicated the
methodology of assessing information content as containing any of the 14 information criteria
(Harmon, Razzouk, and Stern, 1983; Abernathy and Franke, 1996). Others have questioned their
methodology used to assess information content based on the choice of media (television
advertising) that may contain any informational content as well as the relationship between
information content and advertising persuasion (Laband, 1989). The bottom line is: if an
advertising isn‘t informative, is it effective? And if it is informative, is it more or less effective?
And what exactly is the role of the emotive content. Therefore, information and emotive content
analysis scales need revalidation if they are to be used as true indicators of advertising content
analysis.
Resnik and Stern (1977) view concrete information like price and quality as cues consumers can
use to make intelligent decisions among alternative choices. They operationalized the
informativeness construct through a content analytic scheme in which message content is
analyzed with respect to 14 evaluative criteria. They include 1) price or value, 2) quality, 3)
performance, 4) components or contents, 5) availability, 6) special offers, 7) taste, 8) nutrition, 9)
packaging or shape, 10) guarantees or warranties, 11) safety, 12) independent research, 13)
company research, and 14) new ideas. Based on the presence or absence of each content cue in a

75
message, this methodology provides an objective evaluation of the amount of information
communicated in an ad.
The emotive content scales used for validation include a set of 19 semantic differential scales
eliciting emotive responses to a variety of print ads across 12 product categories. The results of
the validation and cross-validation of the scales are analyzed and presented. The proposed
schemata for cross-cultural analysis is discussed for future research.

76
T2A.3: Content analysis of TVC‟s featuring Celebrities
Subhadip Roy
ICFAI Institute for Management
Teachers,Hyderabad;[email protected],[email protected]
Alan D‘ Souza
Mudra Institute of Communication Research, Ahmedabad;[email protected]
Mari Sudha
Mudra Institute of Communication Research, Ahmedabad;[email protected],
Broad aim of the proposed study is to analyze the nature of celebrity endorsements in Indian
Television Commercials (TVCs). The main focus however will be on the mode in which the
celebrity is used in the Ad namely the Explicit Mode, Implicit Mode, Imperative Mode, and Co-
present Mode (McCracken, 1989). The second objective of the study will be to identify if there is
any relation between the celebrity (in terms of occupation and gender) and the nature of the
product endorsed. The third objective of the study would be to look into the presence of
correspondence between the modes in which a celebrity is used in an ad to the product category.
Content Analysis was the selected methodology because of its application in analyzing the
communication message without putting the researcher‘s interpretation (Kassarjian, 1977). TVCs
were selected as the study variable. In the later stage of the study correspondence analysis was
performed to identify the nature of relationship (if any) between the mode in which the celebrity
is present in the ad and the product category featured in the ad.
Data i.e. the Television Commercials were collected from www.magindia.com. In this regard an
alphabet by alphabet thorough search of celebrities was conducted and television commercials
featuring those celebrities were selected. The time period of the selected ads ranged form 1995-
2007. The selection criterion was that an advertisement should have the celebrity present in any
form. This resulted in a set of 630 ads out of which used national celebrities. A total of 56
celebrities were identified to endorse various products ranging from soft drinks to cars.
Sachin Tendulkar was found to be the most featured celebrity in 61 ads; this was followed by
Amitabh Bachchan and Shah Rukh Khan both at 51 ads respectively. Nineteen (19) celebrities
had more than 10 ads to their credit. Food and Beverages was the major product group featured
in the entire set with 182 ads (28.9 %) followed by Health Care and Beauty Products with 92 ads
(14.6%) and Automobiles with 62 ads (9.8%).
Each ad was viewed first in its entirety without undertaking any coding. Then all the ads were
viewed several times to capture the nature of the portrayal of the celebrity in the ad. Two coders
independently performed the procedure and the results thus obtained were compared across the
two coders‘ output. This was done to ensure reliability (Kassarjian, 1977). The Explicit Mode
was coded as 1, The Implicit Mode as 2, The Imperative Mode as 3, The Co-present Mode as 4.
A frequency analysis of the modes in which the celebrity is portrayed in an ad showed the
Implicit Mode to be the most frequent mode with 395 ads out of 630 (62.7%). The Explicit Mode
was found to be the next most frequently used mode with 102 ads (16.2%) in that category. The

77
Imperative Mode with 86 ads (13.7%) and the Co-present Mode with 47 ads (7.5%) followed
this.
Only those product categories/groups, which had a more than 5% presence in the total dataset,
were retained in the sample before analyzing the correspondence between the mode of presence
of a celebrity and the product category/group. This was done to reduce the number of categories
with very small frequency. The six categories that were retained: Food and Beverages, Health
and Beauty Products, Automobiles, Telecom Products and Services, Apparel and Consumer
Durables. The total number of ads was reduced to 438. Two cross-tabulated frequency charts
gave an indication of the nature of correspondence between the celebrity type and the product
category. From the cross tabulated results it was evident that in all the major product categories,
film celebrities were more extensively used than sports celebrities. However, if we observe the
sports celebrities in isolation, the major product category to use them was the Food and Beverage
category. From the second cross-tabulated frequency chart, male celebrities were found to
dominate in all the product categories except Health and Beauty Care, where female celebrities
had a majority. To fulfill the third objective, a Correspondence Analysis of the product
categories to the mode of the celebrity portrayal was performed using SPSS 13. From the results,
it was evident that there was no clear correspondence between the product categories and the
mode of celebrity presence in ads of those products. It was observed that there was a majority of
ads where the celebrity was portrayed in the Implicit Mode (Mode 2) across all product
categories which led to inconclusive results in the correspondence analysis.
There are quite a few implications of the study. Most of the advertisements in the Indian scenario
were found out to be in the mode where the celebrity indirectly suggests the consumer to use a
particular product or brand i.e. the implicit mode. This is ideal for television advertisements
since the celebrity many a times plays the role of a character in the ad which is like a story.
However, this may be harmful in case the celebrity faces any public controversy or does not
excel in his own domain. Secondly, the other three modes were found to be used much less than
the Implicit mode and could be looked into as an opportunity by the marketer. From the findings
of the correspondence analysis it was evident that irrespective of the product category the
celebrity was used implicitly (mostly as an actor/actress). This may be because of the fact that
majority of the products advertised in TVC‘s are low involvement products. Thus when the
buying situation occurs, the consumer may remember the celebrity and thus the product and be
persuaded to purchase the product. Moreover, since the time involvement of the viewer is low
for a TVC, using the celebrities in other modes may not be worth it since the consumers will not
remember the speech/testimonial given by the celebrity. In spite of the limitations, the study had
generated some conclusive findings and will help to foster future research in this area.
78
T2B.1: Value Creation
N.Jayaraman
Consultant;[email protected]
Value creation in Global markets is determined by:
1. innovative products using technology
2 Exploring new markets .
3. Leadership and Entrepreneurship
4. Defining product portfolio
Tata Nano and GE Electrocardiogram innovative products, low price is fixed first ,
designed manufactured created rural .urban markets in India. Millions of Indian Public
using two wheelers at a cost ranging from Rs.50000- Rs.75000/ consider Tata Nano as family
vehicle as it can carry more passangers with roof over their head and also providing road safety
Similarly GE Electrocardiogram will provide affordable health care in India
Indian Telecom companies with 225 million customers., value addition works out to $
0.66 billion per customer. Telecom Network, Hand sets with added features of messaging,
video, camera , transmission towers add value . Rural connectivity is enlarging on a massive
scale. Farmers find latest market rates, weather report instantly
Leadership and Entrepreneurship for value creation by M/s Hutchiso and Lenova , is
visible M/s Hutchison was selling artificial flowers. Lenova a reseller of computers acquired
IBM.Computers Jet Airways Air Deccan, Radio Mirchi made early entry and by offering
quality service created Value addition Airline business opportunities: Government of India
policy allowing private airlines gave Jet Airways , Air Deccan an early opportunity to capitalize.
Jet Airways has ranked second within a short period of .. years. Advantage of private airlines
have relatively young aircraft and operating cost less,
. Companies define their product portfolio to improve value addition to stakeholders . M/s
IBM, Hewlard Packard and Xerox are model examples of defining their product portfolio . IBM
is earning $7 per share with a vision of EPS of $10 in 2013.by concentrating on Software and
Services They have recurring revenue of 50% from existing customers with strong brand
loyalty.
. HP and Xerox are competing printer manufacture where Xerox is restricted to single
product. HP diversified with software and ATM software efficiency by use of console capture
transactions and surplus/shortage of cash in every location M/s HP focus is on Personnel system
, Image and Printing , Enterprise storage and HP Services.. Environmental social responsibity,
their dynamic smart cooling system aims at 60% reduction in energy . Recycle 1 Billion pound
electronic products in 2007 and and 500 Billion pounds recycling during 2004-2007. Focus
return cash to shareholders
Business Focus: M/s Xerox has concentrated only on printing and imaging industry. They were
the first desk top plain paper copier in 1963 and color copier in 1973, First laser/ plain paper Fax
and commercial application of laser technology. Rendering one high quality page requires
billions of mathematical operations , new algorithm for image processing to achieve quality and
performance. Lead in toner photoreceptor building materials using nano technology, linguistic

79
tools, use of digital system reuse and storage Xerox by increasing patents introduce new
printers.
.Conclusion:
Entrepreneurship is the first essential element of value creation.
Companies competing for market share differentiate their product portfolio with Innovation and
patents.
Each company decides upon a matrix of product portfolio management. For example M/s IBM
which was in Hardware manufacture has moved from Hardware to Software and Financial
Services. The cost of production and margin are the deciding factors for strategy management
of product portfolio.
Referenece: Business World , Knowledge Wharton papers
80
T2B.2: IPL as a Value Creator for its Stake-holders
S. Manoharan- Assistant Professor, IFIM Business School
Email:[email protected]
Dr. Rajendra Nargundkar- Dean,Continuing Education, IFIM Business School.
Email: [email protected]
Indian Premier League (IPL) has redefined the sport of cricket and being a recent format
of cricket it has created a lot of excitement, entertainment and expectations from the spectators.
It is considered to be the biggest marketing event of 2008. This paper examines the role of IPL in
creating value to its stakeholders. It is confined to the major stakeholders- namely, team-owner,
the player, the TV channel and the cricket control board (BCCI). To understand the concept of
value creation and how IPL will take shape in forthcoming years, the researchers used qualitative
research where the Delphi technique and/or in-depth interviews with experts (sportspeople,
journalists, etc.) in the field were used along with secondary information.
Value Creation for Franchisee
From the point of view of the franchisee if he is owning a brand it paves a platform to showcase
his brand to the world wide audience. The scope for generating revenue by the franchisee is 80%
of money can be retained by them in gate money, selling advertising space in the stadium,
licensing products for their team like T-shirts, getting sponsorship for their team uniform,
advertising on tickets. The news item in Business Line indicates that India cements the
franchisee of the Chennai super kings (IPL team) has crossed break-even numbers in the
inaugural year which is the runner up in the trophy final.70 crores is the money spent on the
whole exercise in the first year which has been reaped quickly. Deccan Chronicle Holdings and
Group have decided to put the franchisee on sale. The expected enterprise value is likely to be
around $200 million whereas they had invested $107 in the last season.
Value creation for a Player
The players will be recognized quickly for national teams and one example is Virat Kohli
making an entry to the National team along with Badrinath, Brand endorsements are likely to be
more and depends on the performance and in long term the value of the player (in terms of
salary) depends purely on the current performance. The primary details reveal that there is a
greater scope for new talent getting exposed and also it is slightly difficult for the senior players
to get adapted to the changing formats. Also that it has a great deal of scope for junior players or
new players to get exposed to the world. There is great deal of risk if you are paid reasonably
high and if you don‘t perform, the possibility of playing in the next season is doubtful.
Value creation for BCCI
BCCI adds a lot of value to the already known as one of the worlds richest Sports Council. IPL
will be revenue spinner and already has increased the value of BCCI to a great level. BCCI gets
20% from media rights, 40% from title sponsorship and 20% from franchisee rights. An IPL
council headed by IS Bindra and assisted by Lalit Modi and others will manage the show

81
independently of BCCI. BCCI raked in Rs 289 crore (approximately $62 million) from the first
annual installment of the money the owners bid to buy the rights to own an IPL team.
Value creation for the TV Channel
The TV channel Sony Entertainment and Asia based World Sport Group (WSG) has won the
television rights for a ten year period for a whopping US $1 billion. TV rights are worth $918
million and additional $100 million is kept aside for the leagues promotion. The game of cricket
is well suited for the channel which opts to telecast such a mega event which is also acting as an
entertainment value, the game by its virtue gives a break after every over well suited for
advertisements unlike any other sport. The 10 second pricing went upto 10 lakhs during the semi
finals and finals which helped the channels to reap huge money. Media analysts agree IPL will
be a long-term money-earner for Sony. Says Peter Mukerjee, chairman of INX Media, ―With IPL
likely to grow with each season, Sony will up the ante for ad rates and turn the event into a cash
cow in coming years.
Conclusion:
IPL as a concept has really created a mark in the history of cricket. The sport has redefined the
traditional way of looking at cricket. The sudden arrival and apparent success of the new league
has shaken cricket from top to bottom. It is the most vivid illustration in sport of the shift in the
global economy from rich countries to the emerging world .It is very evident from the work that
it is a value creator to the stake holders and many others.

82
T2B.3: Creating value through seniors‟ social networks in third places
Kanika Meshram, Assoc. Prof. Alison Dean
University of Newcastle, Australia
Senior citizens are an important market group to study because most developed countries are
witnessing rapid growth in the size of their senior segment. However, the sociological aging
process reduces seniors‘ social networks, resulting in feelings of social isolation, and loss of
social capital. The cliché ―it is not what you know but who you know‖ can be used to describe
social networks. Belonging to a wide social network implies improvement in one‘s social capital
(Portes 1998) and healthy ageing for seniors (van Tilburg and van Groenou 2002). Third places,
like coffee shops, restaurants and clubs, are commercial settings that enable seniors to socially
interact and expand their social networks more than home (first place) and work (second place
but usually not applicable to seniors). Putnam (2000) claims that ‗places‘ that harbor social
relations to people generate value for themselves. Lusch and Vargo (2006) claim that value is
based on what elements are significant to the customer. For socially isolated seniors, third places
like seniors‘ clubs are a means through which they can expand their valuable social networks.
However, further exploration is required to investigate how expansion in social networks affords
value to the third place. In addressing this gap, this study explores the research question:
How do social networks developed in third places create third place value?
Considering the exploratory nature of the question a qualitative research design was suitable
(Denzin 2005). Data were collected from four senior citizens‘ groups: two separate formal
community groups (Clubs A and B), one informal residential group (Club C) and one formal
residential group (Club D). A combination of focus groups (six), unstructured interviews (three)
and participant observation (six week period for five hours per week in Club B) was adopted to
explore the above research question. Data were examined using QSR NVivo 7 software
(Richards 2005). To add rigour to the qualitative analysis meaningful themes that emerged from
the data were systematically compared to determine general themes within the data and to initiate
theory construction (Strauss & Corbin 1990, Spiggle 1994). Three themes were identified to
surround third place value: 1) Place value as routine, 2) place value to socialize and 3) place
value as home. The subsequent discussion will address each theme in detail and provide actual
quotes wherever possible.
Third place values were mostly influenced by the type of social ties (strong or weak) seniors had
developed from the club. Findings from the study revealed that seniors‘ social interaction in the
club resulted in either a strong social or weak social tie within the club members. Granovetter
(1983) describes strong ties as networks between close friends and weak ties as network of
acquaintances. Based on the type of social ties (strong or weak) it was of interest to explore
whether seniors possessed different views on the value of the club. Thus, open ended questions
including ―Why do you visit this club?, and Does club membership enable you to make close
friends?‖, revealed that some seniors visited the club to predominantly keep up with their weekly
schedule. Words like ―on Saturday I visit club A to play bowls then Sunday I go shopping with
83
my friends, on Tuesday I play cards in club Z I visit club X only to take bus trips‖ were used to
express their routine value from the club.
In contrast to seniors seeking value from ―routine‖ were those seniors who visited the club only
to chat, have fun and to socialize with club members. ―Socializing‖ represented the second major
type of value. Words such as ―I visit this club only because my friends like to come here, or ―I
visit this club to have a chat and a cookie with my friends‖ or ―I get camaraderie from this club‖
were used to express seniors‘ attachment towards their friends in the club rather than the club
itself. Such members had strong ties with the club members and perceived the club to be a social
space that enabled them to meet and engage with their friends.
Within the category of strong ties were seniors who had deep sense of affection towards the club
and to its people. The place value for this group arose from the club being like ―home‖. Words
such as ―without this club we will all fade away‖ or ―this club is my second home now‖ or
―people in this club are like my family‖ were used to express their deep sense of affection
towards the club‖. Thus findings from our study confirm that although the club enabled seniors
to expand their social networks, seniors visited the club with different purposes and consequently
generated different types of place value from the club; Place value as routine, place value to
socialize and place value as home.
Overall, this paper contributes to existing literature, which is very thin on place value but
comprehensive on service value and brand value concepts (Bolton & Drew 1991, Crimmins
2003, Shun Yin Lam, Venkatesh Shankar, et al. 2004). We introduce the concept of ‗place value
creation‘ and probe future research to explore the role of place value on loyalty, satisfaction and
affective commitment towards a service place.

84
T3A.1: Sticky Choices in Unfiltered Sets
A. V. Muthukrishnan
Hong Kong University of Science and Technology, Clearwater Bay, Kowloon,
Hong Kong, China,
Email: [email protected]
Luc Wathieu
ESMT European School of Management and Technology,
Schlossplatz 1, 10178 Berlin, Germany,
Email: [email protected]
Through the random assignment of subjects, choice experiments seek to neutralize the
effect of each subject‘s history in order to effectively highlight context effects. In real life,
however, individual historical circumstances determine each consumer‘s sensitivity to contextual
influences, and an important research agenda is to explore what historical choice circumstances
contribute to the emergence of stable preference patterns. One line of work, including research
on the endowment effect (e.g., Kahneman, Knetsch and Thaler, 1990) and on habituation (e.g.,
Wathieu 2004) indicates that experiences of past ownership reinforce preferences. Another line
of research, to which the present paper belongs, focuses on contextual characteristics that
increase the confidence with which consumers hold their expressed preferences. In a recent
paper, Muthukrishnan and Wathieu (2007) have shown that increased consumer participation in
the form of additional choice steps caused an experience of deliberation likely to foster
preference persistence. Earlier research by Muthukrishnan (1995) showed how consumers
develop persistent preference patterns in response to contextual ambiguity. There seems to be an
emerging general theme that the present paper further reinforces: consumers tend to persist more
confidently with preferences they have expressed in less guiding, more untidy, choice
environments. This general contention might help us reflect on the ecological validity of static
contextual effects obtained in the laboratory, and provide background for people in charge of
designing choice environments for actual decision makers.
In this paper, we study the effects in terms of preference persistence associated with the
presence of dominated alternatives in the choice set. While Huber, Payne and Puto (1983) have
described how one can influence choice by adding asymmetrically ―decoy‖ alternatives, the
dynamic effects associated with selection in the presence of dominated alternatives have not
been studied. The observation that rejecting dominated alternatives might build up confidence in
choice might sound intuitive, but it goes against the other intuitive notion that dominated
alternatives are necessarily irrelevant.
H1: Rejecting dominated options increases the likelihood that the chosen option is chosen again
in future choice contexts.
One might question whether the effects of rejecting dominated alternatives deserve a specific
investigation. Is the mechanism similar to an endowment effect? Is dominance really needed, or
will extra trade-off choices induce the same pattern? In addition, dominated alternatives imply a
superfluous editing stage, and such stages are already known to induce persistence. The
following hypotheses, if true, justify the specific focus on rejecting dominated alternatives.

85
H1A: Rejecting dominated options increases the likelihood that the chosen option is chosen in
future choice contexts, as compared to a situation of initial endowment.
H1B: Rejecting dominated options increases the likelihood that the chosen option is chosen in
future choice contexts, as compared to an initial situation involving a trade-off.
H1C: Rejecting more dominated options further increases the likelihood that the chosen option is
chosen again in future contexts, as compared to when fewer options are being rejected.
H2: Rejecting dominated alternatives in one choice context can enhance confidence in choice
and preference persistence in an adjacent context.
To make this point we have a sequence of four experiments. The first experiment
demonstrates the effect that receiving a preferred object makes it less persistent than choosing it
against a dominated alternative. This experiment also shows that it‘s not just a matter of posing
an act of choice but it does matter that the rejected alternative is a clearly dominated. Along the
same line, the second experiment shows that rejecting more dominated alternatives is conducive
to persistence, not only because it has passed a lot of tests, but domination matters. In the third
and fourth experiment, we show that the persistence-building effect of choosing against a
dominated alternative creates a mindset that is contagious on nearby choice areas. The added
value of the fourth experiment is to show causality by having precedence.

86
T3A.2: An evaluation of microblogging as a marketing communication Platform
Gautam Ramdurai
Ogilvy & Mather Advertising
Email: [email protected]
Introduction
Microblogging is a form of blogging that allows users to send brief updates to public and private
networks. These updates are typically short in length (less than 200 characters) and can be
submitted by a variety of means, including text messaging from mobile devices, instant
messaging, email or the web. The short posts are uploaded to a microblogging service, then
distributed to group members. All parties subscribing (or ‗following‘) to microblog are instantly
notified, enabling groups to keep tabs on one another's activities in real time.
Microblogging has been studied from a social perspective and a user appropriation perspective.
Past research provides only an overview is available when looking at it in a marketing
perspective. This work aims to analyze it in terms of a viable conversation marketing engine for
any brands.
Microblogging with Twitter
For the analysis, this paper uses twitter.com as a case in point. Twitter is the most popular
microblogging service on the Internet, with the number of users approaching 2 million. The
explosive growth and expansion of microblogging as a communication platform owes to the key
characteristics representative of it. The following characteristics set microblogging apart from
other social media technologies:
Ease and Simplicity Signing up for the service is extremely simple and so is posting/updation.
Hyperconnectivity Accessibility has been taken to new levels with the ability to update a
microblog using a multitude of channels including SMS, IM, the web and the scores of Twitter
applications built on its open API.
Minimal Time Investment As opposed to other content generation activities, writing posts that
are less than 140 characters in length takes very less mental effort and time.
Speed and Real-Time Updation Updates from other users reach in real-time to a number of
channels (including mobiles). This immediacy of communication has promoted Twitter as a tool
for emergency communication.
Current use of microblogging in marketing
There are a few brands that have already moved in to communicate with consumers and the
world via Twitter. An analysis was done of the activity on Twitter accounts of 8 such brands.
Each individual post was analyzed and classified. Each brand uses the microblogging service
differently. Inherent patterns in the type of posts reflect the overall objective of the brand.
The use of microblogs for marketing can be classified into three categories:
Listen Before joining the conversation with consumers, brands must pay attention to what they
are saying and understand them better in two ways:
Passive: The marketer stays on the sidelines and monitors how consumers are engaging with
his/her brand.

87
Active: Brands seek answers to specific questions about what the consumer wants. These
answers have more value, since the people who are following a brand have already opted-in and
have a high relevancy.
Inform One of the important user intentions on Twitter is information seeking. This could take
three forms:
Promotion: Tweeting about a new product, offer or discuss existing products. E.g. DellOutlet
gives exclusive discounts to Twitter users.
Updation: New announcements, information that is related to the brand and the products.
Syndication: Directing traffic to the company's homepage or any other page that might be
relevant to the company and the user.
Relate Generally preceded by the Listening exercise, since it is easier to begin a conversation
since the basic premise has already been set.
Responding: When the consumer has a direct query, or has made a statement that is relevant to
the brand, a timely and relevant response establishes a two-way connection between brand and
consumer.
Serving: Here, the relationship value is purely service based through ad hoc troubleshooting and
assistance.
Measurement
Based on our analysis different metrics can be devised to gauge the fulfillment of different
marketing objectives. In the simplest of cases, the number of replies or responses from the
brand's end can be an indicator of its engagement with the customer. Marketers should also
monitor their tweet frequency (the number of posts in a given period of time) to avoid exceeding
the signal-to-noise ratio.
Conclusion
In the current attention economy, as structured messaging gives way to conversations,
microblogging shows a potential arena for marketers to not just start these conversations but to
nurture them for a long standing relationship with their customers

88
T3B.1: Exploring the Dynamics of Trade Show Effectiveness
Srinath Gopalakrishna, Professor of Marketing, David and July O‘Neal MBA Professor,
University of Missouri, Columbia, MO 65211 (Presenting Author) email: [email protected]
Shrihari Sridhar, Doctoral Candidate in Marketing, University of Missouri, Columbia
Gary L. Lilien, Distinguished Research Professor of Management Science, Penn State
University, University Park, PA 16802
Trade shows constitute an important part of the business-marketing communications mix.
They account for 20-25% of the marketing budget in U.S and Europe (Stevens, 2005), offering
enormous opportunities for buyer-seller interactions. Three-quarters of attendees at trade shows
say they have some buying influence. The trade show industry is valued at $120 billion and
organizers attracted 64 million attendees and 1.5 million exhibitors in 2007 (CEIR 2008).
A noteworthy aspect is that the average firm exhibits at nearly 46 shows a year (Stevens 2005).
Despite substantial expenditures on booth space, staff, promotions etc., these decisions are often
based on ―gut feelings‖ (e.g. we expect to do well) or heuristics such as spending till the budget
is exhausted. While the marketing literature has seen advances in optimal advertising planning
models (e.g. Feichtinger et al 1994), there are large gaps in knowledge on tactical aspects of
trade show planning. The goal of our paper is to help exhibitors make better decisions in this
area. Specifically, we address how exhibitors can a) decide which shows to attend and b) how
much to invest at those shows for a given planning horizon.
We employ a two-step approach in our paper. First, we build a dynamic aggregate trade show
response model. Extant research has treated a trade show as an isolated event i.e., the static
response-models assume that past actions of the exhibiting firm have only contemporaneous
effects (Gopalakrishna and Lilien 1995). However, the marketing literature dating from the
classical theoretical models (Vidale and Wolfe 1957; Nerlove and Arrow 1962) acknowledges
the prevalence of dynamic marketing effects. In our context, the effectiveness of an exhibitor‘s
participation at a trade show may be related to its past trade show actions for several reasons:
(a) Many attendees are likely to have attended previous shows in the same industry or may have
visited the firm‘s booth at a previous show
b) First-time participants at the current show might demonstrate an indirect carryover effect
through word-of-mouth by contact with their network of colleagues or
c) The firm's presence at a show may be highlighted by the trade press and show management
which may influence the behavior of subsequent attendees. In sum, it is plausible that there may
be a carry-over effect of exhibiting.
Our dynamic model is similar to Nerlove-Arrow (1962) i.e. we posit that marketing actions at a
show generate goodwill for an exhibitor. Goodwill decays if the exhibitor makes no appearance
at the subsequent show but is enhanced if there is participation. The goodwill (unobserved)
influences the number of leads that an exhibitor generates at a show. Our model has two
important differences from the classic model. First, trade shows occur at irregular time intervals
unlike typical multimedia models; thus our model has to be estimated using irregular time series
methods. Second, shows vary considerably in the number of attendees they attract, e.g. in the IT

89
industry, they range from 5,000 - 50,000. We posit that exhibiting at a larger show (as defined by
higher attendance) might increase a marketing variable‘s effectiveness.
We estimate our model based on data from a large firm in the IT industry. Our data spans over
300 trade show appearances by the firm during the years 2004-2007. Using a Kalman Filter
approach (e.g. Xie et al 1997), we find statistical support for our dynamic model. Specifically,
we find that the carry-over effect, effects of booth space on goodwill and the interaction effect
between attendance and booth space are all statistically significant. In addition, we find that our
model fits the data better than a static model and forecasts adequately.
We employ these estimates in developing a decision support system (DSS) that can enable
exhibitors to make optimal planning decisions. Towards this end, we integrate our forecasting
model with the solutions from a finite horizon optimal control problem. This can offer
mathematical guidelines on selecting the optimal number of shows and the expenditure at each
show selected in a planning horizon (e.g. a quarter). Preliminary results suggest that it may be
optimal for exhibitors to skip a few shows in their consideration set and still do better.
In summary, we make contributions to the trade show literature, by providing the first known
documentation of trade show carryover effects and furnish normative guidance based on model-
based evidence for important tactical decisions. We also contribute to the literature on dynamic
marketing models by introducing a technique to handle the irregular time-series aspect in a new
application area.

90
T3B.2: Influence Of Personality Traits On Goal Orientation And Performance Of
Salespeople– A Conceptual Analysis
Binu Markose
PhD Research Scholar
Dept. of Management Studies
Indian Institute of Technology Madras
Chennai – 600 036.
Email: binu_markose @ rediffmail.com
Dr. S. Jayachandran
Professor (Marketing Management)
Dept. of Management Studies
Indian Institute of Technology Madras
Chennai – 600 036.
Email: sjc @ iitm.ac.in
The two objectives of this study are:
1. To analyze the influence of the big five personality traits on goal orientations of
salespeople.
2. To analyze the influence of the big five personality traits on performance of salespeople.
The work by Sujan et al. (1994) brings into sharp focus two distinct goal orientations of
salespeople, learning and performance. Kohli et al. (1998) made some significant contributions
to this emerging topic. Salespeople with a learning orientation have a strong desire to improve
and master their selling skills and abilities continually and view achievement situations as
opportunities to improve their competence (Dweck and Leggett 1988). In contrast, salespeople
with a performance orientation focus on performing well because they see good performance as a
means to obtaining extrinsic awards from others (e.g., Supervisors). Although there is
considerable stability in individual‘s learning and performance goals, environmental conditions
can make a learning or performance goal more salient. Thus, these motivational orientations are
considered to be both traits (i.e., stable dispositions) and states (i.e., situationally influenced
conditions) (Amabile 1983, Ames and Archer 1988). Even though situations may influence these
orientations, work in psychology suggests that the orientations are relatively stable and that
individuals may possess varying degrees of each orientation (Sujan et al. 1994, Vandewalle and
Cummings 1997). This indicates that a significant slice of goal orientation of an individual can
be considered as stable which indicates that goal orientation in an individual is inherent in nature.
Hence, it can be inferred that there is significant influence of personality traits in the formation
of goal orientation of an individual. Harris et al. (2005) studied the influence of five personality
traits, viz. need for learning, materialism, competitiveness, conscientiousness and openness to
experience on these orientations. The authors reported that some of these traits were found
influencing the goal orientation of salespeople. Conscientiousness, need for learning, and
materialism significantly influence learning orientation whereas competitiveness, materialism,
and openness to experience significantly influence performance orientation. But the authors
didn‘t consider all ―big five personality traits‖ viz. conscientiousness, emotional stability,

91
agreeableness, extraversion and openness to experience called the five factor model which are
considered to be the core traits ( Norman 1963, Luthans 2002). Hence, it will throw more light
into the relationship between personality traits and goal orientation of salespeople from the
analysis - Influence of ―big five personality traits‖ on the goal orientation of salespeople.
Sales managers base many of their most important decisions (e.g., promotions, transfers,
compensation, providing feedback, selecting training programmes for salespeople, and making
terminations) on their overall evaluations of the performance of their sales personnel.
Salespeople can be evaluated in three stages – input, process or output. When salespeople are
evaluated at output stage by monitoring salespeople‘s sales, gross profits and so on, the
evaluation is referred to as output performance, where as when the evaluation is at process stage
by monitoring salespeople‘s selling strategies, work procedures and so on, the evaluation is
referred to as behavioural performance. The evaluation of salespeople at the input stage itself
may have a positive effect on the subsequent evaluation at process and output stages. On this
context, whether to evaluate salespeople based on their personality traits at the input stage is an
interesting question. Because it is generally believed that salespeople with good personality will
produce better results. In a meta analysis by Barrick and Mount (1991), the findings revealed that
the big five personality variables have numerous implications for research and practice in
personnel psychology, especially in the subfields of personnel selection, training and
development, and performance appraisal. Hence the study of the influence of these personality
variables on the performance of salespeople will be a contribution to the sales arena. The two
aspects of salesperson‘s performance viz. output performance and behavioural performance are
considered in the analysis since research shows that both dimensions of performance have
considerable importance in the evaluation of salesperson‘s performance and in the organization‘s
effectiveness (Kohli and Jaworski 1994, Oliver and Anderson 1995, Grant and Cravens 1996,
Baldauf and Cravens 1999).
92
T3B.3: Quality And Quantity- The Case For Multiple Channels
Ranjan Banerjee, Carlson School of Management ([email protected]), Kersi Antia, Wisconsin
School of Business
Email:[email protected].
Shantanu Dutta, Marshall School of Business
Email: [email protected].
Faced with ever-increasing competition and fragmenting markets, firms‘ use of multiple
channels – the simultaneous use of owned and independent channel intermediaries within a
market – has become more the norm than the exception. Since the early 90‘s, more than 85% of
firms have relied on multiple channels for their go-to-market strategy (Easingwood and Storey
1996). As stated by Coughlan, Anderson, Stern, and El-Ansary (2006, p.257), ―…multiple
channels are a way to make markets: Suppliers and customers can find each other more easily
and match their needs to channel types.‖
Despite the increasing importance of multiple channels, there are still gaps in our
understanding of the antecedents of multiple channels. Existing explanations have centered
around the ability of multiple channels to cater to alternative customer segments and enable firms
to keep pace with market growth (Coughlan et al 2006; Rangan 1990; Frazier 1999). These
explanations do not adequately cater to the widely prevalent phenomenon of firms deploying a
mixture of company owned and independent stores which do not differ in terms of offering and
price. It is not uncommon for firms to deploy multiple channels in business to consumer contexts
where there is no explicit customer segmentation There is thus an imperative to explain the
existence of multiple channels when customers are allowed to choose between channels, and the
channels are not necessarily segment specific. Second, there is limited empirical evidence on the
performance implications of specific channel structures. Existing empirical evidence has focused
either on the antecedents of channel governance (Anderson,1985, John and Weitz,1990) or on
the performance of a specific channel configuration (Aulakh and Kotabe, 1997, Srinivasan,
2006). Evidence is scant on the relative performance of company owned and independent
channels within a channel configuration. This question is particularly germane when we consider
the twin objectives that firms seek to achieve through channels of acquisition: a) Acquisition
goals- these pertain to acquiring customers in large volumes, and catering to the growth potential
of the market. b) Retention goals-these pertain to enhancing the profitability per acquired
customer. These goals are achieved through enhancing the longevity and depth of usage of the
customer base. It is apparent that when these goals are simultaneously pursued, multiple
channels should be deployed only if no single channel structure is dominant in terms of
performance on both goals. There is thus a need to assess the relative performance of company
owned and independent channels on acquisition and retention goals.
The present study addresses both the preceding issues, and makes two key contributions
to our understanding of multiple channels: First, we clearly delineate firms‘ disparate yet
simultaneously pursued objectives – acquisition (number of customers) and retention (revenues
per customer) goals. We then draw on existing governance-related theory to suggest that
vertically integrated channels will tend to outperform independent channels on imperfectly
93
measurable revenue enhancing tasks which require greater supervision and control. Conversely,
independent channels are posited to be easier to set up and expand, amenable to incentive based
governance, and are thus likely to outperform firms‘ vertically integrated channels with respect
to the volume of customers acquired. If supported, the preceding argument would imply that
company owned channels, by their actions, better serve the purpose of enhancement of revenues
per acquired customer (quality), whereas independent channels are better geared to acquire a
larger number of customers (quantity).
This is significant, in that it suggests a differential capability on the part of each channel type
with respect to quality and quantity goals. This contention would only be supported if we could
test the performance of alternative channel governance structures on both these goals. This is the
second key contribution of our study. Ours is, to the best of our knowledge, the first study to
empirically explore the performance of company owned and independent channels with regard to
quality and quantity goals. A unique feature of our data is that we are able to assess performance
at an individual channel level, and establish support for our contention that a ‗portfolio‘ of
channels is employed by firms to achieve a balance between quality and quantity goals.
We leverage a unique dataset on customers acquired by two inbound retail channels of a
mobile telephony provider in India, the world‘s fastest growing market for mobile telephony, to
explore the performance implications of multiple channels. We focus on a specific channel
descriptor, governance (whether a channel is company owned or not) and explore the impact of
governance on volume of customer acquisition and revenue per customer. Our context is a
subscription services context, where customers enroll in the service at a point in time and use the
service over time. When a customer exits the service, the firm derives no further revenues from
the customer. Our context is also a concurrent channels context, in that the focal firm uses a mix
of own and independent channels that transact in the same geography and sell the same products
(Sa Vinhas and Anderson, 2005). Thus the channels do not explicitly cater to alternative
customer segments, and retail customers can choose between company owned and independent
stores which offer the same products.
Using a multivariate mixed effects regression with appropriate controls for unobserved
heterogeneity, we show that the governance properties of the channel impact positively on
customer usage, billing conditional on usage, and tenure. Conversely, we show that governance
adversely impacts a channel‘s contribution to the total volume of customers acquired. We use
unique features of our data set to explore possible alternative explanations for our findings, and
show that our hypothesized effects persist even after accounting for the impact of these
alternative explanations.

94
T4A.1: An Integrative Model Of Package Size Propensity
Amit K Ghosh
Associate Professor
Cleveland State University
Email: [email protected]
The U.S. consumer packaged goods (CPG) industry is characterized by fierce competition
among firms attempting to dominate an increasingly mature marketplace. Consequently, the
CPG marketplace has become more complex for consumers who are exposed to an ever-
increasing array of product and packaging options along with constantly changing prices and
promotions. How do consumers react to the various product options? What are their
motivations and how can we target them? What strategies should be employed and how would it
impact firm financials? These research questions have drawn considerable attention from
academics and practitioners and are the focus of this study. In this article, we research a
consumer‘s propensity to purchase a package size or package size propensity. While many
aspects of package size propensity have been researched, limitations include use of experimental
or attitudinal data in some papers, lack of behavioral characteristics and promotional variables in
some models, and inadequate conceptual model that helps us understand why consumer
characteristics might impact package size propensity.
Our research purpose is to help marketers gain a deeper understanding of factors of package size
propensity by formulating a model that help marketers understand the motivation underlying the
correlates of package size propensity. We believe that such a model can also be used to
formulate marketing strategy and to predict consumer responses. We review prior research and
address some of the limitations in the past research in order to formulate an integrative model. A
conceptual model based on the ―economics of information,‖ or the benefits and costs of
information search by consumers, is developed that links behavioral information (e.g., number of
visits to store), response to marketing mix variables (e.g., type of promotion), and demographic
surrogates (e.g., income) of consumers to package size propensity through the benefits and costs
of information search.
The model and the theoretical framework is empirically validated using scanner consumer panel
data provided by Information Resources Inc. The regression model is significant and most the
parameters are in the expected direction – indicating that the model probably does not have
specification error and is likely to be internally consistent. The large and balanced sample of
over 5,600 household across the US is likely to allay fears about external validity. The adjusted
r-square of 47% is over 2.5 times higher compared to similar studies conducted using regression
analysis. The high explanatory power of the model demonstrates the utility of including
responses to marketing mix as well as behavioral variables in the analysis. For promotional
elements, the place where the information was processed by consumers also seems to impact
behavior. While many of the demographic variables are statistically significant, relatively, they
have considerably lower impact compared to the other variables on the dependent variable.
Overall, six out of the eight demographic surrogates are associated with package size propensity.
The results also suggest that there could be imperfect market performance due to low price

95
awareness in the constantly changing CPG marketplace and that consumers in the CPG market
probably use volume discount heuristic in making choice decisions.

96
T4A.2 : Factors That Add Value At The Supplier-Customer Interface:A Case Of The
Fresh Vegetables And Fruits Industry.
Ms .K .Suma Rao,
PES School of Engineering (PESSE), Bangalore
Email: [email protected]
A report by the Austrade on Agribusiness in India has observed that ―although India is the
second largest producer of fruits and vegetables in the world, an estimated one-third of the
combined annual crop is wasted or destroyed due to poor post- harvest techniques and
inadequate transportation, refrigeration and processing infrastructure. Only 2 percent
(approximately) of the total produce is processed commercially.‖ Also there is minimal value-
addition all along the supply chain for fresh vegetables apart from the small scale of operations.
A post liberalization phenomenon is the development of the organized retailing with the concept
of supermarkets and shopping malls, particularly in South India. The Indian Government has
also removed the restrictions on the import of vegetables and fruits leading to intense
competition. In this context the study of the supply chain for fresh fruits and vegetables gives
ample scope for creating better value for various stakeholders.
Competitive strategy may be defined as a set of customer needs that a firm would satisfy through
its products and services. (Michael E.Porter). For products such as fresh fruits and vegetables the
strategy would be to ensure the availability of the right product at the right time, at the right
place and at reasonable prices. ―This strategy dictates that the ideal supply chain will emphasize
efficiency but also maintain an adequate level of responsiveness.‖
( Sunil Chopra ;Peter Meindl)
The primary objective of the supply chain operations, therefore, would be to maximize the
overall value generated ie the difference between what the final product is worth to the customer
and costs the supply chain incurs to fulfill the customer‘s request.
To achieve this, the sub objectives will include:
What should be the structure or the design of the supply chain that is appropriate for perishable
products like fresh vegetables and fruits?
What are the essential processes that need to be performed at each stage of the supply chain such
that Supply Chain responsiveness and efficiency are adequately addressed?
How is the term value interpreted for perishables like fruits and vegetables, among large
organized units?
What are the components of costs incurred and corresponding revenues generated and will these
maximize the value created along the supply chain?
PRELIMINARY OBSERVATIONS:
The current study requires a good understanding of the buying pattern and service levels required
by the bulk buyers of the products. As several parties are involved this in reality refers to a
supply chain network
The appropriate design of a firm‘s supply chain will depend on the
Customer needs reflected by selected categories of retail organizations.
The specific role played by the stages involved.
Likely impact on costs.

97
In certain cases manufacturers respond to an order (pull strategy) while in other cases the
producer has a stock of inventory from which he fulfills the orders (push strategy).
From a process cycle perspective the supply chain includes four major process cycles viz:
Customer order cycle, Replenishment cycle, manufacturing cycle, and Procurement cycle
These when combined form three strategic key areas viz: Customer Relationship Management
(interface between the buyer and supplier); Internal Supply Chain Management (interface
between the organization sub groups) and the Supplier relationship management (interface
between the manufacturer and the supplier)
The sample of processes covered under each of the heads would be as follows:
CRM ISCM SRM
1. Generate demand
from the retailers
1. Plan internal prod.&
storage cap1
Selection of suppliers
2. Facilitate placement
of orders
2. Prepare DD & SS
plans for various
products
2.Negotiate on price and
delivery terms with
suppliers
3. Tracking of orders 3. Fulfill actual orders 3.Sharing of DD and SS
plans with suppliers
4. Marketing process 4.Locationof warehouses 4. Placement of orders.
5. Pricing process 5. Size of warehouse 5. Placement of
replenishment orders.
METHODOLOGY:
This includes study of secondary data sources of the fresh fruits and vegetable industry
.Specifically the status of the industry in emerging markets would be evaluated and their
relevance to the Indian market would be examined. In addition, primary data based on in-depth
interviews would be elicited from a sample of 8-10 different categories of organized retail units
in Bangalore. Additionally a content analysis of the concept of value would also be elicited from
the field study.
CONCLUSIONS: This will include:
Viable supply chain design options for the products under study.
Identification of important value adding activities and the key area that would provide a
competitive advantage in this industry.
Key processes for effective management of the supply chain.

98
T4A.3: A Study On Shopping Styles In Garment Purchase And Comparison Of
Multibrand & Exclusive Brand Retail Outlets.
Prof.D.Malmarugan
Associate Professor Sadar Vallbhbhai Patel Institute of Textiles Management
Email id: [email protected]
Need for the study: The well-known exclusive brand outlets of garments are becoming a threat
to the Multi brand outlets. At the same time, multibrand outlets dominate the scene by return of
investment conversion. Values have become especially important to branded outlet in order to
stay in the game. So, there is a research is required to handle retail decisions in a competitive
context. A study is needed to identify the consumer shopping styles for the garment purchase.
This research also focuses on to the consumer preferences towards Multibrand outlet and
Exclusive brand outlet.
Objectives:
1) To identify the various parameters shopping styles of consumer behavior towards garment
purchase according to their demographic profile.
2).Identify the type of retail outlet consumers preferred.
Methodology: A descriptive study was conducted to achieve the objectives with systematic
sampling method. The study was conducted on 300 respondents focused on two cities,
Coimbatore in Tamil Nadu and Kochi in Kerala state.
The Systematic Sampling design has been used for the proposed study. Instrument to be
used for collecting data is questionnaire method. A pilot study has tested in order to preparing
the questionnaire. Following types of questions are used in the questionnaire.
Open end questions
Multiple choice questions
Semantic differential scale
Limitations of the study: The areas of study are limited only two cities; the customers in other
large cities may not have the same style in the selected areas. The people in rural areas of the
selected cities are not included for sample as they are not interested in branding
Findings and Implications: This research reveals that the demographic features of consumers
such as age, income, gender, occupation and place are affecting their shopping styles for
garments.
The study helps to understand the shopping styles of the consumer and how it affects their choice
of retail outlet. This study enhances the market knowledge about the consumer preferences and
the formats of various retail outlets.
The study recommended that exclusive brand outlets should provide more promotional activities
about its product quality and trend to attract customers. They can give more awareness related to
price range as the customer hesitates to shop from branded outlets. Exclusive brand outlets can
fill the gap in the category of female exclusive brand shops.
In the current scenario of advent of luxurious malls and various retail formats, this study will
help the market researchers to get an outlook about consumer behavior related to the retail
formats.
Keywords: Shopping styles, Multi Brand Outlets, Exclusive Brand Outlets

99
T4B.1: The Trend towards Marketing „Green Energy‟
Dr. R. Venkatesh,
Faculty Member,
IBS, Chennai
Email:[email protected]
Against a grim background of atmospheric pollution and environmental degradation
the need for devising and making use of alternative and renewable energy sources has become
urgent. The marketing of such energy (‗green energy‘) has also assumed vital importance and
many corporates are now engaged in addressing this issue. These developments constitute a real
integration of the concept of creating, communicating, and delivering value.
In both the Western countries and the developing world, governments are paying
greater attention to renewable energy. Several industrial units have come up with innovative
technologies to tap the alternative energy sources like solar, wind, and wave or tidal energy. Pro-
active pursuit of business options in marketing the equipment is also being seen in the U.S.,
Europe and Asia. The manufacture and marketing of these products (solar panels, wind turbines
etc.,) has picked up momentum in India.
Sustainable development is possible only by the use of alternative energy sources. The
Confederation of Indian Industry (CII) has been spearheading the efforts in this direction. The
CII Sohrabji Godrej Green Business Centre (CII – Godrej GBC), for example, is engaged in
promoting concept marketing in the area of green energy and power. It is now a centre of
excellence. It is worth noting in this context that ―green‖ denotes the ―voluntary pursuit of any
activity that encompasses concern for energy efficiency, environmental management, renewable
energy, waste management, and recycling.‖ There is recognition of the fact that any pollution is a
form of economic waste. A wide range of products and markets including technologies in
alternative energy like solar, wind or tidel power constitute ―clean technology.‖ Advanced
recycling mechanisms, solar power projects for residential and commercial use, smart grid
technologies for the utility power grids, and alternative fuels such as bio-diesel and ethanol come
under this rubric.
The market potential for clean technology in India is large. Tapping this has become
imperative in the context of energy demand for outstripping the supply and the country importing
nearly 75% of crude oil costing U.S. $ 56.4 billion. The financing of renewable energy projects
is managed by lending agencies and banks. The ‗Yes Bank‘ has taken a lead here.
A number of incentives for investment in clean energy are made available. These include
tax concessions for industries using wind and solar energy devices. It is expected that marketing
of green energy will be spurred further in the near future. Undoubtedly, this calls for a lot of
entrepreneurial spirit; already fresh ideas are emerging along with new business models. The
diversity must also be noted – this covers stand-alone projects and projects within operating
companies. The private sector has been responding to the challenge by investing in wind energy.
The key drivers in this endeavor are: progressive policy and infrastructure support, experience of
the last two decades and fiscal incentives like accelerated depreciation and income tax benefits.
Suzlon, an integrated wind turbine manufacturer has production facilities in India, China,
USA, and Europe. The company has brought about a paradigm shift in India‘s wing energy
market with an ‗End-to-End Solution‘ enabling hundreds of customers (small/ medium/ large

100
enterprises, public sector companies, and even individuals) to set up their own wind energy
products. Suzlon has consolidated its market share all over the world and maintains a formidable
leadership in the Indian market for the last nine years.
The manufacture an marketing of energy saving solar water heating systems form the core
business of enterprises like Emmvee Solar Systems Pvt. Ltd., having a turnover of Rs.65 crore.
Tata BP Solar India Ltd. manufactures and supplies solar photovoltaic and solar thermal
products/ solutions. The company will be reaching a capacity of 300MW by the year 2010. A
joint venture between Tata Power Company, a pioneer in the power sector and BP Solar, a
world renowned solar enterprise, it has a fully integrated solar manufacturing plant including cell
and modular assembly and Balance of systems all at one site. The total turn over comes to
Rs.910 crore.
ORB Energy Pvt. Ltd. specializes in the design, manufacture, supply, and installation of
solar photovoltaic cells and solar thermal energy. The products include solar PV panels, home
lights, street lights, power packs, solar rooftop integrated systems and high efficiency inverters.
With a modest turn over of Rs.15 crore, the company is doing its best to market the equipment
and improve its business as a turn-key solar solution provider.
An efficient networking of Research and Development (R&D) institutions and
venture capitalists for promoting eco-friendly products is now discernible. Creen Business
Incubation at CII- Godrej GBC aims at hatching technology-led follows a pro-active pursuit of
business opportunities.
India‘s new age private sector bank, Yes Bank, with its vision of ―responsible banking‖
wants to differentiate itself in the market place on a strong ‗sustainability mandate‘. It is the first
Indian bank to become a signatory with the United Nations Environment Programme (UNEP) for
financial initiative. The bank is promoting ‗green energy‘ with a commitment to corporate social
responsibility (CSR).
There are other bright features in the area of green energy. ―Light up every village with
LED lights‖ is the motto of Lifeway Solar Devices Pvt. Ltd. based in Cochin, Kerala. The
company with its aim of promoting solar power in rural India manufactures and markets solar
lanterns, solar security fencing, and LED table lamps. It practises CSR through ‗Kudumbashree‘,
a poverty alleviation scheme, a success story in Kerala. Many unemployed women are trained in
servicing solar lanterns and take the marketing message to the villages.
101
T4B.2: When two is company, is three a crowd?
Prof Rajan Mani,IBS,Chennai
Email: [email protected];[email protected]
This paper seeks to describe a research study just started, which itself is an extension of a
presentation made at GLIM – NASMEI 2007. The earlier study focused on the emerging
situation in Chennai in 2005– 2007 where an English newspaper entrenched for about 130 years
– The Hindu – was shaken, if not stirred, by the advent of The Deccan Chronicle in this Southern
metropolis. The latter was able to carve out an approximate share of one-third of the English
newspaper market within this period, according to our study as well as independent reports.
The present study seeks to carry the research further, now that one more all India newspaper, The
Times of India has also launched a Chennai edition. Also, certain aspects which were not probed
in the earlier study are proposed to be taken up this time. This time around, we shall try to factor
in dimensions such as multiple readership of newspapers, especially English newspapers and
vernacular papers, apart from trying to understand the dynamics of switching. We would like to
see if we can gather insights on how many people have switched newspapers, their motivations
for doing so and their profile.
The study itself is just moving from the planning to the execution stage. Like the earlier study, a
couple of students at the B-school where I teach are helping me this time too and we have
finished deciding the aspects to be studied, the sampling plan & size, the format of the
questionnaire, who will collect the information, how and when .. et al. At the moment the pilot
study is over, small modifications to the questionnaire have been made and data collection has
started.
To help in profiling the respondents and especially to seek to identify any differences in readers
of the various newspapers as well as their habits and tastes, information on the following aspects
will be collected – age, gender, education, occupation and income. The next paragraph gives
more details of the other information being collected.
We start with ascertaining the main medium used to access news – press, television, radio or the
Internet. Next we shall collect information on reading habits such as the time spent to read the
paper, the number of papers bought in the household, the types of newspapers bought (general or
business) and the different languages (English or otherwise) of the newspaper(s) bought. We
shall also ask the respondents to rate the importance of certain stated features for an ideal
newspaper.
This gives us a platform to find out whether the respondent has either changed his or her English
newspaper or added another such newspaper in the last four years (since the Deccan Chronicle
was launched in Chennai). We will then try to probe the reasons for the change.
We hope this will give us enough inputs to analyse differences in profile of a) readers of the
various English general papers published from Chennai and b) those who have either changed
their newspaper or added another newspaper since the DC & the TOI entered Chennai. Since we
also intend to collect information on the reasons for the change, we hope to collect information
on the various segments of the newspaper reading population preferring the various papers
published from Chennai.
By the time Great Lakes-NASMEI Conference II takes place in December 2008, we should have
been able to get enough pointers to these aspects.

102
T4B.3: Ambush Marketing: Attack and Counter-Attack Strategies”
Dr. V.J. Sivakumar, M.Sc., M.B.A., Ph.D.
Email: [email protected]; [email protected]
The paper looks into the concept of marketing, which has picked up in the last few years because
of the prominence of the sporting events, known as Ambush Marketing. It discusses why
Ambush Marketing is so popular and what are the strategies, which make it such a potent tool for
companies? The paper also looks at the pros and cons, the ethical and legal issues, which are
associated with such kind of tactics.
The most important feature of the paper is that it dwells into the strategies which a company
using Ambush marketing would employ. By understanding the strategies employed by the
Ambush Marketers, the paper then develops a framework and suggests strategies which firms
and event organizers should adopt to counter the effect of Ambush Marketing, or in other words
ambush the ambush marketers, by taking their main weapon away from them.
If the strategies are carefully implemented it would be useful for understanding the motives and
strategies of both parties, which would be involved, and will further help to maximize there
advantage in the market space by either using ‗Ambush Marketing‘ or by countering
‗Ambushers‘.