chemistry research journal, 2017,...
TRANSCRIPT

Chemistry Research Journal, 2017, 2(4):104-117
Chemistry Research Journal
104
Available online www.chemrj.org
Research Article
ISSN: 2455-8990
CODEN(USA): CRJHA5
Water Quality Assessment of Lake Edku using physicochemical and Nutrients Salts, Egypt
Mohamed A. Okbah1, Ahmed M Abd El-Halim
1, Mohamed A. Abu El-Regal
2, Mohammed
El. Nassar2
1Marine Chemistry, National Institute of Oceanography and Fisheries, Alexandria, Egypt
2Marine Science Department, Faculty of Science, Port Said University, Egypt
Abstract The present work is aimed to assess the water quality status of Lake Edku using the data at various
locations on the lake based on the Water Quality Index (WQI). Water Quality Index was applied in ten water quality
parameters (pH, Dissolved Oxygen, biological oxygen demand, suspended particulate matter, Electrical
conductivity, Nitrate, Nitrite ammonium and reactive phosphate. The results revealed that the pH values lie slightly
on the alkaline side, with a range of (9.07 -7.47), Electrical conductivity (EC) showed a wide range (590–
5125μS/cm) with an average 1871.88 μS/cm. The values of dissolved oxygen (DO) and Biological oxygen demand
(BOD) ranged (1.56 to 18.10 mgl-1
) and (0.91 and 15.90 mgl-1
), respectively. Suspended particulate matter ranged
between 16 and 122 with an average 37.81 mg/l. The range and the average values of nutrients (µM) were; 0.22-
67.3 (11.36), 1.54 - 80.04 (18.65), 0.11 - 37.29 (10.72), 1.33 - 108.38 (31.63), 1.36–70.97 (19.17) for reactive
phosphate (PO4/P), ammonium (NH4/N), nitrite (NO2/N), nitrate (NO3/N), reactive silicate (SiO4/Si), respectively.
The present study revealed that phosphorus is limiting nutrient factor (N/P > 5) in winter, spring and autumn but
during summer (N/P < 5), nitrogen is limiting nutrient factor for plant growth. T The results of WQI of the
investigated area ranged between1.59 and 32.79. Autumn, spring and summer recorded excellent water quality,
while winter was lower of water quality comparing to other seasons.
Keywords Water Quality, Assessment, Nutrient Salts, Lake Edku
Introduction
With rapid urbanization and economic development, especially the coastal areas, this rapid economic growth has
resulted in a series of severe environmental problems [1] such as increases in eutrophication [2], organic pollutants
[3], heavy metals [4], and habitat degradation [5], which have placed new pressures on national sustainable
development, as water quality may only partially reflect environmental impact [6], more attention should be given to
the status of biological communities and conservation biodiversity in the management of aquatic eco systems [7].
Lake pollution is one of the serious environment problems in recent years with socio-economic development and
pollutants discharge increase from industry, agriculture and domesticity. Increasing human populations and the
expansion of industrial and agricultural activities have been important driving factors for the rapid deterioration of
freshwater ecosystems. Water quality can be assessed by various parameters such as BOD, temperature, electrical
conductivity, nitrate, phosphorus, potassium, dissolved oxygen, etc. Heavy metals such as Pb, Cr, Fe, Hg, etc. are of
special concern because they produce water or chronic poisoning in aquatic animals [8] Lakes are one of the
important water resources used for irrigation, drinking, fisheries and flood control purposes. Lakes also provide a
habitat for invertebrates, fishes and aquatic birds [9]. A vast number of lakes have suffered varying degrees of

Okbah MA et al Chemistry Research Journal, 2017, 2(4):104-117
Chemistry Research Journal
105
pollution across the world, and to monitor lake water quality, physical and chemical proxies have been
commonly used [10]. Basic physical and chemical parameters are included, which determine the characteristics of
an aquatic system and hence the biological population structure and composition [11]. WQI is defined as a rating
reflecting the composite influence of different water quality parameters a water quality index based on some very
important parameters can provide a single indicator of water quality. In general, water quality indices incorporate
data from multiple water quality parameters into a mathematical equation that rates the health of a lake with number
[9].Water quality in an aquatic ecosystem is determined by many physical, chemical and biological factors.
Therefore, particular problem in the case of water quality monitoring is the complexity associated with analyzing the
large number of measured variables, and high variability due to anthropogenic and natural influences [12]. Water
quality index (WQI) can also be used to aggregate data on water quality parameters at different times and in
different places and to translate this information into a single value defining the period of time and spatial unit
involved [13]. During the year 1970, a Water Quality Index (WQI) was developed at the National Sanitation
Foundation (NSF). It appears to be the most comprehensive form of WQI [14]. The present study aimed to follow
the changes of physicochemical and nutrient salts (NH4/N, NO2/N, NO3/N, PO4/P, and SiO4) and chlorophyll-a in
Lake Edku water and assessment of water quality index (WQI)
Materials and Methods
Study Areas
Lake Edku is an important fishing area in Egypt, receives its water from two sources. The main source is the
drainage water of KomBelag and Bersik drains (1836.55 × 106m
3). The sea water of Abu Qir Bay enters the lake
sometimes through the lake sea connection as subsurface water current under the action of wind especially in winter
[15]. Its area has decreased from 28.5x 10³ to about 12x10
³ Fadden’s [16].Lake Edku receives huge amounts of
drainage water from three main drains, namely, Edku, Bousaly, El-Khairy and Berseek, which open into the eastern
basin of the lake, the drainage water contains unspecified quantities of urban, industrial, agricultural and chemicals
from Beheira Governorate and beyond [17].
Sampling
Sampling stations are shown in Table 1 and Figure 1. Ten surface water samples were collected using in flatable
rubber boat (Zodiac) during four seasons through 2016.The samples were taken into clean white Polyethylene
bottles.
Table 1: Sampling stations
Station Station Name Latitude / Longitude
I Al-Tarfaya drain 31°15'20.64"N 30°10'18.92"E
II Hantour Gate 31°14'53.55"N 30°10'33.66"E
III Churches gate 31°14'9.46"N 30°11'54.28"E
IV AL-Tawila gate 31°14'21.25"N 30°12'43.67"E
V AL-charaship 31°15'13.63"N 30°13'54.63"E
VI AL-Berka 31°15'9.55"N 30°12'42.18"E
VII (Edku drain) 31°15'48.15"N 30°13'57.94"E
VIII Allbany mosque 31° 15' 46.19"N 30° 12' 45.921"E
IX International road 31° 15' 46.21" N 30° 11' 29.6592"E
X Albogaz 31° 16' 0.4902"N 30° 10' 46.3182"E

Okbah MA et al Chemistry Research Journal, 2017, 2(4):104-117
Chemistry Research Journal
106
Figure 1: Study area and sampling stations
Chemical analysis
Dissolved oxygen and BOD was analyzed according to Winkler’s methods [18].Conductivity determined by
conductivity meter. pH determined using pH meter. SPM Determined by filtration of 250 ml of water sample
through dried and weight 0.45 µm filter paper (Millipore) by vacuum pump. The residue was washed with afew of
distilled water and then dried at inside a clean cabinet. Before and after filtration weight has record. Nitrate, nitrite,
ammonium and reactive phosphate were determined according to Strickland and Parsons, (1972) and
Grasshoff,(1983) [18,19].
Water quality index determination
Initially, WQI was developed by Horton (1965) [20] in United States by selecting 10 most commonly used water
quality variables like dissolved oxygen (DO), pH, coli forms, specific conductance, alkalinity and chloride etc. and
has been widely applied and accepted in European, African and Asian countries. The assigned weight reflected
significance of a parameter for a particular use and has considerable impact on the index. Furthermore, a new WQI
similar to Horton’s index has also been developed by [14], which was based on weights to individual parameter.
Recently, many modifications have been considered for WQI concept through various scientists and experts [21].
The physicochemical water quality characterization was made by calculating an alternative to (NSFWQI) for each
sampling station as well as for the overall water body [22].
Weighted Arithmetic Water Quality Index Method
Weighted arithmetic water quality index method classified the water quality according to the degree of purity by
using the most commonly measured water quality variables. And the calculation of WQI was made by using the
following equation:
𝑊𝑄𝐼 = 𝑄𝑖𝑊𝑖 / 𝑊𝑖
Okbah MA et al Chemistry Research Journal, 2017, 2(4):104-117
Chemistry Research Journal
107
The quality rating scale (Qi) for each parameter is calculated by using this expression:
𝑄𝑖 = (𝑉𝑖 − 𝑉𝑜)/(𝑆𝑖 − 𝑉𝑜) 𝑋100
Where,
Vi: estimated concentration of the parameter in the analyzed water
Vo: the ideal value of parameter in pure water equal zero except pH =7.0 and DO = 14.6 mg/l
Si: recommended standard value of the parameter
The unit weight (Wi) for each water quality parameter is calculated by using the following formula: Wi = K/ Si
Where: K =proportionality constant (=1) and can also be calculated by using the following equation:
𝐾 = 1/( (1 /𝑆𝑖). The rating of water quality according to the WQI is given as the following; Excellent Water
Quality (0-25), Good Water Quality (26-50), Poor Water Quality (51-75), Very Poor Water Quality (76-100) and
Unfit (> 100).
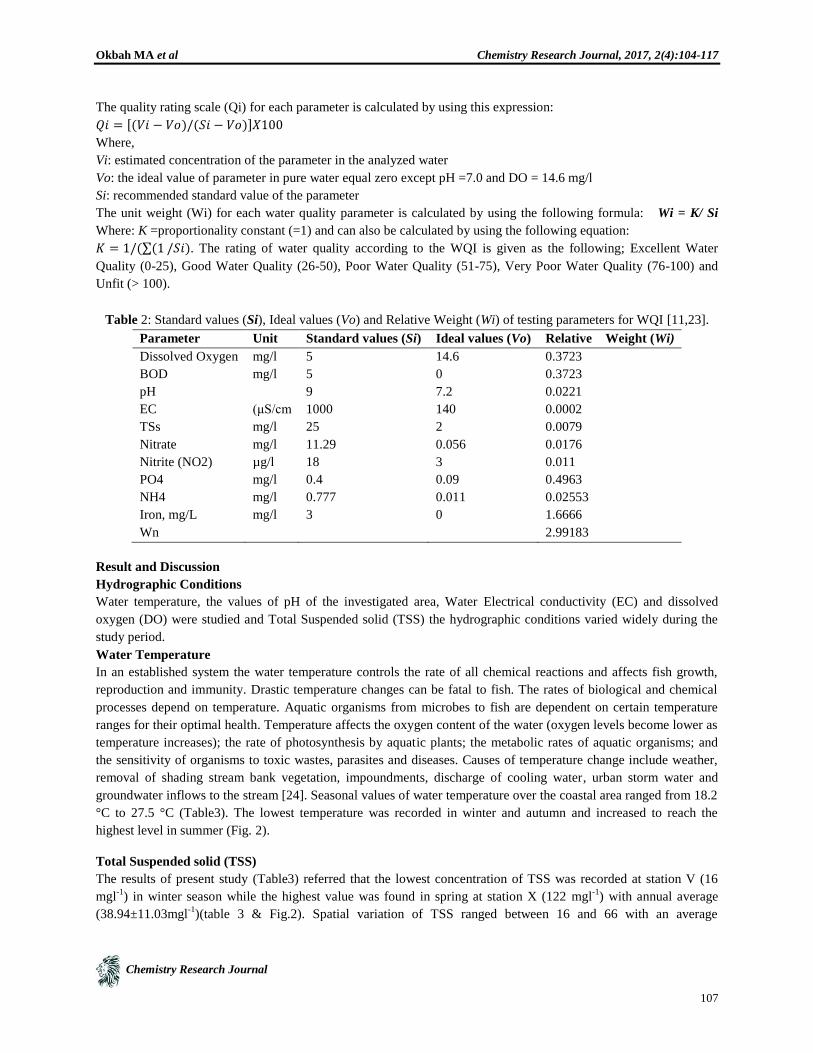
Table 2: Standard values (Si), Ideal values (Vo) and Relative Weight (Wi) of testing parameters for WQI [11,23].
Parameter Unit Standard values (Si) Ideal values (Vo) Relative Weight (Wi)
Dissolved Oxygen mg/l 5 14.6 0.3723
BOD mg/l 5 0 0.3723
pH 9 7.2 0.0221
EC (μS/cm 1000 140 0.0002
TSs mg/l 25 2 0.0079
Nitrate mg/l 11.29 0.056 0.0176
Nitrite (NO2) µg/l 18 3 0.011
PO4 mg/l 0.4 0.09 0.4963
NH4 mg/l 0.777 0.011 0.02553
Iron, mg/L mg/l 3 0 1.6666
Wn 2.99183
Result and Discussion
Hydrographic Conditions
Water temperature, the values of pH of the investigated area, Water Electrical conductivity (EC) and dissolved
oxygen (DO) were studied and Total Suspended solid (TSS) the hydrographic conditions varied widely during the
study period.
Water Temperature
In an established system the water temperature controls the rate of all chemical reactions and affects fish growth,
reproduction and immunity. Drastic temperature changes can be fatal to fish. The rates of biological and chemical
processes depend on temperature. Aquatic organisms from microbes to fish are dependent on certain temperature
ranges for their optimal health. Temperature affects the oxygen content of the water (oxygen levels become lower as
temperature increases); the rate of photosynthesis by aquatic plants; the metabolic rates of aquatic organisms; and
the sensitivity of organisms to toxic wastes, parasites and diseases. Causes of temperature change include weather,
removal of shading stream bank vegetation, impoundments, discharge of cooling water, urban storm water and
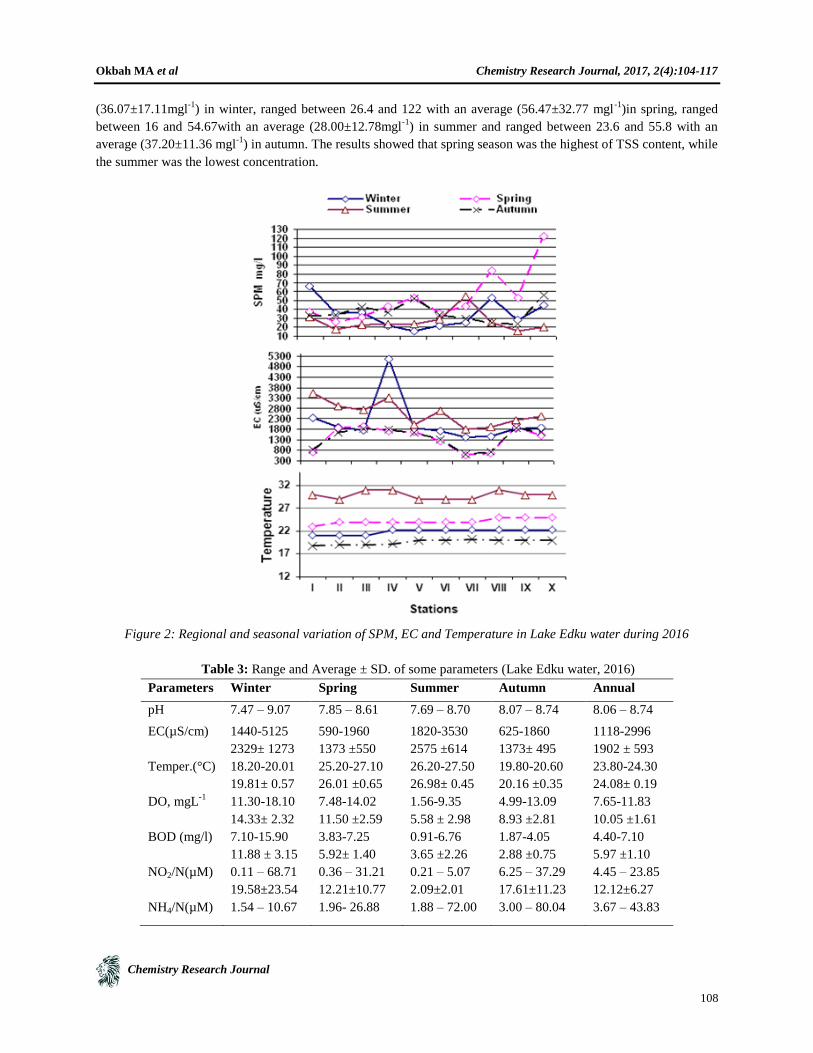
groundwater inflows to the stream [24]. Seasonal values of water temperature over the coastal area ranged from 18.2
°C to 27.5 °C (Table3). The lowest temperature was recorded in winter and autumn and increased to reach the
highest level in summer (Fig. 2).
Total Suspended solid (TSS)
The results of present study (Table3) referred that the lowest concentration of TSS was recorded at station V (16
mgl-1
) in winter season while the highest value was found in spring at station X (122 mgl-1
) with annual average
(38.94±11.03mgl-1
)(table 3 & Fig.2). Spatial variation of TSS ranged between 16 and 66 with an average
Okbah MA et al Chemistry Research Journal, 2017, 2(4):104-117
Chemistry Research Journal
108
(36.07±17.11mgl-1
) in winter, ranged between 26.4 and 122 with an average (56.47±32.77 mgl-1
)in spring, ranged
between 16 and 54.67with an average (28.00±12.78mgl-1
) in summer and ranged between 23.6 and 55.8 with an
average (37.20±11.36 mgl-1
) in autumn. The results showed that spring season was the highest of TSS content, while
the summer was the lowest concentration.
Figure 2: Regional and seasonal variation of SPM, EC and Temperature in Lake Edku water during 2016
Table 3: Range and Average ± SD. of some parameters (Lake Edku water, 2016)
Parameters Winter Spring Summer Autumn Annual
pH 7.47 – 9.07 7.85 – 8.61 7.69 – 8.70 8.07 – 8.74 8.06 – 8.74
EC(µS/cm) 1440-5125
2329± 1273
590-1960
1373 ±550
1820-3530
2575 ±614
625-1860
1373± 495
1118-2996
1902 ± 593
Temper.(°C) 18.20-20.01
19.81± 0.57
25.20-27.10
26.01 ±0.65
26.20-27.50
26.98± 0.45
19.80-20.60
20.16 ±0.35
23.80-24.30
24.08± 0.19
DO, mgL-1
11.30-18.10
14.33± 2.32
7.48-14.02
11.50 ±2.59
1.56-9.35
5.58 ± 2.98
4.99-13.09
8.93 ±2.81
7.65-11.83
10.05 ±1.61
BOD (mg/l) 7.10-15.90
11.88 ± 3.15
3.83-7.25
5.92± 1.40
0.91-6.76
3.65 ±2.26
1.87-4.05
2.88 ±0.75
4.40-7.10
5.97 ±1.10
NO2/N(µM) 0.11 – 68.71
19.58±23.54
0.36 – 31.21
12.21±10.77
0.21 – 5.07
2.09±2.01
6.25 – 37.29
17.61±11.23
4.45 – 23.85
12.12±6.27
NH4/N(µM) 1.54 – 10.67 1.96- 26.88 1.88 – 72.00 3.00 – 80.04 3.67 – 43.83

Okbah MA et al Chemistry Research Journal, 2017, 2(4):104-117
Chemistry Research Journal
109
6.54±3.32 10.12±8.58 23.99±28.41 38.00±32.71 19.50±14.70
NO3/N(µM) 2.90 – 71.33
31.75±22.97
9.10 – 84.05
42.09±29.81
1.33 – 19.95
7.90±7.24
16.76 – 108.38
49.86±33.11
18.02 – 52.84
32.26±12.83
PO4/P(µM) 1.07 – 7.74
4.31±2.53
0.22 – 6.30
3.11±2.06
2.63 – 67.30
22.62±22.41
1.33 – 25.77
17.19±8.99
3.62 – 25.56
11.90±7.63
SiO4/Si(µM) 3.64 – 70.97
29.80±25.84
4.28 – 40.40
12.87± 12.90
3.24 – 22.60
9.04± 6.42
1.36 – 47.88
28.41± 14.91
7.95 – 44.41
20.34± 11.86
SPM (mg/l) 16.00- 66.00
36.07± 17.11
26.40-122.00
56.47± 32.77
16.00-54.67
28.00± 12.78
23.60-55.80
37.20 ±11.36
28.70 – 60.55
38.94± 11.03
Chl-a(µgl-1
) 1.96 – 73.47
39.50 ± 21.08
18.19 – 300.2
137.02± 87.48
29.60 -100.50
57.99±27.55
17.20 – 76.12
35.47 ±22.21
42.04 – 94.26
65.63± 18.92
N/P ratio 3.7 - 58.3
19.80±18.90
5.50 – 65.40
28.10±20.03
0.30 – 4.10
1.80± 1.30
1.80 – 47.30
12.70 ± 15.80
5.40- 25.30
14.30 ± 8.07
Electrical conductivity (EC)
The electrical conductivity is an important factor which reflects the changes caused by the mixing of fresh water,
drainage water and seawater; it is directly related to the concentration of ions in the water [25]. Conductivity showed
significant correlation with parameters such as temperature, pH value alkalinity, total hardness, calcium, total solids,
total dissolved solids and chemical oxygen demand chloride and iron concentration of water. Conductivity in
streams and rivers is affected primarily by the geology of the area through which the water flows. Streams that run
through areas with granite bedrock tend to have lower conductivity because granite is composed of more inert
materials that do not ionize (dissolve into ionic components) when washed into the water [26]. Streams that run
through areas with clay soils tend to have higher conductivity because of the presence of materials that ionize when
washed into the water. Ground water inflows can have the same effects depending on the bedrock they flow through.
Discharges to streams can change the conductivity depending on their make-up. A failing sewage system would
raise the conductivity because of the presence of chloride, phosphate and nitrate; an oil spill would lower the
conductivity. The variation of electrical conductivity was recorded in Figure 2 and Table3.The results of EC
maximum value was recorded at station IV (5125µS/cm) during the winter while minimum value (590µS/cm) was
found at station VII during spring season. Electrical conductivity ranged between 1440 and 5125µS/cm with an
average (2329±1273 µS/cm) during winter, ranged from 590 to 1960 µS/cm with an average (1373±550 µS/cm
during spring, ranged between 1820 and 3530 with an average (2575±614 µS/cm) during summer and ranged
between 625 and 1860 µS/cm with an average (1373±495 µS/cm) during autumn. The highest values of EC were
recorded during summer period ( average 2575 µS/cm) and decreased to 2329 µS/cm in winter, while the lower
values were recorded in autumn and spring seasons (around 1373 µS/cm). The conductivity increased with
increasing in the total dissolved solids and water temperature [27]. The lowest mean value was recorded nearby the
drains in the north eastern parts of the lake. Generally, the EC can be arranged as the following;
summer>winter>spring>autumn.
Hydrogen ion concentration (pH)
The values of pH play an important role in much life processes in aquatic system. It may also reflect the productivity
and pollution levels of the aquatic environments. pH is most important in determining the corrosive nature of water.
Lower the pH value higher is the corrosive nature of water. The reduced rate of photosynthetic activity and the
assimilation of carbon dioxide and bicarbonates are ultimately responsible for increased pH the low oxygen values
coincided with high temperature during the summer month. Various factors bring about changes in the pH of water.
The higher pH values observed suggests that carbon dioxide, carbonate–bicarbonate equilibrium is affected more
due to change in physicochemical condition.
The minimum pH value7.47 was recorded at station (VI) during winter season, while the maximum value 9.07 was
found at station (II) during the same season (Table 3 and Fig. 3). This explains the effects of different effluents in

Okbah MA et al Chemistry Research Journal, 2017, 2(4):104-117
Chemistry Research Journal
110
the surface water of Lake Edku. The spatial distribution of pH values in the lake showed slightly variation within the
stations during the year of study, which may be controlled by the density of phytoplankton count and the water
quality inflow to the lake. Thus, an increase in the phytoplankton population produces an increase in the pH value
and oxygen super saturation due to high photosynthetic activity by green and blue green algae [28], which leads to
reduce the amount of CO2 in water [29].
Figure 3: Regional and seasonal variation of pH values, DO and BOD in Lake Edku water during 2016
Dissolved oxygen (DO)
Dissolve oxygen is an important parameter of aquatic ecosystem and effects on the physical and biological process
of water. The oxygen acts as indicators of planktonic development and plays a significant role in proper growth of
aquatic life like fishes. The level of dissolved oxygen in the northern Lakes of Egypt is influenced by several factors
such as temperature, wind, photosynthetic activity of phytoplankton communities, and respiration of heterotrophic,
autotrophic organisms and decomposition of organic matter [30].The regional values of DO (Table3 &Fig.3)
fluctuated between 1.56mgl-1
(station VII, summer) and 18.1mgl-1
(station II, winter), with an annual average
(10.10±1.61mgl-1
). The seasonal distribution of DO concentration in Lake Edku water showed a wide range of
variation (Fig.3), ranged from 1.56 to 9.35mgl-1
with an average (5.58±2.98 mgl-1
) in summer and ranged between
4.99 and 13.09 with an average (8.91±2.91 mgl-1
) during autumn. During winter season, the DO content of the lake
water was relatively high (11.30±18.10mgl-1
) comparing with the other seasons, this may be due to phytoplankton
Okbah MA et al Chemistry Research Journal, 2017, 2(4):104-117
Chemistry Research Journal
111
productivity, and vice versa the summer that recorded the lowest concentration especially stations (V, VI and VII).
Generally, the increasing of water temperature leads to the decreasing of DO.
Biological oxygen demand (BOD)
BOD is the amount of oxygen required by bacteria while stabilizing decomposable organic matter under aerobic
condition, break down organic material present in a given water sample at certain temperature over a specific time
period. Sources of BOD include leaves and woody debris; dead plants and animals; animal manure; effluents from
pulp and paper mills, wastewater treatment plants, feedlots and food-processing plants; failing septic systems; and
urban storm water runoff. The discharge of wastes with high levels of BOD can cause water quality problems such
as severe dissolved oxygen depletion and fish kills in the receiving water bodies [31]. Chlorine can also affect BOD
measurement by inhibiting or killing the microorganisms that decompose the organic and inorganic matter in a
sample. In chlorinated waters, such as those below the effluent from a sewage treatment plant, it is necessary to
neutralize the chlorine with sodium thiosulphate [32]. The concentration of BOD in Lake Edku water ranged
between minimum 0.91 mgl-1
at station (VI) during the summer and maximum 15.9 mgl-1
during winter at station
(III). The annual variations of biological oxygen demand in Lake Edku water varied between 4.40 and 7.10 mgl-1
with an average of 5.97±1.10 mgl-1
(Table3). The seasonal distribution of BOD fluctuated between 2.88 ± 0.75 and
11.88 ± 3.15 mgl-1
in autumn and winter, respectively.
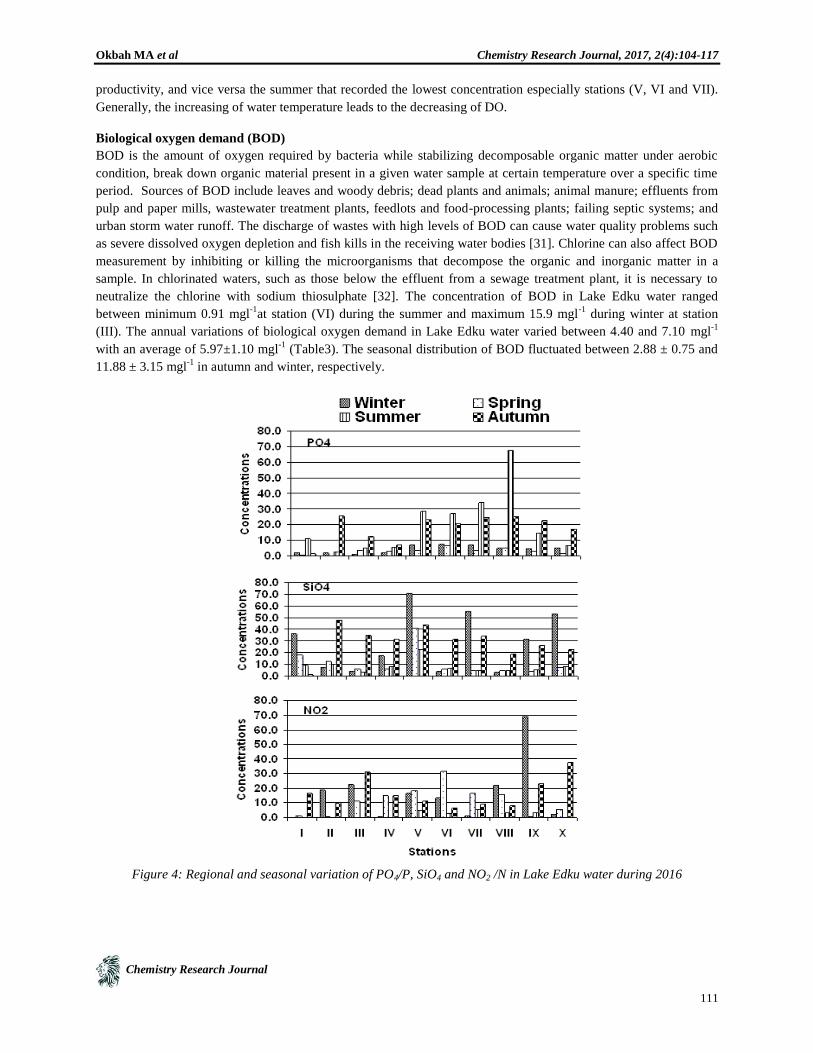
Figure 4: Regional and seasonal variation of PO4/P, SiO4 and NO2 /N in Lake Edku water during 2016

Okbah MA et al Chemistry Research Journal, 2017, 2(4):104-117
Chemistry Research Journal
112
Nutrients Salt
Reactive phosphate (PO4/P)
Fig.4 showed the distribution of PO4/P concentration in Lake Edku water, it ranged between 0.22µM in spring at
station II and 67.3 µM in summer at station VIII, with an annual of average 11.90 ±7.63 µM (Table3). Seasonal
variation of PO4/P were in the range (1.07 - 7.74; mean 4.31 ±2.53 µM) in winter; (0.22 - 6.30; mean 3.11 ± 2.06
µM) in spring; (2.63 - 67.30; mean 22.62± 22.41 µM)in summer and ranged from 1.33 to 25.77 with an average
17.18 ±8.99 µM in autumn. The result of PO4/P concentration can be arranged seasonally as the following: summer
< autumn < winter< spring. The data showed that the highest concentrations were recorded at stations V, VI, VII and
VIII, while stations I and II reveled the lowest levels. Generally, increasing or decreasing of PO4/P concentration
was associated with the biological uptake. The relative decrease of PO4 content maybe attributed to several factors
lead to removal of phosphorus from the water, the consumption of PO4 by algae and aquatic plant, phosphate
adsorption on the clay mineral and suspended matter or precipitation by iron, calcium and aluminum [30].
Reactive silicate (SiO4/Si)
Seasonal and regional distribution of silicate content is shown in Table 3 and Fig. 4 of the investigated area. The
average values of silicate content showed wide variation, it ranged from 9.04 ± 6.42μM in summer to
29.80±25.84μM in winter. Spatial variation of silicate content were in the range (3.64-70.97 μM); (4.28-40.40 μM);
(3.24-22.60 μM); (1.36 - 47.88 μM) in winter, spring, summer and autumn, respectively. The results revealed that
the concentrations of silicate in autumn and winter were the highest than those recorded in spring, and summer.
There is an increase in silicate concentrations due to decrease in the activity of diatoms, and other microorganisms.
Nitrite (NO2/N)
The seasonal distribution of NO2/N concentration in Lake Edku water showed a wide range of variation (Table3 &
Fig.4). It ranged from 0.11 μM in winter (station I) to 68.71μM in autumn (Station IX).The spatial distribution of
NO2/N concentration were in the range (0.11 -68.71); (0.36 to 31.21); (0.21 -5.07) and (6.25 - 37.29) in winter,
spring, summer and autumn, respectively. The data showed decrease in the nitrite content in the summer may be due
to the increase in the oxidation rate of nitrite to nitrate.
Ammonium (NH4/N)
The regional and seasonal variations ofNH4/N during the period of study are reported in Fig.5.NH4/N concentration
was fluctuated between the minimum of 1.54 µM at station (II) in winter and the maximum content of 80.04 µM at
station V in autumn with an average of 19.50± 14.70 µM. The level of NH4/N concentrations during the period of
study can be arranged as the following: autumn > summer > spring >winter. The regional distribution of NH4/N
showed that the highest contents were reported at stations (V, VI, VIII, IX and VII), its content were represented
about 80, 70, 76, 71 µM in autumn and 72 µM in summer, respectively. This may be attributed to the low oxygen
content, which lead to reduction of nitrate to the other form in the reducing form of nitrogen as well as the high rate
of organic matter degradation,
Nitrate (NO3/N)
Nitrate is the final oxidation product of nitrogen compounds in the aquatic system. It is essential for most of
biochemical reactions. There are several factors which may be affected on the distribution of nitrate content in the
study area, the drainage water, organic matter decomposition, regeneration from suspended matter and bottom
sediments as well as phytoplankton assimilation. Generally the investigated area, affected by wastewater from the
neighboring cultivated land. The regional and spatial variations of nitrate concentrations in Edku Lake water are
shown in Figure5 and Table3. The minimum concentration of 1.33 µM was recorded at station IV during the
summer, while the maximum value of 108.38 µM at station III during the autumn. The spatial distribution of NO3/N
during the period of study can be arranged as the following: autumn > spring > winter > summer. The high value of

Okbah MA et al Chemistry Research Journal, 2017, 2(4):104-117
Chemistry Research Journal
113
NO3/N in the autumn may be due to the large amount of drainage water enter the lake, while the low content was
observed in the summer due to its assimilation by phytoplankton and aquatic plants. The regional variation showed
that stations III, IV, V and VI were the highest NO3/N concentration compared with the other stations.
The relatively high concentration of NH4/N, NO2/N and NO3/N may be due to the large amounts of drainage water
from the agricultural areas through the drains, which are contaminated by anthropogenic material.
Figure 5: Regional and seasonal variation of NO3/N, NH4/N and Chl-a in Lake Edku water during 2016
Chlorophyll a (Chl a)
Phytoplankton is important components of lake ecosystems in that they are primary sources of organic carbon;
however, excessive growth resulting from anthropogenic nutrient loads can lead to extreme water fouling [33],
Chlorophyll a (Chl a) is often used as an estimate of algal biomass [35]. Chlorophyll a (Chl a) seasonality was
investigated in lake Edku water located in the northern Nile Delta of Egypt. Chlorophyll a concentration maxima
occurred during the spring (137±87.48 µgl-1
) and summer (57.99±27.55 µgl-1
) when the surface water temperature
was highest. French and Petticrew (2007) [33] found Positive associations between instantaneous [Chl a] and
temperature that forecast changes in phytoplankton productivity even if nutrient loading rates remain constant.
Okbah MA et al Chemistry Research Journal, 2017, 2(4):104-117
Chemistry Research Journal
114
Data Statistical analysis
Water quality index (WQI)
Water quality index (WQI) provides information about water quality in a single value and to reduce higher number
of parameters into a simple expression resulting into easy interpretation of water quality monitoring data. WQI is
commonly used for the evaluation and assessment of water pollution and may be defined as a reflection of
composite influence of different quality parameters on the overall lake water quality. WQI indices are classified into
two types, they are physicochemical and biological indices. The physicochemical indices are based on the values of
various physicochemical parameters in a water sample, while biological indices are derived from the biological
information. In the present work, it has been made to calculate the water quality index of the study area based on
physicochemical data. The ranges of WQI, the corresponding status of water quality and their possible use are
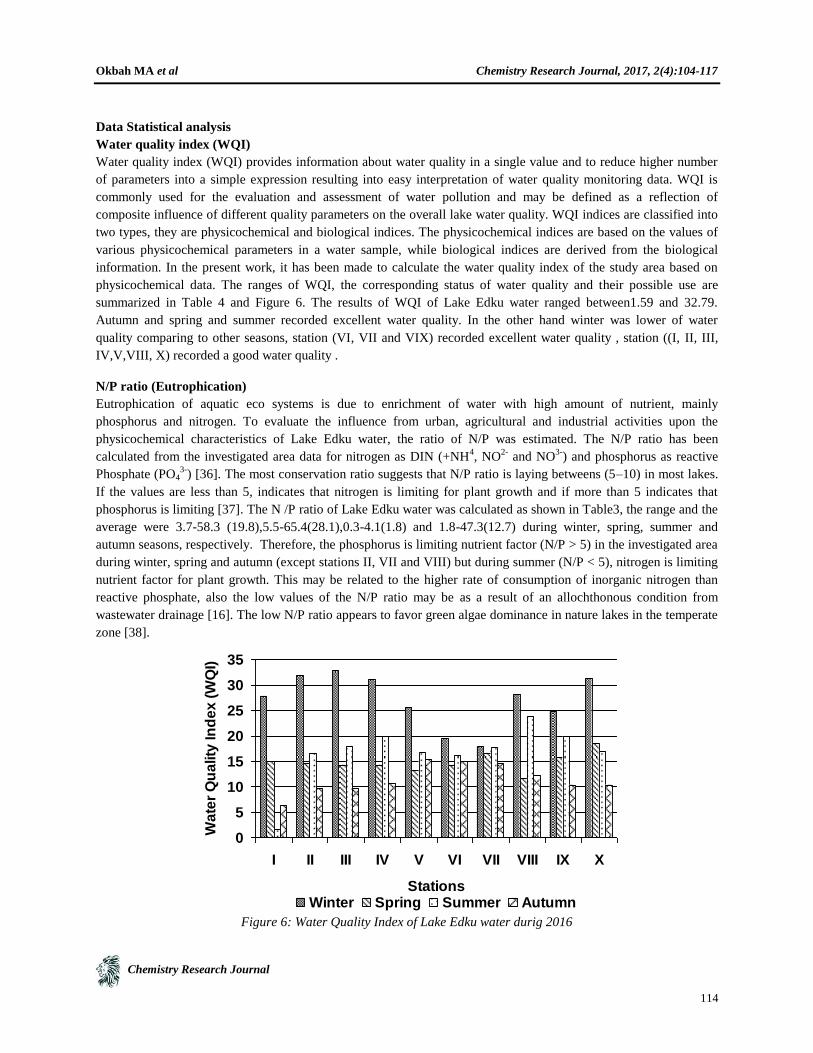
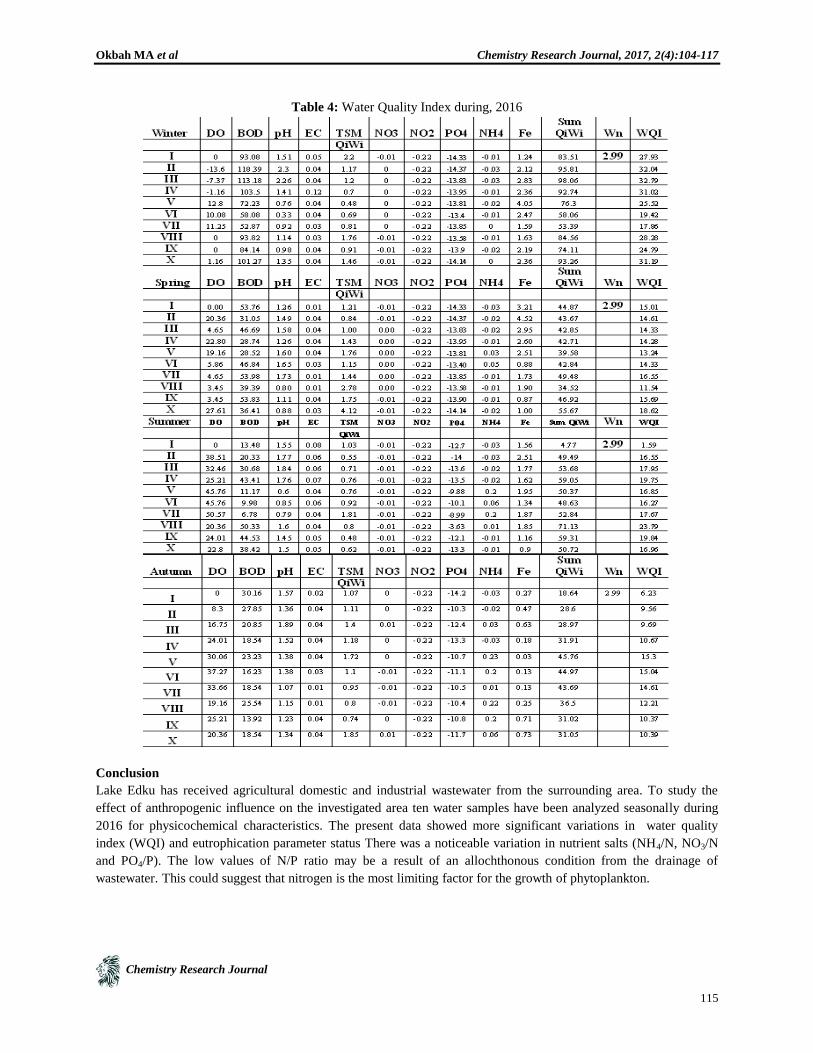
summarized in Table 4 and Figure 6. The results of WQI of Lake Edku water ranged between1.59 and 32.79.
Autumn and spring and summer recorded excellent water quality. In the other hand winter was lower of water
quality comparing to other seasons, station (VI, VII and VIX) recorded excellent water quality , station ((I, II, III,
IV,V,VIII, X) recorded a good water quality .
N/P ratio (Eutrophication)
Eutrophication of aquatic eco systems is due to enrichment of water with high amount of nutrient, mainly
phosphorus and nitrogen. To evaluate the influence from urban, agricultural and industrial activities upon the
physicochemical characteristics of Lake Edku water, the ratio of N/P was estimated. The N/P ratio has been
calculated from the investigated area data for nitrogen as DIN (+NH4, NO
2- and NO
3-) and phosphorus as reactive
Phosphate (PO43-
) [36]. The most conservation ratio suggests that N/P ratio is laying betweens (5–10) in most lakes.
If the values are less than 5, indicates that nitrogen is limiting for plant growth and if more than 5 indicates that
phosphorus is limiting [37]. The N /P ratio of Lake Edku water was calculated as shown in Table3, the range and the
average were 3.7-58.3 (19.8),5.5-65.4(28.1),0.3-4.1(1.8) and 1.8-47.3(12.7) during winter, spring, summer and
autumn seasons, respectively. Therefore, the phosphorus is limiting nutrient factor (N/P > 5) in the investigated area
during winter, spring and autumn (except stations II, VII and VIII) but during summer (N/P < 5), nitrogen is limiting
nutrient factor for plant growth. This may be related to the higher rate of consumption of inorganic nitrogen than
reactive phosphate, also the low values of the N/P ratio may be as a result of an allochthonous condition from
wastewater drainage [16]. The low N/P ratio appears to favor green algae dominance in nature lakes in the temperate
zone [38].
Figure 6: Water Quality Index of Lake Edku water durig 2016
0
5
10
15
20
25
30
35
I II III IV V VI VII VIII IX X
Stations
Wa
ter
Qu
ality
In
de
x (
WQ
I)
Winter Spring Summer Autumn
Okbah MA et al Chemistry Research Journal, 2017, 2(4):104-117
Chemistry Research Journal
115
Table 4: Water Quality Index during, 2016
Conclusion
Lake Edku has received agricultural domestic and industrial wastewater from the surrounding area. To study the
effect of anthropogenic influence on the investigated area ten water samples have been analyzed seasonally during
2016 for physicochemical characteristics. The present data showed more significant variations in water quality
index (WQI) and eutrophication parameter status There was a noticeable variation in nutrient salts (NH4/N, NO3/N
and PO4/P). The low values of N/P ratio may be a result of an allochthonous condition from the drainage of
wastewater. This could suggest that nitrogen is the most limiting factor for the growth of phytoplankton.

Okbah MA et al Chemistry Research Journal, 2017, 2(4):104-117
Chemistry Research Journal
116
References
1. Fu BJ, Zhuang XL, Jiang GB, Shi JB, Lü YH (2007) Environmental problems and challenges in China.
Environ Sci Technol 41: 7597−7602
2. Gao C. and Zhang T. (2010) Eutrophication in a Chinese Context: Understanding Various Physical and
Socio-Economic Aspects. AMBIO, 39:385–393. DOI 10.1007/s13280-010-0040-5
3. An W, Hu J (2006) Effects of endocrine disrupting chemicals on China’s rivers and coastal waters. Front
Ecol Environ 4: 378−386
4. Zhang W, Feng H, Chang J, Qu J, Xie H, Yu L (2009) Heavy metal contamination in surface sediments of
Yangtze River intertidal zone: an assessment from different indexes. Environ Pollut 157: 1533−1543
5. Li T, Shilling F, Thorne J, Li F, Schott H, Boynton R, Berry AM (2010) Fragmentation of China’s
landscape by roads and urban areas. Landscape Ecol 25: 839−853
6. Birk S, Bonne W, Borja A, Brucet S and others (2012) Three hundred ways to assess Europe’s surface
waters: an almost complete overview of biological methods to implement the Water Framework Directive.
Ecol Indic 18: 31−41
7. Morse JC, Bae YJ, Munkhjargal G, Sangpradub N and others (2007) Freshwater biomonitoring with
macroinvertebrates in East Asia. Front Ecol Environ 5: 33−42
8. Bhateria R. and Jain D. (2016) Water quality assessment of lake water: a review. Sustain. Water Resour.
Manag. 2:161–173.
9. Ramakrishnaiah C.R., Sadashivaiah C., Ranganna G. (2009) Assessment of water quality index for the
groundwater in Tumkur Taluk, Karnataka State India., CODEN ECJHAOE-Journal of Chemistry, 6(2), p.
523-530.
10. Ouyang L.L., Pan Y.D., Huang C.M., TANG Y., DU J. and XIAO W. (2016) Water quality assessment of
benthic diatom communities for water quality in the subalpine karstic lakes of Jiuzhaigou, a world heritage
site in China. Journal of Mountain Science 13(9): 1632-1644. DOI: 10.1007/s11629-014-3392-7
11. Trikoilidou1, E.; Samiotis, G.; Tsikritzis L.; Kevrekidis T. and Amanatidou E. (2017) Evaluation of Water
Quality Indices Adequacy in Characterizing the Physico-Chemical Water Quality of Lakes Environ.
Process. DOI 10.1007/s40710-017-0218-y
12. Abdul-Hameed, M.; Jawed, A.; Haider, S. A. and Bahram, K. M. (2010). Application of Water Quality
Index for Assessment of Dokan Lake Ecosystem, Kurdistan Region, Iraq. Journal of Water Resource and
Protection, pp 792-798.
13. Shultz, M. T. (2001). Critique of EPA’s Index of Watershed. Journal of Environmental Management, Vol.
62, No. 4, 2001, pp. 429-442.
14. Brown, R.M., Mclelland,N.I., Deininger,R.A. &Oconn0r,M.F. (1972). A water quality index-crashing the
psychological barrier. In: Advances in Water Pollution Research, Proceedings of the 6th
International
Conference. Pergamon Press, New York, pp. 787–794.
15. Shakweer, L. (2006). Impacts of drainage water discharge on the water chemistry of Lake Edku. Egyptian
Journal of Aquatic Research, Vol. 32 No. 1, 264-282.
16. Okbah M. A. and El-Gohary S. El. (2002) Physical and Chemical Characteristics of Lake Edku Water,
Egypt. Mediterranean Marine Science. Vol. 3/2: 27-39
17. Abdel Halim A. M., Mahmoud M. G.O., Guerguess M. S.and Tadros H. R.Z. (2013). Major constituents in
Lake Edku water, Egypt. The Egyptian Journal of Aquatic Research, 39, 13–20
18. Strickland, J.D.H. and parsons T.R. (1972) A practical handbook of sea water analysis. Bulletin 167 (2nd
edn).Fisheries Research Board of Canada. 167: 33 p.
19. Grasshoff, K. K. (1983). A practical handbook of seawater analysis. Verlag chime, Weinheim. Federal
Republic of Germany.
Okbah MA et al Chemistry Research Journal, 2017, 2(4):104-117
Chemistry Research Journal
117
20. Horton, R.K. (1965). An Index-number System for Rating Water Quality. Journal Water Pollution Control
Federation. 37(3): 300-306.
21. Shweta, T., Bhavtosh, S., Prashant, S. and Rajendra, D. (2013): Water Quality Assessment in Terms of
Water Quality Index. American J .Water Res. 1(3), 34 – 38.
22. Yogendra K, and Puttaiah, E.T. (2008) Determination of water quality index and suitability of an urban
water body in Shimoga town, Karnataka. Preceding of Taal 2007 the 12th
World lake Conference, p 342–
346.
23. Ravikumar, P., Mehmood, M. A. and Somashekar, R. K. (2013). Water quality index to determine the
surface water quality of Sankey tank and Mallathahalli lake, Bangalore urban district, Karnataka, India,
Applied Water Science 03 (1): 247-261.
24. Spellman F.R.and Drinan J.E. (2012) The drinking water handbook, 2nd
edn, ISBN: 978-1-4398-6690-0
25. Environmental Protection Agency Report, EPA (2012) Conductivity in Water Monitoringand
Assessment.http://water.epa.gov/type/rsl/monitoring/vms59.cfm
26. Gupta, P. M. (2010) The seasonal variation in ionic composition of pond water of Lumding, Assam, India.
Doi: 10.12944/ CWE.8.1.12
27. Abdel-Satar, A. M. (2005): On the water quality of Lake Bardawil, Egypt. J. Egypt Acad. Soc. Environ.
Develep., (DEnvironmental studies), b (1): 49-73.
28. El-Sherif Z.M..and Mahmoud Th.H. (1991). The effect of anionicdetergents on the standing cropof
phytoplankton in El-Mex Bay, Egypt.The Bulletin of the High Institute of Public Health.XXI(3):631-8.
29. Masoud, M.S., Mahmoud, ThH., Abdel-Halim, A.M. (2001) Chemical studies of El-Mex Bay, Alexandria.
Proceeding of the Second Conference and Exhibition for Life and Environment, 3-5 April, Alexandria, pp.
339-60.
30. Zaghloul, F. A.; Tadros, A. B.; Okbah, M. A. and Asaad, F.N. (2005) Phytoplankton Standing Crop of El-
max Fish Farm in Relation to the Environmental Conditions, Egyptian Journal of Aquatic Research.Vol.
31, Special Issue, 157-178.
31. Penn, Pauer, Mihelcic (2003). Environmental and ecological chem- istry, vol 2
32. APHA (American Public Health Association) (2005). Standards methods for the examination of water and
wastewater, 21st edn. American Public Health Association, Washington
33. French T. D. & Petticrew E. L. (2007). Chlorophyll a seasonality in four shallow eutrophic lakes (northern
British Columbia, Canada) and the critical roles of internal phosphorus loading and temperature
Hydrobiologia , 575:285–299 DOI 10.1007/s10750-006-0377-8
34. Kotak, B. G., S. L. Kenefick, D. L. Fritz, C. G. Rousseaux, E. E. Prepas & Hrudey, S. E. (1993).
Occurrence and toxicological evaluation of cyanobacterial toxins in Alberta lakes and farm dugouts. Water
Research 27: 495–506.
35. Balali S, Hoseini S., Ghorbani A. & R,Kordi H. (2013). Relationships between Nutrients and Chlorophyll
a Concentration in the International Alma Gol Wetland, Iran. J Aquac Res Development 4: 173 doi:
10.4172/2155-9546.1000173
36. Mcpherson, B. M.; Maryann Sabanskas & Long, W. A. (1982). Physical, Hydrological and Biological
characteristics of Loxanatchee River, Estuary, Florida. U. S. Geological Survey Water Resource
Investigation Open File Report, pp. 82 –50
37. Thomann, R. V. & Multer J. A. (1987). Principle of Water Quality Modeling and Control, Harper Collins
Publishers, New York.
38. Smith, V. H. (1983) Low N to P favors dominance by blue-green algae in Lake Phytoplankton. Sci. Tech.,
225: 669 –671.