chemistry of hydroxycinnamate esters and their role as ... · bruxellensis . two classes of berry...
TRANSCRIPT

Chemistry of Hydroxycinnamate Esters and
their Role as Precursors to Dekkera Produced
Off-flavour in Wine
A thesis presented in fulfilment of the
requirements for the degree of
Doctor of Philosophy
Josh L. Hixson
BTech (Forens&AnalytChem), BSc (Hons)
School of Agriculture, Food and Wine
March 2012

i
Table of Contents
Abstract ................................................................................................................................ iv
Declaration ......................................................................................................................... vii
Acknowledgements ........................................................................................................... viii
Publications and Symposia ................................................................................................ xi
Abbreviations .................................................................................................................... xiii
Figures, Schemes and Tables ........................................................................................... xvi
Chapter 1: Introduction ...................................................................................................... 1
1.1 General Introduction ........................................................................................................ 1
1.2 Dekkera/Brettanomyces bruxellensis ............................................................................... 1
1.3 Volatile Phenols ............................................................................................................... 5
1.3 Introduction to Tartrate Esters ....................................................................................... 11
1.4 Introduction to Glucose Esters ....................................................................................... 16
1.5 Introduction to Ethyl Esters ........................................................................................... 18
1.5 Research Aims ............................................................................................................... 20
Chapter 2: Synthesis of Hydroxycinnamoyl Esters ........................................................ 22
2.1 Synthesis of Hydroxycinnamic Acids and Derivatives ................................................. 22
2.2 Synthesis of Hydroxycinnamoyl Tartrate Esters ........................................................... 24
2.2.1 Introduction to Tartrate Ester Synthesis ............................................................. 24
2.2.2 Synthesis of Hydroxycinnamoyl Tartrate Esters ................................................ 26
2.3 Synthesis of Hydroxycinnamoyl Glucose Esters ........................................................... 34
2.3.1 Introduction to Glucose Ester Synthesis ............................................................. 34
2.3.2 Synthesis of Hydroxycinnamoyl Glucose Esters ................................................ 37
2.4 Conclusions .................................................................................................................... 47

ii
Chapter 3: Acyl Migration of Hydroxycinnamoyl Glucose Esters ............................... 50
3.1 Introduction. ................................................................................................................... 50
3.2 Research Aims ............................................................................................................... 54
3.3 Theoretical Studies into Acyl Migration of Hydroxycinnamoyl Glucoses ................... 55
3.3.1 Thermodynamics of Migration ........................................................................... 55
3.3.2 Kinetics of Migration .......................................................................................... 60
3.4 Liquid Chromatography of Wine. .................................................................................. 67
3.5 Conclusions. ................................................................................................................... 76
Chapter 4: Photoisomerisation of Hydroxycinnamic Acids .......................................... 79
4.1 Introduction. ................................................................................................................... 79
4.1.1 Hydroxycinnamate Photoisomerisation .............................................................. 79
4.1.2 cis-Hydroxycinnamate content in grapes and wine ............................................ 81
4.1.3 Enzymatic Specificity ......................................................................................... 83
4.2 Research Aims ............................................................................................................... 86
4.3 Synthesis of cis-Hydroxycinnamic Acids. ..................................................................... 87
4.4 Theoretical Studies into the Isomerisation of Hydroxycinnamic Acids ........................ 91
4.5 Conclusions .................................................................................................................. 105
Chapter 5: Bioconversion of Hydroxycinnamates by D. bruxellensis ......................... 107
5.1 Bioconversion of trans-Hydroxycinnamate Esters ...................................................... 107
5.1.1 Ethyl Esters ....................................................................................................... 107
5.1.2 Ethyl Esterase Substrate Selectivity ................................................................. 110
5.1.3 Tartrate Esters ................................................................................................... 111
5.1.4 Glucose Esters ................................................................................................... 113
5.1.5 Conclusions for Chapter 5.1 ............................................................................. 114
5.2 Stereoselectivity of D. bruxellensis Enzyme Activities ............................................... 115
5.2.1 Decarboxylase Stereoselectivity ....................................................................... 115

iii
5.2.2 Ethyl Esterase Stereoselectivity ........................................................................ 121
5.2.3 Conclusions for Chapter 5.2 ............................................................................. 125
5.3 Thesis Conclusions and Future Directions .................................................................. 126
Chapter 6: Experimental ................................................................................................. 130
6.1 General Experimental .................................................................................................. 130
6.2 Experimental Procedures for Chapter 2 ....................................................................... 133
6.2.1 Hydroxycinnamoyl Derivatives ........................................................................ 133
6.2.2 Synthesis of Hydroxycinnamoyl Tartrate Esters .............................................. 142
6.2.3 Synthesis of Hydroxycinnamoyl Glucose Esters .............................................. 157
6.3 Experimental Procedures for Chapter 3 ....................................................................... 172
6.4 Experimental Procedures for Chapter 4 ....................................................................... 175
6.5 Experimental Procedures for Chapter 5 ....................................................................... 180
6.5.1 General Procedures for Chapter 5 ..................................................................... 180
6.5.2 Fermentation of trans-Hydroxycinnamate Esters ............................................. 184
6.5.3 Stereoselectivity of D. bruxellensis Enzyme Activities .................................... 184
Appendix 1: Data for Migration Thermodynamics ...................................................... 186
Appendix 2: Data for Migration Kinetics ...................................................................... 188
Appendix 3: Data for Energy Profiles ............................................................................ 190
Appendix 4: Data for Vertical Excitations and HOMO-LUMO Gaps ....................... 192
Appendix 5: Data from Ethylphenol Analyses .............................................................. 196
References ......................................................................................................................... 198

iv
Abstract
The potential for malodour in wine caused by the accumulation of ethylphenols has been
widely studied with respect to the breakdown of the hydroxycinnamic acids, p-coumaric
and ferulic acid, by D. bruxellensis. The presence of esterified hydroxycinnamate
conjugates in grapes and wine is well established and they account for a large proportion of
the hydroxycinnamate content. There exists the possibility that these conjugates could also
provide the potential for spoilage, though they have never been linked to the direct
formation of ethylphenols. The research highlighted within this thesis examines the
potential role of a number of esterified conjugates in the production of ethylphenols by D.
bruxellensis. Two classes of berry derived esters, the tartaric acid and glucose bound
hydroxycinnamates, as well as the vinification formed ethyl esters, were synthesised and
used for model fermentation experiments.
Chapter 2 describes the preparation of a number of protected hydroxycinnamic acid
derivatives that were used in the synthesis of the hydroxycinnamoyl tartrate esters (7 and
8) for the first time. Coupling 1-O-chloroacetyl protected p-coumaric and ferulic acids (21
and 22) with di-tert-butyl-L-tartrate (34) followed by selective hydrolysis of the tert-butyl
esters yielded p-coumaroyl tartrate (7) and feruloyl tartrate (8). Hydroxycinnamoyl glucose
esters (9 and 10) were prepared using the same hydroxycinnamates (21 and 22), esterifying
with a prepared trichloroacetimidate glucosyl donor sequence, though purification of the
glucose esters resulted in undesired chemical transformations. It was found that
photoisomerisation of the glucose esters could be prevented via synthesis under red light,
which gave trans-9 and 10, however migration of the hydroxycinnamoyl moiety around
the glucose ring, which yielded mainly the 2-O-α- and 6-O-α-esters, was a product of
submitting the esters to non-aqueous solvents and could not be avoided.
The acyl migration of the glucose esters that was observed in Chapter 2 has been
researched at a DFT B3LYP 6-31G* theoretical level in Chapter 3 with respect to both the
thermodynamics and kinetics of the transformations. The desired 1-O-β-esters were
thermodynamically favoured only in water, while in any other solvent studied the 2-O-α-
and 6-O-α-esters would prevail. Kinetically, migration to the 3-O-position involved lower
energy barriers which can be equated to a more rapid process, although the ring-flipped

v
conformation needed to achieve the migration would promote subsequent migration to the
6-O-position. Step-wise migration, from the 1-O- to the 2-O-position, was found to be
thermodynamically less favoured than other migrations investigated. This effect can be
rationalised by the formation of a 5-membered cyclic intermediate in comparison to the 6-
membered intermediate produced during 1-O- to 3-O-migration. However, the energy
barriers involved in 1-O-β- to 2-O-β-migration better explain the comparative extent of
migration observed between the p-coumaroyl and feruloyl glucose esters. The possibility
of multiple glucose esters existing in wine was the focus of a brief study, finding two
separate p-coumaroyl glucose esters in red and white wine, while a lesser extent of
migration in feruloyl glucose limited observation to concentrated wine alone. However,
due to co-elution of feruloyl glucose (10) with suspected p-coumaroyl anthocyanin
derivatives in red wine, HPLC-MRM was required to detect it, which is the first report of
this compound in red wine.
Theoretical studies into observed photoisomerisations and the synthesis of cis-
hydroxycinnamates are described in Chapter 4. The cis-ethyl hydroxycinnamates were
isolated and hydrolysed to give a mixture of cis/trans-hydroxycinnamic acids (3 and 4),
which could be separated by flash chromatography, though the pure cis-isomers isomerised
rapidly under ambient conditions and slowly under red light back to the trans-isomers.
Stable isomeric mixtures were achieved by irradiation with ultra-violet light giving
mixtures of 40-50% of the cis-isomer which could be used further in fermentation studies.
Computational evidence suggested that isomerisation of the hydroxycinnamic acids was
favoured with greater resonance throughout the molecule. Those with deprotonated
phenolic moieties possessed the most intramolecular electron movement, decreasing the
HOMO-LUMO gap and promoting photoisomerisation. Smaller solvent and substrate
effects were also noted, though the nature of the phenol and carboxyl clearly played the
most important role in determining stability of each isomer.
Fermentation in the presence of the synthesised trans-hydroxycinnamoyl esters (7-12) and
investigation into the stereospecificity of D. bruxellensis enzyme activities was performed
as detailed in Chapter 5. In Australia, three genetic groups of D. bruxellensis account for
98% of isolates, with the largest of these groups making up 85%. AWRI 1499 is a
representative of the largest genetic group, with AWRI 1608 and AWRI 1613 belonging to
the two remaining significant genetic groups. In the presence of AWRI 1499, the trans-

vi
ethyl esters (11 and 12) were metabolised to varying extents with the preference for
breakdown of ethyl coumarate (11) over ethyl ferulate (12). This selectivity was
investigated further and found to be common for both AWRI 1499 and AWRI 1608, while
AWRI 1613 was unable to breakdown either ester. The preference for formation of 4-
ethylphenol (1) over 4-ethylguaiacol (2) from the ethyl esters could accentuate the ratio of
these compounds as seen in wine, initially thought to be brought about by the relative
concentration of the precursor acids.
Of the berry derived esters, the tartrate esters (7 and 8) were not metabolised by AWRI
1499, and subsequent fermentations with AWRI 1608 and 1613 yielded the same result.
This confirmed that the tartrate esters cannot contribute directly to the formation of
ethylphenols during exposure to D. bruxellensis. The glucose esters were metabolised by
AWRI 1499 to a moderate extent (35% conversion), providing information that these can
contribute to the accumulation of ethylphenols during barrel ageing. Furthermore, the
isomerisation of the glucose esters lead to studies into the stereoselectivity of D.
bruxellensis enzyme activities, whereby the decarboxylase as well as the ethyl esterase
showed selectivity for the trans-isomers and that the cis-hydroxycinnamate content of
grapes and wine are not important in the accumulation of ethylphenols. The experimental
procedures employed throughout Chapters 2-5 are outlined in Chapter 6.

vii
Declaration
This work contains no material which has been accepted for the award of any other degree
or diploma in any university or other tertiary institution and, to the best of my knowledge
and belief, contains no material previously published or written by another person, except
where due reference has been made in the text.
I give consent to this copy of my thesis, when deposited in the University Library, being
available for loan and photocopying, subject to the provisions of the Copyright Act 1968.
I also give permission for the digital version of my thesis to be made available on the web,
via the University’s digital research repository, the Library catalogue, the Australian
Digital Thesis Program (ADTP) and also through web search engines, unless permission
has been granted by the University to restrict access for a period of time.
…………………………………..
Josh L. Hixson
…………………………………..

viii
Acknowledgements
In no particular order, other than chronologically, I would like to thank my supervisors for
their commitment to my learning. Dr. Gordon Elsey…… Gordy, you have been an
absolute inspiration since I met you in 2006 and you are the reason I started this particular
journey. You have pushed me to know more and work harder and have been a constant
source for knowledge outside of the field of chemistry as well as within it. It saddens me
that we didn’t get to finish this journey together, and it saddens me even more that it was
easier for me to dismiss you and carry on without you, rather than help you through some
tough times and for that I am sorry. I will always consider you a friend, regardless of the
past, and I truly believe that you have contributed as much by leaving me to research and
become independent as you have to actively increasing my knowledge.
Dr. Chris Curtin for taking me on during my Ph.D. after seeing my complete lack of
microbiology skills during my honours year and still wanting to get the best out of me and
instill into me as much microbiology knowledge as possible. Also for being a fantastic
outlet when synthetic chemistry became too much and we could discuss fermentation
experiments or I could listen to you get excited about potential enzyme activities that could
be expressed.
When the notion of leaving Flinders University in 2008 arose, the choice to relocate to The
University of Adelaide was made so much easier by being ‘adopted’ by Prof. Dennis
Taylor. Den, thank you for the opportunity of working under you. You have given me such
an insight into the workings of a university always open to discuss which grants you were
applying for and what the outcomes were, when you really didn’t have to. From finding me
a scholarship at very short notice, to offering me roles in the lab to keep my mind off of
what was making me unhappy. You have shown me that there is nothing wrong with
breaking the mold, because it’s not held together that well to start off with.
The final member of the supervision team, who picked up the slack when it was needed,
Dr. Mark Sefton. It has been a pleasure to work with such a fantastic and knowledgeable
flavour and aroma chemist and I sometimes forget how lucky I am. I have honestly been
approached with ‘you work with Dr Sefton? He is a legend, I have read so many of his
ix
papers’ and that was on the other side of the world. Thank you for giving me advice when I
felt like there was nobody else who wanted to give me any.
The members of the original Elsey/AWRI group who moved to Adelaide with me, Natoiya
and Jo, and those who I found when I arrived, Pete and Nicole. You have been good
friends, and have learnt when to leave me alone and when to make me laugh. I have
probably spent as much time complaining to you about all sorts of things than I have
talking to you about science, but by letting me vent, you have definitely helped me get
through.
People that haven’t been on the whole journey, but those that have helped along the way,
Dr. Simon Mathew for advice about theoretical calculations, Dr. Eric Dennis for advice on
anything I needed or just a random message to keep the spirits up, Dr. Dave Jeffery for
being the only person to come and visit me in my red lab in the basement and discuss
deprotection strategies. Ms. Dimi Capone for running ethylphenol analyses and keeping
the instruments running so very well and Dr. Edward Tiekink at the University of Malaysia
for performing X-ray crystallography.
To my family, especially my parents, thank you for understanding why I am doing this and
not out getting a job, and also for pushing me into university when I would have been just
as happy lying on the couch…at the time that is. I am sorry it took me until I started
honours to actually apply myself to do anything, I am hoping you have largely forgotten
my first 21 years of complete laziness and contentment with achieving the minimum
amount to survive.
The biggest thanks of all has to go to my wife and best friend Suey. When you met me I
was a lay about undergraduate student who was about to dropout of uni and find something
more exciting to do, but you have stuck with me, and supported me throughout my
extended university stay, financially, emotionally and physically. Thank you for being
there when I have needed you, and for knowing when I have needed support, even if I was
too tired or grumpy or hungry to figure it out. Thank you for putting up with long days,
long nights, long sleeps and long ramblings about my project, without you I wouldn’t have
made it through this. Also for giving me the ultimate inspiration to get this done and start

x
my working life, I can’t wait to meet Googy and finally take my place as the provider for
my new family.

xi
Publications and Symposia
Publications:
Hixson, J. L.; Sleep, N. R.; Capone, D. L.; Elsey, G. M.; Curtin, C. D.; Sefton, M. A.;
Taylor, D.K. Hydroxycinnamic acid ethyl esters as precursors to ethylphenols in wine. J.
Agric. Food Chem. Accepted 12/02/2012.
Hixson, J. L.; Curtin, C. D.; Sefton, M. A.; Taylor, D. K. Stereospecificity of D.
bruxellensis in the production of ethylphenol off-flavour in wine. Proceedings of the 13th
Weurman Flavour Research Symposium. In press.
Hixson, J. L.; Taylor, D. K.; Ng, S. W.; Tiekink, E. R. T. Di-tert-butyl (2R,3R)-2-({(2E)-3-
[4-(acetyloxy)-3-methoxyphenyl]prop-2-enoyl}oxy)-3-hydroxybutanedioate. Acta
Crystallographica, Section E 2012, 68 (3), o509-o510.
Hixson, J. L.; Taylor, D. K.; Ng, S. W.; Tiekink, E. R. T. Di-tert-butyl (2R,3R)-2-({(2E)-3-
[4-(acetyloxy)phenyl]prop-2-enoyloxy)-3-hydroxybutanedioate. Acta Crystallographica,
Section E 2012, 68 (2), o568-o569.
Hixson, J. L.; Elsey, G. M.; Curtin, C. D.; Sefton, M. A.; Taylor, D.K. Hydroxycinnamoyl
glucose and tartrate esters and their role in the formation of ethylphenols in wine. J. Agric.
Food Chem. In draft.
Symposia:
Hixson, J. L.; Curtin, C. D.; Taylor, D. K.; Elsey, G. M. Mapping the Metabolic Inputs of
‘Brett’ Taint. Poster presented at the 2009 YPD conference (Meeting of the Australasian
Yeast Group).
Hixson, J. L.; Curtin, C. D.; Taylor, D. K. Stereospecificity of the Decarboxylase Enzyme
of D. bruxellensis. Poster presented at the 14th Wine Industry Technical Conference, 2010.

xii
Hixson, J. L.; Elsey, G. M.; Curtin, C. D.; Taylor, D. K. Isomerisation of the
Hydroxycinnamic Acids and their Role in the Production of Wine Off-aroma. Seminar
presented at the 2010 Adelaide Synthetic Chemistry Symposium.
Hixson, J. L.; Curtin, C. D.; Sefton, M. A.; Taylor, D. K. Determination of Alternative
Precursors to Brettanomyces/Dekkera Produced Off-flavour. Seminar presented at the 13th
Weurman Flavour Research Symposium, 2011.
xiii
Abbreviations
4-EG 4-Ethylguaiacol
4-EP 4-Ethylphenol
Å Angstroms
Ac Acetyl
AcCl Chloroacetyl
AcCN Acetonitrile
app. d Apparent doublet
Ar Aromatic
AWRI Australian Wine Research Institute
Bn Benzyl
br Broad
COSY Correlation spectroscopy
d Doublet
DAD Diode array detector
DCM Dichloromethane
dd Doublet of doublets
ddd Doublet of doublet of doublets
DFT Density functional theory
EIC Extracted ion chromatogram
ESI Electrospray ionization
Et Ethyl
Et2O Diethyl ether
EtOAc Ethyl acetate
g Grams
GC Gas chromatography
Glc Glucose
HCA Hydroxycinnamic acid
HMBC Heteronuclear multiple bond correlation
HMQC Heteronuclear multiple quantum coherence
HOMO Highest occupied molecular orbital
HPLC High-performance liquid chromatography
HRMS High resolution mass spectroscopy

xiv
Hz Hertz
hν Light
J Coupling constant
kJ Kilojoules
L Litre
LC Liquid chromatography
Lit. Literature
LUMO Lowest unoccupied molecular orbital
m Multiplet
M Molar (moles/litre)
m/z Mass to charge ratio
mg Milligrams
MgSO4 Magnesium sulphate
MHz Megahertz
ML Megalitre
mL Millilitre
MMFF Merck Molecular Force Field
mmol Millimoles
mol Moles
m.p. Melting point
MRM Multiple reaction monitoring
MS Mass spectrometry
MYPG Malt, yeast extract, peptone, glucose
nm Nanometres
NMR Nuclear magnetic resonance
p Para
Ph Phenyl
ppb Parts per billion
ppm Parts per million
q Quartet
Rf Retension factor
rpm Revolutions per minute
s Singlet
S0 Singlet ground state

xv
S1 Singlet first excited state
t Triplet
T1 Triplet first excited state
tert Tertiary
THF Tetrahydrofuran
TIC Total ion chromatogram
TLC Thin layer chromatography
TMS Tetramethyl silane
UV Ultra-violet
Vis Visible
VNBC Viable but non-culturable
X4 Hexane fraction
YNB Yeast extract, nitrogen, base
YPD Yeast extract, peptone, dextrose
δ Chemical shift
µ Micro

xvi
Figures, Schemes and Tables
List of Figures:
Figure 1.1: Ethylphenols produced by D. bruxellensis in red wine. ...................................... 5
Figure 1.2: Enzymatic conversion of hydroxycinnamic acids to volatile phenols. ............... 6
Figure 1.3: L-Tartaric acid esters of p-coumaric acid (7) and ferulic acid (8). ................... 11
Figure 1.4: 1-O-β-D-Glucose esters of p-coumaric acid (9) and ferulic acid (10). ............. 16
Figure 1.5: Ethyl hydroxycinnamates. ................................................................................. 18
Figure 1.6: Evolution of ethyl coumarate in Shiraz wine. ................................................... 19
Figure 1.7: Hydroxycinnamoyl tartrate (7 and 8), glucose (9 and 10) and ethyl esters (11
and 12) to be synthesised and used in these studies. ........................................................... 20
Figure 2.1: Molecular structure and crystallographic numbering scheme for 35. ............... 31
Figure 2.2: Molecular structure and crystallographic numbering scheme for 36. ............... 32
Figure 2.3: 1H proton NMR spectrum of the chloroacetyl protons in 2,3,4,6-O-
tetrachloroacetyl-β-D-glucopyranosyl cinnamate (48). ....................................................... 40
Figure 2.4: NMR spectrum of isomerised glucose esters. a) cis/trans-Feruloyl glucose (10).
b) cis/trans-Cinnamoyl glucose (53). .................................................................................. 42
Figure 2.5: Hydroxycinnamate esters to be used in fermentation experiments. .................. 48
Figure 2.6: Dominant equilibria in hydroxycinnamoyl glucose ester mixtures to be used in
fermentation experiments. ................................................................................................... 48
Figure 3.1: Acyl migration in p-coumaroyl glucose. ........................................................... 50
Figure 3.2: Initial silica catalysed 3-S- to 6-O-migration observed by Whistler et al. ........ 51
Figure 3.3: Migration intermediates. a) Base-catalysed 1-O-β- to 2-O-β-migration
intermediate proposed by Iddon et al. b) Acid-catalysed 4-O-α- to 6-O-α-migration
intermediate proposed by Horrobin et al. ............................................................................ 51
Figure 3.4: Proposed migration of mono-O-chloroacetyl derivatives to the 6-O-position. . 53
Figure 3.5: Twenty possible esters of p-coumaroyl glucose (9) and feruloyl glucose (10). 55
Figure 3.6: Energy of p-coumaroyl and feruloyl glucose esters in water, relative to the 1-O-
β-esters.. ............................................................................................................................... 56
Figure 3.7: Energy of p-coumaroyl and feruloyl glucose esters in dichloromethane, relative
to the 1-O-β-esters.. ............................................................................................................. 57
Figure 3.8: Energy of p-coumaroyl and feruloyl glucose esters in ethanol, relative to the 1-
O-β-esters.. ........................................................................................................................... 58

xvii
Figure 3.9: Energy of p-coumaroyl and feruloyl glucose esters in toluene, relative to the 1-
O-β-esters.. ........................................................................................................................... 58
Figure 3.10: p-Coumaroyl glucose (9) ester energies calculated in changing solvents,
relative to the 1-O-α-esters.. ................................................................................................ 59
Figure 3.11: Key intermediates (Int. 1-4) for the acid-catalysed 1-O-β- to 2-O-β- acyl
migration of p-coumaroyl glucose (9). ................................................................................ 62
Figure 3.12: Energy of the intermediates in 1-O-β- to 2-O-β-p-coumaroyl glucose
migration, relative to intermediate 1.. .................................................................................. 63
Figure 3.13: Energy of the intermediates in 1-O-β- to 2-O-β-feruloyl glucose migration,
relative to intermediate 1.. ................................................................................................... 63
Figure 3.14: Energy of the intermediates in 1-O-β- to 6-O-β-p-coumaroyl glucose
migration, relative to intermediate 1.. .................................................................................. 65
Figure 3.15: Energy of the intermediates in 1-O-β- to 6-O-β-feruloyl glucose migration,
relative to intermediate 1.. ................................................................................................... 65
Figure 3.16: Energy of the intermediates in 1-O-β- to 3-O-β-p-coumaroyl glucose
migration, relative to intermediate 1.. .................................................................................. 66
Figure 3.17: Energy of the intermediates in 1-O-β- to 3-O-β-feruloyl glucose migration,
relative to intermediate 1.. ................................................................................................... 66
Figure 3.18: Glucose ring-flip to facilitate 1-O- to 3-O-migration and 1-O- to 6-O-
migration. ............................................................................................................................. 67
Figure 3.19: p-Coumaroyl glucose. a) Extracted ion chromatogram of m/z 325. b) Mass
spectrum at 29.6 to 29.8 minutes. ........................................................................................ 69
Figure 3.20: Feruloyl glucose. a) Extracted ion chromatogram of m/z 355. b) Mass
spectrum at 36.5 to 36.6 minutes. ........................................................................................ 69
Figure 3.21: Concentrated white wine, extracted ion chromatogram of m/z 325. ............... 70
Figure 3.22: Mass spectra of compounds identified in extracted ion chromatogram of m/z
325. ...................................................................................................................................... 71
Figure 3.23: Concentrated white wine, extracted ion chromatogram of m/z 355. ............... 72
Figure 3.24: Mass spectra of compounds identified in extracted ion chromatogram of m/z
355. ...................................................................................................................................... 72
Figure 3.25: Red wine chromatogram (DAD). .................................................................... 73
Figure 3.26: Concentrated red wine, extracted ion chromatogram of m/z 325. ................... 73
Figure 3.27: Concentrated red wine, extracted ion chromatogram of m/z 355. ................... 74

xviii
Figure 3.28: HPLC-MRM traces (aglycone - blue, aglycone minus water - red) of
hydroxycinnamoyl glucose esters. a) Pure glucose esters. b) Neat white wine. c)
Concentrated white wine. d) Concentrated red wine. .......................................................... 75
Figure 4.1: Photoisomerisation of the hydroxycinnamoyl glucose esters. .......................... 79
Figure 4.2: Electron configuration of π bonding and anti-bonding molecular orbitals in
ground and excited states. .................................................................................................... 80
Figure 4.3: Compounds investigated in decarboxylation studies. ....................................... 85
Figure 4.4: Proposed resonance assisted conversion of cis-p-coumaric acid to trans-p-
coumaric acid. ...................................................................................................................... 88
Figure 4.5: Intended effect of metal coordination on cis-hydroxycinnamates. ................... 91
Figure 4.6: Frontier molecular orbital diagrams of trans-p-coumaric acid (3). a) HOMO of
S0 trans-p-coumaric acid. b) LUMO of S0 trans-p-coumaric acid. c) HOMO of T1 trans-p-
coumaric acid. ...................................................................................................................... 92
Figure 4.7: Electron spin density in T1 trans-p-coumaric acid. ........................................... 93
Figure 4.8: Energy profile of p-coumaric acid (3).. ............................................................. 94
Figure 4.9: Energy profile produced from forward and reverse dynamic, and manual
constraint of ethyl coumarate (11).. ..................................................................................... 95
Figure 4.10: Pyramidilised alkene resulting from rotation of the dihedral angle from 180o
to 0o in ethyl coumarate (11). ............................................................................................... 95
Figure 4.11: cis-Ethyl coumarate conformers produced by: a) drawing trans-ethyl
coumarate and rotating the dihedral; and b) drawing cis-ethyl coumarate. ......................... 96
Figure 4.12: Energy profile for p-coumaroyl glucose (9), relative to S0 trans-isomer.. ...... 96
Figure 4.13: a) T1 energy profile for p-coumaric acid (3) in water, relative to the S0 trans-
acid. b) T1 energy profile for p-coumaroyl glucose (9) water, relative to the S0 trans-
isomer. .................................................................................................................................. 97
Figure 4.14: S0-T1 vertical excitation energy for trans-p-coumaric acid (3) and trans-p-
coumaroyl glucose (9). . ...................................................................................................... 98
Figure 4.15: HOMO-LUMO gap for trans-p-coumaric acid and trans-p-coumaroyl
glucose.. ............................................................................................................................... 99
Figure 4.16: a) Vertical excitation energies (S0-T1) of trans-p-coumaroyl glucose phenolate
in solvents of differing polarity. b) HOMO-LUMO gap.. ................................................... 99
Figure 4.17: a) HOMO-LUMO gap of trans-hydroxycinnamates. b) HOMO-LUMO gap of
cis-hydroxycinnamates. ..................................................................................................... 101

xix
Figure 4.18: HOMO-LUMO gaps of cis-hydroxycinnamates during base-catalysed ester
hydrolysis. . ........................................................................................................................ 102
Figure 4.19: Numbering of oxygen atoms in hydroxycinnamate skeleton. ....................... 103
Figure 4.20: HOMO-LUMO gap of p-coumaric acid carboxylate.. .................................. 103
Figure 4.21: HOMO-LUMO gaps of hydroxycinnamate derivatives against ratio of charge
between oxygen 1 and oxygen 3.. ...................................................................................... 104
Figure 4.22: Relationship between HOMO-LUMO gap and double bond length in
hydroxycinnamate derivatives.. ......................................................................................... 105
Figure 5.1: Ethyl coumarate (11) and ethyl ferulate (12). ................................................. 107
Figure 5.2: Percentage of the theoretical maximum conversion of ethyl esters (11 and 12)
to ethylphenols. .................................................................................................................. 108
Figure 5.3: Percentage recovery of coumarates in fermentations. ..................................... 109
Figure 5.4: Percentage recovery of ferulates in fermentations. ......................................... 109
Figure 5.5: Percentage of the theoretical maximum conversion from ethyl coumarate (11)
and ethyl ferulate (12) to ethylphenols by different strains of D. bruxellensis. ................ 110
Figure 5.6: p-Coumaroyl L-tartrate (7) and feruloyl L-tartrate (8). ................................... 111
Figure 5.7: p-Coumaroyl glucose (9) and feruloyl glucose (10). ...................................... 113
Figure 5.8: Percentage of the theoretical maximum conversion of hydroxycinnamoyl
glucose esters (9 and 10) to ethylphenols. ......................................................................... 113
Figure 5.9: Percentage of the theoretical maximum conversion to 4-ethylguaiacol for the
trans- and cis/trans- fermentations. ................................................................................... 116
Figure 5.10: Evolution of 4-ethylguaiacol in cis/trans-fermentations as a percentage of
maximum conversion observed in trans-fermentations. .................................................... 117
Figure 5.11: Compounds by percentage in end-point fermentation samples. ................... 119
Figure 5.12: Percentage of the theoretical maximum conversion to 4-ethylphenol in trans-
and cis/trans- fermentations. .............................................................................................. 120
Figure 5.13: Evolution of 4-ethyphenol in cis/trans-fermentations as a percentage of
maximum conversion observed in trans-fermentations. .................................................... 120
Figure 5.14: Percentage of the theoretical maximum ethylphenol conversion from cis-ethyl
esters. ................................................................................................................................. 122
Figure 5.15: Total coumarate recovery from cis-fermentations. ....................................... 124
Figure 5.16: Total ferulate recovery from cis-fermentations. ............................................ 124
Figure 5.17: Breakdown of ethyl ferulate in a single fermentation. .................................. 125

xx
List of Schemes:
Scheme 2.1: Synthesis of hydroxycinnamic acid derivatives. ............................................. 22
Scheme 2.2: Literature syntheses of mono-esters of tartaric acid. ...................................... 25
Scheme 2.3: Literature syntheses of chicoric acid. .............................................................. 26
Scheme 2.4: Synthesis of benzylated hydroxycinnamoyl tartrate esters. ............................ 27
Scheme 2.5: Attempted debenzylation procedures. ............................................................. 28
Scheme 2.6: Synthesis of di-tert-butyl tartrate. ................................................................... 29
Scheme 2.7: Esterification of hydroycinnamic acids and di-tert-butyl tartrate. .................. 30
Scheme 2.8: Synthesis of hydroxycinnamoyl tartrate esters. .............................................. 34
Scheme 2.9: Modified Koenigs-Knorr reaction conditions employed within this research
group. ................................................................................................................................... 35
Scheme 2.10: Glycosylation reactions of Ziegler. ............................................................... 36
Scheme 2.11: Glycosylation method described by Galland. ............................................... 37
Scheme 2.12: Synthesis of 1-O-benzyl hydroxycinnamoyl glucopyranoses. ...................... 39
Scheme 2.13: Synthesis of glucose esters with free hydroxycinnamic acids. ..................... 41
Scheme 2.14: Glycosylation with 1-O-acetyl hydroxycinnamic acids and partial
deacetylation using XAD-8 resin. ........................................................................................ 44
Scheme 2.15: Glycosylation of 1-O-chloroacetyl hydroxycinnamates, and migration of the
free glucose esters. ............................................................................................................... 46
Scheme 3.1: Mechanism for acid catalysed 1-O-β- to 2-O-β- acyl migration of p-
coumaroyl glucose (9). ........................................................................................................ 61
Scheme 4.1: Attempted synthesis of cis-hydroxycinnamic acids. ....................................... 88
List of Tables:
Table 1.1: Hydroxycinnamoyl tartrate ester concentrations in different grape varieties. .... 12
Table 1.2: Changes in p-coumaroyl tartrate concentration during malolactic fermentation.
............................................................................................................................................. 13
Table 1.3: Changes in p-coumaroyl tartrate concentration during wine storage. ................ 14
Table 2.1: 1H NMR shifts for migrated hydroxycinnamoyl glucose esters. ........................ 47
Table 4.1: Content of cis- and trans-p-coumaroyl tartrate in the skin and juice of red and
white grapes. ........................................................................................................................ 82
Table 4.2: Isomeric ratio of p-coumaric acid (3) under different storage conditions. ......... 90
Table 4.3: Solvent polarities and ET30 values. ..................................................................... 98

xxi
Table 5.1: Ethylphenol content in tartrate ester fermentation experiments. ...................... 112
Table 5.2: Concentration of cis- and trans-ferulic acid in end-point fermentation samples.
........................................................................................................................................... 119
Table 5.3: Final trans-ethyl ester content in cis-ethyl ester fermentations. ....................... 123

“Success is the ability to go from one failure to another with no loss of enthusiasm” Sir Winston Churchill
“I’m a great believer in luck, and I find the harder I work the more I have of it”
Thomas Jefferson

Chapter 1: Introduction
1
Chapter 1: Introduction.
1.1 General Introduction.
The global history of wine production spans back many thousands of years, supported by
the discovery of wine vessels that have been dated to as early as circa 5400-5000 B.C., as
well as there being numerous biblical references to wine.1 The history of Australian wine,
however, begins with European settlement in 1788 when the Lady Penrhyn,2 one of the
eleven ships in the First Fleet, arrived carrying on it vine cuttings and seeds from the
species Vitis vinifera obtained en route from Brazil and the Cape of Good Hope.3 Within
days of landing, the vines had been planted in the governor’s garden in Sydney Cove but
failed to thrive due to the humid coastal climate. Late in 1788 the first inland farming
settlement was established at Rose Hill (now Parramatta), some 24 km further inland. This
region had a much drier climate allowing for cultivation of a vineyard and by 1791 boasted
3 acres consisting of 8000 vines and the following year produced approximately 150 kg of
table grapes.3 In 1795 Philip Schaffer became the colony’s first vigneron when he
produced some 90 gallons, or approximately 400 litres of wine.2
From humble beginnings, the Australian wine industry has developed extensively,4 now
consisting of 2477 wineries, crushing 1,603,000 tonnes of grapes and producing 1,533 ML
of wine,5 of which, 777 ML is exported worldwide, with a value of A$2,167,200,000.6
South Australia contributes 48% of the total volume of Australian wine production, which
is a product of crushing 689,000 tonnes of grapes.7
Even though the world of wine has largely moved past the fortuitous fermentation of grape
juice caused by indigenous yeast, and into an industry of more controlled and predictable
fermentations with cultured or purchased yeasts,8-9 there still remains uncertainties that can
be brought about through the presence of unwanted microrganisms.10
1.2 Dekkera/Brettanomyces bruxellensis.
A constant issue encountered in wine making throughout the world,11 and of interest in
Australia since the first reported occurrence in 1986, is that of contamination caused by

Chapter 1: Introduction
2
yeast of the Brettanomyces and Dekkera genera,12 through their potential to cause a prolific
economic impact on the wine industry.13-14
The name Brettanomyces was originally introduced in 1904 as the characteristics produced
by this yeast were similar to the English beers of the time, with the prefix ‘Brettano’ a
reference to the British brewing industry. The first report of this yeast in wine came much
later, when in 1930 Mycotorula intermedia was isolated from a French must, later to be
reclassified as Brettanomyces. The early 1950’s saw the first report of this genus in bottled
wine, which was closely followed by the discovery of a sporulating form of
Brettanomyces,15 which was categorised into the new genus, Dekkera.16
Since then species within Brettanomyces and Dekkera have been classified and re-
classified numerous times,17 with the work of Smith and Poot18 and Boekhout19 being
largely responsible for the current taxonomy of these genera. There consists five species of
Brettanomyces (bruxellensis, anomolus, naardenensis, custersianus, nanus), of which
bruxellensis and anomolus have teleomorphs in the genus Dekkera.17 However, due to the
difficulties associated with characterising yeasts into either the Brettanomyces or Dekkera
genera on the basis of sporulation,20 these two names are often used interchangeably.11 The
current preference is for Dekkera on the basis of molecular identification.21
While there have been numerous wine-related studies focusing on different strains and
species of Brettanomyces and Dekkera, recent attempts to characterise grape, wine and
winery isolates have failed to identify a Dekkera species other than D. bruxellensis.22-27
Also, early research may have used outdated yeast classifications describing species that
have since been re-classified. As such, reference to previous literature will reflect the
author’s original classifications, but wine related instances of these yeasts will be referred
to as D. bruxellensis.
Many studies into Dekkera and Brettanomyces yeasts have shown great variety between
strains within the same species for easily observable characteristics including growth,
nutritional requirements and metabolic output,23-24, 28-36 but the development of genetic
characterisation has allowed for a more in depth study of these yeasts. Conterno et al.
obtained 47 wine strains of B. bruxellensis from around the world, of which 35 isolates
were studied in great detail. While no two strains displayed the same characteristics in

Chapter 1: Introduction
3
terms of growth, temperature dependence, ethanol tolerance, sulfite tolerance and
metabolic output, the genetic characteristics of these strains could link them with their
geographic origin, vintage year and wine variety.23
With respect to Australian winemaking, Curtin et al. characterised 244 D. bruxellensis
isolates from wine making regions across the country and showed that all isolates could be
placed into closely related genetic groups. One group dominated, accounting for 85% of all
the isolates, with another two genetic groups contributing 6% and 7% respectively.22 The
second two groups, while less represented in Australia, were shown to be closely related to
reference isolates from France and California, which indicates that these secondary D.
bruxellensis groups in Australia may be representative of internationally isolated strains.
While Dekkera strains can be classified into distinct genetic clusters, it is the more generic
characteristics that lead to yeast being classified into the Brettanomyces or Dekkera genera.
Prior to the work of Renouf and Lovaud-Funel,37 the origin of these yeasts in the winery
was not completely understood, but through the development of an enrichment media
specifically for growth of B. bruxellensis, detection on grape berries and the vineyard
origin was inferred. These wild yeasts encounter the grapes by becoming airborne and
settling on them in the vineyard, or can be spread by fruit fly and bees with traces of these
yeasts having being found in the feeding and breeding areas of both insects, as well as on
their legs, bodies and wings.15 Once present in the winery, D. bruxellensis can become
established in any area with which the affected wine comes in contact.11, 15
Even though D. bruxellensis can be found throughout the winery, and has been isolated as
early in the winemaking process as the completion of alcoholic fermentation,33 malolactic
fermentation is an important period in the development of D. bruxellensis due to the low
sulphur dioxide levels needed for growth of lactic acid bacteria, as well as the residual
sugar still remaining in the wine.38 The ability to grow and thrive with few nutrients,39-40
along with the increased tolerance for high ethanol concentrations make the later stages of
winemaking ideal for D. bruxellensis, with little competition from other wine
microorganisms.20 This allows for survival throughout vinification until conditions are
more encouraging for growth,40 which is why the most common place of Dekkera infection
is in the barrel, during wine ageing.15, 41-42 D. bruxellensis can live solely off of cellobiose,
a product of cellulose degradation, allowing it to remain in empty barrels and contaminate

Chapter 1: Introduction
4
subsequent wine additions.11, 15, 23 Once a barrel has become contaminated, sterilisation can
be attempted through shaving, toasting, steaming or hot water treatments,15, 43 though there
is no guaranteed method by which to eradicate Dekkera, with prevention being the
recommended course of action.43
While re-use of barrels can increase the chance of further infection by D. bruxellensis,44-45
the use of new barrels can provide the yeast with additional sugar and oxygen in which to
establish themselves,20 and techniques such as micro-oxygenation which is used to
accelerate wine ageing can provide a more favourable environment for growth.44-45 This is
not to say that lack of oxygen is a great inhibitor, Dekkera can adapt to conditions of low
oxygen, with anaerobiosis only restricting growth and not preventing it.44, 46
In the suspended volume of wine, sulphur dioxide has proven relatively successful in
controlling D. bruxellensis growth.47 Along with the use of barrels during red wine
production,15, 42 the increased sulphur dioxide efficacy at the lower pH of white wine is
probably the main reason why this yeast is more commonly found in red wines.20
However, due to the ability of wine to penetrate deep into the barrel, Dekkera can be
carried deep into cracks, between staves, and around the bung, proliferating away from the
dissolved sulphur dioxide.14 Furthermore, the use of sulphur dioxide may induce a viable
but non-culturable state (VBNC) whereby the yeast is no longer active but can become
viable again given favourable conditions. In a VBNC state Dekkera cells can shrink from
an average 5-8 x 3-4 µm to be small enough to pass through a 0.45 µm filter and then
proliferate in the ‘filtered’ wine,48-50 with the potential to become the major organism in
bottled wine.51 Alternatively trialled methods for controlling Dekkera include
dimethyldicarbonate,52-53 sorbic acid,54 increased temperatures,55-56 low-voltage electric
current,57 ozone,38 and high-power ultra sonic radiation.58
Furthermore, detection of D. bruxellensis in wine has proven to be difficult due to its
comparatively slow growing nature and limited carbon dioxide production.11 Agar plate
smears can be used for the detection of yeasts in winemaking, but D. bruxellensis is often
overgrown by other yeasts that are present and missed, or can even develop long after the
agar plate has been disposed of.15 Current techniques for detection revolve around
additions of compounds inhibitory to the growth of other organisms, allowing Dekkera to

Chapter 1: Introduction
5
be the sole occupant and more easily identified,59 in a similar manner to that previously
described for detection on grapes.37
If able to grow in wine, D. bruxellensis is associated with formation of several “spoilage”
compounds. It has been connected with the production of acetic acid in wines,60 and
though this effect is lessened with decreasing amounts of oxygen, it can still be produced
under full anaerobiosis.44-46, 60 D. bruxellensis has also been directly linked with the
production of ‘mousy’ aromas in wine from tetrahydropyridines,12, 29 the formation of
isovaleric acid,15 which has been described as rancid or cheesy,43 and the production of
volatile phenols.61-62
1.3 Volatile Phenols.
Of the spoilage compounds produced by D. bruxellensis, those of greatest interest,
especially in red wine, are 4-ethylphenol (1) and 4-ethylguaiacol (2). These compounds,
their presence in wine, and their link to D. bruxellensis has been extensively researched
over the past 25 years,15, 41-43, 61-67 and they are produced almost exclusively by Dekkera
under oenological conditions.61-62 Only trace amounts of 4-ethylphenol and 4-ethylguaiacol
have been identified in grape musts, with very little present at the conclusion of malolactic
fermentation. The resulting wines can have much higher concentrations of ethylphenols,
with the greatest increase usually occurring during barrel ageing,41 where Dekkera
proliferates.
OH OH
OCH3
1 2
Figure 1.1: Ethylphenols produced by D. bruxellensis in red wine.
Phenols, 1 and 2, are formed via the activity of two enzymes that are active towards the
hydroxycinnamic acids, p-coumaric acid (3) and ferulic acid (4). The first of these
activities, a decarboxylase, converts compounds 3 or 4 into 4-vinylphenol or 4-

Chapter 1: Introduction
6
vinylguaiacol (5 or 6), respectively, by removing the carboxylic acid moiety and releasing
carbon dioxide.68 The second activity is a vinyl reductase which acts by reducing the C-C
double bond, generating ethylphenols (1 or 2).68-69
OH OH OH
COOHDecarboxylase Vinyl Reductase
3 R = H4 R = OCH3
1 R = H2 R = OCH3
5 R = H6 R = OCH3
R R R
Figure 1.2: Enzymatic conversion of hydroxycinnamic acids to volatile phenols.
In studies of B. bruxellensis and B. anamolus, decarboxylase activity towards caffeic acid
as well as p-coumaric and ferulic acids (3 and 4) has been shown.68, 70 However, it has not
been until recently that the metabolite of caffeic acid, 4-ethylcatechol, has been quantified
in wine.71 While caffeic acid concentrations in wine can exceed that of p-coumaric and
ferulic acid,28, 72-73 4-ethylcatechol concentrations are much lower than 4-ethylphenol and
are closer to that of 4-ethylguaiacol.71 The sensory threshold of 4-ethylcatechol is yet to be
adequately determined in wine. Initial reports suggest a detection threshold around 50
µg/L,74 though unpublished investigations by the Australian Wine Research Institute
(AWRI) suggest that it is much higher. A recent study into the detection thresholds in cider
also support a significantly increased threshold when compared to that of 4-ethylphenol,75
implying that 4-ethylcatechol is of little importance in the production of volatile phenol
off-flavour in wine.
Other microbes present during winemaking possess the necessary enzymatic abilities to
breakdown p-coumaric and ferulic acids and can produce varying amounts of volatile
phenols. However, unlike Dekkera, the activity of the Saccharomyces cerevisiae
decarboxylase is inhibited by the presence of polyphenols in red wines.41, 76 As such, S.
cerevisiae is able to perform decarboxylation and contribute to the accumulation of
vinylphenols in white wine alone,76 although does not possess the ability to subsequently
reduce the vinylphenols to the ethyl analogues.77-78

Chapter 1: Introduction
7
This is also the case for lactic acid bacteria. For many that possess the ability to
decarboxylate hydroxycinnamic acids and produce vinylphenols, the activity is inhibited
by the presence of polyphenols, though in situations where decarboxylation can be
performed, subsequent formation of ethylphenols is hindered by limited vinyl reductase
activity.61-62 Specifically, Oenococcus oeni, the organism largely responsible for malolactic
fermentation, displays limited decarboxylase activity even when uninhibited.61, 79 For those
that do possess decarboxylase activity it has been found that it needs to be induced,
whereby the bacteria need to grow in the presence of the hydroxycinnamic acids for it to be
activated.80
Chatonnet et al. investigated numerous bacteria from the genera Leuconostoc,
Lactobacillus, Pediococcus and Acetobacter, and yeasts Candida, Hanseniaspora,
Metchnikovia, Pichia, Hansenula, Kluyveromyces, Torulaspora and Zigosaccharomyces
with respect to production of volatile phenols.41 Other non-wine related microorganisms
that have been studied include Lactobacillus plantarum, Lactobacillus hilgardii,
Lactobacillus brevis, Pediococcus pentosaceus, Pediococcus damnosus,61 Klebsiella
oxytoca,81-82 Erwinia uredovora,82 Aerobacter aerogens,83 Cladosporium phlei,84
Polyporus circinata,85 Bacillus subtilis86 and Pichia guilliermondii.87-88
Of these Lactobacillus plantarum can produce ethylphenols in synthetic media (2.55%
conversion, compared with 68.6% by D. bruxellensis), but like most other organisms is
inhibited by the presence of polyphenolic compounds.61 P. guilliermondii can also produce
ethylphenols but only in grape juice, and as such can only contribute to volatile phenol
accumulation prior to alcoholic fermentation.88 Furthermore, this organism has only been
associated with wine prior to alcoholic fermentation, having been isolated from grapes,
grape juice and winery equipment, but not from wine itself.87 Other than L. plantarum and
P. guilliermondii, the remaining organisms were either studied with respect to
decarboxylase activity and the ability to produce vinylphenols, or did not possess the
necessary enzymatic abilities to produce ethylphenols.
Thus, while winemaking micro-organisms other than D. bruxellensis can possess the
enzymatic abilities to breakdown the hydroxycinnamic acids, they do not produce
ethylphenols in the quantities seen by D. bruxellensis in wine,61-62 due to either inhibition
of the necessary activities by polyphenolic compounds present in red wine or poor survival

Chapter 1: Introduction
8
under oenological conditions. Organisms that do possess the ability to produce volatile
phenols are not present during barrel ageing where the majority of the spoilage occurs.41
Studies into the sensory impact of the volatile phenols found that 4-ethylphenol has a
detection threshold of 605 µg/L and a rejection threshold of 620 µg/L in a red wine, while
4-ethylguaiacol was detected at 110 µg/L with the wine being rejected at 140 µg/L.41
However, the amounts of these compounds found in wine differs greatly depending on
wine variety, with ratios of 4-ethylphenol:4-ethylguaiacol in Australian red wine varying
from 10:1 in Cabernet Sauvignon to 3.5:1 in Pinot Noir and with an average ratio of
approximately 8:1,63 which is said to be a result of the relative amounts of precursors
present in the grape.41 Also, differences in yeast nutrients, winemaking practices, D.
bruxellensis strains, temperature and use of oak can contribute to altering the ratios and
concentration of ethylphenols in finished wine.43
At an 4-ethylphenol:4-ethylguaiacol ratio of 10:1, which has become known as the
Bordeaux ratio, due to first being determined in Bordeaux red wine by Chatonnet and Pons
(1988, cited in Romano et al. 2009),89 a combined 4-ethylphenol and 4-ethylguaiacol
detection threshold of 369 µg/L and a rejection threshold of 426 µg/L was determined.41 A
study of the ethylphenol concentration of Australian red wines reported a combined
concentration of ethylphenols in excess of 2500 µg/L in three wines, and across the entire
survey an average concentration of 795 µg/L for 4-ethylphenol and 99 µg/L for 4-
ethylguaiacol, with approximately 60% of the wines possessing combined concentrations
in excess of 426 µg/L.63 The threshold of these compounds relies heavily on the wine
variety in which they are found, with a lighter wine being spoiled at a much lower
threshold than a full-bodied wine.43 The descriptors used for each compound are spicy,
phenolic, medicinal, wet horse, woody and smoky for 4-ethylphenol, and smoky or clove-
like for 4-ethylguaiacol.62, 66, 90
A more recent study into the sensory properties of the ethylphenols has linked both
isovaleric acid and isobutyric acid with masking effects.89 This study indicates that the
presence of these two acids can increase the detection thresholds of the ethylphenols by as
much as four times. This would have a similar effect as the wine style, whereby a wine
with higher isovaleric and isobutyric acid concentrations could contain slightly more

Chapter 1: Introduction
9
ethylphenols than a wine with lower concentrations of these acids and exhibit the same
sensory properties.
While the ethylphenols are the main contributors to Dekkera related spoilage in red
wines,31 the vinylphenols, while less thoroughly researched, are of greater importance in
white wines.76 Their relative scarcity in red wine is brought about by the efficacy of the
vinyl reductase that D. bruxellensis possesses, converting most to give the ethyl
analogues,41 as well as the potential incorporation of vinylphenols into
pyranoanthocyanins.91 As mentioned previously, the vinylphenols in white wines are due
to the decarboxylase ability of S. cerevisiae when not impeded by polyphenolics, and when
these vinylphenols are present in wine, a 1:1 mixture (4-vinylphenol:4-vinylguaiacol)
imparts pharmaceutical or phenolic nuances at concentrations above 770 µg/L.76
The production of volatile phenols in wine is proportional to the Dekkera population,41
with 4-ethylphenol able to be used as a marker for growth,11 while yeast growth is
proportional to the sugar concentration. Sugar at a level of 300 mg/L allows for
proliferation of 1 x 10³ cells/mL, enough to yield 600 µg/L of 4-ethylphenol. In wine that
has completed malolactic fermentation, up to 1 g/L or more of residual sugar can be
found.61
Research towards the removal of ethylphenols has shown promise in lowering
concentrations, with reverse-osmosis found to reduce the concentrations of 4-ethyphenol
and 4-ethylguaiacol in wine, but the reduction in the volatile phenols was matched with
losses to other desirable aroma compounds.92 Experimentation with lyophilised yeast as an
adsorbent for 4-ethylphenol also resulted in reductions of desirable compounds, in this case
the loss of anthocyanins produced a reduction in wine colour.93
With current efforts at ethylphenol removal resulting in concomitant reductions in wine
quality, one effective way of avoiding spoilage, apart from limiting Dekkera growth, is to
minimise the initial concentration of precursors in the wine.64 As such, the role of
hydroxycinnamic acids in the production of volatile phenols should come under further
scrutiny.

Chapter 1: Introduction
10
There have been conflicting reports as to the presence of p-coumaric and ferulic acids in
grapes with some studies identifying these compounds in grapes, juice or must,73, 94-97
while others have failed to do so.72, 98-99 This could in part be due to insufficient extraction
from the berry, as those that could identify them, found large concentrations in the skin.94-
96 Reported concentrations in juice or must generally range from not present, or not
detected, to around 0.2 mg/L73, 97 which is seen to increase throughout vinification with
changes observed due to skin contact, alcoholic fermentation, malolactic fermentation and
ageing or storage.97, 99-105 A comprehensive study of 547 red wines from multiple countries
and wine regions found p-coumaric acid in concentrations ranging from not detected
through to 6.7 mg/L,106 and although this study did not quantify ferulic acid, it is often
present in lower concentrations than p-coumaric acid,72-73, 101, 103 hence lower 4-
ethylguaiacol concentrations following breakdown by D. bruxellensis. The increase of free
hydroxycinnamic acids during vinification is largely attributed to the release from
conjugated forms,99-100 with the hydroxycinnamic acids having been found as tartaric acid
esters, glucose esters, glucosides, ethyl esters, bound to anthocyanins, or in combinations
of these.107-108 The hydroxycinnamic acids are known to possess antimicrobial
properties109-110 and can be stored in the grape in an inert form until needed to fight off
unwanted organisms, also they may be conjugated to assist in both solubility and
transport.111 Therefore, before p-coumaric and ferulic acids can be decarboxylated and
reduced, yielding ethylphenols, they must be freed from the conjugated forms in which
they are found in grapes.
A common oenological technique is to employ commercial enzyme preparations during
maceration to aid in the release of phenolic compounds from the grape berries. Those
containing undesired cinnamoyl esterase capabilities can be effective at hydrolysing bound
forms, which then leaves the free hydroxycinnamic acids available for conversion to the
associated volatile phenols. As such, enzyme preparations that do possess cinnamoyl
esterase activity are not recommended for use in winemaking as they can increase the
chance of spoilage.64, 112 Furthermore, Dekkera has been shown to be active in the
formation and degradation of ethyl esters,113 and in the release of aglycones from
glycosidically bound forms.114 However, the study of the direct volatile phenol production
from bound hydroxycinnamates by Dekkera has not been studied.

Chapter 1: Introduction
11
1.3 Introduction to Tartrate Esters.
The first report of L-tartaric acid conjugates of the hydroxycinnamic acids in grapes was by
Ribereau-Gayon in 1965, from paper chromatography of black grape skin extracts and of
red wine, identifying the caffeoyl tartaric acid ester along with the p-coumaroyl tartaric
acid ester (7) and feruloyl tartaric acid ester (8). This study failed to identify the quinic
acid esters of the hydroxycinnamic acids, which is the form in which they exist in many
other plants, and were believed to exist in grapes.115 Since this discovery, much research
has been done on the tartaric acid esters of hydroxycinnamic acids, including the discovery
of them in the whole grape berry and not just the skin,116 and showing that they are largely
found in the juice of the grape.117 These esters are also the main phenolic constituent of
fresh grape juice and it has been confirmed that they exist mainly in their trans-form, with
the cis-isomer being present at lower levels.118 The hydroxycinnamoyl tartrates have no
odour, but can add to the taste and astringency of wine, possessing a bitter taste above a
concentration of 10 ppm.119
O O
OH
HOOC
COOH
OH
O O
OH
HOOC
COOH
OH
OCH3
7 8
Figure 1.3: L-Tartaric acid esters of p-coumaric acid (7) and ferulic acid (8).
The highest concentration of hydroxycinnamoyl tartrates are found in immature berries and
they decrease as the berry ripens,94-96, 120-122 which is accentuated by an increase in berry
volume, though in most cases the weight of compound per berry also shows a decline as
the berry matures.95, 121 One study observed an initial drop during ripening followed by a
slow re-accumulation to the original amounts as the berries matured.122
The identification and quantification of the tartrate esters in grapes,72, 94-96, 122-125 skin,98, 126-
127 juice73, 120, 127 and must97, 128-129 has been performed across both red and white grape

Chapter 1: Introduction
12
varieties. The literature data has been collected from different grape varieties from around
the world, and the concentrations determined using a number of analytical techniques
which quantify varied parts of the grape berry or during different stages of winemaking. As
such, a summary of the tartrate ester content in grapes and wine would, at best, only be an
average of many different analyses which possess significant variation. Also, feruloyl
tartrate can be present at low enough concentrations that some analytical methods, if it can
be detected, may give unreliable results.128 The table below shows the results achieved by
Ong and Nagel from analysing different grape varieties for the presence of p-coumaroyl
and feruloyl tartrate in the berry. 122
Table 1.1: Hydroxycinnamoyl tartrate ester concentrations in different grape varieties.122
The tartrate ester content continues to change during winemaking due to the effects of skin
contact,97, 102, 129 alcoholic fermentation,97, 99, 101-102, 104, 129 malolactic fermentation,97, 101-103
and storage or ageing.99-100, 102, 104, 129-130 Some studies have focused simply on the
difference between either grape berry, juice or must concentration, and that of finished
wine, with significant reductions in concentration noted.72-73, 128
In separate studies Gil-Munoz et al.,102 Somers et al.,99 and Nagel and Wulf129 monitored
the changes in p-coumaroyl tartrate throughout fermentations of Monastrell, Chardonnay,
and Cabernet Sauvignon and Merlot wines, respectively. All authors reported an initial
increase in concentration, peaking during alcoholic fermentation, followed by a large
decrease throughout either malolactic fermentation and storage for the red varieties or just
storage for Chardonnay (3-5 fold reductions). Any reductions witnessed in the early stages
NOTE: This table is included on page 12 of the print copy of the thesis held in the University of Adelaide Library.

Chapter 1: Introduction
13
of winemaking have been associated with enzymatic cleavage of the tartrate esters
resulting in liberation of the free hydroxycinnamic acids.99
Observing malolactic fermentation alone (Table 1.2), Hernandez et al. employed different
lactic acid bacteria as well as studying spontaneous malolactic fermentation reporting
increases and decreases in p-coumaroyl tartrate concentration, depending on the
conditions.103 From grapes that were crushed at ambient temperature, Gil-Munoz et al.
witnessed close to a 3-fold reduction of p-coumaroyl tartrate concentration during
malolactic fermentation of Monastrell wine, compared with an increase in wine made with
grapes crushed at 10 oC.102
Table 1.2: Changes in p-coumaroyl tartrate concentration during malolactic
fermentation.102-103
Initial (mg/L) Final (mg/L) Variety Details Reference
8.68 Spontaneous17.98 O. oeni-1813.84 O. oeni-1598.98 L. plantarum-5112.77 L. plantarum-39
397 148 Normal temp.163 255 Low temp.
Tempranillo13.75
Monastrell
Hernandez et al. (2007)
Gil-Munoz et al. (1999)
Ageing or storage of wines, both red and white, results in a reduction of the tartrate ester
concentration over different lengths of storage and under a number of conditions (Table
1.3). The bottle ageing of red wine has been studied from 8 months to 26 months, with
large reductions seen in Monastrell wine over shorter storage times,130 small reductions
observed in Cabernet Sauvignon and Merlot over longer periods,129 and differences
between wine varieties with Monagas reporting a dramatic loss of p-coumaroyl tartrate in
Tempranillo, but only slight fluctuations in Graciano and Cabernet Sauvignon.100 In the
study of Gil-Munoz mentioned above, a 2-fold reduction through 210 days of ageing is
described.
Chapter 1: Introduction
14
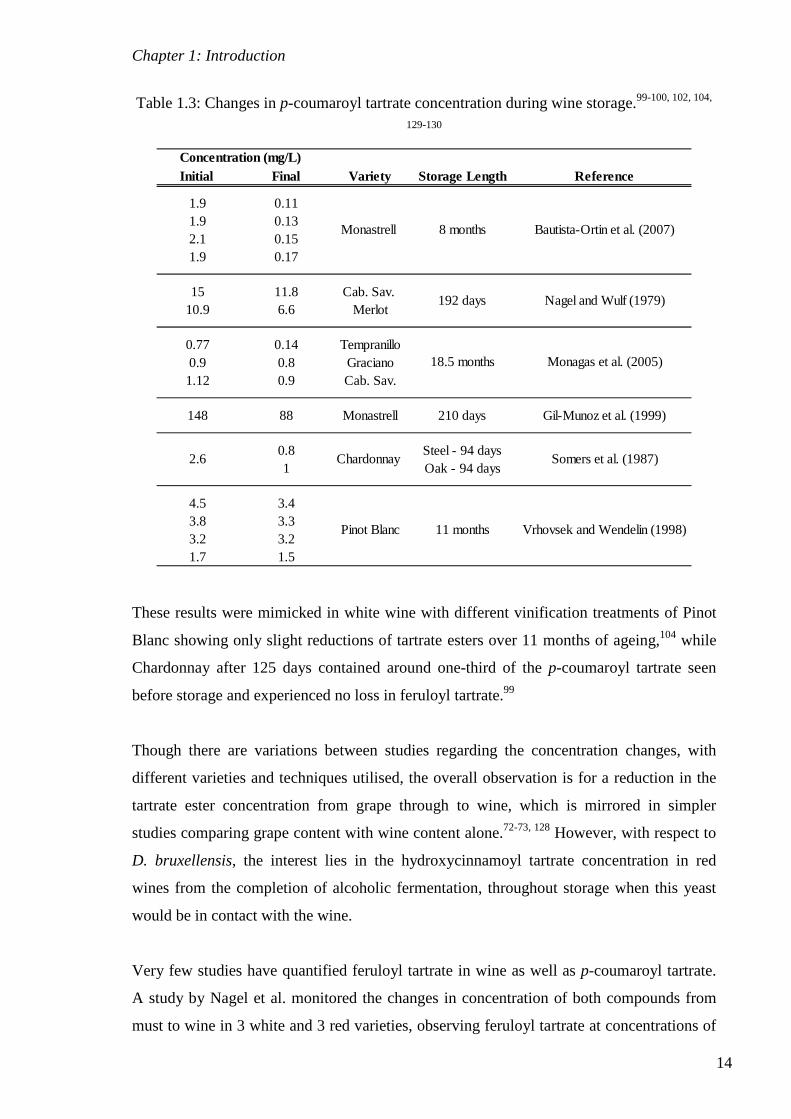
Table 1.3: Changes in p-coumaroyl tartrate concentration during wine storage.99-100, 102, 104,
129-130
Initial Final Variety Storage Length Reference
1.9 0.111.9 0.132.1 0.151.9 0.17
15 11.8 Cab. Sav. 10.9 6.6 Merlot
0.77 0.14 Tempranillo0.9 0.8 Graciano1.12 0.9 Cab. Sav.
148 88 Monastrell 210 days Gil-Munoz et al. (1999)
0.8 Steel - 94 days1 Oak - 94 days
4.5 3.43.8 3.33.2 3.21.7 1.5
2.6
Bautista-Ortin et al. (2007)
Nagel and Wulf (1979)
Chardonnay
Pinot Blanc 11 months
Somers et al. (1987)
Vrhovsek and Wendelin (1998)
Monagas et al. (2005)
Concentration (mg/L)
Monastrell 8 months
192 days
18.5 months
These results were mimicked in white wine with different vinification treatments of Pinot
Blanc showing only slight reductions of tartrate esters over 11 months of ageing,104 while
Chardonnay after 125 days contained around one-third of the p-coumaroyl tartrate seen
before storage and experienced no loss in feruloyl tartrate.99
Though there are variations between studies regarding the concentration changes, with
different varieties and techniques utilised, the overall observation is for a reduction in the
tartrate ester concentration from grape through to wine, which is mirrored in simpler
studies comparing grape content with wine content alone.72-73, 128 However, with respect to
D. bruxellensis, the interest lies in the hydroxycinnamoyl tartrate concentration in red
wines from the completion of alcoholic fermentation, throughout storage when this yeast
would be in contact with the wine.
Very few studies have quantified feruloyl tartrate in wine as well as p-coumaroyl tartrate.
A study by Nagel et al. monitored the changes in concentration of both compounds from
must to wine in 3 white and 3 red varieties, observing feruloyl tartrate at concentrations of

Chapter 1: Introduction
15
1.4, 1.9 and 1.2 ppm in Cabernet Sauvignon, Merlot and Pinot Noir, respectively,
compared with p-coumaroyl tartrate at 5.2, 3.1 and 4.7 ppm.128
In other studies, p-coumaroyl tartrate has been found in wine that has undergone malolactic
fermentation in concentrations ranging from less than 1 mg/L101 up to greater than 20
mg/L,103 and in wines with different lengths of ageing approximately 1 mg/L100, 131 through
to around 10 mg/L.97, 129 With typical p-coumaric concentrations in red wines ranging from
trace to 6.7 mg/L, as reported by Goldberg et al.,106 the role of the hydroxycinnamoyl
tartaric acid esters in the formation of ethylphenols has the potential to exceed that of the
free acids. However, due to the relative molecular weights of the tartrate esters (7 and 8)
compared with the acids (3 and 4), breakdown of an equal concentration of each substrate
will result in a greater amount of ethylphenols in the case of the acids.
While the decrease in hydroxycinnamoyl tartrate ester concentration during winemaking
has been linked to typical winemaking practices such as fermentation and the yeast
Saccharomyces cerevisiae,97, 99, 101-102, 104, 129, 132 malolactic fermentation and the bacteria
Oenococcus oeni,97, 101-104, 129 as well as wine ageing,99-100, 102, 104-105, 129-130 the use of
commercial enzyme preparations has also been studied.64, 112 The breakdown of the tartrate
esters, followed by fermentation with either S. cerevisiae or B. bruxellensis resulted in an
increase in the volatile phenol concentration, linking the use of enzyme preparations to the
liberation of free hydroxycinnamic acids, which can be further modified by yeast.
There has also been a single study linking the p-coumaroyl tartrate to D. bruxellensis,28 but
this study failed to link any observed losses of the tartrate ester with an increase in volatile
phenol production. Instead, only p-coumaroyl tartrate and p-coumaric acid were quantified
in wine having undergone fermentation with multiple strains of D. bruxellensis, with both
compounds exhibiting inconsistent changes in concentration. In some cases the
concentration of p-coumaric acid in the samples inoculated with D. bruxellensis were
higher than in the uninoculated control, and did not exhibit a corresponding loss in the
tartrate ester, leaving it unclear as to whether p-coumaroyl tartrate could be enzymatically
hydrolysed by D. bruxellensis and subsequently broken down to yield volatile phenols.

Chapter 1: Introduction
16
1.4 Introduction to Glucose Esters.
The presence of glucose esters of hydroxycinnamic acids was first postulated in 1978 by
Ong and Nagel who tentatively identified them during a study on the constituents of grapes
using high pressure liquid chromatography.120 Soon after this discovery, Herrmann and
Reschke analysed a number of different fruits to isolate and determine their constituents,133
including white grapes, from which the authors confirmed the presence of p-coumaroyl
glucose (9) and feruloyl glucose (10) (Figure 1.4). More recently Baderschneider and
Winterhalter isolated both the p-coumaroyl and feruloyl glucose esters from a German
Riesling,108 which was the first reported occurrence of these two compounds in wine. The
first report of the isolation of the p-coumaroyl glucose ester from red wine was in 2004 by
Monagas,107 though no feruloyl glucose was detected.
OO
OH
OO
OH
H3CO
9 10
O O
OH
HOHO
OH
OH
HOHO
OH
Figure 1.4: 1-O-β-D-Glucose esters of p-coumaric acid (9) and ferulic acid (10).
Very little research has been performed with regard to grape and wine concentrations of 9
and 10. Through extraction of Riesling wine and purification, Baderschneider was able to
isolate 24.2 mg of p-coumaroyl glucose and 23.9 mg of feruloyl glucose, although in this
publication there is no mention of the scale of the extraction.108 In a later report the co-
author, Winterhalter, states that the earlier study was performed on 100 litres of wine,134
which would indicate an approximate glucose ester concentration of approximately 0.24
mg/L, without taking into account losses during extraction and purification.
The identification of p-coumaroyl glucose in four monovarietal red wines via liquid-liquid
extraction was described by Monagas et al.131 Two compounds with identical
fragmentation patterns were observed, denoted ‘Hexose ester of trans-p-coumaric acid (1)’

Chapter 1: Introduction
17
and ‘Hexose ester of trans-p-coumaric acid (2)’, which were rationalised by attachment to
glucose via different glucose hydroxyls. Both esters were found in the four wines at similar
concentrations with combined amounts ranging from 0.46 mg/L in Merlot to 0.71 mg/L in
Tempranillo, which were determined after 1.5 months of bottle ageing. An extended study
by the same author investigated the concentration changes in the two p-coumaroyl glucose
ester conjugates through 26 months of ageing in the bottle for three of the four varieties
used above.100 From the figures in their publication, which utilise two x-axes without
specification of which axis the data corresponds with, it is initially unclear as to the
concentration of the glucose esters, although the initial data points correspond with those
described in their previous publication,131 and can therefore be established. In all three
varieties studied, the glucose ester concentrations only fluctuate mildly over 26 months.
Using a similar extraction method, Hernandez et al. studied polyphenolic compounds in
red wine during malolactic fermentation, and again, two p-coumaroyl hexose esters were
observed.103 Initial concentrations in wine were 1.23 and 1.51 mg/L, with increases seen
throughout both spontaneous and inoculated malolactic fermentation with different species
and strains. Final concentrations of p-coumaroyl glucose (1) were between 1.39 and 7.16
mg/L, and 1.95 to 2.63 mg/L for p-coumaroyl glucose (2). While there appears little reason
for such a disproportionate increase, this study infers the potential for either chemical or
enzymatic formation of the glucose esters during vinification.
More recently, results of Boido et al. mirror those detailed above with a solid-phase
extraction resulting in identification of two p-coumaroyl glucose esters in Tannat red wine,
both in near identical concentrations.98 Along with quantification in wine, the content of
the two esters in skin was monitored during grape ripening with concentrations of 1.8 and
1.2 mg/kg 20 days after veraison, rising to 2.4 and 1.4 mg/kg 10 days before harvest and
finally 2.6 and 1.7 mg/kg at harvest.
All of the studies mentioned above used p-coumaric acid to quantify the p-coumaroyl
glucose esters, and employ extraction techniques that can result in loss of analyte with little
means of determining the extraction efficiency due to a lack of a pure standard. However,
it can be concluded that the glucose esters which accumulate during grape ripening,
continue to increase during malolactic fermentation, and are stable throughout wine
ageing.

Chapter 1: Introduction
18
Though there exists very little information on the breakdown of the glucose esters,
potential pathways to degradation during the vinification process include the use of
enzyme preparations containing the appropriate esterases,64, 112 or by the activity of
microbiological esterases, either by those of intended wine microflora or by those of
unwanted microorganisms.135-136 Finally, the acidic environment of the wine could promote
acid-catalysed hydrolysis,135 though the results of Monagas imply that the glucose esters
are stable, or that any hydrolysis is in equilibrium with re-formation.100
To date, no research has been performed on this class of compounds with respect to the
potential for breakdown by D. bruxellensis into volatile phenols.
1.5 Introduction to Ethyl Esters.
While numerous grape derived hydroxycinnamoyl derivatives have been identified, there
also exist those that are a product of the winemaking process. This is the case for ethyl
coumarate (11) which was identified by Somers et al. and assumed to be the product of the
free hydroxycinnamic acid and ethanol during alcoholic fermentation.137
O O
OH
O O
OH
OCH3
11 12
Figure 1.5: Ethyl hydroxycinnamates.
The quantities observed in wine are presumed to be dependent on the original
concentration of hydroxycinnamic acid, and the ester synthesising abilities of the yeast
employed for alcoholic fermentation. Somers et al. reported that ethyl coumarate was not
present in the must of commercial Chardonnay wine, but increased throughout the course
of alcoholic fermentation to finally be observed at 2.7 mg/L at day 31.99 This increase in

Chapter 1: Introduction
19
ethyl coumarate was preceded by an initial increase in p-coumaric acid concentration,
followed by a steady decline as ethyl coumarate was formed.
Compared with ethyl coumarate (11), ethyl ferulate (12) has been less frequently observed
in wine, which is most likely to be a product of the relative quantities present, though it has
previously been identified using both HPLC and GC in red wine,138 and also in Riesling
wine.139-140
Both ethyl coumarate and ethyl ferulate were quantified in 3 red wines and 3 white wines
in 2003 when Sleep developed a method for analysis using the deuterated analogues.141
Both esters were identified in all 6 wines analysed, with ethyl coumarate found at 0.35 to
1.02 mg/L and ethyl ferulate at 0.01 to 0.14 mg/L. Furthermore, the ethyl esters were not
observed in standard ratios, and wines with the highest ethyl ferulate did not necessarily
correspond to those with the highest ethyl coumarate concentrations.
Using the above SIDA method, the evolution of ethyl coumarate was monitored in a Shiraz
wine throughout vinification and ageing (AWRI unpublished results) with a sigmoidal
increase during alcoholic fermentation, which was followed by a slow accumulation during
ageing, peaking at 3600 ppb after 300 days (Figure 1.6).
Figure 1.6: Evolution of ethyl coumarate in Shiraz wine.
Previously described evidence indicated that the activity of alcoholic fermentation has the
ability to break down the tartrate esters to give the free acids, which, as shown above, can
then be esterified again to give the ethyl hydroxycinnamates. However, there has been no

Chapter 1: Introduction
20
evidence as to the ability of D. bruxellensis to then breakdown the ethyl esters to give
volatile phenols.
1.5 Research Aims.
With D. bruxellensis reported to express esterase activites,113 it is surprising that to date no
studies have actively measured the volatile phenol output when fermentation is conducted
in the presence of common and known esters of hydroxycinnamic acids. The
hydroxycinnamoyl tartrate and glucose esters, which are present in the grape berry, survive
throughout the winemaking process. Additionally, the evolution of free acids through
cleavage of esterified forms, and subsequent esterification to yield the ethyl esters results
in a number of hydroxycinnamoyl derivatives that are present during barrel ageing. These
esterified forms could contribute to the accumulation of ethylphenols, but are yet to be
examined.
As such, this study aims to synthesise the aforementioned hydroxycinnamoyl esters (Figure
1.7) and examine the ability of D. bruxellensis to metabolise these compounds and
determine whether they can act as direct precursors to the volatile phenols, or if enzyme
preparations containing cinnamoyl esterase are indeed required for the release of the free
hydroxycinnamic acids before this conversion can take place.
O O
OH
HOOC
COOH
OH
R
O O
OH
R
O O
OH
R
7 R = H8 R = OCH3
9 R = H10 R = OCH3
11 R = H12 R = OCH3
OHO
OH
HOOH
Figure 1.7: Hydroxycinnamoyl tartrate (7 and 8), glucose (9 and 10) and ethyl esters (11
and 12) to be synthesised and used in these studies.

Chapter 1: Introduction
21
As previously mentioned, there exist three significant genetic groups of D. bruxellensis in
Australia, with one of these accounting for 85% of isolates. By including the
hydroxycinnmamoyl esters in fermentation studies with a representative strain (AWRI
1499) from the most common group, the results will be largely representative of what
could be expected from Australian isolates of D. bruxellensis.22 As such, small scale D.
bruxellensis fermentations will be conducted in the presence of each of the esters with the
result determined by analysis for the production of 4-ethylphenol and 4-ethylguaiacol as
previously described by Pollnitz et al.63

Chapter 2: Synthesis of Hydroxycinnamoyl Esters
22
Chapter 2: Synthesis of Hydroxycinnamoyl Esters.
2.1 Synthesis of Hydroxycinnamic Acids and Derivatives.
The synthesis of hydroxycinnamic acids and protected derivatives is a matter of simple
organic transformation. More importantly, the hydroxycinnamate derivative must be
compatible with the conditions required for esterification with glucose or tartaric acid and
subsequent deprotection so that the desired product can be achieved. As such, for use in the
synthesis of glucose and tartrate esters, a variety of protected hydroxycinnamic acid
derivatives were synthesised, as outlined below (Scheme 2.1).
O
O
HO
O
HO
R R
O
O
BnO
R
OH
O
BnO
R
OH
O
HO
R
OH
O
AcO
ROH
O
ClAcO
R
13 R = H 14 R = OCH3
11 R = H (93%)12 R = OCH3 (72%)
19 R = H (83%)20 R = OCH3 (79%)
21 R = H (35%)22 R = OCH3 (65%)
3 R = H (97%)4 R = OCH3 (96%)
15 R = H (93%)16 R = OCH3 (85%)
17 R = H (74%)18 R = OCH3 (69%)
i
ii iii
ivv ii
i) (carbethoxymethylene)triphenylphosphorane. ii) potassium hydroxide. iii) anhydrous potassium
carbonate, benzyl bromide. iv) pyridine, acetic anhydride. v) sodium hydroxide, chloroacetyl
chloride.
Scheme 2.1: Synthesis of hydroxycinnamic acid derivatives.

Chapter 2: Synthesis of Hydroxycinnamoyl Esters
23
p-Hydroxybenzaldehyde (13) and vanillin (14) underwent Wittig olefination to afford the
ethyl esters (11 and 12) in good yields, initially being achieved at room temperature in the
presence of 2-3 equivalences of the appropriate stabilised ylide over a number of weeks.
Alternatively, microwave assisted synthesis proved more facile as a method of synthesis
and also afforded 12 with only a small excess of ylide required, but could only be
performed on small scales with our system due to the energetic nature of the process, with
reaction volumes limited to 15 mL. An attempted scale-up, though minor, for the synthesis
of 11 proved unsuccessful given the small volume of the vessel and much of the reaction
mixture was lost. As such, the original method at ambient temperature over a number of
weeks was the method of choice.
The synthesis of the 1-O-benzyl hydroxycinmamic acids (15 and 16) was achieved by
benzylation of 11 or 12 to give 17 or 18 in 74 and 69% yield respectively, followed by
base-catalysed hydrolysis to furnish 15 and 16 in 93 and 85% yield. Previously, the
benzylation of caffeic acid was described by Galland et al. and was originally achieved via
benzylation of the free acid to give the benzylic ester as well as the ether, followed by
hydrolysis of the ester to yield the di-phenolic protected analogue.142 However, in this case,
the production of 11 and 12 allowed for benzylation of the phenol alone.
Unlike in the preparation of 15 and 16, the phenolic protecting groups with ester
functionality were not installed directly onto 11 and 12 due to the potential for removal of
the protecting group during hydrolysis of the ethyl ester. Hence hydrolysis of 11 and 12, in
an analogous method to that used for production of 15 and 16, afforded the free
hydroxycinnamic acids (3 and 4) which were subsequently protected.
1-O-Acetyl protection to furnish 19 and 20 in good yields (83 and 79%) was achieved by
allowing 3 or 4 to react with acetic anhydride in pyridine.143 The successful incorporation
of the acetyl group was confirmed by the inclusion of a 3-proton singlet in each of the 1H
NMR spectra corresponding to the acetyl methyl, and the downfield shift of the ring proton
signals caused by the electron-withdrawing nature of the protecting group. However, when
an analogous process was attempted for preparation of the 1-O-chloroacetyl derivatives (21
and 22), it proved unsuccessful. After 16 hours of reaction the mixture had solidified and
by dissolving in methanol, analysis by TLC showed no desired product. Instead, these
derivatives were prepared using 2M sodium hydroxide solution and chloroacetyl
Chapter 2: Synthesis of Hydroxycinnamoyl Esters
24
chloride.144 This process had to be optimised as the original procedure employed a large
volume of sodium hydroxide solution which was found to promote degradation of the
chloroacetyl chloride. Therefore it was determined that the hydroxycinnamic acid should
be dissolved in a minimal amount of sodium hydroxide solution, aided with sonication,
followed by addition of chloroacetyl chloride which afforded 21 in 35% yield and 22 in
65% yield. The yields were diminished by the inability to successfully separate 21 or 22
from 3 or 4, as only the initial recrystallisation yielded pure product with subsequent
recrystallisation attempts yielding mixtures of the product and the free acid (3 or 4).
Characterisation of 21 and 22 by 1H NMR showed the inclusion of a 2-proton singlet at
approximately 4.6 ppm in accordance with the literature data.144-145
These aforementioned processes gave four different derivatives for each hydroxycinnamic
acid (free acids 3 and 4, 1-O-benzyl protected 15 and 16, 1-O-acetyl protected 19 and 20
and 1-O-chloroacetyl protected 21 and 22) which would be used in the synthesis of the
target glucose and tartrate esters, as well as 11 and 12 which could be used directly in later
fermentation experiments.
2.2 Synthesis of Hydroxycinnamoyl Tartrate Esters.
2.2.1 Introduction to Tartrate Ester Synthesis
While the existence of tartrate esters in grapes and wines has been widely researched, the
synthesis of tartrate conjugates has received less attention. Synthetically, they are mostly
built as di-conjugates but because of the prevalence of mono-esterified tartrates in grapes it
has become desirable to synthesise mono-esters.146-147 The synthesis of mono-esterified
tartaric acid conjugates has been reported on only a few occasions, but all follow a similar
path. The esterification of dibenzyl tartrate with either the acid in the presence of
trifluoroacetic anhydride, 148-149 or DMAP and DCC,150-151 or with an acid chloride,152 was
followed by removal of the benzyl groups via hydrogenolysis (Scheme 2.2).

Chapter 2: Synthesis of Hydroxycinnamoyl Esters
25
HO
COOBnHO
COOBnCOOH
OR
OR
DMAP, DCCor
TFAA
HO
COOBnO
COOBn
R = H, Me, Pri
OOR
OR
H2, Pd/C
HO
COOHO
COOHOOR
OR
HO
COOBnHO
COOBn COCl
OMe
OMe
Et3N, DMAP
Scheme 2.2: Literature syntheses of mono-esters of tartaric acid.
The only reported syntheses of hydroxycinnamoyl tartrates are that of chicoric acid, or
dicaffeoyl tartrate (Scheme 2.3). Scarpati and Oriente managed the preparation of chicoric
acid through reaction of tartaric acid and the acid chloride of caffeic acid protected as a
cyclic carbonate (Pathway A),153 and many other methods for esterification directly from
tartaric acid have been utilised.147 However, the polarity of the products would provide
limited methods by which the mono- and di-esters could be separated. In the preparation of
di-esters the issue of purification can be simplified by reacting with an excess of the
hydroxycinnamate and avoiding the formation of the mono-ester, this would not be the
case when attempting to produce mono-esters alone. As such, protection of the tartaric acid
moiety is required to simplify the handling of the esterified products.
Zhao and Burke described the preparation of chicoric acid by reaction of diacetyl caffeoyl
acid chloride and di-tert-butyl tartrate, followed by treatment with trifluoroacetic acid to
remove the tert-butyl groups, and mild acid hydrolysis of the acetyl groups to yield the
desired product (Pathway B).143 However, the synthesis described by Lamidey et al.
employs a synthetically simpler starting tartrate derivative and a single protecting group,
removing the need for a two-step deprotection.154
Esterification of dibenzyl caffeic acid with dibenzyl tartrate in the presence of 1-(3-
dimethylaminopropyl)-3-ethylcarbodiimide hydrochloride and DMAP yielded the
hexabenzyl-protected chicoric acid (Pathway C). Removal of the benzyl ethers and esters
was achieved in a single step via hydrogenolysis in the presence of triethylsilane and

Chapter 2: Synthesis of Hydroxycinnamoyl Esters
26
triethylamine. While these examples describe the preparation of a di-ester, and the exact
procedures may not be useful in synthesising mono-esters, at the very least they provide
evidence as to the conditions under which the hydroxycinnamoyl esters are, and will be,
stable.
HO
COOBnHO
COOBn
O
OBn
OBn
R'O COOBn
COOBnR'O
R'''OH Et3SiH, Pd(OAc)2, Et3N
HO
COOHHO
COOH
O
O
O
O
R''' =
O
OH
OHR =
R' =
R'ClR''O
R''O
O
O
O
80% Acetic acid
RO COOH
COOHRO
HO
COOButHO
COOBut R'''O COOBut
COOButR'''O
1) TFAA
R''Cl
O
OAc
OAcR'' =
2) HClPathway B)
Pathway A)
Pathway C)
Chicoric acid
Scheme 2.3: Literature syntheses of chicoric acid.
2.2.2 Synthesis of Hydroxycinnamoyl Tartrate Esters
The method by which all of the mono-esters have been created, utilising dibenzyl tartrate,
has also been employed in the production of chicoric acid, and was utilised here in the
synthesis of requisite hydroxycinnamic acid esters (7 and 8). Protection of L-tartaric acid
(23) with benzyl alcohol in the presence of p-toluenesulphonic acid proceeded smoothly in
excellent yields (94%). Esterification of dibenzyl L-tartrate (24) with acids 15 or 16
catalysed by trifluoroacetic anhydride yielded the tri-benzyl protected L-tartrate esters (25
and 26). Furthermore, flash chromatography gave two fractions, one of the pure mono-

Chapter 2: Synthesis of Hydroxycinnamoyl Esters
27
esters and a second consisting largely of the di-esters (27 and 28) with only minor co-
elution of the mono-esters.
Formation of the mono-esters was confirmed by the unsymmetrical nature of the tartrate
proton shifts and the downfield shift of H2’, while the undesired di-esters were identified
by a symmetrical tartrate as outlined in the literature,143, 154 a downfield shift of the tartrate
H2’ and H3’ shifts from 4.63 ppm observed in 24 to approximately 5.9 ppm corresponding
to formation of the desired ester functionality, and a 1:1 ratio between hydroxycinnamoyl
and tartrate shifts. The di-esters were not fully purified, with 1H NMR data extracted from
the crude mixture and simply compared with that for benzyl protected chicoric acid as
reported by Lamidey,154 to explain the reduced formation of the mono-esters.
OH
O
BnO
R
15 R = H16 R = OCH3
O
O
BnO
R
COOBn
COOBn
OHR'O
BnOOC COOBn
OR'
25 R = H (47%)26 R = OCH3 (50%)
27 R' = 15 28 R' = 16
+
HO
COOHHO
COOH
BnOH/p-TsOH
HO
COOBnHO
COOBn
23
24 (94%)
+
TFAA
Scheme 2.4: Synthesis of benzylated hydroxycinnamoyl tartrate esters.
Removal of the benzyl groups by hydrogenolysis was first attempted as described by
Galland et al. for 1-O-benzyl-caffeoyl glucose,142 using 1,4-cyclohexadiene as the proton
donor, but when attempted on 26 this method resulted in reduction of the double bond in

Chapter 2: Synthesis of Hydroxycinnamoyl Esters
28
preference to debenzylation to give 29, as determined by the loss of the alkene proton
shifts in the proton spectrum and the appearance of saturated alkane shifts between 2.84
and 2.48 ppm. The characterisation of multiple reduced hydroxycinnamate derivatives
show all signals for the alkane protons observed in the region of 2.5 to 3.1 ppm.155-158 In
addition, minor shifts due to this second tartaric acid derivative were observed, moving
upfield from those corresponding to 26. Furthermore, limited debenzylation was suspected
as the entire reaction mixture was soluble in chloroform-d, which is not expected for the
desired products (7 and 8).
A subsequent attempt using triethylsilane as a more mild hydrogen donor,154 again resulted
in reduction of the double bond, though concomitant debenzylation also occurred affording
30, which was characterised by a further downfield shift of the tartrate proton shifts and the
loss of the signals corresponding to the benzyl moieties. Altering the stoichiometry of the
reactants showed evidence of the desired product, but only in very small quantities, and not
consistently. In conclusion, the use of benzyl protection was an insufficient method for
consistent and reproducible production of the desired hydroxycinnamoyl tartrates, thus an
alternative approach was investigated.
O
O
BnO
H3CO
COOBn
COOBn
OH
1) 1,4-cyclohexadiene, Pd/C2) Et3SiH, Pd/C
O
O
HO
H3CO
COOH
COOH
OH
29 30
+
26
O
O
BnO
H3CO
COOBn
COOBn
OH
Scheme 2.5: Attempted debenzylation procedures.
In a similar fashion to Zhao or Lamidey et al. the synthesis of the tartrate esters was
attempted using di-tert-butyl tartrate (34). However, due to the cost of the starting material
it was synthesised rather than purchased.

Chapter 2: Synthesis of Hydroxycinnamoyl Esters
29
The use of 34 was described by Uray and Lindner including details of the conversion of di-
O-acetyl tartaric acid (32) to 34 using an undesirable reagent, isobutylene.159 The use of
gaseous isobutylene was avoided by Wright et al., who reported a method for the in-situ
formation of isobutylene from the acid-catalysed dehydration of tert-butanol.160 A review
of tartrate synthesis by Syndoradzki et al. outlined the procedure for synthesis of 32, which
proceeded through di-O-acetyl tartaric anhydride (31).146
O
AcO
AcO
O
O
COOH
COOH
AcO
AcO
COOH
COOH
HO
HO
COOBut
COOBut
AcO
AcO
COOBut
COOBut
HO
HO
SOCl2, t-BuOH
23 31 (82%) 32 (99%) 33 (49%)
34 (29%)
AcCl H2O
KOH
Scheme 2.6: Synthesis of di-tert-butyl tartrate.
Procedures for the preparation of 31 are well known,161-163 though under these conditions,
one study noted the formation of 32 directly. Barros et al. reported the formation of 32
directly, without first yielding 31, and furthermore was characterised in deuterated
chloroform, in which 32 was found to be insoluble, unlike the anhydride.162 Here, 31 was
achieved in 82% yield, but the simplicity of the proton NMR led to ambiguity. The 1H
NMR spectra of 31 and 32 (run in acetone-d6) both display only a shift for the CH protons
at either 6.17 and 5.72 ppm and a shift for the acetyl protons at 2.19 or 2.11 ppm,
respectively, and differ slightly between solvents.161-163 As such, the formation of 31 was
confirmed via determination of the melting point, with the literature value differing by
around 20 oC to that of 32. Preparation of 32 was achieved through stirring with 2
equivalences of water in acetone, though recommendations are for the use of water alone
to ring-open the anhydride,146 it was discovered however, that reacting in an organic
solvent with minimal water lead to a more simple work-up. Concentration followed by
trituration with hexane gave 32 as a white solid in 99% yield after removing excess water
in vacuo.

Chapter 2: Synthesis of Hydroxycinnamoyl Esters
30
Installation of the tert-butyl ester functionality was successful on small scales using the
method of Wright, but yields diminished as the scale of the reaction was increased.
Nonetheless, this proved superior to another method which involved first producing the di-
acid chloride and reacting with tert-butanol,161-162 which tended to cause dehydration of 32
with concomitant formation of 31. In the preparation of 33, mono-O-acetyl di-tert-butyl
tartrate was produced as a minor product, which could also be used in the subsequent
deacetylation. Initially, the two products were separated for characterisation, though a
subsequent synthesis used a mixture of the two for the following reaction.
Uray describes the use of potassium hydroxide to deacetylate 33, although the amount of
potassium hydroxide required proved less than reported.159 The literature procedure
involves a larger amount of potassium hydroxide and a very quick reaction time, though
the reaction was much more controllable with smaller amounts of potassium hydroxide for
a longer period. Minor amounts of tert-butyl methyl tartrate was isolated during
purification and characterised by 1H NMR, with the data corresponding to that previously
reported.159 Presumably upon addition of potassium hydroxide to the reaction mixture a
portion of the methanol was deprotonated and the resulting methoxide was responsible for
the replacement of a tert-butyl group for a methyl ester.
Synthesis of 35 or 36 was achieved by converting the hydroxycinnamate to the acid
chloride, and then reacting with 34, but this could only be achieved for hydroxycinnamates
with phenolic protection (19-22).
OH
O
AcO
RO
O
AcO
1) SOCl2
19 R = H20 R = OCH3
R
2) Pyridine, 34
35 R = H (31%)36 R = OCH3 (48%)
COOBut
COOBut
OH
Scheme 2.7: Esterification of hydroycinnamic acids and di-tert-butyl tartrate.
Preparation of 35 and 36 was achieved in relatively good yields, with minor formation of
the di-ester, which could be lessened by using a greater excess of 34. The unreacted 34 was
easily recovered during flash chromatography of the reaction mixture, eluting with 10%

Chapter 2: Synthesis of Hydroxycinnamoyl Esters
31
EtOAc/X4 while 35 and 36, with similar Rf values, eluted with 20-30% EtOAc/X4.
Interestingly, the di-esters displayed higher Rf values by TLC, but eluted after the mono-
esters from flash chromatography, which is presumably an effect caused by the differences
in the silica gel used during flash chromatography and that on the TLC plates. However,
purification with flash chromatography provided adequate separation of 35 and 36 from the
di-esters to obtain pure samples, with the mixtures analysed by 1H NMR to confirm the
presence the di-esters. While the data is not shown, the di-esters exhibited the same
hydroxycinnamoyl 1H shifts as 35 and 36, a symmetrical tartrate lacking a free hydroxyl
and integration of all signals confirmed two hydroxycinnamoyl moieties for every tartrate,
as described by Zhao.143
Recrystallisation of 35 and 36 from ethyl acetate/X4 yielded hygroscopic white crystals
which were submitted to X-ray crystallography (Figures 2.1 and 2.2), which confirm
retention of the (R,R)-stereochemistry during preparation of 34 and esterification to afford
35 and 36.
Figure 2.1: Molecular structure and crystallographic numbering scheme for 35.

Chapter 2: Synthesis of Hydroxycinnamoyl Esters
32
Figure 2.2: Molecular structure and crystallographic numbering scheme for 36.
The 1H and 13C shifts of the tert-butyl groups within 35 and 36 were assigned using the
shifts of the previously synthesised tert-butyl derivatives. The 1H tert-butyl shifts of 33
appear at approximately 1.44 ppm, whereas they appear at 1.52 ppm in 34. It was assumed
that the tert-butyl group adjacent to the esterified hydroxyl would possess the upfield shift,
which was confirmed with the tert-butyl shifts for the di-esters appearing at 1.44 ppm.
Attempted deprotection of 35 using a previously described method which employed
trifluoroacetic acid to remove the tert-butyl groups followed directly by acid promoted
deacetylation,143 resulted in the desired product (7), which by 1H NMR analysis was shown
to exist in a mixture with other p-coumaroyl tartrate derivatives. Four components were
observed all possessing overlapping signals corresponding to a p-coumaroyl moiety bound
to tartaric acid, which was rationalised by the formation of tartaric acid sodium salts during
work-up. Purification using reverse-phase chromatography was unsuccessful as all
components co-eluted, and in an attempt to protonate the sodium salts the mixture was
taken up in methanol, the pH adjusted to 1 (2M HCl solution) and stirred at room
temperature for 16 hours, which was unsuccessful as shown by 1H NMR analysis.
Furthermore, the use of acetyl protection in the synthesis of hydroxycinnamoyl tartrates
was discontinued when it was discovered that removal of these groups within the glucose
esters (54 and 55, described in a later section), which was performed concurrently, was not
possible while retaining the hydroxycinnamoyl ester linkage.
Utilising a more labile phenolic protection strategy the 1-O-chloroacetyl derivatives, 21
and 22, were esterified with 34, yielding the chloroacetylated products 37 and 38. During

Chapter 2: Synthesis of Hydroxycinnamoyl Esters
33
purification of 38 with flash chromatography, a second compound (of lower Rf) was
isolated and identified as 40, having undergone phenolic deprotection under the reaction
conditions. To test the efficacy of the dechloroacetylation, the p-coumaroyl analogue (37)
was dissolved in 1:1 pyridine/benzene and stirred at room temperature for 24 hours.
Concentration and separation by flash chromatography, gave an approximate 60:40 ratio of
39:37.
For the following esterification attempts reaction times were increased, which gave 39 and
40 as the major products (19 and 28% yields), with some 37 and 38 remaining (11 and
6%). This reaction was not further optimised, as it gave the desired products in acceptable
yields, and further deprotection of the chloroacetylated compounds under the same
conditions could be achieved.
Recrystallisation of 39 and 40 in an analogous manner to 35 and 36 yielded white solids,
which were not suitable for X-ray crystallography, and though the microanalysis of 40 was
within acceptable limits, the hygroscopic nature of the compounds resulted in incorrect
microanalytical data for 39. Nonetheless, the crystallographic data and optical rotations of
35 and 36 and the microanalysis of 40 achieved under the same conditions, along with the
similar 1H and 13C spectra, optical rotations and expected high resolution accurate mass
determination strongly support the structure of 39 and 40.
Deprotection of 39 and 40 was achieved using trifluoroacetic acid, concentrated and
purified with reversed-phase chromatography.143 The crude product was dissolved in
methanol and loaded onto a pre-packed 4 g C18 cartridge which was washed with
water/formic acid (99:1) and 7 and 8 eluted with water/acetonitrile/formic acid (69:30:1).
Concentration of the fractions containing only pure product yielded 7 and 8 which could be
used directly in fermentation experiments, described in Chapter 5.

Chapter 2: Synthesis of Hydroxycinnamoyl Esters
34
OH
O
ClAcO
R
O
O
ClAcO
1) SOCl22) Pyridine, 34
21 R = H22 R = OCH3
R
37 R = H (30%)38 R = OCH3 (34%)
COOBut
COOBut
OH
O
O
HO
R
40 R = OCH3 (24%)
COOBut
COOBut
OH
+
O
O
HO
R
7 R = H (82%)8 R = OCH3 (41%)
COOH
COOH
OH
TFA, C18-RP chromatography
37 R = H (11%)38 R = OCH3 (6%)
39 R = H (19%)40 R = OCH3 (28%)
Reacted for 16 hours
Reacted for 45 hours
Scheme 2.8: Synthesis of hydroxycinnamoyl tartrate esters.
2.3 Synthesis of Hydroxycinnamoyl Glucose Esters.
2.3.1 Introduction to Glucose Ester Synthesis
Glycosylation methods have been extensively studied, and also widely reviewed in books
and journal articles,164-170 including specific articles discussing effects that control
glycosylation such as the anomeric effect.171

Chapter 2: Synthesis of Hydroxycinnamoyl Esters
35
Previous attempts in this research group to synthesise glucose conjugates, have taken
advantage of a modified Koenigs-Knorr reaction. Again, since the original publication
which employed glucopyranosyl bromide, and silver carbonate in the presence of the
alcohol to achieve glycosylation,172 this reaction has been modified and improved, and
these advancements have also been reviewed numerous times.173-175
Glucosylation has been achieved via pivaloyl or acetyl protection of glucose followed by
activation of the glucosyl donor via installation of anomeric bromine (Scheme 2.9).175-177
The glucose ether linkage was created using silver triflate as a catalyst, followed by
removal of glucosyl protecting groups under basic conditions. However, the synthesis of a
glucose ester differs slightly to that of a glucoside due to the ease of hydrolysis of the ester
linkage under the basic conditions required to remove the glucosyl protection.
OR1OR1O
R1OBr
OR1
OR1OR1O
R1O
OR1
OR2
R2OH, 2,6-lutidine
AgOTf, CH2Cl2
R1 = Ac, Piv
Scheme 2.9: Modified Koenigs-Knorr reaction conditions employed within this research
group.
This procedure was employed for glycosylation of hydroxycinnamic acids by the current
author using acetyl glucose protection, which could not be removed with the glucose ester
linkage remaining intact,178 even though Birkofer et al. has reported the use of acetyl
protection on both the glucosyl hydroxyls and on the phenol to achieve hydroxycinnamoyl
glucose esters.179 To ensure consistent and adequate yields for the target esters, a different
protecting group was needed for the glycosyl protection in order to achieve synthesis of
hydroxycinnamoyl glucose esters.
The use of the chloroacetyl group in carbohydrate synthesis was first described by
Bertolini and Glaudemans which provides an alternative to the acetyl group in that the
former can be removed under more mildly nucleophilic conditions due to the decreased
electron density of the carbonyl carbon caused by the electron withdrawing nature of the
chlorine.180 Chloroacetyl protection was utilised by Ziegler and Pantkowski to prepare
cinnamic and hydroxycinnamic acid esters via numerous modified Koenigs-Knorr

Chapter 2: Synthesis of Hydroxycinnamoyl Esters
36
glycosylations (Scheme 2.10).144 The glycosylation attempts, with either cinnamic acid (i)
or 3,4,5-trimethoxybenzioc acid (ii ), gave 51-58% of a mixture of α- and β-glucose ester
(77-81% α-ester) using a glucosyl fluoride in the presence of boron trifluoride etherate
(Method 1). Purification of the crude mixtures afforded 39% of the α-anomer and 27% of
the α-anomer for reactions i and ii , respectively. Using chloroacetyl protected
galactopyranosyl bromide and the silver carboxylate yielded 70% of the β-galactose ester
(Method 2). However, improving on either selectivity for the β-anomer (over method 1) or
simplicity of reaction (eliminating light sensitive reagents in method 2), the use of a
glucopyranosyl trichloroacetimidate in the presence of cinnamic acid and trimethylsilyl
trifluoromethanesulfonate (TMSOTf) resulted in a 75% yield with a ratio of 92:8 β:α-
glucose ester (Method 3).
O
OAcCl
ClAcOClAcO
ClAcO O CCl3
NH
O
OAcCl
ClAcOClAcO
ClAcOF
O
ClAcO
BrClAcO
ClAcO
OAcCl
O
OAcCl
ClAcOClAcO
ClAcO
O
OAcCl
ClAcOClAcO
ClAcO
O
ClAcO
OC(O)RClAcO
ClAcO
OAcCl
O
OAcCl
ClAcOClAcO
ClAcO
O
OAcCl
ClAcOClAcO
ClAcO
O
ClAcO
ClAcO
ClAcO
OAcCl
OC(O)R
OC(O)R
OC(O)R
OC(O)R
OC(O)R
RCO2H
RCO2H
RCO2Ag
75% 8:92 (α:β)
i) R = cinnamic acid, 58% crude, 81:19 (α:β)ii) R = 3,4,5-trimethoxybenzoic acid, 51% crude, 77:23 (α:β)
70% 0:100 (α:β)
Method 1)
Method 2)
Method 3)
Scheme 2.10: Glycosylation reactions of Ziegler.
The trichloroacetimidate glycosylation method was developed by Schmidt and involved
preparation from trichloroacetonitrile under basic conditions.181 This method has been
explored in great detail appearing as book chapters authored or co-authored by Schmidt.168-
169 The trichloroacetimidate method, along with chloroacetyl protection was implemented
by Galland to synthesise caffeoyl glucose esters which were used for co-pigmentation
studies in wines (Scheme 2.11).142

Chapter 2: Synthesis of Hydroxycinnamoyl Esters
37
Sieves, AgOTf
HO O
OBn
OBn
O
OAcCl
ClAcOClAcO
ClAcO
O
O
OBn
OBn
1) Pyridine, water
2) 1,4-cyclohexadiene, Pd/C
O
OH
HOHO
OH
O
O
OH
OH
O
OAcCl
ClAcOClAcO
ClAcOO CCl3
NH
Scheme 2.11: Glycosylation method described by Galland.
While Galland employed silver triflate to catalyse the glycosylation, Ziegler utilised
trimethylsilyl triflate, as is outlined by numerous examples in Preparative Carbohydrate
Chemistry,169 which removes the need for the reaction to be carried out in the dark. This
minor change aside, preparation on the glucosyl donor via chloroacetylation, anomeric
deprotection and activation through preparation of trichloroacetimidate via previously
described methods,142, 144, 180-181 along with the phenolic protection strategies of Galland to
give the protected glucose esters, deprotection was expected to yield p-coumaroyl and
feruloyl glucose esters (9 and 10).
2.3.2 Synthesis of Hydroxycinnamoyl Glucose Esters
Formation of 41 was achieved by addition of chloroacetylchloride (46) to D-glucose
yielding an approximate 55:45 mixture of α-:β-41 after purification and in excellent yields
(91%). Subsequent preparation of 42 gave some residual unreacted 41 solely as the α-
anomer, from which it could be seen by 1H NMR that the shifts for the chloroacetyl groups
are not singlets, as previously reported,142, 182 but distorted AB quartets. This effect is
displayed as a large central signal representing the overlapping inner lines, with very minor
outer lines which when obscured leaves only the single signal corresponding to the inner
lines.

Chapter 2: Synthesis of Hydroxycinnamoyl Esters
38
One chloroacetyl group in α-41 showed separated inner lines, appearing as two singlets, as
the satellite peaks were unresolved from other shifts and the coupling in the distorted
doublets cannot be determined. This effect is difficult to observe in a spectrum of both
anomers, possibly why the previous reports give a two proton singlet for each chloroacetyl
group.142, 182 In the experimental section (Chapter 6) the chloroacetyl shifts are referred to
as apparent singlets (app. s) as they are technically highly distorted pairs of doublets where
the coupling cannot be sufficiently determined.
In the purification of 41 or 42 both anomers largely co-eluted on column chromatography,
and appeared as one spot by TLC. However, the α-anomer did elute slightly before the β-
anomer, meaning that discarded fractions containing one anomer and an impurity could
alter the anomeric ratio which, if important to the synthesis, should be determined prior to
the final purification.
Preparation of 42 gave a 55% yield with an anomeric ratio of 70:30 (α:β) as expected,182
but subsequent synthesis of 43 did not give the pure α-anomer as was reported by
Galland.142 Instead 43 was isolated in a 2:1 ratio (α:β), supporting the findings of Ziegler,
having isolated a 2.6:1 mixture of α:β-anomer.144 The anomers of 43 possess different Rf
values by both TLC and flash chromatography, and as such the β-anomer, eluting second,
could potentially be mistaken for a by-product and discarded. Furthermore, 43 undergoes
hydrolysis, as shown by Skouroumounis,174 and it is was found that the β-anomer was
hydrolysed preferentially to the α-anomer, with the hydrolysis product eluting between the
α- and β-43. From column chromatography the order of elution is α-43, the hydrolysis
product, then β-43.

Chapter 2: Synthesis of Hydroxycinnamoyl Esters
39
O
OAcCl
ClAcOClAcO
ClAcO
O
OAcCl
ClAcOClAcO
ClAcO
O
OAcCl
ClAcOClAcO
ClAcO
Hydrazine acetate
Cl3CCN, DBU
41 (91%, 55:45 α:β)42 (55%, 70:30 α:β)
43 (75%, 67:33 α:β)
Sieves, TMSOTf
O
OH
HOHO
HO OHOAcClOH
O CCl3
NH
OHO
R1
O
OAcCl
ClAcOClAcO
ClAcO
O
O
R1
R2
ClAcCl, pyridine
15 R1 = OBn, R2 = H16 R1 = OBn, R2 = OCH347 R1 = H, R2 = H
R2
+
44 R1 = OBn, R2 = H (52%)45 R1 = OBn, R2 = OCH3 (54%)48 R1 = H, R2 = H (54%)
Scheme 2.12: Synthesis of 1-O-benzyl hydroxycinnamoyl glucopyranoses.
The glycosylation procedure was initially trialled with cinnamic acid (47) with the desired
product, 48, isolated in 54% yield and possessing a distinct 1H NMR shift for the anomeric
proton, with a coupling constant of 8.2 Hz supporting production of the β-ester and
matching the literature data.144 While synthesis of 48 proved useful in confirming the
efficacy of the glycosylation technique and determining the stoichiometric conditions, the
lack of phenol functionality meant that it was not useful in confirming the entire synthetic
pathway due to the inability to investigate phenolic deprotection strategies. However,
synthesis of a single anomer of 48 allowed for confirmation of the AB quartet nature of
some chloroacetyl protons (Figure 2.3). The inner lines at 4.03 and 4.04 ppm corresponded
with satellite peaks at 3.99 and 4.08 ppm, giving 4.05 and 4.02 ppm doublets with 14.5 Hz
coupling.

Chapter 2: Synthesis of Hydroxycinnamoyl Esters
40
Figure 2.3: 1H proton NMR spectrum of the chloroacetyl protons in 2,3,4,6-O-
tetrachloroacetyl-β-D-glucopyranosyl cinnamate (48).
Synthesis of 44 and 45 gave very similar yields to the cinnamate (48), and the formation of
the β-esters was confirmed by the shift of the anomeric proton signal from 6.60 ppm (3.7
Hz) and 5.94 ppm (7.6 Hz) observed for 43, to a single signal at 5.91 ppm possessing an
8.2 Hz coupling constant corresponding to the 1,2-trans conformation of the sugar.
However, debenzylation in the presence of the α,β-double bond was investigated
concurrently during the synthesis of the hydroxycinnamoyl tartrate esters (7 and 8,
described above) and due to those findings 44 and 45 were not used further in the
production of the glucose esters.
Glucosylation using 3 and 4 gave inadequate yields of 49 and 50 which co-eluted with a
sugar impurity from column chromatography. In one instance 50 was prepared as a pure
compound, though the outcome of the reactions were inconsistent with 49 only being
achieved as a mixture of compounds identified based on the 1H NMR spectra, of which the
data for 50 matched that later reported by Zhu and Ralph.183
Regardless, impure 49, as well as 48 and 50, were deprotected followed by attempted
purification on XAD-2, which proved insufficient. Although multiple purification attempts

Chapter 2: Synthesis of Hydroxycinnamoyl Esters
41
using XAD-8 resin provided separation of the desired products and the 6-O-chloroacetyl-
β-D-glucopyranose derivatives (51 and 52) which were identified by the 1H NMR
characterisation of 51 alone.
43, Sieves, TMSOTf
OHO
OH
R
O
OAcCl
ClAcOClAcO
ClAcO
O
O
OH
R
3 R = H4 R = OCH3
49 R = H (29% crude)50 R = OCH3 (39%)
Pyridine, water
O
OH
HOHO
OH
O
O
OH
R
O
OH
HOHO
OH
O
O
OH
R
9 R = H10 R = OCH3
cis-9 R = H (33% both isomers)cis-10 R = OCH3 (20% both isomers)
XAD-8
O
OAcCl
HOHO
OH
O
O
OH
R
51 R = H (25%)52 R = OCH3
+
O
OH
HOHO
OH
O
O
OH
R
trans-9 R = Htrans-10 R = OCH3
+
Scheme 2.13: Synthesis of glucose esters with free hydroxycinnamic acids.
Compounds 9, 10 and 53 were isolated with minor impurities where the excess signals
were attributed to only a single compound as indicated by 1H NMR integration. By
identifying the distinct ring coupling present in 10, the presence of a β-anomeric proton
signal consistent with a glucose ester, and coupling constants of 13.0 Hz for the α,β-
doublets, led to identification of the impurity as cis-10. Upon investigation of the literature,

Chapter 2: Synthesis of Hydroxycinnamoyl Esters
42
the changes in 1H signals between trans-10 and the impurity were consistent with that
observed between cis- and trans-ferulic acid (4)184 and between cis- and trans-ethyl
ferulate (12)185 supporting the presence of the cis-isomer, which was also found to be the
case for 9 and 53 (Figure 2.4).
From the work of Kahnt,186-187 isomerisation was determined to be a result of exposure to
ultra-violet radiation during purification. However, the nature of ambient light conditions
that 9, 10 and 53 were exposed to indicated that photoisomerisation was not limited to
ultra-violet light and exposure to laboratory lighting would also induce this effect. Isomeric
ratios differed slightly between glucose esters, but were in the vicinity of 4:1 (trans:cis).
Figure 2.4: NMR spectrum of isomerised glucose esters. a) cis/trans-Feruloyl glucose (10).
b) cis/trans-Cinnamoyl glucose (53).
Furthermore, photoisomerisation was limited to 9, 10 and 53, and not experienced during
the synthesis of any other hydroxycinnamate derivative. As a precaution further synthetic
attempts towards 9 and 10 were conducted under red light while further investigation into
the photoisomerisation is outlined in Chapter 4. While 9 and 10 could be synthesised
directly from 3 and 4 without employing phenolic protection, the yields were lower than
desired and unpredictable enough to warrant further investigation into the use of phenolic
protection to develop a reproducible and reliable method of synthesis.

Chapter 2: Synthesis of Hydroxycinnamoyl Esters
43
The use of 19 and 20 in glucosylation gave good yields of 54 and 55, but removal of the
acetyl group could not be achieved with retention of glucose ester functionality.
Previously, attempted removal of glucosyl acetates resulted in hydrolysis of the
hydroxycinnamoyl glucose linkage,178 though the use of phenolic acetyl protection was
attempted based on the documented successful removal in the presence of a
hydroxycinnamoyl ester.143, 179
Removal of the glycosyl chloroacetyl groups from 54 in 1:1 pyridine/water failed to
remove the phenolic acetyl group, yielding 56 as evidenced by crude 1H NMR analysis.
Attempted purification on XAD-8 resulted in the appearance of another compound with a
lower Rf value than 56. Partial separation by flash chromatography gave a small amount of
the lower Rf compound which was determined to be 9 by 1H NMR, as well as a mixture of
9 and the original 56. While 56 could only be isolated as a mixture, with subsequent
purification attempts removing some of the residual 9 but also giving slight deacetylation
producing additional 9, the 1H NMR could be assigned by ignoring those signals known to
belong to 9. Removal of all chloroacetyl groups was evident by the glucosyl proton signals
all appearing between 3.86 and 3.38 ppm, indicating the deprotected species, but also
possessing a 3-proton signal at 2.29 ppm and ring proton signals slightly downfield from
those observed in 9, which is consistent with the presence of a phenolic acetyl group.

Chapter 2: Synthesis of Hydroxycinnamoyl Esters
44
43, Sieves, TMSOTf
OHO
OAc
R
O
OAcCl
ClAcOClAcO
ClAcO
O
O
OAc
R
19 R = H20 R = OCH3
54 R = H (40%)55 R = OCH3 (44%)
XAD-8
O
OH
HOHO
OH
O
O
OAc
1:1 Pyridine/water
O
OAcCl
ClAcOClAcO
ClAcO
O
O
OAc
54
56 (20%)
O
OH
HOHO
OH
O
O
OH
+
9 (4%)
Scheme 2.14: Glycosylation with 1-O-acetyl hydroxycinnamic acids and partial
deacetylation using XAD-8 resin.
While XAD-8 gave minor deprotection of the acetyl group, it was not enough to be an
effective method in which to synthesise 9 and 10, with only trace amounts produced.
Alternative methods for deacetylation included stirring with Amberlite IR-120 (H+
form),188 Amberlite IR-4B (-OH form) and catalytic amounts of triethylamine, which failed
to yield 9, with increasing hydrolysis of the glucose ester bond as the methods became less
mild. As such, preparation of 54 (and 55) was not a viable pathway to 9 (and 10), giving
very small yields through accidental deprotection on XAD-8.
The use of 21 and 22 for glycosylation has been attempted by Ziegler using a glucosyl
fluoride in the presence of boron trifluoride etherate, which gave a moderate yield (51%)
and largely the α-glucose ester (Scheme 2.10). Purification of the mixture gave 27% of the
α-glucose ester, though the use of similar glycosyl acceptors and varying glucosyl donors

Chapter 2: Synthesis of Hydroxycinnamoyl Esters
45
suggests that the preference for production of the α-anomer is a factor of the glucosyl
donor, and the use of 21 with the trichloroacetimidate method might therefore yield largely
the β-anomer, as was seen when used with cinnamic acid. Though the deprotection of this
compound is not reported,144 the phenolic chloroacetyl group was not labile under
glycosylation conditions and was expected to be labile under the same deprotection
conditions used to remove the glucosyl chloroacetates.
Compounds 57 and 58 were prepared in 48 and 64% yield respectively, and were
characterised fully, following which the data reported for the synthesis of 58 by Zhu and
Ralph matches that obtained here.183 Deprotection of 57 and 58 required reaction times that
were 50% longer (6 hours) to remove all five chloroacetyl groups than previously
experienced for the removal of four groups (4 hours, 48-50, 54). Again, a large proportion
of the incomplete reaction mixture existed as the 6-O-chloroacetyl protected species.
Given the large proportion of mono-protected species, and co-elution from XAD-8,
alternative purification attempts included flash chromatography using 1% formic acid/ethyl
acetate, 5% methanol/ethyl acetate and 10% methanol/dichloromethane. The two former
solvent systems resulted in co-elution, the later afforded pure fractions of each, from which
re-reaction of the mono-protected analogues yielded the desired products, 9 and 10. Given
full conversion to 9 and 10, purification by flash chromatography using 5% methanol in
ethyl acetate is a convenient and quick method, but fails to remove the mono-protected
species.
Furthermore, TLC of 9 and 10 in aqueous solvent systems utilised heat to evaporate excess
solvent between applications, which resulted in three spots, which were found to
correspond to the desired product (9 or 10), D-glucose and the aglycone (based on
corresponding Rf values of TLC standards) in varying ratios depending on the amount of
heat applied. The decomposition of the compound on silica by heat could have resulted in
previously purified samples being deemed impure and further purifications attempted. As
such, TLC of the glucose esters should be performed without the use of a heat gun, with
the excess solvent allowed to evaporate at room temperature.
Following an adequate method of purification, a previously pure sample of glucose ester
contained impurities that did not show up by TLC, but as seen by 1H NMR possessed the

Chapter 2: Synthesis of Hydroxycinnamoyl Esters
46
correct shifts to be a hydroxycinnamoyl glucose derivative with ester functionality. The
ratio of the hydroxycinnamate to glucose shifts remained 1:1, but various shifts that were
consistent with anomeric protons in different environments. After investigation of the
literature, the appearance of the extra proton shifts were determined to be caused by acyl
migration, or movement of the hydroxycinnamate onto different glucose hydroxyls, which
was observed to occur to a greater extent in p-coumaroyl glucose than in feruloyl glucose.
In labelling the migrated structures, the attachment to glucose is designated by the
hydroxyl number (1, 2, 3, 4 or 6) and the orientation of the anomeric hydroxyl designated
either α or β.
43, Sieves, TMSOTf
OHO
OAcCl
R
O
OAcCl
ClAcOClAcO
ClAcO
O
O
OAcCl
R
21 R = H22 R = OCH3
57 R = H (48%)58 R = OCH3 (64%)
Pyridine, water
O
OH
HOHO
OH
O
OH
O
OR2
HOHO
R1OOH
R1 = HCA, R2 = H, 2-O-α-esterR1 = H, R2 = HCA, 6-O-α-ester
9 R = H (43% all esters)10 R = OCH3 (20% all esters)
Migration
R
O
HCA = O
OH
R
Scheme 2.15: Glycosylation of 1-O-chloroacetyl hydroxycinnamates, and migration of the
free glucose esters.

Chapter 2: Synthesis of Hydroxycinnamoyl Esters
47
The shifts for the migrated esters (Table 2.1) were assigned using data from Brecker who
studied the migration of glucosyl acetate and formate esters,189 and the main esters
produced, apart from the 1-O-β-esters, are the 2-O-α-esters and the 6-O-α-esters.
However, shifts could be assigned for the 1-O-α-ester and the 3-O-α-ester, as well as
minor production of the corresponding 2/3/6-O-β-esters. In addition to altered positions
and coupling constants for the anomeric protons, the shifts for the proton at the point of
attachment appeared further downfield. Coupling constants of 3.7 Hz corresponded to α-
anomeric hydroxyls, with 7.8-8 Hz for β-anomeric hydroxyls, with the nature of the
aglycone (p-coumaroyl or feruloyl) having no impact on the shifts of the glucose protons.
Table 2.1: 1H NMR shifts for migrated hydroxycinnamoyl glucose esters in CD3OD.
Ester H1' (ppm) H2' (ppm) H3' (ppm) H6a' (ppm) H6b' (ppm)
1-O-αααα 6.21 (d, 3.7 Hz)
1-O-ββββ 5.6 (d, 7.8 Hz)
2-O-αααα 5.33 (d, 3.7 Hz) 4.67 (dd, 10.0 and 3.7 Hz)
2-O-ββββ 4.69 (d, 8.0 Hz) 4.77 (dd, 9.6 and 8.0 Hz)
3-O-αααα 5.14 (d, 3.7 Hz) 4.97 (dd)
3-O-ββββ 4.6 (d, 7.8 Hz) 5.04 (dd)
6-O-αααα 5.08 (d, 3.7 Hz) 4.5 (dd, 11.8 and 2.1 Hz) 4.31 (dd, 11.8 and 5.4 Hz)
6-O-ββββ 4.48 (d, 8.0 Hz) 4.45 (dd, 11.8 and 2.2 Hz) 4.29 (dd, 11.8 and 6.0 Hz)
When the migrated mixtures were submitted to wine-like conditions (10% ethanol, pH of
3.5) the 1-O-β-esters predominated, but attempts at isolation of these gave a mixture of
esters, as determined by 1H NMR. The migration of these esters was studied further
(Chapter 3), although a mixture of esters was used in fermentation experiments (Chapter
5). While the desired 1-O-β-esters should proliferate in the fermentation media, the
evolution of 4-ethylphenol and 4-ethylguaiacol would require metabolism of a
hydroxycinnamoyl glucose ester, regardless of its position of attachment to glucose.
2.4 Conclusions.
Along with ethyl esters (11 and 12), which could be used directly in fermentation
experiments, the synthesised hydroxycinnamoyl derivatives (3, 4, 15, 16, 19-22) were used
to explore a new method for successful synthesis of 7 and 8 for the first time, which can
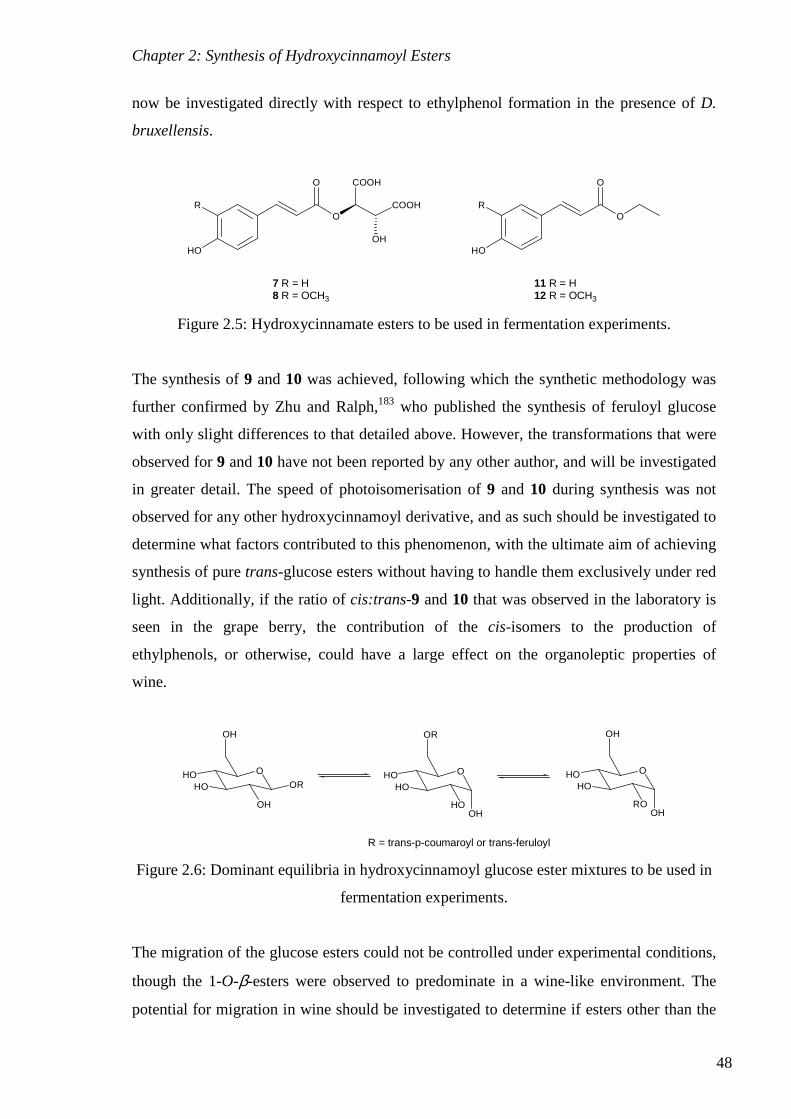
Chapter 2: Synthesis of Hydroxycinnamoyl Esters
48
now be investigated directly with respect to ethylphenol formation in the presence of D.
bruxellensis.
O
O COOH
COOH
OHHO
RO
O
HO
R
11 R = H12 R = OCH3
7 R = H8 R = OCH3
Figure 2.5: Hydroxycinnamate esters to be used in fermentation experiments.
The synthesis of 9 and 10 was achieved, following which the synthetic methodology was
further confirmed by Zhu and Ralph,183 who published the synthesis of feruloyl glucose
with only slight differences to that detailed above. However, the transformations that were
observed for 9 and 10 have not been reported by any other author, and will be investigated
in greater detail. The speed of photoisomerisation of 9 and 10 during synthesis was not
observed for any other hydroxycinnamoyl derivative, and as such should be investigated to
determine what factors contributed to this phenomenon, with the ultimate aim of achieving
synthesis of pure trans-glucose esters without having to handle them exclusively under red
light. Additionally, if the ratio of cis:trans-9 and 10 that was observed in the laboratory is
seen in the grape berry, the contribution of the cis-isomers to the production of
ethylphenols, or otherwise, could have a large effect on the organoleptic properties of
wine.
O
OR
HOHO
HOOH
O
OH
HOHO
ROOH
O
OH
HOHO
OH
OR
R = trans-p-coumaroyl or trans-feruloyl
Figure 2.6: Dominant equilibria in hydroxycinnamoyl glucose ester mixtures to be used in
fermentation experiments.
The migration of the glucose esters could not be controlled under experimental conditions,
though the 1-O-β-esters were observed to predominate in a wine-like environment. The
potential for migration in wine should be investigated to determine if esters other than the

Chapter 2: Synthesis of Hydroxycinnamoyl Esters
49
1-O-β-esters isolated by Baderschneider108 could be present, and if the two p-coumaroyl
hexose esters observed by Monagas100, 131 and Hernandez103 are indeed present in wine and
not products of the analysis, or if additional esters are present that were not observed.
Regardless, 9 and 10 can be submitted to D. bruxellensis to determine their role in the
production of ethylphenols, given that under fermentation conditions they should exist
mainly as the 1-O-β-esters.

Chapter 3: Acyl Migration of Hydroxycinnamoyl Glucose Esters
50
Chapter 3: Acyl Migration of Hydroxycinnamoyl Glucose
Esters.
3.1 Introduction.
Previously (Chapter 2) it was observed that the prepared 1-O-β-hydroxycinnamoyl glucose
esters (9 and 10) underwent acyl migration under acidic conditions to give a range of
undesired mono-hydroxycinnamoyl esters which exhibited alternative glycosyl attachment,
affording largely the 2-O-α- and 6-O-α-esters, in addition to the initial 1-O-β-esters. While
the extent of migration and the ratio of the resulting esters differed between synthetic
attempts, a common factor for production was flash chromatography on silica gel, with no
migration observed during alternative purification attempts.
O
OH
HOHO
OH
O
OH
O
OR2
HOHO
R1OOH
R1 = HCA, R2 = H, 2-O-α-esterR1 = H, R2 = HCA, 6-O-α-ester
O
H+
123
46
123
46
HCA = O
OH
Figure 3.1: Acyl migration in p-coumaroyl glucose.
A similar phenomenon was observed for an S- to O-acetyl group migration occurring for a
furanosyl derivative in the presence of silica (Figure 3.2), which the authors rationalised by
the formation of a pseudo hydrogen bond between the silica and the carbonyl oxygen,
which decreased the electron density around the carbonyl carbon, promoting nucleophilic
attack and allowed for easy migration to the neighbouring oxygen.190 The extent of

Chapter 3: Acyl Migration of Hydroxycinnamoyl Glucose Esters
51
migration was lessened with decreasing activities of silica, which was achieved by
hydrating the silica, reducing the electron accepting abilities. While it was found not to
occur for an O- to O-acetyl migration, this report confirms that silica can promote acyl
migration, which appeared to be the case for 9 and 10.
O
OOSAc
OHHO
O
OOSH
OHAcO
Silica
Figure 3.2: Initial silica catalysed 3-S- to 6-O-migration observed by Whistler et al.
Iddon et al. studied the migration of phenyl acetic acid glucosides under basic conditions,
describing cyclic transition states, and suggested that the speed of migration was largely
related to the stability of the intermediates.191 Migration from the 4-O- to that 6-O-position
proceeded through a 6-membered cyclic intermediate and was found to be much favoured
over those created by nucleophilic attack of the neighbouring hydroxyl groups, which
proceed through a 5-membered intermediate. Similar work by Horrobin et al. investigated
4-O- to 6-O-migrations under acid-catalysed conditions which resulted in the proposal of a
mechanism that proceeded through a cationic cyclic intermediate (Figure 3.3). Again, the
speed of migration was governed by the stability of the intermediate, but the relative ratios
of the products were purely under thermodynamic control.192 Furthermore, the speed of the
4-O- to 6-O-migrations shown by both Horrobin and Iddon rationalise the lack of 4-O-
glucose ester observed in the migrated mixtures of 9 and 10, which can quickly migrate to
the 6-O-position.
OHO
OH
HO
O
OO
R
O
AcO
AcOOAc
O
O
OH
a) b)
H
Figure 3.3: Migration intermediates. a) Base-catalysed 1-O-β- to 2-O-β-migration
intermediate proposed by Iddon et al. b) Acid-catalysed 4-O-α- to 6-O-α-migration
intermediate proposed by Horrobin et al.

Chapter 3: Acyl Migration of Hydroxycinnamoyl Glucose Esters
52
Yoshimoto and Tsuda monitored migrations to and from multiple positions in glucose and
discovered that a direct 1-O- to 6-O-migration was not possible, but occurred in a step-
wise fashion via first a 1-O- to 3-O-, then a 3-O- to 6-O-migration.193 By protecting the 3-
O-position, the previously observed 1-O- to 6-O-migration was inhibited, indicating the
involvement of the 3-O-position in the process. They also documented that the 4-O- to 6-
O-migration occurred rapidly, as did a 1-O-α- to 2-O-transformation, while 2-O- to 3-O-,
3-O- to 4-O- and 4-O- to 2-O-migrations occurred at much slower rates.194 These findings
support the assigned composition of the mixtures for the hydroxycinnamoyl glucose esters
(9 and 10), with rapid migration away from the 4-O-position limiting its presence, while
the ease of 3-O- to 6-O-migration can explain both the prevalence of the 6-O-esters and
limited production of the 3-O-esters. However, Yoshimoto and Tsuda failed to induce a 1-
O-β- to 2-O-migration and claimed that the 1-O-β-ester was stable to migration, in contrast
to the hydroxycinnamoyl glucose esters.194 Furthermore, most of the studies into glucose
acyl migrations have found that migrations to yield the preferred 6-O-esters are largely
irreversible,194-195 which again, is not the case for hydroxycinnamoyl esters, with a
migrated mixture returning to the 1-O-β-ester under wine-like conditions.
As studied in sucrose migrations, Mollinier et al. discovered that basic conditions favoured
the formation of the 6-O-ester, though in acidic conditions the 6-O- as well as the 3-O- and
2-O-esters were produced,196 mimicking that seen for the hydroxycinnamoyl glucoses (9
and 10) which migrated to give the 6-O- and 2-O-esters, with traces of the 3-O-esters
detected. Furthermore, the reported preference for the 6-O-ester under basic conditions
may explain the occurrence of 51 and 52, the 6-O-chloroacetyl derivatives, which were
formed during the deprotection of 49 and 50 to produce 9 and 10, as explained in Chapter
2. It may not be that the 6-O-chloroacetyl is the last group removed, but instead, when a
single chloroacetyl group remains, regardless of the position, migration to the 6-O-position
is promoted under the influence of basic conditions (Figure 3.4).

Chapter 3: Acyl Migration of Hydroxycinnamoyl Glucose Esters
53
OHOHO
OH
OAcCl
OR
OHOClAcO
OH
OH
OR
OClAcOHO
OH
OH
OR
OHOHO
OAcCl
OH
OR
B-
4-O- to 6-O- 3-O- to 6-O-
B-
B- 2-O- to 6-O-
Figure 3.4: Proposed migration of mono-O-chloroacetyl derivatives to the 6-O-position.
The above studies confirm that acyl migrations within glucose derivatives are common,
and can be achieved under acidic or basic conditions, with the conditions playing an
important role in the final products. Largely, the ratios of the products formed are under
thermodynamic control, with the stabilities of the intermediates only determining the speed
at which the final products are formed. If these processes are controlled completely by
thermodynamics, then by mapping the relative stabilities of each possible ester one should
be able to gain an indication as to the potential for the formation of each ester under given
conditions.
A density functional study of acyl migration in formyl nucleosides determined that
mapping a step-wise mechanism was a more valid pathway than a concerted migration, and
that the geometry of the products should be optimised in the desired solvent rather than a
geometry optimisation in a vacuum, followed by a single-point energy calculation in
solvent.197 The use of a step-wise mechanism to study migration supports those proposed
by both Horrobin and Iddon, using a number of cyclic intermediates.191-192
In addition, it was discovered that the energy of migration was lowered by increasing the
polarity of the solvent,197 most likely by stabilising the charge of the intermediates.
However, for the glucose esters (9 and 10) a greater extent of migration away from the 1-
O-β-ester was observed in less polar solvents. Whether this was for kinetic or
thermodynamic reason was initially unclear.

Chapter 3: Acyl Migration of Hydroxycinnamoyl Glucose Esters
54
3.2 Research Aims.
Acyl migrations can occur under acidic, basic and neutral conditions198 which can lead to
the formation of different products.196 The hydroxycinnamoyl glucose esters (9 and 10)
were seen to migrate away from the 1-O-β-esters under acidic non-aqueous conditions and
the resulting mixtures migrated back to the 1-O-β-esters in an acidic aqueous environment
(Chapter 2). The role of thermodynamics has been identified in the literature as the main
factor in determining both if migration will occur and to what extent it will occur under
given conditions,192, 196 while the kinetics of each migration relied on the stability of the
intermediates.191-192
Initially the thermodynamics of migration were studied here in an attempt to determine
why migration occurred, and to justify the ratios of esters observed, including the
propensity for increased migration for the p-coumaroyl glucose system compared with the
feruloyl derivative. Following the findings of Rangelov et al., the equilibrium geometry of
each ester was optimised in the desired solvents, rather than optimising the geometry in a
vacuum and then performing single-point energy calculations in each solvent using the
vacuum optimised geometry common to all.197
Additionally, by applying an analogous mechanism to that described by Horrobin192 the
energy of key intermediates was expected to provide insight into how quickly each
transformation can occur. This should indicate the likely pathway of migration and
whether the ratios obtained experimentally are purely under thermodynamic control, or
whether the kinetics do contribute.
Once the nature of migration is determined, protocols for avoiding, minimising, controlling
or even predicting migration can be developed so that synthesis can be achieved more
simply and without having to characterise and utilise mixtures.
Finally, several analyses have identified two separate hexose esters of p-coumaric acid
without designation of which esters were present.100, 103, 131 If the formation of multiple
esters is found to be possible in wine, then the nature of the esters identified could be
determined, also providing information as to whether multiple esters will need to be
considered during quantification in grapes and wine.

Chapter 3: Acyl Migration of Hydroxycinnamoyl Glucose Esters
55
3.3 Theoretical Studies into Acyl Migration of Hydroxycinnamoyl Glucoses.
3.3.1 Thermodynamics of Migration
Experimentally the 1-O-β-, 2-O-α- and 6-O-α-esters were produced preferentially, though
each of the twenty possible esters (α- and β-anomers for 1-O-, 2-O-, 3-O-, 4-O- and 6-O-
esters, Figure 3.5) need to be considered, not only explain the presence of those that were
seen, but also why others were absent from the “migrated” mixtures.
O
OH
HOHO
OH
O
OH
O
O
OH
HOHO
HOO
O
OH
O
OH
HOHO
O
OH
O
OH
HOHO
OOH
O
O
OH
HOO
OH
OH
O
OH
HOO
HOOH
O O
HO HO
O
OH
OHO
OH
OH
O
OH
OHO
HOOH
OO
HO HO
O
O
HOHO
OH
OH
O
O
HOHO
HOOH
O O
HO HO
O
HO HO
ββββ-D-glucopyranosyl αααα-D-glucopyranosyl
1-O-
2-O-
3-O-
4-O-
6-O-
R
R
RR
R R
R R
R R
9 R = H10 R=OCH3
Figure 3.5: Twenty possible esters of p-coumaroyl glucose (9) and feruloyl glucose (10).
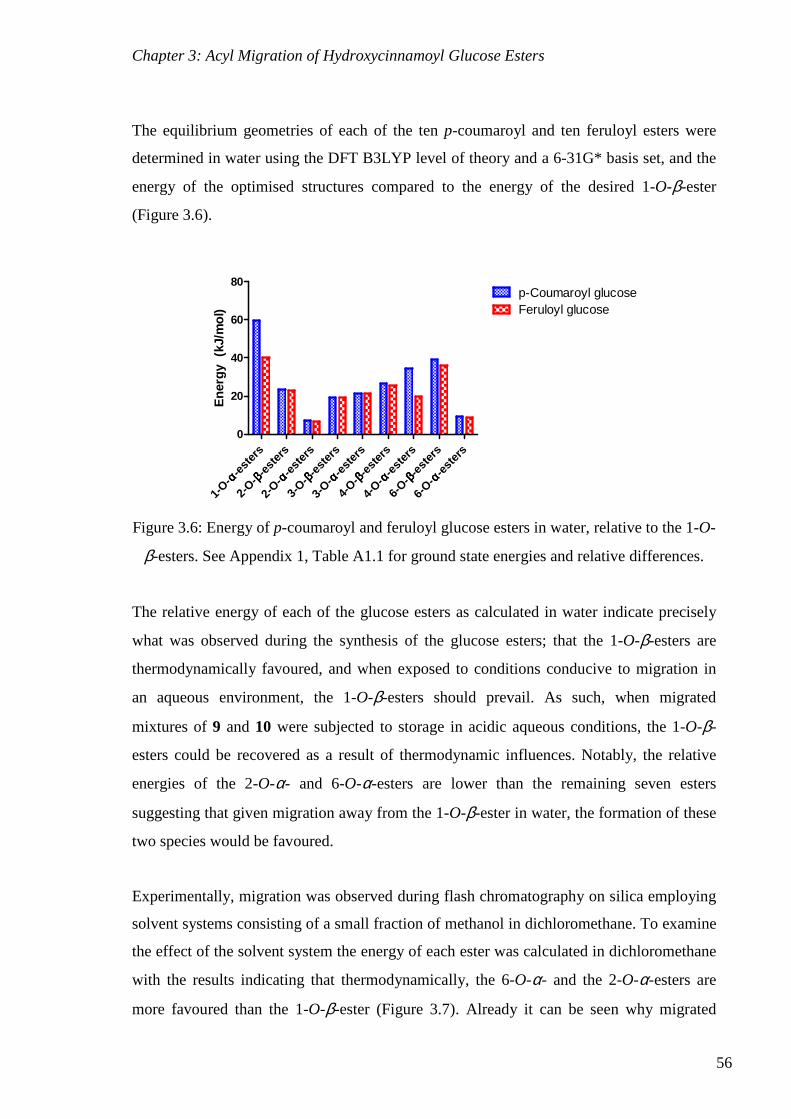
Chapter 3: Acyl Migration of Hydroxycinnamoyl Glucose Esters
56
The equilibrium geometries of each of the ten p-coumaroyl and ten feruloyl esters were
determined in water using the DFT B3LYP level of theory and a 6-31G* basis set, and the
energy of the optimised structures compared to the energy of the desired 1-O-β-ester
(Figure 3.6).
En
erg
y (
kJ/m
ol)
-est
ers
αααα1-
O--e
ster
s
ββββ2-
O--e
ster
s
αααα2-
O--e
ster
s
ββββ3-
O--e
ster
s
αααα3-
O--e
ster
s
ββββ4-
O--e
ster
s
αααα4-
O--e
ster
s
ββββ6-
O--e
ster
s
αααα6-
O-
0
20
40
60
80p-Coumaroyl glucoseFeruloyl glucose
Figure 3.6: Energy of p-coumaroyl and feruloyl glucose esters in water, relative to the 1-O-
β-esters. See Appendix 1, Table A1.1 for ground state energies and relative differences.
The relative energy of each of the glucose esters as calculated in water indicate precisely
what was observed during the synthesis of the glucose esters; that the 1-O-β-esters are
thermodynamically favoured, and when exposed to conditions conducive to migration in
an aqueous environment, the 1-O-β-esters should prevail. As such, when migrated
mixtures of 9 and 10 were subjected to storage in acidic aqueous conditions, the 1-O-β-
esters could be recovered as a result of thermodynamic influences. Notably, the relative
energies of the 2-O-α- and 6-O-α-esters are lower than the remaining seven esters
suggesting that given migration away from the 1-O-β-ester in water, the formation of these
two species would be favoured.
Experimentally, migration was observed during flash chromatography on silica employing
solvent systems consisting of a small fraction of methanol in dichloromethane. To examine
the effect of the solvent system the energy of each ester was calculated in dichloromethane
with the results indicating that thermodynamically, the 6-O-α- and the 2-O-α-esters are
more favoured than the 1-O-β-ester (Figure 3.7). Already it can be seen why migrated

Chapter 3: Acyl Migration of Hydroxycinnamoyl Glucose Esters
57
mixtures of the glucose esters possessed the ratios that they did, with the preferred product
in water, migrating in dichloromethane to give a mixture heavily favouring the formation
of the 2-O-α- and 6-O-α-esters. While very little regarding the relative extent of migration
observed between p-coumaroyl glucose and feruloyl glucose can be explained by the
thermodynamic influences, Figures 3.6 and 3.7 explain the occurrence of different esters
under changing solvent conditions. However, these results suggest that in dichloromethane
complete migration to the 6-O-position would eventuate, and also that the ratios observed
experimentally were under kinetic as well as thermodynamic control. The length of
exposure to dichloromethane, or the kinetics of migration determined the extent of
migration from initially being exposed to dichloromethane to the time of characterisation,
as equilibrium has not yet been established.
En
erg
y (
kJ/m
ol)
-est
ers
αααα1-
O--e
ster
s
ββββ2-
O--e
ster
s
αααα2-
O--e
ster
s
ββββ3-
O--e
ster
s
αααα3-
O--e
ster
s
ββββ4-
O--e
ster
s
αααα4-
O--e
ster
s
ββββ6-
O--e
ster
s
αααα6-
O-
-20
0
20
40
60p-Coumaroyl glucoseFeruloyl glucose
Figure 3.7: Energy of p-coumaroyl and feruloyl glucose esters in dichloromethane, relative
to the 1-O-β-esters. See Appendix 1, Table A1.2 for ground state energies and relative
differences.
To further investigate the role of solvents in determining the thermodynamics of migration
for both 9 and 10, the energy of each of the esters was determined in ethanol (Figure 3.8)
and toluene (Figure 3.9), representing polar non-aqueous and non-polar solvents
respectively, to investigate whether a trend in ester energy with respect to solvent
properties could be established.

Chapter 3: Acyl Migration of Hydroxycinnamoyl Glucose Esters
58
En
erg
y (
kJ/m
ol)
-est
ers
αααα1-
O--e
ster
s
ββββ2-
O--e
ster
s
αααα2-
O--e
ster
s
ββββ3-
O--e
ster
s
αααα3-
O--e
ster
s
ββββ4-
O--e
ster
s
αααα4-
O--e
ster
s
ββββ6-
O--e
ster
s
αααα6-
O-
-20
0
20
40p-Coumaroyl glucoseFeruloyl glucose
Figure 3.8: Energy of p-coumaroyl and feruloyl glucose esters in ethanol, relative to the 1-
O-β-esters. See Appendix 1, Table A1.3 for ground state energies and relative differences.
En
erg
y (
kJ/m
ol)
-est
ers
αααα1-
O--e
ster
s
ββββ2-
O--e
ster
s
αααα2-
O--e
ster
s
ββββ3-
O--e
ster
s
αααα3-
O--e
ster
s
ββββ4-
O--e
ster
s
αααα4-
O--e
ster
s
ββββ6-
O--e
ster
s
αααα6-
O-
-20
0
20
40
60p-Coumaroyl glucoseFeruloyl glucose
Figure 3.9: Energy of p-coumaroyl and feruloyl glucose esters in toluene, relative to the 1-
O-β-esters. See Appendix 1, Table A1.4 for ground state energies and relative differences.
The thermodynamic preference for the 1-O-β-esters only occurred for water, while the
other three solvents studied theoretically show a preference for formation of the 6-O-α-
esters with the 2-O-α-esters closely following. The relative energies in ethanol show not
only a strong preference for the 2-O-α- and 6-O-α-esters, but also suggest that the 3-O-α-
and β-esters are as likely to occur as the 1-O-β-esters. NMR characterisation of the glucose
esters was performed in d4-methanol, and while the effect of methanol on the energies of
the esters could not be studied due to the restraints of the program, it is expected that a
similar trend would be experienced to that calculated for ethanol. As such, any migration
that resulted from exposure to silica in dichloromethane could be compounded by exposure

Chapter 3: Acyl Migration of Hydroxycinnamoyl Glucose Esters
59
to methanol during characterisation. As such, the limited exposure to methanol could have
increased the thermodynamic preference for the 3-O-esters, as well as the 6-O-and 2-O-
esters, and allowed for minor formation of these esters which could be detected in minor
quantities by 1H NMR analysis.
The relative energies shown in Figures 3.6-3.9 show large changes in the energy of every
ester with changing solvent, though this is only a product of plotting the data relative to the
1-O-β-esters. Extracting the data for the p-coumaroyl glucose esters in all four solvents and
plotting the energies relative to the less important 1-O-α-esters furnishes Figure 3.10. The
largest changes in energy between solvents is present for the 1-O-β-esters, indicating that
in different environments, the energies of the other esters does not change to a great extent,
but really only relative to the 1-O-β-esters. The four energies obtained for the 1-O-β-esters
(relative to the 1-O-α-ester) show the greatest variation across the four solvents with
energies of -59.44, -45.53, -34.66 and -51.77 kJ/mol producing a standard deviation of 10.5
kJ/mol. By performing the same analysis for the remaining esters, the 2-O-α-esters
produce a standard deviation of 4.5 kJ/mol, 4.2 kJ/mol for the 2-O-β-esters, 3.9 kJ/mol for
the 4-O-β-esters and the deviations of the remaining esters between 2.2 and 2.9 kJ/mol. A
similar trend can be observed when the data is plotted relative to any ester other than the 1-
O-β, and shows that as the environment moves away from aqueous, the preference for the
1-O-β-esters decreases as opposed to preference for the 2-O-α- or 6-O-α-esters increasing.
En
erg
y (k
J/m
ol)
ββββ1-
O- ββββ2-
O- αααα2-
O- ββββ3-
O- αααα3-
O- ββββ4-
O- αααα4-
O- ββββ6-
O- αααα6-
O-
-60
-40
-20
0DichloromethaneWaterEthanolToluene
Figure 3.10: p-Coumaroyl glucose (9) ester energies calculated in changing solvents,
relative to the 1-O-α-esters. See Appendix 1, Table A1.5 for relative energies and standard
deviations.

Chapter 3: Acyl Migration of Hydroxycinnamoyl Glucose Esters
60
By studying ethanol and toluene in addition to water and dichloromethane, it can be seen
that preference for the 1-O-β-esters is not a product of solvent polarity and these appear to
only be favoured in aqueous environments, with migration to the 2-O-α- and 6-O-α-esters
likely to occur in any solvent other than water. Though formation of other esters may be
favoured, the occurrence of mixtures with differing ratios indicates that equilibrium has not
yet been achieved, and the thermodynamic products will prevail once equilibrium has been
reached. However, instantaneous determination of which esters are present will rely on
both the thermodynamics to determine which esters are being formed and the kinetics to
describe to what extent it has occurred at the time of measurement.
3.3.2 Kinetics of Migration
While base-catalysed migration under some reaction conditions might be expected to a
certain extent, the observed migrations as well as any expected to occur in wine, must be
acid-catalysed, and the lack of free acid seen experimentally in the migrated mixtures
indicate that this is not a case of ester hydrolysis followed by re-attachment, but that the
process is one of intramoleular transesterification. By combining the observations
proposed by Horrobin et al.,192 and that known for an acid-catalysed transesterification, the
mechanism of 1-O-β- to 2-O-β-migration for the p-coumaroyl glucose analogue (9) can be
hypothesised (Scheme 3.1).

Chapter 3: Acyl Migration of Hydroxycinnamoyl Glucose Esters
61
O
O O
HO
O
O
OOH
H
O
OH
OHOH
O
O
OOH
OH
H
O OH
OH
H
O
O O
HO
OH
H
O
OH
O O
OH
Scheme 3.1: Mechanism for acid catalysed 1-O-β- to 2-O-β- acyl migration of p-
coumaroyl glucose (9).
In an acidic environment a pH dependant equilibrium will exist between the protonated
and unprotonated carboxyl oxygen, with the energy difference between the two forms
being of little consequence to the kinetics of the migration. As such, the four cationic
intermediates of interest in mapping the kinetics of this particular migration are given
below (Figure 3.11). While migration has been mapped for the 1-O-β- to 2-O-migration in
p-coumaroyl glucose, a similar mechanism is expected for all those investigated.

Chapter 3: Acyl Migration of Hydroxycinnamoyl Glucose Esters
62
O
O O
OH
O
O
OOH
H
O
OH
OH
HO
OH
HOHO
OH
HOHO
OH
HO
OH
O
O
OOH
OH
HOHO
OH
H
O OH
OH
H
Int. 1 Int. 2
Int. 3 Int. 4
Figure 3.11: Key intermediates (Int. 1-4) for the acid-catalysed 1-O-β- to 2-O-β- acyl
migration of p-coumaroyl glucose (9).
The transformation shown (Scheme 3.1) involves formation of the 2-O-β-ester, though
experimentally the 2-O-α-ester was favoured with very little of the 2-O-β-ester able to be
detected. Ignoring any conversion between α- and β-glucose that could possibly occur
during migration (in an attempt not to complicate the study with concurrent reactions),
migration from the 1-O-β-ester to form the 2-O-α-ester must occur either via mutarotation
before or after migration. Due to mechanistic constraints in mutarotation between the 1-O-
β- and the 1-O-α-ester it is assumed that the migration occurs first, from the 1-O- to the 2-
O-position, followed by mutarotation to convert the 2-O-β- to the 2-O-α-ester. Each four
intermediates (Int. 1-4) were optimised at the B3LYP 6-31G* level and the calculated
energy compared with that of intermediate 1.

Chapter 3: Acyl Migration of Hydroxycinnamoyl Glucose Esters
63
En
erg
y (
kJ/m
ol)
Int. 1 Int. 2 Int. 3 Int. 4
-50
0
50
100
150
DichloromethaneVacuum
Water
Figure 3.12: Energy of the intermediates in 1-O-β- to 2-O-β-p-coumaroyl glucose
migration, relative to intermediate 1. See Appendix 2, Table A2.1 for ground state energies
and relative differences.
Unlike the glucose ester energies calculated in the previous section, the energies of the
migration intermediates were calculated for water and dichloromethane alone, rather than
in all four solvents as were employed above (removing ethanol and toluene).
Experimentally, water and dichloromethane were the most common solvents that the
glucose esters (9 and 10) experienced, having been allowed to react in an aqueous system
and purified in either water/methanol or dichloromethane/methanol. Analogous
intermediates to those used for p-coumaroyl glucose (as shown in Figure 3.11), were used
in calculation of the 1-O-β- to 2-O-β-feruloyl glucose migration (Figure 3.13).
En
erg
y (
kJ/m
ol)
Int. 1 Int. 2 Int. 3 Int. 40
50
100
150
200WaterDichloromethaneVacuum
Figure 3.13: Energy of the intermediates in 1-O-β- to 2-O-β-feruloyl glucose migration,
relative to intermediate 1. See Appendix 2, Table A2.2 for ground state energies and
relative differences.
The relative energies of the intermediates for the p-coumaroyl and feruloyl glucose esters
show similar patterns with intermediates 2 and 3 being highest in energy, which is
accentuated in water. Therefore more energy is required for migration in water than
dichloromethane, which is the opposite effect to that seen by Rangelov,197 whereby more

Chapter 3: Acyl Migration of Hydroxycinnamoyl Glucose Esters
64
polar solvents reduced the energy barriers to migration. However, in this case all four
intermediates investigated are cationic, with intermediate 1 expected to exist in equilibrium
with the neutral species under acidic conditions. Therefore, the energy involved in the
formation of the cationic intermediates is not considered and there is no expected effect
between the intermediates based on charge stabilisation.
Not only is the formation of the 2-O-α-esters more favoured in solvents other than water,
but the energy of migration is lessened in dichloromethane also. When the glucose esters
were synthesised and purified by column chromatography in a dichloromethane based
solvent system, migration away from the 1-O-β-esters under acidic conditions was
thermodynamically favoured and kinetically more favoured also.
Furthermore, the energy to migration in feruloyl glucose (10) compared with p-coumaroyl
glucose (9) in dichloromethane is almost twice as much. For feruloyl glucose the migration
is limited by intermediate 2, lying some 60 kJ/mol higher in energy than intermediate 1,
whereas the same transition for p-coumaroyl glucose requires only 35 kJ/mol.
Experimentally, it was seen that migration occurred faster, or to a greater extent for p-
coumaroyl glucose than for feruloyl glucose, which can be explained by the kinetics of
migration. With a faster process occurring for p-coumaroyl glucose, migration had
occurred to a greater extent at the time of characterisation than for feruloyl glucose.
As mentioned previously, it is expected that by performing the NMR characterisation of
the glucose esters in methanol, migration would continue beyond that caused simply by
purification. As a result, the equilibrium of the mixtures may not have been achieved over
the course of 2-3 hours needed for purification and characterisation, with the kinetically
favoured process (migration in p-coumaroyl glucose) having occurred to a greater extent.
While it would have been relatively simple to allow the mixture to equilibrate over hours,
or even days, the key outcome of this study was to obtain pure 1-O-β-esters and as such,
migration was not encouraged.
Additionally, intermediate 4 was lower in energy than intermediate 1 for p-coumaroyl
glucose under all the conditions investigated, showing a preference for formation of the
cationic 2-O-β-ester over the cationic 1-O-β-ester, which is not the case for feruloyl

Chapter 3: Acyl Migration of Hydroxycinnamoyl Glucose Esters
65
glucose, indicating that kinetically, migration to the 2-O-position within p-coumaroyl
glucose is comparatively favoured.
While step-wise migration around the glucose ring has been proposed,189 migration to the
2-O-position is not the only path of migration. Yoshimoto dismissed direct 1-O- to 6-O-
migration, though their observations differ from those seen in these studies enough for it
not to be completely discounted.193 Calculating the energy barriers for migration to the 6-
O-position should support or eliminate direct migration, as such analogous intermediates to
the 1-O- to 2-O-migration were optimised and the energies calculated, the same
mechanism was assumed, with the attacking nucleophile changed to the hydroxyl of the
final ester.
En
erg
y (
kJ/m
ol)
Int. 1 Int. 2 Int. 3 Int. 4
-50
0
50
100
150WaterDichloromethaneVacuum
Figure 3.14: Energy of the intermediates in 1-O-β- to 6-O-β-p-coumaroyl glucose
migration, relative to intermediate 1. See Appendix 2, Table A2.3 for ground state energies
and relative differences.
En
erg
y (
kJ/m
ol)
Int. 1 Int. 2 Int. 3 Int. 4
-50
0
50
100
150WaterDichloromethaneVacuum
Figure 3.15: Energy of the intermediates in 1-O-β- to 6-O-β-feruloyl glucose migration,
relative to intermediate 1. See Appendix 2, Table A2.4 for ground state energies and
relative differences.

Chapter 3: Acyl Migration of Hydroxycinnamoyl Glucose Esters
66
Figures 3.14 and 3.15 show that direct migration to the 6-O-β-esters is as likely as
migration to the 2-O-β-esters, with very similar energy barriers to overcome. In a similar
fashion to the 2-O-β-p-coumaroyl glucose migration in dichloromethane (Figure 3.12), the
protonated 6-O-β-esters are more favoured than the protonated 1-O-β-esters under all
conditions for both 9 and 10, suggesting that in an aqueous acidic environment direct
migration to the 6-O-position would be favoured over migration to the 2-O-position.
Both transitions involve intermediates of unfavourable conformations, with the 1-O- to 2-
O-migration involving a 5-membered cyclic intermediate, and the 1-O- to 6-O-migration a
7-membered transition state. Given the evidence of Iddon,191 the migration to the 3-O-
position involving a 6-membered cyclic intermediate should be more favourable than both
of the previously calculated transformations.
En
erg
y (
kJ/m
ol)
Int. 1 Int. 2 Int. 3 Int. 4
-40
-20
0
20
40
60WaterDichloromethaneVacuum
Figure 3.16: Energy of the intermediates in 1-O-β- to 3-O-β-p-coumaroyl glucose
migration, relative to intermediate 1. See Appendix 2, Table A2.5 for ground state energies
and relative differences.
En
erg
y (
kJ/m
ol)
Int. 1 Int. 2 Int. 3 Int. 4
-40
-20
0
20
40WaterDichloromethaneVacuum
Figure 3.17: Energy of the intermediates in 1-O-β- to 3-O-β-feruloyl glucose migration,
relative to intermediate 1. See Appendix 2, Table A2.6 for ground state energies and
relative differences.

Chapter 3: Acyl Migration of Hydroxycinnamoyl Glucose Esters
67
As expected, the migration to the 3-O-position involves smaller energy barriers, and can be
expected to occur more quickly than migration to the 2-O- and 6-O-positions. However,
thermodynamics suggests a preference for the formation of the 2-O- and 6-O-esters, which
would be a case of subsequent migration.
The optimised intermediates 2 and 3 produced in studying both the 1-O- to 3-O- and 1-O-
to 6-O-migrations involve a glucose ring-flip, with the result being that for the 1-O-β-ester
the 1-OH, the 3-OH and the 6-OH are all axial and on the same face above the ring,
leading to a less hindered migration.
OOORHO
HO
OH
OH
OR
OH
OH
OH
OH
Ring-flip
Figure 3.18: Glucose ring-flip to facilitate 1-O- to 3-O-migration and 1-O- to 6-O-
migration.
This effect is seen more greatly for the 1-O- to 3-O-migration where very small energy
barriers are seen. The unfavoured ring-flipped conformation is stabilised by the formation
of the bicyclic intermediates, or more accurately that the formation of the cyclic
intermediate in the ring-flipped conformer is more favourable than in the original
conformation. A glucose ring-flip would explain the findings of Yoshimoto, that 1-O- to 3-
O- to 6-O-migrations were occurring rapidly, and potentially why they did not experience
1-O-β- to 2-O-migration, with these groups being too far removed for the transformation to
take place.193
3.4 Liquid Chromatography of Wine.
The ease of migration in non-aqueous solvents provides an explanation as to why two p-
coumaroyl hexose esters were seen by both Monagas and Hernendez,100, 103, 131 and brings
into question whether one or both esters observed are an artifact of the extraction being
performed in non-aqueous solvents, rather than a grape or wine product. A study by Perez-

Chapter 3: Acyl Migration of Hydroxycinnamoyl Glucose Esters
68
Magarino looked at the ability of different resins to absorb and retain phenolic compounds
by loading, then washing with water, ether and finally ethyl acetate.199 From a single resin
one p-coumaroyl glucose ester was eluted with water, but when non-aqueous solvents were
used, two p-coumaroyl glucose esters were observed. It is unlikely that the difference in
chemical properties of the two p-coumaroyl glucose esters would result in a single ester
eluting while the other is retained and further supports the theory that the 1-O-β-esters are
solely found in wine, and any other esters are produced upon exposure to non-aqueous
solvents.
To investigate the presence of multiple hydroxycinnamoyl glucose esters in wine, the
extraction method of Monagas was employed to extract red and white wine spiked with
both p-coumaroyl and feruloyl glucose ester (9 and 10). By comparing the amount
remaining in the “spiked” extraction to that of a pure sample, the liquid-liquid extraction
efficiency was approximately 20% for both compounds, and thus considered inadequate
for detecting small quantities in wine.
Solid-phase extraction by loading spiked wine onto XAD-8, elution with 25%, 50% and
75% methanol in water, followed by HPLC analysis indicated that the majority of the
glucose ester content was found in the 50 and 75% methanol fractions and that the
extraction efficiency was approximately 60%. When analysed by LC-MS, the pure glucose
ester standards, which were not subjected to extraction, consisted largely of single esters,
while the extracted wines contained two glucose esters, the most predominant being the 1-
O-β-ester, with the minor peak expected to be either the 2-O-α- and 6-O-α-esters,
indicating that the spiked glucose esters were migrating under the extraction conditions.
With liquid-liquid extraction giving poor extraction efficiencies, the nature of the solvents
likely to yield migration, and the solid-phase extraction also resulting in migration, neat
red and white wine along with concentrated samples (5 times concentrated under reduced
pressure) were submitted to analysis by LC-MS. The extracted ion chromatograms of the
pure esters again showed largely single esters (Figures 3.19a and 3.20a) which suggests
that migration is not an effect of the HPLC method. The fragmentation pattern of p-
coumaroyl glucose matches literature data,131 and feruloyl glucose fragmented in an
analogous manner, as reported200 (Figures 3.19b and 3.20b).

Chapter 3: Acyl Migration of Hydroxycinnamoyl Glucose Esters
69
Figure 3.19: p-Coumaroyl glucose. a) Extracted ion chromatogram of m/z 325. b) Mass
spectrum at 29.6 to 29.8 minutes.
Figure 3.20: Feruloyl glucose. a) Extracted ion chromatogram of m/z 355. b) Mass
spectrum at 36.5 to 36.6 minutes.

Chapter 3: Acyl Migration of Hydroxycinnamoyl Glucose Esters
70
Injection of neat white wine, as well as concentrated white wine gave the same results,
with 5 main peaks appearing in the area of interest in the extracted ion chromatogram for
m/z 325 (Figure 3.21). Based on the fragmentations, the first peak observed in the EIC for
m/z 325 corresponds to the p-coumaroyl glucoside (A), lacking the fragmentation which
corresponds to the loss of water from the aglycone seen in the glucose ester fragmentation,
the second two (B and C), with aglycone peaks matching ferulic acid are likely to be
feruloyl tartrate derivatives,131 and the fourth and fifth peaks (D and E) are the two p-
coumaroyl glucose esters (Figure 3.22).
Figure 3.21: Concentrated white wine, extracted ion chromatogram of m/z 325.
A B
C
D E

Chapter 3: Acyl Migration of Hydroxycinnamoyl Glucose Esters
71
Figure 3.22: Mass spectra of compounds identified in extracted ion chromatogram of m/z
325.
The fragmentations of the two peaks identified in the extracted ion chromatogram of m/z
355 imply that the first peak (A) is the feruloyl glucoside and the second (B) is the feruloyl
glucose ester (Figure 3.24).
The observation that the white wine, when analysed neat, or concentrated appears to
possess two p-coumaroyl glucose esters, but only single feruloyl glucose ester, is
consistent with the reluctance of feruloyl glucose ester to migrate which was observed
during synthesis and supported by theoretical studies.
A)
B)
C)
D)
E)

Chapter 3: Acyl Migration of Hydroxycinnamoyl Glucose Esters
72
Figure 3.23: Concentrated white wine, extracted ion chromatogram of m/z 355.
Figure 3.24: Mass spectra of compounds identified in extracted ion chromatogram of m/z
355.
With little difference in the results from neat and concentrated white wine, the analysis of
red wine was only repeated with concentrated red wine (Figure 3.25), with the extracted
ion chromatogram for m/z 325 possessing additional peaks, which are tentatively identified
A)
B)
A
B

Chapter 3: Acyl Migration of Hydroxycinnamoyl Glucose Esters
73
as p-coumaroyl anthocyanin derivatives (Figure 3.26). However, the presence of the extra
peaks (at 32.6, 34.3, 36.7 and 40.0 minutes) in the same region of the chromatogram as
feruloyl glucose (approximately 36.6 minutes) led to decreased resolution of the m/z 355
extracted ion chromatogram (Figure 3.27), with no fragmentations able to be found
matching that of the reference sample.
Figure 3.25: Red wine chromatogram (DAD).
Figure 3.26: Concentrated red wine, extracted ion chromatogram of m/z 325.
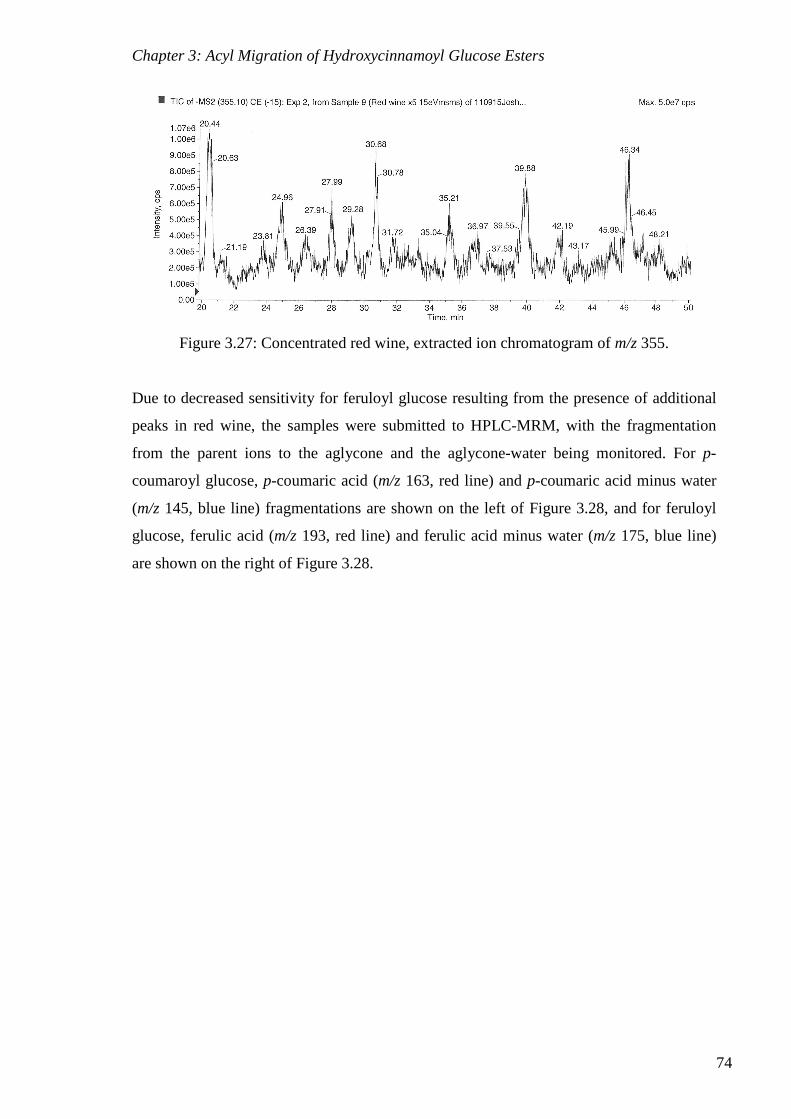
Chapter 3: Acyl Migration of Hydroxycinnamoyl Glucose Esters
74
Figure 3.27: Concentrated red wine, extracted ion chromatogram of m/z 355.
Due to decreased sensitivity for feruloyl glucose resulting from the presence of additional
peaks in red wine, the samples were submitted to HPLC-MRM, with the fragmentation
from the parent ions to the aglycone and the aglycone-water being monitored. For p-
coumaroyl glucose, p-coumaric acid (m/z 163, red line) and p-coumaric acid minus water
(m/z 145, blue line) fragmentations are shown on the left of Figure 3.28, and for feruloyl
glucose, ferulic acid (m/z 193, red line) and ferulic acid minus water (m/z 175, blue line)
are shown on the right of Figure 3.28.

Chapter 3: Acyl Migration of Hydroxycinnamoyl Glucose Esters
75
Figure 3.28: HPLC-MRM traces (aglycone - blue, aglycone minus water - red) of
hydroxycinnamoyl glucose esters. a) Pure glucose esters. b) Neat white wine. c)
Concentrated white wine. d) Concentrated red wine.
From the chromatograms in Figure 3.28, the presence of multiple p-coumaroyl glucose
esters in white and red wine can be observed, but the presence of a second glucose ester of
ferulic acid is not immediately obvious in white wine. Although the concentration of
feruloyl glucose in concentrated red wine is somewhat lower than in white wine, evidence
p-Coumaroyl glucose Feruloyl glucose
a)
b)
c)
d)

Chapter 3: Acyl Migration of Hydroxycinnamoyl Glucose Esters
76
of a second peak in the concentrated red wine sample can be seen. Even though this data
confirms the finding of Monangas, Hernandez and Perez-Magarino that there are multiple
glucose esters in wine, it has also shown that the extraction method can contribute to the
extent of migration, with pure glucose esters undergoing migration during solid-phase
extraction. These results also indicate why the feruloyl glucose ester was not observed in
previous studies, as the presence of what are likely to be p-coumaroyl anthocyanin
derivatives in red wine co-elute, and prevent identification and quantification. Feruloyl
glucose could only be seen in this case by determining the retention time and comparing
fragmentations with the pure reference compound.
3.5 Conclusions.
Previous studies have evaluated the migrations to and from multiple positions of glucose,
and the reverse processes. However, in this study, only the migrations away from the 1-O-
β-esters were examined as the destruction and formation of these esters were specifically
of interest. Migrations involving 5-, 6- and 7-membered cyclic intermediates have been
studied with kinetic preference for migration through the 6-membered intermediate, to an
ester that is thermodynamically unfavourable.191-192 Migration between neighbouring
hydroxyls, in this case 1-O- to 2-O-migration, occurs through a 5-membered intermediate,
while migration to the 3-O-position, which was found to be kinetically more favoured,
involves an extra carbon atom, resulting in a 6-membered intermediate. Whereas migration
from the 1-O- to the 6-O-position requires formation of a 7-membered intermediate, and
was found to be kinetically as favoured as formation through a 5-membered intermediate.
Studying the kinetics of migration away from the 1-O-β-esters is valuable in determining
the likelihood of migration, and it can now be rationalised why previous authors193 have
seen migration through the 3-O-position to get to the 6-O- and 2-O-position. However, the
fact that the 3-O-esters do not accumulate in the migrated glucose ester mixtures
strengthens the argument that these migrations are ultimately under thermodynamic
control. Thus, while in water the energy barriers for migration to the 3-O-position are quite
favourable, the energies of the end products suggest that this wouldn’t be the case,
indicating that the 3-O-esters are intermediates and the secondary migration to the 6-O-
position is extremely facile.

Chapter 3: Acyl Migration of Hydroxycinnamoyl Glucose Esters
77
However, these results do indicate that in wine like conditions (largely aqueous) that the 1-
O-β-esters will be thermodynamically favoured, and that most migrations are suppressed
due to higher energy barriers to migration, with the only exception being the migration to
the 3-O-position which requires a ring flip of the glucose ring before the migration can
take place.
It can be seen that the migrations observed in the hydroxycinnamoyl glucose esters are
largely under thermodynamic control and that under conditions that favour products other
than the 1-O-β-ester, migration will most likely occur rapidly. This study did not
investigate the base-catalysed migration, as it would be of little importance in acidic wine
medium and the 1-O-β-esters appeared stable under mildly basic conditions. There is the
potential that synthetically, basic conditions should also be avoided, not the least because
of the greater likelihood of hydrolysis.
While the kinetics would suggest that migration away from the 1-O-β-esters should
proceed through the 3-O-position, the relative ratios of the different glucose esters
observed during synthesis showed the p-coumaroyl moiety migrating to a greater extent
than the feruloyl, which suggests that migration of p-coumaroyl glucose should be
kinetically more favoured. This effect is only predicted for a 1-O- to 2-O-migration
(Figures 3.12 and 3.13) with the energy required for migration much higher in the feruloyl
derivative than in the p-coumaroyl. Furthermore, if migration to the 3-O-position is
experienced, the ring-flip required for this transformation to occur would most likely
promote further migration to the 6-O-position, resulting in formation of the
thermodynamically more stable esters.
In future synthetic attempts, the use of solvents other than water should be limited,
especially under conditions conducive to migration. If organic solvents are employed, they
should be done so under neutral conditions, or preferably in the presence of a buffer. In the
event of migration away from the desired 1-O-β-esters, it has been shown that storage
under aqueous acidic conditions will again yield the desired esters.
Furthermore, it can be expected that in wine, and wine-like environments such as model
fermentations, that the 1-O-β-esters will predominate and other esters would be a product

Chapter 3: Acyl Migration of Hydroxycinnamoyl Glucose Esters
78
of the conditions that the compounds are exposed to. An analytical method using a liquid-
liquid or solid-phase extraction could promote formation of other esters and render the
quantification inaccurate. As such, to quantify these compounds in wine, care must be
taken to ensure that migration hasn’t occurred, and that the compounds seen are products
of the grape or wine conditions, rather than artifacts of the methodology. If extraction and
concentration is required, analysis of a neat wine sample might assist in determining if any
migration has occurred as a result of the processing. The differences in the ratio of esters
observed between model wine, where the 1-O-β-ester is predominant, and red wine, where
multiple esters were observed, are most likely a product of the matrices and effected by
such factors as pH and dielectric constant.
In addition, this study also describes the identification of feruloyl glucose (10) for the first
time in red wine, which, along with p-coumaroyl glucose can exist as multiple esters in
both red and white wine.

Chapter 4: Photoisomerisation of Hydroxycinnamic Acids
79
Chapter 4: Photoisomerisation of Hydroxycinnamic Acids.
4.1 Introduction.
4.1.1 Hydroxycinnamate Photoisomerisation
In addition to the acyl migrations that were observed (Chapter 2) and studied (Chapter 3),
trans-p-coumaroyl glucose (9) and trans-feruloyl glucose (10) were found to undergo
photoisomerisation resulting in formation of cis-analogues (Figure 4.1). Interconversion
between trans- and cis-hydroxycinnamic acids has been known since Kahnt reported and
investigated the nature of the conversion and found the equilibrium to be effected by the
solvent in which the transition occurred, the concentration of the hydroxycinnamic acids,
and also the nature of the compounds, with caffeic acid existing in different isomeric ratios
to an esterified analogue.187
O
OH
HOHO
OH
O
O
OH
R
O
OH
HOHO
OH
O
O
OH
R9 R = H10 R = OCH3
cis-9 R = Hcis-10 R = OCH3
hν
Figure 4.1: Photoisomerisation of the hydroxycinnamoyl glucose esters.
A further investigation by Kahnt measured the pH dependence of the photoisomerisation
and observed that maximum conversion to the cis-acids was achieved within a pH range of
5-7.186 Subsequent studies have shown there to be changes in equilibria due to: additional
substituents, with TMS ethers producing different isomeric ratios than the free
hydroxycinnamic acids, although the direction of the equilibrium change was not
consistent;201 subtle differences in conversion to the cis-analogue in differing solvents;202
as well as due to the wavelength of incident light.203 Longer wavelengths of ultra-violet
light induce a slower isomerisation, while shorter wavelengths induce a quicker and more
complete isomerisation but can also result in degradation after prolonged exposure.203

Chapter 4: Photoisomerisation of Hydroxycinnamic Acids
80
Under irradiation, the majority of the hydroxycinnamic acids exist at isomeric ratios
favouring the trans-isomer, with the cis-acid contributing between 40 and 49%.204 While
many studies have shown the effect of ultra-violet light on isomerisation, other reports
suggest that it can be promoted under more innocuous light conditions, providing the
recommendation that the hydroxycinnamic acids should be handled in the dark to avoid
any potential isomerisation.205-207
p-Coumaric acid (3) plays an important role in bacteria, being the basis for the
chromophore for the photoactive yellow protein or PYP, and as such the isomerisation of
p-coumaric acid, and derivatives, have been extensively studied at various theoretical
levels.208-213 Kort et al. first investigated the photoisomerisation in the PYP and found that
the thioester of p-coumaric acid is in equilibrium between the cis- and trans-forms, but
also concluded that not only can the cis-isomer be photochemically converted to the trans-
isomer, but that the cis- to trans-isomerisation could be facilitated thermally, which is not
the case for the reverse process.214 In the case of the true PYP, the photoisomerisation can
be induced by light up to 430 nm, although many investigations into the PYP however,
have begun with p-coumaric acid as a model system.
Common to these studies is the concept that the isomerisation proceeds via an excited
electronic state through promotion of an electron from the alkene π-bond into an anti-
bonding orbital, allowing for free bond rotation with the product determined by the nature
of the preferred conformation in the excited state. There still remains conjecture as to
whether the photoisomerisation of p-coumaric acid proceeds through a singlet excited state
(S1) with paired electron spin, or a triplet excited state (T1) with unpaired electron spin
(Figure 4.2).
π
π∗
S0 S1 T1
Figure 4.2: Electron configuration of π bonding and anti-bonding molecular orbitals in
ground and excited states.

Chapter 4: Photoisomerisation of Hydroxycinnamic Acids
81
Li and Fang studied the excited states of trans-p-coumaric acid with respect to the nature
of the excitation, finding that the lowest singlet transition (S0-S1) possessed more n-π*
character which resulted from excitation of the unpaired electrons of the carbonyl oxygen,
but that the S0-T1 transition was dominated by a π - π* electron promotion. The S0-T1
transition resulted in T1 p-coumaric acid possessing the lowest energy conformation with
the alkene p-orbitals at a 90o dihedral angle, compared with 180o seen in the S0 state.
Relaxation from T1 at a 90o conformation to S0 accounted for the formation of cis- and
trans-isomers with either able to be formed.208
Furthermore, Sergi et al. compared the excitation energies of p-coumaric acid against the
phenolate anion (the form in which it is found in the PYP) and found that the vertical
excitation energy of the anion was 20% lower than that of the protonated form,211 though
in acidic wine-like conditions (pH 3.5) it is extremely unlikely that the phenolate anion
would be found.
4.1.2 cis-Hydroxycinnamate content in grapes and wine
There are few examples of grape or wine quantifications that include both the cis- and
trans-hydroxycinnamates, with the majority of these studies focusing on p-coumaroyl
tartrate,72-73, 96, 101, 103, 118, 123-127, 131 although feruloyl tartrate72 and p-coumaric acid have
also been considered.101, 103 Of the studies that do consider hydroxycinnamate
stereochemistry, it is sometimes only specified for some compounds and not others,28, 72, 98,
101, 104 or only the trans-isomer is (or can be) quantified,73, 99-100, 103, 123-124, 126, 131 while other
studies do not consider the stereochemistry at all.97, 102, 105-106, 119, 121-122, 128-130, 215-216 For
some studies it is unclear whether the quantification techniques fail to distinguish the two
forms, or if the cis-isomers are present in concentrations lower than the detection
threshold. However, it is understandable that quantifying both cis- and trans-isomers has
been achieved most regularly for the most prevalent form, p-coumaroyl tartrate.
Both isomers of feruloyl tartrate were quantified and expressed as molar percentages in
Cencibel grapes and the resulting wine, with an initial cis-content of 26.3%, dropping to
9.4% in wine.72 The effect of malolactic fermentation on cis- and trans-p-coumaric acid
was studied, with an initial isomeric ratio of 54.8% cis-p-coumaric acid observed; resulting
in 25.2% of the cis-isomer after malolactic had been conducted in steel, against 32.2% in a

Chapter 4: Photoisomerisation of Hydroxycinnamic Acids
82
barrel.101 In the same study, red wine was aged for 14 months resulting in p-coumaric acid
content consisting of 6.5% of the cis-isomer. The same author performed malolactic
fermentation with several lactic acid bacteria and found that the p-coumaric acid content
changed from 48.1% of the cis-isomer to between 3.1 and 38.1% after malolactic
fermentation.103
The effect of ultra-violet light on cis/trans-ratios in grapes can be observed by compiling
the cis- and trans-p-coumaroyl tartrate content in red and white skins of Montealegra et al., 126 and the content in red and white juices as determined by Singleton et al. (Table 4.1).127
Table 4.1: Content of cis- and trans-p-coumaroyl tartrate in the skin and juice of red and
white grapes.126-127
trans-p -coumaroyl tartrate cis-p-coumaroyl tartrate % cis-isomer
Skin content (mg/kg) White (n = 6) 7.63 2.92 27.65Red (n = 4) 6.28 1.79 22.15
Juice content (mg/L) White (n = 19) 15.32 3.11 16.87Red (n = 21) 18.38 3.43 15.73
Average Concentration
The highest cis-content is in the skin of white grapes (27.7%), where increased exposure to
ultra-violet light is expected, followed by the skin of red grapes (22.2%) where
pigmentation can provide some relief from ultra-violet radiation. The juice content of cis-
p-coumaroyl tartrate is lower than observed in the skins likely caused by the absorbance of
radiation by compounds in the skins protecting the “juice” hydroxycinnamates, again with
white grapes (16.9%) having a higher cis-content than red grapes (15.7%). While this data
has come from two separate sources, the approximate ratio of cis- to trans-p-coumaroyl
tartrate in the entire berry decreases with decreasing exposure to ultra-violet radiation. In
red or white grapes the approximate cis:trans ratio agrees with those observed during
synthesis of the glucose esters, which were observed to exist as approximately 20-25% of
the cis-isomer.
The data obtained by Lee and Jaworski in Pinot Blanc grapes supports that shown in Table
4.1. They observed ratios of 16.6 and 21.8% of cis-p-coumaroyl tartrate at harvest across
two separate vintages,96 as well as Gomez-Alonso reporting 21% of the cis-isomer in
Cencibel grapes.72 Meanwhile, other studies have described much different ratios. Betes-
Saura et al. analysed free run juice of 3 white grape varieties and found an average cis-
Chapter 4: Photoisomerisation of Hydroxycinnamic Acids
83
content of 47.6 %,73 while a further study by Lee and Jaworski found cis-contents ranging
from 10 – 67% across 21 white cultivars.124
In wines, the isomeric ratio of p-coumaroyl tartrate also varies, with one study by Monagas
et al. observing ratios between 10.9 to 55.3% of the cis-isomer in four different red wine
varieties,131 while other studies reported contents anywhere between 6.5 and 47.4% of the
cis-isomer.72-73, 101, 103
Of the hydroxycinnamates of interest in this study, p-coumaroyl tartrate is the analogue to
have been most thoroughly quantified, although the presence of other cis-
hydroxycinnamates in wine have been documented. Baderschnieder108 investigated the
phenolic content of a Riesling wine identifying a cis-isomer for most trans-
hydroxycinnamate species identified (excluding the glucose esters of p-coumaric and
ferulic acid), including p-coumaric acid, p-coumaric and ferulic-4-O-glucosides, and p-
coumaroyl and feruloyl tartrate esters. With the extent of isomerisation observed for the
glucose esters in the laboratory (described in Chapter 2), it is possible that a more sensitive
technique might have detected cis-glucose esters also.
The hydroxycinnamates, a class of compound that are widely researched because of the
possibility that they contribute to spoilage during winemaking, have not been considered in
microbial breakdown with respect to stereochemistry. The cis-hydroxycinnamates which,
as shown above, can contribute to around 20% of the hydroxycinnamate content of the
berry, have not been specifically evaluated with respect to metabolism by D. bruxellensis
and whether these can contribute to the accumulation of ethylphenols in wine during barrel
ageing.
4.1.3 Enzymatic Specificity
The breakdown of hydroxycinnamate esters to yield ethylphenols involves two potentially
stereospecific enzymes, an esterase and a decarboxylase. Submitting cis-esters to D.
bruxellensis would simultaneously test both of these enzymes in the same experiment,
potentially leading to ambiguous results. Furthermore, once Dekkera has expressed
decarboxylase activity, the product of the cis- and trans-acids, the vinylphenols (5 and 6),
do not possess differing alkene stereochemistry and as such the subsequent vinyl reductase

Chapter 4: Photoisomerisation of Hydroxycinnamic Acids
84
will not be a factor in stereospecific metabolism. Formation of ethylphenols from acids as
well as esters must both proceed via decarboxylation, and as such, this stage of
hydroxycinnamate metabolism is a key step at which the stereospecificity should be
scrutinised.
A purified p-coumarate decarboxylase from B. bruxellensis has been tested for substrate
specificity with p-coumaric acid, caffeic acid, ferulic acid and m-coumaric acid.68 The
decarboxylase was active towards caffeic, p-coumaric and ferulic acids in that order of
preference, and inactive towards m-coumaric acid. Although, it showed that a para-
hydroxyl group was required, and by shifting it to the meta position, decarboxylation was
retarded, the specificity within this study towards cis-acids was not tested.
Similar results were seen from a purified hydroxycinnamate decarboxylase enzyme from
B. anomalus when tested towards a number of similar acids.70 Again, caffeic acid was
preferentially decarboxylated before p-coumaric and ferulic acids with relative activities of
37.5 and 31.3%, but the decarboxylase was inactive towards cinnamic acid, sinapic acid,
hydrocaffeic acid, o-coumaric acid, m-coumaric acid, p-methoxycinnamic acid, p-
hydroxybenzoic acid, iso-ferulic acid, 5-hydroxyferulic acid, 3,4-methylenedioxycinnamic
acid, phenylalanine and pyruvic acid. This provides further information that a para-
methoxy group is insufficient to facilitate decarboxylation, but again, no cis-acids were
tested.
Gramatica et al. showed the ability of Saccharomyces cerevisiae to decarboxylate p-
coumaric acid, p-methoxycinnamic acid, ferulic acid and 3,4-dimethoxycinnamic acid, but
found that it was not active towards cinnamic acid, caffeic acid and
methylenedioxycinnamic acid.217 cis-3,4-Dimethoxycinnamic acid was then tested and the
decarboxylase was not active towards it, indicating an inability to decarboxylate this
particular cis-acid. Unlike the previous reports, this study shows the ability for a
decarboxylation to occur for a compound possessing a para-methoxy group, though
possessing a para-hydroxyl group doesn’t appear to guarantee decarboxylation with caffeic
acid not being affected.

Chapter 4: Photoisomerisation of Hydroxycinnamic Acids
85
HO
COOH
HO
COOH
HO
COOH
COOH COOH
H3CO
COOH
COOH
HO H3CO
COOH
HO
COOH
H3CO HO
HO
OH
HOH3CO
OH
COOHO
O
COOH
NH2
COOH
O
COOH
O
HO
COOH
OHCOOH
COOH
HO
COOH
HO
COOH
HO
COOHHO
HO
COOHH3CO
HO
COOHH3CO
OCH3
COOH
O
COOH
O
p-Coumaric acid
m-Coumaric acid o-Coumaric acid
Ferulic acid Caffeic acid
p-Methoxycinnamic acid
p-Hydroxybenzoic acid iso-Ferulic acid 5-Hydroxyferulic acid
3,4-methylenedioxycinnamic acid Phenyl alanine Pyruvic acid Hydroxypyruvic acid
Mandelic acid Hydrocinnamic acid 4-Hydroxyphenyl acetic acid
4-Phenyl but-3-enoic acid Phloretic acid Dihydrocaffeic acid
Dihydroferulic acid Sinapic acid Acrylic acid Crotonic acid
Figure 4.3: Compounds investigated in decarboxylation studies.
Goodey and Tubb studied S. cerevisiae in relation to the gene then designated as POF1
(now known as PAD1218), which is responsible for the decarboxylation of
hydroxycinnamic acids and resulting production of phenolic off-flavour as observed in
beer.219 Those strains possessing the ability to decarboxylate were designated Pof+. S.
cerevisiae strains possessing the Pof+ phenotype showed the ability to decarboxylate
ferulic acid, cinnamic acid and p-coumaric acid, in that order of preference, while caffeic
acid, 4-hydroxypyruvic acid, mandelic acid, hydrocinnamic acid, 4-hydroxyphenylacetic

Chapter 4: Photoisomerisation of Hydroxycinnamic Acids
86
acid, 4-hydroxybenzoate and 4-phenylbut-3-enoate were unaffected by the S. cerevisiae
decarboxylase. Again, compounds possessing a para-hydroxyl group weren’t necessarily
decarboxylated, and additionally, cinnamic acid that has no aromatic ring substitution was
able to be decarboxylated.
Harada and Mino studied the substrate specificity of the decarboxylase activity of
Cladosporium phlei.84 It was active towards cis-p-coumaric acid, trans-p-coumaric acid,
caffeic acid and ferulic acid, in that order of preference, and was inactive towards cinnamic
acid, m-coumaric acid, o-coumaric acid, phloretic acid, p-methoxycinnamic acid,
dihydrocaffeic acid, dihydroferulic acid, sinapic acid, acrylic acid and crotonic acid.
With these examples of decarboxylases, one fungus which showed otherwise similar
substrate specificity to Dekkera did possess the ability to metabolise cis-acids, while
brewing yeasts, which showed very different substrate specificity lacked the ability to
metabolise cis-acids. However, there are no reports as to the stereospecificity of the
decarboxylase of D. bruxellensis and whether cis-hydroxycinnamates, in addition to the
trans-isomers, can be metabolised and contribute to the accumulation of ethylphenols in
wine.
4.2 Research Aims.
Following the photoisomerisation of the hydroxycinnamoyl glucose esters (9 and 10)
which resulted in partial conversion to furnish cis-analogues, and the ease by which it
occurred, the role of the cis-hydroxycinnamates in the production of ethylphenols has
become of importance to this research. Investigation into the known cis-hydroxycinnamate
content of grapes has indicated that for most trans-hydroxycinnamates there exists a
corresponding cis-isomer, and of those quantified, the cis-content is in the vicinity of 20%
of the total hydroxycinnamates. The ability of D. bruxellensis to metabolise the cis-
isomers, or otherwise, could have an impact on the production of ethylphenols by as much
as 20% within wine.
The decarboxylase of D. bruxellensis is active in the bioconversion of the free acids and
esters to ethylphenols and will be tested for stereospecificity by conducting fermentation in

Chapter 4: Photoisomerisation of Hydroxycinnamic Acids
87
the presence of both the cis- and trans-hydroxycinnamic acids. The trans-hydroxycinnamic
acids have already been synthesised, being isolated during preparation of the esters
(Chapter 2), with the cis-hydroxycinnamic acids now requiring synthesis.
In addition to synthesis of cis-p-coumaric and cis-ferulic acids, the photoisomerisation of
the hydroxycinnamic acids will be investigated at a theoretical level beyond that of the free
acids to explain the rapid isomerisation experienced for the glucose esters, which was not
observed for any other hydroxycinnamate derivative. Using the existing theoretical studies
of p-coumaric acid, the procedures will be extended to the hydroxycinnamate esters in an
effort to determine the energy barriers associated with photoisomerisation, and develop
protocols to increase the ease of synthesis of the glucose esters (9 and 10) while
maintaining stereoisomeric purity.
4.3 Synthesis of cis-Hydroxycinnamic Acids.
By isolating the minor products from the Wittig reaction (as described in Chapter 2) via
column chromatography, pure cis-11 and cis-12 could be achieved, though these were only
produced in limited quantities as the trans-products are thermodynamically favoured. The
formation of ethyl coumarate (11) affords approximately 90% trans-11 and 10% cis-11,
while the same reaction for the production of ethyl ferulate (12) yields around 70% trans-
12 and 30% cis-12, which can largely be separated by flash chromatography with only
minor co-elution of isomers. While cis-11 and cis-12 could be isolated and characterised
under ambient light conditions, attempted base-catalysed ester hydrolysis to yield the cis-
acids (cis-3 and cis-4) proved unsuccessful, resulting in isomeric mixtures. Hydrolysis of
cis-11 gave a mixture of cis- and trans-3 in a ratio of 20:80, while hydrolysis of cis-12
afforded a 35:65 mixture of cis- and trans-4.

Chapter 4: Photoisomerisation of Hydroxycinnamic Acids
88
O H
OH
R
OH
R
O OEt
OH
R
O
OEt
OH
R
O
OH
13 R = H14 R = OCH3
cis/trans-11 R = H cis/trans-12 R = OCH3
cis-3 R = Hcis-4 R = OCH3
+
Wittig
KOH
Scheme 4.1: Attempted synthesis of cis-hydroxycinnamic acids.
Initial conclusions for the production of the isomeric mixtures of 3 and 4 were that the
basic reaction conditions caused deprotonation of the phenolic hydroxyl, generating a
phenolate resonance structure that interrupted the α,β-unsaturated double bond and causing
a conversion back to the thermodynamically more favoured trans-isomer (Figure 4.4).
OH
O OEt
O-
O
OEt
O
-O
OEt
O
-O OEt
H+
Figure 4.4: Proposed resonance assisted conversion of cis-p-coumaric acid to trans-p-
coumaric acid.
Separation of cis- and trans-4 was achieved through flash column chromatography using
10% methanol in dichloromethane, yielding the pure cis-4 acid as indicated by TLC. After
standing for 16 hours in solution, analysis by NMR showed a 2:1 mixture of cis- to trans-4,

Chapter 4: Photoisomerisation of Hydroxycinnamic Acids
89
contradicting the previous hypothesis that isomerisation to the trans-acid was facilitated by
formation of the phenolate.
Though the trans-acids proved stable under ambient light conditions during synthesis, this
was not the case for the cis-acids, undergoing isomerisation under laboratory lighting. As
such, isolation of the pure cis-acids by chromatography was then performed under red light
in an attempt to minimise photoisomerisation, although under these conditions the cis-acids
still underwent a slow conversion back to the trans-acids. This indicated that spiking a
fermentation with pure cis-acids in the dark would result in some conversion back to the
trans-isomer which D. bruxellensis could metabolise and yield ethylphenols. With the cis-
acids (cis-3 and cis-4) found to isomerise to give trans-acids even under conditions of low
light exposure, attempted synthesis and isolation of the pure cis-3 and cis-4 was
discontinued.
As the decarboxylase of D. bruxellensis is active towards only a few hydroxycinnamic
acids, a more stable alternative cis-substrate could not be utilised in the investigation of
stereoselective metabolism. Furthermore, an alternative substrate would not provide
adequate information as to the ability of D. bruxellensis to produce the ethylphenols of
interest to this study. Therefore it was required that fermentation experiments be performed
on isomeric mixtures of cis- and trans-hydroxycinnamic acids. These could be produced
through ultra-violet irradiation with literature observations indicating that the
hydroxycinnamates, upon irradiation, exist in approximately 40-49% in the cis-form.204
Photoisomerisation of p-coumaric acid (trans-3 to cis-3) was initially performed under 254
nm ultra-violet light (a readily available lamp in organic laboratories used to view TLC
plates) on small scale in NMR tubes for simple analysis requiring no sample preparation.
After 66 hours of irradiation a stable 52:48 ratio of trans- to cis-3 was produced as
indicated by 1H NMR analysis. Concurrently trans-ethyl coumarate (11) was irradiated to
investigate the thermodynamic effects of the isomerisation, assuming that cis-11 would be
produced to a greater extent given the stability comparative to cis-3 during synthesis. After
66 hours a 60:40 mixture of trans- and cis-11 was observed suggesting that the stability of
cis-11 during synthesis and chromatography is not due to thermodynamic stabilities of the
cis-isomers, but more likely a result of the higher energy required to facilitate the
conversion.

Chapter 4: Photoisomerisation of Hydroxycinnamic Acids
90
One study, of o-coumaroyl glucoside isomerisation, reported a quicker trans- to cis-
conversion with a shorter wavelength of ultra-violet light, but noted that prolonged
exposure of the glucosides to 254 nm light gave significant degradation of the product,
with only 40% remaining after 1 hour of exposure. The isomerisation induced by using a
365 nm lamp was found to be slower, but produced the cis-isomer to greater extents and
resulted in very little degradation of the substrate.203
Isomerisation using 365 nm light was performed for both hydroxycinnamic acids (trans-3
and trans-4), with the percentage conversion to the cis-isomer higher in 4. The extent of
isomerisation for 3 was less than experienced under 254 nm irradiation, however 365 nm
light was used in preference to avoid any potential and unnecessary degradation of the
acids. The isomeric ratios of the cis:trans-mixtures were determined by integrating the
signal for H8 of each isomer as these signals not only show a large change in chemical shift
between isomers, but are removed from other signals thus avoiding overlapping shifts.
The stability of the cis/trans-mixtures were tested by storing a small amount of cis/trans-p-
coumaric acid (3) under different conditions. A 61:39 mixture of trans:cis-3 was stored in
acetone or as a solid under the conditions outlined in Table 4.2, with the final ratios
determined after two weeks of storage.
Table 4.2: Isomeric ratio of p-coumaric acid (3) under different storage conditions.
trans cis
Solid 63 37In acetone 62 38
Solid 63 37In acetone 63 37
Solid 60 40In acetone 61 39
Solid 62 38In acetone 63 37-20 oC
Condition% of isomer
Room temperature, Dark
Room temperature, Light
4 oC
Slight deviations in the observed isomeric ratios are most likely a product of the variability
of the analytical method (NMR), otherwise the mixtures of cis/trans-3 proved stable,
indicating that the mixtures produced by irradiation would remain constant over the course
of the planned fermentation studies.

Chapter 4: Photoisomerisation of Hydroxycinnamic Acids
91
Additionally, in an attempt to promote formation of cis-ethyl coumarate (cis-11) by
binding transition metals between the aromatic ring and carbonyl, and effectively
“holding” the molecule in the cis-configuration (Figure 4.5), palladium and platinum were
stirred in the presence of 11. Both metals were found to retard photoisomerisation in an
undesired manner, and had the effect of yielding trans-11 from the cis-isomer.
O
O
OH
M
Figure 4.5: Intended effect of metal coordination on cis-hydroxycinnamates.
Submitting trans-ethyl coumarate (11) to ultra-violet radiation in the presence of either
palladium or platinum on activated carbon, isomerisation to cis-11 was inhibited by
approximately the same amount as the molar ratio in which the metal was present.
Additionally, by submitting cis-ethyl coumarate (cis-11) to palladium acetate, which was
utilised instead of 10% palladium on carbon to increase the number of moles of metal per
mass of reagent, had a large effect of converting cis-11 to the trans-isomer. With an excess
of palladium, 100% conversion from cis-11 to trans-11 was achieved under ambient light
conditions. So, not only did complexation of metals fail in promoting formation of cis-11,
but assisted in achieving the opposite, production of trans-11, which is consistent with
literature reports.220 However, future use of transition metals to maintain isomeric purity,
or convert unwanted cis-analogues to the trans-isomer may be of use. In the case of
undesired formation of cis-glucose esters (cis-9 and cis-10), future synthetic attempts may
involve producing isomeric mixtures under ambient light conditions, followed by recovery
of the trans-isomers by exposure to palladium or platinum.
4.4 Theoretical Studies into the Isomerisation of Hydroxycinnamic Acids.
Ab initio studies into the photoisomerisation of p-coumaric acid have been well
documented,208-213 but this study aimed to explain the differences in isomerisation observed

Chapter 4: Photoisomerisation of Hydroxycinnamic Acids
92
between hydroxycinnamate derivatives in the laboratory, namely: the ease of trans- to cis-
isomerisation for the glucose esters (9 and 10) that has not been observed previously; the
instability of the cis-hydroxycinnamic acids (cis-3 and cis-4) relative to the cis-ethyl
hydroxycinnamates (cis-11 and cis-12); and the rapid formation of the trans-acids seen
during the base-catalysed ester hydrolysis of the cis-ethyl esters (cis-11 and cis-12).
Using a DFT B3LYP 6-31G* level of theory, trans-p-coumaric acid underwent an
equilibrium geometry optimisation at the ground state (S0) and then again at the first
excited state. While there remains some discrepancy in the literature regarding whether the
isomerisation proceeds via excitation to the S1 or T1 state,208 optimisation of the ‘first
excited state’ of trans-p-coumaric acid identifies this as the T1 state. As the S1 and T1 state
occupy the same molecular orbital, with the HOMO of each theoretically corresponding
with the LUMO of the S0 state, the only difference in energy should arise from the
opposing spin of the promoted electron, which should be constant across all the geometries
and of little consequence to this study.
The HOMO and LUMO of S0 trans-p-coumaric acid (3), along with the HOMO of T1
trans-p-coumaric acid were calculated for the optimised structures and are shown below
(Figure 4.6). These support that promotion of an electron from S0 trans-p-coumaric acid
will result in a molecular orbital corresponding to T1 trans-p-coumaric acid.
Figure 4.6: Frontier molecular orbital diagrams of trans-p-coumaric acid (3). a) HOMO of
S0 trans-p-coumaric acid. b) LUMO of S0 trans-p-coumaric acid. c) HOMO of T1 trans-p-
coumaric acid.

Chapter 4: Photoisomerisation of Hydroxycinnamic Acids
93
Also, the spin density of T1 trans-p-coumaric acid (Figure 4.7) is largely concentrated
around the α,β-unsaturated double bond, suggesting that the alkene is highly affected by
the excitation into the T1 state.
Figure 4.7: Electron spin density in T1 trans-p-coumaric acid.
The energy profile of p-coumaric acid (3) resulted from constraining the dihedral angle of
trans-p-coumaric acid around the α,β-unsaturated double bond to 180o, optimising the
geometry at a DFT B3LYP 6-31G* level and calculating the energy of the conformation.
Using a dynamic constraint, the dihedral angle was rotated from 180o to 0o through 19
possibilities, optimising the geometry and calculating the energy every 10 degrees. This
process was applied to the singlet ground state (S0), then repeating for the triplet state (T1)
representing the photoisomerisation of p-coumaric acid in a vacuum (Figure 4.8).

Chapter 4: Photoisomerisation of Hydroxycinnamic Acids
94
Dihedral Angle
En
erg
y (
kJ/m
ol)
0 30 60 90 120 150 1800
100
200
300
S0
T1
Figure 4.8: Energy profile of p-coumaric acid (3). See Appendix 3, Table A3.1 for
calculated energies and relative differences.
The potential for isomerisation of the hydroxycinnamic acids, or compounds possessing a
similar molecular backbone, can be observed in the energy profile of p-coumaric acid.
Excitation of S0 trans-p-coumaric acid to the T1 state results in the preferred conformation
at a 90o dihedral angle, which corresponds to the two p-orbitals sitting orthogonal.
Relaxation back to S0 state can give either trans- or the cis-p-coumaric acid, which
corresponds to literature evidence.213
Repeating the analysis for ethyl coumarate (11) the S1 profile was generated with
questionable results (Figure 4.9). Rotation of the dihedral from 180o results in geometries
of increasing energy until the 70o conformation whereby calculations for the 60o and 50o
conformations fail to converge, and expected values are achieved for the remaining
conformations (0-40o). This effect also observed for calculations using a dynamic dihedral
constraint and for calculation using individually drawn structures (manual constraint),
though the manually drawn structures are a product of the preceding conformation (170o
drawn from the 180o, and so on). As the dihedral angle of the carbon skeleton is altered,
the alkene protons remain at 180o to each other producing structures with increasing
degrees of pyramidilisation and energy (50 and 60o conformations) until the calculations
fail to converge, whereby the protons are forced to a 0o dihedral angle (0-40o
conformations) (Figure 4.10). As such, the S0 profile was achieved by dynamically rotating
the dihedral from 180o to 90o (forwards) and from 0o towards 90o (backwards), producing
improved results.

Chapter 4: Photoisomerisation of Hydroxycinnamic Acids
95
Dihedral Angle
En
erg
y (
kJ/m
ol)
0 30 60 90 120 150 1800
100
200
300Manual S0 ForwardsDynamic S0 BackwardsDynamic S0 FowardsT1
Figure 4.9: Energy profile produced from forward and reverse dynamic, and manual
constraint of ethyl coumarate (11). See Appendix 3, Table A3.2 for calculated energies and
relative differences.
H
RH
RHH
R
H
R
RH
R R
H
R
H
H
R
R
H
180o 140o 30o60o90o
Figure 4.10: Pyramidilised alkene resulting from rotation of the dihedral angle from 180o
to 0o in ethyl coumarate (11).
The dynamic S0 profiles (forwards and backwards) differ for the 0-40o conformations by
approximately 17 kJ/mol, a product of optimising different ethyl coumarate conformers.
Beginning with trans-ethyl coumarate and rotating the alkene to give cis-ethyl coumarate
produces a different conformer to simply drawing cis-ethyl coumarate, which differ by
rotation around the C8-C9 bond (Figure 4.11). Both configurations, when optimised,
produce geometries that are in their own right in potential energy wells of the surface. As
such, the optimisation of the higher energy conformer determines a local energy minimum
which does not correspond to the global energy minimum. Calculations started from an
initial MMFF geometry, gave higher energy structures than those started from the MMFF
conformer, which identifies the global energy minimum.

Chapter 4: Photoisomerisation of Hydroxycinnamic Acids
96
EtO O
OH OH
EtO
O
OH
O
OEt
a) b)
OR
C8
C9
Figure 4.11: cis-Ethyl coumarate conformers produced by: a) drawing trans-ethyl
coumarate and rotating the dihedral; and b) drawing cis-ethyl coumarate.
The energy profile of p-coumaroyl glucose (9) (Figure 4.12) incorporates first identifying
the MMFF conformer before calculating the S0 profile from both the trans- and cis-isomers
towards the 90o dihedral. The results suggest that different p-coumarate substrates do not
appear to have a large enough effect on the excitation energy to heavily effect the extent or
speed of isomerisation. The energy profiles of p-coumaric acid (3), ethyl coumarate (11)
and p-coumaroyl glucose (9) display similar characteristics and energy barriers.
Dihedral Angle
En
erg
y (
kJ/m
ol)
0 30 60 90 120 150 1800
100
200
300
S0 ForwardsS0 BackwardsT1
Figure 4.12: Energy profile for p-coumaroyl glucose (9), relative to S0 trans-isomer. See
Appendix 3, Table A3.3 for calculated energies and relative differences.
The potential for the different solvent conditions that the glucose esters encountered during
synthesis (aqueous) compared with the other hydroxycinnamates (organic) to have an
effect on the isomerisation exists, as noted by Kahnt.187 Repeating the theoretical analysis
for p-coumaric acid (3) and p-coumaroyl glucose (9) in water (Figure 4.13) yields near
identical energy profiles as shown by the T1 energy profiles which mimic that observed
respectively within Figures 4.8 and 4.12, which were calculated in a vacuum.

Chapter 4: Photoisomerisation of Hydroxycinnamic Acids
97
a)
Dihedral Angle
En
erg
y (
kJ/m
ol)
0 30 60 90 120 150 180180
200
220
240
260
b)
Dihedral Angle
En
erg
y (
kJ/m
ol)
0 30 60 90 120 150 180200
220
240
260
280
Figure 4.13: a) T1 energy profile for p-coumaric acid (3) in water, relative to the S0 trans-
acid. b) T1 energy profile for p-coumaroyl glucose (9) water, relative to the S0 trans-
isomer. See Appendix 3, Table A3.4 for calculated energies and relative differences.
The solvated and vacuum calculated T1 profiles appear to have similar energies, and all
display diabatic profiles, whereby the lowest energy conformation in the T1 state is at a 90o
dihedral angle, which will relax to the S0 state at the highest energy point and potentially
produce either isomer. The shape of the T1 and S0 profiles, and the energy differences
between the S0 and T1 states (the vertical excitation energies) do not change excessively as
a result of either solvation or substrate. Furthermore, optimising the geometry of the T1
state may lead to incorrect vertical excitation energies as the S0 geometry of a molecule is
excited directly to the T1 state, rather than excited to a different, optimised T1 geometry.
Therefore, the vertical excitation energies should be a result of an optimised geometry for
the S0 state, followed by a single point energy calculation for that geometry at the T1 state.
In addition to the S0-T1 vertical excitation energy, the HOMO-LUMO gap was determined
for trans-p-coumaric acid (3) and trans-p-coumaroyl glucose (9) under the effect of
solvation (Figure 4.14). The vertical excitation energy, along with the HOMO-LUMO gap
should decrease with increasing solvent polarity for a π- π* transition due to the
comparative stabilising effect on the π* orbital compared with the π orbital.221
Determination of solvation effects was investigated using solvent ET30 values as shown in
Table 4.3, with a solvent of higher polarity possessing a greater ET30 value.

Chapter 4: Photoisomerisation of Hydroxycinnamic Acids
98
Table 4.3: Solvent polarities and ET30 values.
Solvent Dielectric Constant ET30 Value
Water 80 63.1
Ethanol 24.6 51.9Acetone 21 42.2DCM 9.1 40.7THF 7.5 37.4Ether 4.3 34.5
ET30
En
erg
y (
kJ/m
ol)
30 35 40 45 50 55 60 65245
250
255
260
265trans-p-Coumaric Acidtrans-p-CoumaroylGlucose
Figure 4.14: S0-T1 vertical excitation energy for trans-p-coumaric acid (3) and trans-p-
coumaroyl glucose (9). See Appendix 4, Table A4.1 for calculated vertical excitation
energies.
The vertical excitation energies of trans-p-coumaric acid and trans-p-coumaroyl glucose in
numerous solvents (Figure 4.14) differ by approximately 7 kJ/mol throughout the solvents
tested, and it is unlikely that such a small difference in vertical excitation energy between
the substrates would explain the vast difference in the ease of isomerisation that was
observed during synthesis. However, the HOMO-LUMO gaps of the S0 compounds in each
of the solvents (Figure 4.15) indicate a similar change in energy as displayed for the
vertical excitation energies, without having to calculate the energy of the T1 state,
providing a more rapid indication of the vertical excitation energies.
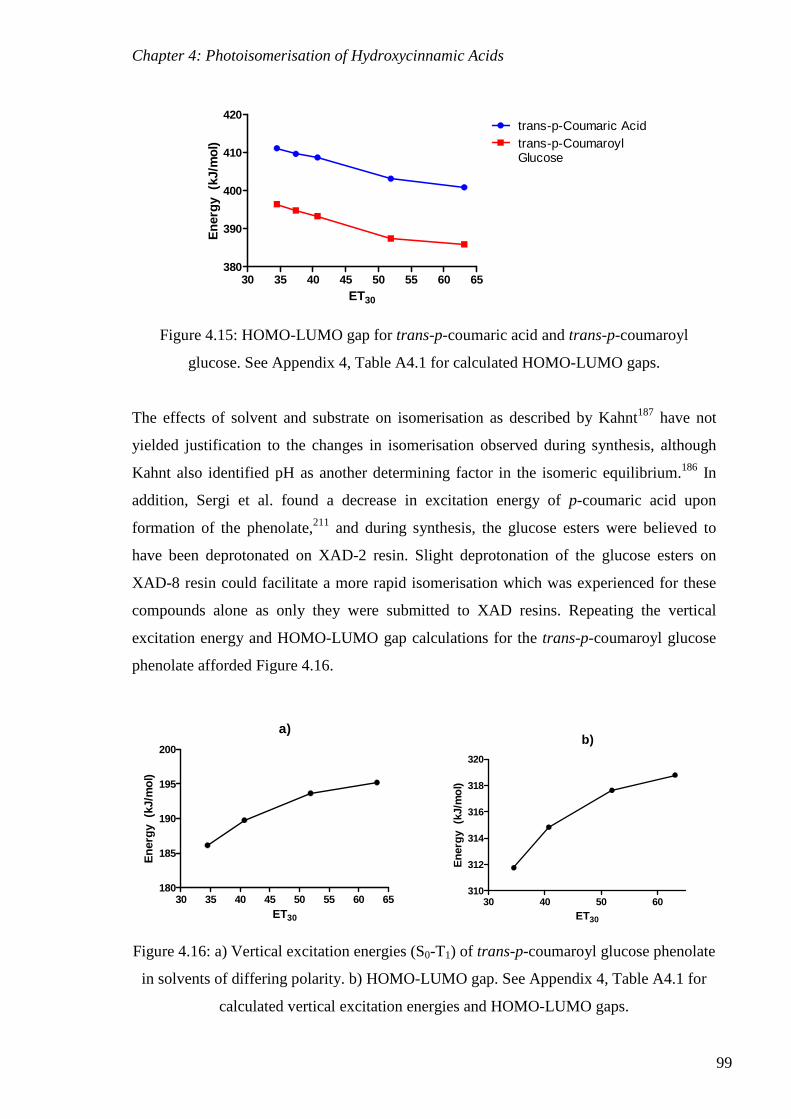
Chapter 4: Photoisomerisation of Hydroxycinnamic Acids
99
ET30
En
erg
y (
kJ/m
ol)
30 35 40 45 50 55 60 65380
390
400
410
420trans-p-Coumaric Acidtrans-p-CoumaroylGlucose
Figure 4.15: HOMO-LUMO gap for trans-p-coumaric acid and trans-p-coumaroyl
glucose. See Appendix 4, Table A4.1 for calculated HOMO-LUMO gaps.
The effects of solvent and substrate on isomerisation as described by Kahnt187 have not
yielded justification to the changes in isomerisation observed during synthesis, although
Kahnt also identified pH as another determining factor in the isomeric equilibrium.186 In
addition, Sergi et al. found a decrease in excitation energy of p-coumaric acid upon
formation of the phenolate,211 and during synthesis, the glucose esters were believed to
have been deprotonated on XAD-2 resin. Slight deprotonation of the glucose esters on
XAD-8 resin could facilitate a more rapid isomerisation which was experienced for these
compounds alone as only they were submitted to XAD resins. Repeating the vertical
excitation energy and HOMO-LUMO gap calculations for the trans-p-coumaroyl glucose
phenolate afforded Figure 4.16.
a)
ET30
En
erg
y (
kJ/m
ol)
30 35 40 45 50 55 60 65180
185
190
195
200
Figure 4.16: a) Vertical excitation energies (S0-T1) of trans-p-coumaroyl glucose phenolate
in solvents of differing polarity. b) HOMO-LUMO gap. See Appendix 4, Table A4.1 for
calculated vertical excitation energies and HOMO-LUMO gaps.
b)
ET30
En
erg
y (
kJ/m
ol)
30 40 50 60310
312
314
316
318
320

Chapter 4: Photoisomerisation of Hydroxycinnamic Acids
100
As seen by Sergi, a significant reduction of the vertical excitation energy is observed for
the trans-p-coumaroyl glucose phenolate to between 185 and 195 kJ/mol from 250-255
kJ/mol calculated for the protonated form. Again, evidence of this trend is observed in the
reduction of the HOMO-LUMO gap, indicating that phenolic deprotonation facilitates the
isomerisation away from the trans-isomer. Furthermore, if deprotonation of p-coumaroyl
glucose significantly effects the energy barrier to isomerisation, then the earlier hypothesis
regarding the base-catalysed ester hydrolysis inducing isomerisation from the cis-
hydroxycinnamates back to the trans-isomers, may in part be justified.
By comparing the HOMO-LUMO gaps of the cis- and trans-hydroxycinnamates examined
throughout this study (p-coumaric acid, ethyl coumarate and p-coumaroyl glucose), similar
conclusions can be made, that the trans-glucose esters are slightly more prone to
isomerisation away from the trans-isomer, and the energy barrier to isomerisation is
lowered with increasing solvent polarity (Figure 4.17). Additionally, the HOMO-LUMO
gaps of the cis-isomers gave the same trend with regard to solvent polarity, again with only
minor differences observed between substrates.

Chapter 4: Photoisomerisation of Hydroxycinnamic Acids
101
a)
ET30
Ene
rgy
(kJ/
mol
)30 40 50 60
380
390
400
410
420trans-Ethyl Coumaratetrans-p-Coumaric Acidtrans-p-CoumaroylGlucose
b)
ET30
En
erg
y (k
J/m
ol)
30 40 50 60390
395
400
405
410cis-Ethyl Coumaratecis-p-Coumaric Acidcis-p-Coumaroyl Glucose
Figure 4.17: a) HOMO-LUMO gap of trans-hydroxycinnamates. b) HOMO-LUMO gap of
cis-hydroxycinnamates. See Appendix 4, Table A4.2 and A4.3 for orbital energies HOMO-
LUMO gaps.
The relative stability of the cis-ethyl esters (cis-11 and cis-12) compared with the cis-acids
(cis-3 and cis-4) can only be attributed to the different solvents that the compounds
experienced, with the ethyl esters being synthesised and purified with less polar solvents
(i.e. dichloromethane), while the acids were prepared in ethanol and water, with this study
providing no other explanation as to the ease with which the acids isomerise.
In order to assess the hypothesis that during the attempted cis-hydroxycinnamic acid
synthesis, base-catalysed ester hydrolysis was the main contributing factor to
isomerisation, the nature of the compounds that existed under the reaction conditions have
to be determined. Literature pKa values for p-coumaric acid are 4.35 and 8.80 which
correspond to the carboxyl group and the phenol group, respectively.222 With a pKa of
4.35, the carboxylate would be heavily deprotonated at the pH needed to form the
phenolate, as such, the phenolate needs only be considered if the carboxylate anion is also
taken into account. At the pH of reaction, determined to be 13 as shown by pH strips, cis-

Chapter 4: Photoisomerisation of Hydroxycinnamic Acids
102
ethyl coumarate (cis-11) would exist as the phenolate. Ester hydrolysis yields cis-p-
coumaric acid dianion, which is protonated fully during acidic work-up (to pH 3) yielding
cis-p-coumaric acid (cis-3). The HOMO-LUMO gaps of each of the two anionic structures
present during reaction have been calculated under different solvent conditions, and
compared with cis-ethyl coumarate and cis-p-coumaric acid (Figure 4.18).
ET30
En
erg
y (k
J/m
ol)
30 35 40 45 50 55 60 65320
340
360
380
400
420cis-Ethyl Coumaratecis-Ethyl Coumarateanioncis-p-Coumaric Aciddianioncis-p-Coumaric Acid
Figure 4.18: HOMO-LUMO gaps of cis-hydroxycinnamates during base-catalysed ester
hydrolysis. See Appendix 4, Table A4.4 for orbital energies and HOMO-LUMO gaps.
The HOMO-LUMO gap of the cis-ethyl coumarate phenolate is considerably lower than
for the protonated form, implying that the greatest potential for cis- to trans-isomerisation
during this reaction is observed for the phenolate. While the cis-p-coumaric dianion has a
reduced HOMO-LUMO gap compared with the protonated forms, and would be more
likely to isomerise back to the trans-isomer. Thus, the cis-ethyl coumarate phenolate must
be largely responsible.
Additionally, those species existing as phenolic anions would be expected to have a much
greater electron donating character, leading to increased resonance forms and hence
reducing the double bond character of the alkene. It can only be assumed that this effect is
not as great for the p-coumaric dianion, as the formation of the carboxylate anion reduces
the electron withdrawing character of the carboxyl and retarding electron movement
throughout the molecule. If this is indeed the case, then calculation of the p-coumaric
carboxylate (with a protonated phenol) HOMO-LUMO would result in an increase in
HOMO-LUMO gap due to a similar electron donating character of the phenol as observed
for p-coumaric acid, but with reduced electron withdrawing character at the top of the
molecule, as determined by the charge on oxygen 3 (Figure 4.19).

Chapter 4: Photoisomerisation of Hydroxycinnamic Acids
103
O O
R
OR'
1
23
Figure 4.19: Numbering of oxygen atoms in hydroxycinnamate skeleton.
ET30
En
erg
y (k
J/m
ol)
30 40 50 60
380
400
420
440trans-p-Coumariccarboxylatecis-p-Coumaric carboxylate
Figure 4.20: HOMO-LUMO gap of p-coumaric acid carboxylate. See Appendix 4, Table
A4.5 for HOMO-LUMO gaps.
The HOMO-LUMO gap of the p-coumaric acid carboxylate in less polar solvents is similar
to those observed for p-coumaric acid, but in more polar solvents, there is a great increase
in the HOMO-LUMO gap of the carboxylate. This supports the theory that the energies of
isomerisation within the hydroxycinnamates are largely dependent on the nature of
intramolecular electronics, and the ability to reduce the double bond character of the
alkene.
The natural charge on the phenolic oxygen (Oxygen 1) and on the single-bonded
carboxylic oxygen (Oxygen 3) was determined for all of the hydroxycinnamates
investigated throughout this study (p-coumaric acid, p-coumaric acid carboxylate, p-
coumaric acid dianion, ethyl coumarate, ethyl coumarate phenolate, p-coumaroyl glucose
and p-coumaroyl glucose phenolate). The charge ratio (O1/O3) was then calculated in
order to provide an indication of the nature of the electronics of each group and what effect
they will have directly on the HOMO-LUMO gap (Figure 4.21). With good linear

Chapter 4: Photoisomerisation of Hydroxycinnamic Acids
104
correlation observed between oxygen charge ratio and HOMO-LUMO gap, additional
substrates were investigated including 1-O-acetyl p-coumaric acid (19) and 1-O-
chloroacetyl p-coumaric acid (21), with an expected reduction in electron donating
character of the ring giving a higher HOMO-LUMO gap, and the carboxylate anions of 19
and 21, in which the effect should be intensified.
HOMO-LUMO gap
Oxy
gen
Ch
arg
e R
atio
300 350 400 4500.0
0.5
1.0
1.5
2.0
2.5
Figure 4.21: HOMO-LUMO gaps of hydroxycinnamate derivatives against ratio of charge
between oxygen 1 and oxygen 3. See Appendix 4, Table A4.6 and A4.7 for charges on the
oxygen atoms and calculated ratios.
The HOMO-LUMO gap shows a rough linear relationship with the charge ratio of the
compounds investigated. Those with a large charge on oxygen 3 compared with oxygen 1
(lower ratio) are expected to have a lesser effect on the double bond and display an
increased HOMO-LUMO gap, where as those with large negative phenolic oxygen charges
and less negative charge on oxygen 3 are expected to have a much larger effect on the
double bond. Increased electron movement within the molecule decreases the HOMO-
LUMO gap and suggest that they will be more prone to isomerisation, which is also seen
by mapping the HOMO-LUMO gap against double bond length (Figure 4.22). The linear
correlation between the bond length or oxygen charge ratio and the HOMO-LUMO gap
indicates that increased resonance of the substrates increases the chance of
photoisomerisation.

Chapter 4: Photoisomerisation of Hydroxycinnamic Acids
105
HOMO-LUMO gapB
on
d L
eng
th (
Å)
300 350 400 4501.34
1.35
1.36
1.37
1.38
Figure 4.22: Relationship between HOMO-LUMO gap and double bond length in
hydroxycinnamate derivatives. See Appendix 4, Table A4.6 and A4.7 for alkene bond
length.
4.5 Conclusions.
The synthesis and attempted isolation of the cis-hydroxycinnamic acids (cis-3 and cis-4)
resulted in isomeric mixtures, which proved stable and could be maintained under
fermentation conditions. The cis-ethyl esters (cis-11 and cis-12) could be isolated and
handled under ambient light conditions without noticeable isomerisation back to the trans-
isomers. As such, fermentation studies into the stereospecificity of the D. bruxellensis
decarboxylase activity will need to be limited to spikes of isomeric mixtures of cis/trans-
hydroxycinnamic acids, and be fermented against pure trans-acids with the difference in
ethylphenol formation between them examined (Chapter 5).
Base-catalysed ester hydrolysis of the cis-ethyl esters involved formation of cis-ethyl ester
phenolates which were found to have a much lower HOMO-LUMO gap that could be
largely implemented in the conversion back to the trans-isomers. The relative stabilities of
the ethyl esters compared with the hydroxycinnamic acids could only be attributed to a
lowering of the HOMO-LUMO gap in solvents of increasing polarity, with the
environments needed to handle (synthesise or analyse) each compound contributing to
isomerisation. Additionally, the use of group 10 metals in the presence of cis- or trans-
ethyl coumarate was found to encourage formation of the trans-isomer. The use of
transition metals may have future applications in stereochemical control of the
hydroxycinnamic acids in synthetic attempts.

Chapter 4: Photoisomerisation of Hydroxycinnamic Acids
106
The energy required to excite p-coumaroyl glucose (9) to the T1 state and facilitate
cis/trans-isomerisation was lower than for p-coumaric acid (3), but was further lowered by
formation of the phenolate, of which there was evidence of occurring during contact with
XAD resins. As such, the use of XAD resins with the hydroxycinnamic acids should be
performed under strictly acidic conditions, preventing phenolate formation, or it should be
performed under light conditions of lower energy. In this study, red light proved useful in
preventing isomerisation.
Further studies into the isomerisation of hydroxycinnamates observed during synthesis
showed a relationship between the electronic make-up of the molecule and the energy
needed to facilitate photoisomerisation, with compounds allowing increased electron
movement, having reduced HOMO-LUMO gaps. This result indicates that even if the
glucose esters had not been completely deprotonated on the XAD resin, any extent of
hydrogen bonding to the phenol that would increase the electron donating character of the
phenolic oxygen would also decrease the energy required for photoisomerisation to occur.

Chapter 5: Bioconversion of Hydroxycinnamates by D. bruxellensis
107
Chapter 5: Bioconversion of Hydroxycinnamates by D.
bruxellensis.
5.1 Bioconversion of trans-Hydroxycinnamate Esters.
5.1.1 Ethyl Esters
O O
OH
O O
OH
OCH3
11 12
Figure 5.1: Ethyl coumarate (11) and ethyl ferulate (12).
Bioconversion of the ethyl hydroxycinnamates (11 and 12) by D. bruxellensis strain AWRI
1499, a representative of the predominant strain grouping in Australian winemaking,22 was
studied and the outcome determined by the production of 4-ethylphenol and 4-
ethylguaiacol. The self-anaerobic fermentations were conducted to maximise the
conversion from precursors, through vinylphenols to ethylphenols.21 Yeast biomass peaked
at day 6 and the fermentations were conducted for a further 3 days, concluding shortly after
the yeast entered stationary phase to maximise the potential metabolism of the ethyl esters.

Chapter 5: Bioconversion of Hydroxycinnamates by D. bruxellensis
108
Fermentation Progress (Days)
Per
cen
tag
e C
on
vers
ion
2 4 6 8 100
20
40
604-Ethylphenol4-Ethylguaiacol
Figure 5.2: Percentage of the theoretical maximum conversion of ethyl esters (11 and 12)
to ethylphenols.
AWRI 1499 displayed a much greater affinity for metabolism of ethyl coumarate (51.4%
conversion to 4-ethylphenol), over ethyl ferulate (4.0% conversion to 4-ethylguaiacol).
This appears to be a product of the esterase activity as such a preference is not observed for
the decarboxylase during the metabolism of the free hydroxycinnamic acids, as seen in a
later experiment and in literature reports.
Furthermore, Godoy et al. studied a purified p-coumarate decarboxylase enzyme from B.
bruxellensis and tested for substrate specificity with p-coumaric acid, caffeic acid and
ferulic acid. The decarboxylase was effective in metabolism of all three substrates with an
activity of 120 and 80% for caffeic and ferulic acids relative to that of p-coumaric acid.68
Similar results were observed by Edlin et al. for a hydroxycinnamate decarboxylase from
B. anomalus, although preferential breakdown was witnessed for caffeic acid, followed by
p-coumaric and ferulic with relative activities of 37.5 and 31.3%, respectively.70
The preferential breakdown of p-coumaric acid compared with that for ferulic acid, as
detailed in these two studies, occurred with relative activities of 1.25 and 1.20, rendering
unlikely the possibility that in this instance the decarboxylase could account for a favoured
formation of 4-ethylphenol over 4-ethylguaiacol by a factor of 12.85.
Therefore the substrate selectivity is presumably a product of the esterase activity of
AWRI 1499 which could be substantiated by the recovery of the remaining ethyl esters in
the fermentation samples using the GC-MS SIDA method as described by Sleep.141 This
method has been validated for quantification up to 10 mg/L in wine, and as such could be

Chapter 5: Bioconversion of Hydroxycinnamates by D. bruxellensis
109
employed without dilution of the fermentation samples. Combining the recovery of the
initially spiked ethyl esters with the evolution of ethylphenols provides a total recovery
(Figures 5.3 and 5.4).
Fermentation Progress (Days)
Per
cen
t R
eco
vere
d
2 4 6 8 100
20
40
60
80
100 4-EthylphenolEthyl CoumarateTotal Recovery
Figure 5.3: Percentage recovery of coumarates in fermentations.
Fermentation Progress (Days)
Per
cen
t R
eco
vere
d
2 4 6 8 100
20
40
60
80
100 4-EthylguaiacolEthyl FerulateTotal Recovery
Figure 5.4: Percentage recovery of ferulates in fermentations.
The total recovery at the conclusion of fermentation was approximately 80% for both the
ferulate series and the coumarate series. In addition to minor contributions by the acids and
vinylphenols, slight losses are expected through adsorption onto the yeast,93, 223 as well as
through loss of the volatile ethylphenols through the gas-lock. Although, with the
significant amount of remaining ethyl ferulate in the ferments, it can be concluded that, for
AWRI 1499, uptake and metabolism of ethyl coumarate is preferential over ethyl ferulate.
This suggests that the ethyl esterase activity of AWRI 1499 exhibits a substrate selectivity.

Chapter 5: Bioconversion of Hydroxycinnamates by D. bruxellensis
110
5.1.2 Ethyl Esterase Substrate Selectivity
As well as establishing the potential for spoilage caused by the breakdown of ethyl
coumarate (11), the ethyl ester substrate selectivity shown for AWRI 1499 has the potential
to accentuate the ratio of 4-ethylphenol:4-ethylguaiacol in wine. To determine whether this
selectivity is strain dependant or is common throughout D. bruxellensis, fermentation
experiments with strains representing the two remaining significant genetic groups (AWRI
1608 and AWRI 1613), in the presence of ethyl coumarate (11) and ethyl ferulate (12)
were conducted, along with a repeat fermentation with AWRI 1499. By using D.
bruxellensis strains AWRI 1499, 1608 and 1613, representatives of the three genetic
groups that contribute to 98% of Australian wine isolates were studied. End-point analyses
of 4-ethylphenol and 4-ethylguaiacol were conducted for all fermentations (Figure 5.5).
Per
cen
tag
e C
on
vers
ion
AWRI 1
499
AWRI 1
608
AWRI 1
613
0
20
40
60
804-Ethylphenol4-Ethylguaiacol
Figure 5.5: Percentage of the theoretical maximum conversion from ethyl coumarate (11)
and ethyl ferulate (12) to ethylphenols by different strains of D. bruxellensis.
The preference shown in the previous experiment by AWRI 1499 was observed again, with
ethyl coumarate metabolised over ethyl ferulate by a factor of 8.75. In this instance the
fermentations were conducted over a longer period as the evolution of ethylphenols was
still showing an upward trend after 9 days in the previous experiment (Figure 5.2). AWRI
1608 also displayed a preferential metabolism for ethyl coumarate, however in this case by
a factor of 18.75, due largely to lesser production of 4-ethylguaiacol.
D. bruxellensis AWRI 1613 did not convert either ethyl ester to the respective ethylphenol.
Subsequent analysis of the end-point fermentation samples by HPLC using ethyl
coumarate and ethyl ferulate as external standards indicated that both esters remained at

Chapter 5: Bioconversion of Hydroxycinnamates by D. bruxellensis
111
the same concentration at which they were spiked. The experiment with AWRI 1613 was
repeated to confirm these findings, and again did not metabolise the ethyl esters, indicating
an inability to express the necessary esterase activity to facilitate this breakdown.
Greater concentrations of 4-ethylphenol over 4-ethylguaiacol in wine is well
documented,41, 63 and has been attributed to the relative amounts of precursors present in
the grapes. However, these results show that not only will this ratio be defined by the
relative amounts of free hydroxycinnamic acids present in the berry, but also by the
relative amounts of ethyl esters produced during vinification. A 10:1 ratio of 4-
ethylphenol:4-ethylguaiacol could imply an initial 10:1 ratio of p-coumaric acid:ferulic
acid, but it could also imply a 1:1 ratio of ethyl coumarate:ethyl ferulate and a 10:1
selectivity in the metabolism of the esters, or a combination of these two effects.
As the ethyl esters are able to be metabolised by some strains of D. bruxellesis and
contribute to the accumulation of ethylphenols, the esterification of the free acids during
alcoholic fermentation is not a means to avoiding spoilage caused by D. bruxellensis.
Instead, this confirms that additional factors need to be considered when assessing a wine
for the potential production of ethylphenols, such as the extent of formation of esters as
well as the strain of D. bruxellensis that proliferates, given that in the presence of AWRI
1613 the ethyl esters are benign in the accumulation of ethylphenols.
5.1.3 Tartrate Esters
O O
OH
HOOC
COOH
OH
O O
OH
HOOC
COOH
OH
OCH3
7 8
Figure 5.6: p-Coumaroyl L-tartrate (7) and feruloyl L-tartrate (8).

Chapter 5: Bioconversion of Hydroxycinnamates by D. bruxellensis
112
Fermentation experiments with AWRI 1499 in the presence of p-coumaroyl and feruloyl
tartrate (7 and 8) yielded no conversion to 4-ethylphenol (4-EP) or 4-ethylguaiacol (4-EG)
after 10 days of fermentation, and to ensure the legitimacy of the result the experiment was
repeated, and identical results observed. As such, the ability of different strains of D.
bruxellensis to metabolise the tartrate esters were tested in fermentation experiments with
AWRI 1608 and AWRI 1613. Analysis for ethylphenol content in the end-point
fermentation samples again failed to detect either 4-ethylphenol (4-EP) or 4-ethylguaiacol
(4-EG) for both strains examined (Table 5.1).
Given, the dilutions used prior to analysis, and the limit of detection for the methodology
at 10 µg/L, the minimum detectable concentration of ethylphenols in the AWRI 1499
fermentations corresponds to 1.25% conversion from the tartrate esters. Detection in the
AWRI 1608 and AWRI 1613 fermentations was limited at around 0.7% conversion, having
employed a smaller dilution factor in preparation of the samples for analysis, due to the
lack of ethylphenol production observed in the initial experiments.
Table 5.1: Ethylphenol content in tartrate ester fermentation experiments.
4-EP 4-EGAWRI 1499 rep. 1 N.D. N.D.AWRI 1499 rep. 2 N.D. N.D.
AWRI 1608 N.D. N.D.AWRI 1613 N.D. N.D.
As outlined in Chapter 1, with the abundance of the tartrate esters, they are often the major
hydroxycinnamates found in grape juice, although the potential for them to contribute to
ethylphenol spoilage is now understood to be somewhat limited and unlike the ethyl esters
appears not to be determined by the yeast strain.
While D. bruxellensis appears to lack the capability to hydrolyse the tartrate esters, and
hence they are unlikely to contribute to the accumulation of the ethylphenols during barrel
ageing, the tartrate ester content of the berries still remains a source of the free
hydroxycinnamic acids (3 and 4). The previously mentioned studies of Dugelay and
Gerbeaux showed that the tartrates could be hydrolysed using commercial enzyme
preparations,64, 112 and there is a loss observed during vinification,97, 99-105, 129-130, 132 as such
the hydroxycinnamoyl tartrate esters (7 and 8) cannot be completely ignored during the
entire vinification process.

Chapter 5: Bioconversion of Hydroxycinnamates by D. bruxellensis
113
5.1.4 Glucose Esters
OO
OH
OO
OH
H3CO
9 10
O O
OH
HOHO
OH
OH
HOHO
OH
Figure 5.7: p-Coumaroyl glucose (9) and feruloyl glucose (10).
The synthetic samples of the glucose esters (9 and 10) were initially spiked as mixtures of
multiple esters, with the majority existing as the 1-O-β-, 2-O-α- and 6-O-α-esters, though
the 1-O-β-esters were found to be thermodynamically favoured in wine-like environments,
as shown by theoretical studies (Chapter 3) and by their prevalence during storage in
fermentation-like conditions (Chapter 2). Regardless of the ratio of esters present at the
time of fermentation, the release of the free hydroxycinnamic acids must be achieved by
hydrolysis of a hydroxycinnamoyl glucose ester. Fermentation studies with AWRI 1499
were concluded after 16 days, and all samples that were taken throughout the experiment
were analysed for content of the ethylphenols (Figure 5.8).
Fermentation Progress (Days)
Per
cen
tag
e C
on
vers
ion
4 8 12 160
10
20
30
40 4-Ethylphenol4-Ethylguaiacol
Figure 5.8: Percentage of the theoretical maximum conversion of hydroxycinnamoyl
glucose esters (9 and 10) to ethylphenols.

Chapter 5: Bioconversion of Hydroxycinnamates by D. bruxellensis
114
At the conclusion of fermentation, 4-ethylphenol and 4-ethylguaiacol were detected at
levels corresponding to 35% conversion from the glucose esters (9 and 10), and remained
relatively constant from day 10 onwards. Unlike the ethyl esters, p-coumaroyl glucose and
feruloyl glucose were metabolised to a similar extent (Figure 5.8).
Due to the previously described stability of the glucose esters in fermentation-like
conditions, both experimentally observed in Chapter 2 and reported in the literature,100 it
can be concluded that the evolution of the ethylphenols is not a product of chemical
hydrolysis of the glucose esters followed by the expected metabolism of the acids. The
moderate conversion of the glucose esters to ethylphenols, along with the observed glucose
ester concentrations in wine (outlined in Chapter 1), indicate that while they can contribute
to the accumulation of ethylphenols during barrel ageing, the metabolism of the glucose
esters alone would not have major effects on the organoleptic properties of the resulting
wine.
5.1.5 Conclusions for Chapter 5.1
For the first time, this work has shown the ability of D. bruxellensis to metabolise
esterified hydroxycinnamic acids directly to ethylphenols. Furthermore, the differences in
breakdown observed between different classes of esters implies the presence of multiple
pathways, or enzyme activities, involved in the release of free hydroxycinnamic acids from
an esterified form. The formation of 4-ethylphenol and 4-ethylguaiacol from the ethyl
esters (11 and 12) shows an overall preference for the breakdown of ethyl coumarate,
though the reasons for stereoselective bioconversion remain to be identified. The high
proportions of ethyl ferulate in the fermentation samples could be a result of a decrease in
transport into the yeast cell for an intracellular esterase, equivalent transport into the cell
but decreased conversion due to the nature of the enzyme, or selective activity of an
extracellular esterase.
The inability of D. bruxellensis to metabolise the tartrate esters (7 and 8), and the moderate
conversion observed for the glucose esters, mean that apart from the metabolism already
known for p-coumaric and ferulic acids, ethyl coumarate has the largest potential to
contribute to wine spoilage, having been found at concentrations high enough to generate
sufficient ethylphenols to affect wine aroma and flavour. However, the formation and

Chapter 5: Bioconversion of Hydroxycinnamates by D. bruxellensis
115
metabolism of ethyl coumarate depends on many variables which would need to be
considered. Initially, the concentration of p-coumaric acid in the wine will be determined
both by that present in the berry, as well as the release from p-coumaroyl tartrate through
enzymatic or chemical hydrolyses. Following this, the formation of ethyl coumarate from
p-coumaric acid via esterification with ethanol could be effected by the enzymatic abilities
of the wine microflora (transferases), or by conditions affecting the equilibrium of a
chemical esterification, or trans-esterification, such as pH and ethanol concentration.
Finally, as shown above (Figure 5.5), the strain of D. bruxellensis can determine the
conversion of ethyl coumarate to 4-ethylphenol, if any.
The glucose esters could contribute to the accumulation of ethylphenols in barrels, though
the concentrations in which they are present they are unlikely to be able to produce
sufficient ethylphenols to cause wine spoilage on their own. However, in addition to the
contribution from the ethyl esters and the free acids, the glucose esters could be the
determining factor in whether the ethylphenol content is above or below the perception
threshold.
It can now be seen that not only the free acids contribute to the accumulation of
ethylphenols, but that certain hydroxycinnamate esters are also potential sources of
spoilage, although this cannot be assumed for all hydroxycinnamates. With the extent of
bioconversion differing between substrate, class of ester and strain of D. bruxellensis, the
breakdown of each esterified hydroxycinnamate must be tested individually and strain
dependencies must be considered.
5.2 Stereoselectivity of D. bruxellensis Enzyme Activities.
5.2.1 Decarboxylase Stereoselectivity
Following the photoisomerisation of the hydroxycinnamoyl glucose esters during
synthesis, the ability of D. bruxellensis to produce ethylphenols through the metabolism of
cis-hydroxycinnamates was of interest. As the breakdown of all hydroxycinnamates to
form ethylphenols must proceed via decarboxylation of the acid, synthesis of the cis-acids
was attempted (Chapter 4). The inability to synthesise a pure sample of cis-ferulic acid

Chapter 5: Bioconversion of Hydroxycinnamates by D. bruxellensis
116
resulted in the use of an isomeric mixture of known stable ratio was chosen. In the case of
ferulic acid (4) a thermodynamically stable 50:50 mixture of the cis- and trans-isomers
was achieved, whereas p-coumaric acid (3) existed as a 39:61 mixture of the cis- and trans-
isomers. The analytical technique most readily available for real-time determination of the
isomeric ratio during fermentation was NMR. Due to overlap of crucial proton shifts
between p-coumaric and ferulic, the decarboxylase stereoselectivity could not be examined
for both acids concurrently. As ferulic acid was obtained with an equal cis:trans-ratio, it
was tested prior to p-coumaric acid, and the isomeric mixture was submitted to
fermentation studies with AWRI 1499 (cis/trans-fermentations) and compared with
fermentations spiked with pure trans-ferulic acid (trans-fermentations).
The isomeric ratio during the fermentation experiments was monitored by extracting
uninoculated controls and analysing by NMR. Enough of each acid needed to be present in
the uninoculated controls to ensure that adequate spectra could be obtained to determine
the isomeric ratio. Thus, allowing for losses during extraction, 10 mg of the mixture was
required in each control (200 mL), which equated to initial spiked concentrations of 50
mg/L. As Kahnt described the changes in isomerisation equilibrium with changing
substrate concentrations,187 to avoid any effects of concentration on the isomeric ratio the
inoculated fermentations were also spiked at 50 mg/L, five times higher than previously
used for the trans-hydroxycinnamate esters. Throughout fermentation the ratio of
cis:trans-ferulic acid in the uninoculated controls remained stable, and the results for 4-
ethylguaiacol analysis of samples taken throughout fermentation are given below (Figure
5.9).
Fermentation Progress (Days)
Per
cen
tag
e C
on
vers
ion
2 4 6 8 100
20
40
60
80 trans-Fermentationscis/trans-Fermentations
Figure 5.9: Percentage of the theoretical maximum conversion to 4-ethylguaiacol for the
trans- and cis/trans- fermentations.

Chapter 5: Bioconversion of Hydroxycinnamates by D. bruxellensis
117
The fermentations supplemented with a mixture of 50:50 cis:trans-ferulic acid produced
approximately half as much 4-ethylguaiacol as the fermentations containing only trans-
ferulic acid. The evolution of 4-ethylguaiacol in the cis/trans-fermentations as a percentage
of the maximum conversion observed in the trans-fermentations is displayed in Figure
5.10, and shows more clearly the 50% reduction of 4-ethylguaiacol produced during the
cis/trans-fermentations.
Fermentation Progress (Days)
Per
cen
tag
e o
ftra
ns-F
erm
ent
2 4 6 8 100
10
20
30
40
50
Figure 5.10: Evolution of 4-ethylguaiacol in cis/trans-fermentations as a percentage of
maximum conversion observed in trans-fermentations.
While these results strongly suggest that cis-ferulic acid is not at all metabolised by D.
bruxellensis, quantification of the remaining ferulic acid in the fermentation samples would
confirm the inability to metabolise cis-ferulic acid.
Ferulic acid quantification techniques as outlined in a review by Barberousse et al. largely
employ reverse-phase HPLC, methanol-water-acid ternary solvent systems and run times
in excess of 20 minutes.224 However, a method previously developed by the AWRI
describes quantification of p-coumaric and ferulic acid using ion-exchange HPLC,
resulting in retention times of around 3 minutes for trans-ferulic acid (unpublished
method). Although analysis times are reduced using ion-exchange HPLC, the previous
analysis did not consider both isomers of ferulic acid and required optimisation to achieve
resolution of the cis- and trans-ferulic acid.
Using formic acid in water (0.1:99.9, solvent A) and formic acid in acetonitrile (0.1:99.9,
solvent B), the AWRI method (45% B, isocratic elution) gave very little separation of the

Chapter 5: Bioconversion of Hydroxycinnamates by D. bruxellensis
118
isomers. This method was further refined, requiring less of the organic solvent (A), with an
isocratic profile of 30% B resulting in similar separation to less organic systems, but with
significantly shorter run times.
To adequately quantify both trans- and cis-ferulic acid, a calibration curve for each had to
be produced. Preparing trans-ferulic acid samples in the concentration range of 1-75 mg/L
gave calibration curves with correlation coefficients of 0.9998 and 0.9973 for absorbance
at 280 and 320 nm, respectively. To overcome the instability of pure cis-ferulic acid,
cis/trans-ferulic acid mixtures of differing, yet known, concentrations and ratios were
produced and analysed. A maximum concentration of 75 mg/L was used with a 50:50
isomeric ratio equating to a maximum cis-ferulic acid content of 37.5 mg/L. Using the
trans-ferulic acid calibration curves the trans-isomer could be quantified in the mixture,
and the remaining cis-ferulic acid in the sample determined, giving calibration curves with
correlation coefficients of 0.9968 and 0.9937 for 280 and 320 nm, respectively. While a
number of different wavelengths were originally used for detection (280, 320, 353, 370 and
520 nm), only 4 of these gave reliable calibration curves for trans-ferulic acid (280, 320,
353 and 370 nm), and only two of those gave reliable calibration curves for cis-ferulic
acid, 280 and 320 nm, the most common wavelengths used to quantify ferulic acid.224
With initially spiked concentrations of 50 mg/L for trans-ferulic acid and 25 mg/L for cis-
ferulic acid (50% of a 50 mg/L spike), preparation of the calibration curves from 1-75
mg/L and 0.5-37.5 mg/L, respectively allowed for the fermentation samples to be analysed
without dilution. After the first 6 samples, overlap of the cis- and trans-ferulic acid peaks
occurred, caused by the drift in retention time of cis-ferulic acid. After refreshing the
column, the analysis could be resumed, though after analysis of the calibration samples and
only a few additional fermentation samples, peak overlap was experienced again. Ion-
exchange HPLC was not an adequate method of analysis for multiple samples due to the
limited number of samples that could be run before the column required refreshing.
Fortuitously, the original 6 samples analysed were the final (triplicate) samples of each of
the trans- and cis/trans-fermentations, as shown in Table 5.2.

Chapter 5: Bioconversion of Hydroxycinnamates by D. bruxellensis
119
Table 5.2: Concentration of cis- and trans-ferulic acid in end-point fermentation samples.
trans-Ferulic acid cis-Ferulic acid trans-Ferulic acid cis-Ferulic acid
trans-Ferments 1.02 ± 0.05 2.23 ± 0.11 50.0 0.0cis/trans-Ferments 0.44 ± 0.07 12.43 ± 0.07 25.0 25.0
Concentration (mg/L) Initial spike (mg/L)
The final ferulic acid concentrations (expressed as the percentage remaining), along with
the initial 4-ethylguaiacol quantifications (expressed as percentage conversion) are
combined to give total recoveries of approximately 70% (Figure 5.11). For the trans-
fermentations, most of the spiked acid is converted to 4-ethylguaiacol (70%) with around
3% remaining as ferulic acid, existing as 2% trans- and 1% cis-ferulic acid. As expected,
metabolism of trans-ferulic acid had occurred to a great extent leaving very little acid,
though some had isomerised to give a small cis-content. The cis/trans-fermentations
contain 4-ethylguaiacol concentrations corresponding to 40% conversion from the spiked
acid, with around 30% remaining as ferulic acid (25% cis-isomer and 5% trans-isomer).
Per
cen
tag
e R
eco
very
trans-
Ferm
ents
cis/tr
ans-
Ferm
ents
0
20
40
60
804-Ethylguaiacoltrans-Ferulic Acidcis-Ferulic Acid
Figure 5.11: Compounds by percentage in end-point fermentation samples.
Recovery of cis-ferulic acid was approximately 50% of the spiked 25 mg/L indicating a
potential for uptake by the yeast, but an inability to decarboxylate it. However, as
incomplete recovery of cis-ferulic acid was observed, the inability of AWRI 1499 to
metabolise cis-ferulic acid cannot be definitively confirmed.
The above fermentation experiment was repeated under the same conditions with cis- and
trans-p-coumaric acid (3) to determine whether the same effect was observed, fermenting

Chapter 5: Bioconversion of Hydroxycinnamates by D. bruxellensis
120
D. bruxellensis in the presence of a 39:61 cis:trans-mixture alongside trans-p-coumaric
acid. The evolution of 4-ethylphenol in both sets of fermentations was monitored
throughout the experiment (Figure 5.12), also the isomeric ratio in the blanks were
observed to be stable by NMR.
Fermentation Progress (Days)
Per
cen
tag
e C
on
vers
ion
to
4-E
P
2 4 6 8 10 120
20
40
60
80trans-Fermentscis/trans-Ferments
Figure 5.12: Percentage of the theoretical maximum conversion to 4-ethylphenol in trans-
and cis/trans- fermentations.
In an analogous fashion to the ferulic acid fermentations, conversion to 4-ethylphenol in
the cis/trans-p-coumaric acid fermentations corresponded to the trans-content, giving final
4-ethylphenol concentrations 39% lower than observed in the trans-fermentations (Figure
5.13).
Fermentation Progress (Days)
Per
cen
tag
e o
ftr
ans-
Fer
men
t
4 8 120
20
40
60
Figure 5.13: Evolution of 4-ethyphenol in cis/trans-fermentations as a percentage of
maximum conversion observed in trans-fermentations.

Chapter 5: Bioconversion of Hydroxycinnamates by D. bruxellensis
121
Slight deviations in 4-ethylphenol concentration may arise from a) partial isomerisation of
cis-p-coumaric acid back to the trans-isomer, b) from slight loss of 4-ethylphenol in the
trans-ferments due to the high concentrations produced, or c) from slight variations in the
amount of p-coumaric acid spiked into, or remaining in the fermentations produced from
solubility issues, caused by performing these fermentation experiments at higher
concentrations than employed previously.
The quantification of ferulic acid in the previous experiments did not provide additional
evidence as to the role of the cis-acid, with the final conclusions based purely on the
isomeric ratio of the spikes compared with the ratio of produced 4-ethylguaiacol. As such,
quantification of the cis- and trans-p-coumaric acids was not performed for these
fermentations. However, these results confirm that the metabolism of p-coumaric acid
occurs to a much greater extent for the trans-isomer and the role of the cis-acids in the
production of ethylphenols is not significant.
5.2.2 Ethyl Esterase Stereoselectivity
During the synthesis of the cis-hydroxycinnamic acids (3 and 4) detailed in Chapter 4, the
cis-ethyl esters were found to be stable under ambient light conditions. As the ability of D.
bruxellensis to metabolise the ethyl esters had been shown, if the cis-ethyl esters could also
be enzymatically hydrolysed, they were a potential source of pure cis-hydroxycinnamic
acids. Thus, cis-ethyl coumarate (11) and cis-ethyl ferulate (12) were simultaneously
submitted to fermentation experiments with AWRI 1499 and the evolution of ethylphenols
monitored (Figure 5.14).

Chapter 5: Bioconversion of Hydroxycinnamates by D. bruxellensis
122
Fermentation Progress (Days)
Per
cen
tag
e C
on
vers
ion
2 4 6 8 100.0
0.2
0.4
0.6
0.8
1.04-Ethylphenol4-Ethylguaiacol
L.o.Q.
Figure 5.14: Percentage of the theoretical maximum ethylphenol conversion from cis-ethyl
esters.
The amounts of 4-ethylphenol and 4-ethylguaiacol produced from metabolism of the cis-
ethyl esters were so low that some data points were below the limit of quantification
(L.o.Q.) for the analytical method (10 µg/L). The values that lay under the L.o.Q. are
approximated only but do indicate an upward trend that continues to above the limit of
detection.
Conversion to the ethylphenols under the same conditions (9 days of fermentation, Figure
5.2) was observed at 51 and 4% from trans-ethyl coumarate and trans-ethyl ferulate,
respectively. The production of ethylphenols observed during the cis-ethyl ester
fermentations, though minimal, could be explained by either the esterase being active
towards the cis-ethyl esters, or by partial isomerisation to yield trans-ethyl esters. For
production of ethylphenols via metabolism of the cis-ethyl esters, the resulting cis-acids
must isomerise and the trans-acids then metabolised. Otherwise the cis-ethyl esters
partially isomerised during the experiment to give a small amount of the trans-ethyl esters,
which were then broken down, or the samples of cis-ethyl esters used to spike the
fermentations contained trace impurities of the trans-isomers. The difference in conversion
observed between the cis-ethyl coumarate and cis-ethyl ferulate would suggest the latter,
brought about by the esterase substrate selectivity established earlier. Using the
quantification method of Sleep, the trans-ethyl esters in the fermentation samples could be
determined141 and the method was also applied in an attempt to quantify the cis-ethyl
esters.

Chapter 5: Bioconversion of Hydroxycinnamates by D. bruxellensis
123
Table 5.3: Final trans-ethyl ester content in cis-ethyl ester fermentations.
Initial cis-esterInoculated Uninoculated spike (mg/L)
Ethyl coumarate 1.1 ± 0.1 1.5 ± 0.1 10.0Ethyl ferulate 1.8 ± 0.1 1.8 ± 0.1 10.0
trans-Ester concentration (mg/L)
The uninoculated samples contain a minor but significant proportion of the trans-ethyl
esters which is not expected to occur purely over the course of the fermentation
experiments, and is most likely a result of the length of storage (due to instrument
availability the fermentation samples had to be stored for 9 months prior to analysis of the
ethyl esters content). If conversion from cis-ethyl coumarate to trans-ethyl coumarate had
occurred during fermentation a much larger concentration of 4-ethylphenol would be
expected, based on the conversions observed in previous experiments.
However, the minor differences in the amounts of trans-ethyl coumarate between the
inoculated and uninoculated fermentations suggest that minor conversion could have
occured during fermentation, followed by metabolism of the resulting trans-ethyl
coumarate to yield 4-ethylphenol.
The cis-ethyl esters could not be accurately quantified using the same method as the trans-
esters due to differences in both the extraction efficiencies and the mass spectral responses.
Mixtures of known cis- and trans-ethyl ester ratios were analysed by GCMS to determine
the differences in ionisation potentials, then mixtures were extracted and analysed to
determine the differences in responses, which were then factored into the quantification to
afford a more accurate indication of the cis-ethyl ester concentration. When combined with
the trans-ethyl ester and the ethylphenol quantifications, the total content at the end of
fermentation could be determined (Figures 5.15 and 5.16).

Chapter 5: Bioconversion of Hydroxycinnamates by D. bruxellensis
124
Per
cen
tag
e R
eco
very
Inocu
lated
Uninocu
lated
0
20
40
60
80
100 4-Ethylphenoltrans-Ethyl coumaratecis-Ethyl coumarate
Figure 5.15: Total coumarate recovery from cis-fermentations.
Per
cen
tag
e R
eco
very
Inocu
lated
Uninocu
lated
0
20
40
604-Ethylguaiacoltrans-Ethyl ferulatecis-Ethyl ferulate
Figure 5.16: Total ferulate recovery from cis-fermentations.
While the recovery for the coumarates were good, this was not the case for the ferulates.
Rough GCMS quantifications of ethyl ferulate (not specific to either isomer) from a single
fermentation throughout the experiment were performed using an abbreviated SIDA
method (Figure 5.17).

Chapter 5: Bioconversion of Hydroxycinnamates by D. bruxellensis
125
Fermentation Progress (Days)E
thyl
Fer
ula
te (
mg
/L)
0 2 4 6 8 100
2
4
6
8
10
Figure 5.17: Breakdown of ethyl ferulate in a single fermentation.
The spiked cis-ethyl ferulate within the inoculated fermentation samples was slowly
degraded, and as the final concentration of cis-ethyl ferulate was reduced in both
inoculated and uninoculated ferments it can be assumed a chemical breakdown rather than
a microbiological breakdown took place. With many potential causes, it was not further
investigated. In any case the role of cis-ethyl ferulate in the production of 4-ethylguaiacol
is negligible. Even allowing for a 50% reduction in cis-ethyl ferulate in the fermentation,
the amount of 4-ethylguaiacol produced would correspond to a conversion of no more than
0.5%.
5.2.3 Conclusions for Chapter 5.2
The results of the first part of this study, limited by the reduced recovery of the spiked cis-
acids, indicate that the decarboxylase of D. bruxellensis is specific to metabolism of the
trans-hydroxycinnamic acids (3 and 4). However, from the isomeric ratio of the spiked
acids and the subsequent production of ethylphenols, the decarboxylase of D. bruxellensis
has little or no activity towards the cis-acids. For the cis-acids to be completely disregarded
as precursors to the ethylphenols one of two things must be achieved: either the
experimental conditions must be improved to allow for a pure cis-acid spike and it remains
isomerically pure; or the full recovery of the cis-acids from isomeric mixtures needs to be
achieved. The nature of the photoisomerisation does not allow for use of a pure cis-acid
spike, and an attempt to use one would most likely result in slow conversion back to the
trans-acid, giving a dynamic mixture that would be difficult to characterise over the course
of these experiments. The incomplete recovery of the cis-acids is most likely a result of
adsorption onto the yeast cell wall or by uptake, which could be overcome by examining

Chapter 5: Bioconversion of Hydroxycinnamates by D. bruxellensis
126
the enzyme directly, through isolation and purification, as opposed to examining the
indirect products of the activity of the decarboxylase enzyme which has been done in this
study.
Even though the cis-hydroxycinnamic acids cannot be completely eliminated as precursors
to ethylphenols, the conversions observed from the isomeric mixtures strongly suggest that
they are not metabolised by D. bruxellensis, and implies that the decarboxylase possesses
stereospecificity.
In reviewing the content of the cis-hydroxycinnamates in grapes and wine (Chapter 4) it
was noted that the tartrate esters exist in both isomeric forms, with the cis-esters
contributing around 20%. While it has been shown that the tartrate esters are not
metabolised by D. bruxellensis, rendering them of little relevance to the direct
stereoselective breakdown, the tartrate esters are hydrolysed either enzymatically and/or
chemically prior to barrel ageing (described in Chapter 1). Assuming that the cis-tartrate
esters also undergo the same hydrolyses, then the production of cis-acids would not lead to
further metabolism by D. bruxellensis.
By displaying stereoselectivity in decarboxylase activity, the cis-hydroxycinnamate
content of wine, esterified or otherwise, can be ignored in relation to the build-up of
ethylphenols during barrel ageing, as cis-hydroxycinnamate esters could either be
enzymatically hydrolysed, which may be limited, or chemically hydrolysed yielding cis-
acids which will not contribute to the production of ethylphenols (unless enough time is
allowed between hydrolysis and D. bruxellensis growth for some trans-acid to form).
5.3 Thesis Conclusions and Future Directions.
This study has investigated the synthesis and chemical transformations of
hydroxycinnamate esters, their role in the production of ethylphenols in wine by D.
bruxellensis and the stereochemical factors contributing to the enzymatic breakdown of
hydroxycinnamates in wine.

Chapter 5: Bioconversion of Hydroxycinnamates by D. bruxellensis
127
In Chapter 2, the synthesis of p-coumaroyl and feruloyl tartrate (7 and 8) has been
described for the first time, via the coupling of the 1-O-chloroacetyl protected acids and di-
tert-butyl tartrate. This has allowed them to be dismissed in the accumulation of
ethylphenols by D. bruxellensis unless first hydrolysed via an alternative pathway.
Moreover, the synthetic methodology developed can now be applied for the synthesis of
other hydroxycinnamoyl tartrate derivatives such as caffeoyl tartrate ester or the grape
reaction product.225 Furthermore, incorporating isotopically labelled hydroxycinnamate
moieties into the synthesis would allow for accurate and convenient quantification of these
compounds in grapes and wine, an addition that could also be applied to the glucose esters.
Synthesis of the glucose esters from the 1-O-chloroacetyl protected acids and a
trichloroacetimidate glucosyl donor and deprotection in pyridine/water resulted in both
photoisomerisation and acyl migration, which have not previously been detailed for the
hydroxycinnamoyl glucose esters. During the course of this study the synthesis of feruloyl
glucose (10) using a similar synthetic pathway was described by Zhu,183 although no
migration or photoisomerisation was described. Theoretical studies into the migration of
the glucose esters identified the role of non-aqueous conditions in altering the
thermodynamic preference for different esters, and in changing kinetic aspects of the
migration away from the desired 1-O-β-esters (Chapter 3). Investigation into the migration
during previously reported analytical procedures showed that the extraction process can
have an effect on the ratios of esters present, but that wine naturally contains multiple
esters for both p-coumaroyl glucose and feruloyl glucose. During these studies, feruloyl
glucose was identified for the first time in red wine, which is rationalised to have gone
unnoticed by other authors due to coelution with p-coumaroyl derivatives tentatively
identified as anthocyanin derivatives.
As outlined in Chapter 4, photoisomerisation of the glucose esters under ambient light
conditions was found to be accelerated in comparison to other synthesised
hydroxycinnamate derivatives, resulting in production of cis-glucose esters in roughly 1:4
ratio with the trans-isomers. For the duration of synthesis this was subdued by working
under red light. Theoretical investigations into the photoisomerisation found that while
solvent and substrate do play a minor role in the ease of isomerisation, the nature of the
phenol and carboxyl contribute to a much larger extent. By increasing the electron
donating character of the phenol or increasing the electron withdrawing character of the

Chapter 5: Bioconversion of Hydroxycinnamates by D. bruxellensis
128
carboxyl, electron movement within the molecule was increased resulting in a decrease in
the α,β-double bond length. This reduced the HOMO-LUMO gap of the molecule,
affecting the S0-T1 vertical excitation energy and altering the energy required for
photoisomerisation. To avoid photoisomerisation, production of the phenolate should be
prevented either by using phenolic protection as far into a synthetic route as possible, or by
preventing exposure to basic conditions.
The ease by which the glucose esters isomerised encouraged the investigation into the
ability of D. bruxellensis to metabolise cis-hydroxycinnamates in addition to the trans-
isomers. Attempts at synthesising pure cis-p-coumaric and ferulic acids were unsuccessful,
with pure cis-ethyl esters undergoing isomerisation during base-catalysed ester hydrolysis,
assisted by formation of the phenolate of the ethyl esters. Instead stable isomeric mixtures
were produced with ferulic acid existing in a 50:50 ratio of cis:trans-ferulic acid and p-
coumaric as a 39:61 ratio, which could be used in fermentation experiments, along with the
pure cis-ethyl esters that were synthesised and remained pure under ambient light
conditions.
Fermentation of the ethyl esters with multiple strains of D. bruxellensis showed that a
substrate selectivity exists in some strains for the preferential breakdown of ethyl
coumarate over ethyl ferulate, which was observed in two strains representing nearly 92%
of Australian D. bruxellensis isolates, while a third strain was unable to metabolise either.
This work showed the ability of D. bruxellensis to form ethylphenols directly from
esterified hydroxycinnamates for the first time, also identifying a substrate preference that
could contribute to the 4-ethylphenol:4-ethylguaiacol ratio seen in red wines. The
bioconversion of ethyl coumarate and subsequent production of 4-ethylphenol has also
been established.
The tartrate esters, while abundant enough to have a large impact on the ethylphenol
content of wine, were unable to be metabolised by D. bruxellensis, showing that for this
compound to be of significance it must first be hydrolysed by alternative enzymatic
methods, or chemically. The inability of D. bruxellensis to breakdown the tartrates was
common to all three strains tested.

Chapter 5: Bioconversion of Hydroxycinnamates by D. bruxellensis
129
Metabolism of migrated mixtures of p-coumaroyl glucose and feruloyl glucose by D.
bruxellensis showed a moderate 35% conversion to the ethylphenols. Given the previous
quantifications in wine, the glucose esters have the ability to contribute to the production
of ethylphenols, but are not abundant enough to solely spoil wine.
In fermentation experiments to examine the stereoselectivity of the decarboxylase activity,
metabolism of cis-ferulic and cis-p-coumaric acids to yield 4-ethylguaiacol and 4-
ethylphenol, was at most limited. The inability to recover all of the spiked cis-acid in
conjunction with the nature of the isomerisation did not allow determination of whether the
decarboxylase activity towards the cis-acids was non-existent or just very small. A similar
result was achieved in testing the ethyl esterase for stereoselectivity, indicating that the cis-
ethyl esters were not broken down, with minor production of ethylphenols attributed to
isomerisation or the presence of trace impurities. Regardless, both decarboxylase and ethyl
esterase were more active towards the trans-isomers, rendering the cis-hydroxycinnamates
unimportant in the accumulation of ethylphenols in wine.
Following the findings that hydroxycinnamates other than the free acids can contribute to
ethylphenol accumulation, further conjugates should be tested in order to determine all
metabolic inputs in the production of 4-ethylphenol and 4-ethylguaiacol. In addition to
those tested in this study, other derivatives have been identified which have the potential to
contribute to a greater extent than those shown here. During the LCMS studies of red wine,
a peak attributed to the glucoside of p-coumaric acid was identified, a compound which
has been identified in red wine and isolated from white wine previously,108, 131 and
appeared to more abundant than the glucose esters. Furthermore, p-coumaroyl anthocyanin
derivatives have been identified in red wine,107 which could also be examined as potential
precursors to ethylphenols.
Regardless of the hydroxycinnamate under investigation, the work here has shown that
metabolism of each substrate by D. bruxellensis must be tested individually, as the result
can be dependent on the substrate, the stereochemistry, and the strain used. While much
has been reported regarding the breakdown of trans-p-coumaric and trans-ferulic acid, and
this thesis has detailed the role of esterified precursors to ethylphenols and the
stereoselective metabolism by D. bruxellensis, the potential for spoilage of this species in
wine still requires further investigation.

Chapter 6: Experimental
130
Chapter 6: Experimental.
6.1 General Experimental.
Solvents and reagents
Dry organic solvents were purchased and dispensed using a Puresolv™ solvent purification
system. Pyridine was dried by storage on 4Å molecular sieves and tert-butanol was
distilled from CaH2 onto 4Å molecular sieves. General organic solvents were obtained and
distilled where needed. Reagents other than those synthesised were purchased from Sigma-
Aldrich Chemical Company Ltd. and used without further purification.
Naming of synthesised compounds
Compounds are named using common nomenclature as they would appear in literature,
followed by the IUPAC name as generated using ACD/Labs 12.0 software. Where alkene
stereochemistry is not denoted the trans-isomer was produced. For the assignment of NMR
shifts, the numbering systems are shown below.
O OH
OH
O
HO
O
OH
O
OH
O
OH
HOHO
OH
O
12
34
5
6
78
9
1'2'3'
4' 5'
6'1'
2'
3'4'
Chromatography
Column chromatography was performed using Davisil 40-63 µm silica gel. Thin layer
chromatography was performed using Merck silica gel 60 F254 alumina sheets (20 x 20 cm)
and viewed under UV light.

Chapter 6: Experimental
131
Melting points
Melting points were obtained using a Buchi B-540 melting point apparatus and are
uncorrected.
Optical Rotation
Rotation was measured with a polAAr 21 polarimeter and referenced to the sodium D line
(589 nm) at 20 oC in a cell with 1 dm path length. The concentration is specified in g/100
mL and in the solvent as reported.
Infrared spectroscopy
Spectra were acquired with a Perkin Elmer Spectrum One FT-IR spectrometer using neat
samples.
High-resolution mass spectrometry
Accurate mass determination was performed by The Organic Mass Spectrometry Facility,
University of Tasmania. Where an appropriate spectrum was obtained prior to accurate
mass determination, other significant fragmentations are quoted.
Mass spectra of compounds 9 and 10
Spectra were obtained during LCMS studies of 9 and 10 in wine, as detailed in Chapter 6.3
(Experimental Procedures for Chapter 3).
Elemental analysis
Analysis was performed at the University of Otago, New Zealand.
X-ray crystallography
Crystallographic data was performed by Dr Edward R. T. Tiekink at the Department of
Chemistry, University of Malaysia.

Chapter 6: Experimental
132
NMR spectroscopy
The 1H and 13C spectra were acquired with either a Bruker Ultrashield Plus 400 MHz
Spectrometer or a Bruker Ultrashield Plus 600 MHz Spectrometer, where indicated.
Spectra were recorded in the specified solvent, and referenced as described by Gottlieb et
al.226 In cases of overlapping solvent and compound shifts, the spectra were referenced to
the TMS peak at 0.00 ppm. Chemical shifts (δ ) are reported in ppm and coupling constants
(J) in Hz. 13C assignments were made using 2D correlation experiments HMQC and
HMBC.
Photoisomerisation
Was carried out using either a 365 nm or 254 nm ultra-violet lamp, as specified.
Computational Chemistry
Was performed using Spartan ’08 software package, with final calculations employing
density functional theory (DFT) and the supplied B3LYP 6-31G* basis set.
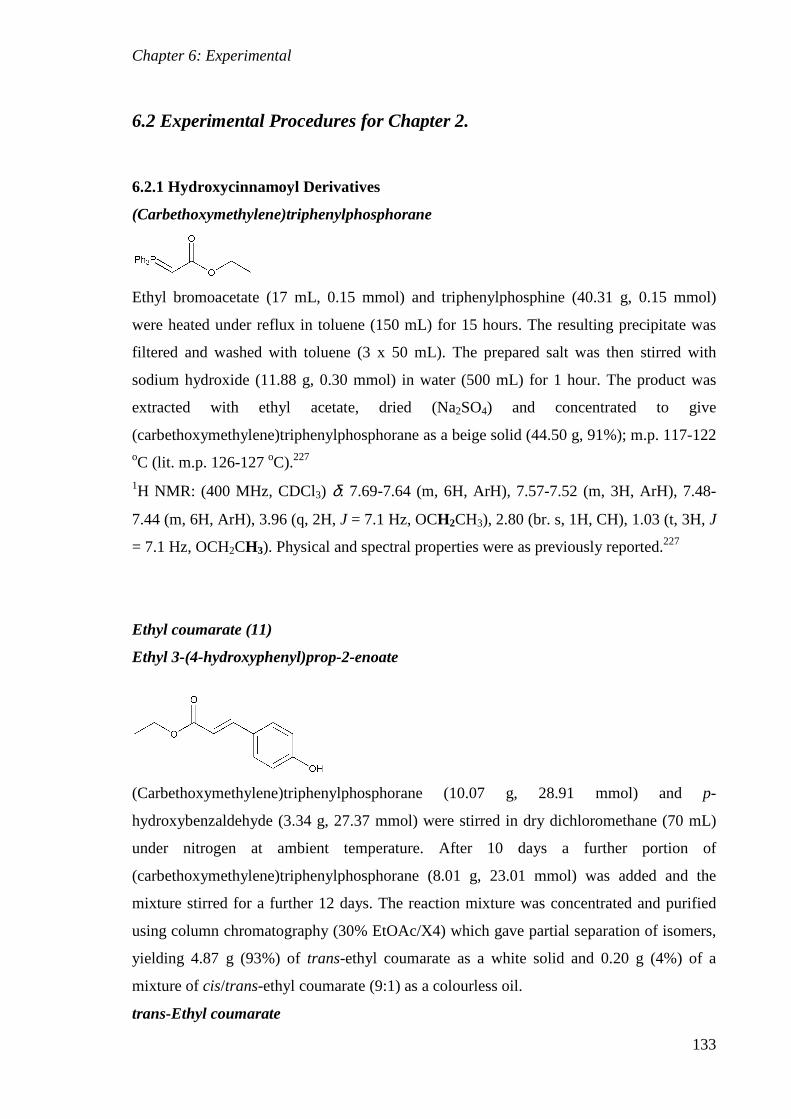
Chapter 6: Experimental
133
6.2 Experimental Procedures for Chapter 2.
6.2.1 Hydroxycinnamoyl Derivatives
(Carbethoxymethylene)triphenylphosphorane
Ethyl bromoacetate (17 mL, 0.15 mmol) and triphenylphosphine (40.31 g, 0.15 mmol)
were heated under reflux in toluene (150 mL) for 15 hours. The resulting precipitate was
filtered and washed with toluene (3 x 50 mL). The prepared salt was then stirred with
sodium hydroxide (11.88 g, 0.30 mmol) in water (500 mL) for 1 hour. The product was
extracted with ethyl acetate, dried (Na2SO4) and concentrated to give
(carbethoxymethylene)triphenylphosphorane as a beige solid (44.50 g, 91%); m.p. 117-122 oC (lit. m.p. 126-127 oC).227 1H NMR: (400 MHz, CDCl3) δ: 7.69-7.64 (m, 6H, ArH), 7.57-7.52 (m, 3H, ArH), 7.48-
7.44 (m, 6H, ArH), 3.96 (q, 2H, J = 7.1 Hz, OCH2CH3), 2.80 (br. s, 1H, CH), 1.03 (t, 3H, J
= 7.1 Hz, OCH2CH3). Physical and spectral properties were as previously reported.227
Ethyl coumarate (11)
Ethyl 3-(4-hydroxyphenyl)prop-2-enoate
(Carbethoxymethylene)triphenylphosphorane (10.07 g, 28.91 mmol) and p-
hydroxybenzaldehyde (3.34 g, 27.37 mmol) were stirred in dry dichloromethane (70 mL)
under nitrogen at ambient temperature. After 10 days a further portion of
(carbethoxymethylene)triphenylphosphorane (8.01 g, 23.01 mmol) was added and the
mixture stirred for a further 12 days. The reaction mixture was concentrated and purified
using column chromatography (30% EtOAc/X4) which gave partial separation of isomers,
yielding 4.87 g (93%) of trans-ethyl coumarate as a white solid and 0.20 g (4%) of a
mixture of cis/trans-ethyl coumarate (9:1) as a colourless oil.
trans-Ethyl coumarate

Chapter 6: Experimental
134
Ethyl (2E)-3-(4-hydroxyphenyl)prop-2-enoate
m.p. 72.1-73.0 oC (lit. m.p. 73 oC).185
Rf (50% EtOAc/X4): 0.47 1H NMR: (400 MHz, CDCl3) δ: 7.63 (d, 1H, J = 15.9 Hz, H7), 7.42 (app. d, 2H, J = 8.6 Hz,
H3,5), 6.85 (app. d, 2H, J = 8.6 Hz, H2,6), 6.29 (d, 1H, J = 15.9 Hz, H8), 4.27 (q, 2H, J = 7.1
Hz, OCH2CH3), 1.33 (t, 3H, J = 7.1 Hz, OCH2CH3).
cis-Ethyl coumarate
Ethyl (2Z)-3-(4-hydroxyphenyl)prop-2-enoate
Rf (50% EtOAc/X4): 0.50 1H NMR: (400 MHz, CDCl3) δ: 7.63 (app. d, 2H, J = 8.6 Hz, H3,5), 6.85 (d, 1H, J = 12.7
Hz, H7), 6.80 (app. d, 2H, J = 8.6 Hz, H2,6), 5.83 (d, 1H, J = 12.7 Hz, H8), 4.21 (q, 2H, J =
7.1 Hz, OCH2CH3), 1.29 (t, 3H, J = 7.1 Hz, OCH2CH3). Data was extracted from the
mixture of isomers.
For both isomers, all physical and chemical properties were as previously reported. 185, 228
Ethyl ferulate (12)
Ethyl 3-(4-hydroxy-3-methoxyphenyl)prop-2-enoate
Reaction of vanillin (3.56 g, 23.41 mmol) using the same procedure as described for 11
(above), yielded 3.73 g (72%) of trans-ethyl ferulate as a pale yellow solid and 0.89 g
(17%) of a mixture of cis/trans-ethyl ferulate (8:2) as a yellow oil.
trans-Ethyl ferulate
Ethyl (2E)-3-(4-hydroxy-3-methoxyphenyl)prop-2-enoate
m.p. 39.6-41.2 oC (lit. m.p. 39 oC).185
Rf (50% EtOAc/X4): 0.45 1H NMR: (400 MHz, CDCl3) δ: 7.61 (d, 1H, J = 15.9 Hz, H7), 7.07 (dd, 1H, J = 8.2 and
1.9 Hz, H5), 7.03 (d, 1H, J = 1.9 Hz, H3), 6.91 (d, 1H, J = 8.2 Hz, H6), 6.28 (d, 1H, J = 15.9
Hz, H8), 4.27 (q, 2H, J = 7.1 Hz, OCH2CH3), 3.92 (s, 3H, OCH3), 1.33 (t, 3H, J = 7.1 Hz,
OCH2CH3).
cis-Ethyl ferulate

Chapter 6: Experimental
135
Ethyl (2Z)-3-(4-hydroxy-3-methoxyphenyl)prop-2-enoate
Rf (50% EtOAc/X4): 0.53 1H NMR: (400 MHz, CDCl3) δ: 7.77 (d, 1H, J = 1.9 Hz, H3), 7.11 (dd, 1H, J = 8.5 and 1.9
Hz, H5), 6.88 (d, 1H, J = 8.5 Hz, H6), 6.79 (d, 1H, J = 12.9 Hz, H7), 5.81 (d, 1H, J = 12.9
Hz, H8), 4.21 (q, 2H, J = 7.1 Hz, OCH2CH3), 3.92 (s, 3H, OCH3), 1.29 (t, 3H, J = 7.1 Hz,
OCH2CH3). Data was extracted from the mixture of isomers.
For both isomers, all physical and chemical properties were as previously reported.185, 229
Microwave synthesis of ethyl ferulate (12)
Vanillin (0.52 g, 3.44 mmol) and (carbethoxymethylene)triphenylphosphorane (1.17 g,
3.36 mmol) were added to dry dichloromethane (15 mL) in a 30 mL reaction vessel and
heated at 50 oC under microwave radiation (CEM discover microwave reactor) for 5
minute intervals. After 20 minutes the reaction mixture showed no further change by TLC
and was concentrated and purified using column chromatography (20% EtOAc/X4) which
yielded 0.46 g (60%) of trans-ethyl ferulate and 0.13 g (17%) of a mixture of trans- and
cis-ethyl ferulate (15:85).
Attempted microwave synthesis of ethyl coumarate (11)
(Carbethoxymethylene)triphenylphosphorane (2.00 g, 5.73 mmol) and p-
hydroxybenzaldehyde (0.59 g, 4.79 mmol) were added to dry dichloromethane (15 mL) in
a 30 mL reaction vessel and heated at 50 oC under microwave radiation for 5 minutes.
After 5 minutes most of the reaction mixture had leaked into the microwave reactor, and a
repeat procedure of this scale provided the same result.

Chapter 6: Experimental
136
1-O-Benzyl p-coumaroyl ethyl ester (17)
Ethyl (2E)-3-[4-(benzyloxy)phenyl]prop-2-enoate
Anhydrous potassium carbonate (0.38 g, 2.71 mmol) and benzyl bromide (0.47 mL, 3.95
mmol) were added to a mixture of ethyl coumarate (11) (0.50 g, 2.60 mmol) in dry
dichloromethane (10 mL) and the reaction mixture heated under reflux. After 20 hours,
further benzyl bromide (0.47 mL, 3.95 mmol) was added. After 4 days, the reaction was
quenched with water, the organics extracted with ethyl acetate (3 x 10 mL), dried (MgSO4)
and concentrated. Purification by column chromatography (10% EtOAc/X4) gave 0.54 g
(74%) of 17 ester as a white solid. m.p. 64.8-65.7 oC (lit. m.p. 65-67 oC).230
Rf (50% EtOAc/X4): 0.61 1H NMR: (400 MHz, CDCl3) δ: 7.64 (d, 1H, J = 16.0 Hz, H7) 7.47 (app. d, 2H, J = 8.8 Hz,
H3,5), 7.44-7.34 (m, 5H, ArH), 6.98 (app. d, 2H, J = 8.8 Hz, H2,6), 6.31 (d, 1H, J = 16.0 Hz,
H8), 5.10 (s, 2H, OCH2Ph), 4.28 (q, 2H, J = 7.1 Hz, OCH2CH3), 1.34 (t, 3H, J = 7.1 Hz,
OCH2CH3). All physical and chemical properties were as previously reported.230
1-O-Benzyl feruloyl ethyl ester (18)
Ethyl (2E)-3-[4-(benzyloxy)-3-methoxyphenyl]prop-2-enoate
Using the same reaction conditions as described for 17 (above), ethyl ferulate (12) (1.00 g,
4.50 mmol) gave 0.96 g (69%) of 18 as a white solid. m.p. 67.7-68.4 oC (lit. m.p. 64 oC).231
Rf (50% EtOAc/X4): 0.69 1H NMR: (600 MHz, CDCl3) δ: 7.61 (d, 1H, J = 15.9 Hz, H7), 7.44-7.42 (m, 2H, ArH),
7.38-7.36 (m, 2H, ArH), 7.33-7.30 (m, 1H, ArH), 7.07 (d, 1H, J = 2.0 Hz, H3), 7.03 (dd,
1H, J = 8.4 and 2.0 Hz, H5), 6.87 (d, 1H, J = 8.4 Hz, H6), 6.30 (d, 1H, J = 15.9 Hz, H8),
5.19 (s, 2H, OCH2Ph), 4.26 (q, 2H, J = 7.1 Hz, OCH2CH3), 3.92 (s, 3H, OCH3), 1.33 (t,
3H, J = 7.1 Hz, OCH2CH3). Physical and spectral properties were as previously
reported.231-232

Chapter 6: Experimental
137
1-O-Benzyl p-coumaric acid (15)
(2E)-3-[4-(Benzyloxy)phenyl]prop-2-enoic acid
Potassium hydroxide (0.10 g, 1.71 mmol) was dissolved in water (5 mL) and added to a
mixture of 1-O-benzyl coumaroyl ethyl ester (17) (0.21 g, 0.73 mmol) in ethanol (5 mL).
The reaction mixture was stirred at room temperature for 20 hours then concentrated under
reduced pressure. The residue was taken up in water (10 mL), acidifed to pH 3 with 10%
HCl solution and caused precipitation of a white solid, which was extracted into ethyl
acetate (3 x 10 mL), washed with saturated brine solution (2 x 10 mL), dried (MgSO4) and
concentrated. This gave 0.17 g (93%) of 15 as a white solid. m.p. 200.2-201.8 oC (lit. m.p.
198-201 oC).233
Rf (50% EtOAc/X4): 0.27 1H NMR: (400 MHz, CDCl3) δ: 7.74 (d, 1H, J = 15.9 Hz, H7), 7.50 (app. d, 2H, J = 8.7 Hz,
H3,5), 7.44-7.30 (m, 5H, ArH), 6.99 (app. d, 2H, J = 8.7 Hz, H2,6), 6.32 (d, 1H, J = 15.9 Hz,
H8), 5.11 (s, 2H, OCH2Ph). 1H NMR: (600 MHz, Acetone-d6) δ: 7.65-7.62 (m, 3H, H3,5,7), 7.50-7.49 (m, 2H, ArH),
7.42-7.39 (m, 2H, ArH), 7.36-7.34 (m, 1H, ArH), 7.08 (app. d, 2H, J = 8.8 Hz, H2,6), 6.39
(d, 1H, J = 15.9 Hz, H8), 5.20 (s, 2H, OCH2Ph). Physical properties and spectral properties
in acetone were as previously reported.233
1-O-Benzyl ferulic acid (16)
(2E)-3-[4-(Benzyloxy)-3-methoxyphenyl]prop-2-enoic acid
1-O-Benzyl feruloyl ethyl ester (18) (0.31 g, 1.00 mmol) was submitted to the same
procedure as described for 15 (above). This gave 0.24 g (85%) of 16 as a pale yellow solid.
m.p. 189.6-190.3 oC (lit. m.p. 191 oC).231
Rf (50% EtOAc/X4): 0.14

Chapter 6: Experimental
138
1H NMR: (400 MHz, CDCl3) δ: 7.70 (d, 1H, J = 15.9 Hz, H7), 7.43 (app. d, 2H, J = 7.1 Hz,
ArH), 7.38 (app. t, 2H, J = 7.3 Hz, ArH), 7.31 (app. t, 1H, J = 7.2 Hz, ArH), 7.09 (d, 1H, J
= 2.0 Hz, H3), 7.06 (dd, 1H, J = 8.3 and 2.0 Hz, H5), 6.89 (d, 1H, J = 8.3 Hz, H6), 6.31 (d,
1H, J = 15.9 Hz, H8), 5.20 (s, 2H, OCH2Ph), 3.93 (s, 3H, OCH3). 1H NMR: (600 MHz, Acetone-d6) δ: 7.61 (d, 1H, J = 15.9 Hz, H7), 7.51-7.49 (m, 2H,
ArH), 7.41-7.39 (m, 2H, ArH), 7.36 (d, 1H, J = 2.0 Hz, H3), 7.35-7.32 (m, 1H, ArH), 7.19
(dd, 1H, J = 8.3 and 2.0 Hz, H5), 7.08 (d, 1H, J = 8.3 Hz, H6), 6.42 (d, 1H, J = 15.9 Hz,
H8), 5.19 (s, 2H, CH2Ph), 3.91 (s, 3H, OCH3). Physical properties and spectral properties
in chloroform were as previously reported.231, 234
p-Coumaric acid (3)
(2E)-3-(4-Hydroxyphenyl)prop-2-enoic acid
trans-Ethyl coumarate (11) (1.00 g, 5.20 mmol) was dissolved in 1:1 aqueous ethanol (v/v,
20 mL) followed by the addition of potassium hydroxide (0.87 g, 15.52 mmol), then the
reaction mixture was stirred at room temperature for 3 days. The mixture was then diluted
with water (10 mL), unwanted organics extracted with diethyl ether (2 x 20 mL), the
aqueous layer acidified to pH 3 with 2 M hydrochloric acid solution and extracted with
ethyl acetate (2 x 20 mL). Concentration at reduced pressure gave 0.83 g (97%) of 3 as an
off-white solid. m.p. 208.7-209.8 oC (lit. m.p. 214-216 oC).235
Rf (10% MeOH/DCM): 0.31 1H NMR: (600 MHz, Acetone-d6) δ: 7.62 (d, 1H, J = 16.0 Hz, H7), 7.55 (app. d, 2H, J =
8.6 Hz, H3,5), 6.90 (app. d, 2H, J = 8.6 Hz, H2,6), 6.34 (d, 1H, J = 16.0 Hz, H8).
Physical and chemical properties were as previously reported.214, 235
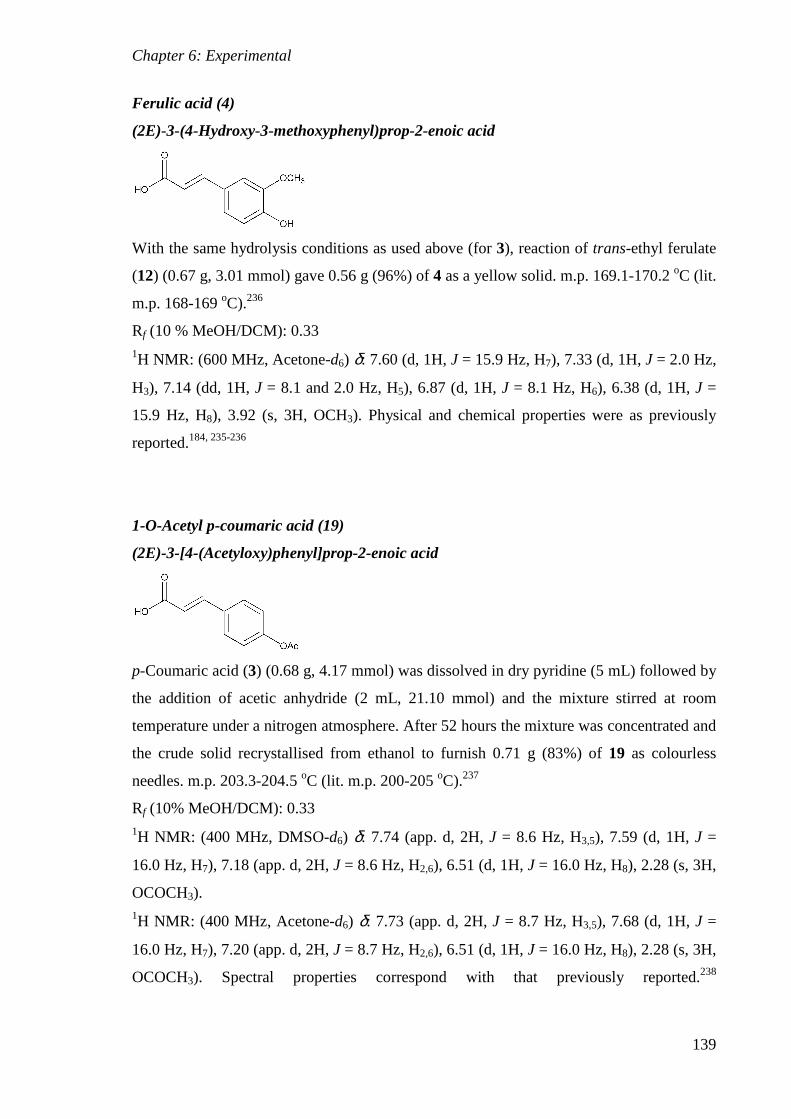
Chapter 6: Experimental
139
Ferulic acid (4)
(2E)-3-(4-Hydroxy-3-methoxyphenyl)prop-2-enoic acid
With the same hydrolysis conditions as used above (for 3), reaction of trans-ethyl ferulate
(12) (0.67 g, 3.01 mmol) gave 0.56 g (96%) of 4 as a yellow solid. m.p. 169.1-170.2 oC (lit.
m.p. 168-169 oC).236
Rf (10 % MeOH/DCM): 0.33 1H NMR: (600 MHz, Acetone-d6) δ: 7.60 (d, 1H, J = 15.9 Hz, H7), 7.33 (d, 1H, J = 2.0 Hz,
H3), 7.14 (dd, 1H, J = 8.1 and 2.0 Hz, H5), 6.87 (d, 1H, J = 8.1 Hz, H6), 6.38 (d, 1H, J =
15.9 Hz, H8), 3.92 (s, 3H, OCH3). Physical and chemical properties were as previously
reported.184, 235-236
1-O-Acetyl p-coumaric acid (19)
(2E)-3-[4-(Acetyloxy)phenyl]prop-2-enoic acid
p-Coumaric acid (3) (0.68 g, 4.17 mmol) was dissolved in dry pyridine (5 mL) followed by
the addition of acetic anhydride (2 mL, 21.10 mmol) and the mixture stirred at room
temperature under a nitrogen atmosphere. After 52 hours the mixture was concentrated and
the crude solid recrystallised from ethanol to furnish 0.71 g (83%) of 19 as colourless
needles. m.p. 203.3-204.5 oC (lit. m.p. 200-205 oC).237
Rf (10% MeOH/DCM): 0.33 1H NMR: (400 MHz, DMSO-d6) δ: 7.74 (app. d, 2H, J = 8.6 Hz, H3,5), 7.59 (d, 1H, J =
16.0 Hz, H7), 7.18 (app. d, 2H, J = 8.6 Hz, H2,6), 6.51 (d, 1H, J = 16.0 Hz, H8), 2.28 (s, 3H,
OCOCH3). 1H NMR: (400 MHz, Acetone-d6) δ: 7.73 (app. d, 2H, J = 8.7 Hz, H3,5), 7.68 (d, 1H, J =
16.0 Hz, H7), 7.20 (app. d, 2H, J = 8.7 Hz, H2,6), 6.51 (d, 1H, J = 16.0 Hz, H8), 2.28 (s, 3H,
OCOCH3). Spectral properties correspond with that previously reported.238

Chapter 6: Experimental
140
1-O-Acetyl ferulic acid (20)
(2E)-3-[4-(Acetyloxy)-3-methoxyphenyl]prop-2-enoic acid
Ferulic acid (4) (1.06 g, 5.46 mmol) was reacted using the same conditions described for
the preparation of 19 (above). Recrystallisation of the crude solid from ethanol afforded
1.02 g (79%) of 20 as an off-white solid. m.p. 196.3-197.2 oC (lit. m.p. 197-200 oC).239
Rf (10% MeOH/DCM): 0.28 1H NMR: (400 MHz, DMSO-d6) δ: 7.57 (d, 1H, J = 16.0 Hz, H7), 7.48 (d, 1H, J = 1.8 Hz,
H3), 7.26 (dd, 1H, J = 8.1 and 1.8 Hz, H5), 7.12 (d, 1H, J = 8.1 Hz, H6), 6.59 (d, 1H, J =
16.0 Hz, H8), 3.82 (s, 3H, OCH3), 2.26 (s, 3H, OCOCH3). 1H NMR: (600 MHz, Acetone-d6) δ: 7.65 (d, 1H, J = 16.0 Hz, H7), 7.47 (d, 1H, J = 2.0 Hz,
H3), 7.26 (dd, 1H, J = 8.2 and 2.0 Hz, H5), 7.12 (d, 1H, J = 8.2 Hz, H6), 6.55 (d, 1H, J =
16.0 Hz, H8), 3.91 (s, 3H, OCH3), 2.25 (s, 3H, OCOCH3). Spectral properties in DMSO
were as previously reported.239
Attempted synthesis of 1-O-chloroacetyl coumaric acid (21)
(2E)-3-{4-[(Chloroacetyl)oxy]phenyl}prop-2-enoic acid
p-Coumaric acid (3) (151.5 mg, 0.92 mmol) was dissolved in dry pyridine (5 mL) followed
by the addition of chloroacetic anhydride (0.73g, 4.26 mmol) and the mixture stirred at
ambient temperature. After 16 hours the solid reaction mixture was dissolved in methanol
(10 mL) and analysed by TLC which indicated no formation of the desired product.

Chapter 6: Experimental
141
1-O-Chloroacetyl p-coumaric acid (21)
(2E)-3-{4-[(Chloroacetyl)oxy]phenyl}prop-2-enoic acid
Chloroacetyl chloride (0.90 mL, 11.30 mmol) was added to p-coumaric acid (3) (0.60 g,
3.68 mmol) dissolved in a minimal volume of 2M sodium hydroxide solution (8 mL) at 0 oC. The resulting suspension was stirred at room temperature for 5 minutes before being
acidified with 2M hydrochloric acid solution. The precipitate was filtered, washed with
cold water, dried and recrystallised from acetone/X4 to give 0.31 g (35%) of 21 as a
crystalline white solid. m.p. 182.9-184.5 oC (lit. m.p. 186-187 oC).144
Rf (10% MeOH/DCM): 0.41 1H NMR: (400 MHz, Acetone-d6) δ: 7.78 (app. d, 2H, J = 8.7 Hz, H3,5), 7.69 (d, 1H, J =
16.0 Hz, H7), 7.27 (app. d, 2H, J = 8.7 Hz, H2,6), 6.53 (d, 1H, J = 16.0 Hz, H8), 4.59 (s, 2H,
CH2Cl). Physical and chemical properties were as previously reported.144
1-O-Chloroacetyl ferulic acid (22)
(2E)-3-{4-[(Chloroacetyl)oxy]-3-methoxyphenyl}prop-2-enoic acid
As described for 21 (above), reaction of ferulic acid (4) (0.60 g, 3.07 mmol) gave a crude
mixture which was recrystallised from ethanol/water to give 0.54 g (65%) of 22 as a pale
yellow crystalline solid. m.p. 148.3-149.6 oC (lit. m.p. 146-148 oC).145
Rf (10% MeOH/DCM): 0.40 1H NMR: (400 MHz, Acetone-d6) δ: 7.66 (d, 1H, J = 16.0 Hz, H7), 7.51 (d, 1H, J = 1.9
Hz, H3), 7.30 (dd, 1H, J = 8.2 and 1.9 Hz, H5), 7.19 (d, 1H, J = 8.2 Hz, H6), 6.56 (d, 1H, J
= 16.0 Hz, H8), 4.58 (s, 2H, CH2Cl), 3.93 (s, 3H, OCH3). NMR data assignments made
based on those of 21, and physical properties were as previously reported.145

Chapter 6: Experimental
142
6.2.2 Synthesis of Hydroxycinnamoyl Tartrate Esters
Dibenzyl L-tartaric acid (24)
Dibenzyl (2R,3R)-2,3-dihydroxybutanedioate
L-Tartaric acid (3.01 g, 20.04 mmol) was added to a mixture of benzyl alcohol (6.3 mL,
60.88 mmol) and p-toluene sulphonic acid (0.36 g, 2.06 mmol) in toluene (40 mL).
Employing a Dean-Stark apparatus, the mixture was heated under reflux for 3 hours, in
which 0.72 mL (100 % theoretical) of water was collected. The mixture was allowed to
cool to room temperature, diluted with diethyl ether (30 mL), poured into saturated sodium
bicarbonate solution (60 mL), and the product extracted with diethyl ether (3 x 30 mL),
dried (MgSO4) and concentrated. Trituration with X4/EtOAc (20:1) gave 6.24 g (94%) of
24 as a white solid. m.p. 49.8-51.0 oC (lit. m.p. 49-50 oC).152
Rf (50% EtOAc/X4): 0.42
= +11.4o (c 1.01, acetone) (lit. = +10.1)148
1H NMR: (400 MHz, CDCl3) δ: 7.38-7.36 (m, 10H, ArH), 5.30 (d, 2H, J = 12.1 Hz,
CHaHbPh), 5.25 (d, 2H, J = 12.1 Hz, CHaHbPh), 4.63 (d, 2H, J = 7.7 Hz, CH), 3.35 (d, 2H,
J = 7.7 Hz, OH). All physical and chemical properties were as previously reported.148, 151-
152
General procedure for esterification with dibenzyl-L-tartrate
The hydroxycinnamate (15 or 16) (0.50 mmol) and 24 (0.60 mmol) were dissolved in dry
dichloromethane (15 mL) followed by the addition of trifluoroacetic anhydride (0.60
mmol) at 0oC. The mixture was then stirred at ambient temperature for 6 hours before
being poured onto saturated sodium bicarbonate solution (20 mL), extracted with
dichloromethane (3 x 15 mL), washed with water (3 x 15 mL), dried (MgSO4) and
concentrated in vacuo. Purification by column chromatography (DCM-3% Et2O/DCM)
furnished the desired products (25 or 26), as well as a mixture of the mono- and di-ester.

Chapter 6: Experimental
143
1-O-Benzyl p-coumaroyl dibenzyl L-tartaric acid (25)
Dibenzyl (2R,3R)-2-({(2E)-3-[4-(benzyloxy)phenyl]prop-2-enoyl}oxy)-3-
hydroxybutanedioate
From 15 (101.6 mg, 0.40 mmol), afforded 107.0 mg (47%) of 25 as a colourless gum, as
well as 49.1 mg of a mixture of 25 and 27 (1:9).
Rf (50% EtOAc/X4): 0.56
= +12.6o (c 0.7, chloroform) 1H NMR: (400 MHz, CDCl3) δ: 7.60 (d, 1H, J = 15.9 Hz, H7), 7.45-7.15 (m, 17H, ArH and
H3,5), 6.98 (app. d, 2H, J = 8.8 Hz, H2,6), 6.21 (d, 1H, J = 15.9 Hz, H8), 5.63 (d, 1H, J = 2.3
Hz, H2’), 5.27-5.02 (m, 6H, 3 x CH2Ph,), 4.86 (dd, 1H, J = 2.3 and 7.5 Hz, H3’), 3.28 (d,
1H, J = 7.5 Hz, OH). 13C NMR: (400 MHz, CDCl3) δ: 170.7 (C4’), 166.8 (C1’), 165.7 (C9), 161.0 (C1), 146.2
(C7), 136.5, 135.1, 134.6 (3 x Ar), 130.0 (C3,5), 130.3-127.0 (Ar), 115.2 (C2,6), 113.2 (C8),
73.7 (CH2Ph), 72.8 (C2’). 70.9 (C3’), 70.2, 67.7 (2 x CH2Ph).
IR (neat) ν: 3475, 2955, 1718, 1145, 732, 695.
LRP (+EI) m/z (%): 566 (M+, 1), 475 (1), 325 (2), 254 (5), 237 (9), 181 (2), 164 (2), 147
(3), 107 (3), 91 (100), 65 (7).
HRMS calculated for C34H30O8 [M] + 566.1941, found 566.1948.
Di(1-O-benzyl coumaroyl)dibenzyl L-tartaric acid (27)
Dibenzyl (2R,3R)-2,3-bis({(2E)-3-[4-(benzyloxy)phenyl]prop-2-enoyl}oxy)butanedioate
Isolated from the synthesis and purification of 25.

Chapter 6: Experimental
144
Rf (50% EtOAc/X4): 0.69 1H NMR: (600 MHz, CDCl3) δ: 7.64 (d, 1H, J = 16.0 Hz, H7), 7.45-7.15 (m, 12H, ArH and
H3,5), 6.99 (app. d, 2H, J = 8.8 Hz, H2,6), 6.25 (d, 1H, J = 16.0 Hz, H8), 5.91 (s, 1H, CH),
5.24 (d, 1H, J = 12.2 Hz, CHaHbPh), 5.14 (d, 1H, J = 12.2 Hz, CHaHbPh), 5.11 (app. s, 2H,
CH2Ph). Identification and characterisation based on reported data for the caffeoyl
derivative.154
1-O-Benzyl feruloyl dibenzyl L-tartaric acid (26)
Dibenzyl (2R,3R)-2-({(2E)-3-[4-(benzyloxy)-3-methoxyphenyl]prop-2-enoyl}oxy)-3-
hydroxybutanedioate
From 16 (185.9 mg, 0.65 mmol), yielded 197.0 mg (50%) of 26 as a colourless gum, as
well as 67.5 mg of a mixture of 26 and 28 (1:19).
Rf (50% EtOAc/X4): 0.48
= +10.2o (c 1.7, chloroform) 1H NMR: (400 MHz, CDCl3) δ: 7.59 (d, 1H, J = 15.9 Hz, H7), 7.45-7.20 (m, 15H, ArH),
7.04 (d, 1H, J = 1.9 Hz, H3), 7.01 (dd, 1H, J = 8.3 and 1.9 Hz, H5), 6.88 (d, 1H, J = 8.3 Hz,
H6), 6.22 (d, 1H, J = 15.9 Hz, H8), 5.64 (d, 1H, J = 2.2 Hz, H2’), 5.26-5.16 (m, 6H,
CH2Ph), 4.86 (br. s, 1H, H3’), 3.93 (s, 3H, OCH3), 3.21 (d, 1H, J = 7.6 Hz, OH). 13C NMR: (400 MHz, CDCl3) δ: 170.7 (C4’), 166.7 (C1’), 165.6 (C9), 150.7 (C1), 149.8
(C2), 146.6 (C7), 136.5, 135.1, 135.0 (3 x Ar), 128.7-128.1 (Ar), 127.3 (C4), 123.0 (C5),
113.9 (C8), 113.3 (C6), 110.3 (C3), 73.0 (C2’), 70.9 (CH2Ph), 70.8 (C3’), 68.2, 67.7 (2 x
CH2Ph), 56.1 (OCH3).
IR (neat) ν: 3478, 2957, 1718, 1133, 731, 695.
LRP (+EI) m/z (%): 596 (M+, 1), 505 (4), 355 (4), 284 (6), 267 (7), 194 (1), 149 (4), 107
(4), 91 (100), 65 (6).
HRMS calculated for C35H32O9 [M] + 596.2046, found 596.2035.

Chapter 6: Experimental
145
Di(1-O-benzyl feruloyl)dibenzyl L-tartaric acid (28)
Dibenzyl (2R,3R)-2,3-bis({(2E)-3-[4-(benzyloxy)-3-methoxyphenyl]prop-2-
enoyl}oxy)butanedioate
Isolated from the synthesis and purification of 26.
Rf (50% EtOAc/X4): 0.58 1H NMR: (400 MHz, CDCl3) δ: 7.61 (d, 1H, J = 15.9 Hz, H7), 7.45-7.15 (m, 10H, ArH),
7.05 (d, 1H, J = 1.8 Hz, H3), 7.01 (dd, 1H, J = 8.4 and 1.8 Hz, H5), 6.89 (d, 1H, J = 8.4 Hz,
H6), 6.26 (d, 1H, J = 15.9 Hz, H8), 5.92 (s, 1H, H2’), 5.26-5.13 (m, 4H, CH2Ph), 3.93 (s,
3H, OCH3). Identification and characterisation based on reported data for the caffeoyl
derivative.154
Attempted syntheses of feruloyl tartrate (8)
Attempt 1:
1-O-Benzyl feruloyl dibenzyl L-tartaric acid (26) (135.1 mg, 0.23 mmol) and 5%
palladium on activated carbon (21.3 mg) were stirred in ethyl acetate (15 mL) followed by
the addition of 1,4-cyclohexadiene (0.22 mL, 0.23 mmol) and the mixture was stirred at
ambient temperature. After 3 hours TLC showed no formation of the desired product and
further 1,4-cyclohexadiene (0.22 mL, 0.23 mmol) was added. After 24 hours analysis by
TLC showed no change and the reaction mixture was filtered through celite, concentrated
in vacuo and the crude mixture analysed by NMR, which suggested formation of the
reduced analogue of the starting material (29).
Rf of reaction mixture (50% EtOAc/X4): 0.48

Chapter 6: Experimental
146
1H NMR: (400 MHz, CDCl3) δ: 5.54 (d, 1H, J = 2.2 Hz, H2’), 4.82 (d, 1H, J = 2.2 Hz, H3’),
2.84 (app. t, 2H, J = 7.9 Hz, H7), 2.62 (m, 1H, H8a), 2.48 (m, 1H, H8b). Unobstructed 1H
signals in addition to those of the remaining starting material (26).
Attempt 2:
Palladium acetate (86.0 mg, 0.38 mmol) and triethylamine (0.05 mL, 0.36 mmol) were
dissolved in dry dichloromethane (5 mL) and after 5 minutes of stirring at ambient
temperature 1-O-benzyl feruloyl dibenzyl L-tartaric acid (26) (80.8 mg, 0.16 mmol) in dry
dichloromethane (5 mL) was added dropwise. After a further 5 minutes triethylsilane (0.20
mL, 1.252 mmol) was added slowly and the mixture stirred at ambient temperature for 24
hours before being diluted with methanol (5 mL) filtered through celite and concentrated in
vacuo. The crude oil was taken up in ethyl acetate/water (6:1, 20 mL), the aqueous layer
separated and washed with ethyl acetate (2 x 10 mL). The combined organics were washed
successively with phosphoric acid solution (1 M, 10 mL) and brine solution (10 mL) until a
pH of 7 was achieved, then dried (MgSO4) and concentrated in vacuo. The clear oil was
dissolved in ethyl acetate and X4 added until a precipitate formed, which was filtered,
washed with X4 and analysed by 1H NMR which suggested formation of the reduced
analogue of the desired product (30).
Rf of crude mixture (50% EtOAc/X4): 0.00 1H NMR: (400 MHz, CD3OD) δ: 5.46 (d, 1H, J = 2.3 Hz, H2’), 4.72 (d, 1H, J = 2.3 Hz,
H3’), 2.94 (app. t, 2H, J = 7.8 Hz, H7), 2.71 (app. t, 2H, J = 7.8 Hz, H8). Unobstructed 1H
signals in the crude mixture.
Attempt 3:
Debenzylation was attempted as described above, employing half the amount of
triethylsilane (0.1 mL, 0.626 mmol). Analysis of the product by 1H NMR displayed the
same peaks as above suggesting formation of the reduced product, with minor signals
corresponding with formation of the desired product (8).
Rf of crude mixture (50% EtOAc/X4): 0.00

Chapter 6: Experimental
147
O,O’-Diacetyl L-tartaric anhydride (31)
(3R,4R)-2,5-Dioxotetrahydrofuran-3,4-diyl diacetate
L-Tartaric acid (10.07 g, 67.08 mmol) in acetyl chloride (65 mL, 0.91 mol) was heated
under reflux under a nitrogen atmosphere for 48 hours. The reaction mixture was allowed
to cool to room temperature, concentrated in vacuo and the resulting oil recyrstallised from
EtOAc/X4 to afford 11.82 g (82%) of 31 as a white crystalline solid. m.p. 135-136 oC (lit.
m.p. 133-135 oC).240 1H NMR: (400 MHz, CDCl3) δ: 5.68 (s, 1H, CH), 2.23 (s, 3H, OCH3). 1H NMR: (400 MHz, Acetone-d6) δ: 6.17 (s, 1H, CH), 2.19 (s, 3H, OCH3). Spectral
properties in chloroform were as previously reported.161, 240-241
O,O’-Diacetyl L-tartaric acid (32)
(2R,3R)-2,3-bis(Acetyloxy)butanedioic acid
O,O’-Diacetyl L-tartaric anhydride (31) (1.03 g, 4.75 mmol) was dissolved in acetone (5
mL) followed by the addition of water (0.17 mL, 9.44 mmol) and the mixture was stirred at
room temperature for 12 hours before being concentrated. Trituration with X4 gave 1.10 g
(99%) of 32 as a white solid. m.p. 117-118 oC (lit. m.p. 118 oC).242 1H NMR: (400 MHz, Acetone-d6) δ: 5.72 (s, 1H, CH), 2.11 (s, 3H, OCH3). Physical and
chemical properties were as previously reported.161, 242
O,O’-Diacetyl-di-tert-butyl L-tartrate (33)
Di-tert-butyl (2R,3R)-2,3-bis(acetyloxy)butanedioate

Chapter 6: Experimental
148
Anhydrous magnesium sulphate (3.98 g) and sulphuric acid (0.5 mL) were stirred in dry
dichloromethane (120 mL) for 15 minutes followed by the addition of O,O’-diacetyl L-
tartaric acid (32) (1.03 g, 4.42 mmol) and dry tert-butanol (4.0 mL, 41.82 mmol), and the
reaction vessel was stoppered tightly. After 3 days the mixture was poured into saturated
sodium bicarbonate solution (100 mL) and stirred until the MgSO4 dissolved, then
extracted in dichloromethane (3 x 50 mL), washed with brine (2 x 50 mL), dried (MgSO4)
and concentrated in vacuo. Column chromatography (20% EtOAc/X4) gave 0.76 g (49%)
of 33 as a clear oil and 0.32 g of a mixture of 33 and the mono-acetate (80:20 as
determined by proton integration).
Rf (50% EtOAc/X4): 0.66 1H NMR: (400 MHz, CDCl3) δ: 5.62 (s, 1H, CH), 2.16 (s, 3H, OCH3), 1.44 (s, 9H, t-Bu). 1H NMR: (400 MHz, DMSO-d6) δ: 5.51 (s, 1H, CH), 2.11 (s, 3H, OCH3), 1.38 (s, 9H, t-
Bu). Spectral properties in chloroform were as previously reported.159
Mono-acetyl-di-tert-butyl L-tartrate (Tentative characterisation)
Di-tert-butyl (2R,3R)-2-(acetyloxy)-3-hydroxybutanedioate
Obtained during the purification of 33.
Rf (50% EtOAc/X4): 0.60 1H NMR: (400 MHz, CDCl3) δ: 5.34 (d, 1H, J = 2.3 Hz, CH), 4.60 (dd, 1H, J = 7.1 and 2.3
Hz, CH), 3.09 (d, 1H, J = 7.1 Hz, OH), 2.12 (s, 3H, OCH3), 1.49 (s, 9H, t-Bu), 1.46 (s, 9H,
t-Bu). Data was extracted from the spectrum of the mixture.
Di-tert-butyl L-tartrate (34)
Di-tert-butyl (2R,3R)-2,3-dihydroxybutanedioate
Diacetyl-di-tert-butyl L-tartrate (33) (3.50 g, 10.10 mmol) was dissolved in methanol (25
mL) followed by the addition of powdered potassium hydroxide (115.7 mg, 2.06 mmol)
and the mixture stirred at room temperature. After 45 minutes the mixture was

Chapter 6: Experimental
149
concentrated and purified by column chromatography (20% EtOAc/X4) yielding 0.79g
(29%) of 34 as a white solid, m.p. 86.1-89.8 oC (lit. m.p. 91 oC),159 as well as tert-butyl
methyl L-tartrate as a clear oil.
Rf (40% EtOAc/X4): 0.49
= +11.0o (c 1.0, acetone) 1H NMR: (400 MHz, CDCl3) δ: 4.36 (d, 1H, J = 6.9 Hz, CH), 3.09 (d, 1H, J = 6.9 Hz,
OH), 1.52 (s, 9H, t-Bu). All physical and chemical properties were as previously
reported.159
tert-Butyl methyl L-tartrate
tert-Butyl methyl (2R,3R)-2,3-dihydroxybutanedioate
Isolated during purification of 34.
Rf (40% EtOAc/X4): 0.27 1H NMR: (400 MHz, CDCl3) δ: 4.51 (dd, 1H, J = 7.6 and 1.8 Hz, CH), 4.41 (dd, 1H, J =
6.4 and 1.8 Hz, CH), 3.86 (s, 3H, OCH3), 3.18 (d, 1H, J = 6.4 Hz, OH), 3.05 (d, 1H, J =
7.6 Hz, OH), 1.52 (s, 9H, t-Bu). Spectral properties were as previously reported.159
General procedure for esterification with di-tert-butyl L-tartrate
The hydroxycinnamate (19-22) (0.50 mmol) was heated under reflux in dry benzene (10
mL) containing thionyl chloride (6.89 mmol). After 5 hours the mixture was allowed to
cool to room temperature and then concentrated in vacuo. The crude residue was taken up
in dry benzene (5 mL) and added dropwise to a solution of di-tert-butyl L-tartrate (34)
(0.65 mmol) in dry pyridine (5 mL), then stirred at ambient temperature overnight. The
mixture was concentrated and pyridine azeotropically removed with toluene. Purification
with column chromatography (20% EtOAc/X4) gave the desired product (35-38).

Chapter 6: Experimental
150
1-O-Acetyl p-coumaroyl di-tert-butyl L-tartrate (35)
Di-tert-butyl (2R,3R)-2-({(2E)-3-[4-(acetyloxy)phenyl]prop-2-enoyl}oxy)-3-
hydroxybutanedioate
From 19 (101.4 mg, 0.49 mmol), and recrystallisation from 30% EtOAc/X4 gave 68.1 mg
(31%) of white crystals. m.p. 143.6-144.2 oC.
Rf (50% EtOAc/X4): 0.57
= +2.04o (c 0.5, acetone) 1H NMR: (400 MHz, CDCl3) δ: 7.73 (d, 1H, J = 16.0 Hz, H7), 7.54 (app. d, 2H, J = 8.7 Hz,
H3,5), 7.13 (app. d, 2H, J = 8.7 Hz, H2,6), 6.45 (d, 1H, J = 16.0 Hz, H8), 5.48 (d, 1H, J = 2.3
Hz, H2’), 4.67 (dd, 1H, J = 6.9 and 2.3 Hz, H3’), 3.20 (d, 1H, J = 6.9 Hz, OH), 2.31 (s, 3H,
OCOCH3), 1.51 (s, 9H, t-Bu4), 1.44 (s, 9H, t-Bu1). 13C NMR: (600 MHz, CDCl3) δ: 170.2 (C4’), 169.3 (OCOCH3), 165.8 (C9), 165.5 (C1’),
152.4 (C1), 145.5 (C7), 131.9 (C4), 129.6 (C3,5), 122.3 (C2,6), 116.7 (C8), 84.0 (C1(CH3)3),
83.4 (C4(CH3)3), 73.5 (C2’), 71.0 (C3’), 28.1 (C4(CH3)3), 28.0 (C1(CH3)3), 21.3 (OCOCH3).
IR (neat) ν: 2982, 1713, 1128, 1055, 1033, 1015.
LRP (+EI) m/z (%): 450 (M+, <1), 408 (2), 352 (10), 338 (5), 321 (12), 296 (63), 278 (6),
251 (6), 206 (7), 189 (46), 164 (79), 147 (100), 119 (14), 57 (37), 41 (13).
HRMS calculated for C23H30O9 [M] + 450.1890, found 450.1891.
Details of crystal structure determination of 35
Crystal data for C23H30O9: M = 450.47, T = 100(2) K, orthorhombic, P212121, a =
5.7183(2), b = 8.7309(3), c = 46.9988(19) Å, V = 2346.46(15) Å3, Z = 4, Dx = 1.275,
F(000) = 960, µ = 0.822 mm-1, no. of unique data (Agilent Technologies SuperNova Dual
diffractometer with Atlas detector using Cu Kα radiation so that θmax = 74.6°) = 4603, no.
of parameters = 300, R (3842 data with I ≥ 2σ(I)) = 0.053, wR (all data) = 0.131. The
structure was solved by direct-methods (SHELXS-97) and refined (anisotropic
displacement parameters, C-bound H atoms in the riding model approximation, full
refinement of the hydroxyl-H atom, and a weighting scheme w = 1/[σ2(Fo2) + (0.067P)2]
where P = (Fo2 + 2Fc
2)/3) with SHELXL-97 on F2. The value of the Flack parameters =
0.0(2).

Chapter 6: Experimental
151
1-O-Acetyl feruloyl tert-butyl L-tartrate (36)
Di-tert-butyl (2R,3R)-2-({(2E)-3-[4-(acetyloxy)-3-methoxyphenyl]prop-2-enoyl}oxy)-3-
hydroxybutanedioate
From 20 (159.1 mg, 0.67 mmol), and recrystallisation from 30% EtOAc/X4 gave 154.0 mg
(48%) of white crystals. m.p. 140.5-142.0 oC.
Rf (30% EtOAc/X4): 0.34
= -4.51o (c 1.3, acetone) 1H NMR: (600 MHz, CDCl3) δ: 7.70 (d, 1H, J = 16.0 Hz, H7), 7.12-7.11 (m, 2H, H3,5),
7.05 (d, 1H, J = 8.6 Hz, H6), 6.45 (d, 1H, J = 16.0 Hz, H8), 5.50 (d, 1H, J = 2.3 Hz, H2’),
4.68 (dd, 1H, J = 6.8 and 2.3 Hz, H3’), 3.87 (s, 3H, OCH3), 3.21 (d, 1H, J = 6.8 Hz, OH),
2.33 (s, 3H, OCOCH3), 1.51 (s, 9H, t-Bu4), 1.44 (s, 9H, t-Bu1). 13C NMR: (600 MHz, CDCl3) δ: 170.2 (C4’), 168.9 (OCOCH3), 165.9 (C1’), 165.5 (C9),
151.5 (C7), 145.9 (C2), 141.8 (C1), 133.2 (C4), 123.4 (C6), 121.8 (C5), 116.8 (C8), 111.3
(C3), 84.1 (C1(CH3)3), 83.5 (C4(CH3)3), 73.5 (C2’), 71.0 (C3’), 56.1 (OMe), 28.1
(C4(CH3)3), 28.0 (C1(CH3)3), 20.8 (OCOCH3).
IR (neat) ν: 1755, 1710, 1260, 1218, 1195, 1148, 1120, 1074, 1030, 981.
Calc. C 59.99, H 6.71, O 33.30. Anal. C 59.79, H 6.73, O 33.48.
Details of crystal structure determination of 36
Crystal data for C24H32O10: M = 450.47, T = 100(2) K, monoclinic, P21, a = 5.9894(1), b =
10.6483(1), c = 19.6676(2) Å, β = 96.324(1)º, V = 1246.71(3) Å3, Z = 2, Dx = 1.280,
F(000) = 512, µ = 0.837 mm-1, no. of unique data (Agilent Technologies SuperNova Dual
diffractometer with Atlas detector using Cu Kα radiation so that θmax = 74.5°) = 4800, no.
of parameters = 326, R (4762 data with I ≥ 2σ(I)) = 0.057, wR (all data) = 0.159. The
structure was solved by direct-methods (SHELXS-97) and refined (anisotropic
displacement parameters, all H atoms in the riding model approximation, and a weighting
scheme w = 1/[σ2(Fo2) + (0.098P)2+ 0.941P] where P = (Fo
2 + 2Fc2)/3) with SHELXL-97
on F2. Two orientations, of equal weight, were discerned for a significant portion of the
molecule. The aromatic rings were refined as hexagons (C–C = 1.39 Å), equivalent pairs of

Chapter 6: Experimental
152
atoms were constrained to have identical anisotropic displacement parameters and these
were constrained to be nearly isotropic. The value of the Flack parameters = 0.0(2).
Attempted synthesis of p-coumaroyl L-tartrate (7)
1-O-Acetyl p-coumaroyl tert-butyl L-tartrate (35) (68.1 mg, 0.15 mmol) was dissolved in
dry dichloromethane (5 mL) followed by the addition of trifluoroacetic acid (0.30 mL, 3.92
mmol) and the mixture was stirred at ambient temperature. After disappearance of the
starting material (as shown by TLC) the mixture was concentrated in vacuo and taken up in
acetone/3 M hydrochloric acid (3:1, 6 mL) and heated under reflux for 3 hours before
being allowed to cool to ambient temperature. The mixture was diluted with ethyl actetate
(20 mL), washed with brine (3 x 20 mL), dried (MgSO4) and concentrated in vacuo. 1H
NMR of the crude product indicated formation of the desired product with major
impurities, and attempted purification using reverse-phase chromatography (linear gradient
from 0.1% formic acid/water to 0.1% formic acid/acetonitrile) failed to separate the by-
products. To protonate any potentially occuring salts, the crude product was taken up in
methanol (5 mL), the pH adjusted to 1 with 2M HCl and the mixture stirred at ambient
temperature for 16 hours before being concentrated in vacuo and analysed by 1H NMR
which showed no change in the ratio of product and impurities.
Rf of mixture (50% EtOAc/X4): 0.00
1-O-Chloroacetyl p-coumaroyl tert-butyl L-tartrate (37)
Di-tert-butyl (2R,3R)-2-{[(2E)-3-{4-[(chloroacetyl)oxy]phenyl}prop-2-enoyl]oxy}-3-
hydroxybutanedioate
From 21 (91.4 mg, 0.38 mmol), gave 54.7 mg (30%) of 37 (m.p 126.5-127.2 oC), as well as
a mixture of 37 and di-ester in an 84:16 ratio as determined by proton integration.

Chapter 6: Experimental
153
Rf (50% EtOAc/X4): 0.65
= -3.22o (c 1.6, acetone) 1H NMR: (400 MHz, CDCl3) δ: 7.72 (d, 1H, J = 16.0 Hz, H7), 7.55 (app. d, 2H, J = 8.7 Hz,
H3,5), 7.16 (app. d, 2H, J = 8.7 Hz, H2,6), 6.45 (d, 1H, J = 16.0 Hz, H8), 5.48 (d, 1H, J = 2.1
Hz, H2’), 4.67 (d, 1H, J = 2.1 Hz, H3’), 4.31 (s, 2H, OCH2Cl), 3.25 (br. s, 1H, OH), 1.50 (s,
9H, t-Bu4), 1.43 (s, 9H, t-Bu1). 13C NMR: (600 MHz, CDCl3) δ: 170.2 (C4’), 165.8 (OCOCH3), 165.7 (C9), 165.4 (C1’),
152.0 (C1), 145.1 (C7), 132.5 (C4), 129.8 (C3,5), 121.8 (C2,6), 117.1 (C8), 84.0 (C1(CH3)3),
83.5 (C4(CH3)3), 73.8 (C2’), 70.7 (C3’), 40.9 (OCOCH2Cl), 28.1 (C4(CH3)3), 27.6
(C1(CH3)3).
IR (neat) ν: 3460, 2975, 2929, 1718, 1127, 839.
LRP (+EI) m/z (%): 484 (M+, <1), 428 (3), 372 (8), 355 (12), 327 (31), 296 (18), 278 (8),
240 (19), 223 (100), 206 (2), 164 (94), 147 (94), 119 (15), 57 (74), 41 (17).
HRMS calculated for C23H29ClO9 [M] + 484.1500, found 484.1494.
1-O-Chloroacetyl feruloyl tert-butyl L-tartrate (38)
Di-tert-butyl (2R,3R)-2-{[(2E)-3-{4-[(chloroacetyl)oxy]-3-methoxyphenyl}prop-2-
enoyl]oxy}-3-hydroxybutanedioate
From 22 (50.1 mg, 0.19 mmol), gave 32.0 mg (34%) of 38 as a white solid (m.p 106.0-
106.8 oC), as well as 19.1 mg (24%) of the dechloroacetylated product (40).
Rf (50% EtOAc/X4): 0.60
= -6.69o (c 1.5, acetone) 1H NMR: (600 MHz, CDCl3) δ: 7.70 (d, 1H, J = 16.0 Hz, H7), 7.12-7.08 (m, 3H, H3,5,6),
6.45 (d, 1H, J = 16.0 Hz, H8), 5.50 (d, 1H, J = 2.3 Hz, H2’), 4.68 (br. s, 1H, H3’), 4.34 (s,
2H, CH2Cl), 3.86 (s, 3H, OCH3), 3.22 (br. s, 1H, OH), 1.51 (s, 9H, t-Bu4), 1.44 (s, 9H, t-
Bu1). 13C NMR: (600 MHz, CDCl3) δ: 170.2 (C4’), 165.8 (OCOCH3), 165.4 (C1’), 165.3 (C9),
151.3 (C7), 145.5 (C2), 141.2 (C1), 133.7 (C4), 123.2 (C6), 121.7 (C5), 116.9 (C8), 111.6
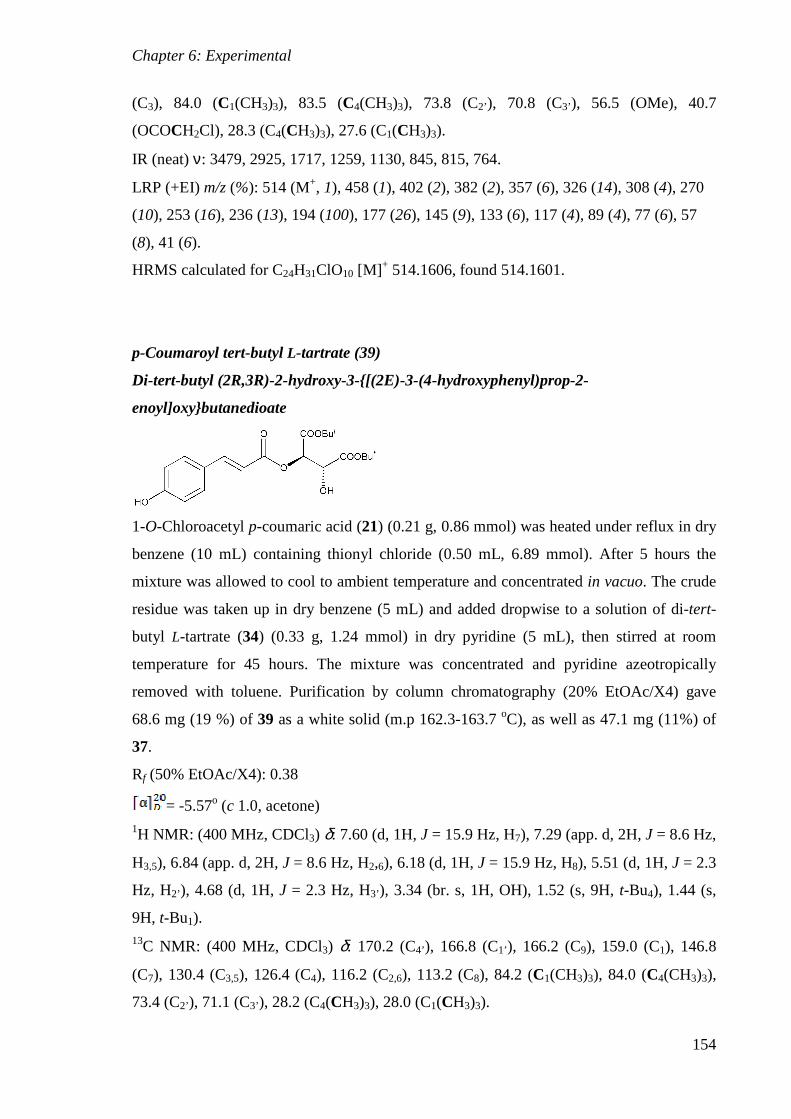
Chapter 6: Experimental
154
(C3), 84.0 (C1(CH3)3), 83.5 (C4(CH3)3), 73.8 (C2’), 70.8 (C3’), 56.5 (OMe), 40.7
(OCOCH2Cl), 28.3 (C4(CH3)3), 27.6 (C1(CH3)3).
IR (neat) ν: 3479, 2925, 1717, 1259, 1130, 845, 815, 764.
LRP (+EI) m/z (%): 514 (M+, 1), 458 (1), 402 (2), 382 (2), 357 (6), 326 (14), 308 (4), 270
(10), 253 (16), 236 (13), 194 (100), 177 (26), 145 (9), 133 (6), 117 (4), 89 (4), 77 (6), 57
(8), 41 (6).
HRMS calculated for C24H31ClO10 [M] + 514.1606, found 514.1601.
p-Coumaroyl tert-butyl L-tartrate (39)
Di-tert-butyl (2R,3R)-2-hydroxy-3-{[(2E)-3-(4-hydroxyphenyl)prop-2-
enoyl]oxy}butanedioate
1-O-Chloroacetyl p-coumaric acid (21) (0.21 g, 0.86 mmol) was heated under reflux in dry
benzene (10 mL) containing thionyl chloride (0.50 mL, 6.89 mmol). After 5 hours the
mixture was allowed to cool to ambient temperature and concentrated in vacuo. The crude
residue was taken up in dry benzene (5 mL) and added dropwise to a solution of di-tert-
butyl L-tartrate (34) (0.33 g, 1.24 mmol) in dry pyridine (5 mL), then stirred at room
temperature for 45 hours. The mixture was concentrated and pyridine azeotropically
removed with toluene. Purification by column chromatography (20% EtOAc/X4) gave
68.6 mg (19 %) of 39 as a white solid (m.p 162.3-163.7 oC), as well as 47.1 mg (11%) of
37.
Rf (50% EtOAc/X4): 0.38
= -5.57o (c 1.0, acetone) 1H NMR: (400 MHz, CDCl3) δ: 7.60 (d, 1H, J = 15.9 Hz, H7), 7.29 (app. d, 2H, J = 8.6 Hz,
H3,5), 6.84 (app. d, 2H, J = 8.6 Hz, H2,6), 6.18 (d, 1H, J = 15.9 Hz, H8), 5.51 (d, 1H, J = 2.3
Hz, H2’), 4.68 (d, 1H, J = 2.3 Hz, H3’), 3.34 (br. s, 1H, OH), 1.52 (s, 9H, t-Bu4), 1.44 (s,
9H, t-Bu1). 13C NMR: (400 MHz, CDCl3) δ: 170.2 (C4’), 166.8 (C1’), 166.2 (C9), 159.0 (C1), 146.8
(C7), 130.4 (C3,5), 126.4 (C4), 116.2 (C2,6), 113.2 (C8), 84.2 (C1(CH3)3), 84.0 (C4(CH3)3),
73.4 (C2’), 71.1 (C3’), 28.2 (C4(CH3)3), 28.0 (C1(CH3)3).

Chapter 6: Experimental
155
IR (neat) ν: 3389, 2977, 1712, 1145, 1129, 988, 831.
LRP (+EI) m/z (%): 408 (M+, 1), 352 (6), 296 (64), 279 (16), 251 (17), 206 (1), 164 (61),
147 (100), 119 (18), 91 (11), 57 (20), 41 (12).
HRMS calculated for C21H28O8 [M] + 408.1784, found 408.1783.
Feruloyl tert-butyl L-tartrate (40)
Di-tert-butyl (2R,3R)-2-hydroxy-3-{[(2E)-3-(4-hydroxy-3-methoxyphenyl)prop-2-
enoyl]oxy}butanedioate
1-O-Chloroacetyl ferulic acid (22) (0.21 g, 0.76 mmol) was submitted to the same reaction
conditions as described for 39 (above). This afforded 92.7 mg (28%) of 40 as a white solid
(m.p 172.6-174.0 oC), as well as 24.8 mg (6%) of 38.
Rf (50 % EtOAc/X4): 0.38
= -8.87o (c 1.0, acetone) 1H NMR: (600 MHz, CDCl3) δ: 7.68 (d, 1H, J = 15.9 Hz, H7), 7.07 (dd, 1H, J = 8.1 and
1.8 Hz, H5), 7.04 (d, 1H, J = 1.8 Hz, H3), 6.92 (d, 1H, J = 8.1 Hz, H6), 6.35 (d, 1H, J = 15.9
Hz, H8), 5.50 (d, 1H, J = 2.3 Hz, H2’), 4.67 (dd, 1H, J = 6.9 and 2.3 Hz, H3’), 3.93 (s, 3H,
OCH3), 3.20 (d, 1H, J = 6.9 Hz, OH), 1.51 (s, 9H, t-Bu4), 1.44 (s, 9H, t-Bu1). 13C NMR: (400 MHz, CDCl3) δ: 170.3 (C4’), 166.0 (C1’), 165.9 (C9), 148.4 (C1), 146.9
(C2), 146.7 (C7), 126.8 (C4), 123.7 (C5), 114.8 (C6), 113.8 (C8), 109.3 (C3), 84.0
(C1(CH3)3), 83.3 (C4(CH3)3), 73.3 (C2’), 71.0 (C3’), 56.1 (OCH3), 28.1 (C4(CH3)3), 28.0
(C1(CH3)3).
IR (neat) ν: 3465, 2929, 1726, 1146, 1120, 981, 844.
HRMS calculated for C22H30O9 [M + Na]+ 461.1788, found 461.1772.

Chapter 6: Experimental
156
p-Coumaroyl L-tartrate (7)
(2R,3R)-2-Hydroxy-3-{[(2E)-3-(4-hydroxyphenyl)prop-2-enoyl]oxy}butanedioic acid
p-Coumaroyl tert-butyl L-tartrate (39) (46.2 mg, 0.11 mmol) was dissolved in dry
dichloromethane (5 mL) followed by the addition of trifluoroacetic acid (0.18 mL, 2.29
mmol) and the mixture stirred at room temperature under a nitrogen atmosphere for 24
hours before being concentrated. Purification by reversed-phase chromatography (C18,
eluted with acetonitrile/H2O/formic acid, 30:69:1) gave 7 as an amorphous solid, 27.5 mg
(82%).
Rf (20% MeOH/DCM): 0.00 1H NMR: (400 MHz, CD3OD) δ: 7.74 (d, 1H, J = 15.9 Hz, H7), 7.48 (app. d, 2H, J = 8.7
Hz, H3,5), 6.81 (app. d, 2H, J = 8.7 Hz, H2,6), 6.38 (d, 1H, J = 15.9 Hz, H8), 5.55 (d, 1H, J =
2.3 Hz, H2’), 4.77 (d, 1H, J = 2.3 Hz, H3’). 13C NMR: (400 MHz, CDCl3) δ: 174.0 (C4’), 170.8 (C1’), 168.0 (C9), 161.5 (C1), 147.8
(C7), 131.4 (C3,5), 127.1 (C4), 116.8 (C2,6), 114.1 (C8), 74.9 (C2’), 71.7 (C3’).
All physical and chemical properties were as previously reported.243
Feruloyl L-tartrate (8)
(2R,3R)-2-Hydroxy-3-{[(2E)-3-(4-hydroxy-3-methoxyphenyl)prop-2-
enoyl]oxy}butanedioic acid
Feruloyl tert-butyl L-tartrate (40) (35.9 mg, 0.082 mmol) was dissolved in dry
dichloromethane (2 mL) followed by the addition of trifluoroacetic acid (0.13 mL, 1.63
mmol) and the mixture stirred at room temperature under a nitrogen atmosphere for 24
hours before being concentrated. Purification by reversed-phase chromatography (C18,
eluted with acetonitrile/H2O/formic acid, 30:69:1) gave 8 as an off-white amorphous solid,
11.0 mg (41%).
Rf (20% MeOH/DCM): 0.00

Chapter 6: Experimental
157
1H NMR: (400 MHz, CD3OD) δ: 7.73 (d, 1H, J = 16.0 Hz, H7), 7.20 (d, 1H, J = 1.9 Hz,
H3), 7.10 (dd, 1H, J = 8.2 and 1.9 Hz, H5), 6.82 (d, 1H, J = 8.2 Hz, H6), 6.41 (d, 1H, J =
16.0 Hz, H8), 5.57 (d, 1H, J = 2.4 Hz, H2’), 4.78 (d, 1H, J = 2.4 Hz, H3’), 3.89 (s, 3H,
OCH3). 13C NMR: (400 MHz, CDCl3) δ: 173.8 (C4’), 170.6 (C1’), 167.9 (C9), 150.8 (C1), 149.4
(C2), 148.1 (C7), 127.6 (C4), 124.3 (C5), 116.4 (C6), 114.3 (C8), 111.7 (C3), 74.9 (C2’), 71.7
(C3’), 56.5 (OCH3).
All physical and chemical properties were as previously reported.243-244
6.2.3 Synthesis of Hydroxycinnamoyl Glucose Esters
Chloroacetyl chloride (46)
Chloroacetic acid (100.25 g, 1.06 mol) and thionyl chloride (75 mL, 1.03 mol) were heated
under reflux for 2 hours under a nitrogen atmosphere. Distillation under nitrogen gave
chloroacetyl chloride (45-55% yield over a number of attempts) as a clear liquid, b.p. 102-
106 oC (lit. b.p. 106 oC),245 and left chloroacetic anhydride as a clear solid, m.p. 49-50 oC
(lit. m.p 48-60 oC)246 which could be separated from residual chloroacetic acid by
kugelrohr distillation under reduced pressure (105 oC at 20 mmHg). (Chloroacetic acid lit.
b.p. 189 oC, 120-123 oC at 20 mmHg).246
1,2,3,4,6-Penta-O-chloroacetyl-D-glucopyranoside (41)
1,2,3,4,6-Pentakis-O-(chloroacetyl)-D-glucopyranose
D-Glucose (4.02 g, 22.4 mmol) was dissolved in dry dichloromethane (90 mL) and dry
pyridine (10 mL). Chloroacetyl chloride (46) (17.6 mL, 221.0 mmol) was added dropwise
at 0 oC, following which the reaction mixture was heated under reflux for 24 hours. The
reaction mixture was poured onto ice water (100 mL), the organics were separated then
washed with 2 M HCl solution (3 x 100 mL), saturated sodium bicarbonate solution (3 x
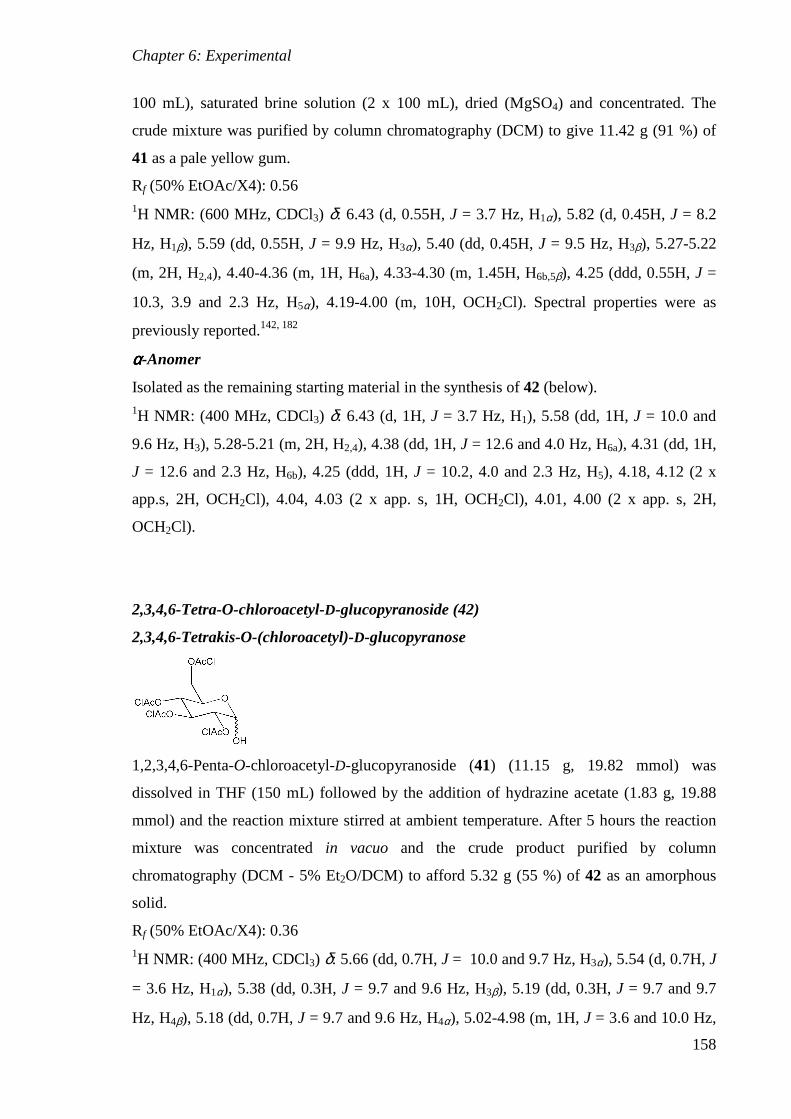
Chapter 6: Experimental
158
100 mL), saturated brine solution (2 x 100 mL), dried (MgSO4) and concentrated. The
crude mixture was purified by column chromatography (DCM) to give 11.42 g (91 %) of
41 as a pale yellow gum.
Rf (50% EtOAc/X4): 0.56 1H NMR: (600 MHz, CDCl3) δ: 6.43 (d, 0.55H, J = 3.7 Hz, H1α), 5.82 (d, 0.45H, J = 8.2
Hz, H1β), 5.59 (dd, 0.55H, J = 9.9 Hz, H3α), 5.40 (dd, 0.45H, J = 9.5 Hz, H3β), 5.27-5.22
(m, 2H, H2,4), 4.40-4.36 (m, 1H, H6a), 4.33-4.30 (m, 1.45H, H6b,5β), 4.25 (ddd, 0.55H, J =
10.3, 3.9 and 2.3 Hz, H5α), 4.19-4.00 (m, 10H, OCH2Cl). Spectral properties were as
previously reported.142, 182
αααα-Anomer
Isolated as the remaining starting material in the synthesis of 42 (below). 1H NMR: (400 MHz, CDCl3) δ: 6.43 (d, 1H, J = 3.7 Hz, H1), 5.58 (dd, 1H, J = 10.0 and
9.6 Hz, H3), 5.28-5.21 (m, 2H, H2,4), 4.38 (dd, 1H, J = 12.6 and 4.0 Hz, H6a), 4.31 (dd, 1H,
J = 12.6 and 2.3 Hz, H6b), 4.25 (ddd, 1H, J = 10.2, 4.0 and 2.3 Hz, H5), 4.18, 4.12 (2 x
app.s, 2H, OCH2Cl), 4.04, 4.03 (2 x app. s, 1H, OCH2Cl), 4.01, 4.00 (2 x app. s, 2H,
OCH2Cl).
2,3,4,6-Tetra-O-chloroacetyl-D-glucopyranoside (42)
2,3,4,6-Tetrakis-O-(chloroacetyl)-D-glucopyranose
1,2,3,4,6-Penta-O-chloroacetyl-D-glucopyranoside (41) (11.15 g, 19.82 mmol) was
dissolved in THF (150 mL) followed by the addition of hydrazine acetate (1.83 g, 19.88
mmol) and the reaction mixture stirred at ambient temperature. After 5 hours the reaction
mixture was concentrated in vacuo and the crude product purified by column
chromatography (DCM - 5% Et2O/DCM) to afford 5.32 g (55 %) of 42 as an amorphous
solid.
Rf (50% EtOAc/X4): 0.36 1H NMR: (400 MHz, CDCl3) δ: 5.66 (dd, 0.7H, J = 10.0 and 9.7 Hz, H3α), 5.54 (d, 0.7H, J
= 3.6 Hz, H1α), 5.38 (dd, 0.3H, J = 9.7 and 9.6 Hz, H3β), 5.19 (dd, 0.3H, J = 9.7 and 9.7
Hz, H4β), 5.18 (dd, 0.7H, J = 9.7 and 9.6 Hz, H4α), 5.02-4.98 (m, 1H, J = 3.6 and 10.0 Hz,
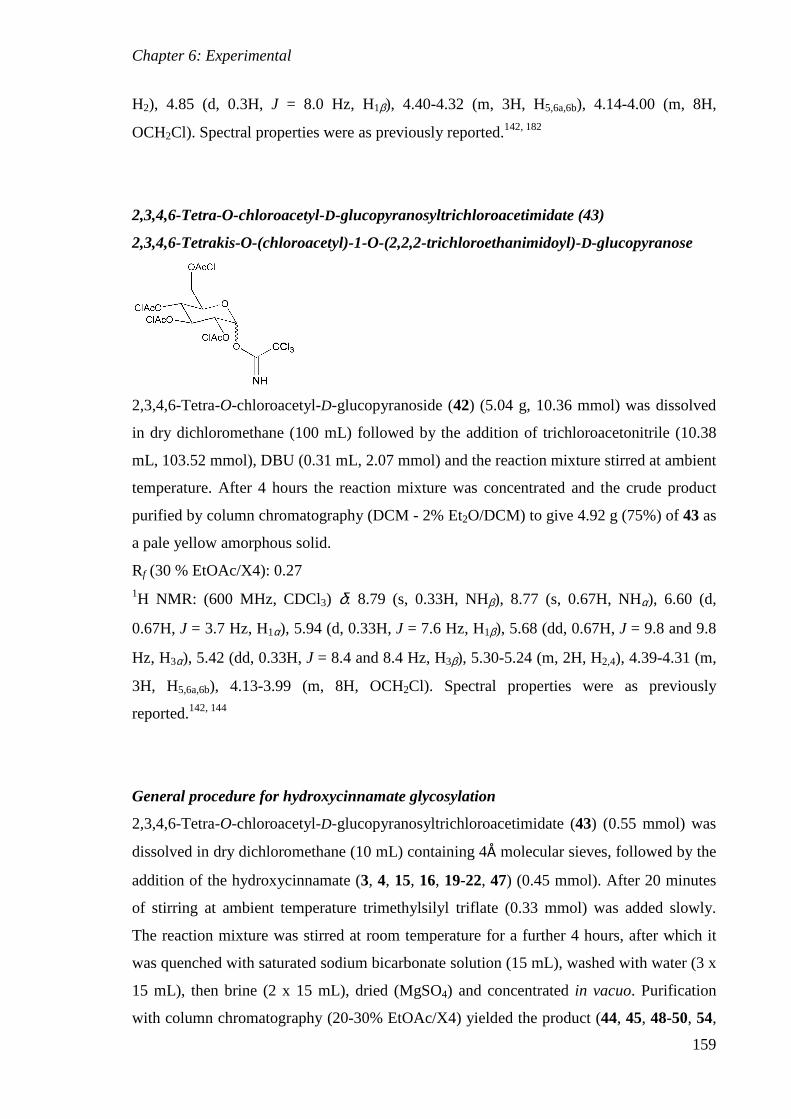
Chapter 6: Experimental
159
H2), 4.85 (d, 0.3H, J = 8.0 Hz, H1β), 4.40-4.32 (m, 3H, H5,6a,6b), 4.14-4.00 (m, 8H,
OCH2Cl). Spectral properties were as previously reported.142, 182
2,3,4,6-Tetra-O-chloroacetyl-D-glucopyranosyltrichloroacetimidate (43)
2,3,4,6-Tetrakis-O-(chloroacetyl)-1-O-(2,2,2-trichloroethanimidoyl)-D-glucopyranose
2,3,4,6-Tetra-O-chloroacetyl-D-glucopyranoside (42) (5.04 g, 10.36 mmol) was dissolved
in dry dichloromethane (100 mL) followed by the addition of trichloroacetonitrile (10.38
mL, 103.52 mmol), DBU (0.31 mL, 2.07 mmol) and the reaction mixture stirred at ambient
temperature. After 4 hours the reaction mixture was concentrated and the crude product
purified by column chromatography (DCM - 2% Et2O/DCM) to give 4.92 g (75%) of 43 as
a pale yellow amorphous solid.
Rf (30 % EtOAc/X4): 0.27 1H NMR: (600 MHz, CDCl3) δ: 8.79 (s, 0.33H, NHβ), 8.77 (s, 0.67H, NHα), 6.60 (d,
0.67H, J = 3.7 Hz, H1α), 5.94 (d, 0.33H, J = 7.6 Hz, H1β), 5.68 (dd, 0.67H, J = 9.8 and 9.8
Hz, H3α), 5.42 (dd, 0.33H, J = 8.4 and 8.4 Hz, H3β), 5.30-5.24 (m, 2H, H2,4), 4.39-4.31 (m,
3H, H5,6a,6b), 4.13-3.99 (m, 8H, OCH2Cl). Spectral properties were as previously
reported.142, 144
General procedure for hydroxycinnamate glycosylation
2,3,4,6-Tetra-O-chloroacetyl-D-glucopyranosyltrichloroacetimidate (43) (0.55 mmol) was
dissolved in dry dichloromethane (10 mL) containing 4Å molecular sieves, followed by the
addition of the hydroxycinnamate (3, 4, 15, 16, 19-22, 47) (0.45 mmol). After 20 minutes
of stirring at ambient temperature trimethylsilyl triflate (0.33 mmol) was added slowly.
The reaction mixture was stirred at room temperature for a further 4 hours, after which it
was quenched with saturated sodium bicarbonate solution (15 mL), washed with water (3 x
15 mL), then brine (2 x 15 mL), dried (MgSO4) and concentrated in vacuo. Purification
with column chromatography (20-30% EtOAc/X4) yielded the product (44, 45, 48-50, 54,
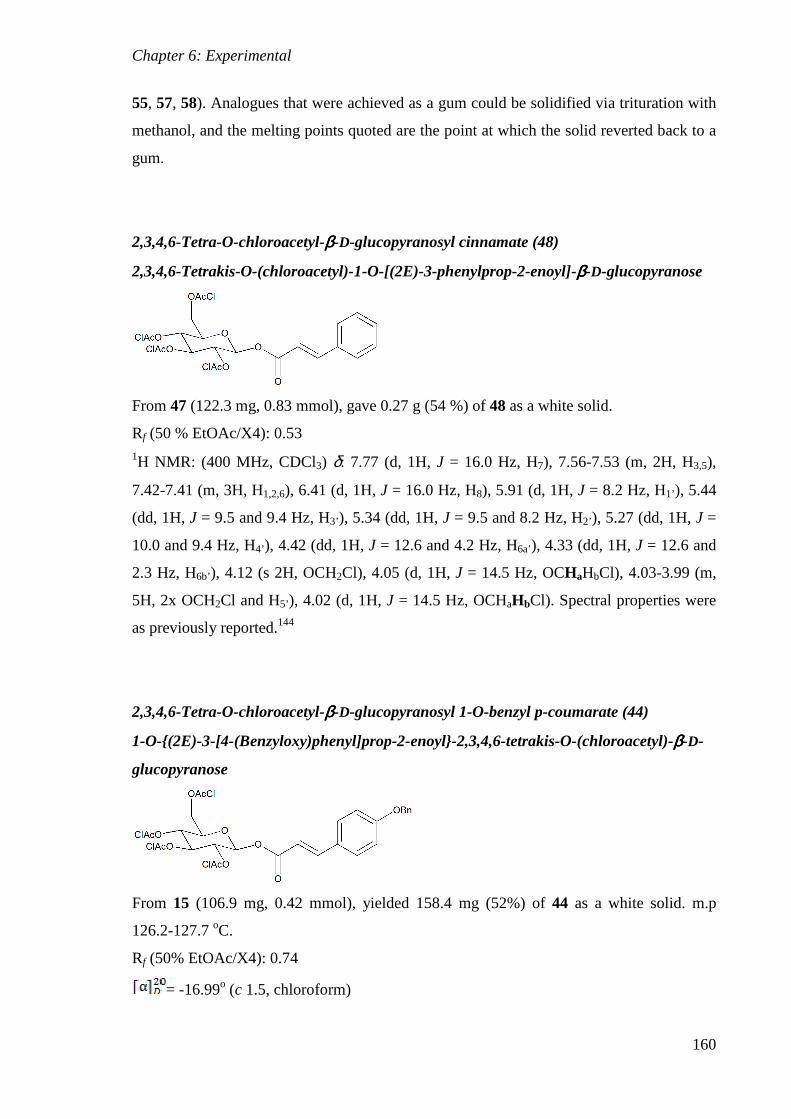
Chapter 6: Experimental
160
55, 57, 58). Analogues that were achieved as a gum could be solidified via trituration with
methanol, and the melting points quoted are the point at which the solid reverted back to a
gum.
2,3,4,6-Tetra-O-chloroacetyl-ββββ-D-glucopyranosyl cinnamate (48)
2,3,4,6-Tetrakis-O-(chloroacetyl)-1-O-[(2E)-3-phenylprop-2-enoyl]-ββββ-D-glucopyranose
From 47 (122.3 mg, 0.83 mmol), gave 0.27 g (54 %) of 48 as a white solid.
Rf (50 % EtOAc/X4): 0.53 1H NMR: (400 MHz, CDCl3) δ: 7.77 (d, 1H, J = 16.0 Hz, H7), 7.56-7.53 (m, 2H, H3,5),
7.42-7.41 (m, 3H, H1,2,6), 6.41 (d, 1H, J = 16.0 Hz, H8), 5.91 (d, 1H, J = 8.2 Hz, H1’), 5.44
(dd, 1H, J = 9.5 and 9.4 Hz, H3’), 5.34 (dd, 1H, J = 9.5 and 8.2 Hz, H2’), 5.27 (dd, 1H, J =
10.0 and 9.4 Hz, H4’), 4.42 (dd, 1H, J = 12.6 and 4.2 Hz, H6a’), 4.33 (dd, 1H, J = 12.6 and
2.3 Hz, H6b’), 4.12 (s 2H, OCH2Cl), 4.05 (d, 1H, J = 14.5 Hz, OCHaHbCl), 4.03-3.99 (m,
5H, 2x OCH2Cl and H5’), 4.02 (d, 1H, J = 14.5 Hz, OCHaHbCl). Spectral properties were
as previously reported.144
2,3,4,6-Tetra-O-chloroacetyl-ββββ-D-glucopyranosyl 1-O-benzyl p-coumarate (44)
1-O-{(2E)-3-[4-(Benzyloxy)phenyl]prop-2-enoyl}-2,3,4,6-tetrakis-O-(chloroacetyl)-ββββ-D-
glucopyranose
From 15 (106.9 mg, 0.42 mmol), yielded 158.4 mg (52%) of 44 as a white solid. m.p
126.2-127.7 oC.
Rf (50% EtOAc/X4): 0.74
= -16.99o (c 1.5, chloroform)

Chapter 6: Experimental
161
1H NMR: (400 MHz, CDCl3) δ: 7.71 (d, 1H, J = 16.0 Hz, H7), 7.49 (app. d, 2H J = 8.8 Hz,
H3,5), 7.44-7.32 (m, 5H, ArH), 6.99 (app. d, 2H, J = 8.8 Hz, H2,6), 6.26 (d, 1H, J = 16.0 Hz,
H8), 5.91 (d, 1H, J = 8.2 Hz, H1’), 5.44 (dd, 1H, J = 9.5 and 9.5 Hz, H3’), 5.33 (dd, 1H, J =
9.5 and 8.2 Hz, H2’), 5.26 (dd, 1H, J = 9.7 and 9.5 Hz, H4’), 5.10 (s, 2H, CH2Bn), 4.41 (dd,
1H, J = 12.5 and 4.3 Hz, H6a’), 4.32 (dd, 1H, J = 12.5 and 2.3 Hz, H6b’), 4.12 (app. s, 2H,
OCH2Cl), 4.04-3.99 (m, 7H, 3x OCH2Cl and H5’). 13C NMR: (400 MHz, CDCl3) δ: 167.1, 167.0, 166.4, 166.3 (4 x OCOCH2Cl), 164.9 (C9),
161.4 (C1), 148.1 (C7), 136.4 (Ar), 130.6 (C3,5), 129.0 (2 x Ar), 128.5 (Ar), 127.7 (2 x Ar),
126.8 (C4), 115.5 (C2,6), 113.0 (C8), 91.5 (C1’), 73.9 (C3’), 72.0 (C5’), 71.4 (C2’), 70.3
(CH2Ph), 69.2 (C4’), 62.9 (C6’), 40.9, 40.7, 40.4, 40.3 (4 x OCH2Cl).
IR (neat) ν: 2960, 1754, 1149, 1101, 1064, 826, 744.
HRMS calculated for C30H28Cl4O12 [M + Na]+ 745.0203, found 745.0163.
2,3,4,6-Tetra-O-chloroacetyl-ββββ-D-glucopyranosyl 1-O-benzyl ferulate (45)
1-O-{(2E)-3-[4-(Benzyloxy)-3-methoxyphenyl]prop-2-enoyl}-2,3,4,6-tetrakis-O-
(chloroacetyl)-ββββ-D-glucopyranose
From 16 (127.0 mg, 0.45 mmol), gave 183.1 mg (54%) of 45 as a white residue. Addition
of methanol followed by evaporation under reduced pressure gave a white solid. m.p 55.7-
59.9 oC.
Rf (50% EtOAc/X4): 0.66
= -8.85o (c 1.1, chloroform) 1H NMR: (400 MHz, CDCl3) δ: 7.68 (d, 1H, J = 15.9 Hz, H7), 7.44-7.42 (m, 2H, ArH),
7.39-7.36 (m, 2H, ArH), 7.33-7.30 (m, 1H, ArH), 7.09-7.04 (m, 2H, H3,5), 6.88 (d, 1H, J =
8.2 Hz, H6), 6.26 (d, 1H, J = 15.9 Hz, H8), 5.90 (d, 1H, J = 8.2 Hz, H1’), 5.43 (dd, 1H, J =
9.5 and 9.5 Hz, H3’), 5.33 (dd, 1H, J = 9.5 and 8.2 Hz, H2’), 5.26 (dd, 1H, J = 9.6 and 9.5
Hz, H4’), 5.20 (s, 2H, CH2Ph), 4.42 (dd, 1H, J = 12.5 and 4.4 Hz, H6a’), 4.32 (dd, 1H, J =
12.5 and 2.3 Hz, H6b’), 4.12 (app. s, 2H, OCH2Cl), 4.04 and 4.03 (2 x app. s, 2 x 1H, O
CH2Cl), 4.01 and 4.01 (m, 5H, 2 x OCH2Cl and H5’), 3.93 (s, 3H, OCH3).

Chapter 6: Experimental
162
13C NMR: (400 MHz, CDCl3) δ: 167.3, 167.1, 166.6, 166.5 (4 x OCOCH2Cl), 165.0 (C9),
151.3 (C1), 150.1 (C2), 148.4 (C7), 136.6 (Ar), 129.0 (2 x Ar), 128.4 (Ar), 127.5 (2 x Ar),
127.2 (C4), 123.6 (C5), 113.5 (C6), 113.4 (C8), 110.5 (C3), 91.6 (C1’), 73.5 (C3’), 72.2 (C5’),
71.1 (C2’), 70.7 (CH2Bn), 69.3 (C4’), 62.8 (C6’), 56.2 (OCH3), 40.8, 40.5, 40.5, 40.5 (4 x
OCH2Cl).
IR (neat) ν: 2958, 1754, 1135, 1068, 1000, 792, 697.
HRMS calculated for C31H30Cl4O13 [M + Na]+ 775.0309, found 775.0284.
2,3,4,6-Tetra-O-chloroacetyl-ββββ-D-glucopyranosyl p-coumarate (49)
2,3,4,6-Tetrakis-O-(chloroacetyl)-1-O-[(2E)-3-(4-hydroxyphenyl)prop-2-enoyl]-ββββ-D-
glucopyranose
From 3 (53.5 mg, 0.33 mmol), afforded 60.0 mg (29 %) of a mixture of 49, and a minor
unidentified impurity.
Rf (50% EtOAc/X4): 0.53 1H NMR: (400 MHz, CDCl3) δ: 7.70 (d, 1H, 15.8 Hz, H7), 7.45 (app. d, 2H, J = 8.7 Hz,
H3,5), 6.86 (app. d, 2H, J = 8.7 Hz, H2,6), 6.52 (d, 1H, J = 8.2 Hz, H1’), 4.43-4.30 (m, 2H,
H6a’,6b’), 4.12-3.99 (4 x OCH2Cl). Assignment and identification was based on
unobstructed proton shifts, and the known spectrum of the feruloyl analogue (50).
2,3,4,6-Tetra-O-chloroacetyl-ββββ-D-glucopyranosyl ferulate (50)
2,3,4,6-Tetrakis-O-(chloroacetyl)-1-O-[(2E)-3-(4-hydroxy-3-methoxyphenyl)prop-2-
enoyl]-ββββ-D-glucopyranose
From 4 (157.4 mg, 0.81 mmol), trituration of the columned product with methanol gave
207.6 mg (39%) of 50 as a white solid. m.p. 157.8-158.7 oC.
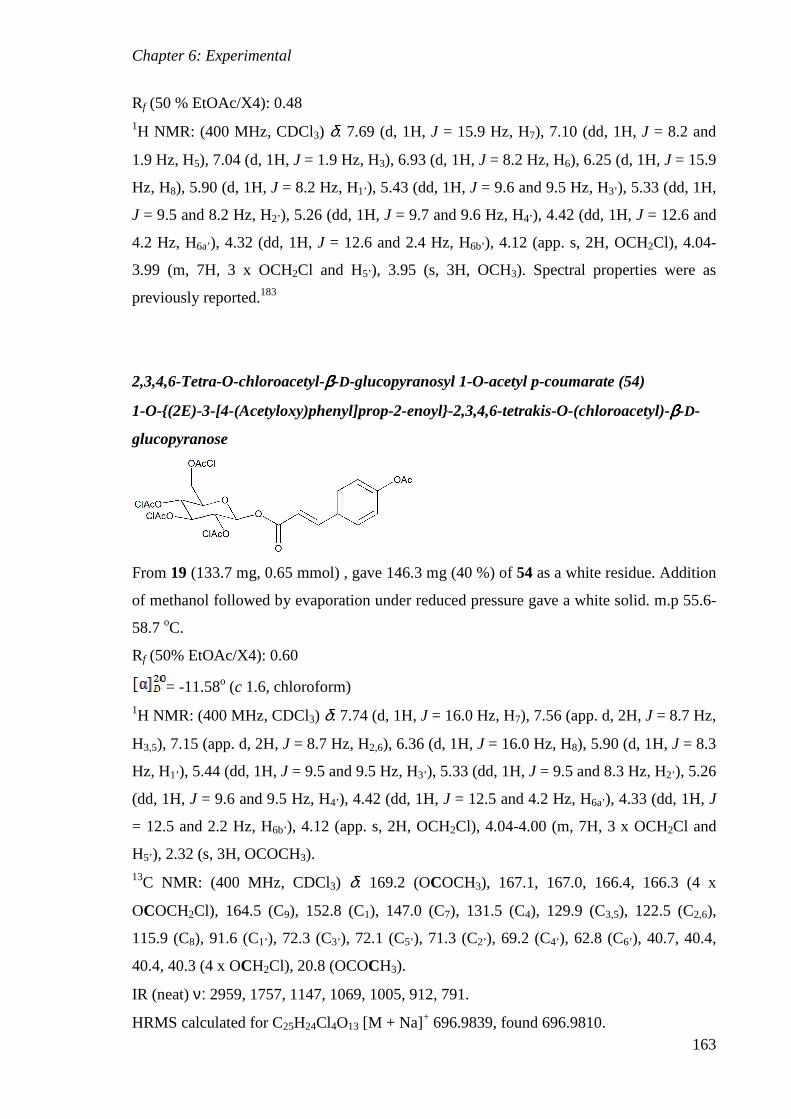
Chapter 6: Experimental
163
Rf (50 % EtOAc/X4): 0.48 1H NMR: (400 MHz, CDCl3) δ: 7.69 (d, 1H, J = 15.9 Hz, H7), 7.10 (dd, 1H, J = 8.2 and
1.9 Hz, H5), 7.04 (d, 1H, J = 1.9 Hz, H3), 6.93 (d, 1H, J = 8.2 Hz, H6), 6.25 (d, 1H, J = 15.9
Hz, H8), 5.90 (d, 1H, J = 8.2 Hz, H1’), 5.43 (dd, 1H, J = 9.6 and 9.5 Hz, H3’), 5.33 (dd, 1H,
J = 9.5 and 8.2 Hz, H2’), 5.26 (dd, 1H, J = 9.7 and 9.6 Hz, H4’), 4.42 (dd, 1H, J = 12.6 and
4.2 Hz, H6a’), 4.32 (dd, 1H, J = 12.6 and 2.4 Hz, H6b’), 4.12 (app. s, 2H, OCH2Cl), 4.04-
3.99 (m, 7H, 3 x OCH2Cl and H5’), 3.95 (s, 3H, OCH3). Spectral properties were as
previously reported.183
2,3,4,6-Tetra-O-chloroacetyl-ββββ-D-glucopyranosyl 1-O-acetyl p-coumarate (54)
1-O-{(2E)-3-[4-(Acetyloxy)phenyl]prop-2-enoyl}-2,3,4,6-tetrakis-O-(chloroacetyl)-ββββ-D-
glucopyranose
From 19 (133.7 mg, 0.65 mmol) , gave 146.3 mg (40 %) of 54 as a white residue. Addition
of methanol followed by evaporation under reduced pressure gave a white solid. m.p 55.6-
58.7 oC.
Rf (50% EtOAc/X4): 0.60
= -11.58o (c 1.6, chloroform) 1H NMR: (400 MHz, CDCl3) δ: 7.74 (d, 1H, J = 16.0 Hz, H7), 7.56 (app. d, 2H, J = 8.7 Hz,
H3,5), 7.15 (app. d, 2H, J = 8.7 Hz, H2,6), 6.36 (d, 1H, J = 16.0 Hz, H8), 5.90 (d, 1H, J = 8.3
Hz, H1’), 5.44 (dd, 1H, J = 9.5 and 9.5 Hz, H3’), 5.33 (dd, 1H, J = 9.5 and 8.3 Hz, H2’), 5.26
(dd, 1H, J = 9.6 and 9.5 Hz, H4’), 4.42 (dd, 1H, J = 12.5 and 4.2 Hz, H6a’), 4.33 (dd, 1H, J
= 12.5 and 2.2 Hz, H6b’), 4.12 (app. s, 2H, OCH2Cl), 4.04-4.00 (m, 7H, 3 x OCH2Cl and
H5’), 2.32 (s, 3H, OCOCH3). 13C NMR: (400 MHz, CDCl3) δ: 169.2 (OCOCH3), 167.1, 167.0, 166.4, 166.3 (4 x
OCOCH2Cl), 164.5 (C9), 152.8 (C1), 147.0 (C7), 131.5 (C4), 129.9 (C3,5), 122.5 (C2,6),
115.9 (C8), 91.6 (C1’), 72.3 (C3’), 72.1 (C5’), 71.3 (C2’), 69.2 (C4’), 62.8 (C6’), 40.7, 40.4,
40.4, 40.3 (4 x OCH2Cl), 20.8 (OCOCH3).
IR (neat) ν: 2959, 1757, 1147, 1069, 1005, 912, 791.
HRMS calculated for C25H24Cl4O13 [M + Na]+ 696.9839, found 696.9810.

Chapter 6: Experimental
164
2,3,4,6-Tetra-O-chloroacetyl-ββββ-D-glucopyranosyl 1-O-acetyl ferulate (55)
1-O-{(2E)-3-[4-(Acetyloxy)-3-methoxyphenyl]prop-2-enoyl}-2,3,4,6-tetrakis-O-
(chloroacetyl)-ββββ-D-glucopyranose
From 20 (132.4 mg, 0.56 mmol), afforded 168.7 mg (44%) of 55. Addition of methanol
followed by evaporation under reduced pressure gave a white solid. m.p 59.8-62.3 oC.
Rf (50 % EtOAc/X4): 0.50
= -4.63o (c 1.1, chloroform) 1H NMR: (400 MHz, CDCl3) δ: 7.72 (d, 1H, J = 16.0 Hz, H7), 7.14 (dd, 1H, J = 8.1 and
1.8 Hz, H5), 7.11 (d, 1H, J = 1.8 Hz, H3), 7.08 (d, 1H, J = 8.1 Hz, H6), 6.35 (d, 1H, J = 16.0
Hz, H8), 5.90 (d, 1H, J = 8.3 Hz, H1’), 5.43 (dd, 1H, J = 9.6 and 9.5 Hz, H3’), 5.34 (dd, 1H,
J = 9.5 and 8.3 Hz, H2’), 5.26 (dd, 1H, J = 9.7 and 9.6 Hz, H4’), 4.42 (dd, 1H, J = 12.5 and
4.2 Hz, H6a’), 4.33 (dd, 1H, J = 12.5 and 2.2 Hz, H6b’), 4.13 (app. s, 2H, OCH2Cl), 4.04-
4.00 (m, 7H, 3 x OCH2Cl and H5’), 3.88 (s, 3H, OCH3), 2.33 (s, 3H, OCOCH3). 13C NMR: (400 MHz, CDCl3) δ: 168.9 (OCOCH3), 167.1, 167.0, 166.4, 166.3 (4 x
OCOCH2Cl), 164.4 (C9), 151.7 (C1), 147.5 (C7), 142.3 (C2), 132.7 (C4), 123.6 (C6), 122.0
(C5), 115.9 (C8), 111.5 (C3), 91.5 (C1’), 73.9 (C3’), 72.3 (C5’), 71.2 (C2’), 69.2 (C4’), 62.8
(C6’), 56.1 (OCH3), 40.7, 40.4, 40.3, 40.3 (4 x OCH2Cl), 20.8 (OCOCH3).
IR (neat) ν: 2959, 1756, 1147, 1070, 1004, 791.
HRMS calculated for C26H26Cl4O14 [M + Na]+ 726.9945, found 726.9936.
2,3,4,6-Tetra-O-chloroacetyl-ββββ-D-glucopyranosyl 1-O-chloroacetyl p-coumarate (57)
2,3,4,6-Tetrakis-O-(chloroacetyl)-1-O-[(2E)-3-{4-[(chloroacetyl)oxy]phenyl}prop-2-
enoyl]-ββββ-D-glucopyranose
From 21 (210.6 mg, 0.88 mmol), gave 0.30 g (48%) of 57 as a white honeycomb. m.p
48.0-51.0 oC.

Chapter 6: Experimental
165
Rf (50% EtOAc/X4): 0.59
= -4.60o (c 0.9, chloroform) 1H NMR: (400 MHz, CDCl3) δ: 7.73 (d, 1H, J = 16.0 Hz, H7), 7.58 (app. d, 2H, J = 8.7 Hz,
H3,5), 7.20 (app. d, 2H, J = 8.7 Hz, H2,6), 6.37 (d, 1H, J = 16.0 Hz, H8), 5.90 (d, 1H, J = 8.2
Hz, H1’), 5.44 (dd, 1H, J = 9.6 and 9.5 Hz, H3’), 5.33 (dd, 1H, J = 9.5 and 8.2 Hz, H2’), 5.26
(dd, 1H, J = 9.7 and 9.6 Hz, H4’), 4.42 (dd, 1H, J = 12.5 and 4.3 Hz, H6a’), 4.33 (m, 3H,
ArOCOCH2Cl and H6b’), 4.12 (app. s, 2H, OCH2Cl), 4.04-4.01 (m, 7H, 3 x OCH2Cl and
H5’). 13C NMR: (400 MHz, CDCl3) δ: 167.1, 166.9, 166.4, 166.2 (4 x Glc-OCOCH2Cl), 165.6
(ArOCOCH2Cl), 164.3 (C9), 152.3 (C1), 146.7 (C7), 132.0 (C4), 129.9 (C3,5), 122.0 (C2,6),
116.4 (C8), 91.5 (C1’), 73.9 (C3’), 72.2 (C5’), 71.4 (C2’), 69.2 (C4’), 62.8 (C6’), 40.9
(ArOCOCH2Cl), 40.6, 40.3, 40.3, 40.3 (4 x Glc-OCOCH2Cl).
IR (neat) ν: 2958, 1752, 1138, 1069, 1002, 926, 792, 754.
HRMS calculated for C25H23Cl5O13 [M + Na]+ 730.9449, found 730.9445.
2,3,4,6-Tetra-O-chloroacetyl-ββββ-D-glucopyranosyl 1-O-chloroacetyl ferulate (58)
2,3,4,6-Tetrakis-O-(chloroacetyl)-1-O-[(2E)-3-{4-[(chloroacetyl)oxy]-3-
methoxyphenyl}prop-2-enoyl]-ββββ-D-glucopyranose
From 22 (224.0 mg, 0.83 mmol), afforded 0.38 g (64%) of 58 as a pale yellow honeycomb.
m.p 62.0-64.7 oC.
Rf (40% EtOAc/X4): 0.46 1H NMR: (400 MHz, CDCl3) δ: 7.71 (d, 1H, J = 16.0 Hz, H7), 7.15 (dd, 1H, J = 8.1 and
1.8 Hz, H5), 7.12 (d, 1H, J = 1.8 Hz, H3), 7.11 (d, 1H, J = 8.1 Hz, H6), 6.36 (d, 1H, J = 16.0
Hz, H8), 5.90 (d, 1H, J = 8.2 Hz, H1’), 5.44 (dd, 1H, J = 9.5 and 9.4 Hz, H3’), 5.33 (dd, 1H,
J = 9.5 and 8.2 Hz, H2’), 5.26 (dd, 1H, J = 9.9 and 9.4 Hz, H4’), 4.42 (dd, 1H, J = 12.5 and
4.3 Hz, H6a’), 4.33 (m, 3H, ArOCH2Cl and H6b’), 4.12 (app, s. 2H, OCH2Cl), 4.04-4.01 (m,
7H, 3 x OCH2Cl and H5’), 3.88 (s, 3H, OCH3). 13C NMR: (400 MHz, CDCl3) δ: 167.1, 166.9, 166.4, 166.3 (4 x Glc-OCOCH2Cl), 165.2
(ArOCOCH2Cl), 164.3 (C9), 151.4 (C1), 147.2 (C7), 141.6 (C2), 133.2 (C4), 123.2 (C6),

Chapter 6: Experimental
166
121.9 (C5), 116.4 (C8), 111.7 (C3), 91.5 (C1’), 73.9 (C3’), 72.3 (C5’), 71.4 (C2’), 69.2 (C4’),
62.8 (C6’), 56.2 (OCH3), 40.6-40.3 (5 x OCH2Cl).
HRMS calculated for C26H25Cl5O14 [M + Na]+ 760.9555, found 760.9523.
Physical and chemical properties were as previously reported.183
General procedure for de-chloroacetylation (ambient light)
2,3,4,6-Tetra-O-chloroacetyl-β-D-glucopyranosyl hydroxycinnamate (48-50) (100.0 mg)
was dissolved in pyridine/water (1:1, 10 mL) and stirred at room temperature for 4 hours.
The reaction mixture was concentrated and the crude mixture purified using XAD-8 resin
(eluted with 60% MeOH/H2O) to give a mixture of cis- and trans-β-D-glucopyranosyl
hydroxycinnamate as a colourless residue (53, 9, 10).
1-O-ββββ-D-Glucopyranosyl cinnamate (53)
1-O-(3-Phenylacryloyl)-ββββ-D-glucopyranose
From 48 (95.6 mg, 0.16 mmol), gave 10 mg (21%) of 53 as a mixture of cis/trans-isomers.
Rf (20% MeOH/DCM): 0.40
1-O-ββββ-D-Glucopyranosyl trans-cinnamate
1-O-[(2E)-3-Phenylprop-2-enoyl]-ββββ-D-glucopyranose 1H NMR: (400 MHz, CD3OD) δ: 7.81 (d, 1H, J = 16.0 Hz, H7), 7.64-7.62 (m, 2H, ArH),
7.44-7.40 (m, 3H, ArH), 6.58 (d, 1H, J = 16.0 Hz, H8), 5.60 (d, 1H, J = 7.7 Hz, H1’), 3.86
(dd, 1H, J = 12.1 and 2.0 Hz, H6a’), 3.70 (dd, 1H, J = 12.1 and 4.8 Hz, H6b’), 3.50-3.35 (m,
4H, H2’,3’,4’,5’).
1-O-ββββ-D-Glucopyranosyl cis-cinnamate
1-O-[(2Z)-3-Phenylprop-2-enoyl]-ββββ-D-glucopyranose 1H NMR: (400 MHz, CD3OD) δ: 7.69-7.66 (m, 2H, ArH), 7.35-7.33 (m, 3H, ArH), 7.10
(d, 1H, J = 12.7 Hz, H7), 6.02 (d, 1H, J = 12.7 Hz, H8), 5.54 (d, 1H, J = 8.1 Hz, H1’), 3.87-
3.83 (m, 1H, H6a’), 3.71-3.66 (m, 1H, H6b’), 3.49-3.34 (m, 4H, H2’,3’,4’,5’).

Chapter 6: Experimental
167
The spectrum of each isomer was extracted from the mixture. Spectral properties for the
trans-isomer were as previously reported.247-248 Assignment and identification of the cis-
isomer was performed using the known trans-isomer (trans-53) and the data for the cis-
aglycone (cis-47).235
1-O-ββββ-D-Glucopyranosyl p-coumarate (9)
1-O-[3-(4-Hydroxyphenyl)acryloyl]-ββββ-D-glucopyranose
From 49 (60.0 mg, 0.10 mmol), yielded 10.3 mg (33%) of 9 as a mixture of cis/trans-
isomer, as well as 9.6 mg (25%) of 51.
Rf (20% MeOH/DCM): 0.29
1-O-ββββ-D-Glucopyranosyl trans-p-coumarate
1-O-[(2E)-3-(4-Hydroxyphenyl)prop-2-enoyl]-ββββ-D-glucopyranose 1H NMR: (400 MHz, CD3OD) δ: 7.73 (m, 1H, H7), 7.48 (app. d, 2H, J = 8.5 Hz, H3,5), 6.82
(app. d, 2H, J = 8.5 Hz, H2,6), 6.37 (d, 1H, J = 15.9 Hz, H8), 5.58 (d, 1H, J = 8.0 Hz, H1’),
3.85 (m, 1H, H6a’), 3.68 (m, 1H, H6b’), 3.47-3.32 (m, 4H, H2’,3’,4’,5’).
1-O-ββββ-D-Glucopyranosyl cis-p-coumarate
1-O-[(2Z)-3-(4-Hydroxyphenyl)prop-2-enoyl]-ββββ-D-glucopyranose 1H NMR: (400 MHz, CD3OD) δ: 7.73 (m, 2H, H3,5), 6.94 (d, 1H, J = 12.9 Hz, H7), 6.82
(app. d, 2H, J = 8.8 Hz, H2,6), 5.82 (d, 1H, J = 12.9 Hz, H8), 5.55 (d, 1H, J = 8.0 Hz, H1’),
3.85 (m, 1H, H6a’), 3.68 (m, 1H, H6b’), 3.47-3.32 (m, 4H, H2’, 3’, 4’, 5’).
The spectrum of each isomer was extracted from the mixture. Spectral properties for the
trans-isomer were as previously reported.108, 179 Assignment and identification of the cis-
isomer was performed using the known trans-isomer (trans-9) and the data for the cis-
aglycone (cis-3).214, 235

Chapter 6: Experimental
168
6-O-Chloroacety-ββββ-D-glucopyranosyl trans-p-coumarate (51)
6-O-(Chloroacetyl)-1-O-[(2E)-3-(4-hydroxyphenyl)prop-2-enoyl]-ββββ-D-glucopyranose
Isolated during the synthesis of 9.
Rf (20% MeOH/DCM): 0.58 1H NMR: (400 MHz, CD3OD) δ: 7.73 (d, 1H, J = 15.9, H7), 7.49 (app. d, 2H, J = 8.6 Hz,
H3,5), 6.82 (app. d, 2H, J = 8.6 Hz, H2,6), 6.37 (d, 1H, J = 15.9 Hz, H8), 5.55 (d, 1H, J = 7.9
Hz, H1’), 4.49 (dd, 1H, J = 12.0 and 2.2 Hz, H6a’), 4.33 (dd, 1H, J = 12.0 and 5.6 Hz, H6b’),
4.23 (s, 2H, OCH2Cl), 3.49-3.36 (m, 4H, H2’,3’,4’,5’).
1-O-ββββ-D-Glucopyranosyl ferulate (10)
1-O-[3-(4-Hydroxy-3-methoxyphenyl)acryloyl]-ββββ-D-glucopyranose
From 50 (219.3 mg, 0.33 mmol), gave 24.1 mg (20%) of 10 as a mixture of cis/trans-
isomer.
Rf (20 % MeOH/DCM): 0.32
ββββ-D-Glucopyranosyl trans-ferulate
1-O-[(2E)-3-(4-Hydroxy-3-methoxyphenyl)prop-2-enoyl]-ββββ-D-glucopyranose 1H NMR: (400 MHz, CD3OD) δ: 7.73 (d, 1H, J = 15.9 Hz, H7), 7.21 (d, 1H, J = 1.9 Hz,
H3), 7.10 (dd, 1H, J = 8.2 and 1.9 Hz, H5), 6.82 (d, 1H, J = 8.2 Hz, H6), 6.41 (d, 1H, J =
15.9 Hz, H8), 5.58 (d, 1H, J = 7.5 Hz, H1’), 3.90 (s, 3H, OCH3), 3.86 (m, 1H, H6a’), 3.70
(m, 1H, H6b’), 3.49-3.35 (m, 4H, H2’, 3’,4’,5’).
ββββ-D-Glucopyranosyl cis-ferulate
1-O-[(2Z)-3-(4-Hydroxy-3-methoxyphenyl)prop-2-enoyl]-ββββ-D-glucopyranose 1H NMR: (400 MHz, CD3OD) δ: 7.87 (d, 1H, J = 1.9 Hz, H3), 7.17 (dd, 1H, J = 8.3 and
1.9 Hz, H5), 6.94 (d, 1H, J = 13.0 Hz, H7), 6.77 (d, 1H, J = 8.3 Hz, H6), 5.83 (d, 1H, J =

Chapter 6: Experimental
169
13.0 Hz, H8), 5.56 (d, 1H, J = 7.8 Hz, H1’), 3.88 (s, 3H, OCH3), 3.88-3.84 (m, 1H, H6a’),
3.72-3.66 (m, 1H, H6b’), 3.49-3.35 (m, 4H, H2’,3’,4’,5’).
The spectrum of each isomer was extracted from the mixture. Spectral properties for the
trans-isomer were as previously reported.108, 179, 183 Assignment and identification of the
cis-isomer was performed using the known trans-isomer (trans-10) and the data for the cis-
aglycone (cis-4).184, 235
General procedure for de-chloroacetylation (red light)
2,3,4,6-Tetra-O-chloroacetyl-β-D-glucopyranosyl hydroxycinnamate (54, 57, 58) (300.0
mg) was dissolved in pyridine/water (1:1, 20 mL) and stirred at room temperature in the
dark for 4 hours (54) or for 6 hours (57 and 58). Only being exposed to red light, the
reaction mixture was concentrated and the crude mixture purified with XAD-8 resin
(eluted with 60% MeOH/H2O) to give a trans-β-D-glucopyranosyl hydroxycinnamate as a
colourless residue.
1-O-ββββ-D-Glucopyranosyl 1-O-acetyl p-coumarate (56)
1-O-{(2E)-3-[4-(Acetyloxy)phenyl]prop-2-enoyl}-ββββ-D-glucopyranose
From 54 (113.8 mg, 0.17 mmol), gave 12.7 mg (20%) of 56 as a white residue containing
minor impurities of 9, as well as 2.3 mg (4%) of 9.
Rf (20 % MeOH/DCM): 0.39 1H NMR: (400 MHz, CD3OD) δ: 7.80 (d, 1H, J = 16.0 Hz, H7), 7.67 (app. d, 2H J = 8.5
Hz, H3,5), 7.17 (app. d, 2H, J = 8.5 Hz, H2,6), 6.56 (d, 1H, J = 16.0 Hz, H8), 5.59 (d, 1H, J =
8.0 Hz, H1’), 3.86 (dd, 1H, J = 12.1 and 1.9 Hz, H6a’), 3.70 (dd, 1H, J = 12.1 and 4.8 Hz,
H6b’), 3.47-3.38 (m, 4H, H2’,3’,4’,5’), 2.29 (s, 3H, OCOCH3).

Chapter 6: Experimental
170
1-O-ββββ-D-Glucopyranosyl trans-p-coumarate (9)
1-O-[(2E)-3-(4-Hydroxyphenyl)prop-2-enoyl]-ββββ-D-glucopyranose
From 57 (261.7 mg, 0.37 mmol), gave 51.5 mg (43%) of 9 as a white residue, determined
to have undergone acyl migration, largely consisting of the 1-O-β-ester (approx. 80%). The
migrated mixture was found to revert back to the 1-O-β-ester after standing in pH 3.5
model wine media.
Rf (20 % MeOH/DCM): 0.29 1H NMR: (400 MHz, CD3OD) δ: 7.73 (d, 1H, J = 15.9 Hz, H7), 7.48 (app. d, 2H, J = 8.5
Hz, H3,5), 6.82 (app. d, 2H, J = 8.5 Hz, H2,6), 6.37 (d, 1H, J = 15.9 Hz, H8), 5.57 (d, 1H, J =
7.9 Hz, H1’), 3.85 (dd, 1H, J = 12.1 and 1.8 Hz, H6a’), 3.69 (dd, 1H, J = 12.1 and 4.6 Hz,
H6b’), 3.45-3.38 (m, 4H, H2’,3’,4’,5’).
MS (-EI) m/z (%): 325.7 (M-, 100), 265.5 (7), 187.7 (8), 163.4 (21), 145.2 (44).
Physical and chemical properties for the 1-O-β-ester were as previously reported.108, 131, 179
1-O-ββββ-D-Glucopyranosyl trans-ferulate (10)
1-O-[(2E)-3-(4-Hydroxy-3-methoxyphenyl)prop-2-enoyl]-ββββ-D-glucopyranose
From 58 (501.8 mg, 0.68 mmol), 47.5 mg (20%) of 10 as an off-white residue, determined
to have undergone acyl migration, largely consisting of the 1-O-β-ester (approx. 90%). The
migrated mixture was found to revert back to the 1-O-β-ester after standing in pH 3.5
model wine media.
Rf (20% MeOH/DCM): 0.32 1H NMR: (400 MHz, CD3OD) δ: 7.73 (d, 1H, J = 15.9 Hz, H7), 7.21 (d, 1H, J = 1.9 Hz,
H3), 7.10 (dd, 1H, J = 8.2 and 1.9 Hz, H5), 6.82 (d, 1H, J = 8.2 Hz, H6), 6.41 (d, 1H, J =
15.9 Hz, H8), 5.58 (d, 1H, J = 7.5 Hz, H1’), 3.90 (s, 3H, OCH3), 3.86 (dd, 1H, J = 12.1 and
2.1 Hz, H6a’), 3.70 (dd, 1H, J = 12.1 and 4.5 Hz, H6b’), 3.49-3.35 (m, 4H, H2’,3’,4’,5’).

Chapter 6: Experimental
171
MS (-EI) m/z (%): 355.3 (M-, 100), 295.5 (8), 217.2 (20), 193.6 (25), 175.4 (32).
Physical and chemical properties for the 1-O-β-ester were as previously reported.108, 179, 183,
200

Chapter 6: Experimental
172
6.3 Experimental Procedures for Chapter 3.
Theoretical studies into the thermodynamics of glucose ester migration
The ten possible glucose esters (1/2/3/4/6-O-α/β-) were drawn for both p-coumaroyl
glucose (9) and feruloyl glucose (10) using the equilibrium geometry optimised in four
different solvents (water, dichloromethane, ethanol and toluene), and the energies given in
Hartrees (a.u.) were converted to kJ/mol using a factor of 2625.5. The final ester energies
were calculated relative to the 1-O-β-ester in each case. The raw data is displayed in
Appendix 1.
Theoretical studies into the kinetics of glucose ester migration
The four intermediates for each migration were drawn and the equilibrium geometry
optimised for three different conditions (vacuum, water and dichloromethane). The
energies calculated were converted to kJ/mol and expressed relative to intermediate 1. The
raw data is displayed in Appendix 2.
Wine samples for analysis
One white wine (Stanley Classic Dry White) and one red wine (Yalumba 1997 Shiraz)
were extracted with and without spikes of p-coumaroyl and feruloyl glucose (5 mg/L).
Liquid-liquid extraction was performed with 50 mL of wine, extracting alternatively with
diethyl ether (3 x 50 mL) and ethyl acetate (3 x 50 mL) before being concentrated under
reduced pressure at 30 oC and taken up in methanol (2 mL). Solid-phase extraction was
performed using XAD-8 resin, where 50 mL of wine was loaded, washed with water,
eluted with 25%, 50%, 75% methanol in water and then 100% methanol, fractions were
individually concentrated and taken up in methanol (2 mL). Concentrated wine samples
were prepared from 50 mL of wine at 30 oC under reduced pressure until the volume had
reduced to 5 mL. Neat wine samples were passed through a 45 µm syringe filter and
analysed directly. Standards of p-coumaroyl glucose (9) and feruloyl glucose (10) were
prepared to determine retention times and response factors (in methanol 10 mg/L, 100
mg/L), extraction efficiencies were estimated using the prepared 3 point calibration curve,
along with the 2 point curves produced by analysing spiked and unspiked wine samples.

Chapter 6: Experimental
173
HPLC analysis of wine samples
Analyses were performed on an Agilent 1100 instrument (Agilent, Forest Hill, Vic,
Australia) equipped with a quaternary pump and diode array detector (DAD). The column
was a 250 x 4.6 mm, 3 µm, 100 Å Luna C18, operated at 25 ºC and protected by a
C18 guard column (4 x 2 mm) (Phenomenex, Lane Cove, NSW, Australia). The eluents
were formic acid/water (0.5:99.5 v/v, Eluent A), formic acid/acetonitrile/water
(0.5:25.0:74.5 v/v, Eluent B) and methanol (Eluent C) with a flow rate of 1 mL/min. A
gradient was applied as follows: 20% to 30% B linear from 0 to 20 minutes; 30% to 50% B
linear from 20 to 50 minutes; 50% B to 100% C linear from 50 to 60 minutes; 100% C to
20% B from 60 to 65 minutes. The column was equilibrated with 20% B for 10 minutes
prior to an injection. A 20 µL injection volume was used for each sample and DAD
signals were recorded at all available wavelengths for compound identification, and
quantified using 280 and 320 nm. Compounds in each sample were identified by
comparison of their retention times and UV/Vis spectra with those of authentic standards.
LCMS analysis of wine samples
HPLC-MS or MS/MS analysis was carried out using a 4000 Q TRAP hybrid tandem mass
spectrometer interfaced with a Turbo V ion source for elecrospray ionization (AB Sciex
AB Sciex, Foster City, CA), combined with an Agilent 1200 HPLC system equipped with
a binary pump, degasser, autosampler, column oven, and photodiode array (PDA) detector.
HPLC conditions:
A 10 µL aliquot of the samples was injected and chromatographed using the same column
and elution profile as described for HPLC, above. The column temperature was maintained
at 25˚C during the HPLC run. The eluent from the HPLC was split by use of a splitter (a
tee) and delivered at a follow rate of 0.45 mL/min to the mass spectrometer and at 0.55
mL/min to the PDA detector with monitoring wavelengths at 290, 320 and 370 nm with a
slit width of 4 and a bandwidth of 16 nm.
Electrospray and mass spectrometric conditions:
All mass spectrometric data were obtained in negative ion mode. Nitrogen gas was used
for the curtain, nebulizer, turbo and collision gases. The Turbo V ion source parameter
were set at -3500 V for the ion spray potential, -60 V for the declustering potential, -10 V

Chapter 6: Experimental
174
for the entrance potential, 50 psi for gas 1 (nebulizer) and gas 2 (turbo), 15 psi for the
curtain gas, and 500 °C for the turbo gas (gas 2) temperature.
For tandem mass spectrometry, the collision potential was set in an appropriate range from
-15 to -25 V and the collision gas pressure was set at high. Product ion spectra of m/z 325
for p-coumaroyl glucose and m/z 355 for feruloyl glucose were recorded in a mass range
from m/z 50 to 400 with a scan time of 1 s and a step mass of 0.1. For selected reaction
monitoring, the following mass transitions were monitored with a dwell time of 50 ms; m/z
325 119, 145, 163 and 187 for p-coumaroyl glucose, and m/z 355 119, 175, 193 and 217
for feruloyl glucose.

Chapter 6: Experimental
175
6.4 Experimental Procedures for Chapter 4.
cis-Ethyl coumarate (cis-11)
Ethyl (2Z)-3-(4-hydroxyphenyl)prop-2-enoate
cis-Ethyl coumarate (cis-11) was achieved as a minor product from the aforementioned
Wittig reaction (Synthesis of 11, Chapter 6.2.1), or by irradiation under ultra-violet light
(365 nm), whereby isolation using column chromatography (10% EtOAc/X4) yielded a
white solid. m.p. 72.3-74.4 oC (lit. m.p.73-74 oC).185
Rf (50% EtOAc/X4): 0.51 1H NMR: (400 MHz, CDCl3) δ: 7.63 (app. d, 2H, J = 8.6 Hz, H3,5), 6.85 (d, 1H, J = 12.7
Hz, H7), 6.80 (app. d, 2H, J = 8.6 Hz, H2,6), 5.83 (d, 1H, J = 12.7 Hz, H8), 4.21 (q, 2H, J =
7.1 Hz, OCH2CH3), 1.29 (t, 3H, J = 7.1 Hz, OCH2CH3).
All physical and chemical properties were as previously reported.185
cis-Ethyl ferulate (cis-12)
Ethyl (2Z)-3-(4-hydroxy-3-methoxyphenyl)prop-2-enoate
cis-Ethyl ferulate (cis-12) was achieved as a minor product from the aforementioned Wittig
reaction (Synthesis of 12, Chapter 6.2.1), or by irradiation under ultra-violet light (365
nm), whereby isolation using column chromatography (10% EtOAc/X4) yielded a
colourless oil.
Rf (50% EtOAc/X4): 0.55 1H NMR: (400 MHz, CDCl3) δ: 7.77 (d, 1H, J = 1.9 Hz, H3), 7.11 (dd, 1H, J = 8.5 and 1.9
Hz, H5), 6.88 (d, 1H, J = 8.5 Hz, H6), 6.79 (d, 1H, J = 12.9 Hz, H7), 5.81 (d, 1H, J = 12.9
Hz, H8), 4.21 (q, 2H, J = 7.1 Hz, OCH2CH3), 3.92 (s, 3H, OCH3), 1.29 (t, 3H, J = 7.1 Hz,
OCH2CH3).
All physical and chemical properties were as previously reported.185

Chapter 6: Experimental
176
cis-p-Coumaric acid (cis-3)
(2Z)-3-(4-Hydroxyphenyl)prop-2-enoic acid
cis-Ethyl coumarate (cis-11) (0.11 g, 0.59 mmol) was dissolved in 1:1 aqueous ethanol
(v/v, 10 mL) followed by the addition of potassium hydroxide (0.10 g, 1.78 mmol), then
the reaction mixture was stirred at room temperature for 3 days. The mixture was then
diluted with water (5 mL), unwanted organics extracted with diethyl ether (2 x 10 mL), the
aqueous layer acidified to pH 3 with 2 M hydrochloric acid solution and extracted with
ethyl acetate (2 x 10 mL). Concentration at reduced pressure gave 97 mg (99%) of a 80:20
mixture of trans- and cis-p-coumaric acid as an off-white solid. 1H NMR: (400 MHz, DMSO-d6) δ: 9.55 (br. s, 0.80H, trans-COOH), 9.84 (br. s, 0.20H,
cis-COOH), 7.63 (app. d, 0.40H, J = 8.6 Hz, cis-H3,5), 7.51 (app. d, 1.60H, J = 8.6 Hz,
trans-H3,5), 7.49 (d, 0.80H, J = 15.9 Hz, trans-H7), 6.79 (app. d, 1.60H, J = 8.6 Hz, trans-
H2,6), 6.78-6.73 (m, 0.60H, cis-H2,6,7), 6.28 (d, 0.80H, J = 15.9 Hz, trans-H8), 5.72 (d,
0.20H, J = 12.8 Hz, cis-H8).
Spectral properties were as previously reported.214, 235
cis-p-Coumaric acid by UV irradiation
trans-p-Coumaric acid (3) was dissolved in acetone and exposed to UV light at 365 nm for
4 days. The resulting mixture of isomers was concentrated and analysed by NMR to show
a trans:cis-ratio of approximately 61:39.
cis-Ferulic acid (cis-4)
(2Z)-3-(4-Hydroxy-3-methoxyphenyl)prop-2-enoic acid
Using the same procedure as described above (for cis-3), reaction of cis-ethyl ferulate (cis-
12) (0.31 g, 1.39 mmol) gave 268 mg (99%) of a 65:35 mixture of trans- and cis-ferulic
acid as a yellow solid.

Chapter 6: Experimental
177
1H NMR: (400 MHz, DMSO-d6) δ: 9.55 (br. s, 0.65H, trans-COOH), 9.46 (br. s, 0.35H,
cis-COOH), 7.65 (d, 0.35H, J = 2.0 Hz, cis-H3), 7.48 (d, 0.65H, J = 15.9 Hz, trans-H7),
7.27 (d, 0.65H, J = 1.9 Hz, trans-H3), 7.15 (dd, 0.35H, J = 8.3 and 2.0 Hz, cis-H5), 7.08
(dd, 0.65H, J = 8.2 and 1.9 Hz, trans-H5), 6.79 (d, 0.65H, J = 8.2 Hz, trans-H6), 6.75 (d,
0.35H, J = 12.9 Hz, cis-H7), 6.75 (d, 0.35H, J = 8.2 Hz, cis-H6), 6.36 (d, 0.65H, J = 15.9
Hz, trans-H8), 5.73 (d, 0.35H, J = 12.9 Hz, cis-H8), 3.81 (s, 1.95H, trans-OCH3), 3.75 (s,
1.05H, cis-OCH3).
Spectral properties were as previously reported.184, 235
cis-Ferulic acid by UV irradiation
trans-Ferulic acid (4) was dissolved in acetone and exposed to UV light at 365 nm for 4
days. The resulting mixture of isomers was concentrated and analysed by NMR to show a
trans:cis-ratio of approximately 50:50.
Stability of cis/trans-p-coumaric acid mixture
Portions of cis/trans-p-coumaric acid (3) (61:39 cis:trans ratio, 5 mg) either as a solid, or
dissolved in acetone (5 mL) were stored under four different conditions. Both a solid and
liquid sample was stored at ambient temperature in the dark, at ambient temperature under
ambient light conditions, at 4 oC or at -20 oC. Samples stored at 4 or -20 oC were not
exposed to light. After two weeks of storage, liquid samples were concentrated in vacuo
and all samples were analysed by 1H NMR and the isomeric ratio determined by
integration of the signals. The ratios determined are shown in Table 4.2.
Effect of group 10 metals on ethyl coumarate isomerisation
Experiment 1:
Into four separate flasks were placed:
1) trans-Ethyl coumarate (11) (60.3 mg, 0.31 mmol) and dichloromethane (3 mL).
2) trans-Ethyl coumarate (11) (56.0 mg, 0.29 mmol), dichloromethane (3 mL) and 10%
palladium on activated carbon (15.7 mg, 0.015 mmol of Pd, 5% by moles).
3) trans-Ethyl coumarate (11) (42.4 mg, 0.22 mmol), dichloromethane (3 mL) and 10%
palladium on activated carbon (311.9 mg, 0.29 mmol of Pd, 132% by moles).

Chapter 6: Experimental
178
4) trans-Ethyl coumarate (11) (31.0 mg, 0.16 mmol), dichloromethane (3 mL) and 10%
platinum on activated carbon (4.9 mg, 0.002 mmol of Pt, 1.6% by moles).
The four mixtures were irradiated under 365 nm light for 18 hours before being filtered
through celite and concentrated in vacuo. Analysis of the crude mixtures by 1H NMR
allowed for determination of the isomeric ratios by integration, which existed as follows:
1) 68:32, trans:cis-ethyl coumarate.
2) 74:26, trans:cis-ethyl coumarate.
3) 100 % trans-ethyl coumarate.
4) 70:30, trans:cis-ethyl coumarate.
Experiment 2:
Into two separate flasks were placed:
1) cis-Ethyl coumarate (cis-11) (12.8 mg, 0.07 mmol) and dichloromethane (4 mL).
2) cis-Ethyl coumarate (cis-11) (10.3 mg, 0.05 mmol), dichloromethane (4 mL) and
palladium acetate (7.8 mg, 0.03 mmol of Pd).
Both mixtures were stirred at ambient temperature under ambient light conditions for 48
hours before being concentrated in vacuo and subjected to analysis by 1H NMR. Analysis
of mixture 1 indicated minor conversion from cis- to trans-ethyl coumarate while mixture
2 contained only trans-ethyl coumarate.
Theoretical studies into the photoisomerisation of hydroxycinnamates
Energy profiles were initially calculated in a vacuum at the S0 and T1 state using either a
dynamic dihedral constraint between 180 and 0o with the geometry optimised every 10o, or
by manually constraining the dihedral in 10o increments with the geometry optimised for
the resulting 19 structures. Energies were calculated in Hartrees and converted to kJ/mol,
with the energy displayed relative to the S0 180o dihedral geometry. Solvated energy
profiles were produced in an analogous fashion optimising the geometries in water. The
energy profile geometries were initially calculated from the MMFF geometry, then from
the MMFF conformer. The raw data is displayed in Appendix 3.

Chapter 6: Experimental
179
Vertical excitation energies were calculated by optimising the unconstrained trans-
configuration, followed by single-point energy calculation at the T1 level. HOMO-LUMO
gaps were calculated by comparing the orbitals in the S0 state. The raw data is displayed in
Appendix 4.

Chapter 6: Experimental
180
6.5 Experimental Procedures for Chapter 5.
6.5.1 General Procedures for Chapter 5
Media for yeast growth
YPD – Yeast extract (1% w/v), peptone (2% w/v), D-glucose (2% w/v) in Milli-Q water
was autoclaved and stored at room temperature.
YNB – US Biologicals Yeast Nitrogen Base in Milli-Q water (6.76 g/L) was supplemented
with glucose (20 g/L), the pH adjusted to 3.5 with 10% HCl solution, sterile filtered
(StericapTM PLUS 0.22 µm) and stored at room temperature.
Starter cultures
Yeasts were obtained from the AWRI culture collection on MYPG plates, transferred to
YPD broth and stored at 28 oC with constant shaking (150 r.p.m.) until the cell count
surpassed 1 x 10⁸ cells/mL as determined by haemocytometry.
Fermentation experiments
Fermentations were performed in triplicate in 250 mL fermentation flasks equipped with a
gas-lock. YNB media (200 mL) was spiked with the specified compound and inoculated
with 1 x 10⁶ cells/mL of yeast from a starter culture. Where specified, control flasks
containing media and the spike were established in the same manner, without inoculation,
and all experiments were conducted at 28 oC. The experiments were concluded after the
yeast stationary phase, as determined by the optical density.
Ferment sampling
An aliquot of 5 mL was taken from each ferment and from this the yeast growth was
determined. The remaining sample was centrifuged (4000 r.p.m. for 5 minutes at 25 oC),
the supernatant decanted from the yeast pellet, and stored at -20 oC until required for
analysis. Sampling was initially performed every two days, with additional samples taken
near the completion of fermentation (as the results specify).

Chapter 6: Experimental
181
Yeast growth
Was determined from fermentation samples by optical density as measured with a
Beckman Coulter DU 530 Life Sciences UV/Vis Spectrophotometer. Aliquots (100 µL)
were diluted with water (10 x) and the yeast growth determined by measuring the
absorbance at 600 nm using water as a blank.
Model wine
A saturated solution of potassium hydrogen tartrate in demineralised water was acidified to
pH 3.5 with tartaric acid, stored at 4 oC overnight, then decanted from the precipitate.
4-Ethylphenol / 4-ethylguaiacol analysis
Analysis of 4-ethylphenol and 4-ethylguaiacol was performed as described by Pollnitz et
al.63 The concentration of 4-ethylphenol and 4-ethylguaiacol in the fermentation samples
were measured in µg/L and the percentage conversion calculated using a full molar
conversion from substrate to ethylphenol. The average percentage conversion across the
three replicates is displayed in Appendix 5, which was used to produce figures as shown in
Chapter 5.
Results for analysis of uninoculated controls are not shown, but all were found to contain
no traces of ethylphenols.

Chapter 6: Experimental
182
cis / trans-Ferulic acid analysis
An unpublished HPLC method developed by the AWRI was utilised, with the solvent
parameters altered to achieve maximum resolution of isomers.
Analyses were performed on an Agilent 1100 instrument (Agilent, Forest Hill, VIC,
Australia) equipped with a quaternary pump and diode array detector (DAD). The column
consisted of a mixed-mode RP/weak anion exchange (WAX) stationary phase based on N-
(10-undecenoyl)-3-aminoquinuclidine, bonded to thiol-functionalised silica (150 x 2 mm, 5
µm, 100 Å VDS Optilab, Berlin, Germany), operated at 25 ºC and protected by an NH2
guard column (4 x 2 mm) (Phenomenex, Lane Cove, NSW, Australia). The eluents were
formic acid/water (0.1:99.9 v/v, Eluent A), and formic acid/acetonitrile (0.1:99.9 v/v,
Eluent B) with a flow rate of 0.400 mL/min. Isocratic elution was performed using 70% A
and 30% B with run time of 7 minutes. A 50% aqueous acetonitrile solution wash was used
as the column wash eluent. A 20 µL injection volume was used for each sample and DAD
signals were recorded at 280, 320, 353, 370 and 520 nm. Compounds in each sample were
identified by comparison of their retention times and UV/Vis spectra with those of
standards, with quantifications calculated using absorbance at 280 and 320 nm only.
trans-Ferulic acid was dissolved in ethanol and serial dilutions were prepared (75 mg/L,
62.5 mg/L, 50 mg/L, 25 mg/L, 10 mg/L, 5 mg/L and 1 mg/L). The produced trans-ferulic
acid calibration curve was used to quantify trans-ferulic acid in prepared isomeric mixtures
of cis/trans-ferulic acid (50:50 cis/trans-ferulic acid, concentrations used as above,
equating to 37.5 mg/L, 31.25 mg/L, 25 mg/L, 12.5 mg/L, 5 mg/L, 2.5 mg/L and 0.5 mg/L).
The calibration was checked by running cis/trans-mixtures of known concentration and
ratio (25:75 cis/trans-ferulic acid, 10 mg/L, 20 mg/L; 12.5:87.5 cis/trans-ferulic acid, 10
mg/L, 20 mg/L).
cis / trans-Ethyl hydroxycinnamate analysis
Analysis of trans-ethyl ferulate and trans-ethyl coumarate was performed using the
method described by Sleep.141, 249 Quantification of cis-ethyl coumarate and cis-ethyl
ferulate was achieved by determining the differences in extraction efficiency and mass
spectral responses from the trans-isomers through extracting and analysing mixtures of
known concentration and ratio (1:1, 5 mg/L and 10 mg/L).

Chapter 6: Experimental
183
Rapid GCMS quantifications were performed using the same method, quantified using a 4
point calibration curve of the trans-internal standard and cis/trans-ethyl esters (0 mg/L, 5
mg/L, 10 mg/L and 15 mg/L).
HPLC quantifications of the trans-isomers were performed using the same
chromatographic conditions described in Chapter 6.3 for analysis of wine samples,
employing external standards of trans-ethyl ferulate and trans-ethyl coumarate prepared at
5, 10, 15 and 20 mg/L. The produced calibration curve was used to quantify trans-ethyl
ferulate and trans-ethyl coumarate in the fermentation samples, which were syringe filtered
(0.45 µm) and analysed without dilution.

Chapter 6: Experimental
184
6.5.2 Fermentation of trans-Hydroxycinnamate Esters
Fermentation of ethyl hydroxycinnamates
Stock solutions of ethyl coumarate (1 mg/mL) and ethyl ferulate (1 mg/mL) were made up
in ethanol, and the fermentations spiked at 10 mg/L. These were inoculated with AWRI
1499, and along with uninoculated controls, were stored and mixed manually at each
sampling point. Substrate selectivity was tested in a similar manner, inoculating with either
AWRI 1499, AWRI 1608 or AWRI 1613 and stored with occasional shaking.
Fermentation of hydroxycinnamoyl tartrate esters
Stock solutions of p-coumaroyl tartrate (1 mg/mL) and feruloyl tartrate (1 mg/mL) were
made up in ethanol, and the fermentations spiked at 10 mg/L. These were inoculated with
AWRI 1499, and along with uninoculated controls, were stored with constant shaking.
Hydroxycinnamoyl tartrate ester strain dependence was performed in a similar manner,
with fermentations inoculated with either AWRI 1499, AWRI 1608 or AWRI 1613 and
stored with constant shaking.
Fermentation of hydroxycinnamoyl glucose esters
Stock solutions of p-coumaroyl glucose (1.03 mg/mL) and feruloyl glucose (0.95 mg/mL)
were made up in ethanol under red light and stored in the dark. The fermentations were
spiked at 10 mg/L and inoculated with AWRI 1499. These, along with uninoculated
controls, were covered in foil to maintain isomeric purity, stored and mixed manually at
each sampling point with.
6.5.3 Stereoselectivity of D. bruxellensis Enzyme Activities
Decarboxylase stereoselectivity
Stock solutions of trans-ferulic acid (5 mg/mL), cis/trans-ferulic acid (50:50 ratio, 5
mg/mL), trans-p-coumaric acid (5 mg/mL) and cis/trans-p-coumaric acid (39:61 ratio, 5
mg/mL) were made up in ethanol. Ferulate and p-coumarate fermentations were performed
separately, being spiked with either trans-acid (50 mg/L) or cis/trans-acid (50 mg/L),
inoculated with AWRI 1499, stored and mixed manually at each sampling point.

Chapter 6: Experimental
185
NMR spectra of uninoculated flasks containing cis/trans-acid (50 mg/L) were used to
monitor the isomeric ratio over the fermentation period. NMR samples were produced by
extraction of the entire 200 mL ferment with ethyl acetate (3 x 50 mL), then removal of the
solvent by rotary evaporation. The ratio was determined by the integration of either the H8
or the H3 signals.
Ethyl esterase stereoselectivity
Stock solutions cis-ethyl coumarate (1 mg/mL) and cis-ethyl ferulate (1 mg/mL) were
made up in ethanol under red light and stored in the dark. The fermentations were spiked
with both esters at 10 mg/L, inoculated with AWRI 1499, wrapped in alfoil to maintain
isomeric purity and along with uninocluated controls, were stored and mixed manually at
each sampling point. Samples for analysis were taken under red light.

Appendix 1: Data for Migration Thermodynamics
186
Appendix 1: Data for Migration Thermodynamics.
Table A1.1: Energies of p-coumaroyl and feruloyl glucose esters in water, using DFT
B3LYP 6-31G*.
Hartrees (a.u.) kJ/mol Relative to 1-O -ββββ Hartrees (a.u.) kJ/mol Relative to 1-O -ββββ1-O -ββββ -1184.20519 -3109130.3 0.0 -1298.72015 -3409789.3 0.01-O -αααα -1184.18255 -3109070.8 59.4 -1298.70484 -3409749.1 40.22-O -ββββ -1184.19626 -3109106.8 23.4 -1298.71136 -3409766.2 23.12-O -αααα -1184.20248 -3109123.2 7.1 -1298.71770 -3409782.8 6.43-O -ββββ -1184.19781 -3109110.9 19.4 -1298.71293 -3409770.3 19.03-O -αααα -1184.19715 -3109109.2 21.1 -1298.71205 -3409768.0 21.34-O -ββββ -1184.19503 -3109103.6 26.7 -1298.71037 -3409763.6 25.74-O -αααα -1184.19211 -3109095.9 34.3 -1298.71263 -3409769.5 19.76-O -ββββ -1184.19020 -3109090.9 39.4 -1298.70643 -3409753.2 36.06-O -αααα -1184.20156 -3109120.7 9.5 -1298.71677 -3409780.4 8.9
p -Coumaroyl glucose Feruloyl glucose
Table A1.2: Energies of p-coumaroyl and feruloyl glucose esters in dichloromethane, using
DFT B3LYP 6-31G*.
Hartrees (a.u.) kJ/mol Relative to 1-O -ββββ Hartrees (a.u.) kJ/mol Relative to 1-O -ββββ1-O -ββββ -1184.20123 -3109119.9 0.0 -1298.71642 -3409779.5 0.01-O -αααα -1184.18389 -3109074.4 45.5 -1298.70860 -3409758.9 20.52-O -ββββ -1184.19515 -3109103.9 16.0 -1298.71055 -3409764.1 15.42-O -αααα -1184.20189 -3109121.6 -1.7 -1298.71734 -3409781.9 -2.43-O -ββββ -1184.19669 -3109108.0 11.9 -1298.71201 -3409767.9 11.63-O -αααα -1184.19673 -3109108.1 11.8 -1298.71190 -3409767.6 11.94-O -ββββ -1184.19374 -3109100.2 19.7 -1298.70910 -3409760.2 19.24-O -αααα -1184.19117 -3109093.5 26.4 -1298.71229 -3409768.6 10.86-O -ββββ -1184.19349 -3109099.6 20.3 -1298.70875 -3409759.3 20.16-O -αααα -1184.20361 -3109126.1 -6.2 -1298.71927 -3409786.9 -7.5
p -Coumaroyl glucose Feruloyl glucose

Appendix 1: Data for Migration Thermodynamics
187
Table A1.3: Energies of p-coumaroyl and feruloyl glucose esters in ethanol, using DFT
B3LYP 6-31G*.
Hartrees (a.u.) kJ/mol Relative to 1-O -ββββ Hartrees (a.u.) kJ/mol Relative to 1-O -ββββ1-O -ββββ -1184.21194 -3109148.0 0.0 -1298.72783 -3409809.4 0.0
1-O -αααα -1184.19874 -3109113.3 34.7 -1298.72248 -3409795.4 14.02-O -ββββ -1184.20851 -3109139.0 9.0 -1298.72467 -3409801.1 8.32-O -αααα -1184.21514 -3109156.4 -8.4 -1298.73133 -3409818.6 -9.23-O -ββββ -1184.21175 -3109147.5 0.5 -1298.72781 -3409809.4 0.13-O -αααα -1184.21154 -3109146.9 1.1 -1298.72747 -3409808.5 0.94-O -ββββ -1184.20785 -3109137.3 10.7 -1298.72393 -3409799.2 10.24-O -αααα -1184.20617 -3109132.8 15.1 -1298.72677 -3409806.6 2.86-O -ββββ -1184.20733 -3109135.9 12.1 -1298.72339 -3409797.8 11.76-O -αααα -1184.21677 -3109160.7 -12.7 -1298.73306 -3409823.2 -13.7
p -Coumaroyl glucose Feruloyl glucose
Table A1.4: Energies of p-coumaroyl and feruloyl glucose esters in toluene, using DFT
B3LYP 6-31G*.
Hartrees (a.u.) kJ/mol Relative to 1-O -ββββ Hartrees (a.u.) kJ/mol Relative to 1-O -ββββ1-O -ββββ -1184.20094 -3109119.1 0.0 -1298.71557 -3409777.2 0.0
1-O -αααα -1184.18122 -3109067.3 51.8 -1298.70599 -3409752.1 25.22-O -ββββ -1184.19381 -3109100.4 18.7 -1298.70870 -3409759.2 18.02-O -αααα -1184.20068 -3109118.4 0.7 -1298.71557 -3409777.2 0.03-O -ββββ -1184.19488 -3109103.2 15.9 -1298.70959 -3409761.5 15.73-O -αααα -1184.19458 -3109102.4 16.7 -1298.70918 -3409760.5 16.84-O -ββββ -1184.19246 -3109096.9 22.3 -1298.70733 -3409755.6 21.64-O -αααα -1184.18910 -3109088.0 31.1 -1298.71038 -3409763.6 13.66-O -ββββ -1184.19104 -3109093.1 26.0 -1298.70580 -3409751.6 25.76-O -αααα -1184.20182 -3109121.4 -2.3 -1298.71679 -3409780.4 -3.2
p -Coumaroyl glucose Feruloyl glucose
Table A1.5: Energies of p-coumaroyl glucose esters in different solvents, relative to the 1-
O-α-ester.
Water Dichloromethane Ethanol Toluene St. Dev.1-O -ββββ -59.44 -45.53 -34.66 -51.77 10.482-O -ββββ -36.00 -29.56 -25.65 -33.06 4.472-O -αααα -52.33 -47.26 -43.06 -51.09 4.183-O -ββββ -40.07 -33.61 -34.16 -35.86 2.923-O -αααα -38.33 -33.71 -33.61 -35.08 2.204-O -ββββ -32.77 -25.86 -23.92 -29.51 3.934-O -αααα -25.10 -19.11 -19.51 -20.69 2.756-O -ββββ -20.09 -25.20 -22.55 -25.78 2.626-O -αααα -49.91 -51.77 -47.34 -54.09 2.86
Energy (kJ/mol) relatve to the 1-O -αααα -ester

Appendix 2: Data for Migration Kinetics
188
Appendix 2: Data for Migration Kinetics.

Appendix 2: Data for Migration Kinetics
189

Appendix 3: Data for Energy Profiles
190
Appendix 3: Data for Energy Profiles.
Table A3.1: Data for p-coumaric acid energy profile in a vacuum.
Dihedral Angle Hartrees (a.u.) kJ/mol Relative to S0 180oHartrees (a.u.) kJ/mol Relative to S0 180o
180 -573.429091 -1505537.9 0.0 -573.341720 -1505308.5 229.4
170 -573.428809 -1505537.1 0.7 -573.342894 -1505311.6 226.3160 -573.427103 -1505532.6 5.2 -573.344340 -1505315.3 222.5150 -573.424026 -1505524.6 13.3 -573.345986 -1505319.7 218.2140 -573.419539 -1505512.8 25.1 -573.347703 -1505324.2 213.7130 -573.413554 -1505497.1 40.8 -573.349252 -1505328.2 209.6120 -573.406317 -1505478.1 59.8 -573.350502 -1505331.5 206.3110 -573.397875 -1505455.9 82.0 -573.351420 -1505333.9 203.9100 -573.388198 -1505430.5 107.4 -573.351946 -1505335.3 202.590 -573.372181 -1505388.4 149.4 -573.352043 -1505335.6 202.380 -573.383155 -1505417.3 120.6 -573.352070 -1505335.6 202.270 -573.393105 -1505443.4 94.5 -573.351687 -1505334.6 203.260 -573.401892 -1505466.4 71.4 -573.350894 -1505332.6 205.350 -573.409397 -1505486.2 51.7 -573.349653 -1505329.3 208.640 -573.415538 -1505502.3 35.6 -573.347991 -1505324.9 212.930 -573.420179 -1505514.5 23.4 -573.345932 -1505319.5 218.320 -573.423281 -1505522.6 15.3 -573.343416 -1505312.9 224.910 -573.424826 -1505526.7 11.2 -573.340433 -1505305.1 232.80 -573.424840 -1505526.7 11.2 -573.337018 -1505296.1 241.7
S0 T1
Table A3.2: Data for ethyl coumarate energy profile in a vacuum.
Dihedral Angle kJ/mol Relative to S0 180okJ/mol Relative to S0 180o
kJ/mol Relative to S0 180okJ/mol Relative to S0 180o
180 -1712001.0 0.0 -1711999.3 0.0 -1711770.6 230.4170 -1711998.9 2.1 -1711997.5 1.8 -1711770.5 230.4160 -1711993.2 7.8 -1711992.0 7.3 -1711771.0 229.9150 -1711983.7 17.3 -1711982.9 16.3 -1711772.1 228.9140 -1711970.2 30.8 -1711970.2 29.1 -1711774.1 226.9130 -1711952.9 48.0 -1711953.8 45.5 -1711776.5 224.5120 -1711932.4 68.6 -1711933.9 65.4 -1711778.6 222.4110 -1711908.4 92.6 -1711910.7 88.6 -1711780.5 220.5100 -1711881.6 119.4 -1711884.3 115.0 -1711781.6 219.490 -1711852.3 148.6 -1711855.1 144.2 -1711835.2 165.8 -1711782.1 218.980 -1711820.9 180.1 -1711822.6 176.7 -1711862.8 138.2 -1711781.5 219.570 -1711787.8 213.2 -1711787.6 211.6 -1711887.6 113.3 -1711780.1 220.960 -1711750.4 248.9 -1711908.2 92.8 -1711777.9 223.050 -1711924.3 76.7 -1711774.6 226.440 -1711958.0 41.3 -1711936.3 64.7 -1711770.6 230.430 -1711959.8 41.2 -1711965.2 34.1 -1711944.8 56.2 -1711765.6 235.320 -1711968.1 32.9 -1711969.7 29.6 -1711950.5 50.5 -1711759.4 241.610 -1711972.6 28.4 -1711971.7 27.6 -1711952.4 48.6 -1711752.4 248.60 -1711973.1 27.9 -1711971.4 27.9 -1711953.9 47.1 -1711744.5 256.5
S0 Dynamic Forwards T1 S0 Manual S0 Dynamic Backwards

Appendix 3: Data for Energy Profiles
191
Table A3.3: Data for p-coumaroyl glucose energy profile in a vacuum.
Dihedral Angle kJ/mol Relative to S0 180o kJ/mol Relative to S0 180o kJ/mol Relative to S0 180o
180 -3109035.5 0.0 -3108809.4 226.2
170 -3109033.9 1.7 -3108809.4 226.1160 -3109028.3 7.2 -3108809.5 226.1150 -3109019.1 16.4 -3108809.7 225.8140 -3109006.3 29.3 -3108810.1 225.4130 -3108989.9 45.6 -3108810.3 225.2120 -3108969.9 65.6 -3108813.0 222.6110 -3108946.5 89.0 -3108814.2 221.3100 -3108919.9 115.7 -3108815.1 220.490 -3108890.4 145.2 -3108909.1 126.5 -3108815.1 220.480 -3108934.5 101.0 -3108814.3 221.270 -3108955.9 79.7 -3108812.9 222.660 -3108972.9 62.7 -3108810.9 224.650 -3108985.7 49.8 -3108807.8 227.840 -3108995.9 39.7 -3108803.3 232.330 -3109003.1 32.4 -3108797.5 238.020 -3109004.3 31.2 -3108790.7 244.810 -3109006.6 28.9 -3108783.4 252.10 -3109006.6 28.9 -3108790.3 245.3
S0 Dynamic Forwards T1 S0 Dynamic Backwards
Table A3.4: Data for T1 energy profiles in water.
Dihedral Angle kJ/mol Relative to S0 180okJ/mol Relative to S0 180o
S0 180 -1505539.2 -3109133.9
180 -1505309.7 229.4 -3108912.2 221.7170 -1505307.3 231.8 -3108911.8 222.1160 -1505316.6 222.5 -3108910.5 223.4150 -1505320.9 218.2 -3108909.2 224.7140 -1505325.4 213.8 -3108908.4 225.6130 -1505329.5 209.6 -3108907.5 226.4120 -1505332.9 206.3 -3108908.8 225.2110 -1505335.3 203.9 -3108909.4 224.5100 -1505336.6 202.5 -3108910.2 223.790 -1505336.8 202.3 -3108909.9 224.080 -1505336.3 202.9 -3108909.0 224.970 -1505334.5 204.660 -1505331.5 207.7 -3108905.1 228.850 -1505327.1 212.1 -3108902.3 231.740 -1505321.5 217.6 -3108897.7 236.230 -1505315.0 224.2 -3108892.4 241.520 -1505307.8 231.3 -3108886.8 247.110 -1505300.3 238.9 -3108882.1 251.80 -1505293.1 246.1 -3108883.2 250.7
T1 p -Coumaric acid T1 p -Coumaroyl glucose

Appendix 4: Data for Vertical Excitations and HOMO-LUMO Gaps
192
Appendix 4: Data for Vertical Excitations and HOMO-LUMO
Gaps.

Appendix 4: Data for Vertical Excitations and HOMO-LUMO Gaps
193

Appendix 4: Data for Vertical Excitations and HOMO-LUMO Gaps
194

Appendix 4: Data for Vertical Excitations and HOMO-LUMO Gaps
195

Appendix 5: Data from Ethylphenol Analyses
196
Appendix 5: Data from Ethylphenol Analyses.
Table A5.1: Percentage conversion from trans-ethyl esters (11 and 12) to ethylphenols in
fermentations with AWRI 1499.
2 4 6 8 9
4-EP 0.1 ± 0.1 8.8 ± 0.4 28.8 ± 1.2 45.8 ± 1.5 51.4 ± 2.44-EG 0.0 ± 0.0 0.5 ± 0.0 1.9 ± 0.1 3.3 ± 0.1 4.0 ± 0.2
Fermentation Progress (Days)
Table A5.2: Percentage of ethyl esters (11 and 12) remaining in fermentations.
2 4 6 8 9
Ethyl coumarate 96.0 ± 5.4 85.7 ± 3.7 65.3 ± 6.9 44.3 ± 3.3 33.3 ± 1.3Ethyl ferulate 93.7 ± 5.9 95.0 ± 4.6 89.7 ± 10.8 90.7 ± 9.0 72.3 ± 3.3
Fermentation Progress (Days)
Table A5.3: Percentage conversion from trans-ethyl esters (11 and 12) to ethylphenols in
fermentations with different strains of D. bruxellensis.
AWRI 1499 AWRI 1608 AWRI 1613
4-EP 67.0 ± 0.1 55.6 ± 0.8 N.D
4-EG 7.7 ± 0.2 3.0 ± 0.1 N.D
Table A5.4: Percentage conversion from hydroxycinnamoyl glucose esters (9 and 10) to
ethylphenols in fermentations with AWRI 1499.
2 4 6 84-EP 6.4 ± 2.7 12.6 ± 1.0 15.8 ± 1.1 20.6 ± 1.74-EG 10.3 ± 3.0 14.6 ± 0.6 18.1 ± 1.4 24.2 ± 2.9
10 12 14 164-EP 33.3 ± 2.9 34.4 ± 1.8 34.3 ± 0.6 36.0 ± 0.74-EG 33.5 ± 2.4 38.6 ± 0.8 33.7 ± 1.7 36.1 ± 1.4
Fermentation Progress (Days)

Appendix 5: Data from Ethylphenol Analyses
197
Table A5.5: Percentage conversion from trans- and cis/trans-ferulic acid (4) to 4-
ethylguaiacol in D. bruxellensis fermentations.
2 3 4 5 6 7 9trans-ferments 3.0 ± 1.2 17.2 ± 1.9 46.8 ± 4.5 67.1 ± 4.0 78.2 ± 5.2 75.3 ± 2.5 69.8 ± 4.5
cis/trans-ferments 1.7 ± 0.5 8.2 ± 0.6 22.6 ± 1.6 30.8 ± 1.7 37.3 ± 2.4 38.4 ± 0.7 39.6 ± 0.3
Fermentation Progress (Days)
Table A5.6: Percentage conversion from trans- and cis/trans-p-coumaric acid (3) to 4-
ethylphenol in D. bruxellensis fermentations.
2 4 6 8 10 12trans-ferments 7.9 ± 0.6 44.8 ± 1.1 56.4 ± 1.6 56.7 ±2.6 66.8 ± 1.6 61.7 ± 3.6
cis/trans-ferments 5.2 ± 0.4 29.9 ± 1.8 37.3 ± 1.2 37.3 ± 2.7 42.4 ± 0.5 40.6 ± 2.4
Fermentation Progress (Days)
Table A5.7: Percentage conversion from cis-ethyl ferulate (cis-12) and cis-ethyl coumarate
(cis-11) to ethylphenols in D. bruxellensis fermentations.
2 4 6 8 10
4-EP 0.00 ± 0.00 0.07 ± 0.12 0.51 ± 0.04 0.74 ± 0.04 0.86 ± 0.024-EG 0.00 ± 0.00 0.00 ± 0.00 0.00 ± 0.00 0.13 ± 0.11 0.25 ± 0.03
Fermentation Progress (Days)

References
198
References
1. Hornsey, I., The Chemistry and Biology of Winemaking. RSC Publishing:
Cambridge, UK, 2007; p 457.
2. Gent, C., Mixed Dozen: The Story of Australian Winemaking Since 1788. Duffy &
Snellgrove: Sydney, 2003; p 344.
3. Beeston, J., A Concise History of Australian Wine. Allen & Unwin: New South
Wales, 1994; p 338.
4. Farkas, J., Technology and Biochemistry of Wine. Gordon and Breach Scientific
Publishers: Montreux, Switzerland, 1988; Vol. 1, p 387.
5. Wine Australia. Australian Wine Sector at a Glance, 2010.
http://www.wineaustralia.com (21/01/2012),
6. Wine Australia. Australian Wine Sales at a Glance - 2010.
http://www.wineaustralia.com (21/01/2012),
7. Wine Australia. Australian Wine Sector, State by State - 2010.
http://www.wineaustralia.com (21/01/2012),
8. Moreno-Arribas, M. V.; Polo, M. C., Winemaking biochemistry and microbiology:
Current knowlegde and future trends. Critical Reviews in Food Science and
Nutrition 2005, 45, (4), 265-286.
9. Pretorius, I. S., Tailoring wine yeast for the new millennium: novel approaches to
the ancient art of winemaking. Yeast 2000, 16, (8), 675-729.
10. Loureiro, V.; Malfeito-Ferreira, M., Spoilage yeasts in the wine industry. Int. J.
Food Microbiol. 2003, 86, (1-2), 23-50.
11. Fugelsang, K. C.; Osborn, M. M.; Muller, C. J., Brettanomyces and Dekkera
implications in wine-making. In Beer and Wine Production: Analysis,
Characterization, and Technological Advances, Gump, B. H.; Pruett, D. J., Eds.
American Chemical Society: 1993; Vol. 536, pp 110-129.
12. Heresztyn, T., Formation of substituted tetrahyropyridines by species of
Brettanomyces and Lactobacillus isolated from mousy wines. Am. J. Enol. Vitic.
1986, 37, (2), 127-132.
13. Boulton, R. B.; Singleton, V. L.; Bisson, L. F.; Kunkee, R. E., Principles and
Practices of Winemaking. Thompson Hall: New York, USA, 1995; p 604.
14. Fugelsang, K. C.; Edwards, C. G., Wine Microbiology. 2nd ed.; Springer: New
York, 2007.

References
199
15. Licker, J. L.; Acree, T. E.; Henick-Kling, T., What is "Brett" (Brettanomyces)
flavour?: A preliminary investigation. In Chemistry of Wine Flavour, Waterhouse,
A. L.; Ebeler, S. E., Eds. American Chemical Society: 1999; Vol. 714, pp 96-115.
16. Barnett, J. A., A history of research on yeasts 8: Taxonomy. Yeast 2004, 21, (14),
1141-1193.
17. Barnett, J.; Payne, R.; Yarrow, D., Yeasts: Characteristics and Identification. Third
ed.; Cambridge University Press: 2000; p 1139.
18. Smith, M. T.; Yamazaki, M.; Poot, G. A., Dekkera, Brettanomyces and Eeniella -
Electrophoretic comparison of enzymes and DNA-DNA homology. Yeast 1990, 6,
(4), 299-310.
19. Boekhout, T.; Kurtzman, C. P.; Odonnell, K.; Smith, M. T., Phylogeny of the yeast
genera Hanseniaspora (anamorph Kloeckera), Dekkera (anamorph Brettanomyces),
and Eeniella as inferred from partial 26S ribosomal DNA nucleotide-sequences. Int.
J. Syst. Bacteriol. 1994, 44, (4), 781-786.
20. Loureiro, V.; Malfeito-Ferreira, M., Dekkera/Bruxellensis spp. In Food Spoilage
Microorganisms, de W. Blackburn, C., Ed. Woodhead Publishing Ltd.: Cambridge,
UK, 2006; pp 354-400.
21. Curtin, C. D. Personal communication, 2012.
22. Curtin, C. D.; Bellon, J. R.; Henschke, P. A.; Godden, P. W.; de Barros Lopes, M.
A., Genetic diversity of Dekkera bruxellensis yeasts isolated from Australian
wineries. Federation of European Microbiological Societies Yeast Research 2007,
7, 471-481.
23. Conterno, L.; Joseph, C. M. L.; Arvik, T. J.; Henick-Kling, T.; Bisson, L. F.,
Genetic and physiological characterization of Brettanomyces bruxellensis strains
isolated from wines. Am. J. Enol. Vitic. 2006, 57, (2), 139-147.
24. Barbin, P.; Cheval, J. L.; Gilis, J. F.; Strehaiano, P.; Thillandier, P., Diversity in
spoilage yeast Dekkera/Brettanomyces bruxellensis isolated from French red wine.
Assessment during fermentation of synthetic wine medium. J. Inst. Brew. 2008,
114, (1), 69-75.
25. Egli, C. M.; Henick-Kling, T., Identification of Brettanomyces/Dekkera species
based on polymorphism in the rRNA internal transcribed spacer region. Am. J.
Enol. Vitic. 2001, 52, (3), 241-247.
26. Cocolin, L.; Rantsiou, K.; Iacumin, L.; Zironi, R.; Comi, G., Molecular detection
and identification of Brettanomyces/Dekkera bruxellensis and

References
200
Brettanomyces/Dekkera anomalus in spoiled wines. Appl. Environ. Microbiol.
2004, 70, (3), 1347-1355.
27. Stender, H.; Kurtzman, C.; Hyldig-Nielsen, J. J.; Sorensen, D.; Broomer, A.;
Oliveira, K.; Perry-O'Keefe, H.; Sage, A.; Young, B.; Coull, J., Identification of
Dekkera bruxellensis (Brettanomyces) from wine by fluorescence in situ
hybridization using peptide nucleic acid probes. Appl. Environ. Microbiol. 2001,
67, (2), 938-941.
28. Silva, L. R.; Andrade, P. B.; Valentao, P.; Seabra, R. M.; Trujillo, M. E.;
Velazquez, E., Analysis of non-coloured phenolics in red wine: Effect of Dekkera
bruxellensis yeast. Food Chem. 2005, 89, (2), 185-189.
29. Grbin, P. R.; Henschke, P. A., Mousy off-flavour production in grape juice and
wine by Dekkera and Brettanomyces yeasts. Australian Journal of Grape and Wine
Research 2000, 6, (3), 255-262.
30. Romano, A.; Perello, M. C.; de Revel, G.; Lonvaud-Funel, A., Growth and volatile
compound production by Brettanomyces/Dekkera bruxellensis in red wine. J. Appl.
Microbiol. 2008, 104, 1577-1585.
31. Vigentini, I.; Romano, A.; Compagno, C.; Merico, A.; Molinari, F.; Tirelli, A.;
Foschino, R.; Volonterio, G., Physiological and oenological traits of different
Dekkera/Brettanomyces bruxellensis strains under wine-model conditions. FEMS
Yeast Research 2008, 8, (7), 1087-1096.
32. Harris, V.; Ford, C. M.; Jiranek, V.; Grbin, P. R., Survey of enzyme activity
responsible for phenolic off-flavour production by Dekkera and Brettanomyces
yeast. Appl. Microbiol. Biotechnol. 2009, 81, (6), 1117-1127.
33. Agnolucci, M.; Vigentini, I.; Capurso, G.; Merico, A.; Tirelli, A.; Compagno, C.;
Foschino, R.; Nuti, M., Genetic diversity and physiological traits of Brettanomyces
bruxellensis strains isolated from Tuscan Sangiovese wines. Int. J. Food Microbiol.
2009, 130, (3), 238-244.
34. Oelofse, A.; Lonvaud-Funel, A.; du Toit, M., Molecular identification of
Brettanomyces bruxellensis strains isolated from red wines and volatile phenol
production. Food Microbiol. 2009, 26, (4), 377-385.
35. Conterno, L.; Lasik, G.; Tomasino, E.; Schneider, K.; Hesford, F.; Henick-Kling,
T., Influence of sugar and nitrogen sources on growth and phenolic off-flavor
production by Brettanomyces bruxellensis isolated from wine. Am. J. Enol. Vitic.
2007, 58, (3), 411A-411A.

References
201
36. Fugelsang, K. C.; Zoecklein, B. W., Population dynamics and effects of
Brettanomyces bruxellensis strains on Pinot noir (Vitis vinifera L.) wines. Am. J.
Enol. Vitic. 2003, 54, (4), 294-300.
37. Renouf, V.; Lonvaud-Funel, A., Development of an enrichment medium to detect
Dekkera/Brettanomyces bruxellensis, a spoilage yeast, on the surface of grape
berries. Microbiological Research 2007, 162, (2), 154-167.
38. Oelofse, A.; Pretorius, I. S.; du Toit, M., Significance of Brettanomyces and
Dekkera during winemaking: A synoptic review. South African Journal of Enology
and Viticulture 2008, 29, (2), 128-144.
39. Uscanga, M. G. A.; Delia, M. L.; Strehaiano, P., Nutritional requirements of
Brettanomyces bruxellensis: Growth and physiology in batch and chemostat
cultures. Canadian Journal of Microbiology 2000, 46, (11), 1046-1050.
40. Barata, A.; Caldeira, J.; Botelheiro, R.; Pagliara, D.; Malfeito-Ferreira, M.;
Loureiro, V., Survival patterns of Dekkera bruxellensis in wines and inhibitory
effect of sulphur dioxide. Int. J. Food Microbiol. 2008, 121, (2), 201-207.
41. Chatonnet, P.; Dubourdieu, D.; Boidron, J. N.; Pons, M., The origin of ethylphenols
in wines. J. Sci. Food Agric. 1992, 60, (2), 165-178.
42. Dias, L.; Pereira-da-Silva, S.; Tavares, M.; Malfeito-Ferreira, M.; Loureiro, V.,
Factors affecting the production of 4-ethylphenol by the yeast Dekkera bruxellensis
in enological conditions. Food Microbiol. 2003, 20, (4), 377-384.
43. Coulter, A.; Robinson, E.; Cowey, G.; Francis, I. L.; Lattey, K.; Capone, D.;
Gishen, M.; Godden, P. In Dekkera/Brettanomyces yeast - an overview of recent
AWRI investigations and some recommendations for its control, ASVO
Proceedings. Grapegrowing at the edge, managing the wine business, impacts on
wine flavour, Barossa Convention Centre, Tanunda, SA, 10-11 July 2003, 2003;
Bell, S. M.; de Garis, K. A.; Dundon, C. G.; Hamilton, R. P.; Partridge, S. J.; Wall,
G. S., Eds. Barossa Convention Centre, Tanunda, SA, 2003; pp 41-50.
44. Ciani, M.; Ferraro, L., Role of oxygen on acetic acid production by
Brettanomyces/Dekkera in winemaking. J. Sci. Food Agric. 1997, 75, (4), 489-495.
45. Aguilar Uscanga, M. G.; Delia, M. L.; Strehaiano, P., Brettanomyces bruxellensis:
Effect of oxygen on growth and acetic acid production. Applied Microbiology &
Biotechnology 2003, 61, (2), 157-162.

References
202
46. Ciani, M.; Maccarelli, F.; Fatichenti, F., Growth and fermentation behaviour of
Brettanomyces/Dekkera yeasts under different conditions of aerobiosis. World
Journal of Microbiology & Biotechnology 2003, 19, (4), 419-422.
47. du Toit, M.; Pretorius, I. S.; Lonvaud-Funel, A., The effects of sulphur dioxide and
oxygen on the viability and culturability of a strain of Acetobacter pasteurianus and
a strain of Brettanomyces bruxellensis isolated from wine. J. Appl. Microbiol. 2005,
98, 862-871.
48. Millet, V.; Lonvaud-Funel, A., The viable but non-culturable state of wine micro-
organisms during storage. Lett. Appl. Microbiol. 2000, 30, (2), 136-141.
49. Umiker, N. L., Impact of SO2 on culturability and viability of Brettanomyces in
wine. Am. J. Enol. Vitic. 2007, 58, (3), 417A-417A.
50. Agnolucci, M.; Rea, F.; Sbrana, C.; Cristani, C.; Fracassetti, D.; Tirelli, A.; Nuti,
M., Sulphur dioxide affects culturability and volatile phenol production by
Brettanomyces/Dekkera bruxellensis. Int. J. Food Microbiol. 2010, 143, (1-2), 76-
80.
51. Renouf, V.; Perello, M. C.; de Revel, G.; Lonvaud-Funell, A., Survival of wine
microorganisms in the bottle during storage. Am. J. Enol. Vitic. 2007, 58, (3), 379-
386.
52. Renouf, V.; Strehaiano, P.; Lonvaud-Funel, A., Effectiveness of
dimethlydicarbonate to prevent Brettanomyces bruxellensis growth in wine. Food
Control 2008, 19, (2), 208-216.
53. Delfini, C.; Gaia, P.; Schellino, R.; Strano, M.; Pagliara, A.; Ambro, S.,
Fermentability of grape must after inhibition with dimethyl dicarbonate (DMDC).
J. Agric. Food Chem. 2002, 50, (20), 5605-5611.
54. Benito, S.; Palomero, F.; Morata, A.; Calderon, F.; Suarez-Lepe, J. A., Factors
affecting the hydroxycinnamate decarboxylase/vinylphenol reductase activity of
Dekkera/Brettanomyces: Application for Dekkera/Brettanomyces control in red
wine making. J. Food Sci. 2009, 74, (1), M15-M22.
55. Barata, A.; Pagliara, D.; Piccininno, T.; Tarantino, F.; Ciardulli, W.; Malfeito-
Ferreira, M.; Loureiro, V., The effect of sugar concentration and temperature on
growth and volatile phenol production by Dekkera bruxellensis in wine. FEMS
Yeast Research 2008, 8, (7), 1097-1102.

References
203
56. Couto, J. A.; Neves, F.; Campos, F.; Hogg, T., Thermal inactivation of the wine
spoilage yeasts Dekkera/Brettanomyces. Int. J. Food Microbiol. 2005, 104, (3),
337-344.
57. Lustrato, G.; Vigentini, I.; Leonardis, A. D.; Alfano, G.; Tirelli, A.; Foschino, R.;
Ranalli, G., Inactivation of wine spoilage yeasts Dekkera bruxellensis using low
electric current treatment (LEC). J. Appl. Microbiol. 2010, 109, (2), 594-604.
58. Yap, A.; Jiranek, V.; Grbin, P.; Barnes, M.; Bates, D., Studies on the application of
high-powered ultrasonics for barrel and plank cleaning and disinfection. Australian
Wine Industry Journal 2007, 22, (3), 96-104.
59. Couto, J. A.; Barbosa, A.; Hogg, T., A simple cultural method for the presumptive
detection of the yeasts Brettanomyces/Dekkera in wines. Lett. Appl. Microbiol.
2005, 41, (6), 505-510.
60. Freer, S. N., Acetic acid production by Dekkera/Brettanomyces yeasts. World
Journal of Microbiology & Biotechnology 2002, 18, (3), 271-275.
61. Chatonnet, P.; Dubourdieu, D.; Boidron, J. N., The influence of
Brettanomyces/Dekkera sp. yeasts and lactic acid bacteria on the ethylphenol
content of red wines. Am. J. Enol. Vitic. 1995, 46, (4), 463-468.
62. Chatonnet, P.; Viala, C.; Dubourdieu, D., Influence of polyphenolic components of
red wines on the microbial synthesis of volatile phenols. Am. J. Enol. Vitic. 1997,
48, (4), 443-448.
63. Pollnitz, A. P.; Pardon, K. H.; Sefton, M. A., Quantitative analysis of 4-ethylphenol
and 4-ethylguaiacol in red wine. J. Chromatogr. A 2000, 874, (1), 101-109.
64. Gerbaux, V.; Vincent, B.; Bertrand, A., Influence of maceration temperature and
enzymes on the content of volatile phenols in Pinot noir wines. Am. J. Enol. Vitic.
2002, 53, (2), 131-137.
65. Edlin, D. A. N.; Narbad, A.; Dickinson, J. R.; Lloyd, D., The biotransformation of
simple phenolic compounds by Brettanomyces anomalus. FEMS Microbiol. Lett.
1995, 125, (2-3), 311-315.
66. Heresztyn, T., Metabolism of volatile phenolic compounds from hydroxycinnamic
acids by Brettanomyces yeast. Archives of Microbiology 1986, 146, 96-98.
67. Silva, P.; Cardoso, H.; Geros, H., Studies on the wine spoilage capacity of
Brettanomyces/Dekkera spp. Am. J. Enol. Vitic. 2004, 55, (1), 65-72.

References
204
68. Godoy, L.; Martinez, C.; Carrasco, N.; Ganga, M. A., Purification and
characterization of a p-coumarate decarboxylase and a vinylphenol reductase from
Brettanomyces bruxellensis. Int. J. Food Microbiol. 2008, 127, (1-2), 6-11.
69. Tchobanov, I.; Gal, L.; Guilloux-Benatier, M.; Remize, F.; Nardi, T.; Guzzo, J.;
Serpaggi, V.; Alexandre, H., Partial vinylphenol reductase purification and
characterization from Brettanomyces bruxellensis. FEMS Microbiol. Lett. 2008,
284, (2), 213-217.
70. Edlin, D. A. N.; Narbad, A.; Gasson, M. J.; Dickinson, J. R.; Lloyd, D., Purification
and characterization of hydroxycinnamate decarboxylase from Brettanomyces
anomalus. Enzyme and Microbial Technology 1998, 22, (4), 232-239.
71. Larcher, R.; Nicolini, G.; Bertoldi, D.; Nardin, T., Determination of 4-ethylcatechol
in wine by high-performance liquid chromatography-coulometric electrochemical
array detection. Anal. Chim. Acta 2008, 609, (2), 235-240.
72. Gomez-Alonso, S.; Garcia-Romero, E.; Hermosin-Gutierrez, I., HPLC analysis of
diverse grape and wine phenolics using direct injection and multidetection by DAD
and fluorescence. J. Food Compos. Anal. 2007, 20, (7), 618-626.
73. Betes-Saura, C.; Andres-Lacueva, C.; Lamuela-Raventos, R. M., Phenolics in white
free run juices and wines from Penedes by high-performance liquid
chromatography: Changes during vinification. J. Agric. Food Chem. 1996, 44, (10),
3040-3046.
74. Hesford, F.; Schneider, K.; Porret, N.; Gafner, J., Identification and analysis of 4-
ethylcatechol in wines tainted by Brettanomyces off-flavour. Abstract. Am. J. Enol.
Vitic. 2004, 55, (3), 304A.
75. Buron, N.; Coton, M.; Legendre, P.; Ledauphin, J.; Kientz-Bouchart, V.; Guichard,
H.; Barillier, D.; Coton, E., Implications of Lactobacillus collinoides and
Brettanomyces/Dekkera anomala in phenolic off-flavour defects of ciders. Int. J.
Food Microbiol. 2012, 153, (1-2), 159-165.
76. Chatonnet, P.; Dubourdieu, D.; Boidron, J. N.; Lavigne, V., Synthesis of volatile
phenols by Saccharomyces cerevisiae in wines. J. Sci. Food Agric. 1993, 62, (2),
191-202.
77. Vanbeneden, N.; Gils, F.; Delvaux, F.; Delvaux, F. R., Formation of 4-vinyl and 4-
ethyl derivatives from hydroxycinnamic acids: Occurrence of volatile phenolic
flavour compounds in beer and distribution of Pad1-activity among brewing yeasts.
Food Chem. 2008, 107, (1), 221-230.

References
205
78. Hernandez-Orte, P.; Cersosimo, M.; Loscos, N.; Cacho, J.; Garcia-Moruno, E.;
Ferreira, V., The development of varietal aroma from non-floral grapes by yeasts of
different genera. Food Chem. 2008, 107, (3), 1064-1077.
79. Couto, J. A.; Campos, F. M.; Figueiredo, A. R.; Hogg, T. A., Ability of lactic acid
bacteria to produce volatile phenols. Am. J. Enol. Vitic. 2006, 57, (2), 166-171.
80. Cavin, J. F.; Andioc, V.; Etievant, P. X.; Divies, C., Ability of wine lactic-acid
bacteria to metabolize phenol carboxylic-acids. Am. J. Enol. Vitic. 1993, 44, (1),
76-80.
81. Hashidoko, Y.; Tahara, S., Stereochemically specific proton transfer in
decarboxylation of 4-hydroxycinnamic acids by 4-hydroxycinnamate decarboxylase
from Klebsiella oxytoca. Archives of Biochemistry and Biophysics 1998, 359, (2),
225-230.
82. Hashidoko, Y.; Urashima, M.; Yoshida, T.; Mizutani, J., Decarboxylative
conversion of hydroxycinnamic acids by Klebsiella-oxytoca and Erwinia-
uredovora, epiphytic bacteria of Polymnia-sonchifolia leaf, possibly associated
with formation of microflora on the damaged leaves. Bioscience Biotechnology and
Biochemistry 1993, 57, (2), 215-219.
83. Parry, R. J., Stereochemistry of decarboxylation of trans-4-hydroxycinnamic acid
by Aerobacter. Proc. Natl. Acad. Sci. U. S. A. 1975, 75, (5), 1681-1683.
84. Harada, T.; Mino, Y., Some properties of p-coumarate decarboxylase from
Cladosporium phlei. Canadian Journal of Microbiology 1976, 22, (9), 1258-1262.
85. Bayne, H. G.; Finkle, B. J.; Lundin, R. E., Decarboxylative conversion of
hydroxycinnamic acids to hydroxystyrenes by Polyporus circinata. Journal of
General Microbiology 1976, 95, (1), 188-190.
86. Cavin, J. F.; Dartois, V.; Divies, C., Gene cloning, transcriptional analysis,
purification, and characterization of phenolic acid decarboxylase from Bacillus
subtilis. Appl. Environ. Microbiol. 1998, 64, (4), 1466-1471.
87. Dias, L.; Dias, S.; Sancho, T.; Stender, H.; Querol, A.; Malfeito-Ferreira, M.;
Loureiro, V., Identification of yeasts isolated from wine-related environments and
capable of producing 4-ethylphenol. Food Microbiol. 2003, 20, (5), 567-574.
88. Barata, A.; Nobre, A.; Correia, P.; Malfeito-Ferreria, M.; Loureiro, V., Growth and
4-ethylphenol production by the yeast Pichia guilliermondii in grape juices. Am. J.
Enol. Vitic. 2006, 57, (2), 133-138.

References
206
89. Romano, A.; Perello, M. C.; Lonvaud-Funel, A.; Sicard, G.; de Revel, G., Sensory
and analytical re-evaluation of "Brett character". Food Chem. 2009, 114, (1), 15-19.
90. Curtin, C. D.; Bellon, J. R.; Coulter, A. D.; Cowey, G. D.; Robinson, E. M. C.; de
Barros Lopes, M. A.; Godden, P. W.; Henschke, P. A.; Pretorius, I. S., The six
tribes of 'Brett' in Australia - Distribution of genetically divergent Dekkera
bruxellensis strains across Australian winemaking regions. Australian Wine
Industry Journal 2005, 20, (6), 28-36.
91. Fulcrand, H.; dosSantos, P. J. C.; SarniManchado, P.; Cheynier, V.; FavreBonvin,
J., Structure of new anthocyanin-derived wine pigments. J. Chem. Soc.-Perkin
Trans. 1 1996, (7), 735-739.
92. Ugarte, P.; Agosin, E.; Bordeu, E.; Villalobos, J. I., Reduction of 4-ethylphenol and
4-ethylguaiacol concentration in red wines using reverse osmosis and adsorption.
Am. J. Enol. Vitic. 2005, 56, (1), 30-36.
93. Palomero, F.; Ntanos, K.; Morata, A.; Benito, S.; Suarez-Lepe, J. A., Reduction of
wine 4-ethylphenol concentration using lyophilised yeast as a bioadsorbent:
influence on anthocyanin content and chromatic variables. Eur. Food Res. Technol.
2011, 232, (6), 971-977.
94. Fernández de Simón, B.; Hernández, T.; Estrella, I.; Gómez-Cordovés, C.,
Variation in phenol content in grapes during ripening: low-molecular-weight
phenols. Zeitschrift für Lebensmitteluntersuchung und -Forschung A 1992, 194, (4),
351-354.
95. Fernandez de Simon, B.; Hernandez, T.; Estrella, I., Phenolic composition of white
grapes (Var. Airen). Changes during ripening. Food Chem. 1993, 47, (1), 47-52.
96. Lee, C. Y.; Jaworski, A., Major phenolic-compounds in ripening white grapes. Am.
J. Enol. Vitic. 1989, 40, (1), 43-46.
97. Mayen, M.; Merida, J.; Medina, M., Flavonoid and nonflavonoid compounds
during fermentation and postfermentation standing of musts from Cabernet-
Sauvignon and Tempranillo grapes. Am. J. Enol. Vitic. 1995, 46, (2), 255-261.
98. Boido, E.; García-Marino, M.; Dellacassa, E.; Carrau, F.; Rivas-Gonzalo, J. C.;
Escribano-Bailón, M. T., Characterisation and evolution of grape polyphenol
profiles of Vitis vinifera L. cv. Tannat during ripening and vinification. Australian
Journal of Grape and Wine Research 2011, 17, (3), 383-393.

References
207
99. Somers, T. C.; Verette, E.; Pocock, K. F., Hydroxycinnamate esters of Vitis vinifera
- Changes during white vinification, and effects of exogenous enzymatic-
hydrolysis. J. Sci. Food Agric. 1987, 40, (1), 67-78.
100. Monagas, M.; Bartolomé, B.; Gómez-Cordovés, C., Evolution of polyphenols in
red wines from Vitis vinifera L. during aging in the bottle. Eur. Food Res. Technol.
2005, 220, (3), 331-340.
101. Hernandez, T.; Estrella, I.; Carlavilla, D.; Martin-Alvarez, P. J.; Moreno-Arribas,
M. V., Phenolic compounds in red wine subjected to industrial malolactic
fermentation and ageing on lees. Anal. Chim. Acta 2006, 563, (1-2), 116-125.
102. Gil-Munoz, R.; Gomez-Plaza, E.; Martinez, A.; Lopez-Roca, J. M., Evolution of
phenolic compounds during wine fermentation and post-fermentation: Influence of
grape temperature. J. Food Compos. Anal. 1999, 12, (4), 259-272.
103. Hernandez, T.; Estrella, I.; Perez-Gordo, M.; Alegria, E. G.; Tenorio, C.; Ruiz-
Larrrea, F.; Moreno-Arribas, M. V., Contribution of malolactic fermentation by
Oenococcus oeni and Lactobacillus plantarum to the changes in the
nonanthocyanin polyphenolic composition of red wine. J. Agric. Food Chem. 2007,
55, (13), 5260-5266.
104. Vrhovsek, U.; Wendelin, S., The effect of fermentation, storage and fining on the
content of hydroxycinnamoyltartaric acids and on browning of Pinot blanc wines.
Viticultural and Enological Sciences 1998, 53, (2), 87-94.
105. Perez-Magarino, S.; Jose, M. L. G., Effect of ripening stage of grapes on the low
molecular weight phenolic compounds of red wines. Eur. Food Res. Technol. 2005,
220, (5-6), 597-606.
106. Goldberg, D. M.; Tsang, E.; Karumanchiri, A.; Soleas, G. J., Quercetin and p-
coumaric acid concentrations in commercial wines. Am. J. Enol. Vitic. 1998, 49,
(2), 142-151.
107. Monagas, M.; Bartolome, B.; Gomez-Cordoves, C., Updated knowledge about the
presence of phenolic compounds in wine. Critical Reviews in Food Science and
Nutrition 2005, 45, (2), 85-118.
108. Baderschneider, B.; Winterhalter, P., Isolation and characterization of novel
benzoates, cinnamates, flavonoids, and lignans from Riesling wine and screening
for antioxidant activity. J. Agric. Food Chem. 2001, 49, (6), 2788-2798.
109. Stead, D., The effect of hydroxycinnamic acids and potassium sorbate on the
growth of 11 strains of spoilage yeasts. J. Appl. Bacteriol. 1995, 78, (1), 82-87.

References
208
110. Harris, V.; Ford, C. M.; Jiranek, V.; Grbin, P. R., Dekkera and Brettanomyces
growth and utilisation of hydroxycinnamic acids in synthetic media. Appl.
Microbiol. Biotechnol. 2008, 78, (6), 997-1006.
111. Chen, J. Y.; Wen, P. F.; Kong, W. F.; Pan, Q. H.; Wan, S. B.; Huang, W. D.,
Changes and subcellular localizations of the enzymes involved in phenylpropanoid
metabolism during grape berry development. Journal of Plant Physiology 2006,
163, (2), 115-127.
112. Dugelay, I.; Gunata, Z.; Sapis, J. C.; Baumes, R.; Bayonove, C., Role of cinnamoyl
esterase-activities from enzyme preparations on the formation of volatile phenols
during winemaking. J. Agric. Food Chem. 1993, 41, (11), 2092-2096.
113. Spaepen, M.; Verachtert, H., Esterase-activity in the genus Brettanomyces. J. Inst.
Brew. 1982, 88, (1), 11-17.
114. Daenen, L.; Saison, D.; Sterckx, F.; Delvaux, F. R.; Verachtert, H.; Derdelinckx,
G., Screening and evaluation of the glucoside hydrolase activity in Saccharomyces
and Brettanomyces brewing yeasts. J. Appl. Microbiol. 2008, 104, (2), 478-488.
115. Ribereau-Gayon, P., Identification of cinnamic acid esters of tartaric acid in the
limbs and berries of Vitis vinifera. Comptes Rendus de l'Academie des Sciences de
Paris 1965, 260, (1), 341-343.
116. Dumazert, G.; Margulis, H.; Montreau, F.-R., Evolution des composes phenoliques
au cours de la maturation d'un Vitis vinifera blanc: Le Mauzac. Annales de
Technologie Agricole 1973, 22, (2), 137-151.
117. Kramling, T. E.; Singleton, V. L., An estimate of the non-flavonoid phenols in
wines. Am. J. Enol. Vitic. 1969, 20, (2), 86-92.
118. Singleton, V. L., The phenolic cinnamates of white grapes and wine. J. Sci. Food
Agric. 1978, 29, 403-410.
119. Okamura, S.; Watanabe, M., Determination of phenolic cinnamates in white wine
and their effect on wine quality. Agricultural and Biological Chemistry 1981, 45,
(9), 2063-2070.
120. Ong, B. Y.; Nagel, C. W., High-pressure liquid chromatographic analysis of
hydroxycinnamic acid-tartaric acid esters and their glucose esters in Vitis vinifera.
Journal of Chromatography 1978, 157, 345-355.
121. Romeyer, F. M.; Macheix, J. J.; Goiffon, J. P.; Reminiac, C. C.; Sapis, J. C., The
browning capacity of grapes. 3. Changes and importance of hydroxycinnamic acid-

References
209
tartaric acid esters during development and maturation of the fruit J. Agric. Food
Chem. 1983, 31, (2), 346-349.
122. Ong, B. Y.; Nagel, C. W., Hydroxycinnamic acid-tartaric acid ester content in
mature grapes and during the maturation of white riesling grapes. Am. J. Enol.
Vitic. 1978, 29, (4), 277-281.
123. Vrhovsek, U., Extraction of hydroxycinnamoyltartaric acids from berries of
different grape varieties. J. Agric. Food Chem. 1998, 46, (10), 4203-4208.
124. Lee, C. Y.; Jaworski, A., Phenolic-compounds in white grapes grown in New York.
Am. J. Enol. Vitic. 1987, 38, (4), 277-281.
125. Jaworski, A. W.; Lee, C. Y., Fractionation and HPLC determination of grape
phenolics. J. Agric. Food Chem. 1987, 35, (2), 257-259.
126. Montealegre, R. R.; Peces, R. R.; Vozmediano, J. L. C.; Gascuena, J. M.; Romero,
E. G., Phenolic compounds in skins and seeds of ten grape Vitis vinifera varieties
grown in a warm climate. J. Food Compos. Anal. 2006, 19, (6-7), 687-693.
127. Singleton, V. L.; Zaya, J.; Trousdale, K., Caftaric and coutaric acids in fruit of
Vitis. Phytochemistry 1986, 25, (9), 2127-2133.
128. Nagel, C. W.; Baranowski, J. D.; Wulf, L. W.; Powers, J. R., The hydroxycinnamic
acid tartaric acid ester content of musts and grape varieties grown in the pacific
northwest. Am. J. Enol. Vitic. 1979, 30, (3), 198-201.
129. Nagel, C. W.; Wulf, L. W., Changes in the anthocyanins, flavanoids and
hydroxycinnamic acid esters during fermentation and aging of Merlot and Cabernet
Savignon. Am. J. Enol. Vitic. 1979, 30, (2), 111-116.
130. Bautista-Ortin, A. B.; Fernandez-Fernandez, J. I.; Lopez-Roca, J. M.; Gomez-Plaza,
E., The effects of enological practices in anthocyanins, phenolic compounds and
wine colour and their dependence on grape characteristics. J. Food Compos. Anal.
2007, 20, (7), 546-552.
131. Monagas, M.; Suarez, R.; Gomez-Cordoves, C.; Bartolome, B., Simultaneous
determination of nonanthocyanin phenolic compounds in red wines by HPLC-
DAD/ESI-MS. Am. J. Enol. Vitic. 2005, 56, (2), 139-147.
132. Monagas, M.; Gomez-Cordoves, C.; Bartolome, B., Evaluation of different
Saccharomyces cerevisiae strains for red winemaking. Influence on the
anthocyanin, pyranoanthocyanin and non-anthocyanin phenolic content and colour
characteristics of wines. Food Chem. 2007, 104, (2), 814-823.

References
210
133. Reschke, A.; Herrmann, K., Occurrence of 1-O-hydroxycinnamyl-β-D-glucoses in
fruits. 15. Phenolics of fruits. Zeitschrift für Lebensmitteluntersuchung und -
Forschung A 1981, 173, (6), 458-463.
134. Winterhalter, P., Application of countercurrent chromatography for wine research
and wine analysis. Am. J. Enol. Vitic. 2009, 60, (2), 123-129.
135. Mathew, S.; Abraham, T. E., Ferulic acid: An antioxidant found naturally in plant
cell walls and feruloyl esterases involved in its release and their applications.
Critical Reviews in Biotechnology 2004, 24, (2-3), 59-83.
136. Donaghy, J. A.; Kelly, P. F.; McKay, A., Conversion of ferulic acid to 4-vinyl
guaiacol by yeasts isolated from unpasteurised apple juice. J. Sci. Food Agric.
1999, 79, (3), 453-456.
137. Somers, T. C.; Verette, E.; Pocock, K. F.; Strauss, C. R., Spectral characteristics of
hydroxycinnamate esters of Vitis vinifera. Bulletin de Liaison - Groupe
Polyphenols 1986, 13, 502-505.
138. Hufnagel, J. C.; Hofmann, T., Orosensory-directed identification of astringent
mouthfeel and bitter-tasting compounds in red wine. J. Agric. Food Chem. 2008,
56, (4), 1376-1386.
139. Guntert, M.; Rapp, A.; Takeoka, G. R.; Jennings, W., HRGC and HRGC-MS
applied to wine constituents of lower volatility. Z. Lebensm.-Unters.-Forsch. 1986,
182, (3), 200-204.
140. Nickenig, R.; Pfeilsticker, K., Investigating oxidative browning of white wine .1.
HPLC separation of preparatively obtained wine phenols. Dtsch. Lebensm.-
Rundsch. 1980, 76, (4), 115-119.
141. Sleep, N. The developement of stable isotope dilution assays (SIDAs) for the
quantification of important aroma precursors in wine. Honours Thesis, Flinders
University of South Australia, 2003.
142. Galland, S.; Mora, N.; Abert-Vian, M.; Rakotomanomana, N.; Dangles, O.,
Chemical synthesis of hydroxycinnamic acid glucosides and evaluation of their
ability to stabilize natural Colors via anthocyanin copigmentation. J. Agric. Food
Chem. 2007, 55, (18), 7573-7579.
143. Zhao, H.; Burke, T. R., Facile syntheses of (2R,3R)-(-)- and (2S,3S)-(+)-chicoric
acids. Synth. Commun. 1998, 28, (4), 737-740.

References
211
144. Ziegler, T.; Pantkowski, G., Preparation of 1-O-acyl-D-glycopyranoses via
chloroacetylated glycopyranosyl donors. J. Carbohydr. Chem. 1993, 12, (3), 357-
370.
145. Zhang, S. Q.; Li, Z. J.; Wang, A. B.; Cai, M. S.; Feng, R., Total synthesis of the
phenylpropanoid glycoside, grayanoside A. Carbohydr. Res. 1997, 299, (4), 281-
285.
146. Synoradzki, L.; Ruskowski, P.; Bernas, U., Tartaric acid and its O-acyl derivatives.
Part 1. Synthesis of tartaric acid and O-acyl tartaric acids and anhydrides. Org.
Prep. Proced. Int. 2005, 37, (1), 37-63.
147. Bernas, U.; Hajmowicz, H.; Madura, I. D.; Majcher, M.; Synoradzki, L.; Zawada,
K., Tartaric acid and its acyl derivatives. Part 5. Direct synthesis of
monoacyltartaric acids and novel mono(benzoyl)tartaric anhydride: unusual
findings in tartaric acid acylation. ARKIVOC 2010, 11, 1-12.
148. Hu, Y.; Yamada, K. A.; Chalmers, D. K.; Annavajjula, D. P.; Covey, D. F.,
Enantioselective synthesis of cyclothiazide analogues: Novel probes of the
stereospecific actions of benzothiadiazine at AMPA-type glutamate receptors. J.
Am. Chem. Soc. 1996, 118, (19), 4550-4559.
149. Ishihara, K.; Gao, Q. Z.; Yamamoto, H., Enantioselective diels-alder reaction of α-
bromo α,β-enals with dienes under catalysis by CAB. J. Org. Chem. 1993, 58, (24),
6917-6919.
150. Sato, M.; Sunami, S.; Sugita, Y.; Kaneko, C., Use of 1,3-dioxin-4-ones and related-
compounds in synthesis .44. Asymmetric aldol reaction of 4-trimethylsiloxy-6-
methylene-1,3-dioxines - use of tartaric acid-derived (acyloxy)borane complex as
the catalyst. Chem. Pharm. Bull. 1994, 42, (4), 839-845.
151. Buschhaus, B.; Bauer, W.; Hirsch, A., Synthesis and chiroptical properties of a new
type of chiral depsipeptide dendrons. Tetrahedron 2003, 59, (22), 3899-3915.
152. Furuta, K.; Gao, Q. Z.; Yamamoto, H., Chiral (acyloxy)borane complex-catalyzed
asymmetric diels-alder reaction - (1R)-1,3,4-Trimethyl-3-cyclohexene-1-
carboxaldehyde - (3-Cyclohexene-1-carboxaldehyde, 1,3,4-trimethyl-, (-)-). In
Organic Syntheses, Vol 72, John Wiley & Sons Inc: New York, 1995; Vol. 72, pp
86-94.
153. Scarpati, M. L.; Oriente, G., Chicoric acid (dicaffeyltartic acid): Its isolation from
chicory (Chicorium intybus) and synthesis. Tetrahedron 1958, 4, (1-2), 43-48.

References
212
154. Lamidey, A. M.; Fernon, L.; Pouysegu, L.; Delattre, C.; Quideau, S.; Pardon, P., A
convenient synthesis of the Echinacea-derived immunostimulator and HIV-1
integrase inhibitor (-)-(2R,3R)-chicoric acid. Helv. Chim. Acta 2002, 85, (8), 2328-
2334.
155. Clough, J. M.; Jones, R. V. H.; McCann, H.; Morris, D. J.; Wills, M., Synthesis and
hydrolysis studies of a peptide containing the reactive triad of serine proteases with
an associated linker to a dye on a solid phase support. Org. Biomol. Chem. 2003, 1,
(9), 1486-1497.
156. Meier, C.; Ruppel, M. F. H.; Vukadinovic, D.; Balzarini, J., Second generation of
cycloSal-pronucleotides with esterase-cleavable sites: The "lock-in"-concept.
Nucleosides Nucleotides Nucleic Acids 2004, 23, (1-2), 89-115.
157. Patel, C. K.; Owen, C. P.; Aidoo-Gyamfi, K.; Ahmed, S., Sturcture-activity
relationship determination study of a series of novel compounds as potential
inhibitors of the enzyme estrone sulfatase (ES). Letters in Drug Design and
Discovery 2004, 1, (1), 35-44.
158. Percec, V.; Peterca, M.; Sienkowska, M. J.; Ilies, M. A.; Aqad, E.; Smidrkal, J.;
Heiney, P. A., Synthesis and retrostructural analysis of libraries of AB(3) and
constitutional isomeric AB(2) phenylpropyl ether-based supramolecular
dendrimers. J. Am. Chem. Soc. 2006, 128, (10), 3324-3334.
159. Uray, G.; Lindner, W., tert-Butyl esters and ethers of (R,R)-tartaric acid.
Tetrahedron 1988, 44, (14), 4357-4362.
160. Wright, S. W.; Hageman, D. L.; Wright, A. S.; McClure, L. D., Convenient
preparations of t-butyl esters and ethers from t-butanol. Tetrahedron Lett. 1997, 38,
(42), 7345-7348.
161. MacFarland, D. K.; Landis, C. R., Synthesis and characterization of novel ligands
designed for secondary interactions. Organometallics 1996, 15, (2), 483-485.
162. Barros, J. C.; da Silva, J. M.; Calazans, A. R.; Tanuri, A.; Brindeiro, R. D. M.;
Williamson, J. S.; Antunes, O. A. C., Synthesis of pseudopeptides derived from
(R,R)-tartaric acid as potential inhibitors of HIV-protease. Lett. Org. Chem. 2006, 3,
(12), 882-886.
163. Schmidt, M.; Amstutz, R.; Crass, G.; Seebach, D., Preparation of some chiral
aminodiols from tartaric acid - Chiral lithium aluminum-hydride derivatives for
asymmetric ketone reductions. Chem. Ber.-Recl. 1980, 113, (5), 1691-1707.

References
213
164. Whitfield, D. M.; Douglas, S. P., Glycosylation reactions - Present status future
directions. Glycoconjugate J. 1996, 13, (1), 5-17.
165. Zhu, X. M.; Schmidt, R. R., New principles for glycoside-bond formation. Angew.
Chem.-Int. Edit. 2009, 48, (11), 1900-1934.
166. Garegg, P. J., Synthesis and reactions of glycosides. In Advances in Carbohydrate
Chemistry and Biochemistry, Academic Press: 2004; Vol. Volume 59, pp 69-134.
167. Handbook of Chemical Glycosylation: Advances in Stereoselectivity and
Therapeutic Relevance. Wiley-VCH Verlag GmbH & Co.: Weinheim, Germany,
2008; p 524.
168. Modern Methods in Carbohydrate Synthesis. Harwood Academic: 1996.
169. Preparative Carbohydrate Chemistry. Marcel Dekker: New York, USA, 1997.
170. Overend, W., Glycosides. In The Carbohydrates: Chemistry and Biochemistry,
Second ed.; Pigman, W.; Horton, D., Eds. Academic Press: New York, USA, 1970;
Vol. 1A, pp 243-283.
171. Juaristi, E.; Cuevas, G., Recent studies on the anomeric effect. Tetrahedron 1992,
48, (24), 5019-5087.
172. Koenigs, W.; Knorr, E., Some derivatives of grape sugars and gallactose. Berichte
der Deutschen Chemischen Gesellschaft 1901, 34, 957-981.
173. Igarashi, K., The Koenigs-Knorr reaction. In Advances in Carbohydrate Chemistry
and Biochemistry, Tipson, R. S.; Derek, H., Eds. Academic Press: 1977; Vol.
Volume 34, pp 243-283.
174. Skouroumounis, G. K. β-Damascenone Precursors in Grapes and Wine. Ph.D.
Thesis, The University of Adelaide, 1991.
175. Wilkinson, K. L. Oak derived flavour compounds and their contribution to wine
and spirits. Ph.D. Thesis, Flinders University of South Australia, 2004.
176. Daniel, M. A.; Puglisi, C. J.; Capone, D. L.; Elsey, G. M.; Sefton, M. A.,
Rationalizing the formation of damascenone: Synthesis and hydrolysis of
damascenone precursors and their analogues, in both aglycone and glycoconjugate
forms. J. Agric. Food Chem. 2008, 56, (19), 9183-9189.
177. Wilkinson, K. L.; Elsey, G. M.; Prager, R. H.; Tanaka, T.; Sefton, M. A.,
Precursors to oak lactone. Part 2: Synthesis, separation and cleavage of several β-D-
glucopyranosides of 3-methyl-4-hydroxyoctanoic acid. Tetrahedron 2004, 60, (29),
6091-6100.

References
214
178. Hixson, J. L. Glucose esters as precursors to volatile phenols in wine. Honours
Thesis, Flinders University of South Australia, 2007.
179. Birkofer, L.; Kaiser, C.; Kosmol, H.; Romussi, G.; Donike, M.; Michaelis, G., D-
Glucose- und L-Rhamnoseester der p-Cumar- und Ferulasaure. Justus Liebig's
Annalen der Chemie 1966, 699, 223-231.
180. Bertolini, M.; Glaudemans, C. P. J., The chloroacetyl group in synthetic
carbohydrate chemistry. Carbohydr. Res. 1970, 15, (2), 263-270.
181. Schmidt, R. R., Recent developments in the synthesis of glycoconjugates. Pure
Appl. Chem. 1989, 61, (7), 1257-1270.
182. Lubineau, A.; Meyer, E.; Place, P., Synthesis of aryl D-gluco-pyranosides and D-
galacto-pyranosides and 1-O-acyl-D-gluco-pyranoses and 1-O-acyl-D-galacto-
pyranoses exploiting the mitsunobu reaction - Influence of the pKa of the acid on
the stereoselectivity of the reaction. Carbohydr. Res. 1992, 228, (1), 191-203.
183. Zhu, Y. M.; Ralph, J., Stereoselective synthesis of 1-O-β-feruloyl and 1-O-β-
sinapoyl glucopyranoses. Tetrahedron Lett. 2011, 52, (29), 3729-3731.
184. Machida, K.; Kikuchi, M., Norisoprenoids from Viburnum dilatatum.
Phytochemistry 1996, 41, (5), 1333-1336.
185. Nonnenmacher, A.; Mayer, R.; Plieninger, H., High pressure experiments. XII.
Application of high pressure in Wittig reactions with resonance stabilised ylides.
Liebigs Annalen Der Chemie 1983, 12, 2135-40.
186. Kahnt, G., trans-cis-Equilibrium of hydroxycinnamic acids during irradiation of
aqueous solutions at different pH. Phytochemistry 1967, 6, (5), 755-&.
187. Kahnt, G., Uber das gleichgewicht zwischen den stereoisomeren einiger zimt-
saurederivate in abhangigkeit von der molaren konzentration und ihre quantitative
spektrophotometrische messung bei pflanzenanalysen. Biologisches Zentralblatt
1966, 85, (5), 545-554.
188. Das, B.; Banerjee, J.; Ramu, R.; Pal, R.; Ravindranath, N.; Ramesh, C., Efficient,
selective deprotection of aromatic acetates catalyzed by Amberlyst-15 or iodine.
Tetrahedron Lett. 2003, 44, (29), 5465-5468.
189. Brecker, L.; Mahut, M.; Schwarz, A.; Nidetzky, B., In situ proton NMR study of
acetyl and formyl group migration in mono-O-acyl D-glucose. Magnetic Resonance
in Chemistry 2009, 47, (4), 328-332.
190. Whistler, R. L.; Anisuzza.Ak; Kim, J. C., Silica gel catalyzed migration of acetyl
groups from a sulfur to an oxygen atom. Carbohydr. Res. 1973, 31, (2), 237-243.
References
215
191. Iddon, L.; Richards, S. E.; Johnson, C. H.; Harding, J. R.; Wilson, I. D.; Nicholson,
J. K.; Lindon, J. C.; Stachulski, A. V., Synthesis of a series of phenylacetic acid 1-
β-O-acyl glucosides and comparison of their acyl migration and hydrolysis kinetics
with the corresponding acyl glucuronides. Org. Biomol. Chem. 2011, 9, (3), 926-
934.
192. Horrobin, T.; Tran, C. H.; Crout, D., Esterase-catalysed regioselective 6-
deacylation of hexopyranose per-acetates, acid-catalysed rearrangement to the 4-
deprotected products and conversions of these into hexose 4- and 6-sulfates. J.
Chem. Soc.-Perkin Trans. 1 1998, (6), 1069-1080.
193. Yoshimoto, K.; Tsuda, Y., On the possibility of direct O-1-β- to -6 acyl migration
in 1-O-acyl-b-D-glucose derivatives. Chem. Pharm. Bull. 1983, 31, (12), 4335-
4340.
194. Yoshimoto, K.; Tsuda, Y., General path of O-acyl migration in D-glucose
derivatives - Acyl migration of methyl mono-O-myristoyl-α and β-D-
glucopyranosides and mono-O-myristoyl-D-glucopyranoses. Chem. Pharm. Bull.
1983, 31, (12), 4324-4334.
195. Thevenet, S.; Wernicke, A.; Belniak, S.; Descotes, G.; Bouchu, A.; Queneau, Y.,
Esterification of unprotected sucrose with acid chlorides in aqueous medium:
kinetic reactivity versus acyl- or alkyloxycarbonyl-group migrations. Carbohydr.
Res. 1999, 318, (1-4), 52-66.
196. Molinier, V.; Wisnienwski, K.; Bouchu, A.; Fitremann, J.; Queneau, Y.,
Transesterification of sucrose in organic medium: Study of acyl group migrations.
J. Carbohydr. Chem. 2003, 22, (7-8), 657-669.
197. Rangelov, M. A.; Vayssilov, G. N.; Petkov, D. D., Quantum chemical model study
of the acyl migration in 2 '(3 ')-formylnucleosides. Int. J. Quantum Chem. 2006,
106, (6), 1346-1356.
198. Roslund, M. U.; Aitio, O.; Warna, J.; Maaheimo, H.; Murzin, D. Y.; Leino, R.,
Acyl group migration and cleavage in selectively protected β-D-galactopyranosides
as studied by NMR spectroscopy and kinetic calculations. J. Am. Chem. Soc. 2008,
130, (27), 8769-8772.
199. Perez-Magarino, S.; Ortega-Heras, M.; Cano-Mozo, E., Optimization of a solid-
phase extraction method using copolymer sorbents for isolation of phenolic
compounds in red wines and quantification by HPLC. J. Agric. Food Chem. 2008,
56, (24), 11560-11570.

References
216
200. Lunkenbein, S.; Bellido, M.; Aharoni, A.; Salentijn, E. M. J.; Kaldenhoff, R.;
Coiner, H. A.; Munoz-Blanco, J.; Schwab, W., Cinnamate metabolism in ripening
fruit. Characterization of a UDP-glucose: Cinnamate glucosyltransferase from
strawberry. Plant Physiol. 2006, 140, (3), 1047-1058.
201. Hartley, R. D.; Jones, E. C., Effect of ultraviolet-light on substituted cinnamic acids
and estimation of their cis and trans isomers by gas-chromatography. Journal of
Chromatography 1975, 107, (1), 213-218.
202. Fenton, T. W.; Mueller, M. M.; Clandinin, D. R., Isomerization of some cinnamic
acid-derivatives. Journal of Chromatography 1978, 152, (2), 517-522.
203. Kleinhofs, A.; Haskins, F. A.; Gorz, H. J., Ultraviolet-induced isomerization of β-
D-glucosyl O-hydroxycinnamic acid on filter paper. Journal of Chromatography
1966, 22, (1), 184-186.
204. Conkerton, E. J.; Chapital, D. C., High-performance liquid-chromatography
separation of the cis-trans isomers of cinnamic acid-derivatives - Ultraviolet and
electrochemical detection. Journal of Chromatography 1983, 281, (DEC), 326-329.
205. Katase, T., Stereoisomerization of para-coumaric and ferulic acids during their
incubation in peat soil extract solution by exposure to fluorescent light. Soil Sci.
Plant Nutr. 1981, 27, (4), 421-427.
206. Singleton, V. L.; Timberlake, C. F.; Whiting, G. C., Chromatography of natural
phenolic cinnamate derivatives on sephadex LH-20 and G-25. Journal of
Chromatography 1977, 140, (1), 120-124.
207. Challice, J. S.; Williams, A. H., Paper chromatographic separation and behaviour of
cis-and trans-isomers of cinnamic acid derivatives. Journal of Chromatography
1966, 21, (2), 357-&.
208. Li, Q. S.; Fang, W. H., Ab initio study on the structures and properties of trans-p-
coumaric acid in low-lying electronic states. Chem. Phys. 2005, 313, (1-3), 71-75.
209. Yoda, M.; Houjou, H.; Inoue, Y.; Sakurai, M., Spectral tuning of photoactive
yellow protein. Theoretical and experimental analysis of medium effects on the
absorption spectrum of the chromophore. J. Phys. Chem. B 2001, 105, (40), 9887-
9895.
210. Molina, V.; Merchan, M., On the absorbance changes in the photocycle of the
photoactive yellow protein: A quantum-chemical analysis. Proc. Natl. Acad. Sci. U.
S. A. 2001, 98, (8), 4299-4304.

References
217
211. Sergi, A.; Gruning, M.; Ferrario, M.; Buda, F., Density Functional study of the
photoactive yellow protein's chromophore. J. Phys. Chem. B 2001, 105, (19), 4386-
4391.
212. Ko, C.; Levine, B.; Toniolo, A.; Manohar, L.; Olsen, S.; Werner, H. J.; Martinez, T.
J., Ab initio excited-state dynamics of the photoactive yellow protein chromophore.
J. Am. Chem. Soc. 2003, 125, (42), 12710-12711.
213. Yamada, A.; Yamamoto, S.; Yamato, T.; Kakitani, T., Ab initio MO study on
potential energy surfaces for twisting around C7=C8 and C4-C7 bonds of coumaric
acid. Theochem-J. Mol. Struct. 2001, 536, (2-3), 195-201.
214. Kort, R.; Vonk, H.; Xu, X.; Hoff, W. D.; Crielaard, W.; Hellingwerf, K. J.,
Evidence for trans-cis isomerization of the p-coumaric acid chromophore as the
photochemical basis of the photocycle of photoactive yellow protein. FEBS Lett.
1996, 382, (1-2), 73-78.
215. Gomez-Plaza, E.; Gil-Munoz, R.; Lopez-Roca, J. M.; Martinez, A., Color and
phenolic compounds of a young red wine as discriminanting variables of its ageing
status. Food Res. Int. 1999, 32, (7), 503-507.
216. Romeyer, F. M.; Sapis, J. C.; Macheix, J. J., Hydroxycinnamic esters and browning
potential in mature berries of some grape varieties. J. Sci. Food Agric. 1985, 36,
728-732.
217. Gramatica, P.; Ranzi, B. M.; Manitto, P., Decarboxylation of cinnamic acids by
Saccharomyces cerevisiae. Bioorganic Chemistry 1981, 10, (1), 14-21.
218. Clausen, M.; Lamb, C. J.; Megnet, R.; Doerner, P. W., PAD1 encodes
phenylacrylic acid decarboxylase with confers resistance to cinnamic acid in
Saccharomyces cerevisiae. Gene 1994, 142, (1), 107-112.
219. Goodey, A. R.; Tubb, R. S., Genetic and biochemical analysis of the ability of
Saccharomyces cerevisiae to decarboxylate cinnamic acids. Journal of General
Microbiology 1982, 128, (11), 2615-2620.
220. Canovese, L.; Santo, C.; Visentin, F., Palladium(0)-catalyzed cis-trans alkene
isomerizations. Organometallics 2008, 27, (14), 3577-3581.
221. Lowry, T. H.; Richardson, K. S., Mechanism and Theory in Organic Chemistry. 3rd
ed.; Harper and Row: New York, 1987; p 1090.
222. Beltran, J. L.; Sanli, N.; Fonrodona, G.; Barron, D.; Ozkan, G.; Barbosa, J.,
Spectrophotometric, potentiometric and chromatographic pK(a) values of

References
218
polyphenolic acids in water and acetonitrile-water media. Anal. Chim. Acta 2003,
484, (2), 253-264.
223. Salameh, D.; Brandam, C.; Medawar, W.; Lteif, R.; Strehaiano, P., Highlight on the
problem generated by p-coumaric acid analysis in wine fermentations. Food Chem.
2008, 107, 1661-1667.
224. Barberousse, H.; Roiseux, O.; Robert, C.; Paquot, M.; Deroanne, C.; Blecker, C.,
Analytical methodologies for quantification of ferulic acid and its oligomers. J. Sci.
Food Agric. 2008, 88, 1494-1511.
225. Singleton, V. L.; Zaya, J.; Trousdale, E.; Salgues, M., Caftaric acid in grapes and
conversion to a reaction-product during processing. Vitis 1984, 23, (2), 113-120.
226. Gottlieb, H. E.; Kotlyar, V.; Nudelman, A., NMR chemical shifts of common
laboratory solvents as trace impurities. The Journal of Organic Chemistry 1997, 62,
(21), 7512-7515.
227. Lang, R. W.; Hansen, H. J., Simple synthesis of alkyl allenecarboxylates (allenic
esters) by the Wittig-reaction. Helv. Chim. Acta 1980, 63, (2), 438-455.
228. Wu, J.; Zhang, D.; Wei, S., Wittig reactions of stabilized phosphorus ylides with
aldehydes in water. Synth. Commun. 2005, 35, 1213-1222.
229. Li, N.-G.; Shi, Z.-H.; Tang, Y.-P.; Li, B.-Q.; Duan, J.-A., Highly efficient
esterification of ferulic acid under microwave irradiation. Molecules 2009, 14,
2118-2126.
230. Reddy, S. H. K.; Lee, S.; Datta, A.; Georg, G. I., Efficient synthesis of the 3 '-
phenolic metabolite of paclitaxel. J. Org. Chem. 2001, 66, (24), 8211-8214.
231. Pearl, I. A.; Beyer, D. L., Reactions of vanillin and its derived compounds .11.
Cinnamic acids derived from vanillin and its related compounds. J. Org. Chem.
1951, 16, (2), 216-220.
232. Xia, Y.; Wang, W., Asymmetric synthesis of machilin C and its analogue.
Chemical Papers 2010, 64, (5), 630-636.
233. Lebedev, A. V.; Lebedeva, A. B.; Sheludyakov, V. D.; Kovaleva, E. A.; Ustinova,
O. L.; Kozhevnikov, I. B., Competitive formation of β-amino acids, propenoic, and
ylidenemalonic acids by the rodionov reaction from malonic acid, aldehydes, and
ammonium acetate in alcoholic medium. Russ. J. Gen. Chem. 2005, 75, (7), 1113-
1124.
234. Leschot, A.; Tapia, R. A.; Eyzaguirre, J., Efficient synthesis of 4-methyl-
umbelliferyl dihydroferulate. Synth. Commun. 2002, 32, (20), 3219.

References
219
235. Salum, M. a. L.; Robles, C. J.; Erra-Balsells, R., Photoisomerization of ionic liquid
ammonium cinnamates: One-pot synthesis−isolation of Z-cinnamic acids. Org. Lett.
2010, 12, (21), 4808-4811.
236. Prachayasittikul, S.; Suphapong, S.; Worachartcheewan, A.; Lawung, R.;
Ruchirawat, S.; Prachayasittikul, V., Bioactive metabolites from Spilanthes acmella
Murr. Molecules 2009, 14, (2), 850-867.
237. Shimizu, T.; Kojima, M., Partial purification and characterization of UDPG: t-
Cinnamate glucosyltransferase in the root of sweet potato, Ipomoea batatas Lam.
Journal of Biochemistry 1984, 95, (1), 205-212.
238. Kiviranta, P. H.; Leppanen, J.; Rinne, V. M.; Suuronen, T.; Kyrylenko, O.;
Kyrylenko, S.; Kuusisto, E.; Tervo, A. J.; Jarvinen, T.; Salminen, A.; Poso, A.;
Wallen, E. A. A., N-(3-(4-hydroxyphenyl)-propenoyl)-amino acid tryptamides as
SIRT2 inhibitors. Bioorg. Med. Chem. Lett. 2007, 17, (9), 2448-2451.
239. Hosoda, A.; Nomura, E.; Mizuno, K.; Taniguchi, H., Preparation of a (+/-)-1,6-di-
O-feruloyl-myo-inositol derivative: An efficient method for introduction of ferulic
acid to 1,6-vicinal hydroxyl groups of myo-inositol. J. Org. Chem. 2001, 66, (21),
7199-7201.
240. Dobashi, Y.; Hara, S., A chiral stationary phase derived from (R,R)-tartramide with
broadened scope of application to the liquid-chromatographic resolution of
enantiomers
J. Org. Chem. 1987, 52, (12), 2490-2496.
241. Lucas, R. L.; Benjamin, M.; Reineke, T. M., Comparison of a tartaric acid derived
polymeric MRI contrast agent to a small molecule model chelate. Bioconjugate
Chem. 2008, 19, (1), 24-27.
242. Austin, P. C.; Park, J. R., The rotatory dispersion of derivatives of tartaric acid. Part
II. Acetyl derivatives. Journal of the Chemical Society 1925, 127, 1926-1934.
243. Baderschneider, B. Isolierung und Strukturaufklarung antioxidativ wirksamer
Verbindungen aus Weisswein. Ph.D. Thesis, Universitat Braunschweig, Germany,
2000.
244. Opitz, S.; Schnitzler, J. P.; Hause, B.; Schneider, B., Histochemical analysis of
phenylphenalenone-related compounds in Xiphidium caeruleum (Haemodoraceae).
Planta 2003, 216, (5), 881-889.
245. Yella, R., Chloroacetylchloride: A versatile reagent in heterocyclic synthesis.
Synlett 2010, 2010, (EFirst), 835,836.
References
220
246. Sigma-Aldrich http://www.sigmaaldrich.com/australia.html (19/01/2012),
247. Schroeder, C.; Lutterbach, R.; Stockigt, J., Preparative biosynthesis of natural
glucosides and fluorogenic substrates for β-glucosidases followed by in vivo 13C
NMR with high density plant cell cultures. Tetrahedron 1996, 52, (3), 925-934.
248. Plusquellec, D.; Roulleau, F.; Bertho, F.; Lefeuvre, M.; Brown, E., Sugar chemistry
without protective groupings .1. Regioselective esterification of anomeric hydroxyl
of lactose, maltose and glucose. Tetrahedron 1986, 42, (9), 2457-2467.
249. Hixson, J. L.; Sleep, N.; Capone, D. L.; Elsey, G. M.; Curtin, C.; Sefton, M. A.;
Taylor, D. K., Hydroxycinnamic Acid Ethyl Esters as Precursors to Ethylphenols in
Wine. J. Agric. Food Chem. 2012.