chemistry 255 — biochemistry lab manual - gustavus adolphus
TRANSCRIPT
CHEMISTRY 255 mdash BIOCHEMISTRY
LAB MANUAL
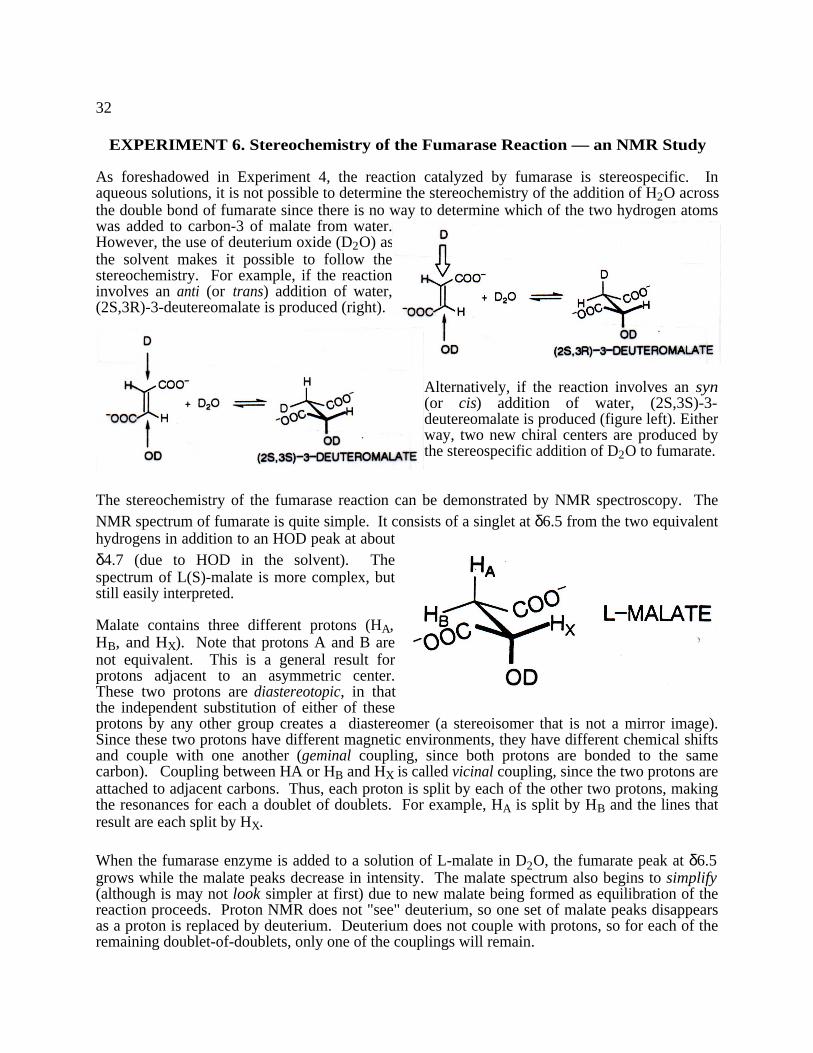
Structure of Fumarate Hydratase with Bound Malate
GUSTAVUS ADOLPHUS COLLEGE
This manual was developed from sourcematerial used with permission provided by
Gail Carlson PhD and Stewart Hendrickson PhDat St Olaf College
Introductory materials were written by Jeff Dahlseid PhDLaboratory exercises were developed adaptededited andor written by Jeff Dahlseid PhD
CHEMISTRY 255 -- Biochemistry Laboratory -- Fall 2002Instructors MW - Jeff Dahlseid PhD - Nobel 206B x6129 dahlseidgustavusedu
TR - Allan Splittgerber PhD - Nobel 206A x7323 splittygustavuseduTime and Location M T W or R 130-520 pm in Nobel 207
Laboratory Schedule
Week Experiment Techniques Used99 Expt 1 Introduction to basic techniques Measurements dilutions
UVVis spectroscopy
916 Expt 2 Amino acid composition of a Enzymatic proteolysis paper dipeptide chromatography
923 Discussion on scientific writing Readcritique primary literatureExercises involving buffer solutions Buffer preparation
930 No lab - Nobel Conference
107 Expt 3 Purification of AMP Extract preparation resin preparationaminohydrolase instrument operation
1014 Expt 3 (contrsquod) Column chromatography dialysisspectroscopic enzyme assay
1021 No lab - Reading Break NOTE Thursday will meet Oct 24 instead of Oct 17
1028 Expt 3 (contrsquod) Gel electrophoresis proteinconcentration and molecular weightdetermination enzyme assay
114 Expt 4 pH-Dependence of fumarase Buffer preparation spectroscopic enzyme assay
1111 Expt 5 Kinetic analysis of fumarase Spectroscopic enzyme assayMichaelis-Menten kinetic analysis
1118 Individual writing consultation (scheduled)
1125 No lab -Thanksgiving Break
122 Expt 6 Stereospecificity of the fumarase Proton NMRreaction mdash an NMR study
129 To Be Determined
Expt 6 may be done at times scheduled separately for each group
i
TABLE OF CONTENTS
Safety Guidelines iv
Safe Handling and Disposal of Chemicals vii
Codes for Chemical Labeling viii
Safe Handling of Biological Material ix
Safety Policies and Procedures Signature Sheet x
Material Safety Data Sheet Example xii
Overview and Integrated Schedule 1
GUIDELINES FOR WRITING LAB REPORTS 3
Lab Notebooks 4
Short Reports for Laboratory 5
Formal Report for Laboratory 6
Scientific Writing Discussion 7
EXPERIMENT 1 Introduction to Basic Biochemical Techniques 8
EXPERIMENT 2 Amino Acid Composition of a Dipeptide 12
EXPERIMENT 3 Purification of AMP Aminohydrolase 15
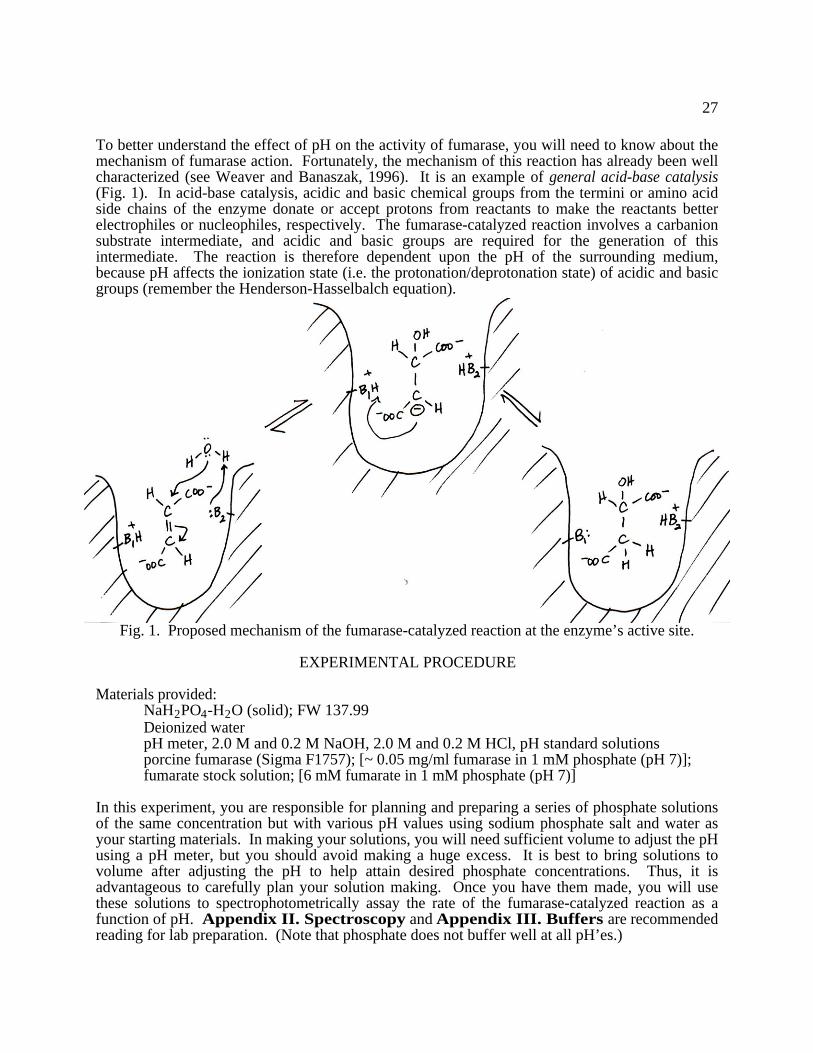
EXPERIMENT 4 pH Dependence of Fumarase 26
EXPERIMENT 5 Kinetic Analysis of Fumarase 29
EXPERIMENT 6 Stereochemistry of the Fumarase Reaction mdash an NMR Study 32
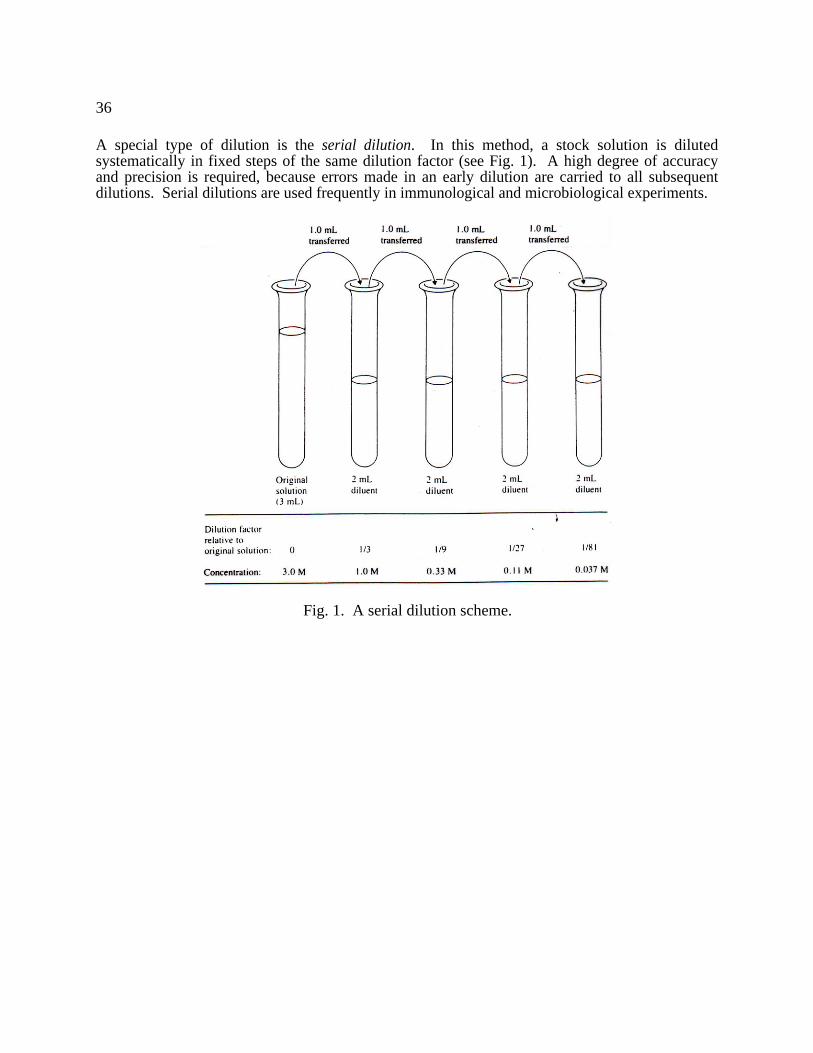
APPENDIX I Concentration and Dilution 35
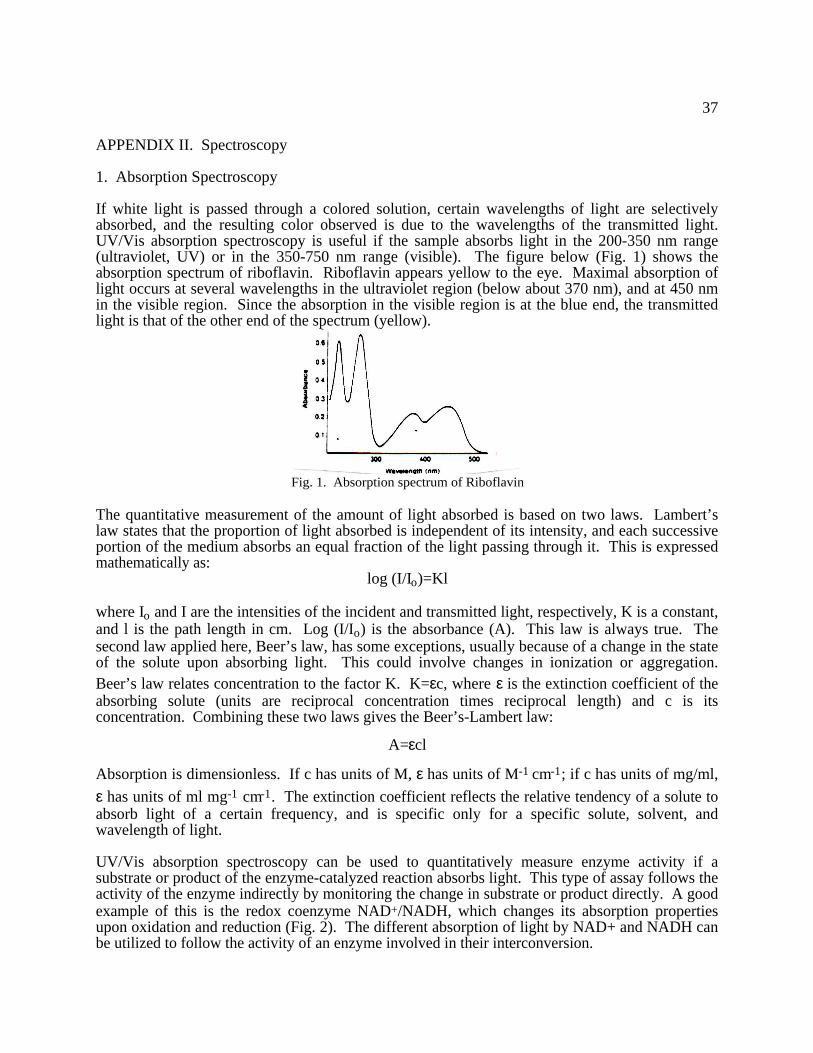
APPENDIX II Spectroscopy 37
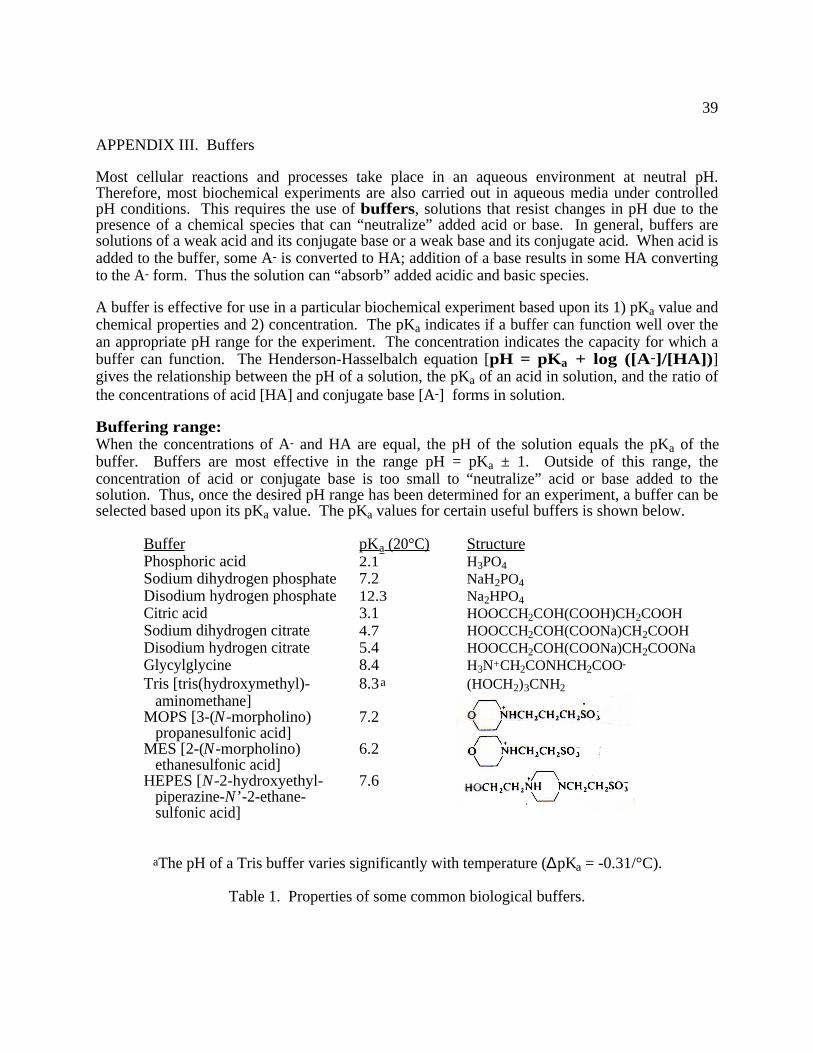
APPENDIX III Buffers 39
APPENDIX IV Enzymology 41
APPENDIX V Nuclear Magnetic Resonance 43
APPENDIX VI SDS-Polyacrylamide Gel Electrophoresis (SDS-PAGE) 45
ii
Safety Guidelines
I M P O R T A N T
POLICY ON SAFETY GOGGLES
ALL STUDENTS WORKING WITH OR IN CLOSE PROXIMITY TOCHEMICALS IN LABORATORIES ARE REQUIRED TO WEAR SAFETY
GOGGLES AT ALL TIMES
The chemistry laboratory can be a dangerous place While little that you will be asked to do isintrinsically dangerous a majority of the materials that you handle are in some way potentiallydangerous if they are handled carelessly Perhaps the greatest potential danger in your laboratorywork will be from corrosive substances such as strong acids and bases that readily attack humantissues
The most vulnerable part of your body is your eyes and they must be protected Therefore wewill INSIST that approved safety goggles be worn at all times (covering the eyes) when you areworking with chemicals or are in the vicinity of others using chemicals We will not tolerateexceptions to this rule Your laboratory instructor will remind you to wear safety goggles and youwill not be permitted to work in the laboratory if you do not wear them
Furthermore at the discretion of the laboratory instructor should you fail to heed warnings aboutwearing your safety goggles you may after two warnings be dismissed from the laboratory andrequired to drop the course We do not wish to use these penalties PLEASE do not force us todo so However be assured that ALL STUDENTS will be required to wear safety goggleswhen working with chemicals and we will not hesitate to assess these penalties to make thisrequirement work
If you have a problem with goggles fogging or if prolonged wear of goggles is uncomfortable werecommend that you occasionally go into the hallways to remove the goggles for relief be sure toput them back on prior to returning to the lab Goggles should NOT be removed in the laboratoryitself while chemicals are in use Several models of goggles are available and we hope that one ofthese will prove comfortable for you
In addition because the safety implications are unclear it is strongly recommended that contactlenses NOT be worn in the laboratory even under safety goggles Should chemicals includingsolvent vapors enter the eyes of a student wearing contact lenses there is a possibility that theychemicals may become trapped under the contact lenses Damage may be done to the eyes until thelenses can somehow be removed with the eyesight of the victim being permanently impaired
Therefore if you wear contact lenses you are encouraged to wear glasses instead of contacts in thelaboratory If you wear contacts but do not own an equivalent pair of glasses you are encouragedto obtain glasses for laboratory use
iii
Safety Guidelines
Submission of a Safety Policies and Procedures Signature Sheets (on page afterthese guidelines and safety information) signed by both the student andlaboratory instructor is required before any student can work in the laboratory
1 IMMEDIATELY REPORT ANY ACCIDENT OR SAFETY ISSUE TO THELABORATORY INSTRUCTOR
Emergency Procedures
2 If chemicals are spilled
a If chemicals are spilled on you or if you see chemicals spilled on another student Callfor help from your instructor Portions of your body or clothing that have been in contactwith the chemicals should immediately be flushed thoroughly with water Use the safetyshower if the spill is extensive An eye wash is available in the laboratory Donrsquot wait tosee if the chemicals will injure you rinse spills immediately
b Work with the instructor to clean up spills on the bench or floor Notify students nearbyof the presence of broken glassware andor chemicals and keep people from walkingthrough the area until cleanup is complete
3 In case of fire
a Call for help from your instructor If clothing is burning slowly walk to the fire blanketand wrap it around yourself and roll on the floor to extinguish the flames or slowly walkto the safety shower and pull the cord (or ask someone nearby to pull the cord) [Otherstudents nearby if necessary bring the fire blanket to the student or help the student to theshower and pull the chain]
b A fire on the bench top or floor may be put out with a fire extinguisher Call for helpfrom your instructor
4 Wash minor cuts or burns with cold water and get band aids or burn ointment from thestockroom Report all such incidents no matter how minor to the instructor
Safety Goggles and Clothing
5 Safety goggles must be worn at all times in the laboratory Since under Minnesota law thecollege is legally responsible for eye accidents if a student is not wearing eye protectionthe instructor may dismiss from the laboratory any students not wearing approvedgoggles In this class the instructor will warn students if necessary to wear theirgoggles If students do not respond to two warnings the may be dismissed form thelaboratory and requested to drop the course Goggles must be provided by each studentand may be purchased through the Gustavus Bookmark
6 If you are using a computer or printer in a lab you must wear safety goggles if work withchemicals is occurring in the lab
iv
7 Clothing Shoes with solid tops (not sandals) must be worn to protect your feet frombroken glass or other sharp materials Shorts or cut-off pants should not be worn in thelab it is important to protect your body with clothing rather than risk skin contact withchemicals or other materials Avoid wearing clothing with loose portions such as opensweaters baggy cuffs and hanging scarves Loose clothing can catch on glassware andequipment can drag through spills and may in some cases be a fire hazard Similarlyloose long hair should be tied back so that it does not become entangled in equipmentexposed to chemicals or provide an impediment to vision
Handling Chemicals
8 Do not taste or ingest any laboratory chemicals
9 Avoid touching chemicals with your hands and always thoroughly wash your hands afterusing chemicals
10 Work in a fume hood when carrying out reactions that give off objectionable gases If youneed to smell vapor do not put your nose directly above a flask beaker or other vesselcontaining chemicals Holding the vessel at least one foot away use your hand to gentlyand very cautiously fan the vapors toward your nose
11 No mouth pipetting is permitted When pipetting use the mechanical pipettors pipette aidsor the rubber bulbs provided in the laboratory
12 Always add acids to water (its alphabetical) never add water to acids Combining acidand water frequently generates heat addition of the acid to the water reduces the amount ofheat generated at the point of mixing and provides more water to disperse the heat
13 LABEL all flasks beakers test tubes and other vessels containing chemicals accordingto their contents This facilitates both identifying chemicals during an experiment andfollowing proper waste disposal procedures
14 Hold reagent bottles and other vessels containing liquids so that any drips will beopposite the label and hold them so any previous drips on that same side do not get onyour hand Clean off any drips or spills If necessary ask for help from your instructoror assistant
15 Laboratory wastes and residues are to be disposed of in an approved manner Wastecontainers for these will be provided and specific instructions on proper disposalprocedures will be provided by the laboratory instructor for each experiment
Laboratory Supervision
16 No unauthorized experiments are permitted Students may try new experiments only ifthey have been discussed with a faculty member and have been approved
17 No student may work in the laboratory alone All laboratory work must be under thesupervision of a faculty member or student laboratory assistant and at least one otherperson must be present when work with chemicals is being done No makeupexperiments may be performed without the permission of a studentrsquos laboratoryinstructor
v
Behavior in the Laboratory
18 Food and beverages are not permitted in the laboratory This includes drinking from waterbottles that you may carry with you on campus If you need to eat or drink during the timelaboratory is scheduled you must remove yourself from the laboratory Be sure to washyour hands before eating after working in laboratory
19 Backpacks and book bags clutter the benches andor floors of the laboratory and interrupttraffick flow during laboratory Please leave your book bags and backpacks in the hallwayor another location outside the laboratory
20 Any horseplay or behavior that is harassing disruptive or aggressive or in any waypresents a hazard to those in the laboratory is forbidden Any student or group of studentsengaging in such behavior may be dismissed by the laboratory instructor and may receivedno credit for the experiment
Other Procedures
21 If you anticipate needing to cut glass tubing or insert glass tubing into a rubber stopperconsult with your instructor prior to proceeding Both procedures present the potentialfor injury from broken glass and proper precautions are essential
22 CLEAN your bench top thoroughly at the end of each laboratory period This should bedone with a damp sponge
Safe Handling and Disposal of Chemicals
Some information on the safe use and disposal of chemicals is provided in this manual additionalsuggestions will be made by your laboratory instructor We want not only to provide you withguidelines about how to use chemicals and equipment safely - no experiment you will do thissemester is dangerous if safe procedures are followed throughout - but to be sure that properprecautions are taken to avoid contaminating the environment To this end we will provideappropriate containers for disposal of chemical wastes After collecting these from all the labsections our stockroom manager will see to it that proper procedures are observed in disposing ofthese items
How does one learn about proper handling of chemicals We have a variety of sources the mostcommon of which are Material Safety Data Sheets (MSDS) These provide a variety ofinformation on such things as health hazards first aid procedures procedures for cleaning upspills and disposal procedures for each chemical An example of an MSDS is copied on pages xi-xv By law companies that sell chemicals must also provide an MSDS (usually inserted as an extrasheet in shipment) for each chemical shipped There is no uniform format for an MSDS so theylook very different depending on the source The Chemistry Department obtains the MSDS formsfrom the corresponding vendors for the chemicals in the stockroom collection and keeps them onfile in the department office MSDS forms are also available from Sigma-Aldrich over the webCheck out the Chemistry Stockroom link on the Chemistry Departmentrsquos Home Page or go towwwsigmaaldrichcomcg i-binh srunDistribu tedHahtShopHahtSh ophtxstart= HS_SeacrchCen ter You may request a copy of an MSDS for one of the compounds you are using if you wish Or youcan download your own from the web
vi
Codes for Chemical Labeling
In the laboratory you will notice that containers of chemicals are labeled not only with the name(and in some cases concentration) of chemicals but also with colored diamonds containingnumerical and other codes These are the NFPA (National Fire Protection Agency) codes andindicate fire reactivity health and other hazards associated with the chemicals In general thehigher the number of a code the greater the potential hazard The specific codes are as follows
Bottom Diamond Special Hazards Right Diamond Reactivity Hazards
OXY Oxidizer 0 StableACID Acid 1 Unstable if heatedALK Alkali 2 Violent chemical changeCOR Corrosive 3 Shockheat may detonateW Use no water 4 May detonateRAD Radiation
Top Diamond Fire Hazards Left Diamond Health Hazards
0 Will not burn 0 Normal material1 Burns above 200deg F 1 Slightly hazardous2 Burns below 200deg F 2 Hazardous3 Burns below 100deg F 3 Extreme danger4 Burns below 73deg F 4 Deadly
vii
Safe Handling of Biological Material
Biochemists encounter potential laboratory risks in addition to those of other chemical laboratoryworkers the risks associated with biological specimens A problem with these is that there may berisks of which we are not yet aware However there are two types of risks we can assess fairlywell
Infectious agents
Agents of infection may be bacterial viral or the recently discovered prions (eg Mad-cowdisease)
With any human tissue (including blood) it is now general practice to follow universalprecautions handling every sample as if it were infected because you can never know that it isnot The precautions include persistent use of gloves segregation of lab from non-lab (eg ablood in the lab is never taken out of the lab) etc These are onerous precautions that take a lot ofplanning and arrangements Think about for example using a phone looking at your watch orusing a personal pen without contamination Remember that there are viruses fortunately stillrare that are extremely infectious more than HIV In this course we will NOT use human tissue
Animal tissue may also be contaminated with infectious agents We will use chicken muscle andfrom your kitchen you should know that poultry is a common source of Salmonella infectionsThe problem in the laboratory is that the chicken product may remain infectious long after it isdiscernable as a chicken product That is unlike your kitchen we do not begin with a cookingprocess that will kill most microorganisms Thus scrupulous cleanliness throughout withpersonal protection by gloves taking great care to avoid contacting personal items with thepossibility of contaminated gloves is necessary Washing hands after lab is highly recommended
Ecological dangers
In contemporary biochemical laboratories it is common to work with cloning vectors geneticallymodified cells and other agents with the potential to modify mostly in unpredictable ways majorecological systems This places a huge burden on the scientist to contain these productssometimes requiring entire new labs with facilities appropriate to handle the materials The biggestrisk is that it is so easy to forget the possible hazard of something that one works with so routinelyTo promote containment vector-containing material is destroyed through autoclaving Howeverin this course we will NOT be working with material involving cloning vectors
viii
Safety Policies and Procedures Signature Sheet
I have read all the material in the Safety Guidelines section of the Biochemistry Laboratory manualincluding the general safety policies goggles policy and material on safe use and disposal ofchemicals I understand this material and how it applies to the laboratory in which I will beworking I have asked for clarification of those points I do not understand
Signed ____________________________________ Date _______________________
Printed name ______________________________________________________________
Laboratory section _________________________________________________________
Accepted by faculty member ___________________________ Date________________
Remarks
Mark the locations of each of the following on the lab
bull Eye Wash (1)bull Safety Shower (1)bull Fire extinguisher (1)bull Gas shut off (1)bull Emergency phone (1)bull Exits (2)
ix
x
Material Safety Data Sheet Example - for ASPIRIN
MSDS Number A7686 --- Effective Date 111799
1 Product Identification
Synonyms 2-(acetyloxy)benzoic acid salicylic acid acetate acetysalicylic acid CAS No 50-78-2 Molecular Weight 18015 Chemical Formula C9H8O4 Product Codes 0033
2 CompositionInformation on Ingredients
Ingredient CAS No Percent Hazardous --------------------------------------- ------------ ------- --------- Acetylsalicylic Acid 50-78-2 100 Yes 3 Hazards Identification
Emergency Overview -------------------------- WARNING HARMFUL IF SWALLOWED OR INHALED CAUSES IRRITATION TO SKIN EYES ANDRESPIRATORY TRACT MAY CAUSE ALLERGIC RESPIRATORY REACTION POSSIBLE BIRTHDEFECT HAZARD MAY CAUSE BIRTH DEFECTS BASED ON ANIMAL DATA AFFECTS THERESPIRATORY SYSTEMLIVER KIDNEYS EYES SKIN AND BLOOD
JT Baker SAF-T-DATA(tm) Ratings (Provided here for your convenience) ----------------------------------------------------------------------------------------------------------- Health Rating 1 - Slight Flammability Rating 1 - Slight Reactivity Rating 0 - None Contact Rating 1 - Slight Lab Protective Equip GOGGLES LAB COAT Storage Color Code Orange (General Storage) -----------------------------------------------------------------------------------------------------------
Potential Health Effects ---------------------------------- Inhalation
Causes irritation to the respiratory tract Exposure may cause an allergy to develop Ingestion
Extremely large oral doses may cause mild burning pain in the mouth and stomach anorexia nauseavomiting intense thirst diarrhea dizziness irritability confusion coma teratogenic effects and death fromrespiratory failure The mean lethal dose of aspirin by mouth probably lies between 20 and 30 grams inadults
Skin Contact May cause irritation Eye Contact
Causes irritation Contact cause severe pain and may cause eye damage
xi
Chronic Exposure Repeated ingestion may cause tinitus abnormal bleeding (gastric or retinal) gastric ulcer weight lossmental deterioration and skin eruptionsMay cause kidney and liver damage in susceptible individuals Aggravation of Pre-existing Conditions
Persons with a history of asthma or allergies to aspirin may be at an increased risk upon exposure to this substance
4 First Aid Measures Inhalation Remove to fresh air If not breathing give artificial respiration If breathing is difficult give oxygen Call aphysician Ingestion Induce vomiting immediately as directed by medical personnel Never give anything by mouth to an unconsciousperson Call a physician Skin Contact In case of contact immediately flush skin with plenty of soap and water for at least 15 minutes Removecontaminated clothing and shoes Wash clothing before reuse Get medical attention if irritation develops or persists Eye Contact Immediately flush eyes with plenty of water for at least 15 minutes lifting lower and upper eyelids occasionally Getmedical attention immediately
5 Fire Fighting Measures Fire As with most organic solids fire is possible at elevated temperatures or by contact with an ignition source Explosion Fine dust dispersed in air in sufficient concentrations and in the presence of an ignition source is a potential dustexplosion hazard Minimum explosive dust concentration 40 gm3 Fire Extinguishing Media Water spray foam or dry chemical Special Information In the event of a fire wear full protective clothing and NIOSH-approved self-contained breathing apparatus with fullface piece operated in the pressure demand or other positive pressure mode
6 Accidental Release MeasuresRemove all sources of ignition Ventilate area of leak or spill Wear appropriate personal protective equipment asspecified in Section 8 SpillsClean up spills in a manner that does not disperse dust into the air Use non-sparking tools and equipment Reduceairborne dust and prevent scattering by moistening with water Pick up spill for recovery or disposal and place in aclosed container
7 Handling and StorageKeep in a tightly closed container stored in a cool dry ventilated area Protect against physical damage Isolate fromany source of heat or ignition Isolate from incompatible substances Containers of this material may be hazardouswhen empty since they retain product residues (dust solids) observe all warnings and precautions listed for theproduct
8 Exposure ControlsPersonal Protection Airborne Exposure Limits - ACGIH Threshold Limit Value (TLV) 5 mgm3 (TWA)
xii
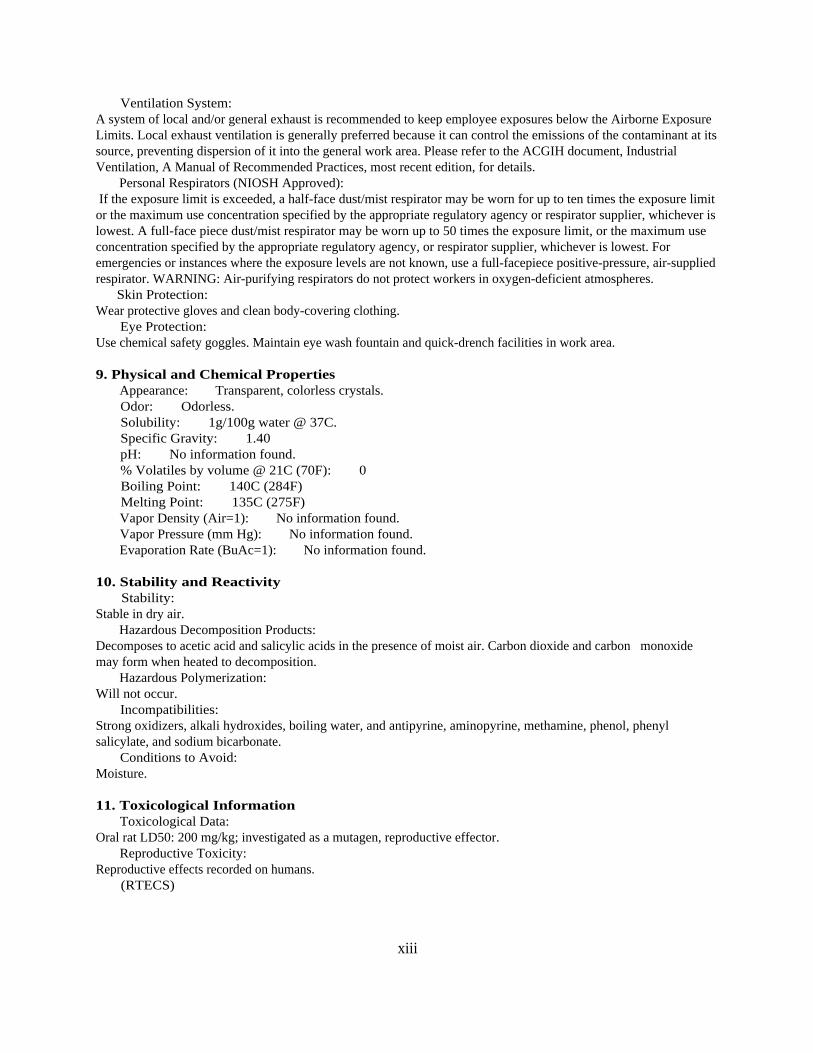
Ventilation System A system of local andor general exhaust is recommended to keep employee exposures below the Airborne ExposureLimits Local exhaust ventilation is generally preferred because it can control the emissions of the contaminant at itssource preventing dispersion of it into the general work area Please refer to the ACGIH document IndustrialVentilation A Manual of Recommended Practices most recent edition for details Personal Respirators (NIOSH Approved) If the exposure limit is exceeded a half-face dustmist respirator may be worn for up to ten times the exposure limitor the maximum use concentration specified by the appropriate regulatory agency or respirator supplier whichever islowest A full-face piece dustmist respirator may be worn up to 50 times the exposure limit or the maximum useconcentration specified by the appropriate regulatory agency or respirator supplier whichever is lowest Foremergencies or instances where the exposure levels are not known use a full-facepiece positive-pressure air-suppliedrespirator WARNING Air-purifying respirators do not protect workers in oxygen-deficient atmospheres Skin Protection Wear protective gloves and clean body-covering clothing Eye Protection Use chemical safety goggles Maintain eye wash fountain and quick-drench facilities in work area
9 Physical and Chemical Properties Appearance Transparent colorless crystals Odor Odorless Solubility 1g100g water 37C Specific Gravity 140 pH No information found Volatiles by volume 21C (70F) 0 Boiling Point 140C (284F) Melting Point 135C (275F) Vapor Density (Air=1) No information found Vapor Pressure (mm Hg) No information found Evaporation Rate (BuAc=1) No information found
10 Stability and Reactivity Stability Stable in dry air Hazardous Decomposition Products Decomposes to acetic acid and salicylic acids in the presence of moist air Carbon dioxide and carbon monoxidemay form when heated to decomposition Hazardous Polymerization Will not occur Incompatibilities Strong oxidizers alkali hydroxides boiling water and antipyrine aminopyrine methamine phenol phenylsalicylate and sodium bicarbonate Conditions to Avoid Moisture
11 Toxicological Information Toxicological Data Oral rat LD50 200 mgkg investigated as a mutagen reproductive effector Reproductive Toxicity Reproductive effects recorded on humans (RTECS)
xiii
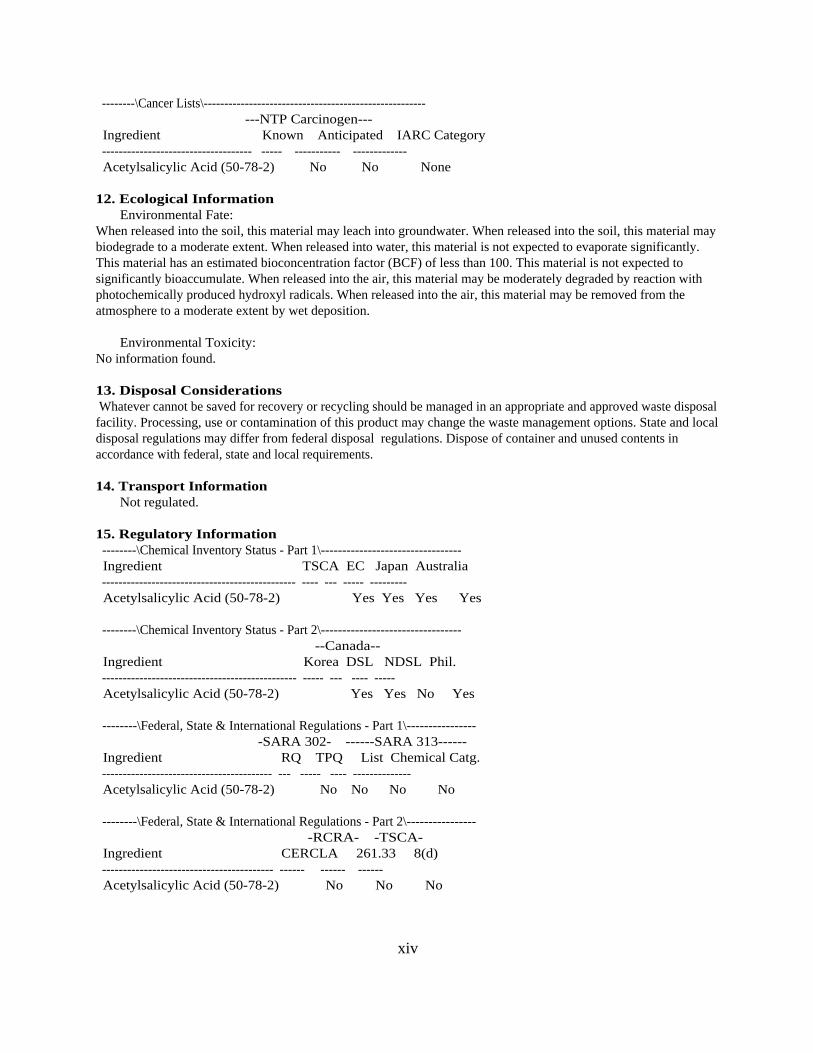
--------Cancer Lists------------------------------------------------------ ---NTP Carcinogen--- Ingredient Known Anticipated IARC Category ------------------------------------ ----- ----------- ------------- Acetylsalicylic Acid (50-78-2) No No None
12 Ecological Information Environmental Fate When released into the soil this material may leach into groundwater When released into the soil this material maybiodegrade to a moderate extent When released into water this material is not expected to evaporate significantlyThis material has an estimated bioconcentration factor (BCF) of less than 100 This material is not expected tosignificantly bioaccumulate When released into the air this material may be moderately degraded by reaction withphotochemically produced hydroxyl radicals When released into the air this material may be removed from theatmosphere to a moderate extent by wet deposition Environmental Toxicity No information found
13 Disposal Considerations Whatever cannot be saved for recovery or recycling should be managed in an appropriate and approved waste disposalfacility Processing use or contamination of this product may change the waste management options State and localdisposal regulations may differ from federal disposal regulations Dispose of container and unused contents inaccordance with federal state and local requirements
14 Transport Information Not regulated
15 Regulatory Information --------Chemical Inventory Status - Part 1--------------------------------- Ingredient TSCA EC Japan Australia ----------------------------------------------- ---- --- ----- --------- Acetylsalicylic Acid (50-78-2) Yes Yes Yes Yes --------Chemical Inventory Status - Part 2--------------------------------- --Canada-- Ingredient Korea DSL NDSL Phil ----------------------------------------------- ----- --- ---- ----- Acetylsalicylic Acid (50-78-2) Yes Yes No Yes --------Federal State amp International Regulations - Part 1---------------- -SARA 302- ------SARA 313------ Ingredient RQ TPQ List Chemical Catg ----------------------------------------- --- ----- ---- -------------- Acetylsalicylic Acid (50-78-2) No No No No --------Federal State amp International Regulations - Part 2---------------- -RCRA- -TSCA- Ingredient CERCLA 26133 8(d) ----------------------------------------- ------ ------ ------ Acetylsalicylic Acid (50-78-2) No No No
xiv
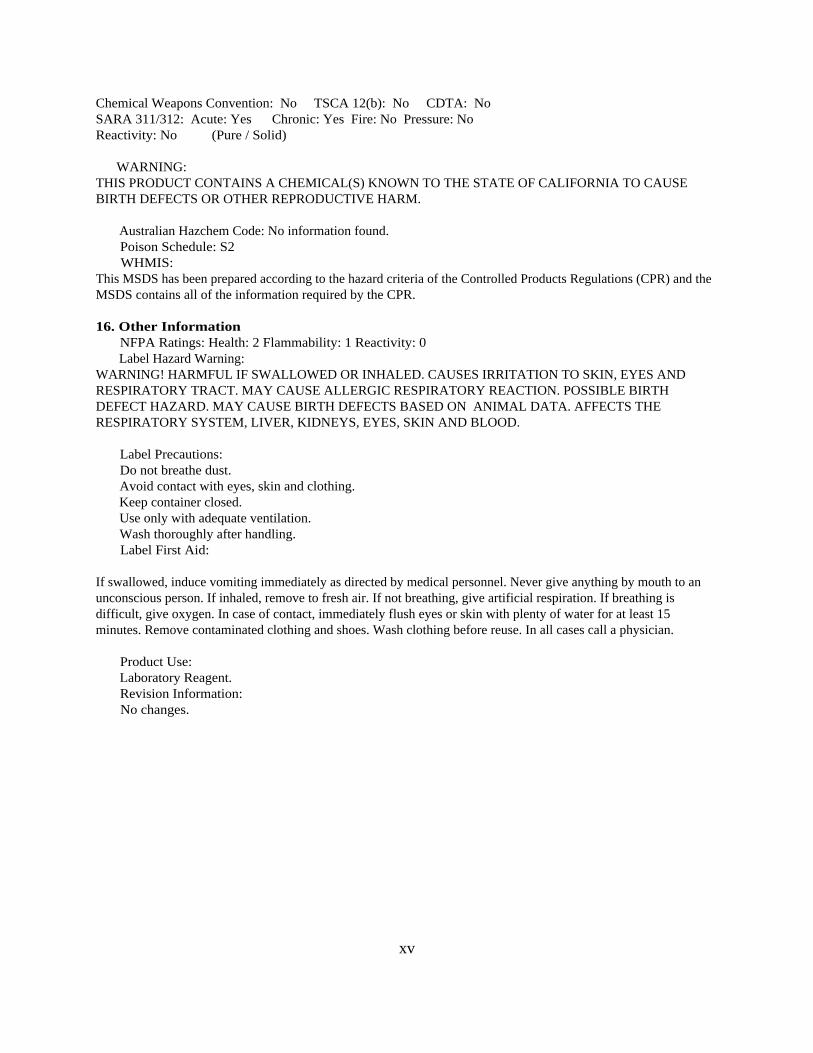
Chemical Weapons Convention No TSCA 12(b) No CDTA NoSARA 311312 Acute Yes Chronic Yes Fire No Pressure NoReactivity No (Pure Solid)
WARNING THIS PRODUCT CONTAINS A CHEMICAL(S) KNOWN TO THE STATE OF CALIFORNIA TO CAUSEBIRTH DEFECTS OR OTHER REPRODUCTIVE HARM
Australian Hazchem Code No information found Poison Schedule S2 WHMIS This MSDS has been prepared according to the hazard criteria of the Controlled Products Regulations (CPR) and theMSDS contains all of the information required by the CPR
16 Other Information NFPA Ratings Health 2 Flammability 1 Reactivity 0 Label Hazard Warning WARNING HARMFUL IF SWALLOWED OR INHALED CAUSES IRRITATION TO SKIN EYES ANDRESPIRATORY TRACT MAY CAUSE ALLERGIC RESPIRATORY REACTION POSSIBLE BIRTHDEFECT HAZARD MAY CAUSE BIRTH DEFECTS BASED ON ANIMAL DATA AFFECTS THERESPIRATORY SYSTEM LIVER KIDNEYS EYES SKIN AND BLOOD Label Precautions Do not breathe dust Avoid contact with eyes skin and clothing Keep container closed Use only with adequate ventilation Wash thoroughly after handling Label First Aid
If swallowed induce vomiting immediately as directed by medical personnel Never give anything by mouth to anunconscious person If inhaled remove to fresh air If not breathing give artificial respiration If breathing isdifficult give oxygen In case of contact immediately flush eyes or skin with plenty of water for at least 15minutes Remove contaminated clothing and shoes Wash clothing before reuse In all cases call a physician
Product Use Laboratory Reagent Revision Information No changes
xv
xvi
1
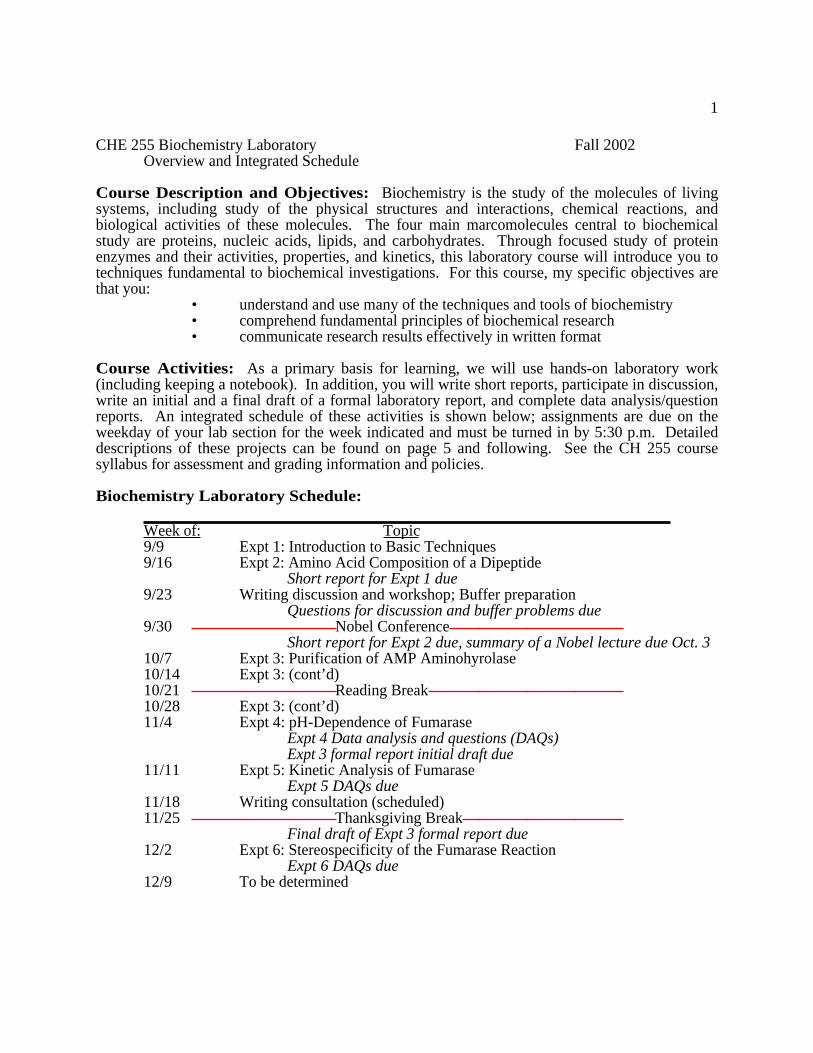
CHE 255 Biochemistry Laboratory Fall 2002Overview and Integrated Schedule
Course Description and Objectives Biochemistry is the study of the molecules of livingsystems including study of the physical structures and interactions chemical reactions andbiological activities of these molecules The four main marcomolecules central to biochemicalstudy are proteins nucleic acids lipids and carbohydrates Through focused study of proteinenzymes and their activities properties and kinetics this laboratory course will introduce you totechniques fundamental to biochemical investigations For this course my specific objectives arethat you
bull understand and use many of the techniques and tools of biochemistrybull comprehend fundamental principles of biochemical researchbull communicate research results effectively in written format
Course Activities As a primary basis for learning we will use hands-on laboratory work(including keeping a notebook) In addition you will write short reports participate in discussionwrite an initial and a final draft of a formal laboratory report and complete data analysisquestionreports An integrated schedule of these activities is shown below assignments are due on theweekday of your lab section for the week indicated and must be turned in by 530 pm Detaileddescriptions of these projects can be found on page 5 and following See the CH 255 coursesyllabus for assessment and grading information and policies
Biochemistry Laboratory Schedule
Week of Topic99 Expt 1 Introduction to Basic Techniques916 Expt 2 Amino Acid Composition of a Dipeptide
Short report for Expt 1 due923 Writing discussion and workshop Buffer preparation
Questions for discussion and buffer problems due930 Nobel Conference
Short report for Expt 2 due summary of a Nobel lecture due Oct 3107 Expt 3 Purification of AMP Aminohyrolase1014 Expt 3 (contrsquod)1021 Reading Break1028 Expt 3 (contrsquod)114 Expt 4 pH-Dependence of Fumarase
Expt 4 Data analysis and questions (DAQs)Expt 3 formal report initial draft due
1111 Expt 5 Kinetic Analysis of FumaraseExpt 5 DAQs due
1118 Writing consultation (scheduled)1125 Thanksgiving Break
Final draft of Expt 3 formal report due122 Expt 6 Stereospecificity of the Fumarase Reaction
Expt 6 DAQs due129 To be determined
2
Class policies structure e-mail and feedback By its very nature laboratory involveslearning through hands-on participation so you must attend laboratory Failure to do so willresult in failure of the laboratory portion of the course (see CHE 255 syllabus) Approval ofexcuses for missing lab will be determined on a case by case basis Should you anticipate anacceptable absence you must let me know ahead of time This will facilitate making advancedarrangements for acceptable absences
For each lab we will have a pre-lab discussion to go over background material for the labanticipate scheduling and trouble-shooting issues and communicate new and helpful informationI strongly recommend that you prepare for pre-laboratory ahead of time Doing this will allowyou to ask questions about matters you find confusing which may save you serious time andfrustration during the laboratory Furthermore by reading the material in the laboratory manualdeveloping a plan doing any necessary calculations and noting questions in advance of lab youcan insure things go more smoothly for you and your group in lab In addition the moreorganized you are when you come to lab the better chance you will have to finish in reasonabletime To gain as much as possible from laboratory I recommend that you read any material fromthe Lehninger text or library reserve papers that are related to the weekrsquos exercise
Presenting scientific results is an essential part of the scientific endeavor and thus a focusof this class will include scientific writing Having an accurate record of what you actually did andhow it worked is critical to communicating your results Therefore you should also keep anotebook during lab of all the information necessary to communicate your results Keeping this ingood form and organized will make reports easier Descriptions and instructions for writtenreports related exercises and the presentation project can be found on page 3 and following
Science as practiced is increasingly a collaborative endeavor It is my hope that anenvironment of active learning and cooperation can be cultivated in laboratory and I welcome andencourage your participation Laboratory work is rigorous and I expect everyone to work hardbut if you are having problems with the course please let me know I am here to help you learnTo help answer questions you have about the course I will be using e-mail Expanded commentsabout e-mail are available upon request As an additional note you should be aware that you mayuse the lab section e-mail alias (f-che-255--labgacedu where is your lab section number) toask questions of other lab members in your section
I expect to be learning a great deal this semester I am very enthusiastic about being andbecoming an excellent educator both for you and my future students I welcome your constructivesuggestions as to how to improve laboratory and my teaching I invite you to present and discussyour suggestions with me in my office at any time during the semester
Note about academic honesty Issues of academic honesty are a serious matter As yourwriting will be a principle vehicle for assessment of your work in the laboratory it is important thatyou understand my academic honesty policy specifically regarding plagiarism Consult the CHE255 course syllabus for details about these matters
Students with disabilities Appropriate accommodations will be made for students withdocumented disabilities If you have a disability requiring accommodation in this class pleasecontact either me at my extension or Jane Patchin at x7027 Information concerning a disabilitywill be kept strictly confidential
3
GUIDELINES FOR WRITING LAB REPORTS
You will be writing short reports (see page 5) for Expt 1 and 2 and a formal lab report (see page6) for Expt 3 You should write your lab reports short or formal following the relevantguidelines for the format of a scientific research paper outlined below (NOTE for short reportsonly the Materials and Methods and Results sections apply) In addition you should write yourreports for a peer audience specifically so that they can be read and understood by someone withabout the same approximate general knowledge of biochemistry Keep in mind that scientificwriting is concise and terse Say only what is needed for clarity My hope is that by defining youraudience for you it will make easier decisions about what detail should and should not beincluded Although I encourage you to work with your lab group to understand the experimentsand data lab reports are to be written on an individual basis and in your ownwords Reports must be turned in by 530 pmthe day they are due as indicated on the schedule
There are many good reference manuals for scientific writing including The ACS Style Guide AManual for Authors and Editors edited by Janet S Dodd (Amer Chem Soc) available in thecollege library See also material from JRL Walker on reserve in the library However we willalso be spending laboratory class time discussing and evaluating samples of scientific writingThere will also be instructor and peer feedback on the first draft of your formal report followed bya consultation with the instructor before the final draft is to be compete
In your reports include the following sections in the order given
Title page First page has the paper title date author(s) and relevant biographical information
Abstract Summarize the major points of the report including a one sentence statement of whatwas doneattempted all significant dataresults obtained and a brief statement about the meaningof the results This section should be very concise and not exceed one paragraph in length
Introduction Provide background material needed to support and understand the data presentedin the report from the angle you present it This means that your choice about whether to presentthe material as a novel discovery or as a methods development should impact the content of yourintroduction Think about the following questions What were you trying to accomplish in thisexperiment Given your answer to that question what does the reader need to know or toremember in preparation for reading a description your experimental results Include in thissection an introduction and pertinent background to the topic of the paper the purpose of yourexperiment(s) the theoretical basis or rationale for the experiment(s) and the significance(expected or real) of the result(s) you sought Do not include any methods or results here
Materials and Methods (Experimental) Describe exactly all the methods and reagents youused in the experiment using passive voice Where the lab manual or other sources providemethod details I want you to reference the source (with a parenthetical inset) but to write in yourown words a description of the method Be sure to list your source reference in thebibliography Copying from the lab manual is not permitted This section should be as brief aspossible yet allow your peers to repeat exactly the experiment you described given only yourreport as a guide For example it is important to list the composition of all buffers and othersolutions used in the experiment but not to describe how they were prepared or how much wasmade In contrast the amount used in the particular experiment may be important
Results Report all data obtained Relevant data should be clearly presented in Tablesandor as Figures To be clear all figures and tables must have a title (following the figure or
4
table number in the legend) properly labeled components (axes units of measure etc) andinclude figure legends with relevant information not already in the figure such as the identity ofsymbols used wavelengths amount of sample used etc Include only essential information in thefigure legends that is already described in the Materials and Methods section The Results sectionmust also include textual explanations of the results as well It is often helpful to think of thetextual part of the results section as serving the function of telling a story about your resultsThis has several implications First introductory or transition sentences can be very helpful Theuse of these seemingly extra words does not have to be in conflict with being concise and it mayyield clarity that allows it all to be said with less Secondly a good story does not covereverything but will report the most significant details Thus although a good Results sectionreports all the details the text of your Results may leave some details present only in the tables orfigures The idea is to lead your reader through the results you obtained from your experimentsnot to simply reiterate the methods Primary data (spectra and kinetic recordings) should beretained dated and kept in your notebooks It is important to provide equations used to calculateimportant experimental values but do not show the actual calculation unless the actual result comesfrom a computational approach These can be placed in the methods when VERY routine in theResults text or Figure Legends but not more than one of these I require you to use the past tensein your Results section (what DID you obtain in this experiment)
Discussion Analyze the data reported in the results section Try to answer the questions Whatdo these data mean How do the results advance the knowledge in this field of study What futureexperiments are suggested by your work Do not simply summarize the data again Use the pasttense here (what DID this experiment reveal) Be sure to address all the questions listed at the endof each experiment in this manual
References As laboratory research relies on previous work written reports must includereferences Inadequate or inappropriate referencing should be avoided Include references to anyjournal articles books laboratory techniques manuals etc used to complete your lab reports bothas parenthetical references (in the correct location of the text) AND in the bibliography Listreferences in proper scientific format Research journals in biochemistry use varied systems forreference citation For this course use the following format
First-last-name First-initial Second-last-name Initial and Last-last-name Initial (Date)Title Journal Title Standard Abbreviation Volume number first page-last page
For further information about writing lab reports consult the article on reserve in the collegelibrary Walker JRL (1991) A studentrsquos guide to practical write-ups Biochem Ed 19 31-32
Lab Notebooks Presenting scientific results (written or oral) is an essential part of the scientificendeavor and thus a focus of this class Having an accurate and real record of what you actuallydid and what resulted is critical to communicating your results Therefore you must keep anotebook during the lab that includes all of the information methods data etc that are necessaryto repeat and communicate your results Researchers in biochemistry use a variety of notebookformats ranging from bound carbon-copy notebooks to loose paper kept in a ring binder Youmay choose your own approach but your notes must be legible clear complete and well-organized so that someone could read understand and repeat your work Ask if you want helpwith this It will be incredibly helpful to you in creating well-written lab reports
Other NotesYou will need a PC-formatted disk on which to save all data generated in this lab includingspectroscopic data Nothing will be safe stored only on the hard drive of the computers in lab
5
Short Reports for Laboratory
Project OverviewThese assignments are short length reports formal in format and intended to improve yourscientific communicating and writing skills by practicing communicating what you did inlaboratory to a peer level audience
Learning Objectivesbull Convey concisely precisely and with understanding the methods for the relevant
experiment (NOT simply a copy of the lab manual) in a Materials and Methods sectionbull Report in narrative form and with understanding the results of the relevant experiment
supported by all of the data in either tabular or figure formatbull Communicate a well understood and well written report (ie complete concise and good
use of bibliographic references and proper English)
Directions and FormatThe short format report should be a brief typed report including only the Methods and Materialssection and Results section (including data analysis and equations) of a formal report plus theanswers to questions from DATA ANALYSIS of the experiment Refer to the preceding pages fordirection on the writing of the short report Additional reference material is available in the libraryas noted in the lab manual
A formal length requirement is not going to be enforced but make sure you follow closely thedirections regarding clarity of communication while being concise in your presentation of what youneed to say Format requirements include a report that is typed double spaced with one inchmargins all around and using a font that is no less than 12 points Placement of figures and tablescan be in the text or at the end but must have titles and figure legends Use headings toidentify the Materials and Methods (one section) and Results sections Note the directions on useof VERB TENSE in scientific writing The report should be nicely printed but need not bebound except by staple or paper clip
Evaluation CriteriaThe report will be evaluated based on how well you accomplish the learning objectives outlinedabove I want to be convinced from your report that I could repeat the experiment given what youhave written I will also be looking for whether you have done a high quality and complete job ineffectively communicating your results including your ability to write a good narrative and notjust a list of references to the figures and tables I will be looking for clear and concisecommunication completeness and a good understanding of your topic I will also be looking forcorrect labeling of figures (units labeled axis etc) and proper and adequate use of references
6
Formal Report for Laboratory
Project OverviewThis assignment is a formal laboratory report to be written in science journal article format Theintent of this project is to provide an opportunity for you to 1) develop an appreciation for thedevelopment and theory of techniques you used in the laboratory exercise 2) gain a deeperknowledge and understanding of the biochemistry central to the laboratory exercise and thefundamentals of biochemical research in general and 3) learn how to communicate effectively theresults of your laboratory efforts in a professional format Together this assignment serves toprovide a vehicle toward achieving the course objectives
The Expt 3 formal report will be initially evaluated (and graded) as a first draft The writing in thefirst draft will also be critiqued through a peer review exercise (see below) Two of your peerswill critique your draft (and you will critique othersrsquo drafts) Peer critiques will be graded I willassemble the critiques as a whole and provide you with the respective feedback You will thenhave the opportunity to discuss your writing with me during a scheduled consultation The finaldraft of the Expt 3 formal report will be due one week later (see syllabus page 1 for dates)
Learning Objectivesbull Convey an understanding of the techniques (use theory etc) used in the laboratory
exercise in the context of presenting your resultsbull Demonstrate knowledge and understanding of the biochemistry and the approach of the
exercise and appreciate the significance of your resultsbull Communicate a well researched and well written report (ie complete concise and good
use of bibliographic references and proper English)
Directions and FormatThe directions for writing formal laboratory reports are well elaborated on pages 3-4 Additionalreference material is available in the library as noted A formal length requirement will not beenforced but make sure you follow closely the directions regarding clarity of communication whilebeing concise in your presentation of what you need to say Format requirements include a reportthat is typed double-spaced with one inch margins all around and using a font that is no less than12 points Placement of figures and tables can be in the text or at the end but figure legendsmust accompany them Headings should be used for each of the key sections of a scientificarticle including abstract introduction materials and methods (one section) results discussionand references Note the directions on use of VERB TENSE in scientific writing The reportshould be a quality printing but need not be bound except by staple or paper clip
Evaluation CriteriaThe report will be evaluated based on how well you accomplish the learning objectives outlinedabove I want to be convinced from your report that you have done a high quality and completejob in effectively communicating your results In your writing I will be looking for clear andconcise communication completeness and a good understanding of your topic I will also belooking for correct labeling of figures (units labeled axis etc) proper and adequate use ofreferences and a discussion that is thoughtful and possibly even creative
7
Scientific Writing Discussion
For this exercise we will be discussing and hopefully learning about scientific writing Thevehicle for our discussion will be in part your reflection and responses to reading the writing in thetwo successfully published biochemical papers provided We will be analyzing the papers for theirwriting rather than their scientific merit Learning to think about the intended reader before orwhile writing is a great vehicle for clear writing However to aid in your assessment of thewriting you will need to have a sense for the science presented I recommend reading both papersonce to get a general sense for their content the types of experimental questions asked the types ofexperimental techniques employed and the outcome and significance of the work After you havedone this you should read the list of questions or points for reflection below and then re-read andanalyze the writing in both papers The papers I have provided intentionally represent twodifferent formats so that comparison and contrast might aid our discussion The main idea behindthis exercise is that reflecting upon and discussing scientific writing as a reader should make moreexplicit to you elements of scientific writing that make it good Once you recognize these elementsexplicitly you can then apply yourself to emulating those elements of quality in your own writing
How does the writing in these papers differ from other types of writing you have encounteredHow does the writing in the two papers differ from each other
What is the general scheme for organization of both papers How do they differ
Look at the respective sections of each paper in light of the function outlined for them in thelaboratory manual (pp 3-4) How do the sections of each paper fall short meet or exceed thesegoalsfunctions How are the papers similar or different in this regard
In order for others to repeat published work it is very important that the description of what wasdone is complete Could you repeat the experiments (or does it seem like you could) described ineither paper given what the authors providedescribe Is one of the papers better in this regardWhich one and why
Figures and tables and their legends play a key role in effectively and clearly presenting scientificresults Can you tell what question the experiment in the figure is trying to answer Can you tellwhat techniques were used to obtain the results in the figure How were the samples (if any)prepared How do the symbols or labels aid your understanding of the data What features aremost helpful or essential
What do you notice about the verb tense used throughout the different sections of a given paperWithin the individual sections of a given paper Between the two different papers What role doesthis play
Clarity of scientific writing is of key importance Are the respective sections of each paper clearAre the figures tables and figure legends (as presented) clear Overall what do you thinkcontributes to whether these papers achieve clarity (or fail to) For example how does theirorganization format use of verb tense etc help or hinder this Is one paper more clear than theother If so why
Having thoughtfully analyzed these papers as a reader what would be your main goal (ie whatwould you try to achieve) as you write a scientific paper What would you try and avoid
What other observations or questions do you have concerning the writing in these two paper
8
EXPERIMENT 1 Introduction to Basic Biochemical Techniques
Biochemistry is a very broad discipline but there are certain basic techniques that every biochemistuses in the laboratory Three of these basic techniques are emphasized in this exercise and theyare (1) Measurements (2) Dilutions and (3) UVvis Spectroscopy This experimentintroduces you to these essential techniques and gives you a chance to try them for yourself Inthis experiment you will utilize these techniques to measure the concentration of protein in solution(the Bradford assay) although you will use these techniques repeatedly throughout the semester
(1) MEASUREMENTS
Many biochemical measurements are made on a very small scale using micropipettors many ofwhich are air displacement piston pipettes such as the Rainin Pipetmantrade They are quick andconvenient but their accuracy is dependent on how they are adjusted and used Below are volumeranges cautions and instructions for using the pipettors If you have not used pipettors before orif it has been a while practice using them with water before proceeding to the Bradford assay
Volume Ranges for Pipettors In biochemistry laboratory we will use sets of pipettors whichmeasure volumes on a microliter scale The following summarizes the three basic models Small-volume model generally 1-20 microl in 002 microl increments (recommended range is 1-20 microl) Mid-volume model 1-200 microl in 02 microl increments (recommended range is 20-200 microl) Large-volume model 1-1000 microl in 20 microl increments (recommended range is 200-1000 microl)
CAUTIONS for using the pipettors1 NEVER invert the pipettor or lay it on its side with liquid in the tip This can result in liquidentering the barrel andor piston This liquid may carry over and contaminate subsequent samplesIn addition it is possible that certain solutions may damage the piston (see 2) If this happensthe pipettor should be disassembled cleaned and dried (please inform your instructor)
2 DO NOT use volatile or highly corrosive liquids Use of highly volatile organic solventswill prevent the tip from filling completely due to their high vapor pressure Highly corrosiveliquids such as concentrated acids may cause corrosion of the stainless steel piston The pipettorshould be disassembled cleaned and dried after such use 3 FOR ACCURACY when making dilutions always pipet the largest volume into your tube orflask first Then pipet the smaller volume into the larger volume When adding a small volume toa larger volume never dispense the sample onto the side of the tube or flask Ratheralways submerge the end of the pipette tip into the solution before dispensing the smaller volume
Operation of Pipettors1 Set the desired volume by turning the volume adjustment knob until the correct volume showson the digital indicator For best precision approach the desired volume by dialing downward(at least one-third revolution) from a larger volume setting
To accurately set the desired volume on the pipettor it is important to recognize the position of thedecimal point On the small-volume model the decimal point is between the middle and lowestdials with tenths of microliters indicated in color or by a line On the mid-volume model thedecimal point is absent and two-tenths of a microliter subdivisions are indicated on the lowest dialOn the large-volume model the decimal point is either between the top and middle dials withmilliliters indicated in color and hundreds and tenths of microliters indicated in black on the lowertwo dials or missing so that the dial that shows 1000 microl with two-tenths subdivisions
9
2 Attach a new disposable tip to the shaft Press firmly with slight twisting to insure a positiveairtight seal Loose tips can result in sample leakage or the tip falling off at an inappropriate time
3 Slowly depress the plunger to the first positive stop (where you feel stronger but not totalresistance) This is the calibrated volume displayed on the digital readout
4 Hold the pipettor vertically and immerse the tip just below the surface (a few mm) of liquid
5 Allow the push button to return slowly to the up position Never permit it to snap upThis can result in liquid being pulled into the barrel andor piston causing the types of problemsyou have been cautioned about above
6 Wait several seconds to insure that the full volume is drawn up into the tip More viscoussamples or very fine tips require a longer period of time
7 Withdraw the tip from the sample liquid If any liquid remains on the tip exterior wipe it with aKimwipe taking care not to touch the tip opening OR drain it by touching the containerrsquos side
8 To dispense the sample depress the plunger slowly to the second stop Always assess that allthe liquid has been dispensed before removing your pipettor (viscous solutions may take severalseconds to be completely expelled from the pipette tip)
(2) DILUTIONS
Please read Appendix I Concentration and Dilution before coming to lab In this exerciseyou will be making a series of dilutions of a 2 mgml bovine serum albumin (BSA) stock solutionusing Tris buffer These dilutions will provide your protein concentration standards which youwill use to determine the concentration of a protein solution of unknown concentration so accuracyis important Serum albumin is an important transport protein in all mammals acting as a carrierfor several substances in the blood most notably fatty acids BSA in particular is frequentlyused as a source of protein for concentration standards as it can be effectively isolated from asource that is both abundant and readily available (cow serum) and is therefore less expensive
(3) UVVIS SPECTROSCOPY
Please read Appendix II Spectroscopy on spectroscopic principles UVVis spectroscopy isa very valuable biochemistry laboratory tool for assaying directly or indirectly the concentrationand concentration changes of various biomolecules Using enzyme proteins as an example theconcentration changes of substrate or product molecules in the presence of the enzyme provideimportant data about the enzymersquos activity We will use UVVis spectroscopy to do this type andother types of measurements in several experiments this semester so to understand what we willbe doing later it is important for you to become familiar with the principles involved now
We will be using Cecil spectrophotometers in these and other experiments throughout the semesterTherefore you will want to use today to learn how to use the instruments in preparation for otherexperiments during the semester The software-spectrophotometer interface is Windows based andfairly intuitive You will have opportunity to ask questions following a brief demo of theinstrument and the instructor and laboratory assistant will be able to help you if questions arisefrom your efforts to learn about the instrument
10
BRADFORD ASSAY
The Bradford spectrophotometric assay (Bradford MM 1976) provides for the indirectmeasurement of protein concentration in solution and is a commonly used method In fact youmay have already used it but if not you will use it today and in later experiments this semester
As an indirect measurement of protein concentration the Bradford spectrophotometric assay doesnot measure the light absorbed directly by the protein in solution Rather the assay measures thelight absorbed by a specific dye that absorbs more of certain wavelengths of light (and less ofothers) when bound to proteins then when it is not In simple terms the physical interaction of thedye and protein in solution results in an observable change in color This assay is an example of adye-binding assay and as such its fidelity in measuring protein concentration is dependent uponthe physical and chemical conditions influencing the interaction between protein and dye
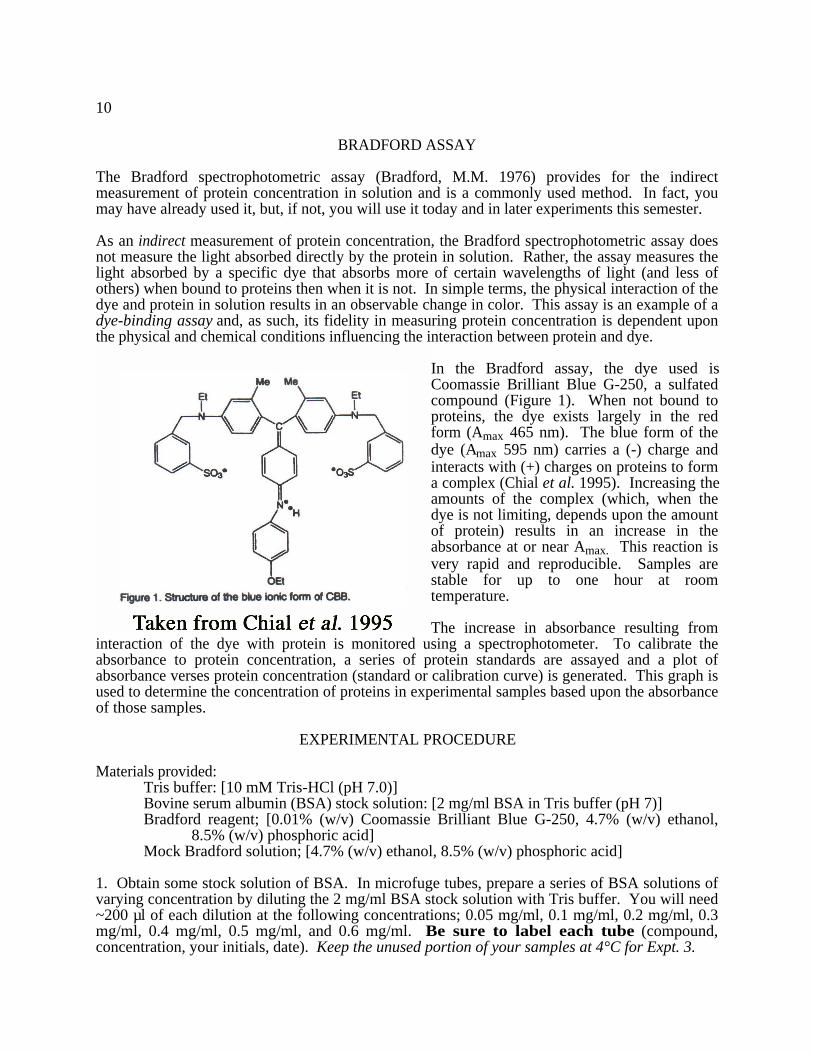
In the Bradford assay the dye used isCoomassie Brilliant Blue G-250 a sulfatedcompound (Figure 1) When not bound toproteins the dye exists largely in the redform (Amax 465 nm) The blue form of thedye (Amax 595 nm) carries a (-) charge andinteracts with (+) charges on proteins to forma complex (Chial et al 1995) Increasing theamounts of the complex (which when thedye is not limiting depends upon the amountof protein) results in an increase in theabsorbance at or near Amax This reaction isvery rapid and reproducible Samples arestable for up to one hour at roomtemperature
The increase in absorbance resulting frominteraction of the dye with protein is monitored using a spectrophotometer To calibrate theabsorbance to protein concentration a series of protein standards are assayed and a plot ofabsorbance verses protein concentration (standard or calibration curve) is generated This graph isused to determine the concentration of proteins in experimental samples based upon the absorbanceof those samples
EXPERIMENTAL PROCEDURE
Materials providedTris buffer [10 mM Tris-HCl (pH 70)]Bovine serum albumin (BSA) stock solution [2 mgml BSA in Tris buffer (pH 7)]Bradford reagent [001 (wv) Coomassie Brilliant Blue G-250 47 (wv) ethanol
85 (wv) phosphoric acid]Mock Bradford solution [47 (wv) ethanol 85 (wv) phosphoric acid]
1 Obtain some stock solution of BSA In microfuge tubes prepare a series of BSA solutions ofvarying concentration by diluting the 2 mgml BSA stock solution with Tris buffer You will need~200 microl of each dilution at the following concentrations 005 mgml 01 mgml 02 mgml 03mgml 04 mgml 05 mgml and 06 mgml Be sure to label each tube (compoundconcentration your initials date) Keep the unused portion of your samples at 4degC for Expt 3
11
2 Add 25 ml of Bradford reagent to a separate test tube or cuvette for each of your samples andlabel them appropriately Consider the value of determining the concentration of one or moredilutions of your unknown sample as well as the undiluted (ldquoneatrdquo) unknown sample Prepareyour samples by adding 50 microl of each protein sample (diluted standard or unknown) separately tothe Bradford reagent in the appropriately labeled tube Mix the tubes by gentle inversion severaltimes and let the color develop for 5 min Observe and record the color change of your standardsamples as a function of protein concentration By comparing your unknown to your proteinstandards determine as closely as you can the concentration of your unknown by eye
3 While the color is developing set up the spectrophotometer Prepare a blank sample by mixing50 microl Tris buffer with 25 ml Bradford reagent and another by mixing 50 microl Tris buffer with 25ml Mock Bradford solution
4 You will need to determine which portion of the UVvis spectrum specifically whichwavelength will be useful for following the dye bound by protein Using your Mock Bradfordblank sample in a plastic cuvette set the background for the spectrophotometer Take a fullspectral scan of your Bradford reagent blank prepared in step 3 When your standard sampleshave fully developed take a full spectral scan of the most concentrated standard you prepared
5 Based on your results chose a single wavelength suitable to analyze the results of your dyebinding assay Measure and record the absorbance of each standard and unknown sample at yourchosen wavelengths using plastic cuvettes These data may be obtained from spectral scans orfrom single wavelength readings In either case you must consider your data in light of thebackground absorbance of your ldquono proteinrdquo sample
6 Prepare a plot of the values of absorbance above background verses protein concentration forthe standard samples and fit the data to a line by linear regression Using the resulting equationfor this line and the value of absorbance above background for unknown sample determine theprotein concentration of your unknown
DATA ANALYSIS
For Expt 1 you are to write a short lab report (see page 7) Using the instructions on pages 5-6prepare a type-written report that includes only the Material and Methods and Results sections plusanswers to the questions below Include all of the data obtained (in a table) a standard calibrationplot figure with relevant equations and the concentration of your unknown protein sample
Questions1 How close was your determination of your unknown protein concentration by eye to thedetermination by Bradford assay What did you learn from this exercise
2 How appropriate is BSA as a concentration standard protein considering standard calibrationplots are often used to determine the concentration of proteins other than BSA (see Chial et al)
3 If you measured the concentration of a dilution of your unknown sample what did you learnfrom this measurement
References Bradford MM (1976) Anal Biochem 72 248-256
Chial HJ Congdon RW and Splittgerber AG (1995) J Chem Ed 72 76-79
12
EXPERIMENT 2 Amino Acid Composition of a Dipeptide
Much can be learned about a protein or peptide by determining its amino acid composition (andsequence) To determine the amino acid composition all peptide bonds in a purified protein mustbe cleaved (either enzymatically or with strong acid or base) and the individual amino acids must beseparated identified and quantified Thus there are three aspects to this type of experiment 1)the reaction chemistry 2) the separation of the reaction components and 3) the assay oranalysis of the outcome (identificationquantification)
For the reaction chemistry of this experiment we will be using enzymatic hydrolysis ofpeptide bonds This approach is advantageous because acid hydrolysis tends to destroy someamino acids There are many enzymes collectively called proteases or peptidases that cleavepeptide bonds Some are endopeptidases in that they cleave internal peptide bonds others areexopeptidases in that they cleave N- or C-terminal peptide bonds In this experiment we will usethe enzyme carboxypeptidase A which cleaves C-terminal peptide bonds to cleave the onepeptide bond present in a purified dipeptide of unknown amino acid composition
The reaction chemistry of our experiment depends on the activity of an enzyme preparation(presumable highly purified) Because enzymes are labile molecules and can lose their activity (iewhen they denature) we will adopt an experimental strategy that implicitly reveals the status of ourenzymersquos activity along with the experimental result We will utilize a comparative approach byseparating and assaying dipeptide ldquotreatedrdquo and ldquountreatedrdquo with enzyme We expect that theenzyme activity will result in a change to the treated dipeptide By including the ldquountreatedrdquoreaction as a control we would observe no change if the enzyme activity were lost or absent
The separation of molecules of interest from uninteresting ones is a fundamental tool tobiochemical research In this experiment separation of amino acids will be done using simplepaper chromatography to illustrate general principles of separations All chromatographictechniques are based on the principle that the solute of interest partitions in a characteristic waybetween a stationary phase and a mobile phase The mobile phase (a gas or liquid) moves thesample solute through a region containing the stationary phase (a liquid or solid) The theory andpractice of paper chromatography are very similar to those of thin-layer chromatography (TLC)which you used in Organic Chemistry lab In paper chromatography a piece of paper composedof cellulose is extensively hydrated so solutes (amino acids here) partition between theimmobilized water (stationary phase) and the solvent used to run the chromatograph (mobilephase) We will see additional application of the principles of this fundamental tool ofbiochemistry in the separation and purification of an enzyme protein in Expt 3
The assay of our experimental outcome involves the identification of the amino acids (we willnot be quantifying the results of this more qualitative experiment) The first step in identification ofthe amino acids involves their detection Detection of amino acids is accomplished by treating thepaper with ninhydrin which turns purple upon binding the free primary amino groups of aminoacids Consult your organic chemistry textbook to review the reaction chemistry of ninhydrinAssigning an identity to each unknown amino acid is accomplished by including on thechromatograph samples containing a known amino acid and comparing the relative mobilities ofsolutes in your unknown sample with those of known standards The relative mobility of amolecule is indicated by the Rf value
Rf = Distance (origin to sample spot) divide Distance (origin to solvent front)
Rf values vary with solvent type of stationary support (eg cellulose silica gel) and temperature
13
EXPERIMENTAL PROCEDUREMaterials provided
Enzyme buffer [25 mM Tris-HCl (pH 75) 500 mM NaCl]Unknown dipeptide [2 mgml in enzyme buffer]Carboxypeptidase A (500-1000 unitsml)10 M acetic acidAmino acid standards [1 mgml in enzyme buffer]Whatman 3MM chromatographic paper 20x20 cmChromatographic solvent [6040 acetonitrile01 M ammonium acetate] and jar or chamberNinhydrin solution [02 ninhydrin in ethanol]
1 Set up three tubes First in each of two microcentrifuge tubes place 100 microl of unknowndipeptide solution To one of these tubes add 5 units carboxypeptidase A and to the other tubeadd a volume of enzyme buffer equal to the volume of enzyme added to the first tube As a controlfor amino acids contributed from the enzyme source place 100 microl of enzyme buffer in a tube andadd 5 units of carboxypeptidase A Mix all tubes gently by tapping them with your fingerIncubate for one hour at 37degC in a water bath
2 For the following step wearing laboratory gloves Amino acids deposited on yourchromatography paper from the skin of your fingers are abundant enough to be detected byninhydrin as fingerprints (this is used in forensic science) Prepare a piece of Whatman 3MMpaper for chromatography Lightly mark the origin 2 cm from one edge (the bottom) of the paperwith a pencil Indicate with dots where each sample and standard will be loaded onto the paper atthe origin keeping the dots at least 15 cm apart You will need 4 lanes for your sample and onelane each for each of the amino acid standards Label each dot Also prepare the solvent chamberby adding enough solvent to reach 1 cm height in a large glass jar or plate chamber Close the lidso that the solvent vapor and liquid phases equilibrate
3 Add 50 microl 10 M acetic acid to all three tubes including the reaction tube and the control tubesMix Acetic acid stops the enzyme-catalyzed reaction and causes the enzyme to precipitate
4 Spin each tube in the microcentrifuge for 10 min at 3000 rpm to pellet any precipitate
5 Carefully remove 50 microl of the supernatant from each tube taking care not to disturb any pelletat the bottom of the tube
6 Load 2 microl of each amino acid standard Based on the amount of standard used determine abouthow much unknown sample you will need Load two different amounts of each unknown sample(plusmn enzyme) to the paper separately at two dots Let loaded samples air-dry briefly
7 Roll the paper into a cylinder and staple the edges taking care not to let the edges touch if usinga large jar This is easier if one person holds the paper in a cylinder and another staples Securepaper to insure it remains upright if you are using a plate chamber Make sure the solvent inthe chromatography chamber is below the origin on the paper then drop the paper intothe solvent chamber Let the chromatograph run for approximately 1 hour or until the solventfront is 1-2 cm from the top of the paper
8 Remove the paper from the chamber quickly but carefully remove the staples and mark thesolvent front lightly with a pencil Let the solvent air-dry When dry spray evenly with ninhydrinsolution in the hood The paper should be damp but not dripping with ninhydrin solution Placethe paper upright in the oven at 110degC until the purple spots develop (~ 15 minutes)
14
9 Calculate Rf values for the standards and unknown sample If the spots are broad measurefrom the middle of the spot
DATA ANALYSIS
For Expt 2 you are to write a short lab report (see page 7) Using the instructions on pages 5-6prepare a type-written report that includes only the Material and Methods and Results sections plusanswers to the questions below Include all of the data obtained (Rf values in a table) and theamino acid composition of your unknown dipeptide sample
1 Look up the substrate specificity of carboxypeptidase A You might find this in one or more ofthe books on enzymes in the library another biochemistry text or on web resources Could youuse this enzyme to cleave the C-terminal peptide bonds of any peptide Explain your reasoning
2 Can you determine or predict the amino acid sequence of your dipeptide How could youchange this experiment to determine the sequence of these two amino acids in the dipeptide
15
EXPERIMENT 3 Purification of AMP Aminohydrolase
In Expt 2 you learned that the separation of molecules from each other is a fundamental tool usedin biochemical research Separations can be employed for analytical purposes (as in Expt 2)which often involve small amounts of material or for preparative purposes which involve largeramounts of material and aim to recover relatively pure molecules for additional study Inbiochemistry a common goal for employing separation techniques is the purification of a proteinof interest for preparative purposes This is a daunting task The development of a successfulprocedure for purifying the protein of interest from the hundreds of other proteins in the startingmaterial often requires trying a series of some of the variety of separation methods in differentorders andor combinations Each separation method generally exploits a specific physicalproperty of the protein of interest that ideally is not shared with too many other proteins in thestarting material In an effective purification the relative purity of the desired protein is increasedby combining two or more separation methods each of which generally exploits a differentphysical property of the protein With each additional step however the final amount of proteinrecovered generally becomes less
Effective protein purification usually requires at least one column chromatography separation Thegeneral principles of chromatographic techniques were introduced in Expt 2 Remember allchromatography is based on the principle that the solute of interest partitions in a characteristic waybetween a stationary phase and a mobile phase The mobile phase (a liquid in this experiment)moves the sample solute (protein of interest) through a region containing the stationary phase (asolid resin in this experiment) The type of chromatography used in this experiment is calledaffinity chromatography as it exploits the high binding specificity and affinity the desired proteinhas for the stationary phase The binding of the protein of interest to the stationary phase has thepotential to very effectively remove it from the hundreds of other proteins in the mobile phase Ifno other proteins in the starting material share the affinity the desired protein has for the stationaryphase affinity chromatography can very powerfully permit complete purification
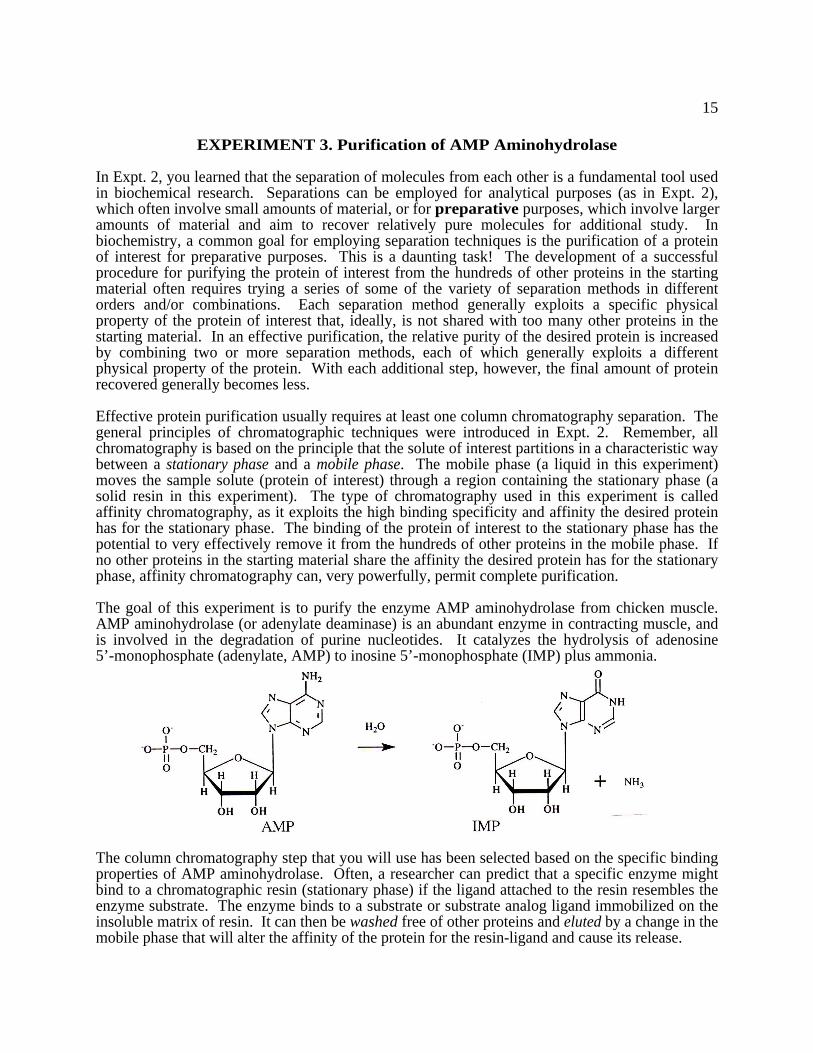
The goal of this experiment is to purify the enzyme AMP aminohydrolase from chicken muscleAMP aminohydrolase (or adenylate deaminase) is an abundant enzyme in contracting muscle andis involved in the degradation of purine nucleotides It catalyzes the hydrolysis of adenosine5rsquo-monophosphate (adenylate AMP) to inosine 5rsquo-monophosphate (IMP) plus ammonia
The column chromatography step that you will use has been selected based on the specific bindingproperties of AMP aminohydrolase Often a researcher can predict that a specific enzyme mightbind to a chromatographic resin (stationary phase) if the ligand attached to the resin resembles theenzyme substrate The enzyme binds to a substrate or substrate analog ligand immobilized on theinsoluble matrix of resin It can then be washed free of other proteins and eluted by a change in themobile phase that will alter the affinity of the protein for the resin-ligand and cause its release
16
The resin used in this experiment is phosphocellulose which contains a high number ofnegatively-charged phosphate groups attached to cellulose It is most frequently used as a resin forion-exchange chromatography However since AMP aminohydrolase binds to the substrateAMP which contains a negatively-charged phosphoryl group one might predict that it will alsobind to this resin If it binds to this substrate analog one might predict that the enzyme could beeluted by pyrophosphate (PPi) (an inhibitor of the enzyme) which decreases the affinity of theenzyme for its substrate (AMP) Pyrophosphate also partially mimics the phosphate groupsattached to the cellulose resin In this experiment you will characterize the effectiveness ofphosphocellulose as a matrix for affinity purification of chicken muscle AMP aminohydrolase
EXPERIMENTAL PROCEDURE
As biochemical purification is often fairly extensive Experiment 3 will be done over the course ofthe next three weeks In the first week you will prepare the protein extract from chicken muscleand chromatography resin and run a brief exercise intended to familiarize you with the Pharmaciachromatography system we will be using in the second week In the second week you willassemble and run the chromatography system to purify (hopefully) AMP aminohydrolase fromyour chicken muscle extract This week concludes with assaying the fractions you collect from thecolumn for enzyme activity pooling those of highest activity and dialyzing them to remove thepyrophosphate eluant from your purified enzyme sample In the third week you will assay themajor fractions of the purification for protein concentration and enzyme activity to help assess themethod You will also analyze these same fractions by sodium dodecyl sulfate-polyacrylamide gelelectrophoresis (SDS-PAGE) to assess relative complexity of the proteins in each sample and therelative purity and molecular weight of AMP aminohydrolase (see Appendix VI)
Week 1
This week your working group will be divided to provide a representative to a task groups thatwill accomplish the three tasks of this week preparation of chicken protein extract preparation ofchromatography resin and preparation for using the chromatography system next week As yourworking groups representative to one of this weekrsquos task groups it will be your responsibility tobecome involved in the task learn all that is necessary to do it independently and report back toyour group what you learned Your working group partners will share a similar responsibility toexplain to you how to do what they learned to do
Materials providedChicken breast muscle (from the local grocery store)Extraction buffer [018 M KCl 54 mM K2HPO4 32 mM KH2PO4 (pH 65)]Waring blender250 ml centrifuge bottlesFunnelGlass woolOakridge 40 ml screwcap polypropylene centrifuge tubesPhosphocellulose resin pre-swelled in dH2O overnightBasic resin wash solution[005 M NaOH 05 M NaCl]Acidic resin wash solution [01 M HCl]Glass columnsBuffer A [25 mM TrisHCl (pH 81)]Buffer B [25 mM TrisHCl (pH 81) 500 mM NaCl]protein standards [015 mgml equine myoglobin 038 mgml conalbumin 046 mgml
chicken albumin 038 mgml soybean trypsin inhibitor 25 mM TrisHCl (pH 81)]
17
CAUTION To prevent proteolysis and preserve enzyme activity keep all enzymefractions and all solutions at 4degC (in the refrigerator or on ice) as much aspossible during extraction and purification Carefully label all your samples
PREPARATION OF CHICKEN BREAST EXTRACT - Extract preparation will be done in batchand will be the responsibility of a group of four that includes one member of each working group
1 Quickly cut up one partially thawed chicken breast into small pieces (1 cm) Place 50 g in aWaring blender and homogenize with 200 ml of cold extraction buffer at high speed with five 15-sec bursts Make sure the blender lid is on tight Immediately pour homogenate into prechilled250 ml centrifuge bottles and keep on ice
2 Important balance centrifuge bottles to equal weights using Harvard Trip balanceCentrifuge the homogenate at 6000 x g (check specifications for rotor used) for 15 min at 4degC
3 Pour the supernatant through a funnel with a ldquofilterrdquo of glass wool into a beaker on ice Discardthe pellet Record the volume of filtrate and aliquot an equal volume into four polypropyleneOakridge tubes Seal screw cap and store tubes in the -20degC freezer until next week
PREPARATION OF PHOSPHOCELLULOSE RESIN AND COLUMN (adapted from directionsof Sigma Chemical Company) - The resin preparation will done as a batch and will be theresponsibility of a group of four that includes one member of each working group
1 Obtain the pre-swelled phosphocellulose resin (3 g = ~20 ml wet resin) and decant water
2 Add a volume of water 5 times that of the wet resin stir and allow to settle for 30-45 minutesWhen most of the resin is settled decant Record the resin volume
3 Suspend resin using 5 times the resin volume of basic wash for 10 min Pour slurry into acourse scintered glass funnel under gentle suction (~1 resin volume5 min) Continue until all ofthe slurry has been added and follow with a wash of 5 times the resin volume of deionized water at1-5 resin volumesmin
4 Use acidic wash to resuspend resin and remove it from the funnel Soak in a total of 5 times theresin volume of acidic wash for 10 min Pour slurry back into the course scintered glass funneland wash with 10 times the resin volume of water until flow-through shows a pH of ~5
5 Wash with 5-10 times the resin volume of extraction buffer until the pH of the flow-throughreaches that of extraction buffer (~ 65) Resuspend in extraction buffer and transfer to a beaker
6 Allow the resin to settle and decant all but one resin volume of buffer
7 (To be done by working group) Mix resin and buffer into a slurry (it will be 11 resinbufferslurry see step 6) and measure a volume of slurry equal to twice the amount of resin bed (gt 2 ml)desired in your column Dispense into your column cap and store at 4degC Record bed volume
18
PREPARATION FOR USING THE PHARMACIA PUMP AND COLLECTOR SYSTEM -Becoming familiar with how to use the peristaltic pump and fraction collector in preparation fortodayrsquos chromatography exercise will be the responsibility of a group of four that includes onemember of each working group The exercise itself is to be done by each working group
1 Identify how to assemble the tubing column and fraction collector and become familiar with itsplumbing and operation Determine how to make a two solution gradient (see instructordemonstration)
2 Once assembled as a working group instruct your group on what you have learned about theequipment you will be using for column chromatography
3 (As a working group) Fill the system line with buffer and eliminate air bubbles Set flow rate tobe constant at about 15 mlmin
4 Attach the ion exchange column to the system line and wash the column removing any air fromtubing with buffer A
5 Before starting set your fraction collector to begin collect 3 ml samples
6 Place inlet tubing into your protein standards solution without introducing any air (a slightsqueezing of the tubing can help achieve this) Run the pump until about 2 ml of your sample hasentered the tubing
7 Pause the pump and transfer the inlet tubing to buffer A Avoid introducing any air Run thepump for about two minutes
8 Pause the pump and transfer the inlet tubing to the gradient buffer set up without introducingany air Run the pump for 10 minutes
9 Pause the pump and transfer the inlet tubing to buffer B Avoid bubbles Run the pump for 6minutes
10 Pause the pump and transfer the inlet tubing to buffer A Avoid bubbles Run the pump for 6minutes
11 Determine the amount of protein in each of your fractions by either direct absorbance orthrough use of the Bradford assay (see Expt 1)
12 Plot the protein concentration or absorbance as a function of fraction number Assess theseparation of the various proteins in the standard mixture
19
Week 2
This week you will work with your working group and you will have a lot to do so preparationwill be especially helpful You will prepare your chromatography system for your purificationmethod and prepare the system by filling the line with the correct initial buffer You will assemblethe column-flow adaptor assembly and attach it in line with the chromatography system You willprepare and apply your sample to the chromatography system running a sequence of buffers toisolate and purify (hopefully) AMP aminohydrolase from chicken muscle extract Finally you willassay and determine which fractions have the highest enzyme activity pool and dialyze them(overnight) to remove the pyrophosphate eluant from your purified enzyme sample
Materials providedExtraction buffer [54 mM K2HPO4 32 mM KH2PO4 018 M KCl (pH 65)]Column wash buffer [045 M KCl 25 mM MES (pH 65) 1 mM 2-mercaptoethanol pH
adjusted with solid Tris]Pyrophosphate elution buffer [25 mM potassium pyrophosphate in column wash buffer]Flow adaptorFraction collection test tubesSubstrate buffer [015 M KCl 50 mM MES (pH 65) pH adjusted with solid Tris]Assay solution [5 mM AMP in assay buffer]SpectrophotometerDialysis tubing or cassettesDialysis buckets stir bars and stir plates
SAMPLE PREPARATION - As this takes a while and should not be rushed you will want to startthis at the beginning of the lab
1 Completely thaw chicken protein extract of week 1 on ice
2 Check balance of centrifuge tubes to insure or adjust to equal weights using Harvard Tripbalance Centrifuge the homogenate at 6000 x g (check rotor specifications) for 15 min at 4degC
3 Remove supernatant to new tube on ice Measure the extract volume and retain 05 ml aliquotin a microcentrifuge tube for analysis of activity
COLUMN PREPARATION - While your extract is thawing prepare your column
1 Fill the column with excess cold extraction buffer and allow several tens of milliliters to flowthrough to settle the resin bed further (gravity only goes so far)
2 Make sure there is ample extraction buffer in the column tube (5 times resin bed) and allow anyresin to settle that might have been disturbed during column filling
3 Fit the flow adaptor to the column taking care to avoid and eliminate bubbles (See demo)
SYSTEM PREPARATION - While the extract is being prepared assemble the Pharmacia pumpand collector system for purification of AMP aminohydrolase
1 Completely fill tubing with buffer to be used ie extraction buffer and purge system of air
2 Make sure column-flow adaptor lines are filled with extraction buffer and free of air
20
3 Install the column-flow adaptor assembly in the system avoid bubbles upstream of the column
4 Run extraction buffer slowly through the system for several minutes to purge any airdownstream of column and to test for any problems
5 Prepare a separate beaker with column wash buffer
6 Prepare apparatus to create a two-buffer gradient of column wash buffer and pyrophosphateelution buffer
RUNNING THE SYSTEM - As a group review from week 1 the operation of thechromatography system and the volume of your column resin bed (arbitrarily defined as 1 columnvolume or CV) Determine a desirable flow rate Using the guidelines below discuss yourseparation strategy and prepare a plan for your separation Remember you have a single inlet lineso think about the different solutions you need to have on hand to achieve the outcome you desire(ie you will need to move the inlet line between different buffers) Check your plan with theinstructor or a teaching assistant before beginning
1 Prepare your plan to use the pump for five steps using your selected flow ratea - Load extract (in extraction buffer) into system measurerecord the extract volumeb - Extraction buffer wash should be 5 CVs minimumc - Column wash buffer wash should be 5 CVs minimum The A280 of your post-columnflow should be 001 or lower if you have washed your column sufficiently well If notyou may wish to extend your wash step before eluting the column d - Gradient (0-15 mM PPi) elution step using column wash buffer and elution buffer(column wash buffer containing 25 mM potassium pyrophosphate 2-4 CVs)e - Final wash with column wash buffer to complete protocol 5 CVs
2 Set inlet line into protein extract (on ice) and start (run) the pump and collector
Note on loading extract volume Because the pump system is not precisely calibrated youmust measure initial and final volumes to determine the exact volume delivered to the column resinWatch during your extract loading to insure that you do not run out of extract or have too much leftunloaded before the second step IF you have protein extract that remains unloaded measure thevolume remaining It will be important to subtract this amount from the initial volume youintended to load or you will overestimate the enzyme activity exposed to the column
If it appears you will run out of extract PAUSE the pump Switch the inlet line to thenext buffer and resume the separation If it appears you will have too much unloaded extractcontinue running the pump to load what you want but be sure to make a record of the amountloaded Once it is adequately loaded PAUSE the pump to switch the inlet line to the next buffer
3 Pause the pump and switch the inlet line to the other buffers or gradients at the appropriate timesas per your plan Run steps for the times planned given the pump flow rate you determined
Note on pausing to switch buffers Stop the pump to move the inlet line to a new buffervessel which will prevent the introduction of air to your column If necessary squeeze theflexible pump tubing to extrude air before placing the inlet tube opening into a new buffer
21
3 Operate the fraction collection using a strategy that will separate your enzyme from othersa - Extract flow-through Using large fractions is convenient for collecting all of yourextract flow-through (post-resin extract) but you will need to use smaller fractions toobtain a small but enriched sample of purified enzyme Thus you may wish to changefraction size during your collection If your extract flow-through exists as more than onefraction pool these to create your ldquoflow-throughrdquo fraction and for analysis As the extractwill take some time to get through the system and to the fraction collector you can delaythe start of your collection appropriately In addition it will take some time for the extractin the system line to pass entirely through the system once you begin the first wash step soyou should not stop collecting when the first wash begins Overall it would be better toget all your flow-through extract and have some extra extraction buffer dilute your flow-through than to recover only part of your flow-throughb - Wash flow-through Collect the protein eluted with high salt column wash buffer(optional) This will allow you to assess if any of the enzyme activity is washed off withthis buffer change You can also check absorbance to see if you have washed enoughc - Elution of column Collect several and smaller fractions during the elution to captureand fractionate all of your sample The less volume you use for the elution the smaller thevolume you want these fractions to be Remember there is a time lag between application ofyour gradient and when it reaches the resin but here it doesnrsquot hurt to collect a few extrafractions before and after the program time of the elution to insure that you recover all ofthe interesting fractions
Note on chilling fractions collected As soon as physically possible label and place on iceeach fraction tube collected from the program method This preserves enzyme activity One wayto doing this is to set an ice bath in the collector tube holder itself Alternatively you may placetubes into an ice bucket
4 Record the results from your separation attempt (not just the method plan)
SYSTEM AND COLUMN CLEAN UP -
1 When the program is finished remove the column from the system line and clean the system bypurging distilled water through the lines extensively for several minutes Excessive washing iscritical to avoid clogging the fraction collector dropper When the system is adequately washeddisassemble the pump head leaving the inlet lines in distilled water and turn the system off
2 The column-flow adaptor assembly can be disassembled and the resin mixed into a slurry anddecanted to a ldquowasterdquo beaker Both the column and flow adaptor should be rinsed extensively withdistilled water and placed aside to dry
POST-SEPARATION ACTIVITIES - You will need to do several things once completed
1 Pool extract ldquoflow-throughrdquo fractions mix and measure the total flow-through volumeAliquot a sample to a microcentrifuge tube on ice
2 Measure and record the volumes of the extract loaded on the column (Vinitial - Vremaining) and theflow-through obtained afterward if you have not already
3 Perform the enzyme assay on the aliquot of protein extract and pooled flow-through fractionsas well as each of the elution fractions (and the column wash buffer fraction(s) if this was done)and the mixture of pooled elution fractions as directed below
22
4 Freeze the remainder of the extract and flow-through aliquots for determination of proteinconcentration and electrophoresis next week See below for treatment of the elution fractions
ENZYME ASSAY OF COLUMN FRACTIONS - Please read APPENDIX II Spectroscopyand review the use of the Beerrsquos-Lambert law before doing the following AMP aminohydrolaseactivity is determined by recording the change in absorption at 265 or 290 nm due to the differencebetween the spectra of AMP and IMP both of which absorb UV light There is much moreabsorption at 265 nm than at 290 nm In fact at high concentrations of AMP the level of A265 istoo high for the spectrophotometer to detect a change upon addition of enzyme Therefore at high[AMP] (greater than 02 mM) measure the initial increase in A290 per minute and divide by afactor of 012 (the difference in extinction coefficients of AMP and IMP) At low [AMP] (lowerthan 02 mM) measure the initial decrease in A265 per minute and divide by a factor of 876
1 Transfer exactly 1 ml of assay solution (5 mM AMP is saturating substrate) to a quartz cuvetteand zero the absorbance at 290 nm (make sure the solution is at room temperature)
2 Add an aliquot of enzyme fraction (10-25 microl) rapidly mix and record the increase in A290 forseveral minutes (or until it becomes non-linear) Make sure you use the same volume of enzymefrom each elution fraction so that you can compare the amount of activity in each fraction
3Determine the initial linear rate (∆Amin) and convert to enzyme activity [unitsml sample =∆Amin(012 x ml sample)] where one unit = 1 micromolmin substrate hydrolyzed in 1 ml assaymixture Use the volume of enzyme fraction added in the denominator to determine its activity
DIALYSIS OF PURIFIED ENZYME SAMPLE - Please read the section on dialysis in AppendixIV Enzymology before starting this portion of the experiment
1 Pool the major enzyme-containing fractions from the phosphocellulose column and mix gentlyMeasure and record the volume
2 Assay the enzyme activity using an aliquot of the pooled fractions and record the result
3 Remove an aliquot of the pooled fractions to a microcentrifuge tube label and freeze Thissample will be included in the Bradford assays you will be doing next week and serves to helpyou assess if there is any protein loss during dialysis
4 Wearing gloves place a dialysis cassette into column wash buffer to soak 1 minuteIntroduce the pooled fractions into the cassette using a syringe alternate introducing some samplewith removing some air After all sample has been introduced remove all air from the cassette
5 Insert cassette into a floatation aid and dialyze overnight at 4degC (in the cold room) against thewash buffer to remove pyrophosphate This should be done with gentle mixing using a stir barand a stir plate
6 (THE NEXT DAY) Remove the dialyzed sample (dialysate) from the cassette using a syringealternate removing some sample with introducing some air To avoid bacterial contaminationhowever make your sample 002 sodium azide Store at 4degC the pure dialyzed enzymeshould be stable for several weeks at 4degC
23
Week 3
This week you will work with your working group You will assay the major fractions of thepurification for protein concentration and enzyme activity to help you assess the method You willalso analyze these same fractions by sodium dodecyl sulfate-polyacrylamide gel electrophoresis(SDS-PAGE) to assess relative complexity of the proteins in each sample and the relative purityand molecular weight of AMP aminohydrolase
Materials providedSubstrate buffer [015 M KCl 50 mM MES (pH 65) pH adjusted with solid Tris]Assay solution [5 mM AMP 015 M KCl 50 mM MES (pH 65) pH adjusted with solid
Tris]SpectrophotometersTris buffer [10 mM Tris-HCl (pH 70)]Bovine serum albumin (BSA) stock solution [2 mgml BSA in Tris buffer (pH 7)]Bradford reagent [001 (wv) Coomassie Brilliant Blue G-250 47 (wv) ethanol
85 (wv) phosphoric acid]Pre-poured SDS-polyacrylamide gel (75 acrylamide)10X reservoir buffer [1 SDS 05 M Trizma Base 19 M glycine] Dilute 110 for use5X Gel Loading Buffer (blue juice) [100 mM Trizma Base 325 SDS 50 glycerol17 mgml bromophenol blue] Add szlig-mercaptoethanol just before use to 25 (vv) finalconcentration Use the hood it stinks Dilute 5-fold for useGel Stain [04 mgml Coomassie Blue R250 40 (vv) methanol 5 (vv) acetic acid]Gel Destain [10 methanol 15 acetic acid]MicrocentrifugeProtein gel electrophoresis apparatus and power supply
DATA COLLECTION FOR PURIFICATION TABLE
1 Assay as before your pooled dialyzed enzyme fraction and all purification fractions not yetassayed (crude extract flow-through and pre-dialysis elution pool) for enzyme activity
2 Assay all purification fractions for protein concentration using the Bradford assay (25 mlBradford reagent + 50 microl protein sample - Expt 1) Remember to generate a standard curve
SDS-POLYACRYLAMIDE GEL ELECTROPHORESIS - Please read Appendix VI SDS-PAGE before starting this part Each lab group should obtain and use or plan to share one pre-poured minigel (75 resolving gel with no upper stacking gel) to analyze their proteins
1 Prepare molecular weight standards and your four protein samples (1-crude extract 2-flow-through from column 3-pooled dialyzed enzyme fraction 4 - protein mass standards)Determine the volume of protein sample necessary to load 5 microg of each onto the gel as well as thatfor ~3 microg of SDS-PAGE molecular weight standards For concentrated samples it may benecessary for you to make a dilution in order to accurately pipet the desired amount For eachsample aliquot the determined volume into its own microfuge tube Add to each sample a volumeof 5X Gel Loading Buffer equal to one fourth the volume of the sample aliquot Make sure freshszlig-mercaptoethanol has been added to the 5X buffer Heat samples for 5 min in a boiling waterbath Note heating samples with szlig-mercaptoethanol denatures and reduces all proteins
NOTE The final volume of each sample need not be the same but it is best if it is 10-30 microl Thegel wells hold gt30 microl and small samples (lt10 microl ) may evaporate upon heating Adjust as needed
24
CAUTION UNPOLYMERIZED ACRYLAMIDE IS A NEUROTOXIN ALWAYSWEAR PROTECTIVE GLOVES WHEN WORKING WITHACRYLAMIDE GELS
2 Put on a pair of disposable gloves Place gel plate into the electrode assembly and assembleUse a buffer dam if only one gel is being run Pour 1X reservoir buffer into upper buffer chamberformed by these two plate holders Make sure no buffer leaks out If it does reassemble theapparatus If the upper buffer chamber does not leak fill the lower chamber up to the electrode atthe bottom of the gel(s) Using the pipettor apply each sample and protein standards into aseparate well of the stacking gel Record in your notebook which sample is loaded into each laneIf possible avoid loading sample in the outer lanes of the gel Avoid trapping large bubbles alongthe bottom edge of the gel plates
3 Run the gel at 15 mA (constant current) per gel (30 mA per two gels) After the tracking dyehas reached the bottom of the gel turn the power off Remove the plates and gently pry the platesapart Place gel in stain for 1 hr (or overnight) Wash all parts of the gel apparatus thoroughlywith soap and water and rinse with dH2O
4 (THE NEXT DAY) Transfer gel to destain solution until bands appear and the background isrelatively clear Rinse gel briefly in dH2O (optional 3 glycerol prevents cracking)
5 Dry the gel between two sheets of cellophane (as demonstrated by the instructor)
6 Measure the distance migrated for the protein molecular weight standards and all bands ofinterest See Appendix VI for determination of apparent molecular weight of your purified enzyme
DATA ANALYSIS
For Expt 3 you are to write individually a formal lab report (page 8) This will be handed in firstas a draft and critiqued by me and reviewed by two of your peers Using the instructions onpages 5-6 prepare a formal type-written report Include all of the data obtained specifically afigure of your chromatographic separation a table of the values of enzyme activity in your elutionfractions a table of raw data and corresponding values of enzyme activity and proteinconcentrations of your purification fractions a figure or table or equation for your Bradfordstandards a purification table (see below) a figure of your gel and a figure of the plot for yourprotein molecular weight standards Include in the purification table (see Appendix IVEnzymology) the total volume total amount of protein total units of enzyme activity specificactivity purification factor and percent yield of enzyme in each of the purification fractions(1-crude extract 2-flow-through from column 3-pooled enzyme fraction before dialysis and4-pooled dialyzed enzyme fraction mdash indicate which fractions were pooled in fraction 4) Alltables and figures should have legends and each component of all figures should be clearly labeled
You may report your findings from this experiment as if you are the first group to report thepurification of AMP aminohydrolase from chicken muscle OR as if you have discovered animproved one-step purification for AMP aminohydrolase Also include answers to the questionsbelow in the discussion in your report
25
Questions
1 How pure is the enzyme after phosphocellulose chromatography Is this an effectivechromatographic step to purify this enzyme Identify your criteria
2 What is the molecular weight of a monomeric subunit of this enzyme according to SDS-PAGEWhat is its native molecular weight How many subunits must it have (see APPENDIX VI)
3 How stable is the enzyme Identify your criteria
4 How does its purity compare with commercially available enzymes (Hint consult the Sigma orCalBiochem catalogs) Could this be a potentially lucrative commercial method
5 What do you think accounts for the enzyme activity lost during purification
6 What else did you learn about this enzyme Be specific
Reference Mahn MM and Husic DH (1989) Biochemical Ed 17 94-96
Boosman A and Chilson OP (1976) J Biol Chem 251 1847-1852
26
EXPERIMENT 4 pH Dependence of Fumarase
Enzymes catalyze chemical reactions by changing the rate of a reaction but not its equilibrium Thecatalytic effect of an enzyme is sensitive to the environment in which the enzyme functions Thenative environment for many enzymes is the inside of cells where conditions are establishedmaintained and modulated by cellular mechanisms to control enzymatic activity However once abiochemist has purified an enzyme that is interesting to study (as you have just done in Expt 3)she or he will most often modulate environmental variables likely to affect the activity of theenzyme in vitro This is done for two reasons First sometimes the influence of a certainenvironmental variable on enzyme activity is interesting in and of itself Secondly routineparameters are modified to identify conditions for optimal enzymatic activity in the non-nativeenvironment of a test tube This is done so that a large window of enzymatic activity is available toreveal the profound AND subtle effects of other interesting influences upon enzyme activity
Since most biochemical reactions occur in the aqueous medium of the cell and since manyreactions involve proton transfers pH is a very important variable in an enzyme-catalyzed reactionIn fact biochemist often spend a great deal of time and effort thinking about and testing suitablebuffers to control the effect of pH as a variable in the enzymersquos environment We have both of thepreviously mentioned reasons for understanding pH as an environmental variable We areinterested in the effect pH has on enzymatic activity but we are also interested in learning the pH atwhich the enzyme has optimal activity so that we can use that pH in experiments 5 and 6
In this lab you will explore the effect of pH on the catalytic activity of the enzyme fumarase(fumarate hydratase) Fumarase catalyzes the hydration of fumarate to yield L-malate one ofthe steps in the citric acid cycle
The citric acid cycle is part of the process of cellular respiration which serves to enzymaticallyoxidize the two-carbon fragments resulting from the oxidative breakdown of glucose and fattyacids to CO2 The enzyme catalyzed conversion of fumarate to malate is reversible both reactionsare mediated by fumarase (we will see this in Expt 5) The reaction can be inhibited (we will testthis in Expt 5) The reaction is also stereospecific (we will see this in Expt 6) mdash the enzymedoes not recognize the cis-isomer of fumarate (maleate) or the enantiomer of L-malate (D-malate)
The reaction catalyzed by fumarase can be followed spectrophotometrically because fumarate witha carbon-carbon double bond absorbs strongly in the near-ultraviolet (UV) range malate does notabsorb in this range As fumarate is converted to malate (in the forward direction of this reaction)the absorbance by fumarate in the near-UV range decreases over time Using this assay the rate ofthis reaction is defined in the forward direction as the amount of fumarate used up per unit timeThe rate in the forward direction can also be defined as the amount of malate formed per unit timeTo explore the effect of pH on the activity of fumarase you will use a spectrophotometer tomeasure changes in near-UV absorbance over time to determine the rate of fumarase activity inbuffers at various pH values From these data you will learn something about pH as anenvironmental variable affecting enzyme activity and the optimal pH for fumarase activity
27
To better understand the effect of pH on the activity of fumarase you will need to know about themechanism of fumarase action Fortunately the mechanism of this reaction has already been wellcharacterized (see Weaver and Banaszak 1996) It is an example of general acid-base catalysis(Fig 1) In acid-base catalysis acidic and basic chemical groups from the termini or amino acidside chains of the enzyme donate or accept protons from reactants to make the reactants betterelectrophiles or nucleophiles respectively The fumarase-catalyzed reaction involves a carbanionsubstrate intermediate and acidic and basic groups are required for the generation of thisintermediate The reaction is therefore dependent upon the pH of the surrounding mediumbecause pH affects the ionization state (ie the protonationdeprotonation state) of acidic and basicgroups (remember the Henderson-Hasselbalch equation)
Fig 1 Proposed mechanism of the fumarase-catalyzed reaction at the enzymersquos active site
EXPERIMENTAL PROCEDURE
Materials providedNaH2PO4-H2O (solid) FW 13799Deionized waterpH meter 20 M and 02 M NaOH 20 M and 02 M HCl pH standard solutionsporcine fumarase (Sigma F1757) [~ 005 mgml fumarase in 1 mM phosphate (pH 7)]fumarate stock solution [6 mM fumarate in 1 mM phosphate (pH 7)]
In this experiment you are responsible for planning and preparing a series of phosphate solutionsof the same concentration but with various pH values using sodium phosphate salt and water asyour starting materials In making your solutions you will need sufficient volume to adjust the pHusing a pH meter but you should avoid making a huge excess It is best to bring solutions tovolume after adjusting the pH to help attain desired phosphate concentrations Thus it isadvantageous to carefully plan your solution making Once you have them made you will usethese solutions to spectrophotometrically assay the rate of the fumarase-catalyzed reaction as afunction of pH Appendix II Spectroscopy and Appendix III Buffers are recommendedreading for lab preparation (Note that phosphate does not buffer well at all pHrsquoes)
28
1 Prepare 18 mM sodium phosphate (NaH2PO4-H2O) buffers over a seven pH unit range Thinkand plan carefully about how best to make this series of buffers Feel free to check yourcalculations with the instructor before making the buffers You will need approximately 2 ml ofeach buffer in this experiment per group more if you make mistakes Consider coordinatingbuffer preparation with other groups (~2 buffersgroup) so that you do not make excess buffer
2 Using the provided 6 mM fumarate stock solution prepare by dilution at least 2 ml of a 1 mMfumarate solution using each of your phosphate solutions separately as diluent
3 Set the spectrophotometer to measure absorbance at 260 nm Zero the absorbance withphosphate solution using a quartz cuvette (4 mm x 10 mm) Remove the solution and carefullyadd 990 microl of fumarate solution to the cuvette The fumarate in this solution should show a strongabsorbance at 260 nm in the absence of enzyme To determine the reaction rate
a) remove the cuvette from its holder and add 10 microl of fumarase to the cuvetteb) quickly cover the cuvette with the white plastic lid and mix by inverting the cuvette twicec) replace the cuvette and record the absorbance over time until the slope levels
The mixing should be done carefully and as rapidly as possible Obtain two measurements ofabsorbance over time at each pH Record the slope for the initial linear range of the reaction
DATA ANALYSIS
After completing the laboratory you are to turn in an analysis of your data (a table with all of thedata (table of rates) and a plot of the pH dependence) plus brief answers to the questions below
Using the slope value for the initial linear range of a spectrum calculate the change in substrateconcentration over time (ie ∆[fumarate]min is the rate of the enzyme-catalyzed reaction) at eachpH using the Beerrsquos-Lambert law Use the extinction coefficient of fumarate at 260 nm (ε260 =900 M-1cm-1) and report your final answers in micromol fumaratemin (convert from ∆Amin) If youare unsure how to do this calculation consult Appendix II Spectroscopy Plot the log of therate of the reaction versus pH (pH is a log scale) Determine the optimal pH range for the enzyme
1 What is the pH optimum for fumarase What would be a good buffer for the fumarasecatalyzed reaction (see Appendix III) Explain
2 Biochemists often mix mono- and di-sodium phosphate solutions to prepare phosphate bufferswith a specific pH What disadvantage does that approach have over the one you used for thisexperiment
3 What are possible explanations for the pH dependence of fumarase based upon the enzymescatalytic mechanism (see reference) Which amino acids may contribute acidic or basic groups tothis reaction
4 Is it possible for an acidic or basic amino acid side chain to function in an enzyme-catalyzedreaction at pH 7 if the side chain pKa is far from 7 How would the native environment of theactive site of the enzyme affect the pKa of the acidic and basic groups involved in the reaction(Consider the tendency of these groups to be protonated or deprotonated)
5 Would you expect the pH optimum to be the same for the reverse reaction Why or why not
Reference Weaver amp Banaszak (1996) Biochemistry 35 13955-13965
29
EXPERIMENT 5 Kinetic Analysis of Fumarase
From what you learned from Experiment 4 you can now analyze the effects of otherenvironmental variables upon the catalytic activity of the citric acid cycle enzyme fumarase whilekeeping constant the pH that promotes optimal enzyme activity One way a biochemist can analyzethe catalytic activity of an enzyme is through study of its reaction rates or kinetics The goal ofthis experiment is to analyze the reaction rates of fumarase in the forward and reverse direction as afunction of changes in substrate concentration and as inhibited by citrate Substrate and inhibitorconcentrations are common variables of an enzymersquos environment that influence its activity
The simplest model for enzyme kinetics states that the formation of an enzyme-substrate (ES)complex is a necessary intermediate in catalysis as proposed by Michaelis and Menten When youthink about it if the formation of an ES complex is a necessary intermediate in catalysis then thereaction rate (Vo) will depend on the formation of the ES complex As formation of the EScomplex will depend on the amount of substrate available the enzyme activity (Vo) will vary withsubstrate concentration ([S]) For enzymes that fit the Michaelis-Menten model (includingfumarase) this is described by the Michaelis-Menten equation
V o = V max[ S ]
K M + [ S ]
At a fixed enzyme concentration and low substrate concentrations the rate of an enzyme catalyzedreaction increases linearly with increases in substrate concentration However when the activesites of an enzyme become saturated at high substrate concentrations the reaction rate isindependent of substrate concentration the maximal velocity (Vmax) is reached The Michaelis-Menten constant (KM) reflects the rates for formation and dissociation of the ES complex andformation of product and is equal to the substrate concentration at half the value of Vmax
Remember that the fumarase-catalyzed interconversion of malate and fumarate can be followed bymeasuring the increase or decrease of near-UV absorption by the conjugated double bond offumarate over time Lacking a similar bond malate does not absorb light in this range By usingthis property of fumarate the fumarase-catalyzed reaction can be analyzed kinetically in both theforward and reverse direction
As you will be changing the fumarate concentration in the reaction for part of this analysis there isthe potential to achieve a corresponding increase in absorbance It will be important to insure thatyou do not exceed the absorption range that can be accurately measured by the spectrophotometerTo accomplish this you will make some of your measurements at wavelengths other than 260 nmMeasurements made at higher concentrations than 1 mM can be done using longer wavelengthswhich have lower molar absorptivities and visa versa You will need to adjust your calculationsfor each wavelength by using the corresponding molar absorptivity of fumarate listed below
Wavelength (nm) ε (M-1cm-1) Wavelength (nm) ε (M-1cm-1)220 9300 260 900230 4520 270 535240 2440 280 278250 1450 290 118
A plot of 1Vo verses 1[S] (Lineweaver-Burke plot) allows you to determine the kinetic parametersVmax and KM See Chapter 8 in the Lehninger text for a refresher on kinetic analysis
30
EXPERIMENTAL PROCEDURE
Materials providedassay buffer [15 mM sodium phosphate (pH - determined in Expt 4)]malate stock solution [24 mM L-malate in phosphate buffer (pH 70)]fumarate stock solution [6 mM in phosphate buffer (pH 70)]citrate stock solution [100 mM in phosphate buffer (pH 70)]porcine fumarase [~005 mgml in phosphate buffer (pH 70)]
1 Dilutions You must make a series of dilutions of malate (to 8 4 2 1 05 and 025 mM inphosphate buffer) and fumarate (4 2 1 05 025 and 0125 mM in phosphate buffer) in theabsence and presence of 8 mM citrate You will need about 1 ml of each dilution per assay If youneed to repeat the assay with one of the solutions you will need to make more You may checkcalculations with the instructor before beginning You need not complete all dilutions beforebeginning step 2
2 Malate Review details of assay protocol in Expt 4 Set the spectrophotometer to 240 nmwavelength Carefully pipet 990 microl of diluted malate solution into a quartz cuvette Place thecuvette in the spectrophotometer and zero the absorbance at 240 nm Add 10 microL of fumarase mixby inversion place the cuvette in spectrophotometer and record the absorbance at 240 nm forseveral minutes Find the slope of the initial linear portion of the time scan Repeat for all of thediluted solutions of malate Calculate the rate in micromolmin (vol = 1 mL) using ∆Asec and theproper extinction coefficient (see above)
3 Fumarate Set the spectrophotometer at one of the following wavelengths depending on theconcentration of fumarate
280nm4 mM 250 nm05 mM270 nm2 mM 240 nm025 mM260 nm1 mM 230 nm0125 mM
Zero the spectrophotometer at the appropriate wavelength with buffer in the quartz cuvetteRemove the buffer carefully pipet 990 microl of diluted fumarate solution into the cuvette and place itin the spectrophotometer (the absorbance should be about 06-1) Add 10 microL of fumarase mix asbefore place the cuvette in the spectrophotometer and record the absorbance for several minutesFind the slope of the initial linear portion of the time scan and calculate the rate in micromolmin (vol =1 ml) using ∆Asec and the appropriate extinction coefficient (see above)
Note because you are using different wavelengths for each of these measurements thechange in rate as a function of fumarate concentration will not be reflected by the slopesyou measure This is because with each change of wavelength there is a change in thecorresponding molar absorptivity You will see the changes in rate after your calculationsare complete
4 Citrate Repeat steps 2 and 3 with substrate reaction mixtures containing 8 mM citrate inaddition to varying concentrations of malate or fumarate In each case calculate the rate of theenzyme-catalyzed reaction in micromolmin using the appropriate extinction coefficients
31
DATA ANALYSIS
Determination of KM and Vmax Using the activity of the enzyme (rate = micromolmin) atvarious substrate concentrations (in mM) (without inhibitor) determine the kinetic parameters ofthe forward and reverse reactions catalyzed by fumarase A plot of 1Vo verses 1[S] (Lineweaver-Burke plot) allows you to determine the kinetic parameters Vmax and KM from the line equation forthe linear regression analysis of the data points Be sure to use the correct units for both Vo and[S] or you will not obtain meaningful values for these parameters Calculate the turnover numberfrom the concentration of enzyme and the molecular weight of fumarase (MW = 194 kDa) Forthis calculation you will need to have the enzyme rate reflected in Mmin which can be convertedfrom micromolmin using the reaction volume (vol = 1 mL) You can also calculate the equilibriumconstant for this reaction using the kinetic parameters obtained and the Haldane relationship
K eq =Vmax
( fum)
K M( mal)
Vmax( mal)
K M( fum)
Determination of KMrsquo and Vmaxrsquo Repeat the same type analysis as above with the dataobtained in the presence of inhibitor The corresponding kinetic parameters obtained in thepresence of inhibitor are indicated as KMrsquo and Vmaxrsquo Using the kinetic parameter that is mostaffected by the presence of inhibitor determine the type of inhibition (competitive ornoncompetitive) exhibited by citrate Using this altered kinetic parameter and one of the equationsbelow calculate the inhibitor constant (Ki)
V max
= V
max
( 1 + [ I ] K
i
)
OR K N
M = K
M ( 1 + [ I ]
K i
)
for citrate in the forward and reverse reactions
For Expt 5 you are to turn in at the end of the laboratory an analysis of your data (graphs of 1Voverses 1[S] and a table of kinetic parameters KM Vmax KMrsquo Vmaxrsquo and Ki) plus brief answersto the questions below
1 How do the kinetic parameters you obtained for porcine fumarase compare to those reported inthe literature (Alberty et al 1954 Table V on reserve)
2 Which substrate is preferred by the enzyme How do you know
3 What type of inhibitor is citrate in the fumarase-catalyzed reaction How do you knowSuggest a mechanism of inhibition by citrate
4 Is citrate an equally effective inhibitor in the forward and reverse reactions How do youknow
Reference Alberty et al (1954) J Amer Chem Soc 76 2485-2493
32
EXPERIMENT 6 Stereochemistry of the Fumarase Reaction mdash an NMR Study
As foreshadowed in Experiment 4 the reaction catalyzed by fumarase is stereospecific Inaqueous solutions it is not possible to determine the stereochemistry of the addition of H2O acrossthe double bond of fumarate since there is no way to determine which of the two hydrogen atomswas added to carbon-3 of malate from waterHowever the use of deuterium oxide (D2O) asthe solvent makes it possible to follow thestereochemistry For example if the reactioninvolves an anti (or trans) addition of water(2S3R)-3-deutereomalate is produced (right)
Alternatively if the reaction involves an syn(or cis) addition of water (2S3S)-3-deutereomalate is produced (figure left) Eitherway two new chiral centers are produced bythe stereospecific addition of D2O to fumarate
The stereochemistry of the fumarase reaction can be demonstrated by NMR spectroscopy TheNMR spectrum of fumarate is quite simple It consists of a singlet at δ65 from the two equivalenthydrogens in addition to an HOD peak at aboutδ47 (due to HOD in the solvent) Thespectrum of L(S)-malate is more complex butstill easily interpreted
Malate contains three different protons (HAHB and HX) Note that protons A and B arenot equivalent This is a general result forprotons adjacent to an asymmetric centerThese two protons are diastereotopic in thatthe independent substitution of either of theseprotons by any other group creates a diastereomer (a stereoisomer that is not a mirror image)Since these two protons have different magnetic environments they have different chemical shiftsand couple with one another (geminal coupling since both protons are bonded to the samecarbon) Coupling between HA or HB and HX is called vicinal coupling since the two protons areattached to adjacent carbons Thus each proton is split by each of the other two protons makingthe resonances for each a doublet of doublets For example HA is split by HB and the lines thatresult are each split by HX
When the fumarase enzyme is added to a solution of L-malate in D2O the fumarate peak at δ65grows while the malate peaks decrease in intensity The malate spectrum also begins to simplify(although is may not look simpler at first) due to new malate being formed as equilibration of thereaction proceeds Proton NMR does not see deuterium so one set of malate peaks disappearsas a proton is replaced by deuterium Deuterium does not couple with protons so for each of theremaining doublet-of-doublets only one of the couplings will remain
33
By knowing the expected sizes of coupling constants for vicinal protons at various dihedral angles(described by the Karplus curve) one can determine which of the protons(HA or HB) was replaced by deuterium This in turn allows determinationof whether the D2O addition is syn or anti
The dihedral angle is the anglebetween Hx and Ha or Hb whenlooking down the bond between thetwo central carbon atoms of malateEXPERIMENTAL PROCEDURE
Materials providedmalate solution [200 mM L-malate in 100 mM phosphate buffered D2O (pH 73)]fumarate solution [200 mM fumarate in 100 mM phosphate buffered D2O (pH 73)]porcine fumarase [10 mgml in 100 mM phosphate buffered D2O (pH 73)]
Please read Appendix V NMR before starting this experiment
1 Place 08 ml of L-malate and 08 ml of fumarate in separate clean dry NMR tubes Record theNMR spectrum of each
2 Place 08 ml of L-malate and 08 ml of fumarate in microfuge tubes Add 5 microl of fumarase toeach tube and mix gently Thirty minutes after addition of enzyme transfer each volume toseparate clean dry NMR tubes and record a spectrum of each
DATA ANALYSIS
For Expt 6 you are to turn in at the end of the laboratory an analysis of your data (a table ofcoupling constants (J) and all NMR spectra with labeled peaks including chemical shift positions(δ)) plus brief answers to the questions below
Assign each peak in the NMR spectra of L-malate and fumarate to protons in each moleculeCalculate the vicinal spin-spin coupling constants JAX and JBX and the geminal constant JABIdentify and interpret the changes in the NMR spectra brought about by the enzyme-catalyzedreaction Assign all the peaks in the final spectra (after enzyme addition)
1 What accounts for the difference in value of JAX and JBX in the spectrum of L-malate aloneRefer to the Karplus curve (see Appendix V NMR) in your answer
2 What changes in the NMR spectra after enzyme addition would you expect if the reaction wassyn anti or non-stereospecific
3 What is the stereochemistry of D2O addition to fumarate References Kasparek amp Pratt (1977) JChemEd 54 515
Nigh (1976) J Chem Ed 53 668
Silverstein et al (1974) in Spectrometric Identification of Organic Compounds (3rd
edition Wiley) pp 181-182 186-187 189-191
Teipel et al (1968) J Biol Chem 243 5684
34
35
APPENDIX I Concentration and Dilution
The most common expressions of concentration in biochemistry are molarity and percent-of-solute Molarity is defined as the number of moles of solute per liter of solution (denoted M) Molarityusually describes solutions of accurate concentration where the molecular weight of the solute isknown Solutes are weighed on an analytical balance and volumes are measured in volumetricflasks In biochemistry most concentrations are in the millimolar (mM) micromolar (microM) ornanomolar (nM) range
Percent-of-solute is frequently used for liquids and solids of undetermined molecular weightThree designations are used volume per volume (vv) weight per volume (wv) and weight perweight (ww) A 5 (vv) solution contains 5 ml solute in 100 ml total solution A 5 (wv)solution contains 5 g solute per 100 ml total solution A 5 (ww) solution contains 5 g solute per100 g total solution Of these three designations weight per volume expressions are used mostcommonly in biochemistry Sometimes these concentrations are not expressed as percentages butrather simply as the number of mg (or microg) per ml solution
Biochemical experiments frequently require the dilution of a particular sample or stock (standard)solution If the concentration of stock solution and that needed in the experiment are known thedilution factor can be calculated For example if you want to dilute a 1 M stock solution to 5 mMin your experiment the dilution factor is 00051 or 1200 (also indicated as a 1200 dilution)This means you must dilute 1 part stock solution with 199 parts solvent Another way of statingthis is that 1 part stock solution must be diluted into 200 parts total solution This is commonlydescribed by biochemists as a one in 200 (or two hundred-fold) dilution However this would bea mixture with a ratio of one (part) to 199 (parts) Generally if you want 200 ml of the dilutedsolution you would mix 1 ml stock solution with 199 ml solvent However this neglects anyvolume change that may be inherent to formation of the new mixture A more rigorous approachwould be to add 1 ml stock solution to a volume of solvent less than the total desired and thenbring the solution to the final desired volume with additional solvent
You can determine the molarity of a diluted solution (Mfinal) or calculate what volume of stocksolution (Vinitial) must be added to solvent to make the diluted solution by using the formula
MinitialVinitial = MfinalVfinal
For example if you have a stock solution of 10 M NaCl and you want to make 250 ml of a 05 M NaCl solution you need to add 125 ml of the stock solution to a 250 ml volumetric flaskand fill it with solvent to 250 ml
Minitial = 10 M Vinitial = Mfinal = 05 M Vfinal = 250 ml
(10 M)Vinitial = (05 M)(250 ml) --------gt Vinitial = 125 ml
In other words 125 ml of the stock solution is diluted to 250 ml with solvent Note that thenumber of moles of solute (in this case NaCl) is the same in the volumes of the initial and finalsolutions Note also that this equation can be written CinitialVinitial = CfinalVfinal where Crepresents concentration in units other than molar (eg mgml)
36
A special type of dilution is the serial dilution In this method a stock solution is dilutedsystematically in fixed steps of the same dilution factor (see Fig 1) A high degree of accuracyand precision is required because errors made in an early dilution are carried to all subsequentdilutions Serial dilutions are used frequently in immunological and microbiological experiments
Fig 1 A serial dilution scheme
37
APPENDIX II Spectroscopy
1 Absorption Spectroscopy
If white light is passed through a colored solution certain wavelengths of light are selectivelyabsorbed and the resulting color observed is due to the wavelengths of the transmitted lightUVVis absorption spectroscopy is useful if the sample absorbs light in the 200-350 nm range(ultraviolet UV) or in the 350-750 nm range (visible) The figure below (Fig 1) shows theabsorption spectrum of riboflavin Riboflavin appears yellow to the eye Maximal absorption oflight occurs at several wavelengths in the ultraviolet region (below about 370 nm) and at 450 nmin the visible region Since the absorption in the visible region is at the blue end the transmittedlight is that of the other end of the spectrum (yellow)
Fig 1 Absorption spectrum of Riboflavin
The quantitative measurement of the amount of light absorbed is based on two laws Lambertrsquoslaw states that the proportion of light absorbed is independent of its intensity and each successiveportion of the medium absorbs an equal fraction of the light passing through it This is expressedmathematically as
log (IIo)=Kl
where Io and I are the intensities of the incident and transmitted light respectively K is a constantand l is the path length in cm Log (IIo) is the absorbance (A) This law is always true Thesecond law applied here Beerrsquos law has some exceptions usually because of a change in the stateof the solute upon absorbing light This could involve changes in ionization or aggregationBeerrsquos law relates concentration to the factor K K=εc where ε is the extinction coefficient of theabsorbing solute (units are reciprocal concentration times reciprocal length) and c is itsconcentration Combining these two laws gives the Beerrsquos-Lambert law
A=εcl
Absorption is dimensionless If c has units of M ε has units of M-1 cm-1 if c has units of mgml
ε has units of ml mg-1 cm-1 The extinction coefficient reflects the relative tendency of a solute toabsorb light of a certain frequency and is specific only for a specific solute solvent andwavelength of light
UVVis absorption spectroscopy can be used to quantitatively measure enzyme activity if asubstrate or product of the enzyme-catalyzed reaction absorbs light This type of assay follows theactivity of the enzyme indirectly by monitoring the change in substrate or product directly A goodexample of this is the redox coenzyme NAD+NADH which changes its absorption propertiesupon oxidation and reduction (Fig 2) The different absorption of light by NAD+ and NADH canbe utilized to follow the activity of an enzyme involved in their interconversion
38
An analysis of the spectra of both (Fig 2) suggests that their absorptions differ most at ~340 nmwavelength light This wavelength therefore provides the largest ldquowindowrdquo to study theirinterconversion By following the change in absorption at 340 nm over time as a function ofenzyme activity one can extract quantitative rate data using the Beerrsquos-Lambert law and theextinction coefficient for NADH
Fig 2 Absorption spectra of NAD+ and NADH
39
APPENDIX III Buffers
Most cellular reactions and processes take place in an aqueous environment at neutral pHTherefore most biochemical experiments are also carried out in aqueous media under controlledpH conditions This requires the use of buffers solutions that resist changes in pH due to thepresence of a chemical species that can ldquoneutralizerdquo added acid or base In general buffers aresolutions of a weak acid and its conjugate base or a weak base and its conjugate acid When acid isadded to the buffer some A- is converted to HA addition of a base results in some HA convertingto the A- form Thus the solution can ldquoabsorbrdquo added acidic and basic species
A buffer is effective for use in a particular biochemical experiment based upon its 1) pKa value andchemical properties and 2) concentration The pKa indicates if a buffer can function well over thean appropriate pH range for the experiment The concentration indicates the capacity for which abuffer can function The Henderson-Hasselbalch equation [pH = pKa + log ([A-][HA])]gives the relationship between the pH of a solution the pKa of an acid in solution and the ratio ofthe concentrations of acid [HA] and conjugate base [A-] forms in solution
Buffering range When the concentrations of A- and HA are equal the pH of the solution equals the pKa of thebuffer Buffers are most effective in the range pH = pKa plusmn 1 Outside of this range theconcentration of acid or conjugate base is too small to ldquoneutralizerdquo acid or base added to thesolution Thus once the desired pH range has been determined for an experiment a buffer can beselected based upon its pKa value The pKa values for certain useful buffers is shown below
Buffer pKa (20degC) StructurePhosphoric acid 21 H3PO4Sodium dihydrogen phosphate 72 NaH2PO4Disodium hydrogen phosphate 123 Na2HPO4Citric acid 31 HOOCCH2COH(COOH)CH2COOHSodium dihydrogen citrate 47 HOOCCH2COH(COONa)CH2COOHDisodium hydrogen citrate 54 HOOCCH2COH(COONa)CH2COONaGlycylglycine 84 H3N+CH2CONHCH2COO-
Tris [tris(hydroxymethyl)- 83a (HOCH2)3CNH2 aminomethane]MOPS [3-(N-morpholino) 72 propanesulfonic acid]MES [2-(N-morpholino) 62 ethanesulfonic acid]HEPES [N-2-hydroxyethyl- 76 piperazine-Nrsquo-2-ethane- sulfonic acid]
aThe pH of a Tris buffer varies significantly with temperature (∆pKa = -031degC)
Table 1 Properties of some common biological buffers
40
Buffering capacityThe concentration of buffer used is also important in order to provide adequate buffering capacityBuffering capacity depends upon the concentration of the buffering components and is defined asthe number of equivalents (n) of either H+ or OH- required to change the pH of a given volume ofbuffer by one pH unit
Buffer capacity = dnd(pH)
Most biological buffers are made in the concentration range of 001-05 M this concentration isreferred to as the buffer strength and reflects the total concentration of acid and conjugate baseforms of the buffer Buffer solutions can be prepared by calculating the amount of acid andconjugate base forms of the buffer needed to obtain the desired pH using the Henderson-Hasselbalch equation Another method is to weigh out the desired amount of one form of thebuffer (HA or A-) and adjust the pH using a pH meter and solutions of NaOH HCl or Tris
The chemical properties of a buffer (eg solubility stability light absorption ionic interactions)must be well-characterized before use in a biochemical experiment A series of biologically usefulbuffers for use in the pH 7-9 range (MOPS HEPES MES PIPES etc) have been characterizedby Good et al (1966) Note that these buffers are not physiological (ie not found in the body)
Reference Good et al (1966) Biochemistry 5 467
41
APPENDIX IV Enzymology
Enzyme assay The activity of an enzyme can be determined by measuring the rate of utilizationof substrate over time or the rate of formation of product over time Enzyme activity is reported as∆[substrate]∆time or ∆[product]∆time (also denoted units of enzyme activity) The unit definitionfor enzymes varies but is often expressed as micromoles substrate used or product formed per min inthe assay mixture at a specified temperature and pH
One unit of enzyme activity = One micromol S (or P)min
Enzyme assays are carried out under buffered conditions at a fixed pH temperature andconcentration of necessary ions and in the presence of excess substrate (usually at least [S] = 10 xKm) Appropriate negative controls should be done in the absence of enzyme andor substrateChanges in the measured parameter in the absence of enzyme indicates the extent of non-enzymaticreaction in the assay mixture Changes in the measured parameter in the absence of substrateindicates the extent of background enzymatic reaction in the enzyme preparation Enzyme activitycan be measured by a continuous (kinetic) method or a discontinuous (fixed-time) method acontinuous assay is preferred
In purifying an enzyme one must determine the amount of enzyme present at each step of thepurification To do this enzyme activity in various purification fractions is measured underconditions of fixed substrate concentration pH temperature and added ions coenzymes etcThe Michaelis-Menten equation (shown below) relates the initial velocity Vo to the total amount
V o
= k
cat[ E
tot] [ S ]
K M
+ [ S ]
of enzyme ET at a fixed substrate concentrationSince the initial velocity is directly proportional to the total amount of enzyme careful measurementof the initial velocity under these fixed conditions gives a measure of the amount of enzyme
A major problem in developing an enzyme assay is establishing conditions that allow accuratemeasurement of the initial velocity This problem is minimized if high [S] is used so that [S]doesnrsquot change appreciably during the assay The amount of enzyme used in an assay is alsoimportant Too little enzyme gives a velocity too low for accurate measurement while too muchenzyme gives a velocity too high and not linear long enough to determine an accurate initial rateThe process by which the optimal amount of enzyme to be used in an assay is determined is calledrange-finding A plot of initial velocity vs amount of enzyme added should have a linear portionthat defines the valid range of [E] for this assay
Enzyme purity When purifying an enzyme one needs to determine the yield and degree ofpurity of the enzyme as the purification progresses Yield is measured by comparing the totalenzyme activity (units) in various enzyme fractions Purity is measured by comparing the specificactivity (unitsmg protein) in various fractions The higher the specific activity the more pure theenzyme Purity is usually expressed as a purification factor (or fold-purity) which is the increasein specific activity The effectiveness of a purification scheme is shown in a purification table(Table 1) which lists the total and specific activities for the various fractions generated during thepurification
42
Total Act Specific ActEnzyme fraction (Units) (Unitsmg) Yield PurityCrude cell extract 1030 12 100 ---Ion exchange column 807 135 78 11-foldAffinity column 498 244 48 203-fold
Table 1 Sample purification table
Dialysis Dialysis is a technique commonly used in biochemistry to separate a mixture ofdissolved solutes by filtration (Fig 1) Amixture is placed within a sealed dialysismembrane and then submerged in buffer andsmall solute molecules that are not highlycharged pass freely across the membrane untila concentration equilibrium on both sides of themembrane is achieved
The driving force for solute movement is theinitial concentration gradient across the dialysismembrane Dialysis is often used to removesalts or other small solutes from a proteinsample during the course of a purification Theconcentrations of solutes within the dialysismembrane change because water passes freelyacross the membrane in the direction of higherinitial solute concentration (the osmotic effect) Fig 1 Dialysis of a mixture of solutes
The dilution factor of the small solutes can becalculated by dividing the initial volume ofsample by the amount of buffer that the sampleis dialyzed against Equilibration usually takesseveral hours so samples are often left todialyze overnight at 4degC Large dilutions can beobtained in shorter times by changing the bufferat least once during the dialysis In this casethe dilution factors due to each volume of bufferused are multiplied by each other to give thefinal dilution For efficient dialysis the buffer inthe outer reservoir should be stirred Fig 2shows the dilution of NaCl over time due todialysis
Fig 2 Dilution of NaCl by dialysis
43
APPENDIX V Nuclear Magnetic Resonance
Nuclear magnetic resonance (NMR) is a very useful technique to study the structure of many typesof biomolecules NMR is useful when biomolecules contain inherently magnetic nuclei (1H 2H13C 14N 19F 31P) 1H and 13C NMR are used most frequently
NMR is based on the behavior of (+)-charged spinning nuclei in an externally applied magneticfield (H0) In the absence of H0 the axes about which the nuclei spin are oriented randomly insolution When H0 is applied the nuclei align parallel or antiparallel to the external field Theparallel orientation is slightly lower in energy and thus slightly favored Irradiation of alignednuclei with radiation of a certain frequency causes nuclei to absorb energy and spin-flip to a higherenergy state (and in doing so be in resonance with the applied radiation)
All nuclei in molecules are shielded somewhat from H0 by surrounding electrons which set uptiny local magnetic fields So the effective magnetic field (Heff) experienced by each nuclei islessened by these local magnetic fields (Hlocal)
Heff = H0 - Hlocal
Most nuclei in a molecule are in a slightly different electronic environment so Heff differs for each
NMR spectra show the intensity of absorption vs chemical shift (an indication of Heff) Eachnonequivalent nucleus will have its own characteristic peak on the spectrum Two protons bondedto the same carbon are not necessarily equivalent In the case of L-malate (Fig 1) protons A andB are diastereotopic because the substitution of either by any other chemical group createsdiastereomers (stereoisomers that are not mirror images) due to the presence of another stereogeniccenter in the molecule Thus HA and HB have their own characteristic peaks on an NMR spectrum
Fig 1 Structure of L-malate
NMR spectra are calibrated by using a reference sample usually tetramethylsilane TMS[(CH3)4Si] The chemical shift of TMS is set at zero samples absorb downfield (to the left of the
standard on the chart) The unit of chemical shift is the delta unit δ
1 δ = 1 ppm of the operating frequency of the NMR spectrometer
Gustavus College has a 300 MHz machine so 1 δ = 300 Hz Most 1H NMR absorptions occur 0-
10 δ downfield of the reference peak For example an allylic proton (=C-C-H) absorbs at δ =
15-25 and a vinylic proton (C=C-H) absorbs at δ=45-65
44
The nuclear spins of adjacent atoms can influence each other causing spin-spin coupling orsplitting In 1H NMR splitting occurs between protons coupled via covalent bonds and usuallyno more than two carbons apart A general rule when studying spectra is that the peaks of protonswith n equivalent neighboring protons split into a multiplet of n+1 peaks The distance betweenpeaks in a multiplet is the coupling constant J In general two groups of protons coupled to eachother have the same value of J Stronger coupling is indicated by greater spacing of the splitpeaks No splitting is observed if adjacent protons are chemically equivalent
For vicinal protons (those on adjacent carbons) the value of J is related to the dihedral angle φthis relationship is shown in the Karplus curve (Fig 2) The coupling of trans protons is greaterthan that between cis protons In this case NMR is useful to distinguish between cis-transisomers Dihedral angles of 60deg and 180deg yield J values of 2-4 and 8-10 respectively
Fig 2 Karplus curve Line theoretical curve shaded area range of empirical results
45
APPENDIX VI SDS-Polyacrylamide Gel Electrophoresis (SDS-PAGE)
Gel electrophoresis is an effective method for separating proteins on the basis of size SDS-PAGEis a electrophoretic technique that uses a gel made of polymerized acrylamide AcrylamideCH2=CH-C(=O)-NH2 forms a linear polymer polyacrylamide that can be cross-linked withNNrsquo-methylene bisacrylamide CH2=CH-C(=O)-NH-CH2-NH-C(=O)-CH=CH2 to form a resinof controlled but varying pore size Cross-linked polyacrylamide is shown in Fig 1
Fig 1 Structure of cross-linked polyacrylamide
Polymerization is catalyzed by free radicals generated by agents such as ammonium persulfate inthe presence of NNNrsquoNrsquo-tetramethylethylenediamine (TEMED) Polymerization is inhibited byoxygen so gel solutions should be degassed If the pore size of the gel approximately matches thesize of the molecules to be separated smaller molecules can move freely in an applied electric fieldwhereas larger molecules have restricted movement
SDS-PAGE most often makes use of vertical slab gels although gels can also be formed incylinders A discontinuous gel system is also used frequently consisting of a stacking gel and aseparating gel The stacking gel makes up only approx 10 of the volume of the total gel and isof a lower percentage acrylamide (usually 25-45) and a lower pH (68) In the stacking gelcharged molecules move freely in an applied electric field and proteins in a sample shouldaccumulate in stacks of closely spaced bands In the separating gel containing a higher percentageacrylamide (usually 7-15) and at a higher pH (88) proteins separate into discrete bands basedon molecular size See Fig 2 for sieving properties of different percentage gels
Percentage acrylamide in separating gel Size of molecules sieved effectively25 105-106 daltons70 104-105 daltons30 102-103 daltons
Fig 2 Molecular sieving properties of gels of varying polyacrylamide percentages
46
Separation is not on the basis of shape or charge because proteins are treated with sodium dodecylsulfate (SDS) a detergent with both polar and nonpolar properties The long hydrocarbon chain ofSDS is buried in nonpolar regions of proteins and the (-)-charged sulfate is exposed on the surfaceof proteins SDS coats proteins with an approximately uniform charge-to-mass ratio of (-) charge(saturation occurs at approx 14 g SDSg protein) In addition proteins are approx uniformlyshaped into spheres when coated with SDS because the detergent disrupts native ionic andhydrophobic interactions Thus proteins separated by SDS-PAGE are denatured Disulfides inproteins are broken by addition to the gel sample buffer of szlig-mercaptoethanol or 14-dithiothreitolboth of which reduce disulfide bonds
The molecular weights of proteins in a sample can be estimated on a gel by measuring the mobilityof protein standards of known molecular weight on the same gel A calibration curve (Fig 3) canbe generated from the mobilities of the standards by plotting the distances migrated from the top ofthe resolving gel versus the log of molecular weight A linear regression can be calculated andused to estimate unknown molecular weights The estimation of molecular weight by this methodis accurate to approximately 5-10 of the actual value
Fig 3 Calibration curve for molecular weight estimation
Reference UK Laemmli (1970) Cleavage of structural proteins during the assembly of thehead of bacteriophage T4 Nature 227 p 680

This manual was developed from sourcematerial used with permission provided by
Gail Carlson PhD and Stewart Hendrickson PhDat St Olaf College
Introductory materials were written by Jeff Dahlseid PhDLaboratory exercises were developed adaptededited andor written by Jeff Dahlseid PhD
CHEMISTRY 255 -- Biochemistry Laboratory -- Fall 2002Instructors MW - Jeff Dahlseid PhD - Nobel 206B x6129 dahlseidgustavusedu
TR - Allan Splittgerber PhD - Nobel 206A x7323 splittygustavuseduTime and Location M T W or R 130-520 pm in Nobel 207
Laboratory Schedule
Week Experiment Techniques Used99 Expt 1 Introduction to basic techniques Measurements dilutions
UVVis spectroscopy
916 Expt 2 Amino acid composition of a Enzymatic proteolysis paper dipeptide chromatography
923 Discussion on scientific writing Readcritique primary literatureExercises involving buffer solutions Buffer preparation
930 No lab - Nobel Conference
107 Expt 3 Purification of AMP Extract preparation resin preparationaminohydrolase instrument operation
1014 Expt 3 (contrsquod) Column chromatography dialysisspectroscopic enzyme assay
1021 No lab - Reading Break NOTE Thursday will meet Oct 24 instead of Oct 17
1028 Expt 3 (contrsquod) Gel electrophoresis proteinconcentration and molecular weightdetermination enzyme assay
114 Expt 4 pH-Dependence of fumarase Buffer preparation spectroscopic enzyme assay
1111 Expt 5 Kinetic analysis of fumarase Spectroscopic enzyme assayMichaelis-Menten kinetic analysis
1118 Individual writing consultation (scheduled)
1125 No lab -Thanksgiving Break
122 Expt 6 Stereospecificity of the fumarase Proton NMRreaction mdash an NMR study
129 To Be Determined
Expt 6 may be done at times scheduled separately for each group
i
TABLE OF CONTENTS
Safety Guidelines iv
Safe Handling and Disposal of Chemicals vii
Codes for Chemical Labeling viii
Safe Handling of Biological Material ix
Safety Policies and Procedures Signature Sheet x
Material Safety Data Sheet Example xii
Overview and Integrated Schedule 1
GUIDELINES FOR WRITING LAB REPORTS 3
Lab Notebooks 4
Short Reports for Laboratory 5
Formal Report for Laboratory 6
Scientific Writing Discussion 7
EXPERIMENT 1 Introduction to Basic Biochemical Techniques 8
EXPERIMENT 2 Amino Acid Composition of a Dipeptide 12
EXPERIMENT 3 Purification of AMP Aminohydrolase 15
EXPERIMENT 4 pH Dependence of Fumarase 26
EXPERIMENT 5 Kinetic Analysis of Fumarase 29
EXPERIMENT 6 Stereochemistry of the Fumarase Reaction mdash an NMR Study 32
APPENDIX I Concentration and Dilution 35
APPENDIX II Spectroscopy 37
APPENDIX III Buffers 39
APPENDIX IV Enzymology 41
APPENDIX V Nuclear Magnetic Resonance 43
APPENDIX VI SDS-Polyacrylamide Gel Electrophoresis (SDS-PAGE) 45
ii
Safety Guidelines
I M P O R T A N T
POLICY ON SAFETY GOGGLES
ALL STUDENTS WORKING WITH OR IN CLOSE PROXIMITY TOCHEMICALS IN LABORATORIES ARE REQUIRED TO WEAR SAFETY
GOGGLES AT ALL TIMES
The chemistry laboratory can be a dangerous place While little that you will be asked to do isintrinsically dangerous a majority of the materials that you handle are in some way potentiallydangerous if they are handled carelessly Perhaps the greatest potential danger in your laboratorywork will be from corrosive substances such as strong acids and bases that readily attack humantissues
The most vulnerable part of your body is your eyes and they must be protected Therefore wewill INSIST that approved safety goggles be worn at all times (covering the eyes) when you areworking with chemicals or are in the vicinity of others using chemicals We will not tolerateexceptions to this rule Your laboratory instructor will remind you to wear safety goggles and youwill not be permitted to work in the laboratory if you do not wear them
Furthermore at the discretion of the laboratory instructor should you fail to heed warnings aboutwearing your safety goggles you may after two warnings be dismissed from the laboratory andrequired to drop the course We do not wish to use these penalties PLEASE do not force us todo so However be assured that ALL STUDENTS will be required to wear safety goggleswhen working with chemicals and we will not hesitate to assess these penalties to make thisrequirement work
If you have a problem with goggles fogging or if prolonged wear of goggles is uncomfortable werecommend that you occasionally go into the hallways to remove the goggles for relief be sure toput them back on prior to returning to the lab Goggles should NOT be removed in the laboratoryitself while chemicals are in use Several models of goggles are available and we hope that one ofthese will prove comfortable for you
In addition because the safety implications are unclear it is strongly recommended that contactlenses NOT be worn in the laboratory even under safety goggles Should chemicals includingsolvent vapors enter the eyes of a student wearing contact lenses there is a possibility that theychemicals may become trapped under the contact lenses Damage may be done to the eyes until thelenses can somehow be removed with the eyesight of the victim being permanently impaired
Therefore if you wear contact lenses you are encouraged to wear glasses instead of contacts in thelaboratory If you wear contacts but do not own an equivalent pair of glasses you are encouragedto obtain glasses for laboratory use
iii
Safety Guidelines
Submission of a Safety Policies and Procedures Signature Sheets (on page afterthese guidelines and safety information) signed by both the student andlaboratory instructor is required before any student can work in the laboratory
1 IMMEDIATELY REPORT ANY ACCIDENT OR SAFETY ISSUE TO THELABORATORY INSTRUCTOR
Emergency Procedures
2 If chemicals are spilled
a If chemicals are spilled on you or if you see chemicals spilled on another student Callfor help from your instructor Portions of your body or clothing that have been in contactwith the chemicals should immediately be flushed thoroughly with water Use the safetyshower if the spill is extensive An eye wash is available in the laboratory Donrsquot wait tosee if the chemicals will injure you rinse spills immediately
b Work with the instructor to clean up spills on the bench or floor Notify students nearbyof the presence of broken glassware andor chemicals and keep people from walkingthrough the area until cleanup is complete
3 In case of fire
a Call for help from your instructor If clothing is burning slowly walk to the fire blanketand wrap it around yourself and roll on the floor to extinguish the flames or slowly walkto the safety shower and pull the cord (or ask someone nearby to pull the cord) [Otherstudents nearby if necessary bring the fire blanket to the student or help the student to theshower and pull the chain]
b A fire on the bench top or floor may be put out with a fire extinguisher Call for helpfrom your instructor
4 Wash minor cuts or burns with cold water and get band aids or burn ointment from thestockroom Report all such incidents no matter how minor to the instructor
Safety Goggles and Clothing
5 Safety goggles must be worn at all times in the laboratory Since under Minnesota law thecollege is legally responsible for eye accidents if a student is not wearing eye protectionthe instructor may dismiss from the laboratory any students not wearing approvedgoggles In this class the instructor will warn students if necessary to wear theirgoggles If students do not respond to two warnings the may be dismissed form thelaboratory and requested to drop the course Goggles must be provided by each studentand may be purchased through the Gustavus Bookmark
6 If you are using a computer or printer in a lab you must wear safety goggles if work withchemicals is occurring in the lab
iv
7 Clothing Shoes with solid tops (not sandals) must be worn to protect your feet frombroken glass or other sharp materials Shorts or cut-off pants should not be worn in thelab it is important to protect your body with clothing rather than risk skin contact withchemicals or other materials Avoid wearing clothing with loose portions such as opensweaters baggy cuffs and hanging scarves Loose clothing can catch on glassware andequipment can drag through spills and may in some cases be a fire hazard Similarlyloose long hair should be tied back so that it does not become entangled in equipmentexposed to chemicals or provide an impediment to vision
Handling Chemicals
8 Do not taste or ingest any laboratory chemicals
9 Avoid touching chemicals with your hands and always thoroughly wash your hands afterusing chemicals
10 Work in a fume hood when carrying out reactions that give off objectionable gases If youneed to smell vapor do not put your nose directly above a flask beaker or other vesselcontaining chemicals Holding the vessel at least one foot away use your hand to gentlyand very cautiously fan the vapors toward your nose
11 No mouth pipetting is permitted When pipetting use the mechanical pipettors pipette aidsor the rubber bulbs provided in the laboratory
12 Always add acids to water (its alphabetical) never add water to acids Combining acidand water frequently generates heat addition of the acid to the water reduces the amount ofheat generated at the point of mixing and provides more water to disperse the heat
13 LABEL all flasks beakers test tubes and other vessels containing chemicals accordingto their contents This facilitates both identifying chemicals during an experiment andfollowing proper waste disposal procedures
14 Hold reagent bottles and other vessels containing liquids so that any drips will beopposite the label and hold them so any previous drips on that same side do not get onyour hand Clean off any drips or spills If necessary ask for help from your instructoror assistant
15 Laboratory wastes and residues are to be disposed of in an approved manner Wastecontainers for these will be provided and specific instructions on proper disposalprocedures will be provided by the laboratory instructor for each experiment
Laboratory Supervision
16 No unauthorized experiments are permitted Students may try new experiments only ifthey have been discussed with a faculty member and have been approved
17 No student may work in the laboratory alone All laboratory work must be under thesupervision of a faculty member or student laboratory assistant and at least one otherperson must be present when work with chemicals is being done No makeupexperiments may be performed without the permission of a studentrsquos laboratoryinstructor
v
Behavior in the Laboratory
18 Food and beverages are not permitted in the laboratory This includes drinking from waterbottles that you may carry with you on campus If you need to eat or drink during the timelaboratory is scheduled you must remove yourself from the laboratory Be sure to washyour hands before eating after working in laboratory
19 Backpacks and book bags clutter the benches andor floors of the laboratory and interrupttraffick flow during laboratory Please leave your book bags and backpacks in the hallwayor another location outside the laboratory
20 Any horseplay or behavior that is harassing disruptive or aggressive or in any waypresents a hazard to those in the laboratory is forbidden Any student or group of studentsengaging in such behavior may be dismissed by the laboratory instructor and may receivedno credit for the experiment
Other Procedures
21 If you anticipate needing to cut glass tubing or insert glass tubing into a rubber stopperconsult with your instructor prior to proceeding Both procedures present the potentialfor injury from broken glass and proper precautions are essential
22 CLEAN your bench top thoroughly at the end of each laboratory period This should bedone with a damp sponge
Safe Handling and Disposal of Chemicals
Some information on the safe use and disposal of chemicals is provided in this manual additionalsuggestions will be made by your laboratory instructor We want not only to provide you withguidelines about how to use chemicals and equipment safely - no experiment you will do thissemester is dangerous if safe procedures are followed throughout - but to be sure that properprecautions are taken to avoid contaminating the environment To this end we will provideappropriate containers for disposal of chemical wastes After collecting these from all the labsections our stockroom manager will see to it that proper procedures are observed in disposing ofthese items
How does one learn about proper handling of chemicals We have a variety of sources the mostcommon of which are Material Safety Data Sheets (MSDS) These provide a variety ofinformation on such things as health hazards first aid procedures procedures for cleaning upspills and disposal procedures for each chemical An example of an MSDS is copied on pages xi-xv By law companies that sell chemicals must also provide an MSDS (usually inserted as an extrasheet in shipment) for each chemical shipped There is no uniform format for an MSDS so theylook very different depending on the source The Chemistry Department obtains the MSDS formsfrom the corresponding vendors for the chemicals in the stockroom collection and keeps them onfile in the department office MSDS forms are also available from Sigma-Aldrich over the webCheck out the Chemistry Stockroom link on the Chemistry Departmentrsquos Home Page or go towwwsigmaaldrichcomcg i-binh srunDistribu tedHahtShopHahtSh ophtxstart= HS_SeacrchCen ter You may request a copy of an MSDS for one of the compounds you are using if you wish Or youcan download your own from the web
vi
Codes for Chemical Labeling
In the laboratory you will notice that containers of chemicals are labeled not only with the name(and in some cases concentration) of chemicals but also with colored diamonds containingnumerical and other codes These are the NFPA (National Fire Protection Agency) codes andindicate fire reactivity health and other hazards associated with the chemicals In general thehigher the number of a code the greater the potential hazard The specific codes are as follows
Bottom Diamond Special Hazards Right Diamond Reactivity Hazards
OXY Oxidizer 0 StableACID Acid 1 Unstable if heatedALK Alkali 2 Violent chemical changeCOR Corrosive 3 Shockheat may detonateW Use no water 4 May detonateRAD Radiation
Top Diamond Fire Hazards Left Diamond Health Hazards
0 Will not burn 0 Normal material1 Burns above 200deg F 1 Slightly hazardous2 Burns below 200deg F 2 Hazardous3 Burns below 100deg F 3 Extreme danger4 Burns below 73deg F 4 Deadly
vii
Safe Handling of Biological Material
Biochemists encounter potential laboratory risks in addition to those of other chemical laboratoryworkers the risks associated with biological specimens A problem with these is that there may berisks of which we are not yet aware However there are two types of risks we can assess fairlywell
Infectious agents
Agents of infection may be bacterial viral or the recently discovered prions (eg Mad-cowdisease)
With any human tissue (including blood) it is now general practice to follow universalprecautions handling every sample as if it were infected because you can never know that it isnot The precautions include persistent use of gloves segregation of lab from non-lab (eg ablood in the lab is never taken out of the lab) etc These are onerous precautions that take a lot ofplanning and arrangements Think about for example using a phone looking at your watch orusing a personal pen without contamination Remember that there are viruses fortunately stillrare that are extremely infectious more than HIV In this course we will NOT use human tissue
Animal tissue may also be contaminated with infectious agents We will use chicken muscle andfrom your kitchen you should know that poultry is a common source of Salmonella infectionsThe problem in the laboratory is that the chicken product may remain infectious long after it isdiscernable as a chicken product That is unlike your kitchen we do not begin with a cookingprocess that will kill most microorganisms Thus scrupulous cleanliness throughout withpersonal protection by gloves taking great care to avoid contacting personal items with thepossibility of contaminated gloves is necessary Washing hands after lab is highly recommended
Ecological dangers
In contemporary biochemical laboratories it is common to work with cloning vectors geneticallymodified cells and other agents with the potential to modify mostly in unpredictable ways majorecological systems This places a huge burden on the scientist to contain these productssometimes requiring entire new labs with facilities appropriate to handle the materials The biggestrisk is that it is so easy to forget the possible hazard of something that one works with so routinelyTo promote containment vector-containing material is destroyed through autoclaving Howeverin this course we will NOT be working with material involving cloning vectors
viii
Safety Policies and Procedures Signature Sheet
I have read all the material in the Safety Guidelines section of the Biochemistry Laboratory manualincluding the general safety policies goggles policy and material on safe use and disposal ofchemicals I understand this material and how it applies to the laboratory in which I will beworking I have asked for clarification of those points I do not understand
Signed ____________________________________ Date _______________________
Printed name ______________________________________________________________
Laboratory section _________________________________________________________
Accepted by faculty member ___________________________ Date________________
Remarks
Mark the locations of each of the following on the lab
bull Eye Wash (1)bull Safety Shower (1)bull Fire extinguisher (1)bull Gas shut off (1)bull Emergency phone (1)bull Exits (2)
ix
x
Material Safety Data Sheet Example - for ASPIRIN
MSDS Number A7686 --- Effective Date 111799
1 Product Identification
Synonyms 2-(acetyloxy)benzoic acid salicylic acid acetate acetysalicylic acid CAS No 50-78-2 Molecular Weight 18015 Chemical Formula C9H8O4 Product Codes 0033
2 CompositionInformation on Ingredients
Ingredient CAS No Percent Hazardous --------------------------------------- ------------ ------- --------- Acetylsalicylic Acid 50-78-2 100 Yes 3 Hazards Identification
Emergency Overview -------------------------- WARNING HARMFUL IF SWALLOWED OR INHALED CAUSES IRRITATION TO SKIN EYES ANDRESPIRATORY TRACT MAY CAUSE ALLERGIC RESPIRATORY REACTION POSSIBLE BIRTHDEFECT HAZARD MAY CAUSE BIRTH DEFECTS BASED ON ANIMAL DATA AFFECTS THERESPIRATORY SYSTEMLIVER KIDNEYS EYES SKIN AND BLOOD
JT Baker SAF-T-DATA(tm) Ratings (Provided here for your convenience) ----------------------------------------------------------------------------------------------------------- Health Rating 1 - Slight Flammability Rating 1 - Slight Reactivity Rating 0 - None Contact Rating 1 - Slight Lab Protective Equip GOGGLES LAB COAT Storage Color Code Orange (General Storage) -----------------------------------------------------------------------------------------------------------
Potential Health Effects ---------------------------------- Inhalation
Causes irritation to the respiratory tract Exposure may cause an allergy to develop Ingestion
Extremely large oral doses may cause mild burning pain in the mouth and stomach anorexia nauseavomiting intense thirst diarrhea dizziness irritability confusion coma teratogenic effects and death fromrespiratory failure The mean lethal dose of aspirin by mouth probably lies between 20 and 30 grams inadults
Skin Contact May cause irritation Eye Contact
Causes irritation Contact cause severe pain and may cause eye damage
xi
Chronic Exposure Repeated ingestion may cause tinitus abnormal bleeding (gastric or retinal) gastric ulcer weight lossmental deterioration and skin eruptionsMay cause kidney and liver damage in susceptible individuals Aggravation of Pre-existing Conditions
Persons with a history of asthma or allergies to aspirin may be at an increased risk upon exposure to this substance
4 First Aid Measures Inhalation Remove to fresh air If not breathing give artificial respiration If breathing is difficult give oxygen Call aphysician Ingestion Induce vomiting immediately as directed by medical personnel Never give anything by mouth to an unconsciousperson Call a physician Skin Contact In case of contact immediately flush skin with plenty of soap and water for at least 15 minutes Removecontaminated clothing and shoes Wash clothing before reuse Get medical attention if irritation develops or persists Eye Contact Immediately flush eyes with plenty of water for at least 15 minutes lifting lower and upper eyelids occasionally Getmedical attention immediately
5 Fire Fighting Measures Fire As with most organic solids fire is possible at elevated temperatures or by contact with an ignition source Explosion Fine dust dispersed in air in sufficient concentrations and in the presence of an ignition source is a potential dustexplosion hazard Minimum explosive dust concentration 40 gm3 Fire Extinguishing Media Water spray foam or dry chemical Special Information In the event of a fire wear full protective clothing and NIOSH-approved self-contained breathing apparatus with fullface piece operated in the pressure demand or other positive pressure mode
6 Accidental Release MeasuresRemove all sources of ignition Ventilate area of leak or spill Wear appropriate personal protective equipment asspecified in Section 8 SpillsClean up spills in a manner that does not disperse dust into the air Use non-sparking tools and equipment Reduceairborne dust and prevent scattering by moistening with water Pick up spill for recovery or disposal and place in aclosed container
7 Handling and StorageKeep in a tightly closed container stored in a cool dry ventilated area Protect against physical damage Isolate fromany source of heat or ignition Isolate from incompatible substances Containers of this material may be hazardouswhen empty since they retain product residues (dust solids) observe all warnings and precautions listed for theproduct
8 Exposure ControlsPersonal Protection Airborne Exposure Limits - ACGIH Threshold Limit Value (TLV) 5 mgm3 (TWA)
xii
Ventilation System A system of local andor general exhaust is recommended to keep employee exposures below the Airborne ExposureLimits Local exhaust ventilation is generally preferred because it can control the emissions of the contaminant at itssource preventing dispersion of it into the general work area Please refer to the ACGIH document IndustrialVentilation A Manual of Recommended Practices most recent edition for details Personal Respirators (NIOSH Approved) If the exposure limit is exceeded a half-face dustmist respirator may be worn for up to ten times the exposure limitor the maximum use concentration specified by the appropriate regulatory agency or respirator supplier whichever islowest A full-face piece dustmist respirator may be worn up to 50 times the exposure limit or the maximum useconcentration specified by the appropriate regulatory agency or respirator supplier whichever is lowest Foremergencies or instances where the exposure levels are not known use a full-facepiece positive-pressure air-suppliedrespirator WARNING Air-purifying respirators do not protect workers in oxygen-deficient atmospheres Skin Protection Wear protective gloves and clean body-covering clothing Eye Protection Use chemical safety goggles Maintain eye wash fountain and quick-drench facilities in work area
9 Physical and Chemical Properties Appearance Transparent colorless crystals Odor Odorless Solubility 1g100g water 37C Specific Gravity 140 pH No information found Volatiles by volume 21C (70F) 0 Boiling Point 140C (284F) Melting Point 135C (275F) Vapor Density (Air=1) No information found Vapor Pressure (mm Hg) No information found Evaporation Rate (BuAc=1) No information found
10 Stability and Reactivity Stability Stable in dry air Hazardous Decomposition Products Decomposes to acetic acid and salicylic acids in the presence of moist air Carbon dioxide and carbon monoxidemay form when heated to decomposition Hazardous Polymerization Will not occur Incompatibilities Strong oxidizers alkali hydroxides boiling water and antipyrine aminopyrine methamine phenol phenylsalicylate and sodium bicarbonate Conditions to Avoid Moisture
11 Toxicological Information Toxicological Data Oral rat LD50 200 mgkg investigated as a mutagen reproductive effector Reproductive Toxicity Reproductive effects recorded on humans (RTECS)
xiii
--------Cancer Lists------------------------------------------------------ ---NTP Carcinogen--- Ingredient Known Anticipated IARC Category ------------------------------------ ----- ----------- ------------- Acetylsalicylic Acid (50-78-2) No No None
12 Ecological Information Environmental Fate When released into the soil this material may leach into groundwater When released into the soil this material maybiodegrade to a moderate extent When released into water this material is not expected to evaporate significantlyThis material has an estimated bioconcentration factor (BCF) of less than 100 This material is not expected tosignificantly bioaccumulate When released into the air this material may be moderately degraded by reaction withphotochemically produced hydroxyl radicals When released into the air this material may be removed from theatmosphere to a moderate extent by wet deposition Environmental Toxicity No information found
13 Disposal Considerations Whatever cannot be saved for recovery or recycling should be managed in an appropriate and approved waste disposalfacility Processing use or contamination of this product may change the waste management options State and localdisposal regulations may differ from federal disposal regulations Dispose of container and unused contents inaccordance with federal state and local requirements
14 Transport Information Not regulated
15 Regulatory Information --------Chemical Inventory Status - Part 1--------------------------------- Ingredient TSCA EC Japan Australia ----------------------------------------------- ---- --- ----- --------- Acetylsalicylic Acid (50-78-2) Yes Yes Yes Yes --------Chemical Inventory Status - Part 2--------------------------------- --Canada-- Ingredient Korea DSL NDSL Phil ----------------------------------------------- ----- --- ---- ----- Acetylsalicylic Acid (50-78-2) Yes Yes No Yes --------Federal State amp International Regulations - Part 1---------------- -SARA 302- ------SARA 313------ Ingredient RQ TPQ List Chemical Catg ----------------------------------------- --- ----- ---- -------------- Acetylsalicylic Acid (50-78-2) No No No No --------Federal State amp International Regulations - Part 2---------------- -RCRA- -TSCA- Ingredient CERCLA 26133 8(d) ----------------------------------------- ------ ------ ------ Acetylsalicylic Acid (50-78-2) No No No
xiv
Chemical Weapons Convention No TSCA 12(b) No CDTA NoSARA 311312 Acute Yes Chronic Yes Fire No Pressure NoReactivity No (Pure Solid)
WARNING THIS PRODUCT CONTAINS A CHEMICAL(S) KNOWN TO THE STATE OF CALIFORNIA TO CAUSEBIRTH DEFECTS OR OTHER REPRODUCTIVE HARM
Australian Hazchem Code No information found Poison Schedule S2 WHMIS This MSDS has been prepared according to the hazard criteria of the Controlled Products Regulations (CPR) and theMSDS contains all of the information required by the CPR
16 Other Information NFPA Ratings Health 2 Flammability 1 Reactivity 0 Label Hazard Warning WARNING HARMFUL IF SWALLOWED OR INHALED CAUSES IRRITATION TO SKIN EYES ANDRESPIRATORY TRACT MAY CAUSE ALLERGIC RESPIRATORY REACTION POSSIBLE BIRTHDEFECT HAZARD MAY CAUSE BIRTH DEFECTS BASED ON ANIMAL DATA AFFECTS THERESPIRATORY SYSTEM LIVER KIDNEYS EYES SKIN AND BLOOD Label Precautions Do not breathe dust Avoid contact with eyes skin and clothing Keep container closed Use only with adequate ventilation Wash thoroughly after handling Label First Aid
If swallowed induce vomiting immediately as directed by medical personnel Never give anything by mouth to anunconscious person If inhaled remove to fresh air If not breathing give artificial respiration If breathing isdifficult give oxygen In case of contact immediately flush eyes or skin with plenty of water for at least 15minutes Remove contaminated clothing and shoes Wash clothing before reuse In all cases call a physician
Product Use Laboratory Reagent Revision Information No changes
xv
xvi
1
CHE 255 Biochemistry Laboratory Fall 2002Overview and Integrated Schedule
Course Description and Objectives Biochemistry is the study of the molecules of livingsystems including study of the physical structures and interactions chemical reactions andbiological activities of these molecules The four main marcomolecules central to biochemicalstudy are proteins nucleic acids lipids and carbohydrates Through focused study of proteinenzymes and their activities properties and kinetics this laboratory course will introduce you totechniques fundamental to biochemical investigations For this course my specific objectives arethat you
bull understand and use many of the techniques and tools of biochemistrybull comprehend fundamental principles of biochemical researchbull communicate research results effectively in written format
Course Activities As a primary basis for learning we will use hands-on laboratory work(including keeping a notebook) In addition you will write short reports participate in discussionwrite an initial and a final draft of a formal laboratory report and complete data analysisquestionreports An integrated schedule of these activities is shown below assignments are due on theweekday of your lab section for the week indicated and must be turned in by 530 pm Detaileddescriptions of these projects can be found on page 5 and following See the CH 255 coursesyllabus for assessment and grading information and policies
Biochemistry Laboratory Schedule
Week of Topic99 Expt 1 Introduction to Basic Techniques916 Expt 2 Amino Acid Composition of a Dipeptide
Short report for Expt 1 due923 Writing discussion and workshop Buffer preparation
Questions for discussion and buffer problems due930 Nobel Conference
Short report for Expt 2 due summary of a Nobel lecture due Oct 3107 Expt 3 Purification of AMP Aminohyrolase1014 Expt 3 (contrsquod)1021 Reading Break1028 Expt 3 (contrsquod)114 Expt 4 pH-Dependence of Fumarase
Expt 4 Data analysis and questions (DAQs)Expt 3 formal report initial draft due
1111 Expt 5 Kinetic Analysis of FumaraseExpt 5 DAQs due
1118 Writing consultation (scheduled)1125 Thanksgiving Break
Final draft of Expt 3 formal report due122 Expt 6 Stereospecificity of the Fumarase Reaction
Expt 6 DAQs due129 To be determined
2
Class policies structure e-mail and feedback By its very nature laboratory involveslearning through hands-on participation so you must attend laboratory Failure to do so willresult in failure of the laboratory portion of the course (see CHE 255 syllabus) Approval ofexcuses for missing lab will be determined on a case by case basis Should you anticipate anacceptable absence you must let me know ahead of time This will facilitate making advancedarrangements for acceptable absences
For each lab we will have a pre-lab discussion to go over background material for the labanticipate scheduling and trouble-shooting issues and communicate new and helpful informationI strongly recommend that you prepare for pre-laboratory ahead of time Doing this will allowyou to ask questions about matters you find confusing which may save you serious time andfrustration during the laboratory Furthermore by reading the material in the laboratory manualdeveloping a plan doing any necessary calculations and noting questions in advance of lab youcan insure things go more smoothly for you and your group in lab In addition the moreorganized you are when you come to lab the better chance you will have to finish in reasonabletime To gain as much as possible from laboratory I recommend that you read any material fromthe Lehninger text or library reserve papers that are related to the weekrsquos exercise
Presenting scientific results is an essential part of the scientific endeavor and thus a focusof this class will include scientific writing Having an accurate record of what you actually did andhow it worked is critical to communicating your results Therefore you should also keep anotebook during lab of all the information necessary to communicate your results Keeping this ingood form and organized will make reports easier Descriptions and instructions for writtenreports related exercises and the presentation project can be found on page 3 and following
Science as practiced is increasingly a collaborative endeavor It is my hope that anenvironment of active learning and cooperation can be cultivated in laboratory and I welcome andencourage your participation Laboratory work is rigorous and I expect everyone to work hardbut if you are having problems with the course please let me know I am here to help you learnTo help answer questions you have about the course I will be using e-mail Expanded commentsabout e-mail are available upon request As an additional note you should be aware that you mayuse the lab section e-mail alias (f-che-255--labgacedu where is your lab section number) toask questions of other lab members in your section
I expect to be learning a great deal this semester I am very enthusiastic about being andbecoming an excellent educator both for you and my future students I welcome your constructivesuggestions as to how to improve laboratory and my teaching I invite you to present and discussyour suggestions with me in my office at any time during the semester
Note about academic honesty Issues of academic honesty are a serious matter As yourwriting will be a principle vehicle for assessment of your work in the laboratory it is important thatyou understand my academic honesty policy specifically regarding plagiarism Consult the CHE255 course syllabus for details about these matters
Students with disabilities Appropriate accommodations will be made for students withdocumented disabilities If you have a disability requiring accommodation in this class pleasecontact either me at my extension or Jane Patchin at x7027 Information concerning a disabilitywill be kept strictly confidential
3
GUIDELINES FOR WRITING LAB REPORTS
You will be writing short reports (see page 5) for Expt 1 and 2 and a formal lab report (see page6) for Expt 3 You should write your lab reports short or formal following the relevantguidelines for the format of a scientific research paper outlined below (NOTE for short reportsonly the Materials and Methods and Results sections apply) In addition you should write yourreports for a peer audience specifically so that they can be read and understood by someone withabout the same approximate general knowledge of biochemistry Keep in mind that scientificwriting is concise and terse Say only what is needed for clarity My hope is that by defining youraudience for you it will make easier decisions about what detail should and should not beincluded Although I encourage you to work with your lab group to understand the experimentsand data lab reports are to be written on an individual basis and in your ownwords Reports must be turned in by 530 pmthe day they are due as indicated on the schedule
There are many good reference manuals for scientific writing including The ACS Style Guide AManual for Authors and Editors edited by Janet S Dodd (Amer Chem Soc) available in thecollege library See also material from JRL Walker on reserve in the library However we willalso be spending laboratory class time discussing and evaluating samples of scientific writingThere will also be instructor and peer feedback on the first draft of your formal report followed bya consultation with the instructor before the final draft is to be compete
In your reports include the following sections in the order given
Title page First page has the paper title date author(s) and relevant biographical information
Abstract Summarize the major points of the report including a one sentence statement of whatwas doneattempted all significant dataresults obtained and a brief statement about the meaningof the results This section should be very concise and not exceed one paragraph in length
Introduction Provide background material needed to support and understand the data presentedin the report from the angle you present it This means that your choice about whether to presentthe material as a novel discovery or as a methods development should impact the content of yourintroduction Think about the following questions What were you trying to accomplish in thisexperiment Given your answer to that question what does the reader need to know or toremember in preparation for reading a description your experimental results Include in thissection an introduction and pertinent background to the topic of the paper the purpose of yourexperiment(s) the theoretical basis or rationale for the experiment(s) and the significance(expected or real) of the result(s) you sought Do not include any methods or results here
Materials and Methods (Experimental) Describe exactly all the methods and reagents youused in the experiment using passive voice Where the lab manual or other sources providemethod details I want you to reference the source (with a parenthetical inset) but to write in yourown words a description of the method Be sure to list your source reference in thebibliography Copying from the lab manual is not permitted This section should be as brief aspossible yet allow your peers to repeat exactly the experiment you described given only yourreport as a guide For example it is important to list the composition of all buffers and othersolutions used in the experiment but not to describe how they were prepared or how much wasmade In contrast the amount used in the particular experiment may be important
Results Report all data obtained Relevant data should be clearly presented in Tablesandor as Figures To be clear all figures and tables must have a title (following the figure or
4
table number in the legend) properly labeled components (axes units of measure etc) andinclude figure legends with relevant information not already in the figure such as the identity ofsymbols used wavelengths amount of sample used etc Include only essential information in thefigure legends that is already described in the Materials and Methods section The Results sectionmust also include textual explanations of the results as well It is often helpful to think of thetextual part of the results section as serving the function of telling a story about your resultsThis has several implications First introductory or transition sentences can be very helpful Theuse of these seemingly extra words does not have to be in conflict with being concise and it mayyield clarity that allows it all to be said with less Secondly a good story does not covereverything but will report the most significant details Thus although a good Results sectionreports all the details the text of your Results may leave some details present only in the tables orfigures The idea is to lead your reader through the results you obtained from your experimentsnot to simply reiterate the methods Primary data (spectra and kinetic recordings) should beretained dated and kept in your notebooks It is important to provide equations used to calculateimportant experimental values but do not show the actual calculation unless the actual result comesfrom a computational approach These can be placed in the methods when VERY routine in theResults text or Figure Legends but not more than one of these I require you to use the past tensein your Results section (what DID you obtain in this experiment)
Discussion Analyze the data reported in the results section Try to answer the questions Whatdo these data mean How do the results advance the knowledge in this field of study What futureexperiments are suggested by your work Do not simply summarize the data again Use the pasttense here (what DID this experiment reveal) Be sure to address all the questions listed at the endof each experiment in this manual
References As laboratory research relies on previous work written reports must includereferences Inadequate or inappropriate referencing should be avoided Include references to anyjournal articles books laboratory techniques manuals etc used to complete your lab reports bothas parenthetical references (in the correct location of the text) AND in the bibliography Listreferences in proper scientific format Research journals in biochemistry use varied systems forreference citation For this course use the following format
First-last-name First-initial Second-last-name Initial and Last-last-name Initial (Date)Title Journal Title Standard Abbreviation Volume number first page-last page
For further information about writing lab reports consult the article on reserve in the collegelibrary Walker JRL (1991) A studentrsquos guide to practical write-ups Biochem Ed 19 31-32
Lab Notebooks Presenting scientific results (written or oral) is an essential part of the scientificendeavor and thus a focus of this class Having an accurate and real record of what you actuallydid and what resulted is critical to communicating your results Therefore you must keep anotebook during the lab that includes all of the information methods data etc that are necessaryto repeat and communicate your results Researchers in biochemistry use a variety of notebookformats ranging from bound carbon-copy notebooks to loose paper kept in a ring binder Youmay choose your own approach but your notes must be legible clear complete and well-organized so that someone could read understand and repeat your work Ask if you want helpwith this It will be incredibly helpful to you in creating well-written lab reports
Other NotesYou will need a PC-formatted disk on which to save all data generated in this lab includingspectroscopic data Nothing will be safe stored only on the hard drive of the computers in lab
5
Short Reports for Laboratory
Project OverviewThese assignments are short length reports formal in format and intended to improve yourscientific communicating and writing skills by practicing communicating what you did inlaboratory to a peer level audience
Learning Objectivesbull Convey concisely precisely and with understanding the methods for the relevant
experiment (NOT simply a copy of the lab manual) in a Materials and Methods sectionbull Report in narrative form and with understanding the results of the relevant experiment
supported by all of the data in either tabular or figure formatbull Communicate a well understood and well written report (ie complete concise and good
use of bibliographic references and proper English)
Directions and FormatThe short format report should be a brief typed report including only the Methods and Materialssection and Results section (including data analysis and equations) of a formal report plus theanswers to questions from DATA ANALYSIS of the experiment Refer to the preceding pages fordirection on the writing of the short report Additional reference material is available in the libraryas noted in the lab manual
A formal length requirement is not going to be enforced but make sure you follow closely thedirections regarding clarity of communication while being concise in your presentation of what youneed to say Format requirements include a report that is typed double spaced with one inchmargins all around and using a font that is no less than 12 points Placement of figures and tablescan be in the text or at the end but must have titles and figure legends Use headings toidentify the Materials and Methods (one section) and Results sections Note the directions on useof VERB TENSE in scientific writing The report should be nicely printed but need not bebound except by staple or paper clip
Evaluation CriteriaThe report will be evaluated based on how well you accomplish the learning objectives outlinedabove I want to be convinced from your report that I could repeat the experiment given what youhave written I will also be looking for whether you have done a high quality and complete job ineffectively communicating your results including your ability to write a good narrative and notjust a list of references to the figures and tables I will be looking for clear and concisecommunication completeness and a good understanding of your topic I will also be looking forcorrect labeling of figures (units labeled axis etc) and proper and adequate use of references
6
Formal Report for Laboratory
Project OverviewThis assignment is a formal laboratory report to be written in science journal article format Theintent of this project is to provide an opportunity for you to 1) develop an appreciation for thedevelopment and theory of techniques you used in the laboratory exercise 2) gain a deeperknowledge and understanding of the biochemistry central to the laboratory exercise and thefundamentals of biochemical research in general and 3) learn how to communicate effectively theresults of your laboratory efforts in a professional format Together this assignment serves toprovide a vehicle toward achieving the course objectives
The Expt 3 formal report will be initially evaluated (and graded) as a first draft The writing in thefirst draft will also be critiqued through a peer review exercise (see below) Two of your peerswill critique your draft (and you will critique othersrsquo drafts) Peer critiques will be graded I willassemble the critiques as a whole and provide you with the respective feedback You will thenhave the opportunity to discuss your writing with me during a scheduled consultation The finaldraft of the Expt 3 formal report will be due one week later (see syllabus page 1 for dates)
Learning Objectivesbull Convey an understanding of the techniques (use theory etc) used in the laboratory
exercise in the context of presenting your resultsbull Demonstrate knowledge and understanding of the biochemistry and the approach of the
exercise and appreciate the significance of your resultsbull Communicate a well researched and well written report (ie complete concise and good
use of bibliographic references and proper English)
Directions and FormatThe directions for writing formal laboratory reports are well elaborated on pages 3-4 Additionalreference material is available in the library as noted A formal length requirement will not beenforced but make sure you follow closely the directions regarding clarity of communication whilebeing concise in your presentation of what you need to say Format requirements include a reportthat is typed double-spaced with one inch margins all around and using a font that is no less than12 points Placement of figures and tables can be in the text or at the end but figure legendsmust accompany them Headings should be used for each of the key sections of a scientificarticle including abstract introduction materials and methods (one section) results discussionand references Note the directions on use of VERB TENSE in scientific writing The reportshould be a quality printing but need not be bound except by staple or paper clip
Evaluation CriteriaThe report will be evaluated based on how well you accomplish the learning objectives outlinedabove I want to be convinced from your report that you have done a high quality and completejob in effectively communicating your results In your writing I will be looking for clear andconcise communication completeness and a good understanding of your topic I will also belooking for correct labeling of figures (units labeled axis etc) proper and adequate use ofreferences and a discussion that is thoughtful and possibly even creative
7
Scientific Writing Discussion
For this exercise we will be discussing and hopefully learning about scientific writing Thevehicle for our discussion will be in part your reflection and responses to reading the writing in thetwo successfully published biochemical papers provided We will be analyzing the papers for theirwriting rather than their scientific merit Learning to think about the intended reader before orwhile writing is a great vehicle for clear writing However to aid in your assessment of thewriting you will need to have a sense for the science presented I recommend reading both papersonce to get a general sense for their content the types of experimental questions asked the types ofexperimental techniques employed and the outcome and significance of the work After you havedone this you should read the list of questions or points for reflection below and then re-read andanalyze the writing in both papers The papers I have provided intentionally represent twodifferent formats so that comparison and contrast might aid our discussion The main idea behindthis exercise is that reflecting upon and discussing scientific writing as a reader should make moreexplicit to you elements of scientific writing that make it good Once you recognize these elementsexplicitly you can then apply yourself to emulating those elements of quality in your own writing
How does the writing in these papers differ from other types of writing you have encounteredHow does the writing in the two papers differ from each other
What is the general scheme for organization of both papers How do they differ
Look at the respective sections of each paper in light of the function outlined for them in thelaboratory manual (pp 3-4) How do the sections of each paper fall short meet or exceed thesegoalsfunctions How are the papers similar or different in this regard
In order for others to repeat published work it is very important that the description of what wasdone is complete Could you repeat the experiments (or does it seem like you could) described ineither paper given what the authors providedescribe Is one of the papers better in this regardWhich one and why
Figures and tables and their legends play a key role in effectively and clearly presenting scientificresults Can you tell what question the experiment in the figure is trying to answer Can you tellwhat techniques were used to obtain the results in the figure How were the samples (if any)prepared How do the symbols or labels aid your understanding of the data What features aremost helpful or essential
What do you notice about the verb tense used throughout the different sections of a given paperWithin the individual sections of a given paper Between the two different papers What role doesthis play
Clarity of scientific writing is of key importance Are the respective sections of each paper clearAre the figures tables and figure legends (as presented) clear Overall what do you thinkcontributes to whether these papers achieve clarity (or fail to) For example how does theirorganization format use of verb tense etc help or hinder this Is one paper more clear than theother If so why
Having thoughtfully analyzed these papers as a reader what would be your main goal (ie whatwould you try to achieve) as you write a scientific paper What would you try and avoid
What other observations or questions do you have concerning the writing in these two paper
8
EXPERIMENT 1 Introduction to Basic Biochemical Techniques
Biochemistry is a very broad discipline but there are certain basic techniques that every biochemistuses in the laboratory Three of these basic techniques are emphasized in this exercise and theyare (1) Measurements (2) Dilutions and (3) UVvis Spectroscopy This experimentintroduces you to these essential techniques and gives you a chance to try them for yourself Inthis experiment you will utilize these techniques to measure the concentration of protein in solution(the Bradford assay) although you will use these techniques repeatedly throughout the semester
(1) MEASUREMENTS
Many biochemical measurements are made on a very small scale using micropipettors many ofwhich are air displacement piston pipettes such as the Rainin Pipetmantrade They are quick andconvenient but their accuracy is dependent on how they are adjusted and used Below are volumeranges cautions and instructions for using the pipettors If you have not used pipettors before orif it has been a while practice using them with water before proceeding to the Bradford assay
Volume Ranges for Pipettors In biochemistry laboratory we will use sets of pipettors whichmeasure volumes on a microliter scale The following summarizes the three basic models Small-volume model generally 1-20 microl in 002 microl increments (recommended range is 1-20 microl) Mid-volume model 1-200 microl in 02 microl increments (recommended range is 20-200 microl) Large-volume model 1-1000 microl in 20 microl increments (recommended range is 200-1000 microl)
CAUTIONS for using the pipettors1 NEVER invert the pipettor or lay it on its side with liquid in the tip This can result in liquidentering the barrel andor piston This liquid may carry over and contaminate subsequent samplesIn addition it is possible that certain solutions may damage the piston (see 2) If this happensthe pipettor should be disassembled cleaned and dried (please inform your instructor)
2 DO NOT use volatile or highly corrosive liquids Use of highly volatile organic solventswill prevent the tip from filling completely due to their high vapor pressure Highly corrosiveliquids such as concentrated acids may cause corrosion of the stainless steel piston The pipettorshould be disassembled cleaned and dried after such use 3 FOR ACCURACY when making dilutions always pipet the largest volume into your tube orflask first Then pipet the smaller volume into the larger volume When adding a small volume toa larger volume never dispense the sample onto the side of the tube or flask Ratheralways submerge the end of the pipette tip into the solution before dispensing the smaller volume
Operation of Pipettors1 Set the desired volume by turning the volume adjustment knob until the correct volume showson the digital indicator For best precision approach the desired volume by dialing downward(at least one-third revolution) from a larger volume setting
To accurately set the desired volume on the pipettor it is important to recognize the position of thedecimal point On the small-volume model the decimal point is between the middle and lowestdials with tenths of microliters indicated in color or by a line On the mid-volume model thedecimal point is absent and two-tenths of a microliter subdivisions are indicated on the lowest dialOn the large-volume model the decimal point is either between the top and middle dials withmilliliters indicated in color and hundreds and tenths of microliters indicated in black on the lowertwo dials or missing so that the dial that shows 1000 microl with two-tenths subdivisions
9
2 Attach a new disposable tip to the shaft Press firmly with slight twisting to insure a positiveairtight seal Loose tips can result in sample leakage or the tip falling off at an inappropriate time
3 Slowly depress the plunger to the first positive stop (where you feel stronger but not totalresistance) This is the calibrated volume displayed on the digital readout
4 Hold the pipettor vertically and immerse the tip just below the surface (a few mm) of liquid
5 Allow the push button to return slowly to the up position Never permit it to snap upThis can result in liquid being pulled into the barrel andor piston causing the types of problemsyou have been cautioned about above
6 Wait several seconds to insure that the full volume is drawn up into the tip More viscoussamples or very fine tips require a longer period of time
7 Withdraw the tip from the sample liquid If any liquid remains on the tip exterior wipe it with aKimwipe taking care not to touch the tip opening OR drain it by touching the containerrsquos side
8 To dispense the sample depress the plunger slowly to the second stop Always assess that allthe liquid has been dispensed before removing your pipettor (viscous solutions may take severalseconds to be completely expelled from the pipette tip)
(2) DILUTIONS
Please read Appendix I Concentration and Dilution before coming to lab In this exerciseyou will be making a series of dilutions of a 2 mgml bovine serum albumin (BSA) stock solutionusing Tris buffer These dilutions will provide your protein concentration standards which youwill use to determine the concentration of a protein solution of unknown concentration so accuracyis important Serum albumin is an important transport protein in all mammals acting as a carrierfor several substances in the blood most notably fatty acids BSA in particular is frequentlyused as a source of protein for concentration standards as it can be effectively isolated from asource that is both abundant and readily available (cow serum) and is therefore less expensive
(3) UVVIS SPECTROSCOPY
Please read Appendix II Spectroscopy on spectroscopic principles UVVis spectroscopy isa very valuable biochemistry laboratory tool for assaying directly or indirectly the concentrationand concentration changes of various biomolecules Using enzyme proteins as an example theconcentration changes of substrate or product molecules in the presence of the enzyme provideimportant data about the enzymersquos activity We will use UVVis spectroscopy to do this type andother types of measurements in several experiments this semester so to understand what we willbe doing later it is important for you to become familiar with the principles involved now
We will be using Cecil spectrophotometers in these and other experiments throughout the semesterTherefore you will want to use today to learn how to use the instruments in preparation for otherexperiments during the semester The software-spectrophotometer interface is Windows based andfairly intuitive You will have opportunity to ask questions following a brief demo of theinstrument and the instructor and laboratory assistant will be able to help you if questions arisefrom your efforts to learn about the instrument
10
BRADFORD ASSAY
The Bradford spectrophotometric assay (Bradford MM 1976) provides for the indirectmeasurement of protein concentration in solution and is a commonly used method In fact youmay have already used it but if not you will use it today and in later experiments this semester
As an indirect measurement of protein concentration the Bradford spectrophotometric assay doesnot measure the light absorbed directly by the protein in solution Rather the assay measures thelight absorbed by a specific dye that absorbs more of certain wavelengths of light (and less ofothers) when bound to proteins then when it is not In simple terms the physical interaction of thedye and protein in solution results in an observable change in color This assay is an example of adye-binding assay and as such its fidelity in measuring protein concentration is dependent uponthe physical and chemical conditions influencing the interaction between protein and dye
In the Bradford assay the dye used isCoomassie Brilliant Blue G-250 a sulfatedcompound (Figure 1) When not bound toproteins the dye exists largely in the redform (Amax 465 nm) The blue form of thedye (Amax 595 nm) carries a (-) charge andinteracts with (+) charges on proteins to forma complex (Chial et al 1995) Increasing theamounts of the complex (which when thedye is not limiting depends upon the amountof protein) results in an increase in theabsorbance at or near Amax This reaction isvery rapid and reproducible Samples arestable for up to one hour at roomtemperature
The increase in absorbance resulting frominteraction of the dye with protein is monitored using a spectrophotometer To calibrate theabsorbance to protein concentration a series of protein standards are assayed and a plot ofabsorbance verses protein concentration (standard or calibration curve) is generated This graph isused to determine the concentration of proteins in experimental samples based upon the absorbanceof those samples
EXPERIMENTAL PROCEDURE
Materials providedTris buffer [10 mM Tris-HCl (pH 70)]Bovine serum albumin (BSA) stock solution [2 mgml BSA in Tris buffer (pH 7)]Bradford reagent [001 (wv) Coomassie Brilliant Blue G-250 47 (wv) ethanol
85 (wv) phosphoric acid]Mock Bradford solution [47 (wv) ethanol 85 (wv) phosphoric acid]
1 Obtain some stock solution of BSA In microfuge tubes prepare a series of BSA solutions ofvarying concentration by diluting the 2 mgml BSA stock solution with Tris buffer You will need~200 microl of each dilution at the following concentrations 005 mgml 01 mgml 02 mgml 03mgml 04 mgml 05 mgml and 06 mgml Be sure to label each tube (compoundconcentration your initials date) Keep the unused portion of your samples at 4degC for Expt 3
11
2 Add 25 ml of Bradford reagent to a separate test tube or cuvette for each of your samples andlabel them appropriately Consider the value of determining the concentration of one or moredilutions of your unknown sample as well as the undiluted (ldquoneatrdquo) unknown sample Prepareyour samples by adding 50 microl of each protein sample (diluted standard or unknown) separately tothe Bradford reagent in the appropriately labeled tube Mix the tubes by gentle inversion severaltimes and let the color develop for 5 min Observe and record the color change of your standardsamples as a function of protein concentration By comparing your unknown to your proteinstandards determine as closely as you can the concentration of your unknown by eye
3 While the color is developing set up the spectrophotometer Prepare a blank sample by mixing50 microl Tris buffer with 25 ml Bradford reagent and another by mixing 50 microl Tris buffer with 25ml Mock Bradford solution
4 You will need to determine which portion of the UVvis spectrum specifically whichwavelength will be useful for following the dye bound by protein Using your Mock Bradfordblank sample in a plastic cuvette set the background for the spectrophotometer Take a fullspectral scan of your Bradford reagent blank prepared in step 3 When your standard sampleshave fully developed take a full spectral scan of the most concentrated standard you prepared
5 Based on your results chose a single wavelength suitable to analyze the results of your dyebinding assay Measure and record the absorbance of each standard and unknown sample at yourchosen wavelengths using plastic cuvettes These data may be obtained from spectral scans orfrom single wavelength readings In either case you must consider your data in light of thebackground absorbance of your ldquono proteinrdquo sample
6 Prepare a plot of the values of absorbance above background verses protein concentration forthe standard samples and fit the data to a line by linear regression Using the resulting equationfor this line and the value of absorbance above background for unknown sample determine theprotein concentration of your unknown
DATA ANALYSIS
For Expt 1 you are to write a short lab report (see page 7) Using the instructions on pages 5-6prepare a type-written report that includes only the Material and Methods and Results sections plusanswers to the questions below Include all of the data obtained (in a table) a standard calibrationplot figure with relevant equations and the concentration of your unknown protein sample
Questions1 How close was your determination of your unknown protein concentration by eye to thedetermination by Bradford assay What did you learn from this exercise
2 How appropriate is BSA as a concentration standard protein considering standard calibrationplots are often used to determine the concentration of proteins other than BSA (see Chial et al)
3 If you measured the concentration of a dilution of your unknown sample what did you learnfrom this measurement
References Bradford MM (1976) Anal Biochem 72 248-256
Chial HJ Congdon RW and Splittgerber AG (1995) J Chem Ed 72 76-79
12
EXPERIMENT 2 Amino Acid Composition of a Dipeptide
Much can be learned about a protein or peptide by determining its amino acid composition (andsequence) To determine the amino acid composition all peptide bonds in a purified protein mustbe cleaved (either enzymatically or with strong acid or base) and the individual amino acids must beseparated identified and quantified Thus there are three aspects to this type of experiment 1)the reaction chemistry 2) the separation of the reaction components and 3) the assay oranalysis of the outcome (identificationquantification)
For the reaction chemistry of this experiment we will be using enzymatic hydrolysis ofpeptide bonds This approach is advantageous because acid hydrolysis tends to destroy someamino acids There are many enzymes collectively called proteases or peptidases that cleavepeptide bonds Some are endopeptidases in that they cleave internal peptide bonds others areexopeptidases in that they cleave N- or C-terminal peptide bonds In this experiment we will usethe enzyme carboxypeptidase A which cleaves C-terminal peptide bonds to cleave the onepeptide bond present in a purified dipeptide of unknown amino acid composition
The reaction chemistry of our experiment depends on the activity of an enzyme preparation(presumable highly purified) Because enzymes are labile molecules and can lose their activity (iewhen they denature) we will adopt an experimental strategy that implicitly reveals the status of ourenzymersquos activity along with the experimental result We will utilize a comparative approach byseparating and assaying dipeptide ldquotreatedrdquo and ldquountreatedrdquo with enzyme We expect that theenzyme activity will result in a change to the treated dipeptide By including the ldquountreatedrdquoreaction as a control we would observe no change if the enzyme activity were lost or absent
The separation of molecules of interest from uninteresting ones is a fundamental tool tobiochemical research In this experiment separation of amino acids will be done using simplepaper chromatography to illustrate general principles of separations All chromatographictechniques are based on the principle that the solute of interest partitions in a characteristic waybetween a stationary phase and a mobile phase The mobile phase (a gas or liquid) moves thesample solute through a region containing the stationary phase (a liquid or solid) The theory andpractice of paper chromatography are very similar to those of thin-layer chromatography (TLC)which you used in Organic Chemistry lab In paper chromatography a piece of paper composedof cellulose is extensively hydrated so solutes (amino acids here) partition between theimmobilized water (stationary phase) and the solvent used to run the chromatograph (mobilephase) We will see additional application of the principles of this fundamental tool ofbiochemistry in the separation and purification of an enzyme protein in Expt 3
The assay of our experimental outcome involves the identification of the amino acids (we willnot be quantifying the results of this more qualitative experiment) The first step in identification ofthe amino acids involves their detection Detection of amino acids is accomplished by treating thepaper with ninhydrin which turns purple upon binding the free primary amino groups of aminoacids Consult your organic chemistry textbook to review the reaction chemistry of ninhydrinAssigning an identity to each unknown amino acid is accomplished by including on thechromatograph samples containing a known amino acid and comparing the relative mobilities ofsolutes in your unknown sample with those of known standards The relative mobility of amolecule is indicated by the Rf value
Rf = Distance (origin to sample spot) divide Distance (origin to solvent front)
Rf values vary with solvent type of stationary support (eg cellulose silica gel) and temperature
13
EXPERIMENTAL PROCEDUREMaterials provided
Enzyme buffer [25 mM Tris-HCl (pH 75) 500 mM NaCl]Unknown dipeptide [2 mgml in enzyme buffer]Carboxypeptidase A (500-1000 unitsml)10 M acetic acidAmino acid standards [1 mgml in enzyme buffer]Whatman 3MM chromatographic paper 20x20 cmChromatographic solvent [6040 acetonitrile01 M ammonium acetate] and jar or chamberNinhydrin solution [02 ninhydrin in ethanol]
1 Set up three tubes First in each of two microcentrifuge tubes place 100 microl of unknowndipeptide solution To one of these tubes add 5 units carboxypeptidase A and to the other tubeadd a volume of enzyme buffer equal to the volume of enzyme added to the first tube As a controlfor amino acids contributed from the enzyme source place 100 microl of enzyme buffer in a tube andadd 5 units of carboxypeptidase A Mix all tubes gently by tapping them with your fingerIncubate for one hour at 37degC in a water bath
2 For the following step wearing laboratory gloves Amino acids deposited on yourchromatography paper from the skin of your fingers are abundant enough to be detected byninhydrin as fingerprints (this is used in forensic science) Prepare a piece of Whatman 3MMpaper for chromatography Lightly mark the origin 2 cm from one edge (the bottom) of the paperwith a pencil Indicate with dots where each sample and standard will be loaded onto the paper atthe origin keeping the dots at least 15 cm apart You will need 4 lanes for your sample and onelane each for each of the amino acid standards Label each dot Also prepare the solvent chamberby adding enough solvent to reach 1 cm height in a large glass jar or plate chamber Close the lidso that the solvent vapor and liquid phases equilibrate
3 Add 50 microl 10 M acetic acid to all three tubes including the reaction tube and the control tubesMix Acetic acid stops the enzyme-catalyzed reaction and causes the enzyme to precipitate
4 Spin each tube in the microcentrifuge for 10 min at 3000 rpm to pellet any precipitate
5 Carefully remove 50 microl of the supernatant from each tube taking care not to disturb any pelletat the bottom of the tube
6 Load 2 microl of each amino acid standard Based on the amount of standard used determine abouthow much unknown sample you will need Load two different amounts of each unknown sample(plusmn enzyme) to the paper separately at two dots Let loaded samples air-dry briefly
7 Roll the paper into a cylinder and staple the edges taking care not to let the edges touch if usinga large jar This is easier if one person holds the paper in a cylinder and another staples Securepaper to insure it remains upright if you are using a plate chamber Make sure the solvent inthe chromatography chamber is below the origin on the paper then drop the paper intothe solvent chamber Let the chromatograph run for approximately 1 hour or until the solventfront is 1-2 cm from the top of the paper
8 Remove the paper from the chamber quickly but carefully remove the staples and mark thesolvent front lightly with a pencil Let the solvent air-dry When dry spray evenly with ninhydrinsolution in the hood The paper should be damp but not dripping with ninhydrin solution Placethe paper upright in the oven at 110degC until the purple spots develop (~ 15 minutes)
14
9 Calculate Rf values for the standards and unknown sample If the spots are broad measurefrom the middle of the spot
DATA ANALYSIS
For Expt 2 you are to write a short lab report (see page 7) Using the instructions on pages 5-6prepare a type-written report that includes only the Material and Methods and Results sections plusanswers to the questions below Include all of the data obtained (Rf values in a table) and theamino acid composition of your unknown dipeptide sample
1 Look up the substrate specificity of carboxypeptidase A You might find this in one or more ofthe books on enzymes in the library another biochemistry text or on web resources Could youuse this enzyme to cleave the C-terminal peptide bonds of any peptide Explain your reasoning
2 Can you determine or predict the amino acid sequence of your dipeptide How could youchange this experiment to determine the sequence of these two amino acids in the dipeptide
15
EXPERIMENT 3 Purification of AMP Aminohydrolase
In Expt 2 you learned that the separation of molecules from each other is a fundamental tool usedin biochemical research Separations can be employed for analytical purposes (as in Expt 2)which often involve small amounts of material or for preparative purposes which involve largeramounts of material and aim to recover relatively pure molecules for additional study Inbiochemistry a common goal for employing separation techniques is the purification of a proteinof interest for preparative purposes This is a daunting task The development of a successfulprocedure for purifying the protein of interest from the hundreds of other proteins in the startingmaterial often requires trying a series of some of the variety of separation methods in differentorders andor combinations Each separation method generally exploits a specific physicalproperty of the protein of interest that ideally is not shared with too many other proteins in thestarting material In an effective purification the relative purity of the desired protein is increasedby combining two or more separation methods each of which generally exploits a differentphysical property of the protein With each additional step however the final amount of proteinrecovered generally becomes less
Effective protein purification usually requires at least one column chromatography separation Thegeneral principles of chromatographic techniques were introduced in Expt 2 Remember allchromatography is based on the principle that the solute of interest partitions in a characteristic waybetween a stationary phase and a mobile phase The mobile phase (a liquid in this experiment)moves the sample solute (protein of interest) through a region containing the stationary phase (asolid resin in this experiment) The type of chromatography used in this experiment is calledaffinity chromatography as it exploits the high binding specificity and affinity the desired proteinhas for the stationary phase The binding of the protein of interest to the stationary phase has thepotential to very effectively remove it from the hundreds of other proteins in the mobile phase Ifno other proteins in the starting material share the affinity the desired protein has for the stationaryphase affinity chromatography can very powerfully permit complete purification
The goal of this experiment is to purify the enzyme AMP aminohydrolase from chicken muscleAMP aminohydrolase (or adenylate deaminase) is an abundant enzyme in contracting muscle andis involved in the degradation of purine nucleotides It catalyzes the hydrolysis of adenosine5rsquo-monophosphate (adenylate AMP) to inosine 5rsquo-monophosphate (IMP) plus ammonia
The column chromatography step that you will use has been selected based on the specific bindingproperties of AMP aminohydrolase Often a researcher can predict that a specific enzyme mightbind to a chromatographic resin (stationary phase) if the ligand attached to the resin resembles theenzyme substrate The enzyme binds to a substrate or substrate analog ligand immobilized on theinsoluble matrix of resin It can then be washed free of other proteins and eluted by a change in themobile phase that will alter the affinity of the protein for the resin-ligand and cause its release
16
The resin used in this experiment is phosphocellulose which contains a high number ofnegatively-charged phosphate groups attached to cellulose It is most frequently used as a resin forion-exchange chromatography However since AMP aminohydrolase binds to the substrateAMP which contains a negatively-charged phosphoryl group one might predict that it will alsobind to this resin If it binds to this substrate analog one might predict that the enzyme could beeluted by pyrophosphate (PPi) (an inhibitor of the enzyme) which decreases the affinity of theenzyme for its substrate (AMP) Pyrophosphate also partially mimics the phosphate groupsattached to the cellulose resin In this experiment you will characterize the effectiveness ofphosphocellulose as a matrix for affinity purification of chicken muscle AMP aminohydrolase
EXPERIMENTAL PROCEDURE
As biochemical purification is often fairly extensive Experiment 3 will be done over the course ofthe next three weeks In the first week you will prepare the protein extract from chicken muscleand chromatography resin and run a brief exercise intended to familiarize you with the Pharmaciachromatography system we will be using in the second week In the second week you willassemble and run the chromatography system to purify (hopefully) AMP aminohydrolase fromyour chicken muscle extract This week concludes with assaying the fractions you collect from thecolumn for enzyme activity pooling those of highest activity and dialyzing them to remove thepyrophosphate eluant from your purified enzyme sample In the third week you will assay themajor fractions of the purification for protein concentration and enzyme activity to help assess themethod You will also analyze these same fractions by sodium dodecyl sulfate-polyacrylamide gelelectrophoresis (SDS-PAGE) to assess relative complexity of the proteins in each sample and therelative purity and molecular weight of AMP aminohydrolase (see Appendix VI)
Week 1
This week your working group will be divided to provide a representative to a task groups thatwill accomplish the three tasks of this week preparation of chicken protein extract preparation ofchromatography resin and preparation for using the chromatography system next week As yourworking groups representative to one of this weekrsquos task groups it will be your responsibility tobecome involved in the task learn all that is necessary to do it independently and report back toyour group what you learned Your working group partners will share a similar responsibility toexplain to you how to do what they learned to do
Materials providedChicken breast muscle (from the local grocery store)Extraction buffer [018 M KCl 54 mM K2HPO4 32 mM KH2PO4 (pH 65)]Waring blender250 ml centrifuge bottlesFunnelGlass woolOakridge 40 ml screwcap polypropylene centrifuge tubesPhosphocellulose resin pre-swelled in dH2O overnightBasic resin wash solution[005 M NaOH 05 M NaCl]Acidic resin wash solution [01 M HCl]Glass columnsBuffer A [25 mM TrisHCl (pH 81)]Buffer B [25 mM TrisHCl (pH 81) 500 mM NaCl]protein standards [015 mgml equine myoglobin 038 mgml conalbumin 046 mgml
chicken albumin 038 mgml soybean trypsin inhibitor 25 mM TrisHCl (pH 81)]
17
CAUTION To prevent proteolysis and preserve enzyme activity keep all enzymefractions and all solutions at 4degC (in the refrigerator or on ice) as much aspossible during extraction and purification Carefully label all your samples
PREPARATION OF CHICKEN BREAST EXTRACT - Extract preparation will be done in batchand will be the responsibility of a group of four that includes one member of each working group
1 Quickly cut up one partially thawed chicken breast into small pieces (1 cm) Place 50 g in aWaring blender and homogenize with 200 ml of cold extraction buffer at high speed with five 15-sec bursts Make sure the blender lid is on tight Immediately pour homogenate into prechilled250 ml centrifuge bottles and keep on ice
2 Important balance centrifuge bottles to equal weights using Harvard Trip balanceCentrifuge the homogenate at 6000 x g (check specifications for rotor used) for 15 min at 4degC
3 Pour the supernatant through a funnel with a ldquofilterrdquo of glass wool into a beaker on ice Discardthe pellet Record the volume of filtrate and aliquot an equal volume into four polypropyleneOakridge tubes Seal screw cap and store tubes in the -20degC freezer until next week
PREPARATION OF PHOSPHOCELLULOSE RESIN AND COLUMN (adapted from directionsof Sigma Chemical Company) - The resin preparation will done as a batch and will be theresponsibility of a group of four that includes one member of each working group
1 Obtain the pre-swelled phosphocellulose resin (3 g = ~20 ml wet resin) and decant water
2 Add a volume of water 5 times that of the wet resin stir and allow to settle for 30-45 minutesWhen most of the resin is settled decant Record the resin volume
3 Suspend resin using 5 times the resin volume of basic wash for 10 min Pour slurry into acourse scintered glass funnel under gentle suction (~1 resin volume5 min) Continue until all ofthe slurry has been added and follow with a wash of 5 times the resin volume of deionized water at1-5 resin volumesmin
4 Use acidic wash to resuspend resin and remove it from the funnel Soak in a total of 5 times theresin volume of acidic wash for 10 min Pour slurry back into the course scintered glass funneland wash with 10 times the resin volume of water until flow-through shows a pH of ~5
5 Wash with 5-10 times the resin volume of extraction buffer until the pH of the flow-throughreaches that of extraction buffer (~ 65) Resuspend in extraction buffer and transfer to a beaker
6 Allow the resin to settle and decant all but one resin volume of buffer
7 (To be done by working group) Mix resin and buffer into a slurry (it will be 11 resinbufferslurry see step 6) and measure a volume of slurry equal to twice the amount of resin bed (gt 2 ml)desired in your column Dispense into your column cap and store at 4degC Record bed volume
18
PREPARATION FOR USING THE PHARMACIA PUMP AND COLLECTOR SYSTEM -Becoming familiar with how to use the peristaltic pump and fraction collector in preparation fortodayrsquos chromatography exercise will be the responsibility of a group of four that includes onemember of each working group The exercise itself is to be done by each working group
1 Identify how to assemble the tubing column and fraction collector and become familiar with itsplumbing and operation Determine how to make a two solution gradient (see instructordemonstration)
2 Once assembled as a working group instruct your group on what you have learned about theequipment you will be using for column chromatography
3 (As a working group) Fill the system line with buffer and eliminate air bubbles Set flow rate tobe constant at about 15 mlmin
4 Attach the ion exchange column to the system line and wash the column removing any air fromtubing with buffer A
5 Before starting set your fraction collector to begin collect 3 ml samples
6 Place inlet tubing into your protein standards solution without introducing any air (a slightsqueezing of the tubing can help achieve this) Run the pump until about 2 ml of your sample hasentered the tubing
7 Pause the pump and transfer the inlet tubing to buffer A Avoid introducing any air Run thepump for about two minutes
8 Pause the pump and transfer the inlet tubing to the gradient buffer set up without introducingany air Run the pump for 10 minutes
9 Pause the pump and transfer the inlet tubing to buffer B Avoid bubbles Run the pump for 6minutes
10 Pause the pump and transfer the inlet tubing to buffer A Avoid bubbles Run the pump for 6minutes
11 Determine the amount of protein in each of your fractions by either direct absorbance orthrough use of the Bradford assay (see Expt 1)
12 Plot the protein concentration or absorbance as a function of fraction number Assess theseparation of the various proteins in the standard mixture
19
Week 2
This week you will work with your working group and you will have a lot to do so preparationwill be especially helpful You will prepare your chromatography system for your purificationmethod and prepare the system by filling the line with the correct initial buffer You will assemblethe column-flow adaptor assembly and attach it in line with the chromatography system You willprepare and apply your sample to the chromatography system running a sequence of buffers toisolate and purify (hopefully) AMP aminohydrolase from chicken muscle extract Finally you willassay and determine which fractions have the highest enzyme activity pool and dialyze them(overnight) to remove the pyrophosphate eluant from your purified enzyme sample
Materials providedExtraction buffer [54 mM K2HPO4 32 mM KH2PO4 018 M KCl (pH 65)]Column wash buffer [045 M KCl 25 mM MES (pH 65) 1 mM 2-mercaptoethanol pH
adjusted with solid Tris]Pyrophosphate elution buffer [25 mM potassium pyrophosphate in column wash buffer]Flow adaptorFraction collection test tubesSubstrate buffer [015 M KCl 50 mM MES (pH 65) pH adjusted with solid Tris]Assay solution [5 mM AMP in assay buffer]SpectrophotometerDialysis tubing or cassettesDialysis buckets stir bars and stir plates
SAMPLE PREPARATION - As this takes a while and should not be rushed you will want to startthis at the beginning of the lab
1 Completely thaw chicken protein extract of week 1 on ice
2 Check balance of centrifuge tubes to insure or adjust to equal weights using Harvard Tripbalance Centrifuge the homogenate at 6000 x g (check rotor specifications) for 15 min at 4degC
3 Remove supernatant to new tube on ice Measure the extract volume and retain 05 ml aliquotin a microcentrifuge tube for analysis of activity
COLUMN PREPARATION - While your extract is thawing prepare your column
1 Fill the column with excess cold extraction buffer and allow several tens of milliliters to flowthrough to settle the resin bed further (gravity only goes so far)
2 Make sure there is ample extraction buffer in the column tube (5 times resin bed) and allow anyresin to settle that might have been disturbed during column filling
3 Fit the flow adaptor to the column taking care to avoid and eliminate bubbles (See demo)
SYSTEM PREPARATION - While the extract is being prepared assemble the Pharmacia pumpand collector system for purification of AMP aminohydrolase
1 Completely fill tubing with buffer to be used ie extraction buffer and purge system of air
2 Make sure column-flow adaptor lines are filled with extraction buffer and free of air
20
3 Install the column-flow adaptor assembly in the system avoid bubbles upstream of the column
4 Run extraction buffer slowly through the system for several minutes to purge any airdownstream of column and to test for any problems
5 Prepare a separate beaker with column wash buffer
6 Prepare apparatus to create a two-buffer gradient of column wash buffer and pyrophosphateelution buffer
RUNNING THE SYSTEM - As a group review from week 1 the operation of thechromatography system and the volume of your column resin bed (arbitrarily defined as 1 columnvolume or CV) Determine a desirable flow rate Using the guidelines below discuss yourseparation strategy and prepare a plan for your separation Remember you have a single inlet lineso think about the different solutions you need to have on hand to achieve the outcome you desire(ie you will need to move the inlet line between different buffers) Check your plan with theinstructor or a teaching assistant before beginning
1 Prepare your plan to use the pump for five steps using your selected flow ratea - Load extract (in extraction buffer) into system measurerecord the extract volumeb - Extraction buffer wash should be 5 CVs minimumc - Column wash buffer wash should be 5 CVs minimum The A280 of your post-columnflow should be 001 or lower if you have washed your column sufficiently well If notyou may wish to extend your wash step before eluting the column d - Gradient (0-15 mM PPi) elution step using column wash buffer and elution buffer(column wash buffer containing 25 mM potassium pyrophosphate 2-4 CVs)e - Final wash with column wash buffer to complete protocol 5 CVs
2 Set inlet line into protein extract (on ice) and start (run) the pump and collector
Note on loading extract volume Because the pump system is not precisely calibrated youmust measure initial and final volumes to determine the exact volume delivered to the column resinWatch during your extract loading to insure that you do not run out of extract or have too much leftunloaded before the second step IF you have protein extract that remains unloaded measure thevolume remaining It will be important to subtract this amount from the initial volume youintended to load or you will overestimate the enzyme activity exposed to the column
If it appears you will run out of extract PAUSE the pump Switch the inlet line to thenext buffer and resume the separation If it appears you will have too much unloaded extractcontinue running the pump to load what you want but be sure to make a record of the amountloaded Once it is adequately loaded PAUSE the pump to switch the inlet line to the next buffer
3 Pause the pump and switch the inlet line to the other buffers or gradients at the appropriate timesas per your plan Run steps for the times planned given the pump flow rate you determined
Note on pausing to switch buffers Stop the pump to move the inlet line to a new buffervessel which will prevent the introduction of air to your column If necessary squeeze theflexible pump tubing to extrude air before placing the inlet tube opening into a new buffer
21
3 Operate the fraction collection using a strategy that will separate your enzyme from othersa - Extract flow-through Using large fractions is convenient for collecting all of yourextract flow-through (post-resin extract) but you will need to use smaller fractions toobtain a small but enriched sample of purified enzyme Thus you may wish to changefraction size during your collection If your extract flow-through exists as more than onefraction pool these to create your ldquoflow-throughrdquo fraction and for analysis As the extractwill take some time to get through the system and to the fraction collector you can delaythe start of your collection appropriately In addition it will take some time for the extractin the system line to pass entirely through the system once you begin the first wash step soyou should not stop collecting when the first wash begins Overall it would be better toget all your flow-through extract and have some extra extraction buffer dilute your flow-through than to recover only part of your flow-throughb - Wash flow-through Collect the protein eluted with high salt column wash buffer(optional) This will allow you to assess if any of the enzyme activity is washed off withthis buffer change You can also check absorbance to see if you have washed enoughc - Elution of column Collect several and smaller fractions during the elution to captureand fractionate all of your sample The less volume you use for the elution the smaller thevolume you want these fractions to be Remember there is a time lag between application ofyour gradient and when it reaches the resin but here it doesnrsquot hurt to collect a few extrafractions before and after the program time of the elution to insure that you recover all ofthe interesting fractions
Note on chilling fractions collected As soon as physically possible label and place on iceeach fraction tube collected from the program method This preserves enzyme activity One wayto doing this is to set an ice bath in the collector tube holder itself Alternatively you may placetubes into an ice bucket
4 Record the results from your separation attempt (not just the method plan)
SYSTEM AND COLUMN CLEAN UP -
1 When the program is finished remove the column from the system line and clean the system bypurging distilled water through the lines extensively for several minutes Excessive washing iscritical to avoid clogging the fraction collector dropper When the system is adequately washeddisassemble the pump head leaving the inlet lines in distilled water and turn the system off
2 The column-flow adaptor assembly can be disassembled and the resin mixed into a slurry anddecanted to a ldquowasterdquo beaker Both the column and flow adaptor should be rinsed extensively withdistilled water and placed aside to dry
POST-SEPARATION ACTIVITIES - You will need to do several things once completed
1 Pool extract ldquoflow-throughrdquo fractions mix and measure the total flow-through volumeAliquot a sample to a microcentrifuge tube on ice
2 Measure and record the volumes of the extract loaded on the column (Vinitial - Vremaining) and theflow-through obtained afterward if you have not already
3 Perform the enzyme assay on the aliquot of protein extract and pooled flow-through fractionsas well as each of the elution fractions (and the column wash buffer fraction(s) if this was done)and the mixture of pooled elution fractions as directed below
22
4 Freeze the remainder of the extract and flow-through aliquots for determination of proteinconcentration and electrophoresis next week See below for treatment of the elution fractions
ENZYME ASSAY OF COLUMN FRACTIONS - Please read APPENDIX II Spectroscopyand review the use of the Beerrsquos-Lambert law before doing the following AMP aminohydrolaseactivity is determined by recording the change in absorption at 265 or 290 nm due to the differencebetween the spectra of AMP and IMP both of which absorb UV light There is much moreabsorption at 265 nm than at 290 nm In fact at high concentrations of AMP the level of A265 istoo high for the spectrophotometer to detect a change upon addition of enzyme Therefore at high[AMP] (greater than 02 mM) measure the initial increase in A290 per minute and divide by afactor of 012 (the difference in extinction coefficients of AMP and IMP) At low [AMP] (lowerthan 02 mM) measure the initial decrease in A265 per minute and divide by a factor of 876
1 Transfer exactly 1 ml of assay solution (5 mM AMP is saturating substrate) to a quartz cuvetteand zero the absorbance at 290 nm (make sure the solution is at room temperature)
2 Add an aliquot of enzyme fraction (10-25 microl) rapidly mix and record the increase in A290 forseveral minutes (or until it becomes non-linear) Make sure you use the same volume of enzymefrom each elution fraction so that you can compare the amount of activity in each fraction
3Determine the initial linear rate (∆Amin) and convert to enzyme activity [unitsml sample =∆Amin(012 x ml sample)] where one unit = 1 micromolmin substrate hydrolyzed in 1 ml assaymixture Use the volume of enzyme fraction added in the denominator to determine its activity
DIALYSIS OF PURIFIED ENZYME SAMPLE - Please read the section on dialysis in AppendixIV Enzymology before starting this portion of the experiment
1 Pool the major enzyme-containing fractions from the phosphocellulose column and mix gentlyMeasure and record the volume
2 Assay the enzyme activity using an aliquot of the pooled fractions and record the result
3 Remove an aliquot of the pooled fractions to a microcentrifuge tube label and freeze Thissample will be included in the Bradford assays you will be doing next week and serves to helpyou assess if there is any protein loss during dialysis
4 Wearing gloves place a dialysis cassette into column wash buffer to soak 1 minuteIntroduce the pooled fractions into the cassette using a syringe alternate introducing some samplewith removing some air After all sample has been introduced remove all air from the cassette
5 Insert cassette into a floatation aid and dialyze overnight at 4degC (in the cold room) against thewash buffer to remove pyrophosphate This should be done with gentle mixing using a stir barand a stir plate
6 (THE NEXT DAY) Remove the dialyzed sample (dialysate) from the cassette using a syringealternate removing some sample with introducing some air To avoid bacterial contaminationhowever make your sample 002 sodium azide Store at 4degC the pure dialyzed enzymeshould be stable for several weeks at 4degC
23
Week 3
This week you will work with your working group You will assay the major fractions of thepurification for protein concentration and enzyme activity to help you assess the method You willalso analyze these same fractions by sodium dodecyl sulfate-polyacrylamide gel electrophoresis(SDS-PAGE) to assess relative complexity of the proteins in each sample and the relative purityand molecular weight of AMP aminohydrolase
Materials providedSubstrate buffer [015 M KCl 50 mM MES (pH 65) pH adjusted with solid Tris]Assay solution [5 mM AMP 015 M KCl 50 mM MES (pH 65) pH adjusted with solid
Tris]SpectrophotometersTris buffer [10 mM Tris-HCl (pH 70)]Bovine serum albumin (BSA) stock solution [2 mgml BSA in Tris buffer (pH 7)]Bradford reagent [001 (wv) Coomassie Brilliant Blue G-250 47 (wv) ethanol
85 (wv) phosphoric acid]Pre-poured SDS-polyacrylamide gel (75 acrylamide)10X reservoir buffer [1 SDS 05 M Trizma Base 19 M glycine] Dilute 110 for use5X Gel Loading Buffer (blue juice) [100 mM Trizma Base 325 SDS 50 glycerol17 mgml bromophenol blue] Add szlig-mercaptoethanol just before use to 25 (vv) finalconcentration Use the hood it stinks Dilute 5-fold for useGel Stain [04 mgml Coomassie Blue R250 40 (vv) methanol 5 (vv) acetic acid]Gel Destain [10 methanol 15 acetic acid]MicrocentrifugeProtein gel electrophoresis apparatus and power supply
DATA COLLECTION FOR PURIFICATION TABLE
1 Assay as before your pooled dialyzed enzyme fraction and all purification fractions not yetassayed (crude extract flow-through and pre-dialysis elution pool) for enzyme activity
2 Assay all purification fractions for protein concentration using the Bradford assay (25 mlBradford reagent + 50 microl protein sample - Expt 1) Remember to generate a standard curve
SDS-POLYACRYLAMIDE GEL ELECTROPHORESIS - Please read Appendix VI SDS-PAGE before starting this part Each lab group should obtain and use or plan to share one pre-poured minigel (75 resolving gel with no upper stacking gel) to analyze their proteins
1 Prepare molecular weight standards and your four protein samples (1-crude extract 2-flow-through from column 3-pooled dialyzed enzyme fraction 4 - protein mass standards)Determine the volume of protein sample necessary to load 5 microg of each onto the gel as well as thatfor ~3 microg of SDS-PAGE molecular weight standards For concentrated samples it may benecessary for you to make a dilution in order to accurately pipet the desired amount For eachsample aliquot the determined volume into its own microfuge tube Add to each sample a volumeof 5X Gel Loading Buffer equal to one fourth the volume of the sample aliquot Make sure freshszlig-mercaptoethanol has been added to the 5X buffer Heat samples for 5 min in a boiling waterbath Note heating samples with szlig-mercaptoethanol denatures and reduces all proteins
NOTE The final volume of each sample need not be the same but it is best if it is 10-30 microl Thegel wells hold gt30 microl and small samples (lt10 microl ) may evaporate upon heating Adjust as needed
24
CAUTION UNPOLYMERIZED ACRYLAMIDE IS A NEUROTOXIN ALWAYSWEAR PROTECTIVE GLOVES WHEN WORKING WITHACRYLAMIDE GELS
2 Put on a pair of disposable gloves Place gel plate into the electrode assembly and assembleUse a buffer dam if only one gel is being run Pour 1X reservoir buffer into upper buffer chamberformed by these two plate holders Make sure no buffer leaks out If it does reassemble theapparatus If the upper buffer chamber does not leak fill the lower chamber up to the electrode atthe bottom of the gel(s) Using the pipettor apply each sample and protein standards into aseparate well of the stacking gel Record in your notebook which sample is loaded into each laneIf possible avoid loading sample in the outer lanes of the gel Avoid trapping large bubbles alongthe bottom edge of the gel plates
3 Run the gel at 15 mA (constant current) per gel (30 mA per two gels) After the tracking dyehas reached the bottom of the gel turn the power off Remove the plates and gently pry the platesapart Place gel in stain for 1 hr (or overnight) Wash all parts of the gel apparatus thoroughlywith soap and water and rinse with dH2O
4 (THE NEXT DAY) Transfer gel to destain solution until bands appear and the background isrelatively clear Rinse gel briefly in dH2O (optional 3 glycerol prevents cracking)
5 Dry the gel between two sheets of cellophane (as demonstrated by the instructor)
6 Measure the distance migrated for the protein molecular weight standards and all bands ofinterest See Appendix VI for determination of apparent molecular weight of your purified enzyme
DATA ANALYSIS
For Expt 3 you are to write individually a formal lab report (page 8) This will be handed in firstas a draft and critiqued by me and reviewed by two of your peers Using the instructions onpages 5-6 prepare a formal type-written report Include all of the data obtained specifically afigure of your chromatographic separation a table of the values of enzyme activity in your elutionfractions a table of raw data and corresponding values of enzyme activity and proteinconcentrations of your purification fractions a figure or table or equation for your Bradfordstandards a purification table (see below) a figure of your gel and a figure of the plot for yourprotein molecular weight standards Include in the purification table (see Appendix IVEnzymology) the total volume total amount of protein total units of enzyme activity specificactivity purification factor and percent yield of enzyme in each of the purification fractions(1-crude extract 2-flow-through from column 3-pooled enzyme fraction before dialysis and4-pooled dialyzed enzyme fraction mdash indicate which fractions were pooled in fraction 4) Alltables and figures should have legends and each component of all figures should be clearly labeled
You may report your findings from this experiment as if you are the first group to report thepurification of AMP aminohydrolase from chicken muscle OR as if you have discovered animproved one-step purification for AMP aminohydrolase Also include answers to the questionsbelow in the discussion in your report
25
Questions
1 How pure is the enzyme after phosphocellulose chromatography Is this an effectivechromatographic step to purify this enzyme Identify your criteria
2 What is the molecular weight of a monomeric subunit of this enzyme according to SDS-PAGEWhat is its native molecular weight How many subunits must it have (see APPENDIX VI)
3 How stable is the enzyme Identify your criteria
4 How does its purity compare with commercially available enzymes (Hint consult the Sigma orCalBiochem catalogs) Could this be a potentially lucrative commercial method
5 What do you think accounts for the enzyme activity lost during purification
6 What else did you learn about this enzyme Be specific
Reference Mahn MM and Husic DH (1989) Biochemical Ed 17 94-96
Boosman A and Chilson OP (1976) J Biol Chem 251 1847-1852
26
EXPERIMENT 4 pH Dependence of Fumarase
Enzymes catalyze chemical reactions by changing the rate of a reaction but not its equilibrium Thecatalytic effect of an enzyme is sensitive to the environment in which the enzyme functions Thenative environment for many enzymes is the inside of cells where conditions are establishedmaintained and modulated by cellular mechanisms to control enzymatic activity However once abiochemist has purified an enzyme that is interesting to study (as you have just done in Expt 3)she or he will most often modulate environmental variables likely to affect the activity of theenzyme in vitro This is done for two reasons First sometimes the influence of a certainenvironmental variable on enzyme activity is interesting in and of itself Secondly routineparameters are modified to identify conditions for optimal enzymatic activity in the non-nativeenvironment of a test tube This is done so that a large window of enzymatic activity is available toreveal the profound AND subtle effects of other interesting influences upon enzyme activity
Since most biochemical reactions occur in the aqueous medium of the cell and since manyreactions involve proton transfers pH is a very important variable in an enzyme-catalyzed reactionIn fact biochemist often spend a great deal of time and effort thinking about and testing suitablebuffers to control the effect of pH as a variable in the enzymersquos environment We have both of thepreviously mentioned reasons for understanding pH as an environmental variable We areinterested in the effect pH has on enzymatic activity but we are also interested in learning the pH atwhich the enzyme has optimal activity so that we can use that pH in experiments 5 and 6
In this lab you will explore the effect of pH on the catalytic activity of the enzyme fumarase(fumarate hydratase) Fumarase catalyzes the hydration of fumarate to yield L-malate one ofthe steps in the citric acid cycle
The citric acid cycle is part of the process of cellular respiration which serves to enzymaticallyoxidize the two-carbon fragments resulting from the oxidative breakdown of glucose and fattyacids to CO2 The enzyme catalyzed conversion of fumarate to malate is reversible both reactionsare mediated by fumarase (we will see this in Expt 5) The reaction can be inhibited (we will testthis in Expt 5) The reaction is also stereospecific (we will see this in Expt 6) mdash the enzymedoes not recognize the cis-isomer of fumarate (maleate) or the enantiomer of L-malate (D-malate)
The reaction catalyzed by fumarase can be followed spectrophotometrically because fumarate witha carbon-carbon double bond absorbs strongly in the near-ultraviolet (UV) range malate does notabsorb in this range As fumarate is converted to malate (in the forward direction of this reaction)the absorbance by fumarate in the near-UV range decreases over time Using this assay the rate ofthis reaction is defined in the forward direction as the amount of fumarate used up per unit timeThe rate in the forward direction can also be defined as the amount of malate formed per unit timeTo explore the effect of pH on the activity of fumarase you will use a spectrophotometer tomeasure changes in near-UV absorbance over time to determine the rate of fumarase activity inbuffers at various pH values From these data you will learn something about pH as anenvironmental variable affecting enzyme activity and the optimal pH for fumarase activity
27
To better understand the effect of pH on the activity of fumarase you will need to know about themechanism of fumarase action Fortunately the mechanism of this reaction has already been wellcharacterized (see Weaver and Banaszak 1996) It is an example of general acid-base catalysis(Fig 1) In acid-base catalysis acidic and basic chemical groups from the termini or amino acidside chains of the enzyme donate or accept protons from reactants to make the reactants betterelectrophiles or nucleophiles respectively The fumarase-catalyzed reaction involves a carbanionsubstrate intermediate and acidic and basic groups are required for the generation of thisintermediate The reaction is therefore dependent upon the pH of the surrounding mediumbecause pH affects the ionization state (ie the protonationdeprotonation state) of acidic and basicgroups (remember the Henderson-Hasselbalch equation)
Fig 1 Proposed mechanism of the fumarase-catalyzed reaction at the enzymersquos active site
EXPERIMENTAL PROCEDURE
Materials providedNaH2PO4-H2O (solid) FW 13799Deionized waterpH meter 20 M and 02 M NaOH 20 M and 02 M HCl pH standard solutionsporcine fumarase (Sigma F1757) [~ 005 mgml fumarase in 1 mM phosphate (pH 7)]fumarate stock solution [6 mM fumarate in 1 mM phosphate (pH 7)]
In this experiment you are responsible for planning and preparing a series of phosphate solutionsof the same concentration but with various pH values using sodium phosphate salt and water asyour starting materials In making your solutions you will need sufficient volume to adjust the pHusing a pH meter but you should avoid making a huge excess It is best to bring solutions tovolume after adjusting the pH to help attain desired phosphate concentrations Thus it isadvantageous to carefully plan your solution making Once you have them made you will usethese solutions to spectrophotometrically assay the rate of the fumarase-catalyzed reaction as afunction of pH Appendix II Spectroscopy and Appendix III Buffers are recommendedreading for lab preparation (Note that phosphate does not buffer well at all pHrsquoes)
28
1 Prepare 18 mM sodium phosphate (NaH2PO4-H2O) buffers over a seven pH unit range Thinkand plan carefully about how best to make this series of buffers Feel free to check yourcalculations with the instructor before making the buffers You will need approximately 2 ml ofeach buffer in this experiment per group more if you make mistakes Consider coordinatingbuffer preparation with other groups (~2 buffersgroup) so that you do not make excess buffer
2 Using the provided 6 mM fumarate stock solution prepare by dilution at least 2 ml of a 1 mMfumarate solution using each of your phosphate solutions separately as diluent
3 Set the spectrophotometer to measure absorbance at 260 nm Zero the absorbance withphosphate solution using a quartz cuvette (4 mm x 10 mm) Remove the solution and carefullyadd 990 microl of fumarate solution to the cuvette The fumarate in this solution should show a strongabsorbance at 260 nm in the absence of enzyme To determine the reaction rate
a) remove the cuvette from its holder and add 10 microl of fumarase to the cuvetteb) quickly cover the cuvette with the white plastic lid and mix by inverting the cuvette twicec) replace the cuvette and record the absorbance over time until the slope levels
The mixing should be done carefully and as rapidly as possible Obtain two measurements ofabsorbance over time at each pH Record the slope for the initial linear range of the reaction
DATA ANALYSIS
After completing the laboratory you are to turn in an analysis of your data (a table with all of thedata (table of rates) and a plot of the pH dependence) plus brief answers to the questions below
Using the slope value for the initial linear range of a spectrum calculate the change in substrateconcentration over time (ie ∆[fumarate]min is the rate of the enzyme-catalyzed reaction) at eachpH using the Beerrsquos-Lambert law Use the extinction coefficient of fumarate at 260 nm (ε260 =900 M-1cm-1) and report your final answers in micromol fumaratemin (convert from ∆Amin) If youare unsure how to do this calculation consult Appendix II Spectroscopy Plot the log of therate of the reaction versus pH (pH is a log scale) Determine the optimal pH range for the enzyme
1 What is the pH optimum for fumarase What would be a good buffer for the fumarasecatalyzed reaction (see Appendix III) Explain
2 Biochemists often mix mono- and di-sodium phosphate solutions to prepare phosphate bufferswith a specific pH What disadvantage does that approach have over the one you used for thisexperiment
3 What are possible explanations for the pH dependence of fumarase based upon the enzymescatalytic mechanism (see reference) Which amino acids may contribute acidic or basic groups tothis reaction
4 Is it possible for an acidic or basic amino acid side chain to function in an enzyme-catalyzedreaction at pH 7 if the side chain pKa is far from 7 How would the native environment of theactive site of the enzyme affect the pKa of the acidic and basic groups involved in the reaction(Consider the tendency of these groups to be protonated or deprotonated)
5 Would you expect the pH optimum to be the same for the reverse reaction Why or why not
Reference Weaver amp Banaszak (1996) Biochemistry 35 13955-13965
29
EXPERIMENT 5 Kinetic Analysis of Fumarase
From what you learned from Experiment 4 you can now analyze the effects of otherenvironmental variables upon the catalytic activity of the citric acid cycle enzyme fumarase whilekeeping constant the pH that promotes optimal enzyme activity One way a biochemist can analyzethe catalytic activity of an enzyme is through study of its reaction rates or kinetics The goal ofthis experiment is to analyze the reaction rates of fumarase in the forward and reverse direction as afunction of changes in substrate concentration and as inhibited by citrate Substrate and inhibitorconcentrations are common variables of an enzymersquos environment that influence its activity
The simplest model for enzyme kinetics states that the formation of an enzyme-substrate (ES)complex is a necessary intermediate in catalysis as proposed by Michaelis and Menten When youthink about it if the formation of an ES complex is a necessary intermediate in catalysis then thereaction rate (Vo) will depend on the formation of the ES complex As formation of the EScomplex will depend on the amount of substrate available the enzyme activity (Vo) will vary withsubstrate concentration ([S]) For enzymes that fit the Michaelis-Menten model (includingfumarase) this is described by the Michaelis-Menten equation
V o = V max[ S ]
K M + [ S ]
At a fixed enzyme concentration and low substrate concentrations the rate of an enzyme catalyzedreaction increases linearly with increases in substrate concentration However when the activesites of an enzyme become saturated at high substrate concentrations the reaction rate isindependent of substrate concentration the maximal velocity (Vmax) is reached The Michaelis-Menten constant (KM) reflects the rates for formation and dissociation of the ES complex andformation of product and is equal to the substrate concentration at half the value of Vmax
Remember that the fumarase-catalyzed interconversion of malate and fumarate can be followed bymeasuring the increase or decrease of near-UV absorption by the conjugated double bond offumarate over time Lacking a similar bond malate does not absorb light in this range By usingthis property of fumarate the fumarase-catalyzed reaction can be analyzed kinetically in both theforward and reverse direction
As you will be changing the fumarate concentration in the reaction for part of this analysis there isthe potential to achieve a corresponding increase in absorbance It will be important to insure thatyou do not exceed the absorption range that can be accurately measured by the spectrophotometerTo accomplish this you will make some of your measurements at wavelengths other than 260 nmMeasurements made at higher concentrations than 1 mM can be done using longer wavelengthswhich have lower molar absorptivities and visa versa You will need to adjust your calculationsfor each wavelength by using the corresponding molar absorptivity of fumarate listed below
Wavelength (nm) ε (M-1cm-1) Wavelength (nm) ε (M-1cm-1)220 9300 260 900230 4520 270 535240 2440 280 278250 1450 290 118
A plot of 1Vo verses 1[S] (Lineweaver-Burke plot) allows you to determine the kinetic parametersVmax and KM See Chapter 8 in the Lehninger text for a refresher on kinetic analysis
30
EXPERIMENTAL PROCEDURE
Materials providedassay buffer [15 mM sodium phosphate (pH - determined in Expt 4)]malate stock solution [24 mM L-malate in phosphate buffer (pH 70)]fumarate stock solution [6 mM in phosphate buffer (pH 70)]citrate stock solution [100 mM in phosphate buffer (pH 70)]porcine fumarase [~005 mgml in phosphate buffer (pH 70)]
1 Dilutions You must make a series of dilutions of malate (to 8 4 2 1 05 and 025 mM inphosphate buffer) and fumarate (4 2 1 05 025 and 0125 mM in phosphate buffer) in theabsence and presence of 8 mM citrate You will need about 1 ml of each dilution per assay If youneed to repeat the assay with one of the solutions you will need to make more You may checkcalculations with the instructor before beginning You need not complete all dilutions beforebeginning step 2
2 Malate Review details of assay protocol in Expt 4 Set the spectrophotometer to 240 nmwavelength Carefully pipet 990 microl of diluted malate solution into a quartz cuvette Place thecuvette in the spectrophotometer and zero the absorbance at 240 nm Add 10 microL of fumarase mixby inversion place the cuvette in spectrophotometer and record the absorbance at 240 nm forseveral minutes Find the slope of the initial linear portion of the time scan Repeat for all of thediluted solutions of malate Calculate the rate in micromolmin (vol = 1 mL) using ∆Asec and theproper extinction coefficient (see above)
3 Fumarate Set the spectrophotometer at one of the following wavelengths depending on theconcentration of fumarate
280nm4 mM 250 nm05 mM270 nm2 mM 240 nm025 mM260 nm1 mM 230 nm0125 mM
Zero the spectrophotometer at the appropriate wavelength with buffer in the quartz cuvetteRemove the buffer carefully pipet 990 microl of diluted fumarate solution into the cuvette and place itin the spectrophotometer (the absorbance should be about 06-1) Add 10 microL of fumarase mix asbefore place the cuvette in the spectrophotometer and record the absorbance for several minutesFind the slope of the initial linear portion of the time scan and calculate the rate in micromolmin (vol =1 ml) using ∆Asec and the appropriate extinction coefficient (see above)
Note because you are using different wavelengths for each of these measurements thechange in rate as a function of fumarate concentration will not be reflected by the slopesyou measure This is because with each change of wavelength there is a change in thecorresponding molar absorptivity You will see the changes in rate after your calculationsare complete
4 Citrate Repeat steps 2 and 3 with substrate reaction mixtures containing 8 mM citrate inaddition to varying concentrations of malate or fumarate In each case calculate the rate of theenzyme-catalyzed reaction in micromolmin using the appropriate extinction coefficients
31
DATA ANALYSIS
Determination of KM and Vmax Using the activity of the enzyme (rate = micromolmin) atvarious substrate concentrations (in mM) (without inhibitor) determine the kinetic parameters ofthe forward and reverse reactions catalyzed by fumarase A plot of 1Vo verses 1[S] (Lineweaver-Burke plot) allows you to determine the kinetic parameters Vmax and KM from the line equation forthe linear regression analysis of the data points Be sure to use the correct units for both Vo and[S] or you will not obtain meaningful values for these parameters Calculate the turnover numberfrom the concentration of enzyme and the molecular weight of fumarase (MW = 194 kDa) Forthis calculation you will need to have the enzyme rate reflected in Mmin which can be convertedfrom micromolmin using the reaction volume (vol = 1 mL) You can also calculate the equilibriumconstant for this reaction using the kinetic parameters obtained and the Haldane relationship
K eq =Vmax
( fum)
K M( mal)
Vmax( mal)
K M( fum)
Determination of KMrsquo and Vmaxrsquo Repeat the same type analysis as above with the dataobtained in the presence of inhibitor The corresponding kinetic parameters obtained in thepresence of inhibitor are indicated as KMrsquo and Vmaxrsquo Using the kinetic parameter that is mostaffected by the presence of inhibitor determine the type of inhibition (competitive ornoncompetitive) exhibited by citrate Using this altered kinetic parameter and one of the equationsbelow calculate the inhibitor constant (Ki)
V max
= V
max
( 1 + [ I ] K
i
)
OR K N
M = K
M ( 1 + [ I ]
K i
)
for citrate in the forward and reverse reactions
For Expt 5 you are to turn in at the end of the laboratory an analysis of your data (graphs of 1Voverses 1[S] and a table of kinetic parameters KM Vmax KMrsquo Vmaxrsquo and Ki) plus brief answersto the questions below
1 How do the kinetic parameters you obtained for porcine fumarase compare to those reported inthe literature (Alberty et al 1954 Table V on reserve)
2 Which substrate is preferred by the enzyme How do you know
3 What type of inhibitor is citrate in the fumarase-catalyzed reaction How do you knowSuggest a mechanism of inhibition by citrate
4 Is citrate an equally effective inhibitor in the forward and reverse reactions How do youknow
Reference Alberty et al (1954) J Amer Chem Soc 76 2485-2493
32
EXPERIMENT 6 Stereochemistry of the Fumarase Reaction mdash an NMR Study
As foreshadowed in Experiment 4 the reaction catalyzed by fumarase is stereospecific Inaqueous solutions it is not possible to determine the stereochemistry of the addition of H2O acrossthe double bond of fumarate since there is no way to determine which of the two hydrogen atomswas added to carbon-3 of malate from waterHowever the use of deuterium oxide (D2O) asthe solvent makes it possible to follow thestereochemistry For example if the reactioninvolves an anti (or trans) addition of water(2S3R)-3-deutereomalate is produced (right)
Alternatively if the reaction involves an syn(or cis) addition of water (2S3S)-3-deutereomalate is produced (figure left) Eitherway two new chiral centers are produced bythe stereospecific addition of D2O to fumarate
The stereochemistry of the fumarase reaction can be demonstrated by NMR spectroscopy TheNMR spectrum of fumarate is quite simple It consists of a singlet at δ65 from the two equivalenthydrogens in addition to an HOD peak at aboutδ47 (due to HOD in the solvent) Thespectrum of L(S)-malate is more complex butstill easily interpreted
Malate contains three different protons (HAHB and HX) Note that protons A and B arenot equivalent This is a general result forprotons adjacent to an asymmetric centerThese two protons are diastereotopic in thatthe independent substitution of either of theseprotons by any other group creates a diastereomer (a stereoisomer that is not a mirror image)Since these two protons have different magnetic environments they have different chemical shiftsand couple with one another (geminal coupling since both protons are bonded to the samecarbon) Coupling between HA or HB and HX is called vicinal coupling since the two protons areattached to adjacent carbons Thus each proton is split by each of the other two protons makingthe resonances for each a doublet of doublets For example HA is split by HB and the lines thatresult are each split by HX
When the fumarase enzyme is added to a solution of L-malate in D2O the fumarate peak at δ65grows while the malate peaks decrease in intensity The malate spectrum also begins to simplify(although is may not look simpler at first) due to new malate being formed as equilibration of thereaction proceeds Proton NMR does not see deuterium so one set of malate peaks disappearsas a proton is replaced by deuterium Deuterium does not couple with protons so for each of theremaining doublet-of-doublets only one of the couplings will remain
33
By knowing the expected sizes of coupling constants for vicinal protons at various dihedral angles(described by the Karplus curve) one can determine which of the protons(HA or HB) was replaced by deuterium This in turn allows determinationof whether the D2O addition is syn or anti
The dihedral angle is the anglebetween Hx and Ha or Hb whenlooking down the bond between thetwo central carbon atoms of malateEXPERIMENTAL PROCEDURE
Materials providedmalate solution [200 mM L-malate in 100 mM phosphate buffered D2O (pH 73)]fumarate solution [200 mM fumarate in 100 mM phosphate buffered D2O (pH 73)]porcine fumarase [10 mgml in 100 mM phosphate buffered D2O (pH 73)]
Please read Appendix V NMR before starting this experiment
1 Place 08 ml of L-malate and 08 ml of fumarate in separate clean dry NMR tubes Record theNMR spectrum of each
2 Place 08 ml of L-malate and 08 ml of fumarate in microfuge tubes Add 5 microl of fumarase toeach tube and mix gently Thirty minutes after addition of enzyme transfer each volume toseparate clean dry NMR tubes and record a spectrum of each
DATA ANALYSIS
For Expt 6 you are to turn in at the end of the laboratory an analysis of your data (a table ofcoupling constants (J) and all NMR spectra with labeled peaks including chemical shift positions(δ)) plus brief answers to the questions below
Assign each peak in the NMR spectra of L-malate and fumarate to protons in each moleculeCalculate the vicinal spin-spin coupling constants JAX and JBX and the geminal constant JABIdentify and interpret the changes in the NMR spectra brought about by the enzyme-catalyzedreaction Assign all the peaks in the final spectra (after enzyme addition)
1 What accounts for the difference in value of JAX and JBX in the spectrum of L-malate aloneRefer to the Karplus curve (see Appendix V NMR) in your answer
2 What changes in the NMR spectra after enzyme addition would you expect if the reaction wassyn anti or non-stereospecific
3 What is the stereochemistry of D2O addition to fumarate References Kasparek amp Pratt (1977) JChemEd 54 515
Nigh (1976) J Chem Ed 53 668
Silverstein et al (1974) in Spectrometric Identification of Organic Compounds (3rd
edition Wiley) pp 181-182 186-187 189-191
Teipel et al (1968) J Biol Chem 243 5684
34
35
APPENDIX I Concentration and Dilution
The most common expressions of concentration in biochemistry are molarity and percent-of-solute Molarity is defined as the number of moles of solute per liter of solution (denoted M) Molarityusually describes solutions of accurate concentration where the molecular weight of the solute isknown Solutes are weighed on an analytical balance and volumes are measured in volumetricflasks In biochemistry most concentrations are in the millimolar (mM) micromolar (microM) ornanomolar (nM) range
Percent-of-solute is frequently used for liquids and solids of undetermined molecular weightThree designations are used volume per volume (vv) weight per volume (wv) and weight perweight (ww) A 5 (vv) solution contains 5 ml solute in 100 ml total solution A 5 (wv)solution contains 5 g solute per 100 ml total solution A 5 (ww) solution contains 5 g solute per100 g total solution Of these three designations weight per volume expressions are used mostcommonly in biochemistry Sometimes these concentrations are not expressed as percentages butrather simply as the number of mg (or microg) per ml solution
Biochemical experiments frequently require the dilution of a particular sample or stock (standard)solution If the concentration of stock solution and that needed in the experiment are known thedilution factor can be calculated For example if you want to dilute a 1 M stock solution to 5 mMin your experiment the dilution factor is 00051 or 1200 (also indicated as a 1200 dilution)This means you must dilute 1 part stock solution with 199 parts solvent Another way of statingthis is that 1 part stock solution must be diluted into 200 parts total solution This is commonlydescribed by biochemists as a one in 200 (or two hundred-fold) dilution However this would bea mixture with a ratio of one (part) to 199 (parts) Generally if you want 200 ml of the dilutedsolution you would mix 1 ml stock solution with 199 ml solvent However this neglects anyvolume change that may be inherent to formation of the new mixture A more rigorous approachwould be to add 1 ml stock solution to a volume of solvent less than the total desired and thenbring the solution to the final desired volume with additional solvent
You can determine the molarity of a diluted solution (Mfinal) or calculate what volume of stocksolution (Vinitial) must be added to solvent to make the diluted solution by using the formula
MinitialVinitial = MfinalVfinal
For example if you have a stock solution of 10 M NaCl and you want to make 250 ml of a 05 M NaCl solution you need to add 125 ml of the stock solution to a 250 ml volumetric flaskand fill it with solvent to 250 ml
Minitial = 10 M Vinitial = Mfinal = 05 M Vfinal = 250 ml
(10 M)Vinitial = (05 M)(250 ml) --------gt Vinitial = 125 ml
In other words 125 ml of the stock solution is diluted to 250 ml with solvent Note that thenumber of moles of solute (in this case NaCl) is the same in the volumes of the initial and finalsolutions Note also that this equation can be written CinitialVinitial = CfinalVfinal where Crepresents concentration in units other than molar (eg mgml)
36
A special type of dilution is the serial dilution In this method a stock solution is dilutedsystematically in fixed steps of the same dilution factor (see Fig 1) A high degree of accuracyand precision is required because errors made in an early dilution are carried to all subsequentdilutions Serial dilutions are used frequently in immunological and microbiological experiments
Fig 1 A serial dilution scheme
37
APPENDIX II Spectroscopy
1 Absorption Spectroscopy
If white light is passed through a colored solution certain wavelengths of light are selectivelyabsorbed and the resulting color observed is due to the wavelengths of the transmitted lightUVVis absorption spectroscopy is useful if the sample absorbs light in the 200-350 nm range(ultraviolet UV) or in the 350-750 nm range (visible) The figure below (Fig 1) shows theabsorption spectrum of riboflavin Riboflavin appears yellow to the eye Maximal absorption oflight occurs at several wavelengths in the ultraviolet region (below about 370 nm) and at 450 nmin the visible region Since the absorption in the visible region is at the blue end the transmittedlight is that of the other end of the spectrum (yellow)
Fig 1 Absorption spectrum of Riboflavin
The quantitative measurement of the amount of light absorbed is based on two laws Lambertrsquoslaw states that the proportion of light absorbed is independent of its intensity and each successiveportion of the medium absorbs an equal fraction of the light passing through it This is expressedmathematically as
log (IIo)=Kl
where Io and I are the intensities of the incident and transmitted light respectively K is a constantand l is the path length in cm Log (IIo) is the absorbance (A) This law is always true Thesecond law applied here Beerrsquos law has some exceptions usually because of a change in the stateof the solute upon absorbing light This could involve changes in ionization or aggregationBeerrsquos law relates concentration to the factor K K=εc where ε is the extinction coefficient of theabsorbing solute (units are reciprocal concentration times reciprocal length) and c is itsconcentration Combining these two laws gives the Beerrsquos-Lambert law
A=εcl
Absorption is dimensionless If c has units of M ε has units of M-1 cm-1 if c has units of mgml
ε has units of ml mg-1 cm-1 The extinction coefficient reflects the relative tendency of a solute toabsorb light of a certain frequency and is specific only for a specific solute solvent andwavelength of light
UVVis absorption spectroscopy can be used to quantitatively measure enzyme activity if asubstrate or product of the enzyme-catalyzed reaction absorbs light This type of assay follows theactivity of the enzyme indirectly by monitoring the change in substrate or product directly A goodexample of this is the redox coenzyme NAD+NADH which changes its absorption propertiesupon oxidation and reduction (Fig 2) The different absorption of light by NAD+ and NADH canbe utilized to follow the activity of an enzyme involved in their interconversion
38
An analysis of the spectra of both (Fig 2) suggests that their absorptions differ most at ~340 nmwavelength light This wavelength therefore provides the largest ldquowindowrdquo to study theirinterconversion By following the change in absorption at 340 nm over time as a function ofenzyme activity one can extract quantitative rate data using the Beerrsquos-Lambert law and theextinction coefficient for NADH
Fig 2 Absorption spectra of NAD+ and NADH
39
APPENDIX III Buffers
Most cellular reactions and processes take place in an aqueous environment at neutral pHTherefore most biochemical experiments are also carried out in aqueous media under controlledpH conditions This requires the use of buffers solutions that resist changes in pH due to thepresence of a chemical species that can ldquoneutralizerdquo added acid or base In general buffers aresolutions of a weak acid and its conjugate base or a weak base and its conjugate acid When acid isadded to the buffer some A- is converted to HA addition of a base results in some HA convertingto the A- form Thus the solution can ldquoabsorbrdquo added acidic and basic species
A buffer is effective for use in a particular biochemical experiment based upon its 1) pKa value andchemical properties and 2) concentration The pKa indicates if a buffer can function well over thean appropriate pH range for the experiment The concentration indicates the capacity for which abuffer can function The Henderson-Hasselbalch equation [pH = pKa + log ([A-][HA])]gives the relationship between the pH of a solution the pKa of an acid in solution and the ratio ofthe concentrations of acid [HA] and conjugate base [A-] forms in solution
Buffering range When the concentrations of A- and HA are equal the pH of the solution equals the pKa of thebuffer Buffers are most effective in the range pH = pKa plusmn 1 Outside of this range theconcentration of acid or conjugate base is too small to ldquoneutralizerdquo acid or base added to thesolution Thus once the desired pH range has been determined for an experiment a buffer can beselected based upon its pKa value The pKa values for certain useful buffers is shown below
Buffer pKa (20degC) StructurePhosphoric acid 21 H3PO4Sodium dihydrogen phosphate 72 NaH2PO4Disodium hydrogen phosphate 123 Na2HPO4Citric acid 31 HOOCCH2COH(COOH)CH2COOHSodium dihydrogen citrate 47 HOOCCH2COH(COONa)CH2COOHDisodium hydrogen citrate 54 HOOCCH2COH(COONa)CH2COONaGlycylglycine 84 H3N+CH2CONHCH2COO-
Tris [tris(hydroxymethyl)- 83a (HOCH2)3CNH2 aminomethane]MOPS [3-(N-morpholino) 72 propanesulfonic acid]MES [2-(N-morpholino) 62 ethanesulfonic acid]HEPES [N-2-hydroxyethyl- 76 piperazine-Nrsquo-2-ethane- sulfonic acid]
aThe pH of a Tris buffer varies significantly with temperature (∆pKa = -031degC)
Table 1 Properties of some common biological buffers
40
Buffering capacityThe concentration of buffer used is also important in order to provide adequate buffering capacityBuffering capacity depends upon the concentration of the buffering components and is defined asthe number of equivalents (n) of either H+ or OH- required to change the pH of a given volume ofbuffer by one pH unit
Buffer capacity = dnd(pH)
Most biological buffers are made in the concentration range of 001-05 M this concentration isreferred to as the buffer strength and reflects the total concentration of acid and conjugate baseforms of the buffer Buffer solutions can be prepared by calculating the amount of acid andconjugate base forms of the buffer needed to obtain the desired pH using the Henderson-Hasselbalch equation Another method is to weigh out the desired amount of one form of thebuffer (HA or A-) and adjust the pH using a pH meter and solutions of NaOH HCl or Tris
The chemical properties of a buffer (eg solubility stability light absorption ionic interactions)must be well-characterized before use in a biochemical experiment A series of biologically usefulbuffers for use in the pH 7-9 range (MOPS HEPES MES PIPES etc) have been characterizedby Good et al (1966) Note that these buffers are not physiological (ie not found in the body)
Reference Good et al (1966) Biochemistry 5 467
41
APPENDIX IV Enzymology
Enzyme assay The activity of an enzyme can be determined by measuring the rate of utilizationof substrate over time or the rate of formation of product over time Enzyme activity is reported as∆[substrate]∆time or ∆[product]∆time (also denoted units of enzyme activity) The unit definitionfor enzymes varies but is often expressed as micromoles substrate used or product formed per min inthe assay mixture at a specified temperature and pH
One unit of enzyme activity = One micromol S (or P)min
Enzyme assays are carried out under buffered conditions at a fixed pH temperature andconcentration of necessary ions and in the presence of excess substrate (usually at least [S] = 10 xKm) Appropriate negative controls should be done in the absence of enzyme andor substrateChanges in the measured parameter in the absence of enzyme indicates the extent of non-enzymaticreaction in the assay mixture Changes in the measured parameter in the absence of substrateindicates the extent of background enzymatic reaction in the enzyme preparation Enzyme activitycan be measured by a continuous (kinetic) method or a discontinuous (fixed-time) method acontinuous assay is preferred
In purifying an enzyme one must determine the amount of enzyme present at each step of thepurification To do this enzyme activity in various purification fractions is measured underconditions of fixed substrate concentration pH temperature and added ions coenzymes etcThe Michaelis-Menten equation (shown below) relates the initial velocity Vo to the total amount
V o
= k
cat[ E
tot] [ S ]
K M
+ [ S ]
of enzyme ET at a fixed substrate concentrationSince the initial velocity is directly proportional to the total amount of enzyme careful measurementof the initial velocity under these fixed conditions gives a measure of the amount of enzyme
A major problem in developing an enzyme assay is establishing conditions that allow accuratemeasurement of the initial velocity This problem is minimized if high [S] is used so that [S]doesnrsquot change appreciably during the assay The amount of enzyme used in an assay is alsoimportant Too little enzyme gives a velocity too low for accurate measurement while too muchenzyme gives a velocity too high and not linear long enough to determine an accurate initial rateThe process by which the optimal amount of enzyme to be used in an assay is determined is calledrange-finding A plot of initial velocity vs amount of enzyme added should have a linear portionthat defines the valid range of [E] for this assay
Enzyme purity When purifying an enzyme one needs to determine the yield and degree ofpurity of the enzyme as the purification progresses Yield is measured by comparing the totalenzyme activity (units) in various enzyme fractions Purity is measured by comparing the specificactivity (unitsmg protein) in various fractions The higher the specific activity the more pure theenzyme Purity is usually expressed as a purification factor (or fold-purity) which is the increasein specific activity The effectiveness of a purification scheme is shown in a purification table(Table 1) which lists the total and specific activities for the various fractions generated during thepurification
42
Total Act Specific ActEnzyme fraction (Units) (Unitsmg) Yield PurityCrude cell extract 1030 12 100 ---Ion exchange column 807 135 78 11-foldAffinity column 498 244 48 203-fold
Table 1 Sample purification table
Dialysis Dialysis is a technique commonly used in biochemistry to separate a mixture ofdissolved solutes by filtration (Fig 1) Amixture is placed within a sealed dialysismembrane and then submerged in buffer andsmall solute molecules that are not highlycharged pass freely across the membrane untila concentration equilibrium on both sides of themembrane is achieved
The driving force for solute movement is theinitial concentration gradient across the dialysismembrane Dialysis is often used to removesalts or other small solutes from a proteinsample during the course of a purification Theconcentrations of solutes within the dialysismembrane change because water passes freelyacross the membrane in the direction of higherinitial solute concentration (the osmotic effect) Fig 1 Dialysis of a mixture of solutes
The dilution factor of the small solutes can becalculated by dividing the initial volume ofsample by the amount of buffer that the sampleis dialyzed against Equilibration usually takesseveral hours so samples are often left todialyze overnight at 4degC Large dilutions can beobtained in shorter times by changing the bufferat least once during the dialysis In this casethe dilution factors due to each volume of bufferused are multiplied by each other to give thefinal dilution For efficient dialysis the buffer inthe outer reservoir should be stirred Fig 2shows the dilution of NaCl over time due todialysis
Fig 2 Dilution of NaCl by dialysis
43
APPENDIX V Nuclear Magnetic Resonance
Nuclear magnetic resonance (NMR) is a very useful technique to study the structure of many typesof biomolecules NMR is useful when biomolecules contain inherently magnetic nuclei (1H 2H13C 14N 19F 31P) 1H and 13C NMR are used most frequently
NMR is based on the behavior of (+)-charged spinning nuclei in an externally applied magneticfield (H0) In the absence of H0 the axes about which the nuclei spin are oriented randomly insolution When H0 is applied the nuclei align parallel or antiparallel to the external field Theparallel orientation is slightly lower in energy and thus slightly favored Irradiation of alignednuclei with radiation of a certain frequency causes nuclei to absorb energy and spin-flip to a higherenergy state (and in doing so be in resonance with the applied radiation)
All nuclei in molecules are shielded somewhat from H0 by surrounding electrons which set uptiny local magnetic fields So the effective magnetic field (Heff) experienced by each nuclei islessened by these local magnetic fields (Hlocal)
Heff = H0 - Hlocal
Most nuclei in a molecule are in a slightly different electronic environment so Heff differs for each
NMR spectra show the intensity of absorption vs chemical shift (an indication of Heff) Eachnonequivalent nucleus will have its own characteristic peak on the spectrum Two protons bondedto the same carbon are not necessarily equivalent In the case of L-malate (Fig 1) protons A andB are diastereotopic because the substitution of either by any other chemical group createsdiastereomers (stereoisomers that are not mirror images) due to the presence of another stereogeniccenter in the molecule Thus HA and HB have their own characteristic peaks on an NMR spectrum
Fig 1 Structure of L-malate
NMR spectra are calibrated by using a reference sample usually tetramethylsilane TMS[(CH3)4Si] The chemical shift of TMS is set at zero samples absorb downfield (to the left of the
standard on the chart) The unit of chemical shift is the delta unit δ
1 δ = 1 ppm of the operating frequency of the NMR spectrometer
Gustavus College has a 300 MHz machine so 1 δ = 300 Hz Most 1H NMR absorptions occur 0-
10 δ downfield of the reference peak For example an allylic proton (=C-C-H) absorbs at δ =
15-25 and a vinylic proton (C=C-H) absorbs at δ=45-65
44
The nuclear spins of adjacent atoms can influence each other causing spin-spin coupling orsplitting In 1H NMR splitting occurs between protons coupled via covalent bonds and usuallyno more than two carbons apart A general rule when studying spectra is that the peaks of protonswith n equivalent neighboring protons split into a multiplet of n+1 peaks The distance betweenpeaks in a multiplet is the coupling constant J In general two groups of protons coupled to eachother have the same value of J Stronger coupling is indicated by greater spacing of the splitpeaks No splitting is observed if adjacent protons are chemically equivalent
For vicinal protons (those on adjacent carbons) the value of J is related to the dihedral angle φthis relationship is shown in the Karplus curve (Fig 2) The coupling of trans protons is greaterthan that between cis protons In this case NMR is useful to distinguish between cis-transisomers Dihedral angles of 60deg and 180deg yield J values of 2-4 and 8-10 respectively
Fig 2 Karplus curve Line theoretical curve shaded area range of empirical results
45
APPENDIX VI SDS-Polyacrylamide Gel Electrophoresis (SDS-PAGE)
Gel electrophoresis is an effective method for separating proteins on the basis of size SDS-PAGEis a electrophoretic technique that uses a gel made of polymerized acrylamide AcrylamideCH2=CH-C(=O)-NH2 forms a linear polymer polyacrylamide that can be cross-linked withNNrsquo-methylene bisacrylamide CH2=CH-C(=O)-NH-CH2-NH-C(=O)-CH=CH2 to form a resinof controlled but varying pore size Cross-linked polyacrylamide is shown in Fig 1
Fig 1 Structure of cross-linked polyacrylamide
Polymerization is catalyzed by free radicals generated by agents such as ammonium persulfate inthe presence of NNNrsquoNrsquo-tetramethylethylenediamine (TEMED) Polymerization is inhibited byoxygen so gel solutions should be degassed If the pore size of the gel approximately matches thesize of the molecules to be separated smaller molecules can move freely in an applied electric fieldwhereas larger molecules have restricted movement
SDS-PAGE most often makes use of vertical slab gels although gels can also be formed incylinders A discontinuous gel system is also used frequently consisting of a stacking gel and aseparating gel The stacking gel makes up only approx 10 of the volume of the total gel and isof a lower percentage acrylamide (usually 25-45) and a lower pH (68) In the stacking gelcharged molecules move freely in an applied electric field and proteins in a sample shouldaccumulate in stacks of closely spaced bands In the separating gel containing a higher percentageacrylamide (usually 7-15) and at a higher pH (88) proteins separate into discrete bands basedon molecular size See Fig 2 for sieving properties of different percentage gels
Percentage acrylamide in separating gel Size of molecules sieved effectively25 105-106 daltons70 104-105 daltons30 102-103 daltons
Fig 2 Molecular sieving properties of gels of varying polyacrylamide percentages
46
Separation is not on the basis of shape or charge because proteins are treated with sodium dodecylsulfate (SDS) a detergent with both polar and nonpolar properties The long hydrocarbon chain ofSDS is buried in nonpolar regions of proteins and the (-)-charged sulfate is exposed on the surfaceof proteins SDS coats proteins with an approximately uniform charge-to-mass ratio of (-) charge(saturation occurs at approx 14 g SDSg protein) In addition proteins are approx uniformlyshaped into spheres when coated with SDS because the detergent disrupts native ionic andhydrophobic interactions Thus proteins separated by SDS-PAGE are denatured Disulfides inproteins are broken by addition to the gel sample buffer of szlig-mercaptoethanol or 14-dithiothreitolboth of which reduce disulfide bonds
The molecular weights of proteins in a sample can be estimated on a gel by measuring the mobilityof protein standards of known molecular weight on the same gel A calibration curve (Fig 3) canbe generated from the mobilities of the standards by plotting the distances migrated from the top ofthe resolving gel versus the log of molecular weight A linear regression can be calculated andused to estimate unknown molecular weights The estimation of molecular weight by this methodis accurate to approximately 5-10 of the actual value
Fig 3 Calibration curve for molecular weight estimation
Reference UK Laemmli (1970) Cleavage of structural proteins during the assembly of thehead of bacteriophage T4 Nature 227 p 680
Safety Guidelines
Submission of a Safety Policies and Procedures Signature Sheets (on page afterthese guidelines and safety information) signed by both the student andlaboratory instructor is required before any student can work in the laboratory
1 IMMEDIATELY REPORT ANY ACCIDENT OR SAFETY ISSUE TO THELABORATORY INSTRUCTOR
Emergency Procedures
2 If chemicals are spilled
a If chemicals are spilled on you or if you see chemicals spilled on another student Callfor help from your instructor Portions of your body or clothing that have been in contactwith the chemicals should immediately be flushed thoroughly with water Use the safetyshower if the spill is extensive An eye wash is available in the laboratory Donrsquot wait tosee if the chemicals will injure you rinse spills immediately
b Work with the instructor to clean up spills on the bench or floor Notify students nearbyof the presence of broken glassware andor chemicals and keep people from walkingthrough the area until cleanup is complete
3 In case of fire
a Call for help from your instructor If clothing is burning slowly walk to the fire blanketand wrap it around yourself and roll on the floor to extinguish the flames or slowly walkto the safety shower and pull the cord (or ask someone nearby to pull the cord) [Otherstudents nearby if necessary bring the fire blanket to the student or help the student to theshower and pull the chain]
b A fire on the bench top or floor may be put out with a fire extinguisher Call for helpfrom your instructor
4 Wash minor cuts or burns with cold water and get band aids or burn ointment from thestockroom Report all such incidents no matter how minor to the instructor
Safety Goggles and Clothing
5 Safety goggles must be worn at all times in the laboratory Since under Minnesota law thecollege is legally responsible for eye accidents if a student is not wearing eye protectionthe instructor may dismiss from the laboratory any students not wearing approvedgoggles In this class the instructor will warn students if necessary to wear theirgoggles If students do not respond to two warnings the may be dismissed form thelaboratory and requested to drop the course Goggles must be provided by each studentand may be purchased through the Gustavus Bookmark
6 If you are using a computer or printer in a lab you must wear safety goggles if work withchemicals is occurring in the lab
iv
7 Clothing Shoes with solid tops (not sandals) must be worn to protect your feet frombroken glass or other sharp materials Shorts or cut-off pants should not be worn in thelab it is important to protect your body with clothing rather than risk skin contact withchemicals or other materials Avoid wearing clothing with loose portions such as opensweaters baggy cuffs and hanging scarves Loose clothing can catch on glassware andequipment can drag through spills and may in some cases be a fire hazard Similarlyloose long hair should be tied back so that it does not become entangled in equipmentexposed to chemicals or provide an impediment to vision
Handling Chemicals
8 Do not taste or ingest any laboratory chemicals
9 Avoid touching chemicals with your hands and always thoroughly wash your hands afterusing chemicals
10 Work in a fume hood when carrying out reactions that give off objectionable gases If youneed to smell vapor do not put your nose directly above a flask beaker or other vesselcontaining chemicals Holding the vessel at least one foot away use your hand to gentlyand very cautiously fan the vapors toward your nose
11 No mouth pipetting is permitted When pipetting use the mechanical pipettors pipette aidsor the rubber bulbs provided in the laboratory
12 Always add acids to water (its alphabetical) never add water to acids Combining acidand water frequently generates heat addition of the acid to the water reduces the amount ofheat generated at the point of mixing and provides more water to disperse the heat
13 LABEL all flasks beakers test tubes and other vessels containing chemicals accordingto their contents This facilitates both identifying chemicals during an experiment andfollowing proper waste disposal procedures
14 Hold reagent bottles and other vessels containing liquids so that any drips will beopposite the label and hold them so any previous drips on that same side do not get onyour hand Clean off any drips or spills If necessary ask for help from your instructoror assistant
15 Laboratory wastes and residues are to be disposed of in an approved manner Wastecontainers for these will be provided and specific instructions on proper disposalprocedures will be provided by the laboratory instructor for each experiment
Laboratory Supervision
16 No unauthorized experiments are permitted Students may try new experiments only ifthey have been discussed with a faculty member and have been approved
17 No student may work in the laboratory alone All laboratory work must be under thesupervision of a faculty member or student laboratory assistant and at least one otherperson must be present when work with chemicals is being done No makeupexperiments may be performed without the permission of a studentrsquos laboratoryinstructor
v
Behavior in the Laboratory
18 Food and beverages are not permitted in the laboratory This includes drinking from waterbottles that you may carry with you on campus If you need to eat or drink during the timelaboratory is scheduled you must remove yourself from the laboratory Be sure to washyour hands before eating after working in laboratory
19 Backpacks and book bags clutter the benches andor floors of the laboratory and interrupttraffick flow during laboratory Please leave your book bags and backpacks in the hallwayor another location outside the laboratory
20 Any horseplay or behavior that is harassing disruptive or aggressive or in any waypresents a hazard to those in the laboratory is forbidden Any student or group of studentsengaging in such behavior may be dismissed by the laboratory instructor and may receivedno credit for the experiment
Other Procedures
21 If you anticipate needing to cut glass tubing or insert glass tubing into a rubber stopperconsult with your instructor prior to proceeding Both procedures present the potentialfor injury from broken glass and proper precautions are essential
22 CLEAN your bench top thoroughly at the end of each laboratory period This should bedone with a damp sponge
Safe Handling and Disposal of Chemicals
Some information on the safe use and disposal of chemicals is provided in this manual additionalsuggestions will be made by your laboratory instructor We want not only to provide you withguidelines about how to use chemicals and equipment safely - no experiment you will do thissemester is dangerous if safe procedures are followed throughout - but to be sure that properprecautions are taken to avoid contaminating the environment To this end we will provideappropriate containers for disposal of chemical wastes After collecting these from all the labsections our stockroom manager will see to it that proper procedures are observed in disposing ofthese items
How does one learn about proper handling of chemicals We have a variety of sources the mostcommon of which are Material Safety Data Sheets (MSDS) These provide a variety ofinformation on such things as health hazards first aid procedures procedures for cleaning upspills and disposal procedures for each chemical An example of an MSDS is copied on pages xi-xv By law companies that sell chemicals must also provide an MSDS (usually inserted as an extrasheet in shipment) for each chemical shipped There is no uniform format for an MSDS so theylook very different depending on the source The Chemistry Department obtains the MSDS formsfrom the corresponding vendors for the chemicals in the stockroom collection and keeps them onfile in the department office MSDS forms are also available from Sigma-Aldrich over the webCheck out the Chemistry Stockroom link on the Chemistry Departmentrsquos Home Page or go towwwsigmaaldrichcomcg i-binh srunDistribu tedHahtShopHahtSh ophtxstart= HS_SeacrchCen ter You may request a copy of an MSDS for one of the compounds you are using if you wish Or youcan download your own from the web
vi
Codes for Chemical Labeling
In the laboratory you will notice that containers of chemicals are labeled not only with the name(and in some cases concentration) of chemicals but also with colored diamonds containingnumerical and other codes These are the NFPA (National Fire Protection Agency) codes andindicate fire reactivity health and other hazards associated with the chemicals In general thehigher the number of a code the greater the potential hazard The specific codes are as follows
Bottom Diamond Special Hazards Right Diamond Reactivity Hazards
OXY Oxidizer 0 StableACID Acid 1 Unstable if heatedALK Alkali 2 Violent chemical changeCOR Corrosive 3 Shockheat may detonateW Use no water 4 May detonateRAD Radiation
Top Diamond Fire Hazards Left Diamond Health Hazards
0 Will not burn 0 Normal material1 Burns above 200deg F 1 Slightly hazardous2 Burns below 200deg F 2 Hazardous3 Burns below 100deg F 3 Extreme danger4 Burns below 73deg F 4 Deadly
vii
Safe Handling of Biological Material
Biochemists encounter potential laboratory risks in addition to those of other chemical laboratoryworkers the risks associated with biological specimens A problem with these is that there may berisks of which we are not yet aware However there are two types of risks we can assess fairlywell
Infectious agents
Agents of infection may be bacterial viral or the recently discovered prions (eg Mad-cowdisease)
With any human tissue (including blood) it is now general practice to follow universalprecautions handling every sample as if it were infected because you can never know that it isnot The precautions include persistent use of gloves segregation of lab from non-lab (eg ablood in the lab is never taken out of the lab) etc These are onerous precautions that take a lot ofplanning and arrangements Think about for example using a phone looking at your watch orusing a personal pen without contamination Remember that there are viruses fortunately stillrare that are extremely infectious more than HIV In this course we will NOT use human tissue
Animal tissue may also be contaminated with infectious agents We will use chicken muscle andfrom your kitchen you should know that poultry is a common source of Salmonella infectionsThe problem in the laboratory is that the chicken product may remain infectious long after it isdiscernable as a chicken product That is unlike your kitchen we do not begin with a cookingprocess that will kill most microorganisms Thus scrupulous cleanliness throughout withpersonal protection by gloves taking great care to avoid contacting personal items with thepossibility of contaminated gloves is necessary Washing hands after lab is highly recommended
Ecological dangers
In contemporary biochemical laboratories it is common to work with cloning vectors geneticallymodified cells and other agents with the potential to modify mostly in unpredictable ways majorecological systems This places a huge burden on the scientist to contain these productssometimes requiring entire new labs with facilities appropriate to handle the materials The biggestrisk is that it is so easy to forget the possible hazard of something that one works with so routinelyTo promote containment vector-containing material is destroyed through autoclaving Howeverin this course we will NOT be working with material involving cloning vectors
viii
Safety Policies and Procedures Signature Sheet
I have read all the material in the Safety Guidelines section of the Biochemistry Laboratory manualincluding the general safety policies goggles policy and material on safe use and disposal ofchemicals I understand this material and how it applies to the laboratory in which I will beworking I have asked for clarification of those points I do not understand
Signed ____________________________________ Date _______________________
Printed name ______________________________________________________________
Laboratory section _________________________________________________________
Accepted by faculty member ___________________________ Date________________
Remarks
Mark the locations of each of the following on the lab
bull Eye Wash (1)bull Safety Shower (1)bull Fire extinguisher (1)bull Gas shut off (1)bull Emergency phone (1)bull Exits (2)
ix
x
Material Safety Data Sheet Example - for ASPIRIN
MSDS Number A7686 --- Effective Date 111799
1 Product Identification
Synonyms 2-(acetyloxy)benzoic acid salicylic acid acetate acetysalicylic acid CAS No 50-78-2 Molecular Weight 18015 Chemical Formula C9H8O4 Product Codes 0033
2 CompositionInformation on Ingredients
Ingredient CAS No Percent Hazardous --------------------------------------- ------------ ------- --------- Acetylsalicylic Acid 50-78-2 100 Yes 3 Hazards Identification
Emergency Overview -------------------------- WARNING HARMFUL IF SWALLOWED OR INHALED CAUSES IRRITATION TO SKIN EYES ANDRESPIRATORY TRACT MAY CAUSE ALLERGIC RESPIRATORY REACTION POSSIBLE BIRTHDEFECT HAZARD MAY CAUSE BIRTH DEFECTS BASED ON ANIMAL DATA AFFECTS THERESPIRATORY SYSTEMLIVER KIDNEYS EYES SKIN AND BLOOD
JT Baker SAF-T-DATA(tm) Ratings (Provided here for your convenience) ----------------------------------------------------------------------------------------------------------- Health Rating 1 - Slight Flammability Rating 1 - Slight Reactivity Rating 0 - None Contact Rating 1 - Slight Lab Protective Equip GOGGLES LAB COAT Storage Color Code Orange (General Storage) -----------------------------------------------------------------------------------------------------------
Potential Health Effects ---------------------------------- Inhalation
Causes irritation to the respiratory tract Exposure may cause an allergy to develop Ingestion
Extremely large oral doses may cause mild burning pain in the mouth and stomach anorexia nauseavomiting intense thirst diarrhea dizziness irritability confusion coma teratogenic effects and death fromrespiratory failure The mean lethal dose of aspirin by mouth probably lies between 20 and 30 grams inadults
Skin Contact May cause irritation Eye Contact
Causes irritation Contact cause severe pain and may cause eye damage
xi
Chronic Exposure Repeated ingestion may cause tinitus abnormal bleeding (gastric or retinal) gastric ulcer weight lossmental deterioration and skin eruptionsMay cause kidney and liver damage in susceptible individuals Aggravation of Pre-existing Conditions
Persons with a history of asthma or allergies to aspirin may be at an increased risk upon exposure to this substance
4 First Aid Measures Inhalation Remove to fresh air If not breathing give artificial respiration If breathing is difficult give oxygen Call aphysician Ingestion Induce vomiting immediately as directed by medical personnel Never give anything by mouth to an unconsciousperson Call a physician Skin Contact In case of contact immediately flush skin with plenty of soap and water for at least 15 minutes Removecontaminated clothing and shoes Wash clothing before reuse Get medical attention if irritation develops or persists Eye Contact Immediately flush eyes with plenty of water for at least 15 minutes lifting lower and upper eyelids occasionally Getmedical attention immediately
5 Fire Fighting Measures Fire As with most organic solids fire is possible at elevated temperatures or by contact with an ignition source Explosion Fine dust dispersed in air in sufficient concentrations and in the presence of an ignition source is a potential dustexplosion hazard Minimum explosive dust concentration 40 gm3 Fire Extinguishing Media Water spray foam or dry chemical Special Information In the event of a fire wear full protective clothing and NIOSH-approved self-contained breathing apparatus with fullface piece operated in the pressure demand or other positive pressure mode
6 Accidental Release MeasuresRemove all sources of ignition Ventilate area of leak or spill Wear appropriate personal protective equipment asspecified in Section 8 SpillsClean up spills in a manner that does not disperse dust into the air Use non-sparking tools and equipment Reduceairborne dust and prevent scattering by moistening with water Pick up spill for recovery or disposal and place in aclosed container
7 Handling and StorageKeep in a tightly closed container stored in a cool dry ventilated area Protect against physical damage Isolate fromany source of heat or ignition Isolate from incompatible substances Containers of this material may be hazardouswhen empty since they retain product residues (dust solids) observe all warnings and precautions listed for theproduct
8 Exposure ControlsPersonal Protection Airborne Exposure Limits - ACGIH Threshold Limit Value (TLV) 5 mgm3 (TWA)
xii
Ventilation System A system of local andor general exhaust is recommended to keep employee exposures below the Airborne ExposureLimits Local exhaust ventilation is generally preferred because it can control the emissions of the contaminant at itssource preventing dispersion of it into the general work area Please refer to the ACGIH document IndustrialVentilation A Manual of Recommended Practices most recent edition for details Personal Respirators (NIOSH Approved) If the exposure limit is exceeded a half-face dustmist respirator may be worn for up to ten times the exposure limitor the maximum use concentration specified by the appropriate regulatory agency or respirator supplier whichever islowest A full-face piece dustmist respirator may be worn up to 50 times the exposure limit or the maximum useconcentration specified by the appropriate regulatory agency or respirator supplier whichever is lowest Foremergencies or instances where the exposure levels are not known use a full-facepiece positive-pressure air-suppliedrespirator WARNING Air-purifying respirators do not protect workers in oxygen-deficient atmospheres Skin Protection Wear protective gloves and clean body-covering clothing Eye Protection Use chemical safety goggles Maintain eye wash fountain and quick-drench facilities in work area
9 Physical and Chemical Properties Appearance Transparent colorless crystals Odor Odorless Solubility 1g100g water 37C Specific Gravity 140 pH No information found Volatiles by volume 21C (70F) 0 Boiling Point 140C (284F) Melting Point 135C (275F) Vapor Density (Air=1) No information found Vapor Pressure (mm Hg) No information found Evaporation Rate (BuAc=1) No information found
10 Stability and Reactivity Stability Stable in dry air Hazardous Decomposition Products Decomposes to acetic acid and salicylic acids in the presence of moist air Carbon dioxide and carbon monoxidemay form when heated to decomposition Hazardous Polymerization Will not occur Incompatibilities Strong oxidizers alkali hydroxides boiling water and antipyrine aminopyrine methamine phenol phenylsalicylate and sodium bicarbonate Conditions to Avoid Moisture
11 Toxicological Information Toxicological Data Oral rat LD50 200 mgkg investigated as a mutagen reproductive effector Reproductive Toxicity Reproductive effects recorded on humans (RTECS)
xiii
--------Cancer Lists------------------------------------------------------ ---NTP Carcinogen--- Ingredient Known Anticipated IARC Category ------------------------------------ ----- ----------- ------------- Acetylsalicylic Acid (50-78-2) No No None
12 Ecological Information Environmental Fate When released into the soil this material may leach into groundwater When released into the soil this material maybiodegrade to a moderate extent When released into water this material is not expected to evaporate significantlyThis material has an estimated bioconcentration factor (BCF) of less than 100 This material is not expected tosignificantly bioaccumulate When released into the air this material may be moderately degraded by reaction withphotochemically produced hydroxyl radicals When released into the air this material may be removed from theatmosphere to a moderate extent by wet deposition Environmental Toxicity No information found
13 Disposal Considerations Whatever cannot be saved for recovery or recycling should be managed in an appropriate and approved waste disposalfacility Processing use or contamination of this product may change the waste management options State and localdisposal regulations may differ from federal disposal regulations Dispose of container and unused contents inaccordance with federal state and local requirements
14 Transport Information Not regulated
15 Regulatory Information --------Chemical Inventory Status - Part 1--------------------------------- Ingredient TSCA EC Japan Australia ----------------------------------------------- ---- --- ----- --------- Acetylsalicylic Acid (50-78-2) Yes Yes Yes Yes --------Chemical Inventory Status - Part 2--------------------------------- --Canada-- Ingredient Korea DSL NDSL Phil ----------------------------------------------- ----- --- ---- ----- Acetylsalicylic Acid (50-78-2) Yes Yes No Yes --------Federal State amp International Regulations - Part 1---------------- -SARA 302- ------SARA 313------ Ingredient RQ TPQ List Chemical Catg ----------------------------------------- --- ----- ---- -------------- Acetylsalicylic Acid (50-78-2) No No No No --------Federal State amp International Regulations - Part 2---------------- -RCRA- -TSCA- Ingredient CERCLA 26133 8(d) ----------------------------------------- ------ ------ ------ Acetylsalicylic Acid (50-78-2) No No No
xiv
Chemical Weapons Convention No TSCA 12(b) No CDTA NoSARA 311312 Acute Yes Chronic Yes Fire No Pressure NoReactivity No (Pure Solid)
WARNING THIS PRODUCT CONTAINS A CHEMICAL(S) KNOWN TO THE STATE OF CALIFORNIA TO CAUSEBIRTH DEFECTS OR OTHER REPRODUCTIVE HARM
Australian Hazchem Code No information found Poison Schedule S2 WHMIS This MSDS has been prepared according to the hazard criteria of the Controlled Products Regulations (CPR) and theMSDS contains all of the information required by the CPR
16 Other Information NFPA Ratings Health 2 Flammability 1 Reactivity 0 Label Hazard Warning WARNING HARMFUL IF SWALLOWED OR INHALED CAUSES IRRITATION TO SKIN EYES ANDRESPIRATORY TRACT MAY CAUSE ALLERGIC RESPIRATORY REACTION POSSIBLE BIRTHDEFECT HAZARD MAY CAUSE BIRTH DEFECTS BASED ON ANIMAL DATA AFFECTS THERESPIRATORY SYSTEM LIVER KIDNEYS EYES SKIN AND BLOOD Label Precautions Do not breathe dust Avoid contact with eyes skin and clothing Keep container closed Use only with adequate ventilation Wash thoroughly after handling Label First Aid
If swallowed induce vomiting immediately as directed by medical personnel Never give anything by mouth to anunconscious person If inhaled remove to fresh air If not breathing give artificial respiration If breathing isdifficult give oxygen In case of contact immediately flush eyes or skin with plenty of water for at least 15minutes Remove contaminated clothing and shoes Wash clothing before reuse In all cases call a physician
Product Use Laboratory Reagent Revision Information No changes
xv
xvi
1
CHE 255 Biochemistry Laboratory Fall 2002Overview and Integrated Schedule
Course Description and Objectives Biochemistry is the study of the molecules of livingsystems including study of the physical structures and interactions chemical reactions andbiological activities of these molecules The four main marcomolecules central to biochemicalstudy are proteins nucleic acids lipids and carbohydrates Through focused study of proteinenzymes and their activities properties and kinetics this laboratory course will introduce you totechniques fundamental to biochemical investigations For this course my specific objectives arethat you
bull understand and use many of the techniques and tools of biochemistrybull comprehend fundamental principles of biochemical researchbull communicate research results effectively in written format
Course Activities As a primary basis for learning we will use hands-on laboratory work(including keeping a notebook) In addition you will write short reports participate in discussionwrite an initial and a final draft of a formal laboratory report and complete data analysisquestionreports An integrated schedule of these activities is shown below assignments are due on theweekday of your lab section for the week indicated and must be turned in by 530 pm Detaileddescriptions of these projects can be found on page 5 and following See the CH 255 coursesyllabus for assessment and grading information and policies
Biochemistry Laboratory Schedule
Week of Topic99 Expt 1 Introduction to Basic Techniques916 Expt 2 Amino Acid Composition of a Dipeptide
Short report for Expt 1 due923 Writing discussion and workshop Buffer preparation
Questions for discussion and buffer problems due930 Nobel Conference
Short report for Expt 2 due summary of a Nobel lecture due Oct 3107 Expt 3 Purification of AMP Aminohyrolase1014 Expt 3 (contrsquod)1021 Reading Break1028 Expt 3 (contrsquod)114 Expt 4 pH-Dependence of Fumarase
Expt 4 Data analysis and questions (DAQs)Expt 3 formal report initial draft due
1111 Expt 5 Kinetic Analysis of FumaraseExpt 5 DAQs due
1118 Writing consultation (scheduled)1125 Thanksgiving Break
Final draft of Expt 3 formal report due122 Expt 6 Stereospecificity of the Fumarase Reaction
Expt 6 DAQs due129 To be determined
2
Class policies structure e-mail and feedback By its very nature laboratory involveslearning through hands-on participation so you must attend laboratory Failure to do so willresult in failure of the laboratory portion of the course (see CHE 255 syllabus) Approval ofexcuses for missing lab will be determined on a case by case basis Should you anticipate anacceptable absence you must let me know ahead of time This will facilitate making advancedarrangements for acceptable absences
For each lab we will have a pre-lab discussion to go over background material for the labanticipate scheduling and trouble-shooting issues and communicate new and helpful informationI strongly recommend that you prepare for pre-laboratory ahead of time Doing this will allowyou to ask questions about matters you find confusing which may save you serious time andfrustration during the laboratory Furthermore by reading the material in the laboratory manualdeveloping a plan doing any necessary calculations and noting questions in advance of lab youcan insure things go more smoothly for you and your group in lab In addition the moreorganized you are when you come to lab the better chance you will have to finish in reasonabletime To gain as much as possible from laboratory I recommend that you read any material fromthe Lehninger text or library reserve papers that are related to the weekrsquos exercise
Presenting scientific results is an essential part of the scientific endeavor and thus a focusof this class will include scientific writing Having an accurate record of what you actually did andhow it worked is critical to communicating your results Therefore you should also keep anotebook during lab of all the information necessary to communicate your results Keeping this ingood form and organized will make reports easier Descriptions and instructions for writtenreports related exercises and the presentation project can be found on page 3 and following
Science as practiced is increasingly a collaborative endeavor It is my hope that anenvironment of active learning and cooperation can be cultivated in laboratory and I welcome andencourage your participation Laboratory work is rigorous and I expect everyone to work hardbut if you are having problems with the course please let me know I am here to help you learnTo help answer questions you have about the course I will be using e-mail Expanded commentsabout e-mail are available upon request As an additional note you should be aware that you mayuse the lab section e-mail alias (f-che-255--labgacedu where is your lab section number) toask questions of other lab members in your section
I expect to be learning a great deal this semester I am very enthusiastic about being andbecoming an excellent educator both for you and my future students I welcome your constructivesuggestions as to how to improve laboratory and my teaching I invite you to present and discussyour suggestions with me in my office at any time during the semester
Note about academic honesty Issues of academic honesty are a serious matter As yourwriting will be a principle vehicle for assessment of your work in the laboratory it is important thatyou understand my academic honesty policy specifically regarding plagiarism Consult the CHE255 course syllabus for details about these matters
Students with disabilities Appropriate accommodations will be made for students withdocumented disabilities If you have a disability requiring accommodation in this class pleasecontact either me at my extension or Jane Patchin at x7027 Information concerning a disabilitywill be kept strictly confidential
3
GUIDELINES FOR WRITING LAB REPORTS
You will be writing short reports (see page 5) for Expt 1 and 2 and a formal lab report (see page6) for Expt 3 You should write your lab reports short or formal following the relevantguidelines for the format of a scientific research paper outlined below (NOTE for short reportsonly the Materials and Methods and Results sections apply) In addition you should write yourreports for a peer audience specifically so that they can be read and understood by someone withabout the same approximate general knowledge of biochemistry Keep in mind that scientificwriting is concise and terse Say only what is needed for clarity My hope is that by defining youraudience for you it will make easier decisions about what detail should and should not beincluded Although I encourage you to work with your lab group to understand the experimentsand data lab reports are to be written on an individual basis and in your ownwords Reports must be turned in by 530 pmthe day they are due as indicated on the schedule
There are many good reference manuals for scientific writing including The ACS Style Guide AManual for Authors and Editors edited by Janet S Dodd (Amer Chem Soc) available in thecollege library See also material from JRL Walker on reserve in the library However we willalso be spending laboratory class time discussing and evaluating samples of scientific writingThere will also be instructor and peer feedback on the first draft of your formal report followed bya consultation with the instructor before the final draft is to be compete
In your reports include the following sections in the order given
Title page First page has the paper title date author(s) and relevant biographical information
Abstract Summarize the major points of the report including a one sentence statement of whatwas doneattempted all significant dataresults obtained and a brief statement about the meaningof the results This section should be very concise and not exceed one paragraph in length
Introduction Provide background material needed to support and understand the data presentedin the report from the angle you present it This means that your choice about whether to presentthe material as a novel discovery or as a methods development should impact the content of yourintroduction Think about the following questions What were you trying to accomplish in thisexperiment Given your answer to that question what does the reader need to know or toremember in preparation for reading a description your experimental results Include in thissection an introduction and pertinent background to the topic of the paper the purpose of yourexperiment(s) the theoretical basis or rationale for the experiment(s) and the significance(expected or real) of the result(s) you sought Do not include any methods or results here
Materials and Methods (Experimental) Describe exactly all the methods and reagents youused in the experiment using passive voice Where the lab manual or other sources providemethod details I want you to reference the source (with a parenthetical inset) but to write in yourown words a description of the method Be sure to list your source reference in thebibliography Copying from the lab manual is not permitted This section should be as brief aspossible yet allow your peers to repeat exactly the experiment you described given only yourreport as a guide For example it is important to list the composition of all buffers and othersolutions used in the experiment but not to describe how they were prepared or how much wasmade In contrast the amount used in the particular experiment may be important
Results Report all data obtained Relevant data should be clearly presented in Tablesandor as Figures To be clear all figures and tables must have a title (following the figure or
4
table number in the legend) properly labeled components (axes units of measure etc) andinclude figure legends with relevant information not already in the figure such as the identity ofsymbols used wavelengths amount of sample used etc Include only essential information in thefigure legends that is already described in the Materials and Methods section The Results sectionmust also include textual explanations of the results as well It is often helpful to think of thetextual part of the results section as serving the function of telling a story about your resultsThis has several implications First introductory or transition sentences can be very helpful Theuse of these seemingly extra words does not have to be in conflict with being concise and it mayyield clarity that allows it all to be said with less Secondly a good story does not covereverything but will report the most significant details Thus although a good Results sectionreports all the details the text of your Results may leave some details present only in the tables orfigures The idea is to lead your reader through the results you obtained from your experimentsnot to simply reiterate the methods Primary data (spectra and kinetic recordings) should beretained dated and kept in your notebooks It is important to provide equations used to calculateimportant experimental values but do not show the actual calculation unless the actual result comesfrom a computational approach These can be placed in the methods when VERY routine in theResults text or Figure Legends but not more than one of these I require you to use the past tensein your Results section (what DID you obtain in this experiment)
Discussion Analyze the data reported in the results section Try to answer the questions Whatdo these data mean How do the results advance the knowledge in this field of study What futureexperiments are suggested by your work Do not simply summarize the data again Use the pasttense here (what DID this experiment reveal) Be sure to address all the questions listed at the endof each experiment in this manual
References As laboratory research relies on previous work written reports must includereferences Inadequate or inappropriate referencing should be avoided Include references to anyjournal articles books laboratory techniques manuals etc used to complete your lab reports bothas parenthetical references (in the correct location of the text) AND in the bibliography Listreferences in proper scientific format Research journals in biochemistry use varied systems forreference citation For this course use the following format
First-last-name First-initial Second-last-name Initial and Last-last-name Initial (Date)Title Journal Title Standard Abbreviation Volume number first page-last page
For further information about writing lab reports consult the article on reserve in the collegelibrary Walker JRL (1991) A studentrsquos guide to practical write-ups Biochem Ed 19 31-32
Lab Notebooks Presenting scientific results (written or oral) is an essential part of the scientificendeavor and thus a focus of this class Having an accurate and real record of what you actuallydid and what resulted is critical to communicating your results Therefore you must keep anotebook during the lab that includes all of the information methods data etc that are necessaryto repeat and communicate your results Researchers in biochemistry use a variety of notebookformats ranging from bound carbon-copy notebooks to loose paper kept in a ring binder Youmay choose your own approach but your notes must be legible clear complete and well-organized so that someone could read understand and repeat your work Ask if you want helpwith this It will be incredibly helpful to you in creating well-written lab reports
Other NotesYou will need a PC-formatted disk on which to save all data generated in this lab includingspectroscopic data Nothing will be safe stored only on the hard drive of the computers in lab
5
Short Reports for Laboratory
Project OverviewThese assignments are short length reports formal in format and intended to improve yourscientific communicating and writing skills by practicing communicating what you did inlaboratory to a peer level audience
Learning Objectivesbull Convey concisely precisely and with understanding the methods for the relevant
experiment (NOT simply a copy of the lab manual) in a Materials and Methods sectionbull Report in narrative form and with understanding the results of the relevant experiment
supported by all of the data in either tabular or figure formatbull Communicate a well understood and well written report (ie complete concise and good
use of bibliographic references and proper English)
Directions and FormatThe short format report should be a brief typed report including only the Methods and Materialssection and Results section (including data analysis and equations) of a formal report plus theanswers to questions from DATA ANALYSIS of the experiment Refer to the preceding pages fordirection on the writing of the short report Additional reference material is available in the libraryas noted in the lab manual
A formal length requirement is not going to be enforced but make sure you follow closely thedirections regarding clarity of communication while being concise in your presentation of what youneed to say Format requirements include a report that is typed double spaced with one inchmargins all around and using a font that is no less than 12 points Placement of figures and tablescan be in the text or at the end but must have titles and figure legends Use headings toidentify the Materials and Methods (one section) and Results sections Note the directions on useof VERB TENSE in scientific writing The report should be nicely printed but need not bebound except by staple or paper clip
Evaluation CriteriaThe report will be evaluated based on how well you accomplish the learning objectives outlinedabove I want to be convinced from your report that I could repeat the experiment given what youhave written I will also be looking for whether you have done a high quality and complete job ineffectively communicating your results including your ability to write a good narrative and notjust a list of references to the figures and tables I will be looking for clear and concisecommunication completeness and a good understanding of your topic I will also be looking forcorrect labeling of figures (units labeled axis etc) and proper and adequate use of references
6
Formal Report for Laboratory
Project OverviewThis assignment is a formal laboratory report to be written in science journal article format Theintent of this project is to provide an opportunity for you to 1) develop an appreciation for thedevelopment and theory of techniques you used in the laboratory exercise 2) gain a deeperknowledge and understanding of the biochemistry central to the laboratory exercise and thefundamentals of biochemical research in general and 3) learn how to communicate effectively theresults of your laboratory efforts in a professional format Together this assignment serves toprovide a vehicle toward achieving the course objectives
The Expt 3 formal report will be initially evaluated (and graded) as a first draft The writing in thefirst draft will also be critiqued through a peer review exercise (see below) Two of your peerswill critique your draft (and you will critique othersrsquo drafts) Peer critiques will be graded I willassemble the critiques as a whole and provide you with the respective feedback You will thenhave the opportunity to discuss your writing with me during a scheduled consultation The finaldraft of the Expt 3 formal report will be due one week later (see syllabus page 1 for dates)
Learning Objectivesbull Convey an understanding of the techniques (use theory etc) used in the laboratory
exercise in the context of presenting your resultsbull Demonstrate knowledge and understanding of the biochemistry and the approach of the
exercise and appreciate the significance of your resultsbull Communicate a well researched and well written report (ie complete concise and good
use of bibliographic references and proper English)
Directions and FormatThe directions for writing formal laboratory reports are well elaborated on pages 3-4 Additionalreference material is available in the library as noted A formal length requirement will not beenforced but make sure you follow closely the directions regarding clarity of communication whilebeing concise in your presentation of what you need to say Format requirements include a reportthat is typed double-spaced with one inch margins all around and using a font that is no less than12 points Placement of figures and tables can be in the text or at the end but figure legendsmust accompany them Headings should be used for each of the key sections of a scientificarticle including abstract introduction materials and methods (one section) results discussionand references Note the directions on use of VERB TENSE in scientific writing The reportshould be a quality printing but need not be bound except by staple or paper clip
Evaluation CriteriaThe report will be evaluated based on how well you accomplish the learning objectives outlinedabove I want to be convinced from your report that you have done a high quality and completejob in effectively communicating your results In your writing I will be looking for clear andconcise communication completeness and a good understanding of your topic I will also belooking for correct labeling of figures (units labeled axis etc) proper and adequate use ofreferences and a discussion that is thoughtful and possibly even creative
7
Scientific Writing Discussion
For this exercise we will be discussing and hopefully learning about scientific writing Thevehicle for our discussion will be in part your reflection and responses to reading the writing in thetwo successfully published biochemical papers provided We will be analyzing the papers for theirwriting rather than their scientific merit Learning to think about the intended reader before orwhile writing is a great vehicle for clear writing However to aid in your assessment of thewriting you will need to have a sense for the science presented I recommend reading both papersonce to get a general sense for their content the types of experimental questions asked the types ofexperimental techniques employed and the outcome and significance of the work After you havedone this you should read the list of questions or points for reflection below and then re-read andanalyze the writing in both papers The papers I have provided intentionally represent twodifferent formats so that comparison and contrast might aid our discussion The main idea behindthis exercise is that reflecting upon and discussing scientific writing as a reader should make moreexplicit to you elements of scientific writing that make it good Once you recognize these elementsexplicitly you can then apply yourself to emulating those elements of quality in your own writing
How does the writing in these papers differ from other types of writing you have encounteredHow does the writing in the two papers differ from each other
What is the general scheme for organization of both papers How do they differ
Look at the respective sections of each paper in light of the function outlined for them in thelaboratory manual (pp 3-4) How do the sections of each paper fall short meet or exceed thesegoalsfunctions How are the papers similar or different in this regard
In order for others to repeat published work it is very important that the description of what wasdone is complete Could you repeat the experiments (or does it seem like you could) described ineither paper given what the authors providedescribe Is one of the papers better in this regardWhich one and why
Figures and tables and their legends play a key role in effectively and clearly presenting scientificresults Can you tell what question the experiment in the figure is trying to answer Can you tellwhat techniques were used to obtain the results in the figure How were the samples (if any)prepared How do the symbols or labels aid your understanding of the data What features aremost helpful or essential
What do you notice about the verb tense used throughout the different sections of a given paperWithin the individual sections of a given paper Between the two different papers What role doesthis play
Clarity of scientific writing is of key importance Are the respective sections of each paper clearAre the figures tables and figure legends (as presented) clear Overall what do you thinkcontributes to whether these papers achieve clarity (or fail to) For example how does theirorganization format use of verb tense etc help or hinder this Is one paper more clear than theother If so why
Having thoughtfully analyzed these papers as a reader what would be your main goal (ie whatwould you try to achieve) as you write a scientific paper What would you try and avoid
What other observations or questions do you have concerning the writing in these two paper
8
EXPERIMENT 1 Introduction to Basic Biochemical Techniques
Biochemistry is a very broad discipline but there are certain basic techniques that every biochemistuses in the laboratory Three of these basic techniques are emphasized in this exercise and theyare (1) Measurements (2) Dilutions and (3) UVvis Spectroscopy This experimentintroduces you to these essential techniques and gives you a chance to try them for yourself Inthis experiment you will utilize these techniques to measure the concentration of protein in solution(the Bradford assay) although you will use these techniques repeatedly throughout the semester
(1) MEASUREMENTS
Many biochemical measurements are made on a very small scale using micropipettors many ofwhich are air displacement piston pipettes such as the Rainin Pipetmantrade They are quick andconvenient but their accuracy is dependent on how they are adjusted and used Below are volumeranges cautions and instructions for using the pipettors If you have not used pipettors before orif it has been a while practice using them with water before proceeding to the Bradford assay
Volume Ranges for Pipettors In biochemistry laboratory we will use sets of pipettors whichmeasure volumes on a microliter scale The following summarizes the three basic models Small-volume model generally 1-20 microl in 002 microl increments (recommended range is 1-20 microl) Mid-volume model 1-200 microl in 02 microl increments (recommended range is 20-200 microl) Large-volume model 1-1000 microl in 20 microl increments (recommended range is 200-1000 microl)
CAUTIONS for using the pipettors1 NEVER invert the pipettor or lay it on its side with liquid in the tip This can result in liquidentering the barrel andor piston This liquid may carry over and contaminate subsequent samplesIn addition it is possible that certain solutions may damage the piston (see 2) If this happensthe pipettor should be disassembled cleaned and dried (please inform your instructor)
2 DO NOT use volatile or highly corrosive liquids Use of highly volatile organic solventswill prevent the tip from filling completely due to their high vapor pressure Highly corrosiveliquids such as concentrated acids may cause corrosion of the stainless steel piston The pipettorshould be disassembled cleaned and dried after such use 3 FOR ACCURACY when making dilutions always pipet the largest volume into your tube orflask first Then pipet the smaller volume into the larger volume When adding a small volume toa larger volume never dispense the sample onto the side of the tube or flask Ratheralways submerge the end of the pipette tip into the solution before dispensing the smaller volume
Operation of Pipettors1 Set the desired volume by turning the volume adjustment knob until the correct volume showson the digital indicator For best precision approach the desired volume by dialing downward(at least one-third revolution) from a larger volume setting
To accurately set the desired volume on the pipettor it is important to recognize the position of thedecimal point On the small-volume model the decimal point is between the middle and lowestdials with tenths of microliters indicated in color or by a line On the mid-volume model thedecimal point is absent and two-tenths of a microliter subdivisions are indicated on the lowest dialOn the large-volume model the decimal point is either between the top and middle dials withmilliliters indicated in color and hundreds and tenths of microliters indicated in black on the lowertwo dials or missing so that the dial that shows 1000 microl with two-tenths subdivisions
9
2 Attach a new disposable tip to the shaft Press firmly with slight twisting to insure a positiveairtight seal Loose tips can result in sample leakage or the tip falling off at an inappropriate time
3 Slowly depress the plunger to the first positive stop (where you feel stronger but not totalresistance) This is the calibrated volume displayed on the digital readout
4 Hold the pipettor vertically and immerse the tip just below the surface (a few mm) of liquid
5 Allow the push button to return slowly to the up position Never permit it to snap upThis can result in liquid being pulled into the barrel andor piston causing the types of problemsyou have been cautioned about above
6 Wait several seconds to insure that the full volume is drawn up into the tip More viscoussamples or very fine tips require a longer period of time
7 Withdraw the tip from the sample liquid If any liquid remains on the tip exterior wipe it with aKimwipe taking care not to touch the tip opening OR drain it by touching the containerrsquos side
8 To dispense the sample depress the plunger slowly to the second stop Always assess that allthe liquid has been dispensed before removing your pipettor (viscous solutions may take severalseconds to be completely expelled from the pipette tip)
(2) DILUTIONS
Please read Appendix I Concentration and Dilution before coming to lab In this exerciseyou will be making a series of dilutions of a 2 mgml bovine serum albumin (BSA) stock solutionusing Tris buffer These dilutions will provide your protein concentration standards which youwill use to determine the concentration of a protein solution of unknown concentration so accuracyis important Serum albumin is an important transport protein in all mammals acting as a carrierfor several substances in the blood most notably fatty acids BSA in particular is frequentlyused as a source of protein for concentration standards as it can be effectively isolated from asource that is both abundant and readily available (cow serum) and is therefore less expensive
(3) UVVIS SPECTROSCOPY
Please read Appendix II Spectroscopy on spectroscopic principles UVVis spectroscopy isa very valuable biochemistry laboratory tool for assaying directly or indirectly the concentrationand concentration changes of various biomolecules Using enzyme proteins as an example theconcentration changes of substrate or product molecules in the presence of the enzyme provideimportant data about the enzymersquos activity We will use UVVis spectroscopy to do this type andother types of measurements in several experiments this semester so to understand what we willbe doing later it is important for you to become familiar with the principles involved now
We will be using Cecil spectrophotometers in these and other experiments throughout the semesterTherefore you will want to use today to learn how to use the instruments in preparation for otherexperiments during the semester The software-spectrophotometer interface is Windows based andfairly intuitive You will have opportunity to ask questions following a brief demo of theinstrument and the instructor and laboratory assistant will be able to help you if questions arisefrom your efforts to learn about the instrument
10
BRADFORD ASSAY
The Bradford spectrophotometric assay (Bradford MM 1976) provides for the indirectmeasurement of protein concentration in solution and is a commonly used method In fact youmay have already used it but if not you will use it today and in later experiments this semester
As an indirect measurement of protein concentration the Bradford spectrophotometric assay doesnot measure the light absorbed directly by the protein in solution Rather the assay measures thelight absorbed by a specific dye that absorbs more of certain wavelengths of light (and less ofothers) when bound to proteins then when it is not In simple terms the physical interaction of thedye and protein in solution results in an observable change in color This assay is an example of adye-binding assay and as such its fidelity in measuring protein concentration is dependent uponthe physical and chemical conditions influencing the interaction between protein and dye
In the Bradford assay the dye used isCoomassie Brilliant Blue G-250 a sulfatedcompound (Figure 1) When not bound toproteins the dye exists largely in the redform (Amax 465 nm) The blue form of thedye (Amax 595 nm) carries a (-) charge andinteracts with (+) charges on proteins to forma complex (Chial et al 1995) Increasing theamounts of the complex (which when thedye is not limiting depends upon the amountof protein) results in an increase in theabsorbance at or near Amax This reaction isvery rapid and reproducible Samples arestable for up to one hour at roomtemperature
The increase in absorbance resulting frominteraction of the dye with protein is monitored using a spectrophotometer To calibrate theabsorbance to protein concentration a series of protein standards are assayed and a plot ofabsorbance verses protein concentration (standard or calibration curve) is generated This graph isused to determine the concentration of proteins in experimental samples based upon the absorbanceof those samples
EXPERIMENTAL PROCEDURE
Materials providedTris buffer [10 mM Tris-HCl (pH 70)]Bovine serum albumin (BSA) stock solution [2 mgml BSA in Tris buffer (pH 7)]Bradford reagent [001 (wv) Coomassie Brilliant Blue G-250 47 (wv) ethanol
85 (wv) phosphoric acid]Mock Bradford solution [47 (wv) ethanol 85 (wv) phosphoric acid]
1 Obtain some stock solution of BSA In microfuge tubes prepare a series of BSA solutions ofvarying concentration by diluting the 2 mgml BSA stock solution with Tris buffer You will need~200 microl of each dilution at the following concentrations 005 mgml 01 mgml 02 mgml 03mgml 04 mgml 05 mgml and 06 mgml Be sure to label each tube (compoundconcentration your initials date) Keep the unused portion of your samples at 4degC for Expt 3
11
2 Add 25 ml of Bradford reagent to a separate test tube or cuvette for each of your samples andlabel them appropriately Consider the value of determining the concentration of one or moredilutions of your unknown sample as well as the undiluted (ldquoneatrdquo) unknown sample Prepareyour samples by adding 50 microl of each protein sample (diluted standard or unknown) separately tothe Bradford reagent in the appropriately labeled tube Mix the tubes by gentle inversion severaltimes and let the color develop for 5 min Observe and record the color change of your standardsamples as a function of protein concentration By comparing your unknown to your proteinstandards determine as closely as you can the concentration of your unknown by eye
3 While the color is developing set up the spectrophotometer Prepare a blank sample by mixing50 microl Tris buffer with 25 ml Bradford reagent and another by mixing 50 microl Tris buffer with 25ml Mock Bradford solution
4 You will need to determine which portion of the UVvis spectrum specifically whichwavelength will be useful for following the dye bound by protein Using your Mock Bradfordblank sample in a plastic cuvette set the background for the spectrophotometer Take a fullspectral scan of your Bradford reagent blank prepared in step 3 When your standard sampleshave fully developed take a full spectral scan of the most concentrated standard you prepared
5 Based on your results chose a single wavelength suitable to analyze the results of your dyebinding assay Measure and record the absorbance of each standard and unknown sample at yourchosen wavelengths using plastic cuvettes These data may be obtained from spectral scans orfrom single wavelength readings In either case you must consider your data in light of thebackground absorbance of your ldquono proteinrdquo sample
6 Prepare a plot of the values of absorbance above background verses protein concentration forthe standard samples and fit the data to a line by linear regression Using the resulting equationfor this line and the value of absorbance above background for unknown sample determine theprotein concentration of your unknown
DATA ANALYSIS
For Expt 1 you are to write a short lab report (see page 7) Using the instructions on pages 5-6prepare a type-written report that includes only the Material and Methods and Results sections plusanswers to the questions below Include all of the data obtained (in a table) a standard calibrationplot figure with relevant equations and the concentration of your unknown protein sample
Questions1 How close was your determination of your unknown protein concentration by eye to thedetermination by Bradford assay What did you learn from this exercise
2 How appropriate is BSA as a concentration standard protein considering standard calibrationplots are often used to determine the concentration of proteins other than BSA (see Chial et al)
3 If you measured the concentration of a dilution of your unknown sample what did you learnfrom this measurement
References Bradford MM (1976) Anal Biochem 72 248-256
Chial HJ Congdon RW and Splittgerber AG (1995) J Chem Ed 72 76-79
12
EXPERIMENT 2 Amino Acid Composition of a Dipeptide
Much can be learned about a protein or peptide by determining its amino acid composition (andsequence) To determine the amino acid composition all peptide bonds in a purified protein mustbe cleaved (either enzymatically or with strong acid or base) and the individual amino acids must beseparated identified and quantified Thus there are three aspects to this type of experiment 1)the reaction chemistry 2) the separation of the reaction components and 3) the assay oranalysis of the outcome (identificationquantification)
For the reaction chemistry of this experiment we will be using enzymatic hydrolysis ofpeptide bonds This approach is advantageous because acid hydrolysis tends to destroy someamino acids There are many enzymes collectively called proteases or peptidases that cleavepeptide bonds Some are endopeptidases in that they cleave internal peptide bonds others areexopeptidases in that they cleave N- or C-terminal peptide bonds In this experiment we will usethe enzyme carboxypeptidase A which cleaves C-terminal peptide bonds to cleave the onepeptide bond present in a purified dipeptide of unknown amino acid composition
The reaction chemistry of our experiment depends on the activity of an enzyme preparation(presumable highly purified) Because enzymes are labile molecules and can lose their activity (iewhen they denature) we will adopt an experimental strategy that implicitly reveals the status of ourenzymersquos activity along with the experimental result We will utilize a comparative approach byseparating and assaying dipeptide ldquotreatedrdquo and ldquountreatedrdquo with enzyme We expect that theenzyme activity will result in a change to the treated dipeptide By including the ldquountreatedrdquoreaction as a control we would observe no change if the enzyme activity were lost or absent
The separation of molecules of interest from uninteresting ones is a fundamental tool tobiochemical research In this experiment separation of amino acids will be done using simplepaper chromatography to illustrate general principles of separations All chromatographictechniques are based on the principle that the solute of interest partitions in a characteristic waybetween a stationary phase and a mobile phase The mobile phase (a gas or liquid) moves thesample solute through a region containing the stationary phase (a liquid or solid) The theory andpractice of paper chromatography are very similar to those of thin-layer chromatography (TLC)which you used in Organic Chemistry lab In paper chromatography a piece of paper composedof cellulose is extensively hydrated so solutes (amino acids here) partition between theimmobilized water (stationary phase) and the solvent used to run the chromatograph (mobilephase) We will see additional application of the principles of this fundamental tool ofbiochemistry in the separation and purification of an enzyme protein in Expt 3
The assay of our experimental outcome involves the identification of the amino acids (we willnot be quantifying the results of this more qualitative experiment) The first step in identification ofthe amino acids involves their detection Detection of amino acids is accomplished by treating thepaper with ninhydrin which turns purple upon binding the free primary amino groups of aminoacids Consult your organic chemistry textbook to review the reaction chemistry of ninhydrinAssigning an identity to each unknown amino acid is accomplished by including on thechromatograph samples containing a known amino acid and comparing the relative mobilities ofsolutes in your unknown sample with those of known standards The relative mobility of amolecule is indicated by the Rf value
Rf = Distance (origin to sample spot) divide Distance (origin to solvent front)
Rf values vary with solvent type of stationary support (eg cellulose silica gel) and temperature
13
EXPERIMENTAL PROCEDUREMaterials provided
Enzyme buffer [25 mM Tris-HCl (pH 75) 500 mM NaCl]Unknown dipeptide [2 mgml in enzyme buffer]Carboxypeptidase A (500-1000 unitsml)10 M acetic acidAmino acid standards [1 mgml in enzyme buffer]Whatman 3MM chromatographic paper 20x20 cmChromatographic solvent [6040 acetonitrile01 M ammonium acetate] and jar or chamberNinhydrin solution [02 ninhydrin in ethanol]
1 Set up three tubes First in each of two microcentrifuge tubes place 100 microl of unknowndipeptide solution To one of these tubes add 5 units carboxypeptidase A and to the other tubeadd a volume of enzyme buffer equal to the volume of enzyme added to the first tube As a controlfor amino acids contributed from the enzyme source place 100 microl of enzyme buffer in a tube andadd 5 units of carboxypeptidase A Mix all tubes gently by tapping them with your fingerIncubate for one hour at 37degC in a water bath
2 For the following step wearing laboratory gloves Amino acids deposited on yourchromatography paper from the skin of your fingers are abundant enough to be detected byninhydrin as fingerprints (this is used in forensic science) Prepare a piece of Whatman 3MMpaper for chromatography Lightly mark the origin 2 cm from one edge (the bottom) of the paperwith a pencil Indicate with dots where each sample and standard will be loaded onto the paper atthe origin keeping the dots at least 15 cm apart You will need 4 lanes for your sample and onelane each for each of the amino acid standards Label each dot Also prepare the solvent chamberby adding enough solvent to reach 1 cm height in a large glass jar or plate chamber Close the lidso that the solvent vapor and liquid phases equilibrate
3 Add 50 microl 10 M acetic acid to all three tubes including the reaction tube and the control tubesMix Acetic acid stops the enzyme-catalyzed reaction and causes the enzyme to precipitate
4 Spin each tube in the microcentrifuge for 10 min at 3000 rpm to pellet any precipitate
5 Carefully remove 50 microl of the supernatant from each tube taking care not to disturb any pelletat the bottom of the tube
6 Load 2 microl of each amino acid standard Based on the amount of standard used determine abouthow much unknown sample you will need Load two different amounts of each unknown sample(plusmn enzyme) to the paper separately at two dots Let loaded samples air-dry briefly
7 Roll the paper into a cylinder and staple the edges taking care not to let the edges touch if usinga large jar This is easier if one person holds the paper in a cylinder and another staples Securepaper to insure it remains upright if you are using a plate chamber Make sure the solvent inthe chromatography chamber is below the origin on the paper then drop the paper intothe solvent chamber Let the chromatograph run for approximately 1 hour or until the solventfront is 1-2 cm from the top of the paper
8 Remove the paper from the chamber quickly but carefully remove the staples and mark thesolvent front lightly with a pencil Let the solvent air-dry When dry spray evenly with ninhydrinsolution in the hood The paper should be damp but not dripping with ninhydrin solution Placethe paper upright in the oven at 110degC until the purple spots develop (~ 15 minutes)
14
9 Calculate Rf values for the standards and unknown sample If the spots are broad measurefrom the middle of the spot
DATA ANALYSIS
For Expt 2 you are to write a short lab report (see page 7) Using the instructions on pages 5-6prepare a type-written report that includes only the Material and Methods and Results sections plusanswers to the questions below Include all of the data obtained (Rf values in a table) and theamino acid composition of your unknown dipeptide sample
1 Look up the substrate specificity of carboxypeptidase A You might find this in one or more ofthe books on enzymes in the library another biochemistry text or on web resources Could youuse this enzyme to cleave the C-terminal peptide bonds of any peptide Explain your reasoning
2 Can you determine or predict the amino acid sequence of your dipeptide How could youchange this experiment to determine the sequence of these two amino acids in the dipeptide
15
EXPERIMENT 3 Purification of AMP Aminohydrolase
In Expt 2 you learned that the separation of molecules from each other is a fundamental tool usedin biochemical research Separations can be employed for analytical purposes (as in Expt 2)which often involve small amounts of material or for preparative purposes which involve largeramounts of material and aim to recover relatively pure molecules for additional study Inbiochemistry a common goal for employing separation techniques is the purification of a proteinof interest for preparative purposes This is a daunting task The development of a successfulprocedure for purifying the protein of interest from the hundreds of other proteins in the startingmaterial often requires trying a series of some of the variety of separation methods in differentorders andor combinations Each separation method generally exploits a specific physicalproperty of the protein of interest that ideally is not shared with too many other proteins in thestarting material In an effective purification the relative purity of the desired protein is increasedby combining two or more separation methods each of which generally exploits a differentphysical property of the protein With each additional step however the final amount of proteinrecovered generally becomes less
Effective protein purification usually requires at least one column chromatography separation Thegeneral principles of chromatographic techniques were introduced in Expt 2 Remember allchromatography is based on the principle that the solute of interest partitions in a characteristic waybetween a stationary phase and a mobile phase The mobile phase (a liquid in this experiment)moves the sample solute (protein of interest) through a region containing the stationary phase (asolid resin in this experiment) The type of chromatography used in this experiment is calledaffinity chromatography as it exploits the high binding specificity and affinity the desired proteinhas for the stationary phase The binding of the protein of interest to the stationary phase has thepotential to very effectively remove it from the hundreds of other proteins in the mobile phase Ifno other proteins in the starting material share the affinity the desired protein has for the stationaryphase affinity chromatography can very powerfully permit complete purification
The goal of this experiment is to purify the enzyme AMP aminohydrolase from chicken muscleAMP aminohydrolase (or adenylate deaminase) is an abundant enzyme in contracting muscle andis involved in the degradation of purine nucleotides It catalyzes the hydrolysis of adenosine5rsquo-monophosphate (adenylate AMP) to inosine 5rsquo-monophosphate (IMP) plus ammonia
The column chromatography step that you will use has been selected based on the specific bindingproperties of AMP aminohydrolase Often a researcher can predict that a specific enzyme mightbind to a chromatographic resin (stationary phase) if the ligand attached to the resin resembles theenzyme substrate The enzyme binds to a substrate or substrate analog ligand immobilized on theinsoluble matrix of resin It can then be washed free of other proteins and eluted by a change in themobile phase that will alter the affinity of the protein for the resin-ligand and cause its release
16
The resin used in this experiment is phosphocellulose which contains a high number ofnegatively-charged phosphate groups attached to cellulose It is most frequently used as a resin forion-exchange chromatography However since AMP aminohydrolase binds to the substrateAMP which contains a negatively-charged phosphoryl group one might predict that it will alsobind to this resin If it binds to this substrate analog one might predict that the enzyme could beeluted by pyrophosphate (PPi) (an inhibitor of the enzyme) which decreases the affinity of theenzyme for its substrate (AMP) Pyrophosphate also partially mimics the phosphate groupsattached to the cellulose resin In this experiment you will characterize the effectiveness ofphosphocellulose as a matrix for affinity purification of chicken muscle AMP aminohydrolase
EXPERIMENTAL PROCEDURE
As biochemical purification is often fairly extensive Experiment 3 will be done over the course ofthe next three weeks In the first week you will prepare the protein extract from chicken muscleand chromatography resin and run a brief exercise intended to familiarize you with the Pharmaciachromatography system we will be using in the second week In the second week you willassemble and run the chromatography system to purify (hopefully) AMP aminohydrolase fromyour chicken muscle extract This week concludes with assaying the fractions you collect from thecolumn for enzyme activity pooling those of highest activity and dialyzing them to remove thepyrophosphate eluant from your purified enzyme sample In the third week you will assay themajor fractions of the purification for protein concentration and enzyme activity to help assess themethod You will also analyze these same fractions by sodium dodecyl sulfate-polyacrylamide gelelectrophoresis (SDS-PAGE) to assess relative complexity of the proteins in each sample and therelative purity and molecular weight of AMP aminohydrolase (see Appendix VI)
Week 1
This week your working group will be divided to provide a representative to a task groups thatwill accomplish the three tasks of this week preparation of chicken protein extract preparation ofchromatography resin and preparation for using the chromatography system next week As yourworking groups representative to one of this weekrsquos task groups it will be your responsibility tobecome involved in the task learn all that is necessary to do it independently and report back toyour group what you learned Your working group partners will share a similar responsibility toexplain to you how to do what they learned to do
Materials providedChicken breast muscle (from the local grocery store)Extraction buffer [018 M KCl 54 mM K2HPO4 32 mM KH2PO4 (pH 65)]Waring blender250 ml centrifuge bottlesFunnelGlass woolOakridge 40 ml screwcap polypropylene centrifuge tubesPhosphocellulose resin pre-swelled in dH2O overnightBasic resin wash solution[005 M NaOH 05 M NaCl]Acidic resin wash solution [01 M HCl]Glass columnsBuffer A [25 mM TrisHCl (pH 81)]Buffer B [25 mM TrisHCl (pH 81) 500 mM NaCl]protein standards [015 mgml equine myoglobin 038 mgml conalbumin 046 mgml
chicken albumin 038 mgml soybean trypsin inhibitor 25 mM TrisHCl (pH 81)]
17
CAUTION To prevent proteolysis and preserve enzyme activity keep all enzymefractions and all solutions at 4degC (in the refrigerator or on ice) as much aspossible during extraction and purification Carefully label all your samples
PREPARATION OF CHICKEN BREAST EXTRACT - Extract preparation will be done in batchand will be the responsibility of a group of four that includes one member of each working group
1 Quickly cut up one partially thawed chicken breast into small pieces (1 cm) Place 50 g in aWaring blender and homogenize with 200 ml of cold extraction buffer at high speed with five 15-sec bursts Make sure the blender lid is on tight Immediately pour homogenate into prechilled250 ml centrifuge bottles and keep on ice
2 Important balance centrifuge bottles to equal weights using Harvard Trip balanceCentrifuge the homogenate at 6000 x g (check specifications for rotor used) for 15 min at 4degC
3 Pour the supernatant through a funnel with a ldquofilterrdquo of glass wool into a beaker on ice Discardthe pellet Record the volume of filtrate and aliquot an equal volume into four polypropyleneOakridge tubes Seal screw cap and store tubes in the -20degC freezer until next week
PREPARATION OF PHOSPHOCELLULOSE RESIN AND COLUMN (adapted from directionsof Sigma Chemical Company) - The resin preparation will done as a batch and will be theresponsibility of a group of four that includes one member of each working group
1 Obtain the pre-swelled phosphocellulose resin (3 g = ~20 ml wet resin) and decant water
2 Add a volume of water 5 times that of the wet resin stir and allow to settle for 30-45 minutesWhen most of the resin is settled decant Record the resin volume
3 Suspend resin using 5 times the resin volume of basic wash for 10 min Pour slurry into acourse scintered glass funnel under gentle suction (~1 resin volume5 min) Continue until all ofthe slurry has been added and follow with a wash of 5 times the resin volume of deionized water at1-5 resin volumesmin
4 Use acidic wash to resuspend resin and remove it from the funnel Soak in a total of 5 times theresin volume of acidic wash for 10 min Pour slurry back into the course scintered glass funneland wash with 10 times the resin volume of water until flow-through shows a pH of ~5
5 Wash with 5-10 times the resin volume of extraction buffer until the pH of the flow-throughreaches that of extraction buffer (~ 65) Resuspend in extraction buffer and transfer to a beaker
6 Allow the resin to settle and decant all but one resin volume of buffer
7 (To be done by working group) Mix resin and buffer into a slurry (it will be 11 resinbufferslurry see step 6) and measure a volume of slurry equal to twice the amount of resin bed (gt 2 ml)desired in your column Dispense into your column cap and store at 4degC Record bed volume
18
PREPARATION FOR USING THE PHARMACIA PUMP AND COLLECTOR SYSTEM -Becoming familiar with how to use the peristaltic pump and fraction collector in preparation fortodayrsquos chromatography exercise will be the responsibility of a group of four that includes onemember of each working group The exercise itself is to be done by each working group
1 Identify how to assemble the tubing column and fraction collector and become familiar with itsplumbing and operation Determine how to make a two solution gradient (see instructordemonstration)
2 Once assembled as a working group instruct your group on what you have learned about theequipment you will be using for column chromatography
3 (As a working group) Fill the system line with buffer and eliminate air bubbles Set flow rate tobe constant at about 15 mlmin
4 Attach the ion exchange column to the system line and wash the column removing any air fromtubing with buffer A
5 Before starting set your fraction collector to begin collect 3 ml samples
6 Place inlet tubing into your protein standards solution without introducing any air (a slightsqueezing of the tubing can help achieve this) Run the pump until about 2 ml of your sample hasentered the tubing
7 Pause the pump and transfer the inlet tubing to buffer A Avoid introducing any air Run thepump for about two minutes
8 Pause the pump and transfer the inlet tubing to the gradient buffer set up without introducingany air Run the pump for 10 minutes
9 Pause the pump and transfer the inlet tubing to buffer B Avoid bubbles Run the pump for 6minutes
10 Pause the pump and transfer the inlet tubing to buffer A Avoid bubbles Run the pump for 6minutes
11 Determine the amount of protein in each of your fractions by either direct absorbance orthrough use of the Bradford assay (see Expt 1)
12 Plot the protein concentration or absorbance as a function of fraction number Assess theseparation of the various proteins in the standard mixture
19
Week 2
This week you will work with your working group and you will have a lot to do so preparationwill be especially helpful You will prepare your chromatography system for your purificationmethod and prepare the system by filling the line with the correct initial buffer You will assemblethe column-flow adaptor assembly and attach it in line with the chromatography system You willprepare and apply your sample to the chromatography system running a sequence of buffers toisolate and purify (hopefully) AMP aminohydrolase from chicken muscle extract Finally you willassay and determine which fractions have the highest enzyme activity pool and dialyze them(overnight) to remove the pyrophosphate eluant from your purified enzyme sample
Materials providedExtraction buffer [54 mM K2HPO4 32 mM KH2PO4 018 M KCl (pH 65)]Column wash buffer [045 M KCl 25 mM MES (pH 65) 1 mM 2-mercaptoethanol pH
adjusted with solid Tris]Pyrophosphate elution buffer [25 mM potassium pyrophosphate in column wash buffer]Flow adaptorFraction collection test tubesSubstrate buffer [015 M KCl 50 mM MES (pH 65) pH adjusted with solid Tris]Assay solution [5 mM AMP in assay buffer]SpectrophotometerDialysis tubing or cassettesDialysis buckets stir bars and stir plates
SAMPLE PREPARATION - As this takes a while and should not be rushed you will want to startthis at the beginning of the lab
1 Completely thaw chicken protein extract of week 1 on ice
2 Check balance of centrifuge tubes to insure or adjust to equal weights using Harvard Tripbalance Centrifuge the homogenate at 6000 x g (check rotor specifications) for 15 min at 4degC
3 Remove supernatant to new tube on ice Measure the extract volume and retain 05 ml aliquotin a microcentrifuge tube for analysis of activity
COLUMN PREPARATION - While your extract is thawing prepare your column
1 Fill the column with excess cold extraction buffer and allow several tens of milliliters to flowthrough to settle the resin bed further (gravity only goes so far)
2 Make sure there is ample extraction buffer in the column tube (5 times resin bed) and allow anyresin to settle that might have been disturbed during column filling
3 Fit the flow adaptor to the column taking care to avoid and eliminate bubbles (See demo)
SYSTEM PREPARATION - While the extract is being prepared assemble the Pharmacia pumpand collector system for purification of AMP aminohydrolase
1 Completely fill tubing with buffer to be used ie extraction buffer and purge system of air
2 Make sure column-flow adaptor lines are filled with extraction buffer and free of air
20
3 Install the column-flow adaptor assembly in the system avoid bubbles upstream of the column
4 Run extraction buffer slowly through the system for several minutes to purge any airdownstream of column and to test for any problems
5 Prepare a separate beaker with column wash buffer
6 Prepare apparatus to create a two-buffer gradient of column wash buffer and pyrophosphateelution buffer
RUNNING THE SYSTEM - As a group review from week 1 the operation of thechromatography system and the volume of your column resin bed (arbitrarily defined as 1 columnvolume or CV) Determine a desirable flow rate Using the guidelines below discuss yourseparation strategy and prepare a plan for your separation Remember you have a single inlet lineso think about the different solutions you need to have on hand to achieve the outcome you desire(ie you will need to move the inlet line between different buffers) Check your plan with theinstructor or a teaching assistant before beginning
1 Prepare your plan to use the pump for five steps using your selected flow ratea - Load extract (in extraction buffer) into system measurerecord the extract volumeb - Extraction buffer wash should be 5 CVs minimumc - Column wash buffer wash should be 5 CVs minimum The A280 of your post-columnflow should be 001 or lower if you have washed your column sufficiently well If notyou may wish to extend your wash step before eluting the column d - Gradient (0-15 mM PPi) elution step using column wash buffer and elution buffer(column wash buffer containing 25 mM potassium pyrophosphate 2-4 CVs)e - Final wash with column wash buffer to complete protocol 5 CVs
2 Set inlet line into protein extract (on ice) and start (run) the pump and collector
Note on loading extract volume Because the pump system is not precisely calibrated youmust measure initial and final volumes to determine the exact volume delivered to the column resinWatch during your extract loading to insure that you do not run out of extract or have too much leftunloaded before the second step IF you have protein extract that remains unloaded measure thevolume remaining It will be important to subtract this amount from the initial volume youintended to load or you will overestimate the enzyme activity exposed to the column
If it appears you will run out of extract PAUSE the pump Switch the inlet line to thenext buffer and resume the separation If it appears you will have too much unloaded extractcontinue running the pump to load what you want but be sure to make a record of the amountloaded Once it is adequately loaded PAUSE the pump to switch the inlet line to the next buffer
3 Pause the pump and switch the inlet line to the other buffers or gradients at the appropriate timesas per your plan Run steps for the times planned given the pump flow rate you determined
Note on pausing to switch buffers Stop the pump to move the inlet line to a new buffervessel which will prevent the introduction of air to your column If necessary squeeze theflexible pump tubing to extrude air before placing the inlet tube opening into a new buffer
21
3 Operate the fraction collection using a strategy that will separate your enzyme from othersa - Extract flow-through Using large fractions is convenient for collecting all of yourextract flow-through (post-resin extract) but you will need to use smaller fractions toobtain a small but enriched sample of purified enzyme Thus you may wish to changefraction size during your collection If your extract flow-through exists as more than onefraction pool these to create your ldquoflow-throughrdquo fraction and for analysis As the extractwill take some time to get through the system and to the fraction collector you can delaythe start of your collection appropriately In addition it will take some time for the extractin the system line to pass entirely through the system once you begin the first wash step soyou should not stop collecting when the first wash begins Overall it would be better toget all your flow-through extract and have some extra extraction buffer dilute your flow-through than to recover only part of your flow-throughb - Wash flow-through Collect the protein eluted with high salt column wash buffer(optional) This will allow you to assess if any of the enzyme activity is washed off withthis buffer change You can also check absorbance to see if you have washed enoughc - Elution of column Collect several and smaller fractions during the elution to captureand fractionate all of your sample The less volume you use for the elution the smaller thevolume you want these fractions to be Remember there is a time lag between application ofyour gradient and when it reaches the resin but here it doesnrsquot hurt to collect a few extrafractions before and after the program time of the elution to insure that you recover all ofthe interesting fractions
Note on chilling fractions collected As soon as physically possible label and place on iceeach fraction tube collected from the program method This preserves enzyme activity One wayto doing this is to set an ice bath in the collector tube holder itself Alternatively you may placetubes into an ice bucket
4 Record the results from your separation attempt (not just the method plan)
SYSTEM AND COLUMN CLEAN UP -
1 When the program is finished remove the column from the system line and clean the system bypurging distilled water through the lines extensively for several minutes Excessive washing iscritical to avoid clogging the fraction collector dropper When the system is adequately washeddisassemble the pump head leaving the inlet lines in distilled water and turn the system off
2 The column-flow adaptor assembly can be disassembled and the resin mixed into a slurry anddecanted to a ldquowasterdquo beaker Both the column and flow adaptor should be rinsed extensively withdistilled water and placed aside to dry
POST-SEPARATION ACTIVITIES - You will need to do several things once completed
1 Pool extract ldquoflow-throughrdquo fractions mix and measure the total flow-through volumeAliquot a sample to a microcentrifuge tube on ice
2 Measure and record the volumes of the extract loaded on the column (Vinitial - Vremaining) and theflow-through obtained afterward if you have not already
3 Perform the enzyme assay on the aliquot of protein extract and pooled flow-through fractionsas well as each of the elution fractions (and the column wash buffer fraction(s) if this was done)and the mixture of pooled elution fractions as directed below
22
4 Freeze the remainder of the extract and flow-through aliquots for determination of proteinconcentration and electrophoresis next week See below for treatment of the elution fractions
ENZYME ASSAY OF COLUMN FRACTIONS - Please read APPENDIX II Spectroscopyand review the use of the Beerrsquos-Lambert law before doing the following AMP aminohydrolaseactivity is determined by recording the change in absorption at 265 or 290 nm due to the differencebetween the spectra of AMP and IMP both of which absorb UV light There is much moreabsorption at 265 nm than at 290 nm In fact at high concentrations of AMP the level of A265 istoo high for the spectrophotometer to detect a change upon addition of enzyme Therefore at high[AMP] (greater than 02 mM) measure the initial increase in A290 per minute and divide by afactor of 012 (the difference in extinction coefficients of AMP and IMP) At low [AMP] (lowerthan 02 mM) measure the initial decrease in A265 per minute and divide by a factor of 876
1 Transfer exactly 1 ml of assay solution (5 mM AMP is saturating substrate) to a quartz cuvetteand zero the absorbance at 290 nm (make sure the solution is at room temperature)
2 Add an aliquot of enzyme fraction (10-25 microl) rapidly mix and record the increase in A290 forseveral minutes (or until it becomes non-linear) Make sure you use the same volume of enzymefrom each elution fraction so that you can compare the amount of activity in each fraction
3Determine the initial linear rate (∆Amin) and convert to enzyme activity [unitsml sample =∆Amin(012 x ml sample)] where one unit = 1 micromolmin substrate hydrolyzed in 1 ml assaymixture Use the volume of enzyme fraction added in the denominator to determine its activity
DIALYSIS OF PURIFIED ENZYME SAMPLE - Please read the section on dialysis in AppendixIV Enzymology before starting this portion of the experiment
1 Pool the major enzyme-containing fractions from the phosphocellulose column and mix gentlyMeasure and record the volume
2 Assay the enzyme activity using an aliquot of the pooled fractions and record the result
3 Remove an aliquot of the pooled fractions to a microcentrifuge tube label and freeze Thissample will be included in the Bradford assays you will be doing next week and serves to helpyou assess if there is any protein loss during dialysis
4 Wearing gloves place a dialysis cassette into column wash buffer to soak 1 minuteIntroduce the pooled fractions into the cassette using a syringe alternate introducing some samplewith removing some air After all sample has been introduced remove all air from the cassette
5 Insert cassette into a floatation aid and dialyze overnight at 4degC (in the cold room) against thewash buffer to remove pyrophosphate This should be done with gentle mixing using a stir barand a stir plate
6 (THE NEXT DAY) Remove the dialyzed sample (dialysate) from the cassette using a syringealternate removing some sample with introducing some air To avoid bacterial contaminationhowever make your sample 002 sodium azide Store at 4degC the pure dialyzed enzymeshould be stable for several weeks at 4degC
23
Week 3
This week you will work with your working group You will assay the major fractions of thepurification for protein concentration and enzyme activity to help you assess the method You willalso analyze these same fractions by sodium dodecyl sulfate-polyacrylamide gel electrophoresis(SDS-PAGE) to assess relative complexity of the proteins in each sample and the relative purityand molecular weight of AMP aminohydrolase
Materials providedSubstrate buffer [015 M KCl 50 mM MES (pH 65) pH adjusted with solid Tris]Assay solution [5 mM AMP 015 M KCl 50 mM MES (pH 65) pH adjusted with solid
Tris]SpectrophotometersTris buffer [10 mM Tris-HCl (pH 70)]Bovine serum albumin (BSA) stock solution [2 mgml BSA in Tris buffer (pH 7)]Bradford reagent [001 (wv) Coomassie Brilliant Blue G-250 47 (wv) ethanol
85 (wv) phosphoric acid]Pre-poured SDS-polyacrylamide gel (75 acrylamide)10X reservoir buffer [1 SDS 05 M Trizma Base 19 M glycine] Dilute 110 for use5X Gel Loading Buffer (blue juice) [100 mM Trizma Base 325 SDS 50 glycerol17 mgml bromophenol blue] Add szlig-mercaptoethanol just before use to 25 (vv) finalconcentration Use the hood it stinks Dilute 5-fold for useGel Stain [04 mgml Coomassie Blue R250 40 (vv) methanol 5 (vv) acetic acid]Gel Destain [10 methanol 15 acetic acid]MicrocentrifugeProtein gel electrophoresis apparatus and power supply
DATA COLLECTION FOR PURIFICATION TABLE
1 Assay as before your pooled dialyzed enzyme fraction and all purification fractions not yetassayed (crude extract flow-through and pre-dialysis elution pool) for enzyme activity
2 Assay all purification fractions for protein concentration using the Bradford assay (25 mlBradford reagent + 50 microl protein sample - Expt 1) Remember to generate a standard curve
SDS-POLYACRYLAMIDE GEL ELECTROPHORESIS - Please read Appendix VI SDS-PAGE before starting this part Each lab group should obtain and use or plan to share one pre-poured minigel (75 resolving gel with no upper stacking gel) to analyze their proteins
1 Prepare molecular weight standards and your four protein samples (1-crude extract 2-flow-through from column 3-pooled dialyzed enzyme fraction 4 - protein mass standards)Determine the volume of protein sample necessary to load 5 microg of each onto the gel as well as thatfor ~3 microg of SDS-PAGE molecular weight standards For concentrated samples it may benecessary for you to make a dilution in order to accurately pipet the desired amount For eachsample aliquot the determined volume into its own microfuge tube Add to each sample a volumeof 5X Gel Loading Buffer equal to one fourth the volume of the sample aliquot Make sure freshszlig-mercaptoethanol has been added to the 5X buffer Heat samples for 5 min in a boiling waterbath Note heating samples with szlig-mercaptoethanol denatures and reduces all proteins
NOTE The final volume of each sample need not be the same but it is best if it is 10-30 microl Thegel wells hold gt30 microl and small samples (lt10 microl ) may evaporate upon heating Adjust as needed
24
CAUTION UNPOLYMERIZED ACRYLAMIDE IS A NEUROTOXIN ALWAYSWEAR PROTECTIVE GLOVES WHEN WORKING WITHACRYLAMIDE GELS
2 Put on a pair of disposable gloves Place gel plate into the electrode assembly and assembleUse a buffer dam if only one gel is being run Pour 1X reservoir buffer into upper buffer chamberformed by these two plate holders Make sure no buffer leaks out If it does reassemble theapparatus If the upper buffer chamber does not leak fill the lower chamber up to the electrode atthe bottom of the gel(s) Using the pipettor apply each sample and protein standards into aseparate well of the stacking gel Record in your notebook which sample is loaded into each laneIf possible avoid loading sample in the outer lanes of the gel Avoid trapping large bubbles alongthe bottom edge of the gel plates
3 Run the gel at 15 mA (constant current) per gel (30 mA per two gels) After the tracking dyehas reached the bottom of the gel turn the power off Remove the plates and gently pry the platesapart Place gel in stain for 1 hr (or overnight) Wash all parts of the gel apparatus thoroughlywith soap and water and rinse with dH2O
4 (THE NEXT DAY) Transfer gel to destain solution until bands appear and the background isrelatively clear Rinse gel briefly in dH2O (optional 3 glycerol prevents cracking)
5 Dry the gel between two sheets of cellophane (as demonstrated by the instructor)
6 Measure the distance migrated for the protein molecular weight standards and all bands ofinterest See Appendix VI for determination of apparent molecular weight of your purified enzyme
DATA ANALYSIS
For Expt 3 you are to write individually a formal lab report (page 8) This will be handed in firstas a draft and critiqued by me and reviewed by two of your peers Using the instructions onpages 5-6 prepare a formal type-written report Include all of the data obtained specifically afigure of your chromatographic separation a table of the values of enzyme activity in your elutionfractions a table of raw data and corresponding values of enzyme activity and proteinconcentrations of your purification fractions a figure or table or equation for your Bradfordstandards a purification table (see below) a figure of your gel and a figure of the plot for yourprotein molecular weight standards Include in the purification table (see Appendix IVEnzymology) the total volume total amount of protein total units of enzyme activity specificactivity purification factor and percent yield of enzyme in each of the purification fractions(1-crude extract 2-flow-through from column 3-pooled enzyme fraction before dialysis and4-pooled dialyzed enzyme fraction mdash indicate which fractions were pooled in fraction 4) Alltables and figures should have legends and each component of all figures should be clearly labeled
You may report your findings from this experiment as if you are the first group to report thepurification of AMP aminohydrolase from chicken muscle OR as if you have discovered animproved one-step purification for AMP aminohydrolase Also include answers to the questionsbelow in the discussion in your report
25
Questions
1 How pure is the enzyme after phosphocellulose chromatography Is this an effectivechromatographic step to purify this enzyme Identify your criteria
2 What is the molecular weight of a monomeric subunit of this enzyme according to SDS-PAGEWhat is its native molecular weight How many subunits must it have (see APPENDIX VI)
3 How stable is the enzyme Identify your criteria
4 How does its purity compare with commercially available enzymes (Hint consult the Sigma orCalBiochem catalogs) Could this be a potentially lucrative commercial method
5 What do you think accounts for the enzyme activity lost during purification
6 What else did you learn about this enzyme Be specific
Reference Mahn MM and Husic DH (1989) Biochemical Ed 17 94-96
Boosman A and Chilson OP (1976) J Biol Chem 251 1847-1852
26
EXPERIMENT 4 pH Dependence of Fumarase
Enzymes catalyze chemical reactions by changing the rate of a reaction but not its equilibrium Thecatalytic effect of an enzyme is sensitive to the environment in which the enzyme functions Thenative environment for many enzymes is the inside of cells where conditions are establishedmaintained and modulated by cellular mechanisms to control enzymatic activity However once abiochemist has purified an enzyme that is interesting to study (as you have just done in Expt 3)she or he will most often modulate environmental variables likely to affect the activity of theenzyme in vitro This is done for two reasons First sometimes the influence of a certainenvironmental variable on enzyme activity is interesting in and of itself Secondly routineparameters are modified to identify conditions for optimal enzymatic activity in the non-nativeenvironment of a test tube This is done so that a large window of enzymatic activity is available toreveal the profound AND subtle effects of other interesting influences upon enzyme activity
Since most biochemical reactions occur in the aqueous medium of the cell and since manyreactions involve proton transfers pH is a very important variable in an enzyme-catalyzed reactionIn fact biochemist often spend a great deal of time and effort thinking about and testing suitablebuffers to control the effect of pH as a variable in the enzymersquos environment We have both of thepreviously mentioned reasons for understanding pH as an environmental variable We areinterested in the effect pH has on enzymatic activity but we are also interested in learning the pH atwhich the enzyme has optimal activity so that we can use that pH in experiments 5 and 6
In this lab you will explore the effect of pH on the catalytic activity of the enzyme fumarase(fumarate hydratase) Fumarase catalyzes the hydration of fumarate to yield L-malate one ofthe steps in the citric acid cycle
The citric acid cycle is part of the process of cellular respiration which serves to enzymaticallyoxidize the two-carbon fragments resulting from the oxidative breakdown of glucose and fattyacids to CO2 The enzyme catalyzed conversion of fumarate to malate is reversible both reactionsare mediated by fumarase (we will see this in Expt 5) The reaction can be inhibited (we will testthis in Expt 5) The reaction is also stereospecific (we will see this in Expt 6) mdash the enzymedoes not recognize the cis-isomer of fumarate (maleate) or the enantiomer of L-malate (D-malate)
The reaction catalyzed by fumarase can be followed spectrophotometrically because fumarate witha carbon-carbon double bond absorbs strongly in the near-ultraviolet (UV) range malate does notabsorb in this range As fumarate is converted to malate (in the forward direction of this reaction)the absorbance by fumarate in the near-UV range decreases over time Using this assay the rate ofthis reaction is defined in the forward direction as the amount of fumarate used up per unit timeThe rate in the forward direction can also be defined as the amount of malate formed per unit timeTo explore the effect of pH on the activity of fumarase you will use a spectrophotometer tomeasure changes in near-UV absorbance over time to determine the rate of fumarase activity inbuffers at various pH values From these data you will learn something about pH as anenvironmental variable affecting enzyme activity and the optimal pH for fumarase activity
27
To better understand the effect of pH on the activity of fumarase you will need to know about themechanism of fumarase action Fortunately the mechanism of this reaction has already been wellcharacterized (see Weaver and Banaszak 1996) It is an example of general acid-base catalysis(Fig 1) In acid-base catalysis acidic and basic chemical groups from the termini or amino acidside chains of the enzyme donate or accept protons from reactants to make the reactants betterelectrophiles or nucleophiles respectively The fumarase-catalyzed reaction involves a carbanionsubstrate intermediate and acidic and basic groups are required for the generation of thisintermediate The reaction is therefore dependent upon the pH of the surrounding mediumbecause pH affects the ionization state (ie the protonationdeprotonation state) of acidic and basicgroups (remember the Henderson-Hasselbalch equation)
Fig 1 Proposed mechanism of the fumarase-catalyzed reaction at the enzymersquos active site
EXPERIMENTAL PROCEDURE
Materials providedNaH2PO4-H2O (solid) FW 13799Deionized waterpH meter 20 M and 02 M NaOH 20 M and 02 M HCl pH standard solutionsporcine fumarase (Sigma F1757) [~ 005 mgml fumarase in 1 mM phosphate (pH 7)]fumarate stock solution [6 mM fumarate in 1 mM phosphate (pH 7)]
In this experiment you are responsible for planning and preparing a series of phosphate solutionsof the same concentration but with various pH values using sodium phosphate salt and water asyour starting materials In making your solutions you will need sufficient volume to adjust the pHusing a pH meter but you should avoid making a huge excess It is best to bring solutions tovolume after adjusting the pH to help attain desired phosphate concentrations Thus it isadvantageous to carefully plan your solution making Once you have them made you will usethese solutions to spectrophotometrically assay the rate of the fumarase-catalyzed reaction as afunction of pH Appendix II Spectroscopy and Appendix III Buffers are recommendedreading for lab preparation (Note that phosphate does not buffer well at all pHrsquoes)
28
1 Prepare 18 mM sodium phosphate (NaH2PO4-H2O) buffers over a seven pH unit range Thinkand plan carefully about how best to make this series of buffers Feel free to check yourcalculations with the instructor before making the buffers You will need approximately 2 ml ofeach buffer in this experiment per group more if you make mistakes Consider coordinatingbuffer preparation with other groups (~2 buffersgroup) so that you do not make excess buffer
2 Using the provided 6 mM fumarate stock solution prepare by dilution at least 2 ml of a 1 mMfumarate solution using each of your phosphate solutions separately as diluent
3 Set the spectrophotometer to measure absorbance at 260 nm Zero the absorbance withphosphate solution using a quartz cuvette (4 mm x 10 mm) Remove the solution and carefullyadd 990 microl of fumarate solution to the cuvette The fumarate in this solution should show a strongabsorbance at 260 nm in the absence of enzyme To determine the reaction rate
a) remove the cuvette from its holder and add 10 microl of fumarase to the cuvetteb) quickly cover the cuvette with the white plastic lid and mix by inverting the cuvette twicec) replace the cuvette and record the absorbance over time until the slope levels
The mixing should be done carefully and as rapidly as possible Obtain two measurements ofabsorbance over time at each pH Record the slope for the initial linear range of the reaction
DATA ANALYSIS
After completing the laboratory you are to turn in an analysis of your data (a table with all of thedata (table of rates) and a plot of the pH dependence) plus brief answers to the questions below
Using the slope value for the initial linear range of a spectrum calculate the change in substrateconcentration over time (ie ∆[fumarate]min is the rate of the enzyme-catalyzed reaction) at eachpH using the Beerrsquos-Lambert law Use the extinction coefficient of fumarate at 260 nm (ε260 =900 M-1cm-1) and report your final answers in micromol fumaratemin (convert from ∆Amin) If youare unsure how to do this calculation consult Appendix II Spectroscopy Plot the log of therate of the reaction versus pH (pH is a log scale) Determine the optimal pH range for the enzyme
1 What is the pH optimum for fumarase What would be a good buffer for the fumarasecatalyzed reaction (see Appendix III) Explain
2 Biochemists often mix mono- and di-sodium phosphate solutions to prepare phosphate bufferswith a specific pH What disadvantage does that approach have over the one you used for thisexperiment
3 What are possible explanations for the pH dependence of fumarase based upon the enzymescatalytic mechanism (see reference) Which amino acids may contribute acidic or basic groups tothis reaction
4 Is it possible for an acidic or basic amino acid side chain to function in an enzyme-catalyzedreaction at pH 7 if the side chain pKa is far from 7 How would the native environment of theactive site of the enzyme affect the pKa of the acidic and basic groups involved in the reaction(Consider the tendency of these groups to be protonated or deprotonated)
5 Would you expect the pH optimum to be the same for the reverse reaction Why or why not
Reference Weaver amp Banaszak (1996) Biochemistry 35 13955-13965
29
EXPERIMENT 5 Kinetic Analysis of Fumarase
From what you learned from Experiment 4 you can now analyze the effects of otherenvironmental variables upon the catalytic activity of the citric acid cycle enzyme fumarase whilekeeping constant the pH that promotes optimal enzyme activity One way a biochemist can analyzethe catalytic activity of an enzyme is through study of its reaction rates or kinetics The goal ofthis experiment is to analyze the reaction rates of fumarase in the forward and reverse direction as afunction of changes in substrate concentration and as inhibited by citrate Substrate and inhibitorconcentrations are common variables of an enzymersquos environment that influence its activity
The simplest model for enzyme kinetics states that the formation of an enzyme-substrate (ES)complex is a necessary intermediate in catalysis as proposed by Michaelis and Menten When youthink about it if the formation of an ES complex is a necessary intermediate in catalysis then thereaction rate (Vo) will depend on the formation of the ES complex As formation of the EScomplex will depend on the amount of substrate available the enzyme activity (Vo) will vary withsubstrate concentration ([S]) For enzymes that fit the Michaelis-Menten model (includingfumarase) this is described by the Michaelis-Menten equation
V o = V max[ S ]
K M + [ S ]
At a fixed enzyme concentration and low substrate concentrations the rate of an enzyme catalyzedreaction increases linearly with increases in substrate concentration However when the activesites of an enzyme become saturated at high substrate concentrations the reaction rate isindependent of substrate concentration the maximal velocity (Vmax) is reached The Michaelis-Menten constant (KM) reflects the rates for formation and dissociation of the ES complex andformation of product and is equal to the substrate concentration at half the value of Vmax
Remember that the fumarase-catalyzed interconversion of malate and fumarate can be followed bymeasuring the increase or decrease of near-UV absorption by the conjugated double bond offumarate over time Lacking a similar bond malate does not absorb light in this range By usingthis property of fumarate the fumarase-catalyzed reaction can be analyzed kinetically in both theforward and reverse direction
As you will be changing the fumarate concentration in the reaction for part of this analysis there isthe potential to achieve a corresponding increase in absorbance It will be important to insure thatyou do not exceed the absorption range that can be accurately measured by the spectrophotometerTo accomplish this you will make some of your measurements at wavelengths other than 260 nmMeasurements made at higher concentrations than 1 mM can be done using longer wavelengthswhich have lower molar absorptivities and visa versa You will need to adjust your calculationsfor each wavelength by using the corresponding molar absorptivity of fumarate listed below
Wavelength (nm) ε (M-1cm-1) Wavelength (nm) ε (M-1cm-1)220 9300 260 900230 4520 270 535240 2440 280 278250 1450 290 118
A plot of 1Vo verses 1[S] (Lineweaver-Burke plot) allows you to determine the kinetic parametersVmax and KM See Chapter 8 in the Lehninger text for a refresher on kinetic analysis
30
EXPERIMENTAL PROCEDURE
Materials providedassay buffer [15 mM sodium phosphate (pH - determined in Expt 4)]malate stock solution [24 mM L-malate in phosphate buffer (pH 70)]fumarate stock solution [6 mM in phosphate buffer (pH 70)]citrate stock solution [100 mM in phosphate buffer (pH 70)]porcine fumarase [~005 mgml in phosphate buffer (pH 70)]
1 Dilutions You must make a series of dilutions of malate (to 8 4 2 1 05 and 025 mM inphosphate buffer) and fumarate (4 2 1 05 025 and 0125 mM in phosphate buffer) in theabsence and presence of 8 mM citrate You will need about 1 ml of each dilution per assay If youneed to repeat the assay with one of the solutions you will need to make more You may checkcalculations with the instructor before beginning You need not complete all dilutions beforebeginning step 2
2 Malate Review details of assay protocol in Expt 4 Set the spectrophotometer to 240 nmwavelength Carefully pipet 990 microl of diluted malate solution into a quartz cuvette Place thecuvette in the spectrophotometer and zero the absorbance at 240 nm Add 10 microL of fumarase mixby inversion place the cuvette in spectrophotometer and record the absorbance at 240 nm forseveral minutes Find the slope of the initial linear portion of the time scan Repeat for all of thediluted solutions of malate Calculate the rate in micromolmin (vol = 1 mL) using ∆Asec and theproper extinction coefficient (see above)
3 Fumarate Set the spectrophotometer at one of the following wavelengths depending on theconcentration of fumarate
280nm4 mM 250 nm05 mM270 nm2 mM 240 nm025 mM260 nm1 mM 230 nm0125 mM
Zero the spectrophotometer at the appropriate wavelength with buffer in the quartz cuvetteRemove the buffer carefully pipet 990 microl of diluted fumarate solution into the cuvette and place itin the spectrophotometer (the absorbance should be about 06-1) Add 10 microL of fumarase mix asbefore place the cuvette in the spectrophotometer and record the absorbance for several minutesFind the slope of the initial linear portion of the time scan and calculate the rate in micromolmin (vol =1 ml) using ∆Asec and the appropriate extinction coefficient (see above)
Note because you are using different wavelengths for each of these measurements thechange in rate as a function of fumarate concentration will not be reflected by the slopesyou measure This is because with each change of wavelength there is a change in thecorresponding molar absorptivity You will see the changes in rate after your calculationsare complete
4 Citrate Repeat steps 2 and 3 with substrate reaction mixtures containing 8 mM citrate inaddition to varying concentrations of malate or fumarate In each case calculate the rate of theenzyme-catalyzed reaction in micromolmin using the appropriate extinction coefficients
31
DATA ANALYSIS
Determination of KM and Vmax Using the activity of the enzyme (rate = micromolmin) atvarious substrate concentrations (in mM) (without inhibitor) determine the kinetic parameters ofthe forward and reverse reactions catalyzed by fumarase A plot of 1Vo verses 1[S] (Lineweaver-Burke plot) allows you to determine the kinetic parameters Vmax and KM from the line equation forthe linear regression analysis of the data points Be sure to use the correct units for both Vo and[S] or you will not obtain meaningful values for these parameters Calculate the turnover numberfrom the concentration of enzyme and the molecular weight of fumarase (MW = 194 kDa) Forthis calculation you will need to have the enzyme rate reflected in Mmin which can be convertedfrom micromolmin using the reaction volume (vol = 1 mL) You can also calculate the equilibriumconstant for this reaction using the kinetic parameters obtained and the Haldane relationship
K eq =Vmax
( fum)
K M( mal)
Vmax( mal)
K M( fum)
Determination of KMrsquo and Vmaxrsquo Repeat the same type analysis as above with the dataobtained in the presence of inhibitor The corresponding kinetic parameters obtained in thepresence of inhibitor are indicated as KMrsquo and Vmaxrsquo Using the kinetic parameter that is mostaffected by the presence of inhibitor determine the type of inhibition (competitive ornoncompetitive) exhibited by citrate Using this altered kinetic parameter and one of the equationsbelow calculate the inhibitor constant (Ki)
V max
= V
max
( 1 + [ I ] K
i
)
OR K N
M = K
M ( 1 + [ I ]
K i
)
for citrate in the forward and reverse reactions
For Expt 5 you are to turn in at the end of the laboratory an analysis of your data (graphs of 1Voverses 1[S] and a table of kinetic parameters KM Vmax KMrsquo Vmaxrsquo and Ki) plus brief answersto the questions below
1 How do the kinetic parameters you obtained for porcine fumarase compare to those reported inthe literature (Alberty et al 1954 Table V on reserve)
2 Which substrate is preferred by the enzyme How do you know
3 What type of inhibitor is citrate in the fumarase-catalyzed reaction How do you knowSuggest a mechanism of inhibition by citrate
4 Is citrate an equally effective inhibitor in the forward and reverse reactions How do youknow
Reference Alberty et al (1954) J Amer Chem Soc 76 2485-2493
32
EXPERIMENT 6 Stereochemistry of the Fumarase Reaction mdash an NMR Study
As foreshadowed in Experiment 4 the reaction catalyzed by fumarase is stereospecific Inaqueous solutions it is not possible to determine the stereochemistry of the addition of H2O acrossthe double bond of fumarate since there is no way to determine which of the two hydrogen atomswas added to carbon-3 of malate from waterHowever the use of deuterium oxide (D2O) asthe solvent makes it possible to follow thestereochemistry For example if the reactioninvolves an anti (or trans) addition of water(2S3R)-3-deutereomalate is produced (right)
Alternatively if the reaction involves an syn(or cis) addition of water (2S3S)-3-deutereomalate is produced (figure left) Eitherway two new chiral centers are produced bythe stereospecific addition of D2O to fumarate
The stereochemistry of the fumarase reaction can be demonstrated by NMR spectroscopy TheNMR spectrum of fumarate is quite simple It consists of a singlet at δ65 from the two equivalenthydrogens in addition to an HOD peak at aboutδ47 (due to HOD in the solvent) Thespectrum of L(S)-malate is more complex butstill easily interpreted
Malate contains three different protons (HAHB and HX) Note that protons A and B arenot equivalent This is a general result forprotons adjacent to an asymmetric centerThese two protons are diastereotopic in thatthe independent substitution of either of theseprotons by any other group creates a diastereomer (a stereoisomer that is not a mirror image)Since these two protons have different magnetic environments they have different chemical shiftsand couple with one another (geminal coupling since both protons are bonded to the samecarbon) Coupling between HA or HB and HX is called vicinal coupling since the two protons areattached to adjacent carbons Thus each proton is split by each of the other two protons makingthe resonances for each a doublet of doublets For example HA is split by HB and the lines thatresult are each split by HX
When the fumarase enzyme is added to a solution of L-malate in D2O the fumarate peak at δ65grows while the malate peaks decrease in intensity The malate spectrum also begins to simplify(although is may not look simpler at first) due to new malate being formed as equilibration of thereaction proceeds Proton NMR does not see deuterium so one set of malate peaks disappearsas a proton is replaced by deuterium Deuterium does not couple with protons so for each of theremaining doublet-of-doublets only one of the couplings will remain
33
By knowing the expected sizes of coupling constants for vicinal protons at various dihedral angles(described by the Karplus curve) one can determine which of the protons(HA or HB) was replaced by deuterium This in turn allows determinationof whether the D2O addition is syn or anti
The dihedral angle is the anglebetween Hx and Ha or Hb whenlooking down the bond between thetwo central carbon atoms of malateEXPERIMENTAL PROCEDURE
Materials providedmalate solution [200 mM L-malate in 100 mM phosphate buffered D2O (pH 73)]fumarate solution [200 mM fumarate in 100 mM phosphate buffered D2O (pH 73)]porcine fumarase [10 mgml in 100 mM phosphate buffered D2O (pH 73)]
Please read Appendix V NMR before starting this experiment
1 Place 08 ml of L-malate and 08 ml of fumarate in separate clean dry NMR tubes Record theNMR spectrum of each
2 Place 08 ml of L-malate and 08 ml of fumarate in microfuge tubes Add 5 microl of fumarase toeach tube and mix gently Thirty minutes after addition of enzyme transfer each volume toseparate clean dry NMR tubes and record a spectrum of each
DATA ANALYSIS
For Expt 6 you are to turn in at the end of the laboratory an analysis of your data (a table ofcoupling constants (J) and all NMR spectra with labeled peaks including chemical shift positions(δ)) plus brief answers to the questions below
Assign each peak in the NMR spectra of L-malate and fumarate to protons in each moleculeCalculate the vicinal spin-spin coupling constants JAX and JBX and the geminal constant JABIdentify and interpret the changes in the NMR spectra brought about by the enzyme-catalyzedreaction Assign all the peaks in the final spectra (after enzyme addition)
1 What accounts for the difference in value of JAX and JBX in the spectrum of L-malate aloneRefer to the Karplus curve (see Appendix V NMR) in your answer
2 What changes in the NMR spectra after enzyme addition would you expect if the reaction wassyn anti or non-stereospecific
3 What is the stereochemistry of D2O addition to fumarate References Kasparek amp Pratt (1977) JChemEd 54 515
Nigh (1976) J Chem Ed 53 668
Silverstein et al (1974) in Spectrometric Identification of Organic Compounds (3rd
edition Wiley) pp 181-182 186-187 189-191
Teipel et al (1968) J Biol Chem 243 5684
34
35
APPENDIX I Concentration and Dilution
The most common expressions of concentration in biochemistry are molarity and percent-of-solute Molarity is defined as the number of moles of solute per liter of solution (denoted M) Molarityusually describes solutions of accurate concentration where the molecular weight of the solute isknown Solutes are weighed on an analytical balance and volumes are measured in volumetricflasks In biochemistry most concentrations are in the millimolar (mM) micromolar (microM) ornanomolar (nM) range
Percent-of-solute is frequently used for liquids and solids of undetermined molecular weightThree designations are used volume per volume (vv) weight per volume (wv) and weight perweight (ww) A 5 (vv) solution contains 5 ml solute in 100 ml total solution A 5 (wv)solution contains 5 g solute per 100 ml total solution A 5 (ww) solution contains 5 g solute per100 g total solution Of these three designations weight per volume expressions are used mostcommonly in biochemistry Sometimes these concentrations are not expressed as percentages butrather simply as the number of mg (or microg) per ml solution
Biochemical experiments frequently require the dilution of a particular sample or stock (standard)solution If the concentration of stock solution and that needed in the experiment are known thedilution factor can be calculated For example if you want to dilute a 1 M stock solution to 5 mMin your experiment the dilution factor is 00051 or 1200 (also indicated as a 1200 dilution)This means you must dilute 1 part stock solution with 199 parts solvent Another way of statingthis is that 1 part stock solution must be diluted into 200 parts total solution This is commonlydescribed by biochemists as a one in 200 (or two hundred-fold) dilution However this would bea mixture with a ratio of one (part) to 199 (parts) Generally if you want 200 ml of the dilutedsolution you would mix 1 ml stock solution with 199 ml solvent However this neglects anyvolume change that may be inherent to formation of the new mixture A more rigorous approachwould be to add 1 ml stock solution to a volume of solvent less than the total desired and thenbring the solution to the final desired volume with additional solvent
You can determine the molarity of a diluted solution (Mfinal) or calculate what volume of stocksolution (Vinitial) must be added to solvent to make the diluted solution by using the formula
MinitialVinitial = MfinalVfinal
For example if you have a stock solution of 10 M NaCl and you want to make 250 ml of a 05 M NaCl solution you need to add 125 ml of the stock solution to a 250 ml volumetric flaskand fill it with solvent to 250 ml
Minitial = 10 M Vinitial = Mfinal = 05 M Vfinal = 250 ml
(10 M)Vinitial = (05 M)(250 ml) --------gt Vinitial = 125 ml
In other words 125 ml of the stock solution is diluted to 250 ml with solvent Note that thenumber of moles of solute (in this case NaCl) is the same in the volumes of the initial and finalsolutions Note also that this equation can be written CinitialVinitial = CfinalVfinal where Crepresents concentration in units other than molar (eg mgml)
36
A special type of dilution is the serial dilution In this method a stock solution is dilutedsystematically in fixed steps of the same dilution factor (see Fig 1) A high degree of accuracyand precision is required because errors made in an early dilution are carried to all subsequentdilutions Serial dilutions are used frequently in immunological and microbiological experiments
Fig 1 A serial dilution scheme
37
APPENDIX II Spectroscopy
1 Absorption Spectroscopy
If white light is passed through a colored solution certain wavelengths of light are selectivelyabsorbed and the resulting color observed is due to the wavelengths of the transmitted lightUVVis absorption spectroscopy is useful if the sample absorbs light in the 200-350 nm range(ultraviolet UV) or in the 350-750 nm range (visible) The figure below (Fig 1) shows theabsorption spectrum of riboflavin Riboflavin appears yellow to the eye Maximal absorption oflight occurs at several wavelengths in the ultraviolet region (below about 370 nm) and at 450 nmin the visible region Since the absorption in the visible region is at the blue end the transmittedlight is that of the other end of the spectrum (yellow)
Fig 1 Absorption spectrum of Riboflavin
The quantitative measurement of the amount of light absorbed is based on two laws Lambertrsquoslaw states that the proportion of light absorbed is independent of its intensity and each successiveportion of the medium absorbs an equal fraction of the light passing through it This is expressedmathematically as
log (IIo)=Kl
where Io and I are the intensities of the incident and transmitted light respectively K is a constantand l is the path length in cm Log (IIo) is the absorbance (A) This law is always true Thesecond law applied here Beerrsquos law has some exceptions usually because of a change in the stateof the solute upon absorbing light This could involve changes in ionization or aggregationBeerrsquos law relates concentration to the factor K K=εc where ε is the extinction coefficient of theabsorbing solute (units are reciprocal concentration times reciprocal length) and c is itsconcentration Combining these two laws gives the Beerrsquos-Lambert law
A=εcl
Absorption is dimensionless If c has units of M ε has units of M-1 cm-1 if c has units of mgml
ε has units of ml mg-1 cm-1 The extinction coefficient reflects the relative tendency of a solute toabsorb light of a certain frequency and is specific only for a specific solute solvent andwavelength of light
UVVis absorption spectroscopy can be used to quantitatively measure enzyme activity if asubstrate or product of the enzyme-catalyzed reaction absorbs light This type of assay follows theactivity of the enzyme indirectly by monitoring the change in substrate or product directly A goodexample of this is the redox coenzyme NAD+NADH which changes its absorption propertiesupon oxidation and reduction (Fig 2) The different absorption of light by NAD+ and NADH canbe utilized to follow the activity of an enzyme involved in their interconversion
38
An analysis of the spectra of both (Fig 2) suggests that their absorptions differ most at ~340 nmwavelength light This wavelength therefore provides the largest ldquowindowrdquo to study theirinterconversion By following the change in absorption at 340 nm over time as a function ofenzyme activity one can extract quantitative rate data using the Beerrsquos-Lambert law and theextinction coefficient for NADH
Fig 2 Absorption spectra of NAD+ and NADH
39
APPENDIX III Buffers
Most cellular reactions and processes take place in an aqueous environment at neutral pHTherefore most biochemical experiments are also carried out in aqueous media under controlledpH conditions This requires the use of buffers solutions that resist changes in pH due to thepresence of a chemical species that can ldquoneutralizerdquo added acid or base In general buffers aresolutions of a weak acid and its conjugate base or a weak base and its conjugate acid When acid isadded to the buffer some A- is converted to HA addition of a base results in some HA convertingto the A- form Thus the solution can ldquoabsorbrdquo added acidic and basic species
A buffer is effective for use in a particular biochemical experiment based upon its 1) pKa value andchemical properties and 2) concentration The pKa indicates if a buffer can function well over thean appropriate pH range for the experiment The concentration indicates the capacity for which abuffer can function The Henderson-Hasselbalch equation [pH = pKa + log ([A-][HA])]gives the relationship between the pH of a solution the pKa of an acid in solution and the ratio ofthe concentrations of acid [HA] and conjugate base [A-] forms in solution
Buffering range When the concentrations of A- and HA are equal the pH of the solution equals the pKa of thebuffer Buffers are most effective in the range pH = pKa plusmn 1 Outside of this range theconcentration of acid or conjugate base is too small to ldquoneutralizerdquo acid or base added to thesolution Thus once the desired pH range has been determined for an experiment a buffer can beselected based upon its pKa value The pKa values for certain useful buffers is shown below
Buffer pKa (20degC) StructurePhosphoric acid 21 H3PO4Sodium dihydrogen phosphate 72 NaH2PO4Disodium hydrogen phosphate 123 Na2HPO4Citric acid 31 HOOCCH2COH(COOH)CH2COOHSodium dihydrogen citrate 47 HOOCCH2COH(COONa)CH2COOHDisodium hydrogen citrate 54 HOOCCH2COH(COONa)CH2COONaGlycylglycine 84 H3N+CH2CONHCH2COO-
Tris [tris(hydroxymethyl)- 83a (HOCH2)3CNH2 aminomethane]MOPS [3-(N-morpholino) 72 propanesulfonic acid]MES [2-(N-morpholino) 62 ethanesulfonic acid]HEPES [N-2-hydroxyethyl- 76 piperazine-Nrsquo-2-ethane- sulfonic acid]
aThe pH of a Tris buffer varies significantly with temperature (∆pKa = -031degC)
Table 1 Properties of some common biological buffers
40
Buffering capacityThe concentration of buffer used is also important in order to provide adequate buffering capacityBuffering capacity depends upon the concentration of the buffering components and is defined asthe number of equivalents (n) of either H+ or OH- required to change the pH of a given volume ofbuffer by one pH unit
Buffer capacity = dnd(pH)
Most biological buffers are made in the concentration range of 001-05 M this concentration isreferred to as the buffer strength and reflects the total concentration of acid and conjugate baseforms of the buffer Buffer solutions can be prepared by calculating the amount of acid andconjugate base forms of the buffer needed to obtain the desired pH using the Henderson-Hasselbalch equation Another method is to weigh out the desired amount of one form of thebuffer (HA or A-) and adjust the pH using a pH meter and solutions of NaOH HCl or Tris
The chemical properties of a buffer (eg solubility stability light absorption ionic interactions)must be well-characterized before use in a biochemical experiment A series of biologically usefulbuffers for use in the pH 7-9 range (MOPS HEPES MES PIPES etc) have been characterizedby Good et al (1966) Note that these buffers are not physiological (ie not found in the body)
Reference Good et al (1966) Biochemistry 5 467
41
APPENDIX IV Enzymology
Enzyme assay The activity of an enzyme can be determined by measuring the rate of utilizationof substrate over time or the rate of formation of product over time Enzyme activity is reported as∆[substrate]∆time or ∆[product]∆time (also denoted units of enzyme activity) The unit definitionfor enzymes varies but is often expressed as micromoles substrate used or product formed per min inthe assay mixture at a specified temperature and pH
One unit of enzyme activity = One micromol S (or P)min
Enzyme assays are carried out under buffered conditions at a fixed pH temperature andconcentration of necessary ions and in the presence of excess substrate (usually at least [S] = 10 xKm) Appropriate negative controls should be done in the absence of enzyme andor substrateChanges in the measured parameter in the absence of enzyme indicates the extent of non-enzymaticreaction in the assay mixture Changes in the measured parameter in the absence of substrateindicates the extent of background enzymatic reaction in the enzyme preparation Enzyme activitycan be measured by a continuous (kinetic) method or a discontinuous (fixed-time) method acontinuous assay is preferred
In purifying an enzyme one must determine the amount of enzyme present at each step of thepurification To do this enzyme activity in various purification fractions is measured underconditions of fixed substrate concentration pH temperature and added ions coenzymes etcThe Michaelis-Menten equation (shown below) relates the initial velocity Vo to the total amount
V o
= k
cat[ E
tot] [ S ]
K M
+ [ S ]
of enzyme ET at a fixed substrate concentrationSince the initial velocity is directly proportional to the total amount of enzyme careful measurementof the initial velocity under these fixed conditions gives a measure of the amount of enzyme
A major problem in developing an enzyme assay is establishing conditions that allow accuratemeasurement of the initial velocity This problem is minimized if high [S] is used so that [S]doesnrsquot change appreciably during the assay The amount of enzyme used in an assay is alsoimportant Too little enzyme gives a velocity too low for accurate measurement while too muchenzyme gives a velocity too high and not linear long enough to determine an accurate initial rateThe process by which the optimal amount of enzyme to be used in an assay is determined is calledrange-finding A plot of initial velocity vs amount of enzyme added should have a linear portionthat defines the valid range of [E] for this assay
Enzyme purity When purifying an enzyme one needs to determine the yield and degree ofpurity of the enzyme as the purification progresses Yield is measured by comparing the totalenzyme activity (units) in various enzyme fractions Purity is measured by comparing the specificactivity (unitsmg protein) in various fractions The higher the specific activity the more pure theenzyme Purity is usually expressed as a purification factor (or fold-purity) which is the increasein specific activity The effectiveness of a purification scheme is shown in a purification table(Table 1) which lists the total and specific activities for the various fractions generated during thepurification
42
Total Act Specific ActEnzyme fraction (Units) (Unitsmg) Yield PurityCrude cell extract 1030 12 100 ---Ion exchange column 807 135 78 11-foldAffinity column 498 244 48 203-fold
Table 1 Sample purification table
Dialysis Dialysis is a technique commonly used in biochemistry to separate a mixture ofdissolved solutes by filtration (Fig 1) Amixture is placed within a sealed dialysismembrane and then submerged in buffer andsmall solute molecules that are not highlycharged pass freely across the membrane untila concentration equilibrium on both sides of themembrane is achieved
The driving force for solute movement is theinitial concentration gradient across the dialysismembrane Dialysis is often used to removesalts or other small solutes from a proteinsample during the course of a purification Theconcentrations of solutes within the dialysismembrane change because water passes freelyacross the membrane in the direction of higherinitial solute concentration (the osmotic effect) Fig 1 Dialysis of a mixture of solutes
The dilution factor of the small solutes can becalculated by dividing the initial volume ofsample by the amount of buffer that the sampleis dialyzed against Equilibration usually takesseveral hours so samples are often left todialyze overnight at 4degC Large dilutions can beobtained in shorter times by changing the bufferat least once during the dialysis In this casethe dilution factors due to each volume of bufferused are multiplied by each other to give thefinal dilution For efficient dialysis the buffer inthe outer reservoir should be stirred Fig 2shows the dilution of NaCl over time due todialysis
Fig 2 Dilution of NaCl by dialysis
43
APPENDIX V Nuclear Magnetic Resonance
Nuclear magnetic resonance (NMR) is a very useful technique to study the structure of many typesof biomolecules NMR is useful when biomolecules contain inherently magnetic nuclei (1H 2H13C 14N 19F 31P) 1H and 13C NMR are used most frequently
NMR is based on the behavior of (+)-charged spinning nuclei in an externally applied magneticfield (H0) In the absence of H0 the axes about which the nuclei spin are oriented randomly insolution When H0 is applied the nuclei align parallel or antiparallel to the external field Theparallel orientation is slightly lower in energy and thus slightly favored Irradiation of alignednuclei with radiation of a certain frequency causes nuclei to absorb energy and spin-flip to a higherenergy state (and in doing so be in resonance with the applied radiation)
All nuclei in molecules are shielded somewhat from H0 by surrounding electrons which set uptiny local magnetic fields So the effective magnetic field (Heff) experienced by each nuclei islessened by these local magnetic fields (Hlocal)
Heff = H0 - Hlocal
Most nuclei in a molecule are in a slightly different electronic environment so Heff differs for each
NMR spectra show the intensity of absorption vs chemical shift (an indication of Heff) Eachnonequivalent nucleus will have its own characteristic peak on the spectrum Two protons bondedto the same carbon are not necessarily equivalent In the case of L-malate (Fig 1) protons A andB are diastereotopic because the substitution of either by any other chemical group createsdiastereomers (stereoisomers that are not mirror images) due to the presence of another stereogeniccenter in the molecule Thus HA and HB have their own characteristic peaks on an NMR spectrum
Fig 1 Structure of L-malate
NMR spectra are calibrated by using a reference sample usually tetramethylsilane TMS[(CH3)4Si] The chemical shift of TMS is set at zero samples absorb downfield (to the left of the
standard on the chart) The unit of chemical shift is the delta unit δ
1 δ = 1 ppm of the operating frequency of the NMR spectrometer
Gustavus College has a 300 MHz machine so 1 δ = 300 Hz Most 1H NMR absorptions occur 0-
10 δ downfield of the reference peak For example an allylic proton (=C-C-H) absorbs at δ =
15-25 and a vinylic proton (C=C-H) absorbs at δ=45-65
44
The nuclear spins of adjacent atoms can influence each other causing spin-spin coupling orsplitting In 1H NMR splitting occurs between protons coupled via covalent bonds and usuallyno more than two carbons apart A general rule when studying spectra is that the peaks of protonswith n equivalent neighboring protons split into a multiplet of n+1 peaks The distance betweenpeaks in a multiplet is the coupling constant J In general two groups of protons coupled to eachother have the same value of J Stronger coupling is indicated by greater spacing of the splitpeaks No splitting is observed if adjacent protons are chemically equivalent
For vicinal protons (those on adjacent carbons) the value of J is related to the dihedral angle φthis relationship is shown in the Karplus curve (Fig 2) The coupling of trans protons is greaterthan that between cis protons In this case NMR is useful to distinguish between cis-transisomers Dihedral angles of 60deg and 180deg yield J values of 2-4 and 8-10 respectively
Fig 2 Karplus curve Line theoretical curve shaded area range of empirical results
45
APPENDIX VI SDS-Polyacrylamide Gel Electrophoresis (SDS-PAGE)
Gel electrophoresis is an effective method for separating proteins on the basis of size SDS-PAGEis a electrophoretic technique that uses a gel made of polymerized acrylamide AcrylamideCH2=CH-C(=O)-NH2 forms a linear polymer polyacrylamide that can be cross-linked withNNrsquo-methylene bisacrylamide CH2=CH-C(=O)-NH-CH2-NH-C(=O)-CH=CH2 to form a resinof controlled but varying pore size Cross-linked polyacrylamide is shown in Fig 1
Fig 1 Structure of cross-linked polyacrylamide
Polymerization is catalyzed by free radicals generated by agents such as ammonium persulfate inthe presence of NNNrsquoNrsquo-tetramethylethylenediamine (TEMED) Polymerization is inhibited byoxygen so gel solutions should be degassed If the pore size of the gel approximately matches thesize of the molecules to be separated smaller molecules can move freely in an applied electric fieldwhereas larger molecules have restricted movement
SDS-PAGE most often makes use of vertical slab gels although gels can also be formed incylinders A discontinuous gel system is also used frequently consisting of a stacking gel and aseparating gel The stacking gel makes up only approx 10 of the volume of the total gel and isof a lower percentage acrylamide (usually 25-45) and a lower pH (68) In the stacking gelcharged molecules move freely in an applied electric field and proteins in a sample shouldaccumulate in stacks of closely spaced bands In the separating gel containing a higher percentageacrylamide (usually 7-15) and at a higher pH (88) proteins separate into discrete bands basedon molecular size See Fig 2 for sieving properties of different percentage gels
Percentage acrylamide in separating gel Size of molecules sieved effectively25 105-106 daltons70 104-105 daltons30 102-103 daltons
Fig 2 Molecular sieving properties of gels of varying polyacrylamide percentages
46
Separation is not on the basis of shape or charge because proteins are treated with sodium dodecylsulfate (SDS) a detergent with both polar and nonpolar properties The long hydrocarbon chain ofSDS is buried in nonpolar regions of proteins and the (-)-charged sulfate is exposed on the surfaceof proteins SDS coats proteins with an approximately uniform charge-to-mass ratio of (-) charge(saturation occurs at approx 14 g SDSg protein) In addition proteins are approx uniformlyshaped into spheres when coated with SDS because the detergent disrupts native ionic andhydrophobic interactions Thus proteins separated by SDS-PAGE are denatured Disulfides inproteins are broken by addition to the gel sample buffer of szlig-mercaptoethanol or 14-dithiothreitolboth of which reduce disulfide bonds
The molecular weights of proteins in a sample can be estimated on a gel by measuring the mobilityof protein standards of known molecular weight on the same gel A calibration curve (Fig 3) canbe generated from the mobilities of the standards by plotting the distances migrated from the top ofthe resolving gel versus the log of molecular weight A linear regression can be calculated andused to estimate unknown molecular weights The estimation of molecular weight by this methodis accurate to approximately 5-10 of the actual value
Fig 3 Calibration curve for molecular weight estimation
Reference UK Laemmli (1970) Cleavage of structural proteins during the assembly of thehead of bacteriophage T4 Nature 227 p 680
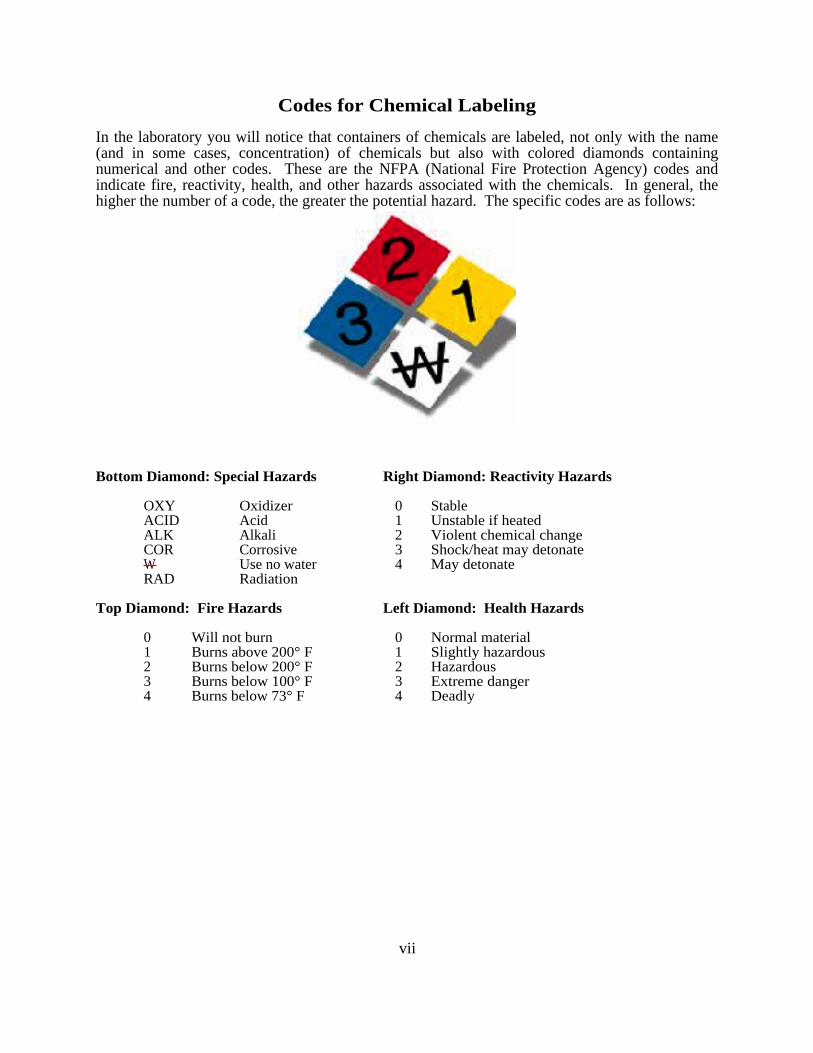
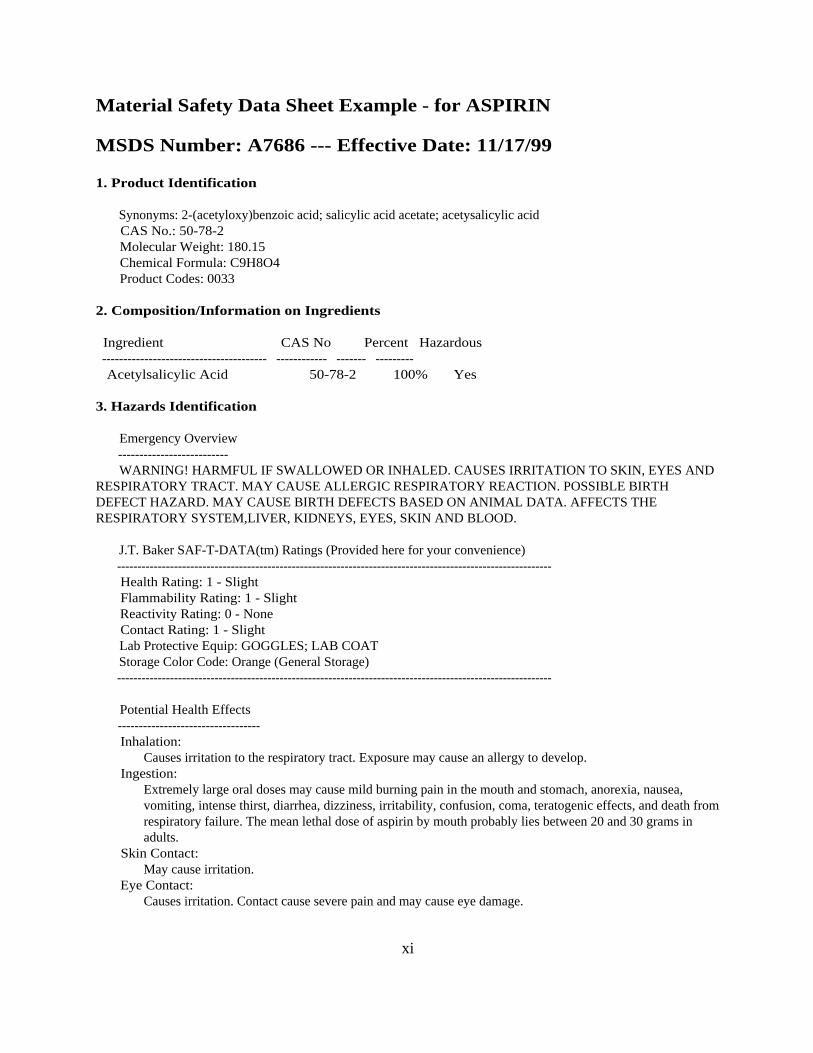