cheminformatics and high-throughput screening to...
TRANSCRIPT

Cheminformatics and High-throughputScreening to Improve Toxicity PredictionCheminformatics and High-throughput
Screening to Improve Toxicity Prediction
Alexander TropshaCarolina Center for Computational Toxicology Carolina Center for Environmental Bioinformatics
and Laboratory for Molecular Modeling Eshelman School of Pharmacy
UNC-Chapel Hill
83499901

ChemBench web portal (chembench.mml.unc.edu)A Cheminformatics Workbench for Data Exploration,Model Building and Toxicity Evaluation
Predictors of end point toxicities:-Using chemical structure only- Using hybrid chemical-biological descriptors
Introductory notes on current data streams and cheminformatics approaches to data modeling:Chemical Structure – in vitro – in vivo data continuum
1
2
3
OUTLINE
Conclusions and outlook.- Current data streams require novel data analytical
workflows- Models can be used to prioritize or design the desired
chemicals- Models should be made publicly available: ChemBench
portal (chembench.mml.unc.edu) as a freely available in silico toxicity profiler.
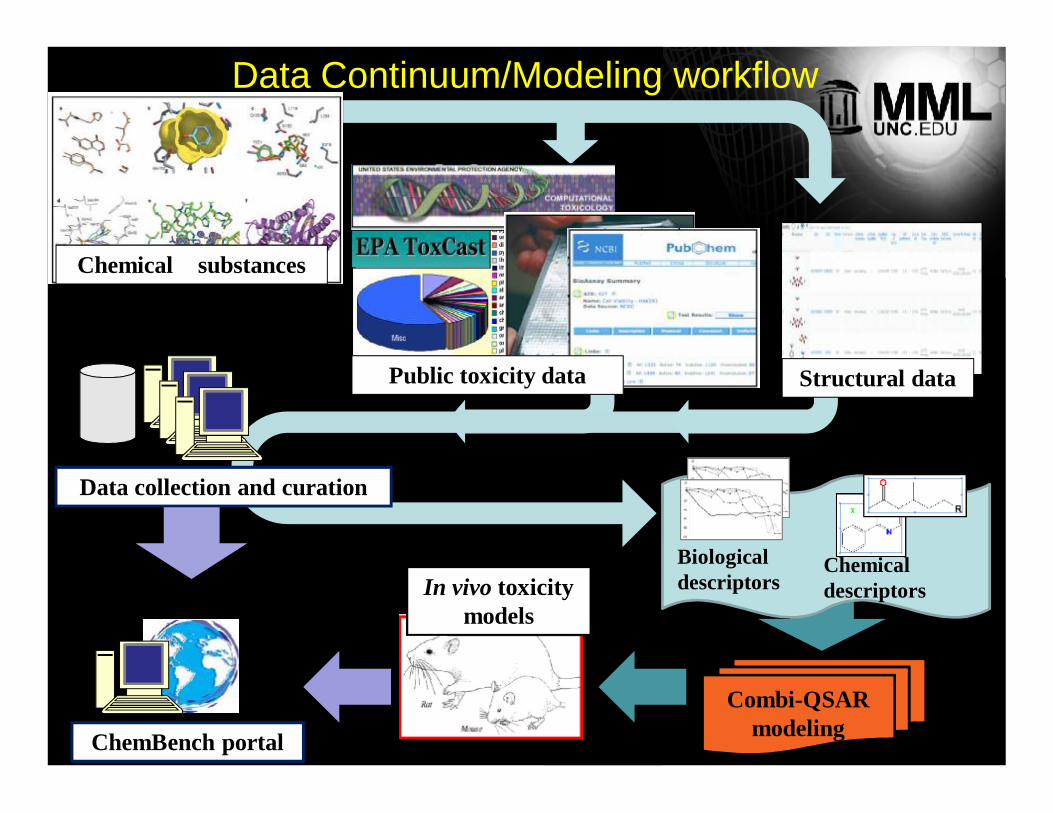
In vivo toxicity models
Chemical substances
Data collection and curation
Public toxicity data Structural data
ChemBench portal
Chemical descriptors
Biological descriptors
Combi-QSAR modeling
Data Continuum/Modeling workflow
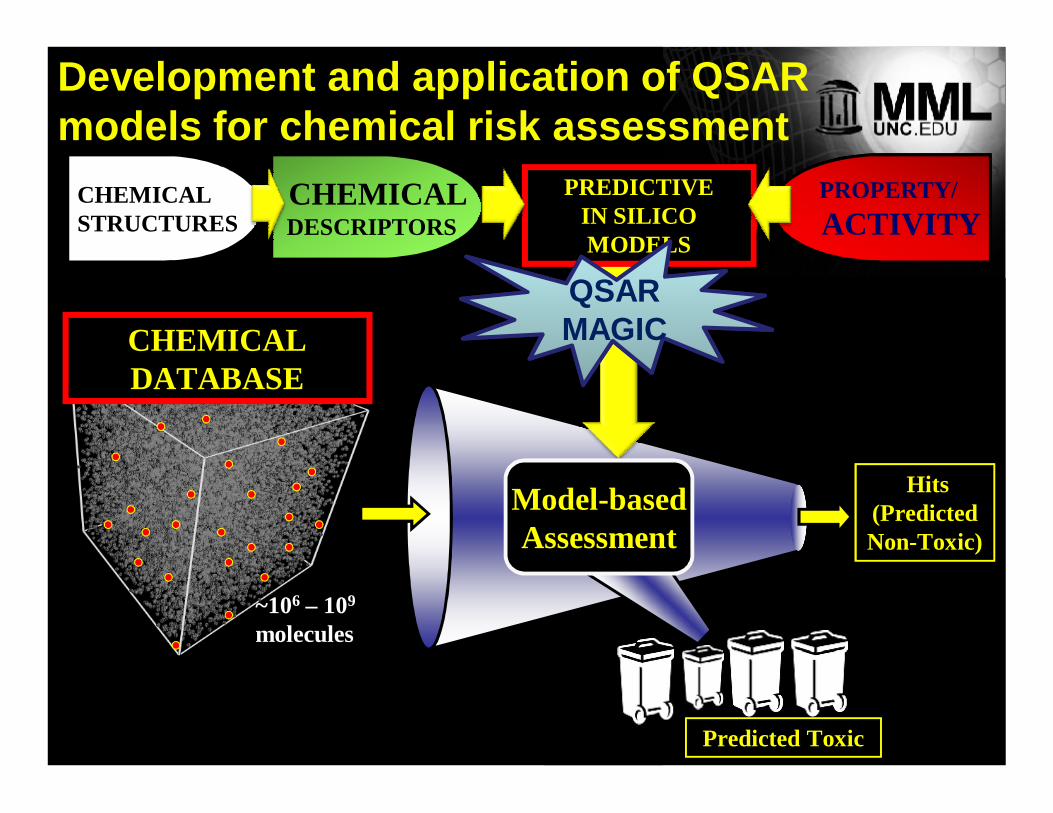
~106 – 109
molecules
Model-basedAssessment
CHEMICALSTRUCTURES
CHEMICALCHEMICALDESCRIPTORS
PROPERTY/ACTIVITY
PREDICTIVEIN SILICO MODELS
Predicted Toxic
QSARMAGICQSARMAGIC
Hits (Predicted Non-Toxic)
CHEMICAL DATABASE
Development and application of QSARmodels for chemical risk assessment

QSAR Table – Chemical descriptors
ID Name Structure MW arom.atoms … -C-
sp21 Acrolein 56.0 0 … 1
2 2-Amino-4-nitrophenol
154.0 6 … 6
... ... … … … … …
369
Tebuco-nazole
307.1 11 … 5
Descriptor #: 1 2 … 201

QuantitativeStructureProperty Relationships
D E S CRI
P T O R S
N
O
N
O
N
O
N
O
N
O
N
O
N
O
N
O
N
O
N
O
0.613
0.380
-0.222
0.708
1.146
0.491
0.301
0.141
0.956
0.256
0.799
1.195
1.005
Principles of QSAR/QSPR modeling
COMPOUNDS
PROPERTY
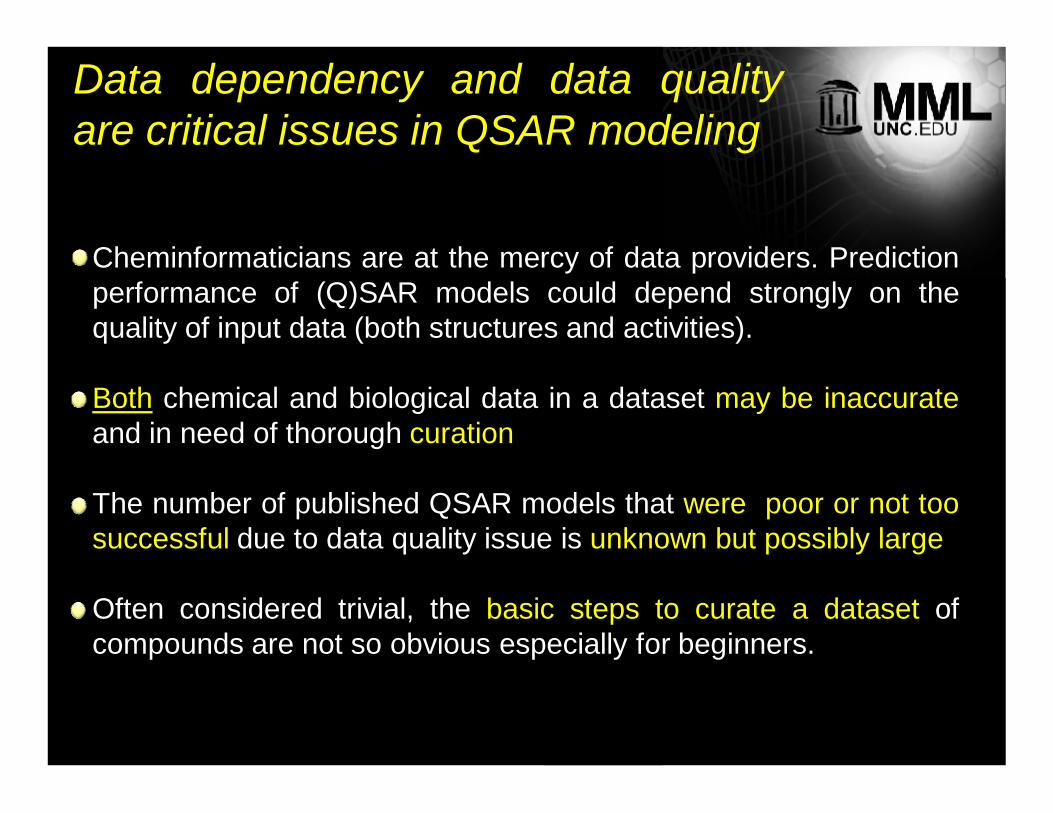
Cheminformaticians are at the mercy of data providers. Predictionperformance of (Q)SAR models could depend strongly on thequality of input data (both structures and activities).
Both chemical and biological data in a dataset may be inaccurateand in need of thorough curation
The number of published QSAR models that were poor or not toosuccessful due to data quality issue is unknown but possibly large
Often considered trivial, the basic steps to curate a dataset ofcompounds are not so obvious especially for beginners.
Data dependency and data qualityare critical issues in QSAR modeling

242 chemical records (Ames dataset)
Looks clean …
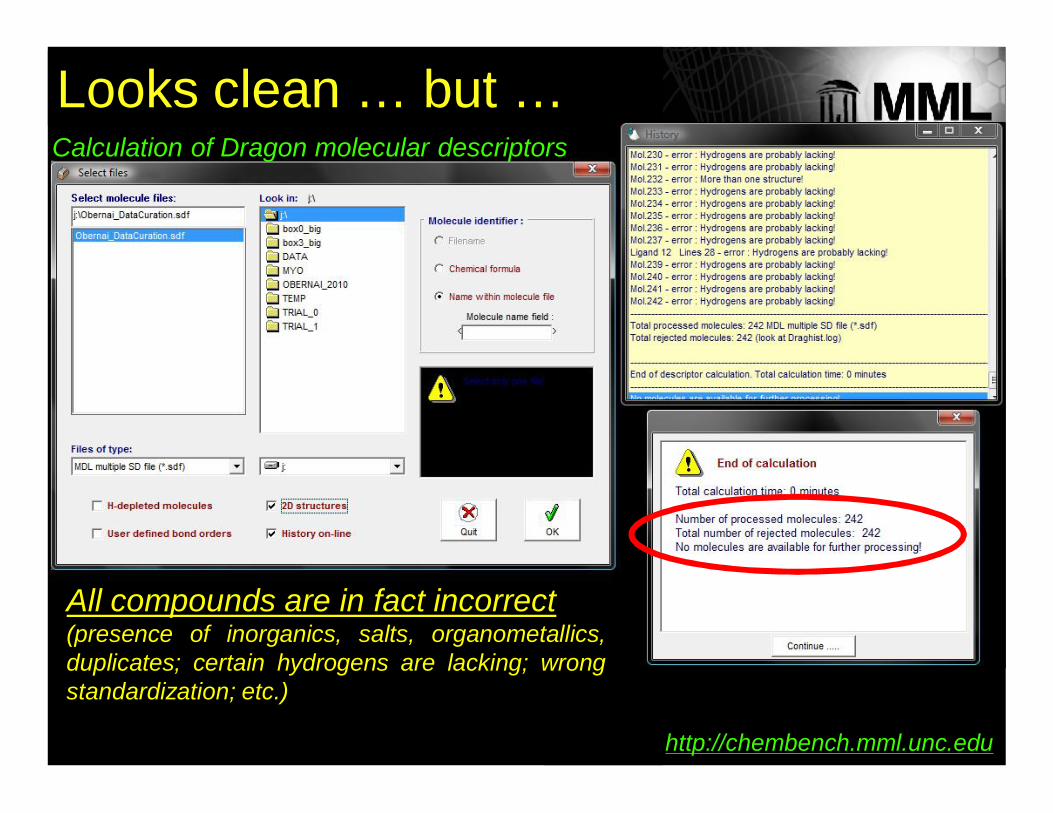
Looks clean … but …Calculation of Dragon molecular descriptors
All compounds are in fact incorrect(presence of inorganics, salts, organometallics,duplicates; certain hydrogens are lacking; wrongstandardization; etc.)
http://chembench.mml.unc.edu

D E S CRI
P T O R S
N
O
N
O
N
O
N
O
N
O
N
O
N
O
N
O
N
O
0.613 0.380
-0.222 7.08
1.1460.491
0.3010.141 0.9560.256
0.799 1.195 1.005
QSAR modeling with non-curated datasets
C
CH3
CH3
CH3
N
O
H3C CH2
CH3
O
O–Na+
Presence of SALTS
Presence of MIXTURESOH
Presence of ERRONEOUS AND/ORWRONG STRUCTURES
Presence of DUPLICATES
Presence of MISPRINTSAND WRONG NAMES
Etc.
ERRORS in the calculationof DESCRIPTORS
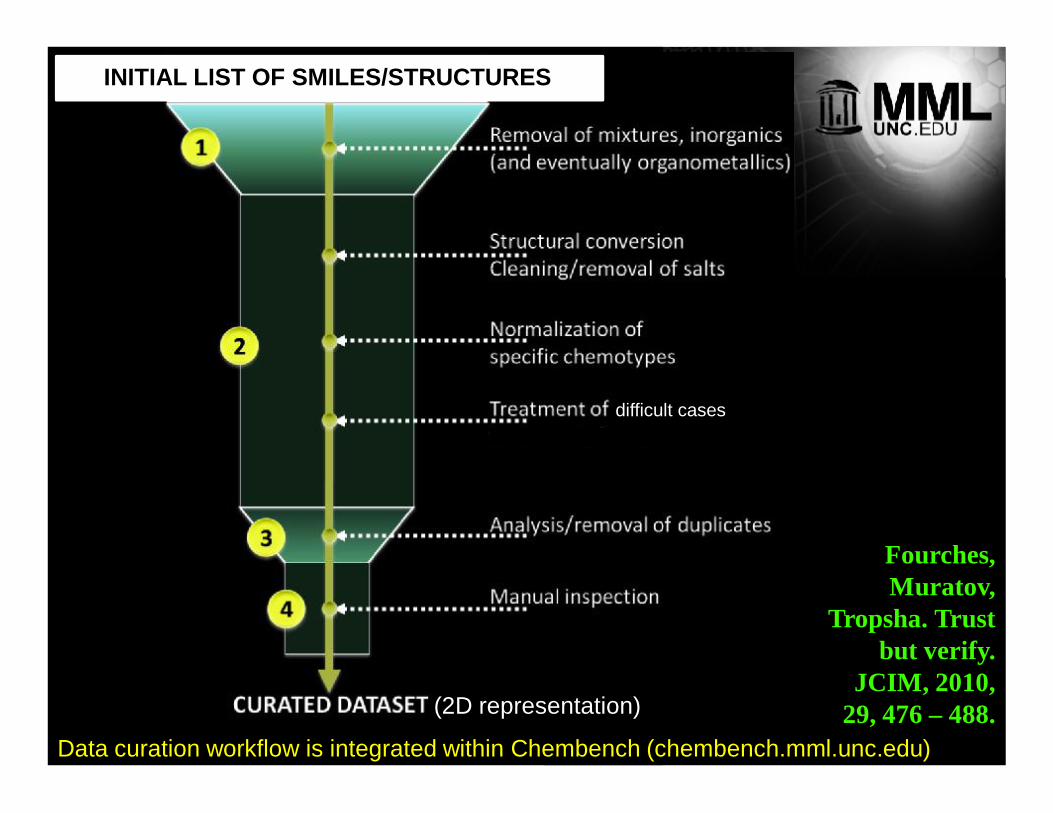
INITIAL LIST OF SMILES/STRUCTURES
(2D representation)
difficult cases
Fourches, Muratov,
Tropsha. Trust but verify.
JCIM, 2010, 29, 476 – 488.
Data curation workflow is integrated within Chembench (chembench.mml.unc.edu)

QSAR modeling of nitro-aromatictoxicants -Case Study 1: 28 compounds tested in rats,log(LD50), mmol/kg.-Case Study 2: 95 compounds tested againstTetrahymena pyriformis, log(IGC50), mmol/ml.
-Case Study 2: after the normalization of nitro groups R2ext~0 increased to R2
ext~0.5
Artemenko, Muratov et al. J. SAR QSAR 2011, 22 (5-6), 1-27.
- Five different representations of nitro groups.-Case Study 1: after the normalization of nitro groupsR2
ext~0.45 increased to R2ext~0.9.
Even small differences in structure representation can lead tosignificant errors in prediction accuracy of models
Data curation impacts the true accuracy (up or down!) of QSAR models

In vivo toxicity models
Chemical substances
Data collection and curation
Public toxicity data Structural data
ChemBench portal
Chemical descriptors
Biological descriptors
Combi-QSAR modeling
Data Continuum/Modeling workflow

The T. pyriformis aquatic toxicity dataset
• Compiled from several publications of T. Schultz’s group (2001-2005) and the Tetratox website (http://www.vet.utk.edu/TETRATOX/)
• Corrected over 100 errors (chemical structures, chemical name and CAS ids).
• 983 unique compounds: 644 compound in modeling set; 339 compound in the external validation set I.
• 110 new compounds from a recent publication (Schultz et al, 2007) and used as the external validation set II.

International Virtual Collaboratory of Computational Chemical Toxicology
• USA: UNC-Chapel Hill (UNC) - H. Zhu and A. Tropsha
• France: University of Louis Pasteur (ULP) – D. FOURCHES and A. VARNEK
• Italy: University of Insubria (UI) – E. PAPA and P. GRAMATICA
• Sweden: University of Kalmar (UK) – T. ÖBERG• Germany: Munich Information Center for Protein
Sequences/Virtual Computational Chemistry Laboratory (VCCLAB)– I. TETKO
• Canada: University of British Columbia (UBC) –A. CHERKASOV
Zhu H, Tropsha A, et al. . Combinatorial QSAR Modeling of Chemical Toxicants Tested against Tetrahymenapyriformis. J Chem Inf Model 2008; (48): 766-784

Different countries, different groups, different tools – shared basic principles
• Explore and combine various QSAR approaches• Use extensive model validation and applicability
domains• Consider external prediction accuracy as the
ultimate criteria of model quality
∑∑ ><−−−=YY
predabs YYYYR 2expexp
2exp
2 )()(1
2expexp
2exp
2 )()(1 ∑∑ ><−−−=YY
LOOabs YYYYQ
∑ −=Y
pred nYYMAE (3)
(2)
(1)

The Prediction of the Two Evaluation Sets by Consensus Models
Model Group ID
1st Evaluation Set (n=339)
2nd Evaluation Set (n=110)
RI2 SEI Coverage RII
2 SEII Coverage
kNN-Dragon UNC 0.87 0.30 80.2% 0.77 0.29 52.7%
kNN-MolconnZ UNC 0.86 0.31 84.3% 0.50 0.36 53.6%
SVM-Dragon UNC 0.82 0.39 80.2% 0.83 0.31 52.7%
SVM-MolconnZ UNC 0.84 0.37 84.3% 0.59 0.41 53.6%
kNN-Fragmental ULP 0.71 0.47 100% 0.41 0.53 100%
SVM-Fragmental ULP 0.78 0.49 100% 0.46 0.62 100%
MLR ULP 0.82 0.43 97.3% 0.48 0.62 95.5%
MLR-CODESSA ULP 0.72 0.47 100% 0.59 0.44 100%
OLS UI 0.77 0.43 98.5% 0.59 0.49 98.2%
PLS UK 0.81 0.40 96.1% 0.60 0.49 95.5%
ASNN MISP 0.88 0.33 87.4% 0.76 0.40 71.8%
PLS-IND_I UBC 0.74 0.39 99.7% 0.45 0.54 100%
MLR-IND_I UBC 0.75 0.40 99.7% 0.46 0.53 100%
ANN-IND_I UBC 0.76 0.39 99.7% 0.46 0.53 100%
SVM-IND_I UBC 0.79 0.35 99.7% 0.53 0.46 100%
Consensus Model
- 0.87 0.27 100% 0.70 0.34 100%

14 Teams1 (UNC) Laboratory of Molecular Modeling, School of Pharmacy, University of North Carolina,Chapel Hill, USA;2 (PCI) Laboratory on Theoretical Chemistry, A.V. Bogatsky Physical-Chemical Institute NAS ofUkraine, Odessa, Ukraine;3 (MSU) Department of Chemistry, Moscow State University, Moscow, Russia;4 (UI) Department of Structural and Functional Biology, University of Insubria, Varese, Italy;5 (EPA) National Risk Management Research Laboratory, US Environmental Protection Agency,Cincinnati, USA;6 (SFU) Laboratory for Computational Biology, Simon Fraser University, Burnaby, Canada;7 (UBC) Division of Infectious Diseases, University of British Columbia, Vancouver, Canada;8 (UK) School of Pure and Applied Natural Sciences, University of Kalmar, Kalmar, Sweden;9 (UMB) Milano Chemometrics and QSAR Research Group, University of Milano-Bicocca, Milan,Italy;10 (IBMC) Laboratory for Structure-Function Based Drug Design, Institute of BiomedicalChemistry RAS, Moscow, Russia;11 (ULP) Department of Chemistry, L. Pasteur University of Strasbourg, Strasbourg, France;12 (ULZ) Department of Chemistry, Lanzhou University, Lanzhou, China;13 (TUB) Machine Learning Group, Technical University of Berlin, Berlin, Germany14 (VCCLAB) German Research Center for Environmental Health, Institute for Bioinformatics,Neuherberg, Germany.
Collaborative QSAR Modeling of Ames Mutagenicity
Sushko et al. Applicability domains for classification problems: Benchmarking of distance to models for Ames mutagenicity set. J Chem Inf Model. 2010 Dec 27;50(12):2094-111

Team Name Descriptors Modeling DA estimation
EPA PCID NN, FDAEuclidean distance threshold between a test
compound and compounds in the modeling set (for NN only)
IBMC GUSAR, PASS RB, SCR Leverage approach (SCR only)
MSU NASAWIN fragments RLR, SVM One-Class Classification Approach
PCISiRMS (2D),
Dragon (2D) and their mix
RF No
TUB Dragon (3D) RF, SVM NoUBC, SFU ID (3D) IWNN, WNN No
UI Dragon (2D) LDA, SVM No
UK Dragon (2D) PLS Residual standard deviation and leverage within the PLS model
ULP ISIDA NB, SQS, SVM, VP Fragment control approach
ULZ Dragon (3D) KNN, SVM NoUMB Dragon (2D) CART No
UNCSiRMS (2D),
Dragon (2D) and their mix
KNN, RF, SVM Euclidean distance
VCCLAB ESI ASNN Distance to model
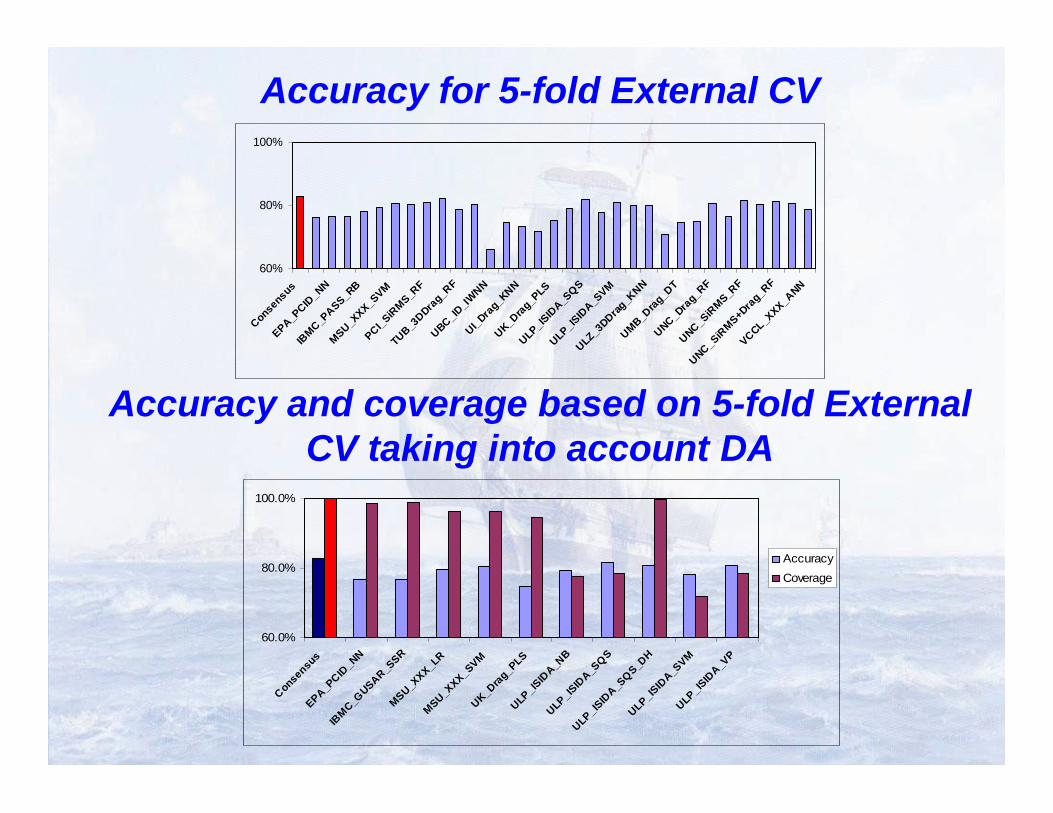
33 Models, 9 Descriptor types, 17 Modeling techniques, 6 DA approaches
QSAR approaches
60%
80%
100%
Consensus
EPA_PCID
_NN
IBMC_P
ASS_RB
MSU_XXX_SVM
PCI_SiRMS_R
F
TUB_3DDra
g_RF
UBC_ID_IW
NN
UI_Drag_KNN
UK_Drag_PLS
ULP_ISIDA_S
QS
ULP_ISIDA_S
VM
ULZ_3DDrag_K
NN
UMB_Drag_DT
UNC_Drag_RF
UNC_SiRMS_R
F
UNC_SiRMS+Dra
g_RF
VCCL_XXX_ANN
60.0%
80.0%
100.0%
Consensus
EPA_PCID
_NN
IBMC_G
USAR_SSR
MSU_XXX_LR
MSU_XXX_SVM
UK_Drag_PLS
ULP_ISIDA_N
B
ULP_ISIDA_S
QS
ULP_ISIDA_S
QS_DH
ULP_ISIDA_S
VM
ULP_ISIDA_V
P
AccuracyCoverage
Accuracy for 5-fold External CV
Accuracy and coverage based on 5-fold External CV taking into account DA
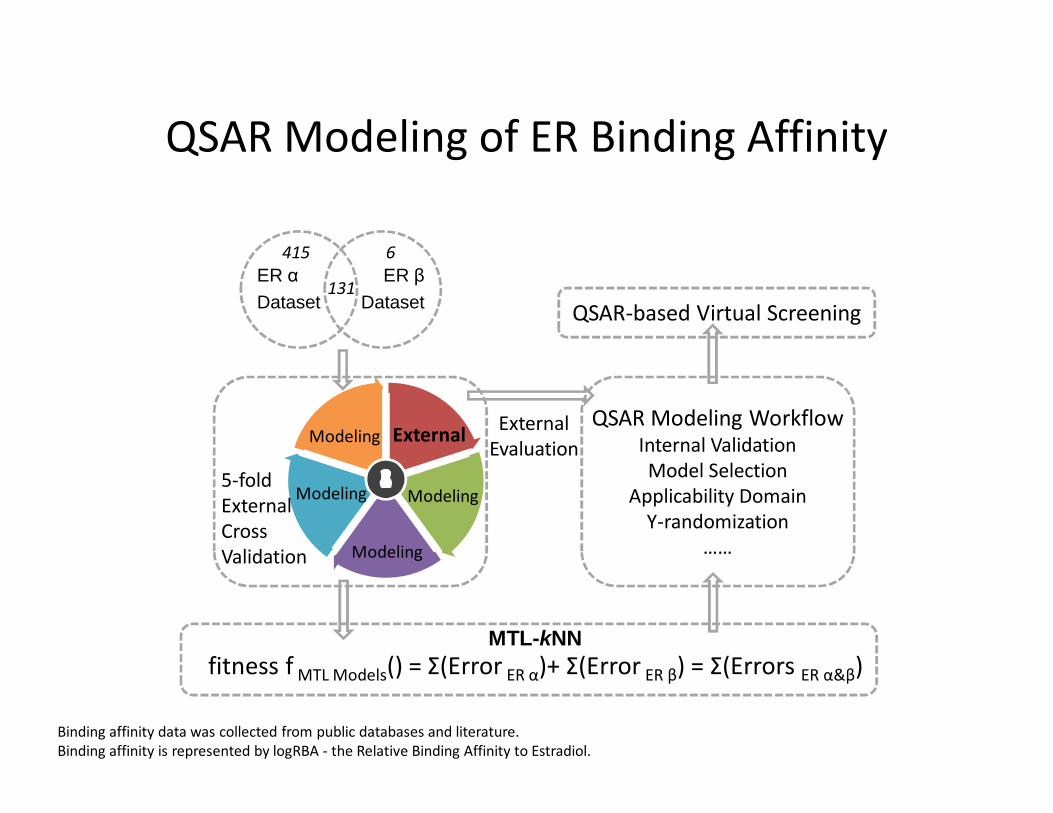
fitness f MTL Models() = Σ(Error ER α)+ Σ(Error ER β) = Σ(Errors ER α&β)
QSAR Modeling WorkflowInternal Validation Model Selection
Applicability DomainY-randomization
……
5-fold External Cross Validation
External Evaluation
MTL-kNN
QSAR-based Virtual Screening
Modeling
Modeling
Modeling
Modeling
External
QSAR Modeling of ER Binding Affinity
ER αDataset
ER βDataset
131
6415
12354
Binding affinity data was collected from public databases and literature.Binding affinity is represented by logRBA - the Relative Binding Affinity to Estradiol.

0
0.2
0.4
0.6
0.8
ER α ER β
R2
STLSTL_ADMTLMTL_AD
Predictive Accuracy of Models for ERαand ERβ subtypes
• MTL improved the predictive accuracy for ER β (but not ER α) binding affinity models .
• Using applicability domain slightly increased the predictive accuracy of both models.• No statistically significant models were derived after Y-randomization, indicating the
robustness of models that used real data.
5-fold external cross validation results of MTL vs. conventional STL models

Descriptor profiles for ER ligands
Strong ERα binders’ chemical descriptor profilesWeak ERα binders’ chemical descriptor profilesExample of a strong binder’s chemical descriptor profileExample of a weak binder’s chemical descriptor profile
In order to reduce the binding affinity of ER ligands, chemical modifications that could reduce (increase) the values of selected descriptors are favored.

Virtual Screening for ER-mediated Endocrine Disrupting Compounds
• Predictive QSAR models were used to virtually screen Tox21 3K dataset.
• 135 compounds were prioritized* as potential ERα or ERβ binders that might induce endocrine disruption effects via estrogen signaling pathway.
* Selection criteria: predicted logRBA > -2 (equally IC50 <10μM); at least within the applicability domain of 50% of models; standard deviation of predictions <0.8.

Emerging approaches combining cheminformatics and short-term assays :
The Use of Biological Screening Data as Additional Biological Descriptors Improves the
Prediction Accuracy of Conventional QSAR Models of Chemical Toxicity*
Zhu, H., Rusyn I, Richard A, Tropsha A. Use of cell viability assay data improves the prediction accuracy of conventional quantitative structure-activity relationship models of animal carcinogenicity. EHP, 2008, (116): 506-513Sedykh A, Zhu H, Tang H, Zhang L, Richard A, Rusyn I, Tropsha A. Use of in vitro HTS-derived concentration-response data as biological descriptors improves the accuracy of QSAR models of in vivo toxicity.EHP, 2011, 119(3):364-70.Low et al., Predicting drug-induced hepatotoxicity using QSAR and toxicogenomics approaches. Chem Res Toxicol. 2011 Aug 15;24(8):1251-62
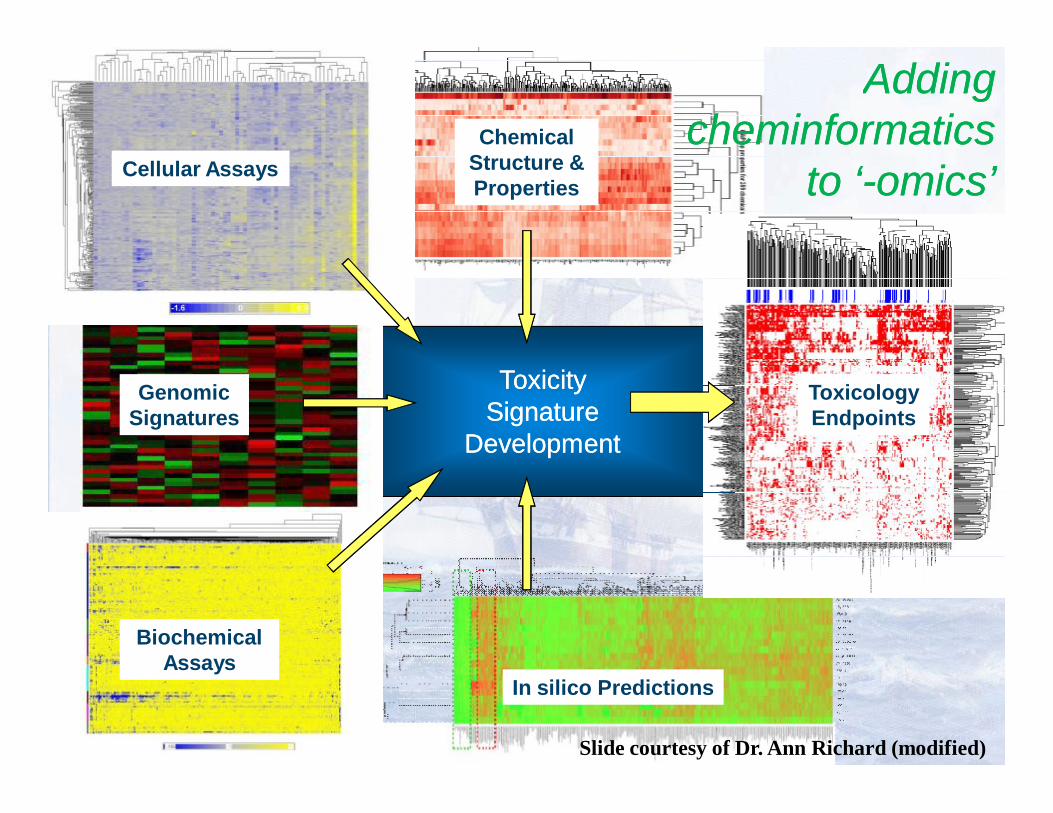
ChemicalStructure & Properties
ToxicityToxicitySignatureSignature
DevelopmentDevelopment
GenomicSignatures
Cellular Assays
BiochemicalAssays
In silico Predictions
ToxicologyEndpoints
Adding Adding cheminformaticscheminformatics
to ‘to ‘--omicsomics’’
Slide courtesy of Dr. Ann Richard (modified)
QuantitativeStructureProperty Relationships
N
O
N
O
N
O
N
O
N
O
N
O
0.613
0.380
-0.222
0.708
1.146
0.491
0.301
0.141
0.956
0.256
0.799
1.195
1.005
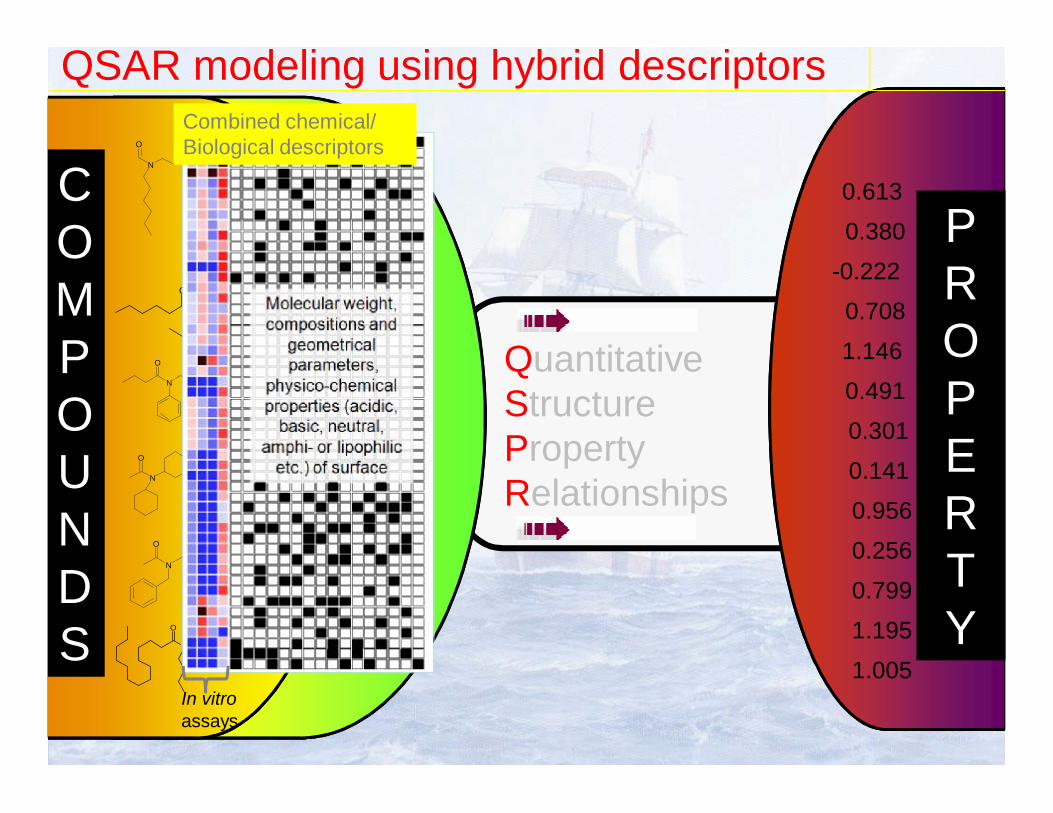
QSAR modeling using hybrid descriptors
COMPOUNDS
PROPERTY
Combined chemical/Biological descriptors
In vitroassays

in vitro dose-response data improve the predictive power of QSAR
modelsCase Study: prediction of in vivo toxicity (rat LD50 )
•1408 substances •382 chemical structure descriptors (Dragon v5.5)• 13 in vitro NCGC cell viability assays * :
¥ qHTS (quantitative HTS) data
¥ 14 test concentrations: 0.6nm .. 92.2μm
May yield up to 13x14 = 182 in vitro qHTS descriptors, but the issue of data noise becomes important.
*Inglese J., Douglas S. A. et al. PNAS, 2006, v103(31), p11473

QSAR Table – qHTS descriptors
ID Name Structure 3T39.2mkM
3T321mkM … SHSY
92mkM1 Acrolein 0 0 … -92
2 2-Amino-4-nitrophenol
0 -22 … 0
... ... … … … … …
369
Tebuco-nazole
-21 -24 … -18
Descriptor #: 1 2 … 182
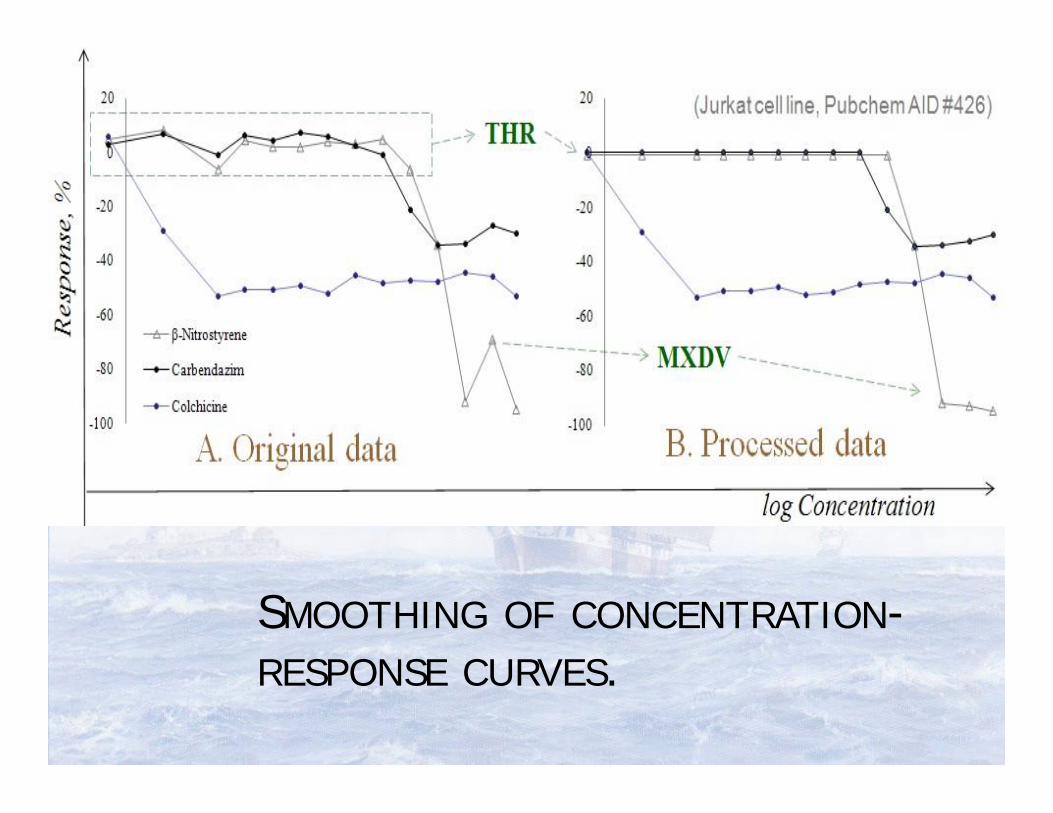
SMOOTHING OF CONCENTRATION-RESPONSE CURVES.

Modeling Workflow
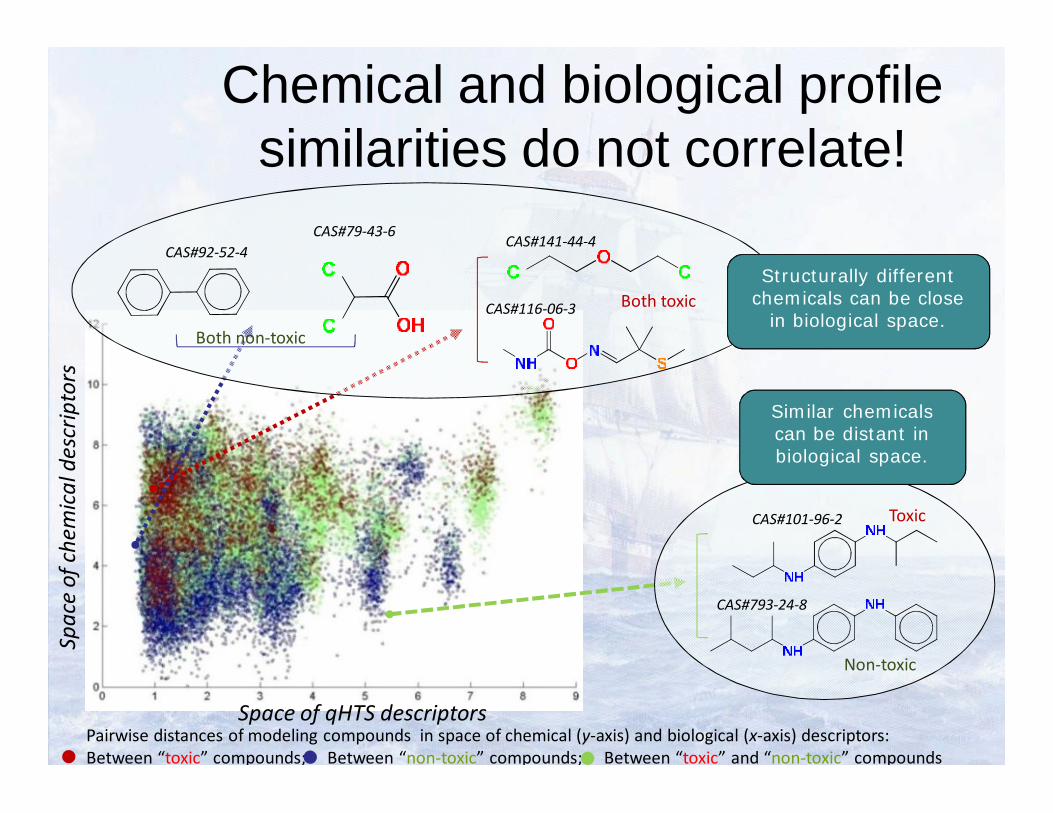
Chemical and biological profile similarities do not correlate!
Spac
e of
che
mic
al d
escr
ipto
rs
Pairwise distances of modeling compounds in space of chemical (y-axis) and biological (x-axis) descriptors:Between “toxic” compounds; Between “non-toxic” compounds; Between “toxic” and “non-toxic” compounds
Toxic
Non-toxic
CAS#101-96-2
CAS#793-24-8
Space of qHTS descriptors
CAS#79-43-6CAS#92-52-4
Both non-toxic
CAS#141-44-4
CAS#116-06-3 Both toxic
Similar chemicals can be distant in biological space.
Structurally different chemicals can be close
in biological space.

Smoothing the concentration-response data improves the prediction accuracy
of hybrid models.
%Chemical
descriptorsonly
Hybrid descriptors (Original)
Hybrid descriptors
(THR=15%)
Sensitivity 68±8 63±9 76±5
Specificity 85±4 86±4 87±2
CCR 76 ±5 * 74 ±5 82 ±3
Sensitivity 74±9 66±8 77±10
Specificity 82±7 87±4 86±3
CCR 78 ±4 * 77 ±5 82 ±5
Shown are averaged results of five-fold external validation. *Chemical descriptors.only models were significantly different (p < 0.05) from all other models of the corresponding group by the permutation test (10,000 times).
kNNmodelskNNmodels
Random Forest (RF) models
Random Forest (RF) models
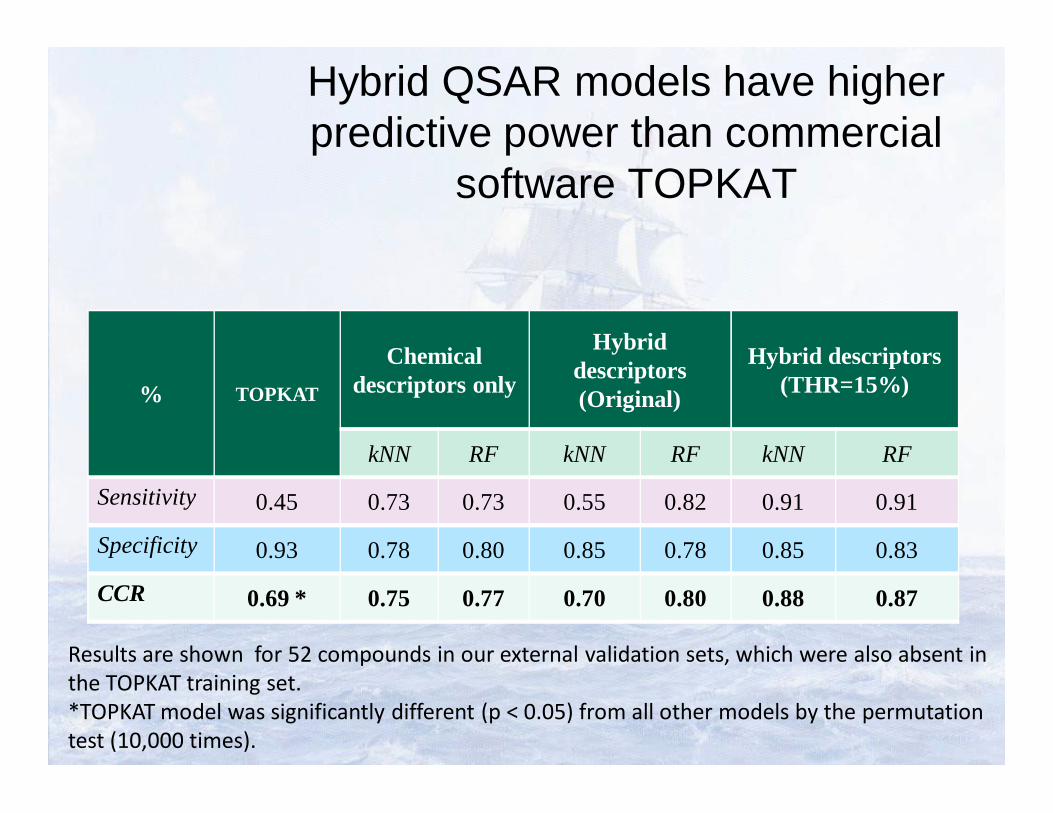
Hybrid QSAR models have higher predictive power than commercial
software TOPKAT
% TOPKAT
Chemical descriptors only
Hybrid descriptors (Original)
Hybrid descriptors (THR=15%)
kNN RF kNN RF kNN RF
Sensitivity 0.45 0.73 0.73 0.55 0.82 0.91 0.91
Specificity 0.93 0.78 0.80 0.85 0.78 0.85 0.83
CCR 0.69 * 0.75 0.77 0.70 0.80 0.88 0.87
Results are shown for 52 compounds in our external validation sets, which were also absent in the TOPKAT training set. *TOPKAT model was significantly different (p < 0.05) from all other models by the permutation test (10,000 times).
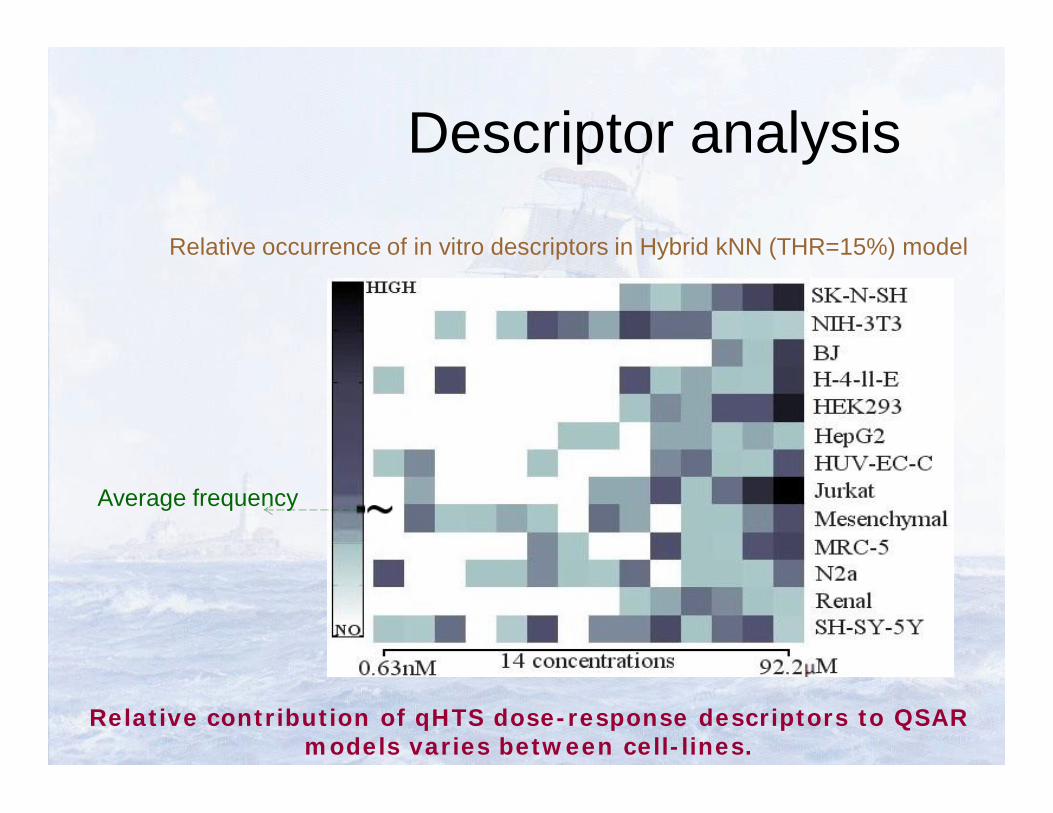
Descriptor analysis
Relative occurrence of in vitro descriptors in Hybrid kNN (THR=15%) model
Relative contribution of qHTS dose-response descriptors to QSAR models varies between cell-lines.
Average frequency

ChemBench: cheminformatics portal for model development and end point prediction
http://chembench.mml.unc.edu


Conclusions• Methodology:
– data curation is critical!– consensus (collaborative!) prediction using all acceptable
models affords the highest accuracy– outcome: decision support tools in selecting future
experimental screening sets• The highest accuracy is achieved by models that
employ both chemical and biological descriptors of compounds– predictive models of selected endpoints using integrated
short term biological profiles (biodescriptors ) and chemical descriptors for compound subsets
– Interpretation of significant chemical and biological descriptors to inform the selection or design of novel, safe chemicals
Research ProfessorsClark Jeffries, Alexander Golbraikh, Hao Zhu, Denis Fourches
Graduate Research AssistantsLiying Zhang, Guiyu Zhao, Andrew Fant, Stephen Bush, Yen Low, Dan Operer, Petro BorysovPostdoctoral Fellows
Aleks Sedykh, Ashutosh Tripathy, Nancy Baker
Visiting Research ScientistEugene Muratov
Adjunct MembersWeifan Zheng, Shubin Liu
AcknowledgementsAcknowledgements
Research ProgrammerTheo Walker
System AdministratorMihir Shah
MAJOR FUNDINGNIH
- R01-GM66940- R01-GM068665
EPA (STAR awards)- RD832720- RD833825- RD834999
Collaborators:UNC: I. Rusyn, F. WrightEPA: T. Martin, D. YoungA. Richard, R. Judson, D. Dix, R. Kavlock