chemicalengineeringscience - college of … engineering science 64 (2009) 2433--2447 contents lists...
TRANSCRIPT

Chemical Engineering Science 64 (2009) 2433 -- 2447
Contents lists available at ScienceDirect
Chemical Engineering Science
journal homepage: www.e lsev ier .com/ locate /ces
Experimental studiesandpopulationbalanceequationmodels forbreakagepredictionof emulsion drop size distributions
Neha B. Raikar, Surita R. Bhatia, Michael F. Malone, Michael A. Henson∗
Department of Chemical Engineering, University of Massachusetts, Amherst, MA 01003-9303, USA
A R T I C L E I N F O A B S T R A C T
Article history:Received 21 July 2008Received in revised form 10 January 2009Accepted 27 January 2009Available online 14 February 2009
Keywords:EmulsionsDrop breakageDrop size distributionsPopulation balance equation modelsParameter estimation
A population balance equation (PBE) model for pure drop breakage processes was developed from homog-enization experiments and used to investigate model extensibility over a range of emulsion formulationand homogenizer operating variables. Adjustable parameters in the mechanistic breakage functions wereestimated from measured drop volume distributions by constrained nonlinear least-squares optimization.Satisfactory prediction of measured bimodal distributions was achieved by the incorporation of twodifferent breakage functions that accounted for large drop breakage due to turbulent shear and for smalldrop breakage due to collisions between drops and turbulent eddies. Model extensibility to differentemulsion compositions and homogenizer pressures was investigated by comparing model predictionsgenerated with the base case parameters to drop volume distributions measured under different condi-tions. The PBE model satisfactorily accounted for changes in the dispersed phase volume fraction and theinterfacial tension with the base case parameters. By contrast, significantly improved predictions for thecontinuous phase viscosity or multiple formulation variables were obtained through re-estimation of themodel parameters using multiple data sets in which the associated variables were systematically varied.The model was not able to satisfactorily predict drop volume distributions resulting from homogenizerpressure changes, perhaps due to the assumption of a constant pressure throughout the homogenizer.We conclude that PBE models of drop breakage can be used to reasonably predict the effects of emulsionformulation variables on drop volume distributions and have the potential for guiding experimentalefforts aimed at the design of novel emulsified products.
© 2009 Elsevier Ltd. All rights reserved.
1. Introduction
Oil-in-water emulsions are ubiquitous in petroleum-based con-sumer products, including cosmetics, creams, lotions, and agricul-tural products (Chappat, 1994; Israelachvili, 1994). Emulsions arealso encountered throughout the petroleum industry with appli-cations at many stages of petroleum recovery, transportation, andprocessing (Becher, 2001; Schramm, 1992). In petroleum recoveryapplications, emulsion formation at the well-head is undesirablewhile emulsions are critical for enhanced oil recovery as drillingmuds and fluids. Heavy crude oils typically have viscosities in therange of a few hundred to several thousand centipoise, and thereforethey cannot be transported economically in conventional pipelineswithout reducing their viscosity (Nasr-El-Din, 1992). Emulsifyingheavy oils with an aqueous solution significantly reduces the vis-cosity, allowing for lower pumping power requirements and more
∗ Corresponding author. Tel.: +14135453481; fax: +14135451647.E-mail address: [email protected] (Michael A. Henson).
0009-2509/$ - see front matter © 2009 Elsevier Ltd. All rights reserved.doi:10.1016/j.ces.2009.01.062
economical transportation (Saniere et al., 2004; Rimmer et al., 1992;Yaghi and Al-Bemani, 2002).
The emulsion drop size distribution has a significant effect onemulsion stability as well as on emulsion viscosity, and hencepipeline frictional losses and pumping power. For petroleum ap-plications, emulsions with small drops are desirable to promotestability and minimize viscosity (Nasr-El-Din, 1992; Pal et al., 1992).Coarse emulsions are typically formed by low-shear mixing in anagitated vessel, followed by a high-shear process to create smallerdrops. The prepared emulsions are then stored under static condi-tions before introduction into the pipeline (Schramm, 1992; Rimmeret al., 1992). Drop breakage and coalescence during high-shearpreparation have a substantial impacts on the drop size distribution.While drop breakage under laminar conditions has been extensivelystudied (Dhingra, 2001; Gupta, 2004), predictive models for dropbreakage and coalescence under turbulent conditions are lacking.
Due the lack of suitable models, emulsified products are currentlydeveloped by combining a broad knowledge of the previous productformulations with empirical scientific experimentation to createnew formulations with desired properties. Because this approach is

2434 Neha B. Raikar et al. / Chemical Engineering Science 64 (2009) 2433 -- 2447
intuitive and experimental, the progression of a formulation isgenerally unpredictable and a new product will often go throughhundreds of prototype formulations in a laboratory or pilot plantbefore commercialization. Due to the very large number of possibleformulation and processing combinations that need to be explored,the traditional trial-and-error approach requires significant timeand resources. The lack of suitable models has impeded the de-velopment of systematic methodologies for designing emulsifiedproducts. Such methodologies will not eliminate the need for lab-oratory experimentation, but rather they will serve to guide andfocus product experimentation on quantifying key physicochemicalproperties instead of attempting to directly identify new productformulations.
Population balance equation (PBE) models have been widely usedto predict drop size distributions in turbulently agitated liquid–liquiddispersions (Ramkrishna, 2000). More recently, several investigatorshave developed PBE models of high pressure homogenizers for thepreparation of oil-in-water emulsions (Floury et al., 2004a,b; Soonet al., 2001; Vankova et al., 2007ab). The key challenge associatedwith the formulation of predictive PBEmodels is experimental deter-mination of unknown drop breakage and coalescence functions. Inthis paper, we restrict our analysis to pure breakage processes underthe assumption of negligible drop coalescence. A volume-structuredPBE model includes three breakage functions for the breakage rateg(v), the number �(v) of daughter drops formed from breakage ofa mother drop, and the probability �(v,v′) of obtaining daughterdrops of size v from breakage of mother drops of volume v′. To avoidcomplications associated with modeling multiple daughter drop for-mation, binary breakage is commonly assumed such that �(v) = 2.While several functional forms have been proposed for the proba-bility �(v,v′), available functions are phenomenological rather thanbased on fundamental principles (Alopaeus et al., 2002; Coulaloglouand Tavlarides, 1977; Ruiz and Padilla, 2004; Tcholakova et al., 2007).By contrast, mechanistic modeling of the breakage rate g(v) has re-ceived considerable attention and a variety of functional forms areavailable (Chen et al., 1998; Coulaloglou and Tavlarides, 1977).
From a product engineering perspective, mechanistic break-age rate functions that depend on the emulsion chemical for-mulation (oil, water, and surfactant concentrations) through bulkphysical properties (dispersed phase volume fraction, contin-uous phase viscosity, and interfacial tension) are preferred toempirical forms such as power law functions obtained throughinverse PBE modeling (Ramkrishna, 2000; Raikar et al., 2006;Sathyagal et al., 1995; Sathyagal and Ramkrishna, 1996). In princi-ple, mechanistic breakage functions can be identified from limitedexperimental data for a particular chemical formulation and thenused to predict drop volume distributions that result from differentchemical compositions. From a process engineering perspective,the breakage rate should also depend on emulsification equipmentparameters, such as the stirrer speed of an agitated vessel or theoperating pressure of a homogenizer, to allow prediction of dropvolume distributions that result from different process operatingconditions. This connection can be made through process-specificexpressions for the energy dissipation rate that commonly appearsin mechanistic breakage rate functions (Chen et al., 1998; Flouryet al., 2004b). Surprisingly, we have not found any studies in whichPBE model extensibility to different chemical compositions or pro-cess conditions has been tested experimentally.
In this paper, we develop a PBE model for pure drop break-age processes by fitting model parameters to data collected fromhigh-pressure homogenization experiments and evaluate model ex-tensibility over a range of emulsion formulation and homogenizeroperating variables. Homogenizer flow regimes are investigated us-ing computational fluid dynamics (CFD) to better understand rel-evant drop breakage mechanisms and to motivate development oftwo mechanistic breakage functions. Nonlinear least-squares opti-
mization is used to estimate adjustable parameters in breakage ratefunctions from measured drop volume distributions. Model extensi-bility is evaluated by comparing predictions generated with the basecase parameters to drop volume distributions measured for differentdispersed phase volume fractions, interfacial tensions, continuousphase viscosities, and homogenizer pressures.
2. Experimental methods
2.1. Materials
We used soybean oil (Spectrum Organic) as the dispersed phase,nanopure water as the continuous phase, and the nonionic surfac-tant Pluronic F-68 (Sigma Aldrich) as the emulsifier. The base caseemulsion consisted of 0.5wt% oil and 0.1wt% surfactant with theremainder water (Table 1). Relatively low oil and high surfactantconcentrations were used to minimize the possibility of coalescence,an assumption tested experimentally through a specific coalescenceexperiment (see Section 4.2). Emulsions were prepared at concen-trations different than the base case listed in Table 2 to test ex-tensibility of the PBE model for varying bulk emulsion properties.The dispersed phase volume fraction was changed by adjusting theamount of oil, and the interfacial tension was changed by adjustingthe amount of surfactant. To change the continuous phase viscos-ity, varying amounts of sucrose (Fisher Scientific) were added to thenanopure water.
2.2. Emulsion preparation
Emulsions were prepared using a two-step process. First about100ml of coarse pre-emulsion was prepared by mixing the chemicalingredients in a stator–rotor device (Ultra-Turrax Model T25, RoseScientific Ltd.) at 13000 rpm for 1min (Table 1). Approximately5ml of the pre-emulsion was sampled for measuring the drop sizedistribution (see below). The pre-emulsion was then processed ina high-pressure homogenizer (Emulsiflex C-3, Avestin Inc.) wherethe liquid was pressurized to 10000psig (68.95MPa) and thenexpanded through a narrow valve gap to create turbulent shear con-ditions favoring drop breakage. Multiple passes each approximately2min long were performed by reprocessing the emulsion obtainedfrom the previous homogenizer pass. Five passes were performedfor each experiment, and after each pass 5ml of the emulsionwas sampled for drop size distribution measurement. Experimentswere also performed at different pressures (5000–20000Psig)than the base case value to test extensibility of the PBE model(Table 2).
Table 1Base case emulsion formulation and homogenization values.
Soybean oil 0.5wt%Pluronic F-68 0.1wt%Dispersed phase volume fraction (�) 5.59 × 10⁻³
Interfacial tension (�) 13.68mN/mContinuous phase viscosity (�c) 1 cPHomogenizer pressure (P) 10000psig (68.95MPa)
Table 2Range of emulsion formulations and homogenization pressures studied.
Dispersed phase volume fraction (�) 2.78 × 10⁻³ to 0.0228Interfacial tension (�) 14.318–12.68mN/mContinuous phase viscosity (�c) 1–1.3 cPHomogenizer pressure (P) 5000–20000psig (34.48–137.9MPa)

Neha B. Raikar et al. / Chemical Engineering Science 64 (2009) 2433 -- 2447 2435
2.3. Emulsion characterization
Drop size distributions were measured using a static light scatter-ing device (Coulter LS230 Particle Size Analyzer, Beckman Coulter).Optical microscopy (Olympus IX71 Inverted Microscope, Olympus)at a magnification of 20× and 40× was used to visually analyze dropsizes. Oil–water interfacial tensions were measured by drop shapeanalysis (KRUSS Instruments Model DSA-10 Tensiometer, KRUSS) at25 ◦C. Continuous and dispersed phase viscosities were measuredusing a Ubbelohde type capillary viscometer (Model CT-1000, CanonInstruments Company) at 25 ◦C. We found that large amounts ofadded sucrose designed to vary the continuous phase viscosity alsoslightly changed the interfacial tension. This issue is discussed fur-ther in the results section.
3. Theory
3.1. Computational fluid dynamics (CFD)
A CFD study was performed to better understand the flow fieldnear the homogenizer valve. Because our goal was to identify pos-sible turbulent mechanisms for drop breakage rather than to modelthe effects of inhomogeneous flow fields on drop breakage, the CFDcomputations were performed separately from the PBE model solu-tion. The interested reader is referred elsewhere for CFD studies inwhich the PBE model is coupled to the flow field calculations (Doraoand Jakobsen, 2006; Gavi et al., 2008; Jaworski et al., 2007; Kim andKramer, 2006; Woo et al., 2006).
Because our intention was to analyze bulk flow fields and not totrack droplets, only continuous phase properties were consideredunder the assumption that the flow properties of our very diluteemulsions were dictated by the continuous phase fluid (water).The CFD analysis was restricted to a two-dimensional axisymmet-ric representation of the homogenizer valve near the narrow gapshown in Fig. 3 (Kelly and Muske, 2004; Lander et al., 2000; Milleret al., 2002). The geometry was meshed using Gambit v2.2.30, andthe flow field calculations were performed using Fluent v6.2.16(Guide, 2005). Interactions between the water liquid and vaporphases were captured using the Fluent cavitation model. The stan-dard k–� model was used for turbulence with no-slip boundarycondition at the walls, and pressure-velocity coupling was capturedusing the SIMPLEC algorithm. A constant velocity of 0.42ms−1
calculated from the homogenizer flow rate and the valve gapwas introduced normal to the inlet plane, and the outlet pres-sure was set to 950psig (6.5MPa) since only a truncated sectionof the homogenizer was considered. The numerical solution wasconsidered converged when the normalized residuals were lessthan 10−5 and subsequent iterations did not change the flow fieldresults.
3.2. Population balance equation model
The analysis in this paper is restricted to pure breakage processesunder the assumption of negligible drop coalescence (Simon et al.,2003). Under this assumption, the PBE for a batch system can bewritten as (Canu, 2005; Chen et al., 1998; Coulaloglou and Tavlarides,1977)
�n(v, t)�t
= −g(v)n(v, t) +∫ ∞
v�(v,v′)�(v′)g(v′)n(v′, t)dv′ (1)
where n(v, t)dv is the number of drops with volume in the range[v,v + dv] per unit volume of the dispersion, g(v) is the breakagerate representing the fraction of drops of volume v breaking per unittime, �(v) is the number of daughter drops formed by breakage of amother drop of volume v, and �(v,v′) is the daughter drop distribu-
tion function representing the probability of forming a daughter dropof size v from breakage of a mother drop of size v′. We model thehigh-pressure homogenizer as a well-mixed batch system in whichthe initial drop volume distribution is the measured distribution ofthe coarse pre-emulsion, and each pass corresponds to one dimen-sionless time unit. Our particle size analyzer providedmeasurementsof the volume percent distribution np(v, t) rather than the numberdensity n(v, t) as in PBE model (1). Consequently, the PBE model wasreformulated in terms of volume percent distribution using the fol-lowing relation based on the assumption of spherical drops consis-tent with experiments:
n(v, t) = Vtotnp(v, t)v
(2)
where Vtot is the conserved total volume of the drops. Simple manip-ulations produced the following alternative form of the PBE model:
�np(v, t)�t
= −g(v)np(v, t) + v∫ ∞
0
g(v′)�(v′)�(v,v′)np(v′, t)v′ dv′ (3)
The PBE model (3) contains three breakage kernels (g(v),�(v,v′), �(v)) that must be specified to generate predictions. To ourknowledge, mechanistic functions are not available for the numberof drops formed upon breakage �(v) and the daughter drop distri-bution �(v,v′). Although the breakage of mother drops into multipledaughter drops has been reported by some investigators (Sathyagaland Ramkrishna, 1996; Vankova et al., 2007a; Tcholakova et al.,2007; Kostoglou and Karabelas, 2005), we have assumed binarybreakage such that �(v)=2 for simplicity and to examine the possiblelimitations of assuming that multiple breakage events can be mod-eled as a series of binary breakage events. We further assumed that�(v,v′) follows the truncated normal distribution such that breakagehas the highest probability of forming two equally sized daughterdrops (Soon et al., 2001; Maguire et al., 2003; Ruiz and Padilla,2004):
�(v,v′) = 2.4v′ exp
[−4.5
(2v − v′)2
(v′)2
](4)
We limited our consideration of the breakage rate g(v) to twomechanistic functions that explicitly depend on the physical prop-erties of the emulsion and allowed the resulting PBE models to ac-count for chemical composition variations. The first function g1(v)is a modified version of two previously proposed functions (Chenet al., 1998; Coulaloglou and Tavlarides, 1977) which were derivedassuming that breakage results from drop collision with turbulenteddies. Unlike the breakage function proposed by Chen et al. (1998),our function does not account for the small effect of the dispersedphase viscosity, but the breakage time tB is assumed to be dependenton drop volume rather than being constant:
tB = c1v2/9(
��d
)−1/3
(5)
The breakage function was specialized to high-pressure homogeniz-ers by using the following relation between the energy dissipationrate � and the homogenization pressure P (Becher, 1983a,b; Flouryet al., 2004a,b; Walstra, 1993):
� = c2P3/2v−1/3�−3/2d (6)
Following the procedure in Chen et al. (1998), the following breakagerate function was derived:
g1(v) = K1v−1/3P1/2�−1/2d exp
[−K2�(1 + �)2
v1/3P
](7)

2436 Neha B. Raikar et al. / Chemical Engineering Science 64 (2009) 2433 -- 2447
10−1 100 1010
1
2
3
4
5
6
Vol
%
1st pass2nd pass3rd pass4th pass5th passpre−emulsion
Diameter (μm)
Fig. 1. (a) Measured drop volume distributions for the base case conditions. Optical microscopy image at 20× magnification of (b) the pre-emulsion, (c) the homogenizedsample after the first pass, and (d) the homogenized sample after the fifth pass.
PE H10−1 H10−3 H10−5 H5−1 H5−3 H5−5
0.15
0.2
0.25
0.3
0.35
0.4
Sample ID
Sau
ter m
ean
diam
eter
d32
(μm
)
10−1 100 1010
1
2
3
4
5
6
Vol
%
H10K−1H10K−3H10K−5H5K−1H5K−3
Diameter (μm)
Fig. 2. Recoalescence test where the base case formulation was homogenized for six passes at 10000psig (labeled H10K-1 through H10K-6) and then homogenized for fivepasses at 5000psig (labeled as H5K-1 through H5K-5). (a) Sauter mean diameters d32. (b) Drop volume distributions.

Neha B. Raikar et al. / Chemical Engineering Science 64 (2009) 2433 -- 2447 2437
Contours of turbulenceIntensity %
1.00e+029.50e+019.00e+018.50e+018.00e+017.50e+017.00e+016.50e+016.00e+015.50e+015.00e+014.50e+014.00e+01
3.00e+01
2.00e+01
1.00e+01
0.00e+015.00e+01
1.50e+01
2.50e+01
3.50e+01
Fig. 3. Computational fluid dynamics simulation of the homogenizing valve gap showing contours of turbulence intensity (%) near the valve. The section of the homogenizingvalve is shown at the extreme left. The portion of the valve gap used for CFD calculation is shown in the center. Enlarged sections of the gap inlet, the middle part of thegap, and the gap outlet are shown on the right.
10−1 100 1010
0.5
1
1.5
2
2.5
3
Bre
akag
e R
ate
s−1
10−1 100 1010
1
2
3
4
5
6
Vol
%
exptalpredictedpre−emulsion
Ψ = 0.414
P
5
1
3
Diameter (μm) Diameter (μm)
Fig. 4. Base case parameter estimation results with the drop-eddy collision breakage function g1(v). (a) Breakage rate. (b) Predicted and experimental drop volume distributionsfor the pre-emulsion (P), the first pass (1), the third pass (3), and the fifth pass (5). is the objective function value.
where K1 and K2 are parameters determined from measured dropsize distributions (see below). Note that the breakage rate dependson the homogenizer pressure P and bulk emulsion properties in-cluding the dispersed phase volume fraction �, the dispersed phasedensity �d, and the interfacial tension �.
The second breakage rate function g2(v) accounts for drop break-age resulting from turbulent shear. The derivation shown in the Ap-
pendix produces the following functional form:
g2(v) = K3
(2
)1/2⎛⎝ P3/4
�1/2d �1/4
d v1/6
⎞⎠ exp
⎛⎝ −2K4�2�
�cP3/2�−1/2d v1/3
⎞⎠ (8)
where �=�d/�c and K3 and K4 are adjustable constants. In addition todepending on the same emulsion properties as g1(v), the turbulent

2438 Neha B. Raikar et al. / Chemical Engineering Science 64 (2009) 2433 -- 2447
10−1 100 1010
0.5
1
1.5
2
2.5
3
Bre
akag
e R
ate
s−1
10−1 100 1010
1
2
3
4
5
6
Vol
%
exptalpredictedpre−emulsion
P
1
Ψ = 0.4143
5
0
0.5
1
1.5
2
2.5
3
Bre
akag
e R
ate
s−1
0
1
2
3
4
5
Vo
l%
exptalpredictedpre−emulsionΨ = 0.202
P
1
3
5
Diameter μm Diameter (μm)
10−1 100 101 10−1 100 101
Diameter μm Diameter (μm)
Fig. 5. Base case parameter estimation results with the shear breakage function g2(v). (a) Breakage rate. (b) Predicted and experimental drop volume distributions. Base caseparameter estimation results with the combined breakage function g(v) = g1(v) + g2(v). (c) Breakage rate. (d) Predicted and experimental drop volume distributions.
shear function g2(v) also depends on the continuous phase viscosity�c and the dispersed phase viscosity �d.
A variety of numerical techniques have been developed for solv-ing PBE models of particulate processes (Kumar and Ramkrishna,1996; Ramkrishna, 2000; Dorao and Jakobsen, 2006; Gavi et al.,2008). In this study, the PBE model (3) was solved numericallyby approximating the integral expression using Simpson's rulewith 100 equally spaced node points. The resulting system of 100nonlinear ordinary differential equations describing the time evo-lution of the volume percent distribution at each node point wassolved using the Matlab integration code ode45. The measureddistribution of the coarse pre-emulsion was used as the initialcondition np(v, 0).
3.3. Parameter estimation
The constants K1–K4 in the breakage rate functions (7) and (8)were estimated from drop volume distribution measurements us-ing a systematic nonlinear optimization procedure rather than aninefficient trial-and-error procedure. The data available for param-eter estimation consisted of measured bulk emulsion properties(�,�,�d,�d,�c) and drop volume distribution measurements for thecoarse pre-emulsion n(v, 0) and the processed emulsion obtainedafter the ith homogenizer pass n(v, i). In addition to approximatingthe integral expression with Simpson's rule, the PBE model (3) wasspatially and temporally discretized to produce a large set of non-linear algebraic equations suitable for the application of constrainedoptimization codes. Spatial discretization in the volume space wasperformed using a finite difference approximation with 100 node
points. Temporal discretization was performed using orthogonalcollocation on finite elements where each pass corresponded toa single finite element and two internal collocation points wereemployed within each finite element. We found that additionalspatial node points, finite elements, and/or collocation points hada negligible effect on the parameter estimates but increased thecomputational effort significantly.
The parameter estimation problem was posed as the constrainedminimization of the following least-squares objective function:
=N∑i=1
n∑j=1
[n̂p(vj, i) − np(vj, i)]2
[np(vj, i)]2 (9)
where np(vj, i) is the measured value of the drop volume distributionat drop volume vj and homogenizer pass i, n̂p(vj, i) is correspond-ing predicted value from the PBE model (3), n is the total numberof spatial node points, and N is the number of passes. The objec-tive function was minimized subject to a large number of equalityconstraints representing the discretized model equations and con-tinuity conditions across the finite elements. The decision variablesin optimization problem were constants K1 and K2 if g(v) = g1(v),constants K3 and K4 if g(v) = g2(v), or the four constants K1–K4 ifg(v) = g1(v) + g2(v). The optimization problem was formulated inAMPL (Fourer et al., 2003) and solved using the nonlinear programcode CONOPT. For some cases, multiple data sets were used and theobjective function included a third sum over the data sets. Rela-tive values of the objective function were used to judge the qualityof model predictions.

Neha B. Raikar et al. / Chemical Engineering Science 64 (2009) 2433 -- 2447 2439
pe 1pass 2pass 3pass 4pass 5pass0
1
2
3
4
5
number of passespe 1pass 2pass 3pass 4pass 5pass
number of passes
pe 1pass 2pass 3pass 4pass 5passnumber of passes
pe 1pass 2pass 3pass 4pass 5passnumber of passes
Mea
n di
amet
er (d
43)
φ = 2.78e−03φ = 5.59e−03φ = 0.0112φ = 0.0228
0
1
2
3
4
5
Mea
n di
amet
er (d
43)
0
1
2
3
4
5
Mea
n di
amet
er (d
43)
0
1
2
3
4
5
Mea
n di
amet
er (d
43)
σ = 14.318 mN/mσ = 13.68 mN/mσ = 13.056 mN/mσ = 12.68 mN/m
φ = 2.78e−03φ = 5.59e−03φ = 0.0112φ = 0.0228
σ = 14.318 mN/mσ = 13.68 mN/mσ = 13.056 mN/mσ = 12.68 mN/m
Fig. 6. Effect of dispersed phase volume fraction and interfacial tension on the experimental and predicted mean diameters. (a) Experimental mean diameters d43 forchanges in dispersed phase volume fraction. (b) Predicted mean diameters d43 using base case values for changes in dispersed phase volume fraction. (c) Experimental meandiameters d43 for changes in interfacial tension. (d) Predicted mean diameters d43 using base case values for changes in interfacial tension.
4. Results and discussion
4.1. Homogenized drop volume distributions
We prepared five sample emulsions at the base case conditions(Table 1), performed five homogenization passes for each sample,and measured the drop volume distribution after each pass foreach sample to analyze data reproducibility. The maximum stan-dard deviation in the measured drop size distribution based onfive repeats for any pass was about 9%, indicating that the exper-imental procedure and the distribution measurements were quitereproducible.
Fig. 1(a) shows a representative set of drop distribution measure-ments for the base case conditions. The pre-emulsion produced abimodal distribution with the two peaks exhibiting large differencesin drop diameter. Successive homogenizer passes had the effect ofreducing the volume percentage of large drops, increasing the per-centage of small drops, and sharpening the two peaks. The peakdiameter of larger drops was noticeably reduced with successivepasses, while the peak diameter of smaller drops remained roughlyconstant. Each pass produced a smaller relative change in the dis-tribution, indicating that the breakage rate decreased with decreas-ing drop size. Fig. 1(b)–(d) show optical microscopy images at 20×magnification of the pre-emulsion, the first pass, and the fifth pass,respectively. The images were consistent with the measured dropdistributions, with subsequent passes producing a larger fractionof small drops and all three samples having a noticeable bimodalnature.
4.2. Recoalescence test
The PBE model (3) used in this study is based on the assump-tion of negligible drop coalescence in the homogenizer. The termrecoalescence is used to denote coalescence occurring in the ho-mogenizer from newly formed drops. While the base case emulsion(Table 1) was formulated to have a low dispersed phase volume frac-tion and a high surfactant concentration to minimize recoalescence,we performed a targeted experiment to test this assumption. A basecase emulsion was prepared and successively homogenized for sixpasses at 10000psig (68.95MPa) until the Sauter mean diameter anddrop distribution remained approximately constant, at which timethe rates of drop breakage and drop coalescence (if present) wereexpected to be equal. The sample obtained after the sixth pass at10000psig was reprocessed with five additional passes at 5000psig(34.47MPa), which was expected to produce a reduced breakage rateand an increased coalescence rate if significant recoalescence wasoccurring. If the mean diameter and drop volume distribution re-mained approximately constant after successive passes at 5000psig,then the coalescence rate was judged to be negligible relative to thebreakage rate.
Fig. 2a and b shows the results of this experiment, with thesix passes at 10000psig (68.95MPa) labeled H10K-1–H10K-6 andthe five passes at 5000psig labeled H5K-1–H5K-5. Convergence ofthe Sauter mean diameters and the drop distributions support theassumption of negligible coalescence at the base case condition.While this assumption was not validated for the other conditionsstudied, we were confident that the coalescence rate remained

2440 Neha B. Raikar et al. / Chemical Engineering Science 64 (2009) 2433 -- 2447
pe 1pass 2pass 3pass 4pass 5pass0
1
2
3
4
5
number of passespe 1pass 2pass 3pass 4pass 5pass
number of passes
pe 1pass 2pass 3pass 4pass 5passnumber of passes
pe 1pass 2pass 3pass 4pass 5passnumber of passes
Mea
n di
amet
er (d
43)
0
1
2
3
4
5
Mea
n di
amet
er (d
43)
0
1
2
3
4
5
Mea
n di
amet
er (d
43)
0
1
2
3
4
5
Mea
n di
amet
er (d
43)
ηc = 1cPηc = 1.095cPηc = 1.195cPηc = 1.3cP
P = 5000 PsiP = 10000 PsiP = 15000 PsiP = 20000 Psi
P = 5000 PsiP = 10000 PsiP = 15000 PsiP = 20000 Psi
ηc = 1cPηc = 1.095cPηc = 1.195cPηc = 1.3cP
Fig. 7. Effect of continuous phase viscosity and pressure on the experimental and predicted mean diameters. (a) Experimental mean diameters d43 for changes in continuousphase viscosity. (b) Predicted mean diameters d43 using base case values for changes in continuous phase viscosity. (c) Experimental mean diameters d43 for changes inpressure. (d) Predicted mean diameters d43 using base case values for changes in pressure.
small. We also calculated the theoretical surface load from mea-sured values of the interfacial tension versus surfactant concentra-tion. The ratio of the adsorption to collision time scale (Walstra,2003) shown below provides a qualitative measure of the extent ofrecoalescence
�ads�coll
= 6 �dCs
(10)
where is the surface load and Cs is surfactant concentration. Fornegligible recoalescence, the ratio of �ads/�coll should be less than 1.At our base case conditions this ratio was in the range of 0.15–0.3,further indicating that recoalescence is negligible.
4.3. Computational fluid dynamics
Fig. 3 shows CFD results for the homogenizing valve and the trun-cated section near the valve that constituted the domain for flowfield calculations. Although not included in our simple PBE model,the CFD calculations indicated strong spatial heterogeneities overthe homogenizer domain. The contours demonstrated that the tur-bulence intensity was large in and at the exit of the valve gap andcomparatively small elsewhere. Reynolds numbers in the range of2000–4000 were calculated for most of the gap section, indicatingthe presence of a turbulent flow field. These results suggested thatturbulence is an important mechanisms for drop breakage in the gapregion and provided a mechanistic basis to apply the breakage ratefunctions (7) and (8) to our system.
4.4. Base case parameter estimation
We performed parameter estimation for the base case emul-sion (Table 1) to better understand the relevant mechanisms fordrop breakage. First parameter estimation was performed using thebreakage rate function g1(v) (7) derived under the assumption thatbreakage results from drop collisionwith turbulent eddies. Measureddrop volume distributions for the pre-emulsion and for the five pro-cessed emulsions sampled after each pass were used to estimate theunknown constant K1 and K2. Fig. 4(a) shows the resulting depen-dence of g1(v) on the drop diameter. The breakage function exhib-ited a maximum rate at a drop diameter of approximately 5�m,suggesting reduced breakage for very large drops, and small break-age rates below 1�m, indicating negligible breakage of small drops.The corresponding drop distribution predictions are shown inFig. 4(b) along with the objective function value . The parameter-ized PBE model generated poor predictions, with the peak for largerdrops poorly tracked and themovement of the peak for smaller dropsnot captured whatsoever due to the negligible breakage rates pre-dicted at small drop sizes. The decreasing breakage rate above 5�mappeared to have a relatively small effect on drop distribution predic-tions as the model emulsions had only a small number of such largedrops.
Next parameter estimation was performed to determine con-stants K3 and K4 of the breakage rate function g2(v) (8) derived underthe assumption that turbulent shear was the primary mechanismfor drop breakage. The results (Fig. 5(a) and (b)) were very similarto those obtained for the other breakage function. The optimizer de-termined that the objective function was minimized by placing

Neha B. Raikar et al. / Chemical Engineering Science 64 (2009) 2433 -- 2447 2441
10−10
1
2
3
4
5
6
Vol
%
exptalpredictedpre−emulsion
P
Ψ = 0.251
φ = 2.78e−03
1
3
5
exptalpredictedpre−emulsion
P
Ψ = 0.269
φ = 2.78e−03
13
5
0
1
2
3
4
5
6
Vol
%
0
1
2
3
4
5
6
Vol
%
0
1
2
3
4
5
6
Vol
%
exptalpredictedpre−emulsionΨ = 0.336
P
1
5
3
φ = 0.0112exptalpredictedpre−emulsion
Ψ = 0.142
φ = 0.0112
1
35
P
Diameter (μm)101100 10−1
Diameter (μm)101100
10−1
Diameter (μm)101100 10−1
Diameter (μm)101100
Fig. 8. Effect of the dispersed phase volume fraction on predicted drop volume distributions with the combined breakage function g(v) for the pre-emulsion (P), thefirst pass (1), the third pass (3), and the fifth pass (5). is the objective function value. The base case values were used for the adjustable breakage parameters K1–K4.(a) � = 2.78 × 10⁻³. (c) � = 0.0112. The parameters K1–K4 were re-estimated using a combined data set containing the dispersed phase volume fraction variations. (b)� = 2.78 × 10⁻³. (d) � = 0.0112.
the breakage rate peak at a relatively large drop diameter due to thegreater contribution of the large drop region to . As a result, verylittle breakage of small drops was predicted and the experimentallyobserved movement of the smaller drop peak could not be tracked.These results demonstrated that neither of two breakage rate func-tions alone could capture experimentally observed trends and sug-gested that some relevant physics were not modeled.
Although the large deviations observed between experimentaland predicted drop distributions could be attributed to other fac-tors, we investigated the possibility that the two turbulent breakagemechanisms were simultaneously active. For this case, the breakagerate function g(v)= g1(v)+ g2(v) and the four constants K1–K4 wereestimated. We found that the optimizer could converge to two lo-cally optimal solutions that produced identical values dependingon the initial parameter guesses. Each solution produced a slightlybimodal breakage function, with the first peak for small drops cor-responding to one function and the second peak for large drops cor-responding to the other function. The solutions differed accordingto which function corresponded to which peak. Based on timescalearguments presented in Appendix B, we determined that the morephysically meaningful solution was g1(v) representing the first peakand g2(v) representing the second peak (Fig. 5(c)). The combinedbreakage function produced much closer agreement to the experi-mental data (Fig. 5(d)) than either function alone, as reflected by thesmaller value (0.202 versus 0.414 in Fig. 4(b)). The movement ofboth peaks in the drop distribution was qualitatively captured, al-though noticeable differences between the measured and predicted
distributions remained. We judged these base case modeling resultsto be acceptable.
4.5. PBE model extensibility
We sought to investigate the extensibility of the PBE model withthe combined breakage rate function to conditions other than thebase case. The dispersed phase volume fraction (�), the interfacialtension (�), the continuous phase viscosity (�c), and the homoge-nizer pressure (P) were varied from their base case values (Table 1)to determine if K1–K4 values estimated from the base case data couldproduce satisfactory drop distribution predictions over a range ofconditions. For each case, the four parameters were also re-estimatedfrom a combined data set that included variations in the associatedemulsion property or the homogenizer pressure to determine if im-proved predictions could be generated.
First we compared experimental and predicted values of the DeBrouckere mean moment diameter d43 (McClements, 2005) to de-termine if the PBE model could capture the general trends observedexperimentally. The mean diameter d43, which is defined as the ra-tio of the fourth moment over the third moment of the drop distri-bution, provides a meaningful scalar measure of the mean diameterfor the bimodal distributions observed in our data sets. To investi-gate the effect of the dispersed phase volume fraction (�), the oilconcentration was reduced by 50% (� = 2.78 × 10⁻³) and increasedby 200% (� = 0.0112) and 400% (� = 0.0228) from the base case
2442 Neha B. Raikar et al. / Chemical Engineering Science 64 (2009) 2433 -- 2447
10−10
1
2
3
4
5
6
Vol
%
0
1
2
3
4
5
6
Vol
%
0
1
2
3
4
5
6
Vol
%
0
1
2
3
4
5
6
Vol
%
Diameter (μm)101100 10−1
Diameter (μm)101100
10−1
Diameter (μm)101100 10−1
Diameter (μm)101100
exptalpredictedpre−emulsion
Ψ = 0.384
14.318 mN/m
13
5
P
exptalpredictedpre−emulsion
P
Ψ = 0.331
14.318mM/m
5
31
3
5
P
exptalpredictedpre−emulsion
13.056 mN/m
1
exptalpredictedpre−emulsion
P
1
3
5
Ψ = 0.196
13.056 mN/m
Ψ = 0.260
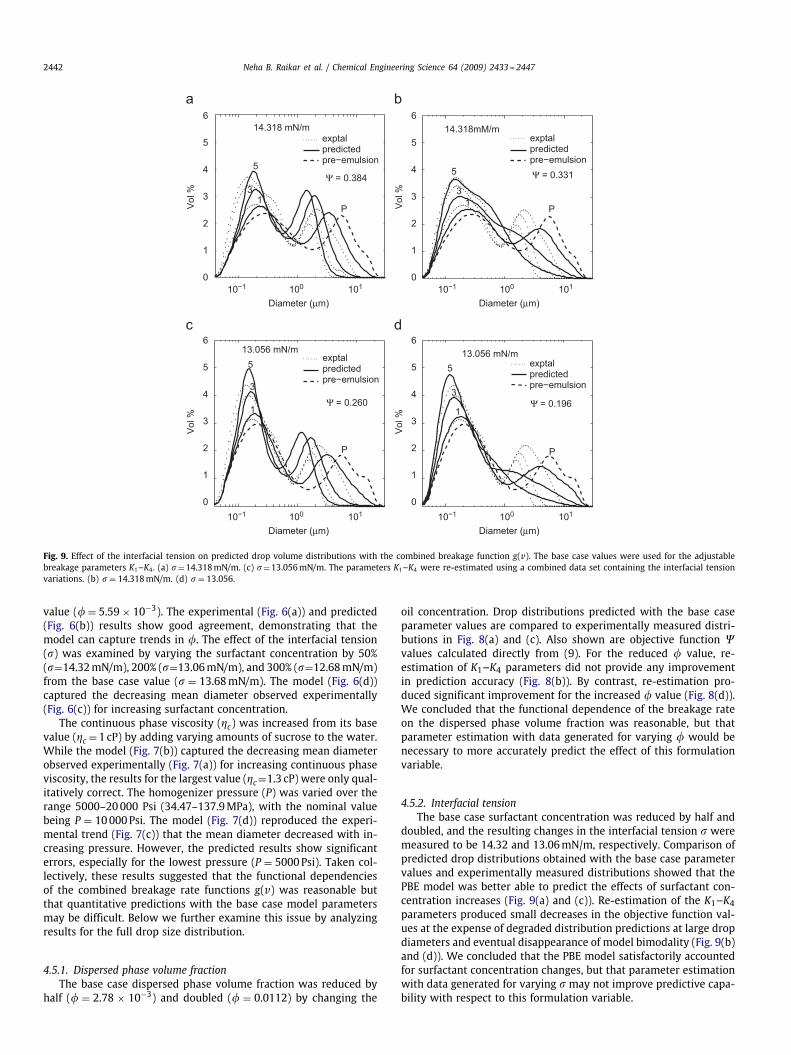
Fig. 9. Effect of the interfacial tension on predicted drop volume distributions with the combined breakage function g(v). The base case values were used for the adjustablebreakage parameters K1–K4. (a) �=14.318mN/m. (c) �=13.056mN/m. The parameters K1–K4 were re-estimated using a combined data set containing the interfacial tensionvariations. (b) � = 14.318mN/m. (d) � = 13.056.
value (� = 5.59 × 10⁻³). The experimental (Fig. 6(a)) and predicted(Fig. 6(b)) results show good agreement, demonstrating that themodel can capture trends in �. The effect of the interfacial tension(�) was examined by varying the surfactant concentration by 50%(�=14.32mN/m), 200% (�=13.06mN/m), and 300% (�=12.68mN/m)from the base case value (� = 13.68mN/m). The model (Fig. 6(d))captured the decreasing mean diameter observed experimentally(Fig. 6(c)) for increasing surfactant concentration.
The continuous phase viscosity (�c) was increased from its basevalue (�c =1 cP) by adding varying amounts of sucrose to the water.While the model (Fig. 7(b)) captured the decreasing mean diameterobserved experimentally (Fig. 7(a)) for increasing continuous phaseviscosity, the results for the largest value (�c=1.3 cP) were only qual-itatively correct. The homogenizer pressure (P) was varied over therange 5000–20000 Psi (34.47–137.9MPa), with the nominal valuebeing P = 10000Psi. The model (Fig. 7(d)) reproduced the experi-mental trend (Fig. 7(c)) that the mean diameter decreased with in-creasing pressure. However, the predicted results show significanterrors, especially for the lowest pressure (P = 5000Psi). Taken col-lectively, these results suggested that the functional dependenciesof the combined breakage rate functions g(v) was reasonable butthat quantitative predictions with the base case model parametersmay be difficult. Below we further examine this issue by analyzingresults for the full drop size distribution.
4.5.1. Dispersed phase volume fractionThe base case dispersed phase volume fraction was reduced by
half (� = 2.78 × 10⁻³) and doubled (� = 0.0112) by changing the
oil concentration. Drop distributions predicted with the base caseparameter values are compared to experimentally measured distri-butions in Fig. 8(a) and (c). Also shown are objective function values calculated directly from (9). For the reduced � value, re-estimation of K1–K4 parameters did not provide any improvementin prediction accuracy (Fig. 8(b)). By contrast, re-estimation pro-duced significant improvement for the increased � value (Fig. 8(d)).We concluded that the functional dependence of the breakage rateon the dispersed phase volume fraction was reasonable, but thatparameter estimation with data generated for varying � would benecessary to more accurately predict the effect of this formulationvariable.
4.5.2. Interfacial tensionThe base case surfactant concentration was reduced by half and
doubled, and the resulting changes in the interfacial tension � weremeasured to be 14.32 and 13.06mN/m, respectively. Comparison ofpredicted drop distributions obtained with the base case parametervalues and experimentally measured distributions showed that thePBE model was better able to predict the effects of surfactant con-centration increases (Fig. 9(a) and (c)). Re-estimation of the K1–K4parameters produced small decreases in the objective function val-ues at the expense of degraded distribution predictions at large dropdiameters and eventual disappearance of model bimodality (Fig. 9(b)and (d)). We concluded that the PBE model satisfactorily accountedfor surfactant concentration changes, but that parameter estimationwith data generated for varying � may not improve predictive capa-bility with respect to this formulation variable.

Neha B. Raikar et al. / Chemical Engineering Science 64 (2009) 2433 -- 2447 2443
10−10
1
2
3
4
5
6
Vol
%
0
1
2
3
4
5
6
Vol
%
0
1
2
3
4
5
6
Vol
%
0
1
2
3
4
5
6
Vol
%
Diameter (μm)101100 10−1
Diameter (μm)101100
10−1
Diameter (μm)101100 10−1
Diameter (μm)101100
1.09cPexptalpredictedpre−emulsion
P
1
5
3
exptalpredictedpre−emulsion
P
1
3
5
1.09cP
exptalpredictedpre−emulsion
1.195cP
1
5
3
P
exptalpredictedpre−emulsion
1.195cP
1
3
5
P
Ψ = 0.491 Ψ = 0.273
Ψ = 0.138Ψ = 0.392
Fig. 10. Effect of the continuous phase viscosity on predicted drop volume distributions with the combined breakage function g(v). The base case values were used forthe adjustable breakage parameters K1–K4. (a) �c = 1.09 cP. (c) �c = 1.195 cP. The parameters K1–K4 were re-estimated using a combined data set containing the continuousphase viscosity variations. (b) �c = 1.09 cP. (d) �c = 1.195 cP.
10−1 100 1010
1
2
3
4
5
6
Vol
%
exptal
predicted
pre−emulsion
5
3
1
P
0
1
2
3
4
5
6
Vol
%
exptal
predicted
pre−emulsion
1
5
P
3
Diameter (μm)10−1 100 101
Diameter (μm)
Ψ = 0.192
φ = 2.78e−03, σ = 13.08mN/m, ηc1.3cP
Ψ = 0.321
φ = 2.78e−03, σ = 13.08 mN/m, ηc = 1.3cP
Fig. 11. Effect of simultaneous changes in the dispersed phase volume fraction, interfacial tension, and continuous phase viscosity with the combined breakage functiong(v). (a) The base case values were used for the adjustable breakage parameters K1–K4. (b) The parameters K1–K4 were re-estimated using a combined data set containingvariations in the three formulation variables.

2444 Neha B. Raikar et al. / Chemical Engineering Science 64 (2009) 2433 -- 2447
10−1 100 1010
1
2
3
4
5
6
Vol
%
P
exptalpredictedpre−emulsion
5000Psi
135
5000Psi
P13
5
exptalpredictedpre−emulsion
0
1
2
3
4
5
6
Vol
%
0
1
2
3
4
5
6
Vol
%
0
1
2
3
4
5
6
Vol
%exptalpredictedpre−emulsion
P1
3
5 15000Psi 15000Psi
5
3
1P
exptalpredictedpre−emulsion
Diameter (μm)10−1 100 101
Diameter (μm)
10−1 100 101
Diameter (μm)10−1 100 101
Diameter (μm)
Ψ = 1.287 Ψ = 0.991
Ψ = 0.355Ψ = 0.583
Fig. 12. Effect of the homogenization pressure on predicted drop volume distributions with the combined breakage function g(v). The base case values were used for theadjustable breakage parameters K1–K4. (a) P = 5000psig (34.47MPa). (c) P = 15000psig (103.42MPa). The parameters K1–K4 were re-estimated using a combined data setcontaining the pressure variations. (b) P = 5000psig (34.47MPa). (d) P = 15000psig (103.42MPa).
4.5.3. Continuous phase viscosityThe continuous phase viscosity �c was changed by adding vary-
ing amounts of sucrose to nanopure water used for emulsion prepa-ration. Moderate and large additions of sucrose produced increasedcontinuous phase viscosities of 1.09 and 1.195 cP, respectively, com-pared to the base case. The large sucrose addition also produced aslight change in interfacial tension, which was incorporated withinthe breakage rate function. Predicted drop distributions obtainedwith the base case parameter values are compared to experimentallymeasured distributions in Fig. 10(a) and (c). As measured by relativeobjective function values, the PBE model predictions showed largerdeviations from data than observed for � and � variations. However,significantly improved predictions were obtained when K1–K4 pa-rameters were re-estimated (Fig. 10(b) and (d)). We concluded thatthe functional dependence of the breakage rate on the continuousphase viscosity was reasonable, but that parameter estimation withdata generated for varying �c would be necessary to satisfactorilypredict the effect of this formulation variable.
4.5.4. Multiple formulation variablesRational design of emulsified products will require models capa-
ble of predicting the coupled effects of multiple formulation vari-ables. To this end, we performed additional experiments in which thedispersed phase volume fraction, interfacial tension, and continuous
phase viscosity were changed simultaneously from their base casevalues. Predicted drop distributions obtained with the base case pa-rameter values are compared to experimentally measured distribu-tions for a representative case in Fig. 11(a). The PBE model capturedmost of the qualitative trends with the exception of the predicteddistributions approaching unimodality more quickly than the mea-sured distributions. Re-estimation of K1–K4 parameters with a com-bined data set in which all the formulation variables were changedsimultaneously produced a significant decrease in the objective func-tion value (Fig. 11(b)), but the predicted distributions become uni-modal even more rapidly than with the base case parameters. Weconcluded that the PBE model was capable of capturing the coupledeffects of multiple formulation variables given an appropriate dataset for parameter estimation.
4.5.5. Homogenization pressureThe homogenization pressure P was lowered to 5000psig
(34.47MPa) and increased to 15000psig (103.42MPa) from the basecase value. Comparison of predicted drop distributions obtainedwith the base case parameter values and experimentally measureddistributions showed that the PBE model was not able to satisfac-torily capture pressure variations (Fig. 12(a) and (c)). Moreover,re-estimation of K1–K4 parameters with a combined data set inwhich the pressure was varied did not substantially improve the

Neha B. Raikar et al. / Chemical Engineering Science 64 (2009) 2433 -- 2447 2445
model predictions (Fig. 12(b) and (d)). These results suggest that thepressure dependence of the energy dissipation rate (6) was incor-rect. However, additional parameter estimation tests in which thepressure exponent in (6) was considered to be another adjustableparameter did not significantly improve the model predictions (notshown).
We believe that our CFD study may provide insights into thismodel deficiency. The turbulence intensity contours in Fig. 3 showstrong spatial heterogeneities over the homogenizer domain, whilethe PBE model treats the homogenizer as a well-mixed system. Sim-ilar heterogeneities were observed in the pressure contours (notshown), with a large pressure drop from the valve gap inlet to theoutlet. Accordingly, the assumption of a single homogenizer pres-sure is questionable and improved predictions over large pressureranges may require the incorporation of spatial heterogeneities intothe PBE model (Maguire et al., 2003).
5. Conclusion
We believe that the PBE modeling approach presented in thispaper represents a necessary first step towards addressing the emul-sion design problem for homogenized products. By invoking assump-tions such as negligible drop coalescence, binary drop breakage, andhomogeneous flow fields in the homogenizer, we investigated theability of a simplified PBE model to match experimental data. Dropbreakage functions that depend explicitly on formulation and pro-cessing variableswere used such that the PBEmodel has the potentialto reproduce qualitative trends in the drop volume distribution thatresult when these variable are changed. Consequently, the modelcan be used to predict the effects of different formulation propertiesbefore performing the associated experiments. This capability willnot only allow new formulations to be identified but also will en-able unacceptable solutions to be eliminated more rapidly and withless experimental effort. The current version of our PBE model doesnot adequately describe the effects of the homogenization pressure.Our future work will focus on better capturing the pressure effect,relaxing the assumption of binary breakage, including mechanisticdescriptions of drop coalescence, and combining predicted drop dis-tributions with physical property estimation techniques to allow theprediction of end-use characteristics.
Notation
c1, c2 constantsCa capillary numberCac critical capillary numberCs surfactant concentration, mgm−3
d drop diameter, mg(v) breakage rate of drops of size v, s−1
G shear rate, s−1
Gb critical shear rate, s−1
K1, K2, K3, K4 adjustable parameters in breakage rate func-tion g(v)
n number of node pointsNcp number of collocation pointsn(v, t) number of drops with size v per unit volume
of the dispersion at time tnp(v, t) volume percent distribution of drops of size
v at time tn̂p(vj, i) predicted volume percent distribution of drop
of size vj at ith passN number of passesP operating pressure, Pat time, stB breakage time, s
�u rms velocity difference, ms−1
v volume of drops, m3
Vtot total volume of drops, m3
Greek symbols
�(v,v′) probability density function for daughterdrops
surface load of the surfactant,mgm−2
� local energy dissipation per unit volume,kgm−1 s3
�c viscosity of continuous phase, Pa s�d viscosity of dispersed phase, Pa s� viscosity ratio�(v′) number of daughter drops formed by break-
age of a drop of size v′
�d density of dispersed phase, kgm−3
�c density of continuous phase, kgm−3
� interfacial tension, Nm−1
� volume fraction of the dispersed phase objective function defined in Eq. (9)
Subscripts
c continuous phased dispersed phase
Acknowledgments
We acknowledge financial support from the Petroleum ResearchFund (Grant no. 44526-AC9), the National Science Foundation (Grantnos. 0730795 and DMI-0531171), and Unilever Foods. We would liketo thank Prof. David Julian McClements (UMass Food Science) forproviding access to particle size analyzers in his laboratory and toProf. David Schmidt (UMass Mechanical and Industrial Engineering)for providing access to Fluent.
Appendix A. Derivation of the breakage rate function g2(v)
The breakage rate is considered to be exponentially distributedas described by (Wang et al., 2005)
g(d) =(2
)1/2 �udi
exp
(−�u2b�u2
)(11)
where �u is the rms velocity difference across distance di, and �ubis the critical velocity difference at which drop breakage occurs. Thelocal shear rate is approximated as
G = �udi
(12)
Substituting for �u and �ub yields
g(d) =(2
)1/2
G exp
(−G2b
G2
)(13)
where Gb is the critical shear rate that causes drop breakup. TheCapillary number (Ca) for a drop of diameter d is given as
Cad = �cGd2�
(14)
where �c is the continuous phase viscosity, and � is the interfacialtension. If Cad > Cac (the critical capillary number), the drop is unsta-ble and will eventually break. The critical shear rate can be writtenin terms of the critical capillary number Cac as (Dhingra, 2001)
Gb = 2Cac��cd
(15)

2446 Neha B. Raikar et al. / Chemical Engineering Science 64 (2009) 2433 -- 2447
Therefore, the breakage rate can be written as
g(d) =(2
)1/2
G exp
(−(2Cac�)2
(�cGd)2
)(16)
For turbulent flow, G can be related to energy dissipation rate �and the kinematic viscosity � (Marchisio et al., 2006; Wang et al.,2005). The resulting expression based on dispersed phase propertiesis
G =√
��
=√
��d
�d(17)
Substituting for G in the breakage rate yields
g(d) =(2
)1/2( ��d
�d
)1/2
exp
(−(2Cac�)2�(�cd2��d)
)(18)
where � = �d/�c is viscosity ratio. Expressing � in terms of pressureyields the final result
� = c1d
(P�d
)3/2
(19)
g(v) = g2(v) = K3
(2
)1/2⎛⎝ P3/4
�1/2d �1/4
d v1/6
⎞⎠ exp
⎛⎝ −c2(2Cac�)
2�
�cP3/2�−1/2d v1/3
⎞⎠(20)
This function depends on the pressure P, interfacial tension �, dis-persed phase density �d, continuous phase viscosity �c, dispersedphase viscosity �d, and the critical capillary number Cac. The criticalcapillary number is expected to depend on the viscosity ratio andthe type of flow (Gupta, 2004; Koper, 2007). However, for turbulentviscous flows the dependance on the viscosity ratio is not strong.Therefore, we invoke the assumption that Cac is constant and incor-porate Cac into the adjustable constant K4.
g(v) = g2(v) = K3
(2
)1/2⎛⎝ P3/4
�1/2d �1/4
d v1/6
⎞⎠ exp
⎛⎝ −2K4�2�
�cP3/2�−1/2d v1/3
⎞⎠(21)
Appendix B. Appendix B
From turbulence theory, drops can break by collisions with tur-bulent eddies (function g1) or due to viscous stress (function g2). Thesize of the smallest eddy is given by (Hinze, 1955; Walstra, 1993,2005; Vankova et al., 2007a; McClements, 2005)
�0 ≈ �−1/4�3/4c �−1/2
c (22)
where � is the energy dissipation rate per unit volume of fluid. Themaximum stable drop size in the inertial turbulent regime is givenby
di ≈ �3/5�−2/5�−1/5c (23)
For the case of shear or viscous turbulent flow, the maximum stabledrop diameter is
dv ≈ ��−1/2�−1/2c (24)
For our base case conditions dv ≈ �0 ≈ di, which implies that bothinertial and viscous forces are important (Vankova et al., 2007a).
The deformation time scale is given by (Walstra, 1993, 2005)
tdef ≈ �d
C�1/3c �2/3d2/3 − 4�/d
(25)
The lifetime of the eddy is
teddy ≈ �1/3c d2/3
�1/3(26)
Because the deformation time is smaller than eddy lifetime for mostof the size range considered, drops can be broken by inertial forcesand viscous forces. Therefore, either function could be used to de-scribe breakage at small drop sizes. Because dv was larger than di, weused the turbulent eddy function (g1) to describe breakup of smalldrops and turbulent shear function (g2) to describe breakup of largedrops.
References
Alopaeus, V., Koskinen, J., Keskinen, K., Majander, J., 2002. Simulation of thepopulation balances for liquid–liquid systems in a nonideal stirred tank. Part2—parameter fitting and the use of the multiblock model for dense dispersions.Chemical Engineering Science 57 (10), 1815–1825.
Becher, P., 1983a. Encyclopedia of Emulsion Technology, vol. I. Marcel Dekker, NewYork, NY.
Becher, P., 1983b. Encyclopedia of Emulsion Technology, vol. II. Marcel Dekker, NewYork, NY.
Becher, P., 2001. Emulsions: Theory and Practice. Oxford University Press, New York,NY.
Canu, P., 2005. Prediction of multimodal distributions in breakage processes.Industrial & Engineering Chemistry Research 44 (8), 2649–2658.
Chappat, M., 1994. Some applications of emulsions. Colloids and SurfacesA—Physicochemical and Engineering Aspects 91, 57–77.
Chen, Z., Pruss, J., Warnecke, H., 1998. A population balance model for dispersesystems: drop size distribution in emulsion. Chemical Engineering Science 53(5), 1059–1066.
Coulaloglou, C., Tavlarides, L., 1977. Description of interaction processes in agitatedliquid–liquid dispersions. Chemical Engineering Science 32 (11), 1289–1297.
Dhingra, D., 2001. Feasible drop sizes in laminar emulsification systems. Master'sThesis, University of Massachusetts Amherst.
Dorao, C., Jakobsen, H., 2006. Numerical calculation of the moments of the populationbalance equation. Journal of Computational and Applied Mathematics 196 (2),619–633.
Floury, J., Bellettre, J., Legrand, J., Desrumaux, A., 2004a. Analysis of a new type ofhigh pressure homogeniser: a study of the flow pattern. Chemical EngineeringScience 59 (4), 843–853.
Floury, J., Legrand, J., Desrumaux, A., 2004b. Analysis of a new type of high pressurehomogeniser: part B: study of droplet break-up and recoalescence phenomena.Chemical Engineering Science 59 (6), 1285–1294.
Fourer, R., Gay, D.M., Kernighan, B.W., 2003. AMPL: A Modeling Language forMathematical Programming. Brooks/Cole Publishing Company, Pacific Grove, CA.
Fluent Users Guide, 2005. Version 6.2. Fluent Inc, Lebanon, NH.Gavi, E., Marchisio, D., Barresi, A., 2008. On the importance of mixing for the
production of nanoparticles. Journal of Dispersion Science and Technology 29(4), 548–554.
Gupta, S., 2004. Structured liquid products: emulsification process design forviscoelastic liquids. Master's Thesis, University of Massachusetts Amherst.
Hinze, J., 1955. Fundamentals of the hydrodynamic mechanism of splitting indispersion processes. A.I.Ch.E. Journal 1 (3), 289–295.
Israelachvili, J., 1994. The science and applications of emulsions—An overview.Colloids and Surfaces A—Physicochemical and Engineering Aspects 91, 1–8.
Jaworski, Z., Pianko-Oprych, P., Marchisio, D., Nienow, A., 2007. CFD modellingof turbulent drop breakage in a kenics static mixer and comparison withexperimental data. Chemical Engineering Research & Design 85, 753–759.
Kelly, W., Muske, K., 2004. Optimal operation of high-pressure homogenization forintracellular product recovery. Bioprocess and Biosystems Engineering 27 (1),25–37.
Kim, J., Kramer, T., 2006. Improved orthokinetic coagulation model for fractal colloids:aggregation and breakup. Chemical Engineering Science 61 (1), 45–53.
Koper, G.J.M., 2007. An introduction to Interfacial Engineering. VSSD,Leeghwaterstraat, Delft, Netherlands.
Kostoglou, M., Karabelas, A., 2005. Toward a unified framework for the derivationof breakage functions based on the statistical theory of turbulence. ChemicalEngineering Science 60 (23), 6584–6595.
Kumar, S., Ramkrishna, D., 1996. On the solution of population balance equationsby discretization 1. A fixed pivot technique. Chemical Engineering Science 51(8), 1311–1332.
Lander, R., Manger, W., Scouloudis, M., Ku, A., Davis, C., Lee, A., 2000. Gaulinhomogenization: a mechanistic study. Biotechnology Progress 16 (1), 80–85.
Maguire, L., Zhang, H., Shamlou, P., 2003. Preparation of small unilamellar vesicles(SUV) and biophysical characterization of their complexes with poly-l-lysine-condensed plasmid DNA. Biotechnology and Applied Biochemistry 37, 73–81.
Marchisio, D., Soos, M., Sefcik, J., Morbidelli, M., 2006. Role of turbulent shearrate distribution in aggregation and breakage processes. A.I.Ch.E. Journal 52 (1),158–173.
McClements, D.J., 2005. Food Emulsions: Principles, Practice, and Techniques. CRCPress, Boca Raton, FL.

Neha B. Raikar et al. / Chemical Engineering Science 64 (2009) 2433 -- 2447 2447
Miller, J., Rogowski, M., Kelly, W., 2002. Using a CFD model to understand thefluid dynamics promoting e-coli breakage in a high-pressure homogenizer.Biotechnology Progress 18 (5), 1060–1067.
Nasr-El-Din, H.A., 1992. Fluid Dynamics in Oil–Water–Sand Systems in Emulsions:Fundamentals and Applications in the Petroleum Industry. American ChemicalSociety, Washington, DC.
Pal, R., Yan, Y., Masliyah, J., 1992. Rheology of Emulsions, in Emulsions: Fundamentalsand Applications in the Petroleum Industry. American Chemical Society,Washington, DC.
Raikar, N.B., Bhatia, S.R., Malone, M.F., Henson, M.A., 2006. Self-similar inversepopulation balance modeling for turbulently prepared batch emulsions:sensitivity to measurement errors. Chemical Engineering Science 61 (22),7421–7435.
Ramkrishna, D., 2000. Population Balances: Theory and Applications to ParticulateProcesses in Engineering. Academic Press, New York, NY.
Rimmer, D.P., Gregoli, A.A., Hamshar, J.A., Yildirim, E., 1992. Pipeline EmulsionTransportation for Heavy Oils, in Emulsions: Fundamentals and Applications inthe Petroleum Industry. American Chemical Society, Washington, DC.
Ruiz, M., Padilla, R., 2004. Analysis of breakage functions for liquid–liquid dispersions.Hydrometallurgy 72 (3–4), 245–258.
Saniere, A., Henaut, I., Argillier, J., 2004. Pipeline transportation of heavy oils,a strategic, economic and technological challenge. Oil and Gas Science andTechnology—Revue De L Institut Francais Du PetrolE 59 (5), 455–466.
Sathyagal, A., Ramkrishna, D., 1996. Droplet breakage in stirred dispersions: breakagefunctions from experimental drop-size distributions. Chemical EngineeringScience 51 (9), 1377–1391.
Sathyagal, A., Ramkrishna, D., Narsimhan, G., 1995. Solution of inverse problems inpopulation balances 2: particle break-up. Computers and Chemical Engineering19 (4), 437–451.
Schramm, L.L., 1992. Petroleum Emulsions: Basic Principles in Emulsions:Fundamentals and Applications in the Petroleum Industry. American ChemicalSociety, Washington, DC.
Simon, M., Schmidt, S., Bart, H., 2003. The droplet population balance model-Estimation of breakage and coalescence. Chemical Engineering & Technology 26(7), 745–750.
Soon, S., Harbidge, J., Titchener-Hooker, N., Shamlou, P., 2001. Prediction of dropbreakage in an ultra high velocity jet homogenizer. Journal of ChemicalEngineering of Japan 34 (5), 640–646.
Tcholakova, S., Vankova, N., Denkov, N., Danner, T., 2007. Emulsification in turbulentflow: 3. Daughter drop-size distribution. Journal of Colloid and Interface Science310 (2), 570–589.
Vankova, N., Tcholakova, S., Denkov, N., Ivanov, I., Vulchev, V., Danner, T., 2007a.Emulsification in turbulent flow—1. Mean and maximum drop diameters ininertial and viscous regimes. Journal of Colloid and Interface Science 312 (2),363–380.
Vankova, N., Tcholakova, S., Denkov, N., Vulchev, V., Danner, T., 2007b. Emulsificationin turbulent flow 2. Breakage rate constants. Journal of Colloid and InterfaceScience 313 (2), 612–629.
Walstra, P., 1993. Principles of emulsion formation. Chemical Engineering Science48 (2), 333–349.
Walstra, P., 2003. Physical Chemistry of Foods. Marcel Dekker, New York, NY.Walstra, P., 2005. Emulsions. In: Lyklema, J. (Ed.), Fundamentals of Interface and
Colloid Science: Soft Colloids. Elsevier, Academic Press, London.Wang, L., Marchisio, D., Vigil, R., Fox, R., 2005. CFD simulation of aggregation
and breakage processes in laminar Taylor–Couette flow. Journal of Colloid andInterface Science 282 (2), 380–396.
Woo, X., Tan, R., Chow, P., Braatz, R., 2006. Simulation of mixing effects in antisolventcrystallization using a coupled CFD–PDF–PBE approach. Crystal Growth & Design6 (6), 1291–1303.
Yaghi, B., Al-Bemani, A., 2002. Heavy crude oil viscosity reduction for pipelinetransportation. Energy Sources 24 (2), 93–102.