chemical signature of two permian volcanic ash deposits
TRANSCRIPT

“main” — 2006/7/24 — 18:16 — page 525 — #1
Anais da Academia Brasileira de Ciências (2006) 78(3): 525-541(Annals of the Brazilian Academy of Sciences)ISSN 0001-3765www.scielo.br/aabc
Chemical signature of two Permian volcanic ash depositswithin a bentonite bed from Melo, Uruguay
LIANE M. CALARGE 1,2,4, ALAIN MEUNIER 2, BRUNO LANSON3 and MILTON L.L. FORMOSO 4
1Universidade Católica Dom Bosco, UCDB, Av. Tamandaré 600079117-900 Campo Grande, MS, Brasil
2Université de Poitiers, Laboratoire Hydr’ASA, UMR 6532, 40 Av. du Recteur Pineau86022 – Poitiers Cedex – France
3Université Joseph Fourier, LGIT, IRIGM, 5559 CNRS, BO 53X38041 – Grenoble Cedex – France
4Universidade Federal do Rio Grande do Sul, Instituto de Geociências, Av. Bento Gonçalves 950091540-900 Porto Alegre, RS, Brasil
Manuscript received on March 7, 2005; accepted for publication on November 22, 2005;contributed byALAIN MEUNIER* AND MILTON L.L. FORMOSO*
ABSTRACT
A Permian bentonite deposit at Melo, Uruguay is composed of a calcite-cemented sandstone containing clay
pseudomorphs of glass shards (0–0.50 m) overlying a pink massive clay deposit (0.50–2.10m). The massive
bed is composed of two layers containing quartz and smectite or pure smectite respectively. The smectite is
remarkably homogeneous throughout the profile: it is a complex mixed layer composed of three layer types
whose expandability with ethylene glycol (2EG 1EG or 0EG sheets in the interlayer zone which correspond
to low-, medium- and high-charge layers respectively) varies with the cation saturating the interlayer zone.
The smectite homogeneity through the profile is the signature of an early alteration process in a lagoonal
water which was over saturated with respect to calcite. Compaction during burial has made the bentonite
bed a K-depleted closed system in which diagenetic illitization was inhibited. Variations in major, REE and
minor element abundances throughout the massive clay deposit suggest that it originated from two successive
ash falls. The incompatible element abundances are consistent with that of a volcanic glass fractionated from
a rhyolite magma formed in a subduction/collision geological context.
Key words: bentonite, REE, incompatible elements, mixed-layer minerals, Uruguay.
INTRODUCTION
Bentonite beds are generally formed by alterationof volcanic ash in sea, brackish or fresh waters (Grimand Güven 1978). They represent useful chrono-stratigraphic units that can be traced for very longdistances. They have been shown to preserve achemica magmatic signature (Wray 1995, Christi-
*Member Academia Brasileira de CiênciasCorrespondence to: Dr. Alain MeunierE-mail: [email protected]
dis et al. 1995, Clayton et al. 1996, Laviano andMongelli 1996). Huff and Kolata (1989) showedthat each bentonite bed have a unique chemical sig-nature.
A thick Permian bentonite bed (>2 m) wasdiscovered in the Melo area, Uruguay (Goñi 1952).It is nearly monomineralic and is composed of anexceptionally well-crystallized Ca-montmorillonite(Calarge et al. 2002). The purpose of the presentwork is to investigate the mineralogical and chem-
An Acad Bras Cienc(2006)78 (3)

“main” — 2006/7/24 — 18:16 — page 526 — #2
526 LIANE M. CALARGE, ALAIN MEUNIER, BRUNO LANSON and MILTON L.L. FORMOSO
Fig. 1 – The geological setting of the bentonite bed from Melo (Uruguay). a) Location of the
studied quarry. b) The studied profile.
ical composition of that bentonite bed (major andtrace elements), in order to determine the possibleorigin of the initial volcanic ashes.
GEOLOGICAL SETTING
Permian bentonite beds have been described in dif-ferent geological formations of the South East partof the Paraná basin: Rio do Rastro area in Acegua– RS – Brazil (Pintaude and Formoso 1972), Tuñasand Yaguari Formations, in the Sierras Australes,Argentina (Iñiguez et al. 1988) and the Bañado deMedina-Melo area, Uruguay (Andreis et al. 1996)respectively. A fossil reptile (Pareiasaurus ameri-
canus) discovered at Aceguá indicates that the ben-tonite bed can be correlated to theDaptocephalus
biozone of the Karoo basin (Barberena et al. 1985)which belongs to the Upper Permian (Tatarian) ac-cording to D.C. Araújo, unpublished data.
The Melo bentonite bed crops out in a smallquarry 50 m on the South side of the Melo to Mon-tevideo road (Uruguay) 1 km from the R7 and R6road intersection and 20 km from the Melo city(Fig. 1a). This bentonite bed and the Acegua onebelong to the Late Permian Yaguary Formation(Tatarian) of the Bacia do Paraná (Andreis et al.1996). The rocks are mostly sandstones of fluvi-atile and eolian origin alternating with mudstonedeposits (red beds) which are typical lagoonal de-posits formed during the Late Permian regression.Concomitantly, the volcanic activity in the north-ern part of Patagonia increased, peaking during theTriassic and Early Jurassic (Andreis et al. 1996).The magmas were silica-rich, and the eruptions werehighly explosive and gave rise to large ash deposits(Axelrod 1981). The bentonite bed itself is a pink,massive, soft rock 1.6 m thick (Fig. 1b). It is over-lain by a calcite-cemented sandstone 50 cm thick.
An Acad Bras Cienc(2006)78 (3)

“main” — 2006/7/24 — 18:16 — page 527 — #3
CHEMICAL SIGNATURE OF TWO BENTONITE DEPOSITS 527
MATERIALS AND METHODS
XRD ANALYSES
The bentonite samples were gently ground afterdrying at 60◦C and the powders were ultrasonical-ly dispersed in distilled water. The< 0.1 mμ frac-tion was separated using centrifugation and Ca-,Na- and K-saturated with 1N CaCl2, NaCl or KCl,respectively. The excess of chloride was rinsedusing ethyl alcohol until no white precipitate wasformed with AgNO3. An aliquot of the K-saturatedsamples was Ca-exchanged using the same proce-dure (K-Ca samples). Oriented and random powdermounts were prepared for each sample. XRD pat-terns were recorded using a Siemens D500 diffrac-tometer (Cu Kα radiation generated at 40 kV and40 mA), equipped with a stepping motor drive onthe goniometer (SOCABIM DACO system) and aKevex PSI detector (resolution: 260 eV). The an-alytical conditions regarding angular range, scan-ning step size and counting time were 2–35 and2–75◦2θ , 0.025 and 0.040◦2θ , 4 s for oriented pre-parations and random powders, respectively. De-tailed XRD patterns were obtained from randompowders in the 32–42 (4s) and 58–64◦2α (8s) an-gular ranges for detailed study ofhkl bands charac-teristic of 3D structures.
Calculations of XRD patterns were performedusing the MLM3C software developed by Plançonand Drits (2000). Atomic coordinates for the dif-ferent layer types were set as recommended byMoore and Reynolds (1989), and the structural for-mula determined from chemical analyses was usedto define the layer composition. The d00l of the dif-ferent layer types was adjusted as needed withinthe limits given by Sato et al. (1992) to improvethe quality of the fit (Table I).
Among the other parameters that had to beadjusted in the trial-and-error fitting procedure, spe-cial attention was paid to the proportions of eachlayer type, and to the coherent scattering domainsize (N). The Reichweite parameter (Jagodzinski1949) for these three-component MLM was limitedto R= 0 (random interstratification). Because on1y
the main features of the experimental XRD patternswere reproduced, the estimated precision on theproportion of the different layer types is about±10%. An additional parameter describes the seg-regation degree of the third component (Pcc).
CHEMICAL ANALYSES
Major and minor elements including Rare EarthElements (REE) were analyzed from bulk rocksamples by ICP-Emission spectroscopy. Trace el-ements were analyzed by ICP-MS (Service d’ana-lyses du CNRS, Nancy). The cation exchange ca-pacity (CEC) of the< 1μm fraction was obtainedfrom Mg2+-exchanged Ca-saturated samples, theexcess of Mg salt being carefully washed out withethanol. Mg2+ was then exchanged by NH+
4 andanalyzed in the exchange solution by atomic absorp-tion spectrophotometry.
TOTAL SURFACE AREA (TSA)
TSA measurements (external + internal surfaces)were performed on the run products (< 1μm frac-tion) using the adsorption of ethylene glycol mono-ethyl ether (EGME) according to the method re-commended by Heilman et al. (1965). The totalsurface area (TSA) is calculated from the measu-red EGME mass divided by the monolayer EGMEmass adsorbed per surface unit (3.77 10−4 g m−2).
RESULTS
PETROGRAPHY
The studied profile is composed of two parts: Fromthe top down they are:
1) 0 to 0.50 m deep: From 0 to 20 cm, the uppersandstone is composed of angular quartz andfeldspar grains, disseminated in a clay matrixand cemented by calcite. It exhibits glass shardpseudomorphs in its lower part from a depthof 20 cm to the sandstone-bentonite interface.Calcite cement is more abundant in the lowerthan in the upper part. Feldspar, mostly pla-gioclase, was observed only in the upper sand-stone. Quartz and feldspar are fairly typical of
An Acad Bras Cienc(2006)78 (3)

“main” — 2006/7/24 — 18:16 — page 528 — #4
528 LIANE M. CALARGE, ALAIN MEUNIER, BRUNO LANSON and MILTON L.L. FORMOSO
TABLE IStructural parameters of the different types of layers considered in the XRD pattern calculation
of the mixed-layered minerals (Sato et al.1992).
State Layers d001
AD and EGstates Collapsed smectite (0 water or EG layer: 0W,0EG) d001 ∼ 10.0Å
AD state1 water layer smectite(1W) 12.1< d001 < 12.9Å2 water layer smectite(2W) 14.7< d001 < 15.5Å
EGstate1EG layersmectite 12.7< d001 < 13.9Å2EG layersmectite 16.5< d001 < 17.3A
the detrital input in a deltaic environment andare consistent with the mineral composition ofadjacent siliciclastic beds. The fact that vit-roclastic ash structures were preserved only inthe lower part of the sandstone suggests thatvolcanic debris were cemented early by car-bonates (Jeans et al. 1977). The volcanogenicdebris, as well as the detrital grains, seem tohave been deposited simultaneously with theprecipitation of calcite.
2) 0.50 to 2.10 m deep: the bentonite bed is a mas-sive pink clay with layer a density of 1.92 ±0.05 g cm−3. Clay pseudomorphs are absent;the microstructure is typical of clay-rich sedi-ments. Calcite and dolomite crystals are pre-sent in all the bentonite samples as trace com-ponents (< 1% in weight). The examinationof thin sections of the massive clay bed didnot show the presence of any magmatic phe-nocrysts (zircon, sanidine, micas). The coarsergrains size (5 to 10μm) contains only quartz.
XRD ANALYSES
Powder XRD patterns from the massive
bentonite bed
XRD patterns from bulk rock powders show thatthe bentonite bed is mostly composed of a well-crystallized smectite. Quartz is present in the upperpart from a depth of 0.50 to 1.30 m. Other silica-tes (feldspar, mica or zeolites) or carbonates com-monly observed in bentonite beds are not presenthere. The 0.60 diffraction peak at 1.498 Å shows
that the smectite is dioctahedral. Its intensity sug-gests a large size of the coherent scattering domainsin the b direction (Moore and Reynolds 1989), andis remarkably homogeneous throughout the profile.The Ca-saturated samples exhibit a large asymme-trical band at 2.58 Å typical of completely turbo-stratic 3D structures (Reynolds 1992).
XRD patterns of oriented samples
(<1μm fraction)
Ca-saturated samples.As the studied samples areapparently all composed of “pure smectite”, onlysample 8 (1.55m depth) will be detailed for sim-plicity. The intensity and sharpness of the 001 peakin the AD and EG XRD experimental patterns istypical of a “well-crystallized” smectite (Fig. 2a-b).However, calculated patterns (Plançon and Drits2000) give a coherent solution for the AD and EGXRD patterns for a random MLM of 2W or 2EG(96%) and 1W or 1EG (4%) expanded layers (Ta-ble II).
K-saturated samples.The expandability is strong-ly reduced: the 001 peak shifts to 11.94 Å and14.06 Å in the AD and EG states, respectively (Fig.2c-d). Calculated patterns do not give a coherentsolution for the two states. Indeed, the best approx-imations for AD and EG are a single three compo-nent random MLM, and a mixture of two threecomponent random MLM respectively (Fig. 2c-d).
K-Ca saturated samples.When Ca-saturated, theexpandability of K-samples increases but does notreach the values obtained in the Ca-saturated sam-
An Acad Bras Cienc(2006)78 (3)

“main” — 2006/7/24 — 18:16 — page 529 — #5
CHEMICAL SIGNATURE OF TWO BENTONITE DEPOSITS 529
Fig. 2 – Experimental and calculated XRD patterns from oriented
preparations of sample 8 (1.55m depth). a) Ca-saturated sample
in the AD state. b) Ca-saturated sample in the EG state. c) K-
saturated sample in the AD state. d) K-saturated sample in the
EG state. e) K-Ca-saturated sample in the AD state. f) K-Ca-
saturated sample in the EG state.
ples: 14.36 Å and 16.27 Å for AD and EG statesrespectively. This indicates that some layers haveirreversibly fixed the K+ cations. The calculatedpatterns do not give exactly the same solution forthe AD and EG states but the best solution forboth of them is a three component random and twocomponent random MLM (Fig. 2e-f).
All samples present the same XRD pattern dif-ferences between the Ca-, K- and K-Ca-saturatedpreparations suggesting that the crystal structure ofthe smectite is remarkably constant all over the ben-tonite bed. It is characterized by strong layer chargeheterogeneities.
Three types of layers have been considered inthe mixed layering depending on their respectivelayer charges (Sato et al. 1992):
– high-charge layers: collapsed to 10 Å after K-saturation (0 water or ethylene glycol layer:Sm0W, Sm0EG),
– medium-charge layers:1 EG or EG in the K-saturated state re-expanding to 2EG in the K-Ca sample,
– low-charge layers: 2EG even in the K-saturatedsamples.
Except for the Ca-saturated samples, the calculatedXRD patterns do not give similar solutions for theAD and EG states (Table II). Such a discrepancymay be due to the fact that water and ethylene glycolmolecules do not have the same dipolar moment.Thus, the number of water or ethylene glycol layersdepends on the Ca and K ion distribution within theinterlayer zones.
CHEMICAL ANALYSES OF THEMASSIVE
BENTONITE BED
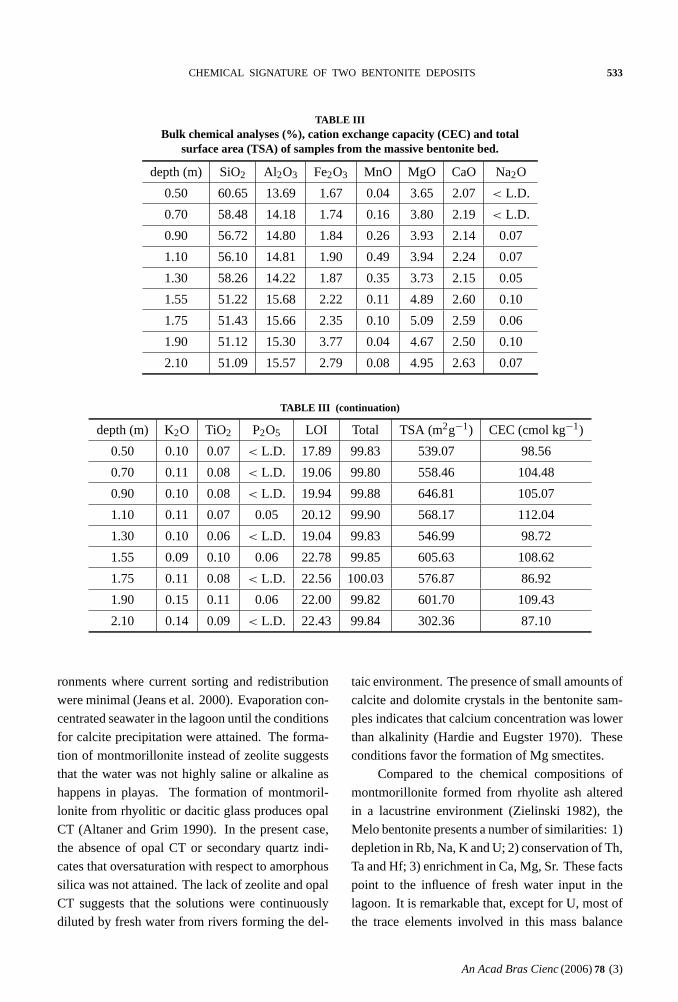
Bulk rock composition(Table III)
Based on bulk rock chemical compositions, themassive bentonite bed appears to be divided in twozones. The upper zone (0,5–1,55 m) is SiO2-richwhile the lower one (1,55–2,10 m) is Al2O3, Fe2O3,CaO, MgO – rich (Figs. 3a, b, c). However, thesechemical differences could be an artefact due to
An Acad Bras Cienc(2006)78 (3)

“main” — 2006/7/24 — 18:16 — page 530 — #6
530 LIANE M. CALARGE, ALAIN MEUNIER, BRUNO LANSON and MILTON L.L. FORMOSO
TABLE IIComposition of the two and three component mixed-layer minerals
for Ca-, K- and K-Ca-saturated samples, as determined byXRD pattern calculations.
cation AD amounts%
2W 1W 0W R N Pcc
Ca 96 4 0 0 6 - 100
K-Ca 50 20 30 0 5 - 100
K 5 50 45 0 10 - 100
EG
2EG 1EG 0EG R N Pcc
Ca 96 4 0 0 6 100
K-Ca 60 10 30 1 6.5 0.3 100
K10 60 30 0 5 - 709 1 90 0 6.5 - 30
the presence of quartz in the upper zone as shownby powder XRD patterns. Thus, it is more appro-priate to compare ratios than absolute amounts ofmajor elements excluding SiO2. The MgO/CaO andAl2O3/MgO ratios are roughly constant within thetwo zones but change abruptly at –1.55 m (Figs.3d, e). The MgO/MgO + Fe2O3 ratio decreasesfrom bottom to top forming two successive para-bolic trends joining at –1.55 m (Fig. 3f). To thechemical changes observed at –1.55 m correspondsalso changes in physical properties of the clay min-erals. Indeed, the average TSA value (Ca-saturatedsamples) is lower in the upper part: 597.90 insteadof 596.64 m2 g−1. Such a convergence betweenchemical and physical properties strongly suggeststhat the bentonite bed is composed of two layers,each of them being homogeneous in itself (constantchemical composition and TSA values).
Trace elements and REE abundances
Trace and REE element concentrations (Table IV)vary with depth. For simplicity, elements exhibitingthe same concentration profiles have been grouped.Four groups were distinguished: 1) identical con-centrations amounts in the two layers (Co, Ga, Hf,Nb, Rb, Sn, Sr, Ta, Th, Zr). This group is rep-resented by the Sr concentration profile (Fig. 4a);
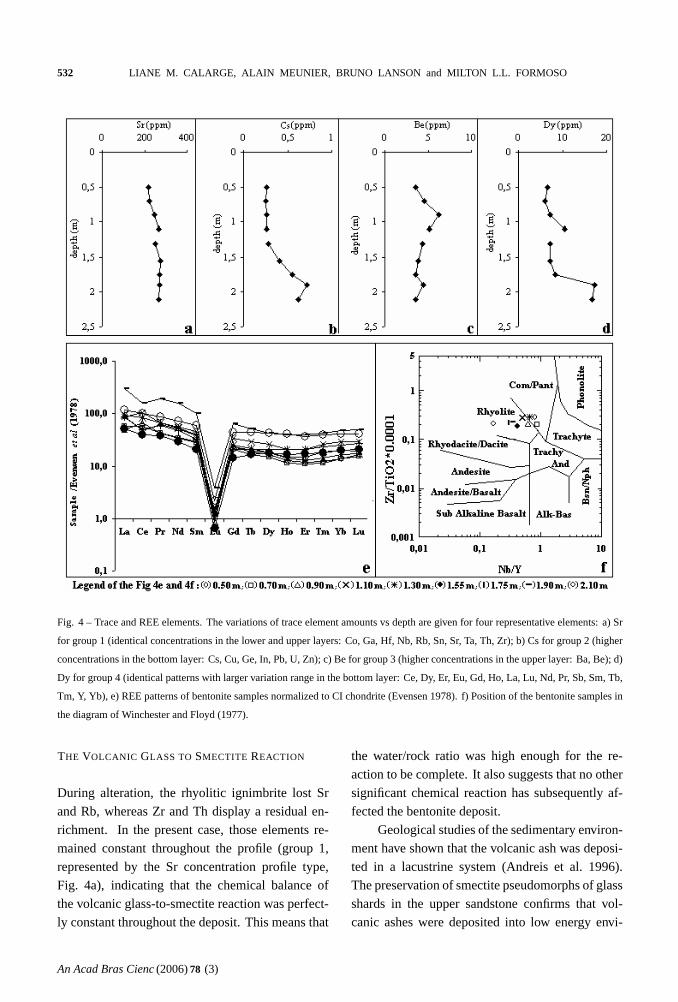
2) higher concentrations in the bottom layer (Cs,Cu, Ge, In, Pb, U, Zn). This group is representedby the Cs concentration profile (Fig. 4b); 3) higherconcentrations in the upper layer (Ba, Be). Thisgroup is represented by the Ba concentration pro-file (Fig. 4c); 4) identical patterns with a largerrange of variation in the bottom layer (Ce, Dy, Er,Eu, Gd, Ho, La, Lu, Nd, Pr, Sb, Sm, Tb, Tm, Y,Yb). This group is represented by the Dy concen-tration profile (Fig. 4d). The total REE concentra-tions in the studied samples vary from 130 to 570ppm. However, in spite of these large differences,the REE pattern abundances, normalized to chon-drite, are constant in shape throughout the profile(Fig. 4e). They all show the negative Eu anomaly.
DISCUSSION
THE ORIGIN OF THE VOLCANIC GLASS
As bentonites result from an alteration process, thechemical composition of the initial volcanic ash ismodified through gains and losses of elements withrespect to the altering solutions. Christidis (1998)showed that these chemical exchanges depend onthe composition of the volcanic debris and the wa-ter/rock ratio in a marine system. Consequently, itis excluded to use the proportions of the major ele-ments to determine the original glass composition.
An Acad Bras Cienc(2006)78 (3)

“main” — 2006/7/24 — 18:16 — page 531 — #7
CHEMICAL SIGNATURE OF TWO BENTONITE DEPOSITS 531
0
0.5
1
1.5
2
2.5
0.5 0.6 0.7
MgO/MgO + Fe 2O3Al2O3/MgO
SiO2 %
dept
h (c
m)
Al2O3 % oxide %
Fe2O3 CaO MgO
Fig. 3 – Evolution of the major chemical components throughout the profile. a) Variation of absolute values
vs depth (m). b) Variation of MgO/CaO, Al2O3/MgO and MgO/MgO + Fe2O3 ratios vs depth (m).
Christidis (1998) showed that only the ratios of therelatively immobile elements in the bulk bentoniterock (smectite + accessory minerals) are potentialindicators. Such attempts at chemical fingerprint-ing have had mixed success because alteration pro-cesses have been shown to variably modify the rel-ative proportions of most elements. However, usingratios of the so-called “immobile” elements suchas Ti, Zr, Y and Nb in the projection of Winch-ester and Floyd (1977), the studied samples are inthe rhyolite composition field or near its boundary
with comendite/pantellerite one (Fig. 4f). The Euanomaly is commonly attributed to the removal ofEu by plagioclase feldspar during fractionation ofthe melt. This anomaly is typical of evolved mag-mas.
Considering the Permian age of the bentonitedeposit, the source of the volcanic glass could berelated to a volcanic activity triggered by the col-lision of the northern active margin of the Patag-onian micro-plate with the South American conti-nental plate (Ramos 1984).
An Acad Bras Cienc(2006)78 (3)
“main” — 2006/7/24 — 18:16 — page 532 — #8
532 LIANE M. CALARGE, ALAIN MEUNIER, BRUNO LANSON and MILTON L.L. FORMOSO
Fig. 4 – Trace and REE elements. The variations of trace element amounts vs depth are given for four representative elements: a) Sr
for group 1 (identical concentrations in the lower and upper layers: Co, Ga, Hf, Nb, Rb, Sn, Sr, Ta, Th, Zr); b) Cs for group 2 (higher
concentrations in the bottom layer: Cs, Cu, Ge, In, Pb, U, Zn); c) Be for group 3 (higher concentrations in the upper layer: Ba, Be); d)
Dy for group 4 (identical patterns with larger variation range in the bottom layer: Ce, Dy, Er, Eu, Gd, Ho, La, Lu, Nd, Pr, Sb, Sm, Tb,
Tm, Y, Yb), e) REE patterns of bentonite samples normalized to CI chondrite (Evensen 1978). f) Position of the bentonite samples in
the diagram of Winchester and Floyd (1977).
THE VOLCANIC GLASS TO SMECTITE REACTION
During alteration, the rhyolitic ignimbrite lost Srand Rb, whereas Zr and Th display a residual en-richment. In the present case, those elements re-mained constant throughout the profile (group 1,represented by the Sr concentration profile type,Fig. 4a), indicating that the chemical balance ofthe volcanic glass-to-smectite reaction was perfect-ly constant throughout the deposit. This means that
the water/rock ratio was high enough for the re-action to be complete. It also suggests that no othersignificant chemical reaction has subsequently af-fected the bentonite deposit.
Geological studies of the sedimentary environ-ment have shown that the volcanic ash was deposi-ted in a lacustrine system (Andreis et al. 1996).The preservation of smectite pseudomorphs of glassshards in the upper sandstone confirms that vol-canic ashes were deposited into low energy envi-
An Acad Bras Cienc(2006)78 (3)
“main” — 2006/7/24 — 18:16 — page 533 — #9
CHEMICAL SIGNATURE OF TWO BENTONITE DEPOSITS 533
TABLE IIIBulk chemical analyses (%), cation exchange capacity (CEC) and total
surface area (TSA) of samples from the massive bentonitebed.
depth(m) SiO2 Al2O3 Fe2O3 MnO MgO CaO Na2O
0.50 60.65 13.69 1.67 0.04 3.65 2.07 < L.D.
0.70 58.48 14.18 1.74 0.16 3.80 2.19 < L.D.
0.90 56.72 14.80 1.84 0.26 3.93 2.14 0.07
1.10 56.10 14.81 1.90 0.49 3.94 2.24 0.07
1.30 58.26 14.22 1.87 0.35 3.73 2.15 0.05
1.55 51.22 15.68 2.22 0.11 4.89 2.60 0.10
1.75 51.43 15.66 2.35 0.10 5.09 2.59 0.06
1.90 51.12 15.30 3.77 0.04 4.67 2.50 0.10
2.10 51.09 15.57 2.79 0.08 4.95 2.63 0.07
TABLE III (continuation)
depth(m) K2O TiO2 P2O5 LOI Total TSA (m2g−1) CEC (cmol kg−1)
0.50 0.10 0.07 < L.D. 17.89 99.83 539.07 98.56
0.70 0.11 0.08 < L.D. 19.06 99.80 558.46 104.48
0.90 0.10 0.08 < L.D. 19.94 99.88 646.81 105.07
1.10 0.11 0.07 0.05 20.12 99.90 568.17 112.04
1.30 0.10 0.06 < L.D. 19.04 99.83 546.99 98.72
1.55 0.09 0.10 0.06 22.78 99.85 605.63 108.62
1.75 0.11 0.08 < L.D. 22.56 100.03 576.87 86.92
1.90 0.15 0.11 0.06 22.00 99.82 601.70 109.43
2.10 0.14 0.09 < L.D. 22.43 99.84 302.36 87.10
ronments where current sorting and redistributionwere minimal (Jeans et al. 2000). Evaporation con-centrated seawater in the lagoon until the conditionsfor calcite precipitation were attained. The forma-tion of montmorillonite instead of zeolite suggeststhat the water was not highly saline or alkaline ashappens in playas. The formation of montmoril-lonite from rhyolitic or dacitic glass produces opalCT (Altaner and Grim 1990). In the present case,the absence of opal CT or secondary quartz indi-cates that oversaturation with respect to amorphoussilica was not attained. The lack of zeolite and opalCT suggests that the solutions were continuouslydiluted by fresh water from rivers forming the del-
taic environment. The presence of small amounts ofcalcite and dolomite crystals in the bentonite sam-ples indicates that calcium concentration was lowerthan alkalinity (Hardie and Eugster 1970). Theseconditions favor the formation of Mg smectites.
Compared to the chemical compositions ofmontmorillonite formed from rhyolite ash alteredin a lacustrine environment (Zielinski 1982), theMelo bentonite presents a number of similarities: 1)depletion in Rb, Na, K and U; 2) conservation of Th,Ta and Hf; 3) enrichment in Ca, Mg, Sr. These factspoint to the influence of fresh water input in thelagoon. It is remarkable that, except for U, most ofthe trace elements involved in this mass balance
An Acad Bras Cienc(2006)78 (3)

“main” — 2006/7/24 — 18:16 — page 534 — #10
534 LIANE M. CALARGE, ALAIN MEUNIER, BRUNO LANSON and MILTON L.L. FORMOSO
TABLE IVTrace element abundances (ppm) of samples from the massive bentonitebed.
0.5m 0.7m 0.9m 1.1m 1.3m 1.55m 1.75m 1.9m 2.1m
As 7.50 7.67 8.02 14.35 8.95 7.90 9.81 23.88 26.99
Ba 336.65 361.87 629.90 893.01 669.07 318.18 314.36 270.31 306.90
Be 3.54 4.56 6.19 5.11 4.31 3.90 3.56 4.43 3.54
Bi 0.29 0.23 0.24 0.32 0.27 0.39 0.28 0.74 0.47
Cd < L.D. < L.D. < L.D. < L.D. < L.D. < L.D. < L.D. < L.D. < L.D.
Ce 57.92 68.33 80.13 126.19 99.68 46.54 59.67 188.47 122.36
Co 5.13 1.16 7.66 3.89 5.00 2.70 2.78 5.99 4.17
Cr 5.93 < L.D. 5.59 < L.D. < L.D. < L.D. < L.D. < L.D. < L.D.
Cs 0.26 0.26 0.26 0.27 0.28 0.41 0.55 0.72 0.63
Cu < L.D. < L.D. < L.D. < L.D. < L.D. 7.77 8.16 10.84 9.35
Dy 6.60 6.00 7.24 10.57 7.11 7.11 8.31 17.24 16.73
Er 3.09 2.89 3.84 5.45 3.34 4.50 5.34 10.07 9.66
Eu 0.12 0.12 0.09 0.13 0.14 0.07 0.10 0.37 0.22
Ga 24.82 27.79 29.12 28.68 27.03 30.37 29.31 29.52 29.99
Gd 8.03 7.05 7.80 11.68 8.51 4.85 7.17 21.64 15.17
Ge 0.69 0.82 0.89 1.02 1.07 3.72 3.62 2.53 3.22
Hf 7.81 8.17 9.39 8.93 8.24 8.95 8.19 9.39 8.73
Ho 1.14 1.02 1.31 1.84 1.29 1.49 1.87 3.46 3.59
In 0.11 0.11 0.12 0.13 0.11 0.14 0.14 0.14 0.15
La 39.31 26.07 22.43 39.29 43.51 23.85 39.54 136.58 53.98
Lu 0.62 0.59 0.74 1.11 0.66 0.81 1.04 1.87 1.55
Mo < L.D. < L.D. < L.D. 0.45 < L.D. < L.D. < L.D. < L.D. < L.D.
Nb 21.93 23.10 19.41 20.87 22.46 18.64 17.61 20.70 17.40
Nd 43.82 29.04 29.74 46.60 45.27 24.95 41.16 133.49 60.70
Ni < L.D. < L.D. < L.D. < L.D. < L.D. < L.D. < L.D. < L.D. < L.D.
Pb Total 6.75 10.81 23.80 34.78 27.16 61.74 45.78 50.47 46.81
Pr 11.33 7.68 7.68 11.89 11.95 6.82 10.81 34.09 15.86
Rb 5.93 5.21 6.76 6.22 6.01 4.81 6.23 7.39 6.83
Sb 0.36 0.13 0.13 0.17 0.16 0.41 0.47 1.58 0.55
Sm 10.43 7.54 7.75 12.56 10.55 5.66 8.69 27.44 15.98
Sn 6.58 6.87 7.51 7.59 7.32 7.69 7.50 5.88 7.45
Sr 216.97 223.44 246.65 266.84 252.06 275.24 272.13 272.67 268.00
Ta 1.91 2.03 2.05 2.08 1.95 2.12 2.11 1.77 2.21
Tb 1.11 0.99 1.21 1.78 1.29 0.99 1.26 3.04 2.65
Th 20.58 20.87 20.99 23.12 21.15 25.14 23.61 21.00 25.18
Tm 0.49 0.45 0.71 1.01 0.56 0.70 0.90 1.64 1.55
U 0.68 0.51 0.78 0.82 0.52 1.25 1.29 1.83 1.71
V 52.37 22.84 18.20 24.96 16.30 18.16 20.50 22.92 39.73
W 0.57 0.28 1.10 1.29 1.02 0.34 0.20 0.93 0.50
Y 27.97 27.24 31.85 44.34 32.30 45.93 55.54 107.46 103.54
Yb 3.41 3.40 4.98 7.43 4.22 5.01 6.39 11.82 10.32
Zn 101.63 112.30 118.11 128.42 109.76 142.08 131.76 127.66 133.86
Zr 159.94 163.96 172.63 182.10 171.97 175.95 170.74 231.93 181.71
<D.L. – Amount lower than the detection limits.
An Acad Bras Cienc(2006)78 (3)

“main” — 2006/7/24 — 18:16 — page 535 — #11
CHEMICAL SIGNATURE OF TWO BENTONITE DEPOSITS 535
(Rb, Th, Ta, Hf, Sr) belong to group 1 (representedby the Sr concentration profile type, Fig. 4a). There-fore, whatever the chemical variations in the profilewere, the formation of montmorillonite happenedin identical conditions throughout the bentonite de-posit. This process is different from the progres-sive diagenetic transformation of volcanic glass tosmectite in deep-sea environments (Hein and Scholl1978). In the latter case, polyphased assemblagesare produced while some glass relics survive. Fur-ther, the smectitic minerals produced contain onlya few illite layers.
The absence of any K-bearing mineral phasein the Melo bentonite implies that excess Si4+ andK+ ions were leached out of the system. Duringburial, as compaction increases the density of thesediment and decreases its permeability, the ben-tonite bed became progressively more compact andformed a closed K-depleted chemical system inwhich the smectite-to-illite diagenetic reaction wasinhibited. This explains why there are no illite-smectite mixed layers as commonly observed in K-bentonites (Huff and Türkmenoglü 1981, Altaneret al. 1984). Nevertheless, even though illite isnot formed, charge heterogeneities still appear, asshown by the effects of K- and K-Ca-saturations onXRD patterns. The Melo smectite is an interstra-tification of expandable layers that have differentlayer charge.
In summary, the volcanic glass was probablyaltered shortly after deposition in lagoonal waterthat was oversaturated with respect to calcite. Theseparticular conditions were stable during the ashfall, which explains the mineralogical homogeneitythroughout the profile. Afterwards, diagenetic con-ditions did not modify the composition of the smec-tite significantly because the compacting bentonitebed became progressively a Ca-rich K-depletedclosed system that was improper to illitization. Thecompaction process destroyed the volcanoclasticstructures, except in the upper sandstone wherethese structures were preserved by the rigidity ofthe calcite cement.
GRADING IN A SINGLE ASH FALL OR
IN TWO ASH FALLS?
The abrupt variation of major component concen-trations at the depth 1.55 m (Fig. 3) suggests thatthe bentonite bed is composed of two parts. Thisis confirmed by variations in trace element abun-dances elements with greater or lower abundance inthe upper layer, i.e., Cs, Cu, Ge, In, Pb, U, and Zn,(group 2, represented by the Cs concentration pro-file type, Fig. 4b) or Ba and Be (group 3, representedby the Be concentration profile type, Fig. 4c) andDy concentration profile type for group 4 (Fig. 4d)respectively. Compared to sample 8 (1.55 m depth)which has the lowest REE abundance, most of theupper ones appear to be more HREE depleted thanthe lower ones (Fig. 4e). The La/Yb ratio variesfrom 3,04 to 7,80. This means that the HREE werepartially leached (Christidis 1998). The four groupsof elements are shown in Figures 5a to 5d.
There variations in the amounts of major andtrace elements are significant. They suggest thateither the chemical composition of the magmaticproducts has varied during a rhythmic volcaniceruption, or that two successive eruptions producedthe ash falls. In either scenario, the two ash de-posits were superimposed before the transforma-tion of glass into smectite. The lack of any detritaldeposit between the two parts militates for a singlerhythmic event. Unfortunately, as magmatic phe-nocrysts and particularly heavy minerals have notbeen found in the massive bentonite bed, it is almostimpossible to discriminate between the two alter-natives.
A POSSIBLERHYOLITIC COMPOSITION
Even if most of the major element abundances aremodified during the transformation of volcanic glassto smectite, the less mobile ones (Fe3+, Al) sug-gest that the initial ash composition was closer torhyolite than to rhyodacite or andesite. This is con-firmed by the so-called “immobile” elements suchas Ti, Zr, Y and Nb. Using ratios rather than ab-solute values, the projection from Winchester andFloyd (1977) can be applied to altered volcanic ma-
An Acad Bras Cienc(2006)78 (3)

“main” — 2006/7/24 — 18:16 — page 536 — #12
536 LIANE M. CALARGE, ALAIN MEUNIER, BRUNO LANSON and MILTON L.L. FORMOSOde
pth
(m)
dept
h (m
)
Fig. 5a – GROUP 1
terials such as bentonites (Huff et al. 1993). In thepresent case, most of the studied samples are in therhyolite composition field or near its boundary withcomendite/pantellerite (Fig. 4f). The Eu anomaly iscommonly attributed to the removal of Eu by pla-gioclase feldspar during fractionation of the melt.This anomaly is typical of evolved magmas.
Therefore, the Melo bentonite probably deri-ved from ash resulting from an explosive frag-mentation of the residual melt, after plagioclasefeldspar crystallized from a rhyolitic magma. Thisis confirmed by spider diagrams (Figs. 5a to 5d)normalized to a subduction/collision rhyolite glass(Juteau and Maury 1997). Considering that the neg-
ative Rb, K and Eu anomalies are related to mag-matic differentiation and plagioclase crystallizationrespectively, it appears that the bentonite patternsare close to the reference line.
CONCLUSION
Based on its chemical characteristics, the thickMelo bentonite bed resulted probably from the su-perposition of two different volcanic ash deposits.Using the distribution of incompatible elements,the composition of the original glass appears to besimilar to that of glass resulting from the fractiona-tion of a rhyolitic magma in a subduction/collision
An Acad Bras Cienc(2006)78 (3)

“main” — 2006/7/24 — 18:16 — page 537 — #13
CHEMICAL SIGNATURE OF TWO BENTONITE DEPOSITS 537
dept
h (m
)
dept
h (m
)
Fig. 5b – GROUP 2
setting. It is to be noticed that the chemical dif-ferences between the two ash falls were not suffi-cient to cause a mineralogical contrast. The high ho-mogeneity of the smectitic minerals throughout themassive bentonite suggests that the volcanic glasshas been altered in stable chemical conditions im-posed by the sedimentary environment.
ACKNOWLEGMENTS
L. Calarge has benefited of a grant from theFrench-Brazilian cooperation agreement Coorde-
nação de Aperfeiçoamento de Pessoal de Nível Su-perior (CAPES) – Comité Français d’Evaluation dela Coopération Universitaire avec le Brésil (COFE-CUB). Funding for analyses was provided by UnitéMixte de Recherche (UMR) 6532 Centre Nationalde la Recherche Scientifique (CNRS).
RESUMO
Um depósito Permiano de bentonita em Melo, Uruguai,
é composto por um arenito com cimento calcítico con-
tendo pseudomorfos de argila sobre detritos vítreos
An Acad Bras Cienc(2006)78 (3)

“main” — 2006/7/24 — 18:16 — page 538 — #14
538 LIANE M. CALARGE, ALAIN MEUNIER, BRUNO LANSON and MILTON L.L. FORMOSO
Be (ppm)
dept
h (m
)
Fig. 5c – GROUP 3
(0–0.50 m) superpostos a um deposito maciço de argila
rosado (0.50–2.10 m). A camada maciça é composta
por dois níveis contendo quartzo e esmectita ou esmectita
pura, respectivamente. A homogeneidade de esmectita ao
longo do perfil é notável: trata-se de um interestratificado
composto de três tipos de camadas, cuja expansibilidade
com etileno-glicol (folhas 2EG, 1EG ou 0EG na zona in-
terfoliar correspondentes a camadas com baixa, média e
alta carga, respectivamente) variam com o tipo de cátion
que satura a zona interfoliar. A homogeneidade da es-
mectita ao longo do perfil é a assinatura de um processo
de alteração precoce em uma água lagunar supersaturada
em calcita. A compactação durante o soterramento tornou
a camada de bentonita um sistema fechado empobrecido
em K no qual a ilitização diagenética foi inibida. Varia-
ções nas abundâncias de elementos maiores, menores e
ETR no depósito maciço de argila sugere que este foi
originado a partir de duas quedas sucessivas de cinza.
A abundância de elementos incompatíveis é consistente
com a de um vidro vulcânico fracionado a partir de um
magma riolitico formado em um ambiente geológico de
subducção/colisão.
Palavras-chave: bentonita, ETR, elementos incompatí-
veis, interestratificados, Uruguai.
REFERENCES
ALTANER SPAND GRIM RE. 1990. Mineralogy, chem-
istry, and diagenesis of the Sucker Creek Formation
(Miocene), eastern Oregon. Clays Clay Miner 38:
561–572.
ALTANER SP, HOWER J, WHITNEY G AND ARON-
SON JL. 1984. Model for K-bentonite formation:
evidence from zoned K-bentonites in the disturbed
belt, Montana. Geology 12: 412–415.
ANDREIS RR, FERRANDO L AND HERBST R. 1996.
Terrenos Carboniferos y Pérmicos de Republica Ori-
ental del Uruguay. In: EL SISTEMA PERMICO EN
LA REPUBLICA ARGENTINA Y EN LA REPUBLICA
ORIENTAL DEL URUGUAY. Academia Nacional del
Uruguay, Cordoba, Argentina, p. 309–343.
AXELROD DI. 1981. Role of volcanism in climate and
evolution. Geol Soc Amer Spec Paper 185: 59.
BARBERENA MC, ARAUJO DC, LAVINA EL AND
AZEVEDO SAK. 1985. O estado atual do conhe-
cimento sobre tetrapodos permianos e triássicos do
Brasil Meridional. In: CONGRESSOBRASILEIRO
DE PALEONTOLOGIA 8, Coletânea de trabalhos pa-
leontológicos, Brasília, DF, Brasil, Ser Geol 27(2):
21–28.
An Acad Bras Cienc(2006)78 (3)

“main” — 2006/7/24 — 18:16 — page 539 — #15
CHEMICAL SIGNATURE OF TWO BENTONITE DEPOSITS 539
10 20 5 10 15 0.2 0.4 10 20 30 2 4100 200
dept
h (m
)
50 100 150 20 40 1 2 10 20 3010 20 30
dept
h (m
)
1 2 2 4 1 2 50 100 15050 100 150
dept
h (m
)
5 10 15
Fig. 5d – GROUP 4
An Acad Bras Cienc(2006)78 (3)

“main” — 2006/7/24 — 18:16 — page 540 — #16
540 LIANE M. CALARGE, ALAIN MEUNIER, BRUNO LANSON and MILTON L.L. FORMOSO
CALARGE LM, M EUNIER A AND FORMOSO ML.
2002. A bentonite bed in the Acegua (RS, Brazil)
and Melo (Uruguay) areas: a highly crystallized
montmorillonite. J South Am Earth Sci 16: 187–198.
CHRISTIDIS GE. 1998. Comparative study of the mo-
bility of major and trace elements during alteration of
an andesite and a rhyolite to bentonite, in the islands
of Milos and Kimolos, Aedean, Greece. Clays Clay
Miner 46: 379–399.
CHRISTIDIS GE, SCOTT PW AND MARCOPOULOST.
1995. Origin of the bentonite deposits of eastern
Milos, Aegean, Greece: geological, mineralogical
and geochemical evidence. Clays Clay Miner 43:
63–77.
CLAYTON T, FRANCIS JE, HILLIER SJ, HODSON F,
SAUNDERS RA AND STONE J. 1996. The implica-
tion of reworking on the mineralogy and chemistry
of lower Carboniferous K-bentonites. Clay Miner
31: 377–390.
EVENSEN NM, HAMILTON PJ AND O’NIONS RK.
1978. Rare-earth abundances in chondritic meteo-
rites. Geochim Cosmochim Acta 42: 1199–1212.
GOÑI JC. 1952. Etude minéralogique de quelques argi-
les de l’Uruguay. C.I.P.E.A. XIX Congresso Interna-
cional de Geologia, Fasc XVIII: 47–56.
GRIM RE AND GÜVEN N. 1978. Bentonites, Geol-
ogy, Mineralogy, Properties and Uses. Developments
in Sedimentology 24, Elsevier, Amsterdam, Nether-
lands, 256 p.
HARDIE LA AND EUGSTER HP. 1970. The evolution
of closed-basin brines. Mineral Soc Am Spec Pub 3:
273–290.
HEILMAN MD, CARTER DL AND GONZALEZ CL.
1965. The ethylene glycol monoethyl ether (EGME)
technique for determining soil-surface area. Soil Sci
100: 409–413.
HEIN JR AND SCHOLL DW. 1978. Diagenesis and
distribution of late Cenozoic volcanic sediment in
the southern Bering Sea. Geol Soc Amer Bull 89:
197–210.
HUFF WD AND KOLATA DR. 1989. Correlation of
K-bentonite beds by chemical fingerprinting using
multivariate analysis. In: QUANTITATIVE DYNA -
MIC STRATIGRAPHY. CROSS TA (Ed), Prentice-
Hall, Englewood Cliffs, New Jersey, p. 567–577.
HUFF WD AND TÜRKMENOGLÜ AG. 1981. Chemical
characteristics and origin of Ordovician K-bentonites
along the Cincinnati Arch. Clays Clay Miner 29:
113–123.
HUFF WD, MERRIMAN RJ, MORGAN DJ AND RO-
BERTS B. 1993. Distribution and tectonic setting
of Ordovician K-bentonites in the United Kingdom.
Geol Mag 130: 93–100.
IÑIGUEZ A, A NDREIS RR AND ZALBA P. 1988. Even-
tos piroclasticos en la Formacion Tunas (Permico),
Sierras Australes, provincia de Buenos Aires, Re-
publica Argentina. Segundas Jornadas Geologicas
Bonaerenses. Actas, Bahia Blanca, Argentina,
p. 383–395.
JAGODZINSKI H. 1949. Eindimensionale Fehlordnung
in Kristallen und ihr Einfluss auf die Röntgeninter-
ferenzen. III. Vergleich der Berechnungen mit expe-
rimentellen Ergebnissen. Acta Crystall 2: 298–304.
JEANS CV, MERRIMAN RJ AND MITCHELL JG. 1977.
Origin of Middle Jurassic and Lower Cretaceous ful-
ler’s earths in England. Clay Miner 12: 11–44.
JEANS CV, WRAY DS, MERRIMAN RJ AND FISHER
MJ. 2000. Volcanogenic clays in Jurassic and Cre-
taceous strata of England and the North Sean Basin.
Clay Miner 35: 25–55.
JUTEAU T AND MAURY R. 1997. Géologie de la croûte
océanique: Pétrologie et dynamique endogène, Mas-
son ed., 367 p.
LAVIANO R AND MONGELLI G. 1996. Geochemistry
and mineralogy as indicators of parental affinity for
Cenozoic bentonites: a case study from S. Croce Di
Magliano (southern Apennines, Italy). Clay Miner
31: 391–401.
MOOREDM AND REYNOLDS RC. 1989. X-ray diffrac-
tion and the identification and analysis of clay min-
erals. Oxford, Oxford University Press, 198 p.
PINTAUDE DA AND FORMOSOMLL. 1972. Ocorren-
cia de Argila montmorilonitica em Acegua – RS.
Instituto Tecnologico do Rio Grande do Sul. Bol
57, 40 p.
PLANÇON A AND DRITS VA. 2000. Phase analysis
of clays using an expert system calculation programs
for X-ray diffraction by two- or three-component
mixed-layer minerals. Clays Clay Miner 48: 57–62.
RAMOS VA. 1984. Patagonia: Un continente paleozoi-
An Acad Bras Cienc(2006)78 (3)

“main” — 2006/7/24 — 18:16 — page 541 — #17
CHEMICAL SIGNATURE OF TWO BENTONITE DEPOSITS 541
co a la deriva? IX Congreso Geológico Argentino
(S.C. Bariloche) Actas I: 311–325.
REYNOLDS RC. 1992. X-ray diffraction studies of il-
lite/smectite from rocks,< 1μm randomly oriented
powders, and< 1μm oriented powder aggregates:
the absence of laboratory induced artefacts. Clays
Clay Miner 40: 387–396.
SATO T, WATANABE T AND OTSUKA R. 1992. Effects
of layer charge, charge location, and energy change
on expansion properties of dioctahedral smectites.
Clays Clay Miner 40: 103–113.
WINCHESTERJA AND FLOYD PA. 1977. Geochemical
discrimination of different magma series and their
differentiation products using immobile elements.
Chem Geol 20: 235–243.
WRAY DS. 1995. Origin of clay-rich beds in Turonian
chalks from lower Saxony, Germany – a rare-earth
element study. Chem Geol 119: 161–173.
ZIELINSKI RA. 1982. The mobility of uranium and other
elements during alteration of rhyolite ash to mont-
morillonite: a case study in the Troublesome Forma-
tion, Colorado, USA. Chem Geol 35: 185–204.
An Acad Bras Cienc(2006)78 (3)