chemical properties and fertility analysis of dredger-fill ... · pdf fileabstract:...
TRANSCRIPT

Chemical properties and fertility analysis of dredger-fill silt
during soil formation: The tianjin dredge–fill project
Xin Sui 1 , Huijun Gu 1 , Guogang Zhang Corresp., 1 , Meiqing Jia 1
1 College of Life Sciences,Tianjin Normal University, Tianjin Key Laboratory of Animal and Plant Resistance, Tianjin, China
Corresponding Author: Guogang Zhang
Email address: [email protected]
Dredger-fill silt has been used in the port of Tianjin, China to reclaim land; however, the
dredger-fill silt has no soil ecological function. Translating the silt into soil rapidly and
accelerating the soil-forming process are key to solving the ecological problems of the
Dredge–Fill project. This study measured 15 chemical properties of the dredger-fill silt for 8
years of the soil forming process to explore fertility changes and the critical factors
affecting soil formation. The results showed that: (1) the salinity of silt changed from
severe to mild with a reduction in Na+ and Cl- concentration. Other ion concentrations
changed slightly. (2) Effective nutrients significantly decreased during soil formation. Soil
organic matter (SOM),the nitrate-nitrogen, available phosphorus (A-P) and available
potassium (A-K) decreased by 26.22%, 86.23%, 45.92%, 33.61% respectively, indicating
severe nutrients loss. (3) Principal component analysis showed that silt fertility decreased
significantly and the total soil fertility loss was severe. This study has significance for the
artificial improvement of silt.
PeerJ Preprints | https://doi.org/10.7287/peerj.preprints.3214v2 | CC BY 4.0 Open Access | rec: 1 Sep 2017, publ: 1 Sep 2017

ChemicalmPropertiesmandmFertilitymAnalysismofmDredger-fillmsiltmDuringmSoilmFormation:mThem
TianjinmDredge–FillmProject
Huijun Gu1,2 * , Xin Sui1,2* , Meiqing Jia3 ,Guogang Zhang1,2
1 College of Life Sciences, Tianjin Normal University, Tianjin, 300387, China
2 Tianjin Key Laboratory of Animal and Plant Resistance, Tianjin Normal University, Tianjin,
300387, China
3 Key Laboratory of Water Resource and Environment, Tianjin Normal University, Tianjin,
300387, China
*These authors contributed equally to this study and share first authorship.
Correspondeng Author:
Guoggang Zhang, College of Lefe Sceences, Teanjen Normal Uneversety, Teanjen, 300387, Chena. E-
mael: [email protected]
1
2
3
4
5
6
7
8
9
10
11
12
PeerJ Preprints | https://doi.org/10.7287/peerj.preprints.3214v2 | CC BY 4.0 Open Access | rec: 1 Sep 2017, publ: 1 Sep 2017

Abstract: Dredger-fill silt has been used in the port of Tianjin, China to reclaim land; however,
the dredger-fill silt has no soil ecological function. Translating the silt into soil rapidly and
accelerating the soil-forming process are key to solving the ecological problems of the Dredge–
Fill project. This study measured 15 chemical properties of the dredger-fill silt for 8 years of the
soil forming process to explore fertility changes and the critical factors affecting soil formation.
The results showed that: (1) the salinity of silt changed from severe to mild with a reduction in
Na+ and Cl- concentration. Other ion concentrations changed slightly. (2) Effective nutrients
significantly decreased during soil formation. Soil organic matter (SOM), the nitrate-nitrogen,
available phosphorus (A-P) and available potassium (A-K) decreased by 26.22%, 86.23%,
45.92%, 33.61% respectively, indicating severe nutrients loss. (3) Principal component analysis
showed that silt fertility decreased significantly and the total soil fertility loss was severe. This
study has significance for the artificial improvement of silt.
Key words: chemical properties; dredger-fill silt; fertility; Principal component analysis
Introductionm
The Tianjin Port is located in the lower reaches of the Haihe River, at the western end of Bohai
Bay (38°59′08″N, 117°42′05″E). The Tianjin beach is a typical silt coast (Sun Lian-cheng, 2011).
Siltation phenomenon was so severe that it restricted the initial development of the port. Presently
the Tianjin Port requires silt to be extracted from the seabed to dredge the channel every year, and
the silt is used for land reclamation to increase the area of the port (L Zhao, 2015). However,
vegetation does not grow well on the reclaimed land because of the high salt and alkali content
of the silt (salinity>1%, pH>8.0) (Thorup JT, 1969; Tuteja N, 2007 ;Waśkiewicz A et al., 2013).
The area of reclaimed land is increasing every year, but the area has become wasteland due to the
poor ecological function of the soil. Understanding how to develop the silt into soil rapidly is the
key to improving the land quality.
Since the commencement of the dredger-fill project in 2000, many scholars have made efforts
to improve the quality of dredger-fill silt in many ways. In terms of physical and chemical
properties, some scholars filled the waste into the silt to improve it, such as gypsum, bran, sand
13
14
15
16
17
18
19
20
21
22
23
24
25
26
27
28
29
30
31
32
33
34
35
36
37
38
39
PeerJ Preprints | https://doi.org/10.7287/peerj.preprints.3214v2 | CC BY 4.0 Open Access | rec: 1 Sep 2017, publ: 1 Sep 2017

and so on(Zhang Wan-jun et al,. 2001a, 2002b; Guo Hongyu et al,. 2005;Wang Guoqiang et al,.
2011 ; Jin Cong, 2013; Tian miao et al,. 2014;). In the perspective of bioremediation, some
scholars proposed planting halophytes can improve the silt quality (Zou Guimei et al,. 2010).
Although these measures have some good effects in a short period of time, the long-term effect is
not well, and the cost of manpower and material resources is enormous, so the practicability still
needs to be studied. In view of the current research, most scholars hope to improve silt quality
directly through external means, but they ignore the silt can transform into soil in a natural long
evolution. Therefore, this study suggests that the combination of the natural evolution and
artificial modification can be used to improve the silt quality. Artificial improvement could be
guided by the study of various natural factors changes in the evolution process of silt. At the same
time, the use of artificial improvement means can conform to the natural evolution trend, guiding
and accelerating the dredger-fill silt to change into soil.
Under natural conditions, soil formation takes million years and is impacted by various factors,
while manual intervention is expected to shorten the time of soil formation. After extracted into
the terrestrial ecosystem and exposed to natural environment, silt tend to evolve into soil with
ecology function, which was affected by geological processes and multi - factors process (air,
microorganisms, temperature, humidity, and other factors). In this study, 15 chemical properties
of the dredger-fill silt are determined. Principal component analysis is used to evaluate the
changes in soil over time, indicating the change of dredger-fill silt fertility during the period of
soil formation. Exploring the natural evolution process of silt has guiding significance for the
artificial improvement of silt.
1mMaterialsmandmMethods
1.1mSoilmcollection
Soil samples were selected from the Tianjin Port area in 2016. The soil formation time is different
at every sampling point (Figure 1). As the sampling took place all in the same year, dredger
filling time represents the soil formation time, including soil formation for year 0 (S0), year 1
(S1), year 4 (S4), year 6 (S6), year 7 (S7), and year 8 (S8). As the sampling sites for year 2 (S2),
40
41
42
43
44
45
46
47
48
49
50
51
52
53
54
55
56
57
58
59
60
61
62
63
64
65
66
PeerJ Preprints | https://doi.org/10.7287/peerj.preprints.3214v2 | CC BY 4.0 Open Access | rec: 1 Sep 2017, publ: 1 Sep 2017

year 3 (S3), and year 5 (S5) have been covered by construction, soil was not collected. At each
soil sampling point, the topsoil (0–30 cm) was selected for the chemical properties study. Three
replicate experiments were performed on each soil sample. Each soil sample was collected from
multiple sites, mixed uniformly, then packed into plastic bags and taken to the laboratory. The
soil samples were divided into two groups; a fresh sample was preserved at -20°C and the other
sample was air dried after impurities such as gravel were removed, and sieved through two
different sieve sizes (0.025 and 0.015 mm). In this study, we quoted the soil chemical properties
of eight farmland sampling points from the literature (Wenmei Ma, 2011) that are located close to
the silt sampling points , and every parameter was determined by the same method used in this
study. The farmland sampling points are shown in Figure 1. The farmlands are located in the New
Coastal Region of Tianjin; the soil has a near neutral pH and exhibits mild or moderate soil
salinization. The mean value of the eight-farmland sampling points was used in order to ensure
the accuracy of the data.
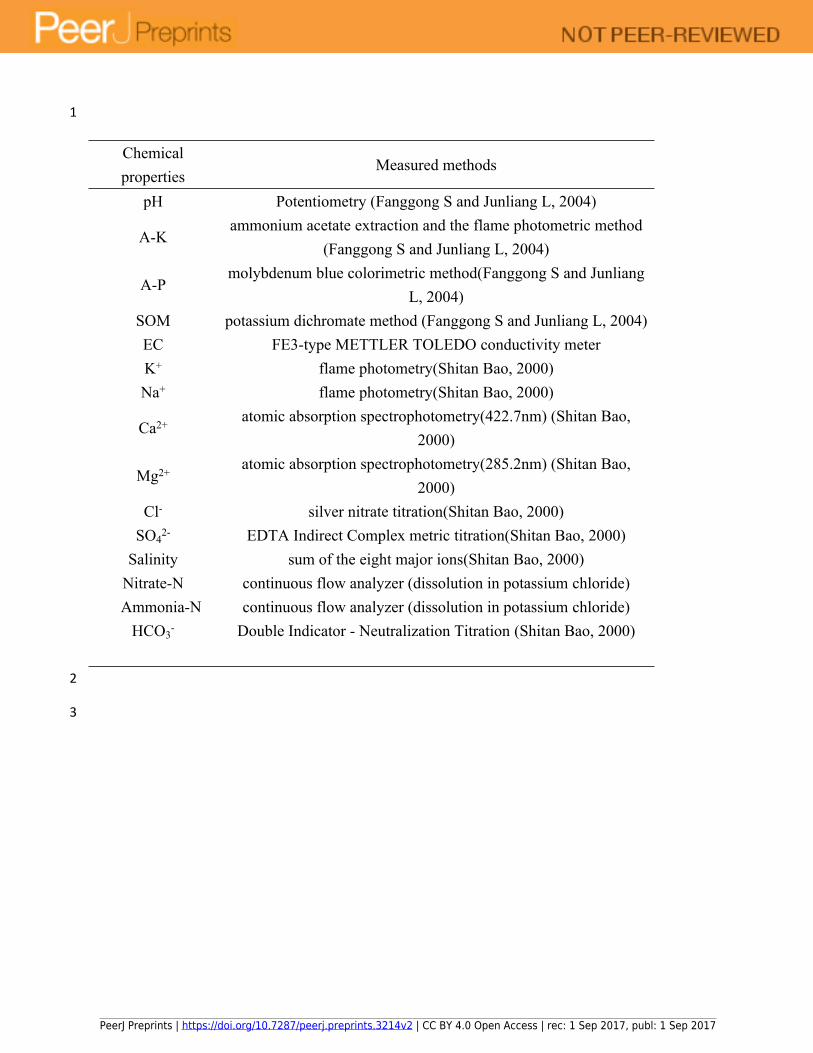
1.2mAnalysismofmthemchemicalmpropertiesmofmsilt
The chemical properties of silt were determined by the conventional method(Tablem1). The data
were averaged over three replicates.
1.3mPrincipalmcomponentmanalysis
In this paper, 15 chemical properties were evaluated by principal component analysis ( Jolliffe IT,
1986; Wold S et al., 1987 ; Liu XJ, 2010; Zhang SQ, 2011 ; Xie LW et al., 2015;). The
comprehensive score was used to evaluate the silt fertility of each sample(Li B, 1992; Qin Z,
2015). As each variable represents a single index of silt fertility, the comprehensive score can
represent the overall level of dredger-fill silt fertility. In addition, this study used Sigmaplot 12.5
and SPSS17.0 to analyze the data.
2mResultsmandmdiscussion
67
68
69
70
71
72
73
74
75
76
77
78
79
80
81
82
83
84
85
86
87
88
89
90
PeerJ Preprints | https://doi.org/10.7287/peerj.preprints.3214v2 | CC BY 4.0 Open Access | rec: 1 Sep 2017, publ: 1 Sep 2017

2.1mSalinitymandmalkalinitymofmsiltmduringmthemsoilmformation
With increased soil-forming time, the electrical conductivity (EC) and salinity of the dredger-fill
silt first increased, then decreased (Figurem2amandmFigm2b). The EC of the soil samples positively
correlate with salinity; both can be used to evaluate the degree of soil salinization. EC increased
by 61.39% from S0 to S4 and then decreased by 36.20% from S4 to S8. The salinity of the
dredger-fill silt increased slightly by 15% from S0 to S4 and then declined dramatically by 69%
from S4 to S8. The silt underwent severe salinization from S0 to S4(Chinese Academy of
Science, 1991). The level of salinization decreased significantly from S4 to S8. That indicates,
salinization degree of silt had a reducing trend. In addition, the dredger-fill silt was strongly
alkaline during soil formation; the pH values were 8.7–8.9 throughout the experiment and had no
significant differences(Figurem2c).
At S0 , the silt maintained the high salinity and strong alkalinity of the marine environment,
which were major limiting factors of soil formation. However, the salinity reduced with time
improving conditions for soil formation. The alkalinity did not change with time and continued to
inhibit soil formation.
With increasing soil formation time, the Na+ and Cl- content changed sharply, and the other ions
changed slightly (Figurem3). Tests of significance showed that the K+, HCO3-, and SO4
2- content of
the soil did not exhibit significant differences (P >0.05), indicating that over the eight years the
content remained stable. The content changes of Na+, Cl-, Ca2+, Mg2+ exhibited significant
difference (P<0.05), indicating that these ions had significant differences over eight years.
In S4, the Na+, Cl-, Mg2+, and Ca2+ content of the silt increased 3 g/kg, 0.1 g/kg, 0.014 g/kg, and
0.043 g/kg respectively. From S4 to S8, the Na+ content declined significantly by 17 g/kg.
Compared with S0, the Na+, Cl-, Mg2+, and Ca2+ contents of the silt declined by 14 g/kg (72%),
0.2 g/kg, 0.014 g/kg, and 0.04 g/kg, respectively. From S0–S8, the Na+ and Cl- content showed a
declining trend, Mg2+ and Ca2+ content remained stable.
91
92
93
94
95
96
97
98
99
100
101
102
103
104
105
106
107
108
109
110
111
112
113
114
115
PeerJ Preprints | https://doi.org/10.7287/peerj.preprints.3214v2 | CC BY 4.0 Open Access | rec: 1 Sep 2017, publ: 1 Sep 2017
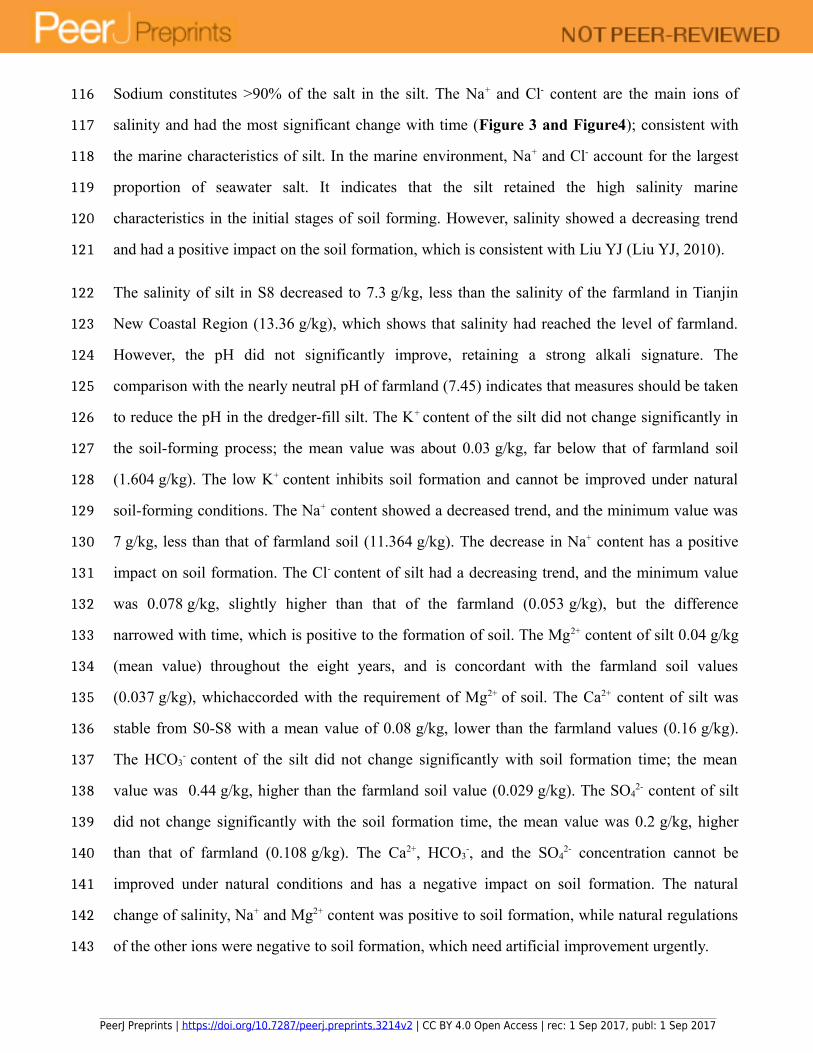
Sodium constitutes >90% of the salt in the silt. The Na+ and Cl- content are the main ions of
salinity and had the most significant change with time (Figurem3mandmFigure4); consistent with
the marine characteristics of silt. In the marine environment, Na+ and Cl- account for the largest
proportion of seawater salt. It indicates that the silt retained the high salinity marine
characteristics in the initial stages of soil forming. However, salinity showed a decreasing trend
and had a positive impact on the soil formation, which is consistent with Liu YJ (Liu YJ, 2010).
The salinity of silt in S8 decreased to 7.3 g/kg, less than the salinity of the farmland in Tianjin
New Coastal Region (13.36 g/kg), which shows that salinity had reached the level of farmland.
However, the pH did not significantly improve, retaining a strong alkali signature. The
comparison with the nearly neutral pH of farmland (7.45) indicates that measures should be taken
to reduce the pH in the dredger-fill silt. The K+ content of the silt did not change significantly in
the soil-forming process; the mean value was about 0.03 g/kg, far below that of farmland soil
(1.604 g/kg). The low K+ content inhibits soil formation and cannot be improved under natural
soil-forming conditions. The Na+ content showed a decreased trend, and the minimum value was
7 g/kg, less than that of farmland soil (11.364 g/kg). The decrease in Na+ content has a positive
impact on soil formation. The Cl- content of silt had a decreasing trend, and the minimum value
was 0.078 g/kg, slightly higher than that of the farmland (0.053 g/kg), but the difference
narrowed with time, which is positive to the formation of soil. The Mg2+ content of silt 0.04 g/kg
(mean value) throughout the eight years, and is concordant with the farmland soil values
(0.037 g/kg), whichaccorded with the requirement of Mg2+ of soil. The Ca2+ content of silt was
stable from S0-S8 with a mean value of 0.08 g/kg, lower than the farmland values (0.16 g/kg).
The HCO3- content of the silt did not change significantly with soil formation time; the mean
value was 0.44 g/kg, higher than the farmland soil value (0.029 g/kg). The SO42- content of silt
did not change significantly with the soil formation time, the mean value was 0.2 g/kg, higher
than that of farmland (0.108 g/kg). The Ca2+, HCO3-, and the SO4
2- concentration cannot be
improved under natural conditions and has a negative impact on soil formation. The natural
change of salinity, Na+ and Mg2+ content was positive to soil formation, while natural regulations
of the other ions were negative to soil formation, which need artificial improvement urgently.
116
117
118
119
120
121
122
123
124
125
126
127
128
129
130
131
132
133
134
135
136
137
138
139
140
141
142
143
PeerJ Preprints | https://doi.org/10.7287/peerj.preprints.3214v2 | CC BY 4.0 Open Access | rec: 1 Sep 2017, publ: 1 Sep 2017

2.2mEffectivemnutrientsmduringmthemsoilmformingmprocess
The SOM, A-P, A-K, and nitrate-N content of the dredger-fill silt reduced linearly with increased
time, while the content of ammonia-N showed a stable trend first and then increased significantly
(Figure 4). The SOM, A-P, A-K, and nitrate-N content of the dredger-fill silt reduced by
3.75 g/kg, 5.97 mg/kg, 0.4 mg/kg, and 7.14 mg/kg, respectively, within eight years. Compared
with S1, the SOM, A-P, A-K, and nitrate-N content of the dredger-fill silt reduced by 26.22%,
45.92%, 33.61%, and 86.23%, respectively.
The ammonia-N content was maintained from S0 to S6 and then increased by 84.31%, from 0.24
mg/kg (S6) to 1.53 mg/kg (S8). With increasing soil formation time, the nitrate-N content
decreased and the content of ammonia-N increased (Figurem3dmandm3e), indicating that some
nitrate-N was converted to ammonia-N. The total inorganic nitrogen content showed a downward
trend.
The analysis of the nutrients showed that the maximum organic matter content of the silt was
14.30 g/kg, which is less than farmland soil (23.6 g/kg). The SOM content of the silt decreased
with increasing soil formation time, negatively influencing the soil forming process. The A-K
content of the silt declined with increasing soil formation time to a minimum of 0.79 mg/kg
during S8, more than that in farmland (0.47 mg/kg). Distinction of A-K content has a narrowing
tendency between silt and farmland , which was positive for the soil formation. The nitrate-N
content decreased with increasing of soil formation time and reached a minimum in S8
(1.14 mg/kg), much lower than the farmland soil value (290 mg/kg). The nitrate-N is more
suitable for artificial improvement due to the large gap between the farmland and silt soil values.
The maximum content of ammonia-N was 1.53 mg/kg, lower than the farmland soil (4.5 mg/kg),
but it increased naturally with time. Overall, apart from the change of ammonia–N, which was
favorable to soil formation, the loss of the other effective nutrients was severe within the eight
years and limited soil formation.
144
145
146
147
148
149
150
151
152
153
154
155
156
157
158
159
160
161
162
163
164
165
166
167
168
PeerJ Preprints | https://doi.org/10.7287/peerj.preprints.3214v2 | CC BY 4.0 Open Access | rec: 1 Sep 2017, publ: 1 Sep 2017

2.3mComprehensivemfertilitymevaluationmbasedmonmprincipalmcomponentmanalysis
Principal component analysis (PCA) was used to analyze 15 chemical properties that represent
the fertility level of silt, three principal components were extracted, and the accumulative
contribution rate was 91.834%(Tablem2). Due to the indicators in this experiment had different
dimension and order of magnitude, data standardization processing needs to be applied, to
eliminate the influence of dimension and order of magnitude on the evaluation results and ensure
the objectivity and accuracy of evaluation, which was completed by SPSS software
automatically. The standardized variables for each sample are denoted as Z1 to Z15.
The principal component is a linear combination of all the standardized indexes, and the weight is
the component score coefficients of each index (Tablem2), so the linear combination of the three
principal components and the 15 original indexes can be obtained as follows:
F1=-0.022×Z1+0.107×Z2-0.085×Z3+0.101×Z4+0.086×Z5+0.091×Z6-0.008×Z7-0.106×Z8-
0.014×Z9+0.101×Z10+0.12×Z11+0.14×Z12-0.065×Z13+0.15×Z14-0.095×Z15
F2=0.160×Z1+0.045×Z2-0.065×Z3+0.112×Z4-0.157×Z5+0.127×Z6+0.186×Z7-
0.122×Z8+0.046×Z9-0.111×Z10-0.103×Z11-0.034×Z12+0.155×Z13+0.028×Z14+0.101×Z15
F3=0.229×Z1+0.292×Z2-0.335×Z3-0.216×Z4+0.012×Z5+0.137×Z6-
0.016×Z7+0.121×Z8+0.121×Z9-0.217×Z10+0.158×Z11-0.079×Z12+0.008×Z13-0.087×Z14-
0.114×Z15
By substituting the standardized data into the above formula, the scores of 6 samples on three
principal components can be obtained.
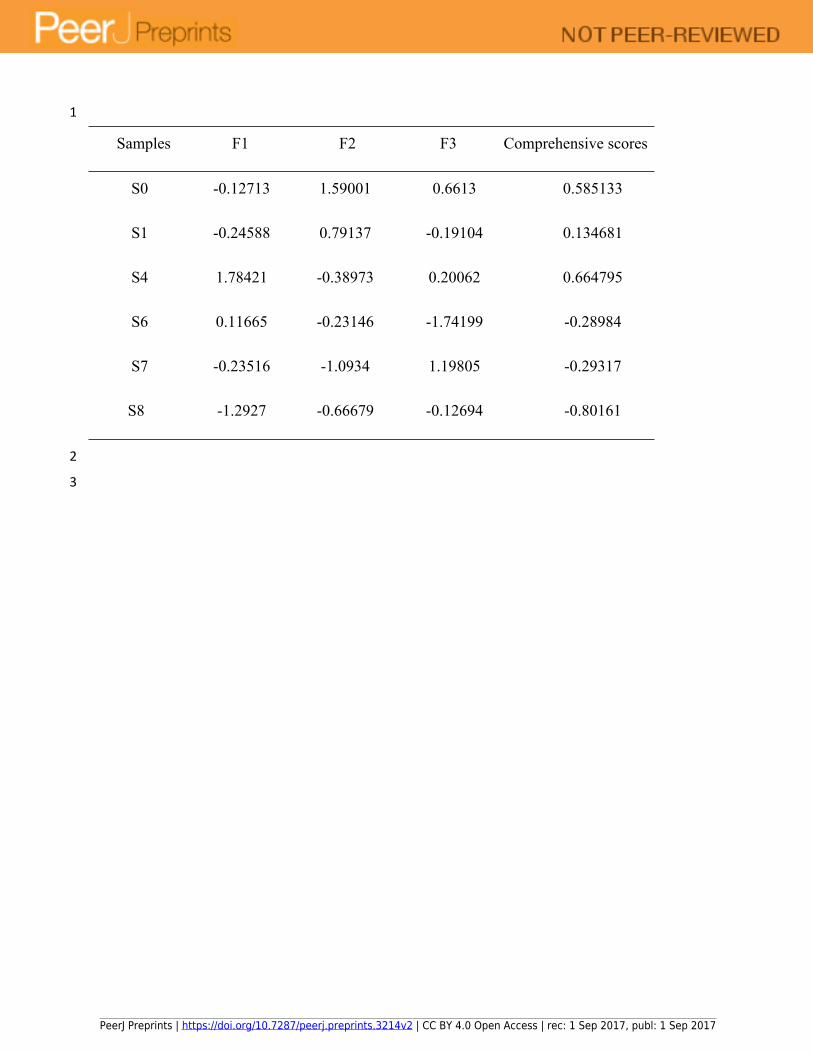
In this study, the comprehensive fertility of 6 samples was represented by comprehensive scores
of principal component analysis. The comprehensive score formula is F=0.43×F1+0.34× F2+0.15
×F3, the coefficients are the principal component contribution rates. The principal component
scores and comprehensive scores of each sample are shown in Tablem3.
169
170
171
172
173
174
175
176
177
178
179
180
181
182
183
184
185
186
187
188
189
190
191
192
PeerJ Preprints | https://doi.org/10.7287/peerj.preprints.3214v2 | CC BY 4.0 Open Access | rec: 1 Sep 2017, publ: 1 Sep 2017
The comprehensive fertility of the silt showed a downward trend, and the loss of soil fertility was
severe which was consistent with the above results, which further verified the serious fertility loss
in the process of soil formation over the eight-year soil formation time (Figurem5).
2.4mDiscussionmonmimprovementmmethodsmofmdredger-fillmsilt
Artificial improvement and manual regulation of the silt is needed to adjust the pH values to
improve the strong alkaline environment. The pH values can be adjusted by adding calcium
reagent and acidic substances(Rhoades JD and Loveday J, 1990), and adding industrial waste
(e.g., fly ash)( Xiuzhen Z and Jiang W, 1990; Xun Z et al., 2011; Nan C, 2012; Wen Z et al,. 2013
). Reducing the salinity and alkaline can be achieved by irrigation and drainage engineering
(Wang X et al,. 2013). Organic nutrients, like organic matter, A-K, A-P, and nitrate-N should be
added manually. Artificial intervention should be performed in the early stages of soil formation
to reduce the loss of silt fertility. The application of organic fertilizer and eutrophic sludge(Jihong
Z et al., 1986; Li G et al., 2002;Bo F et al., 2012; Liang Z et al., 2014; Liangquan W et al.,
2015) can be used for soil reclamation. Ions (K+,Ca2+, HCO3-, SO4
2-, etc.) were added to the
dredger-fill silt to increase the concentrations to reach the farmland ion content level. In addition,
plants and other biological methods are feasible ways to improve the silt fertility (Cui J et al.,
2012; Pinho RC et al., 2012; Li X et al., 2015).
3mConclusion
(1) The dredger-fill silt changed from severe to mild salinization during the eight years of soil
formation. Na+ and Cl- were the most abundant ions and showed the greatest change; the other
ions were present in lower concentration and changed slightly. The pH value of the silt was >8.5
and did not vary during the study period.
(2) The silt effective nutrient loss was severe. The concentration of organic matter, nitrate-N, A-P,
and A-K decreased by 3.75 g/kg, 7.14 g/kg, 5.97 g/kg and 0.4 g/kg respectively, indicating that
effective nutrients loss was severe.
193
194
195
196
197
198
199
200
201
202
203
204
205
206
207
208
209
210
211
212
213
214
215
216
217
PeerJ Preprints | https://doi.org/10.7287/peerj.preprints.3214v2 | CC BY 4.0 Open Access | rec: 1 Sep 2017, publ: 1 Sep 2017

(3) Using the principal component analysis method, the comprehensive fertility of the silt was
evaluated. The results showed that silt fertility decreased significantly and the total fertility loss
was severe.
References
Sun Lian-cheng, 2011. Tianjin Port engineering sediment treatment and efficacy on silt coast. J.
China:Port& Waterway Engineering. 449, 66-74.
L Zhao, Y Zheng, G Mao, H Guo, 2015. Spatial Distribution of Nitrogen and Phosphorus in
Dredger Fill at Tianjin Reclamation Land Area. J. China: Jilin Daxue Xuebao. 45(2),255-64.
Waśkiewicz A, Beszterda M, Goliński P, 2013. Role in Plant Signaling Under Salt Stress.
Springer New York, 175-196.
Thorup JT , 1969. pH effect on root growth and water uptake by plants. Agron J. 61(2),225-75.
Tuteja N, 2007. Mechanisms of high salinity tolerance in plants. Method Enzymol. 428,419-38.
Jin Cong, 2013. Physico-Chemical Properties and Soil Envelopment by Mixing Sand Research
on Dredger Fill in Tianjin. Tianjin: Tianjin University of Technology..
Zhang Wan-jun, Gou Yu-wen, Wang Dou-tian, Zhang Ming-sheng, Huang Ming-yong, 2001,
Ecological Remediaiton of Wastes Resources by Comprehensive Utilization in Coastal
Ecosystem. Chinese Journal of Soil Science, 32(Z1), 151 - 155.
Zhang Wan-jun, Gou Yu-wen, Huang Ming-yong, 2002. Study on Synthetic Utilization of Three
Solid Wastes. Engineering Science , 4(10), 57 - 61.
Zou Guimei, Su Derong, Huang Mingyong, 2010. Effect of planting Suaeda salsa on
improvement of dredger filled soil. Pratacultural Science, 27(4), 51 - 56.Tian miao, 2014. The research of mechanism and effect on dredger fill improved by industrial
and agricultural waste. Tianjin University of Technology
Wang Guoqiang, Wu Tao, Xiang Jingsong, Huang Mingyong, 2011. Study on Improve Effect of
Phosphogypsum on Brackish Dredged Sediment. Journal of Anhui Agri, (28), 17249
-17251 .
Guo Hongyu, Yan Chi, Ling Guang Mao, 2005. Research on Improving Engineering Properties
of Dredger Fill with Additive. Port Engineering Technology,(01),50-51.
Wenmei Ma, 2011. The Relationship Between Soil Physical-Chemical Characteristics and
Quality of Coastal Plain. Northwest A & F University.
Fanggong S, Junliang L, 2004. Soil agrochemical analysis experiment(2st ed). China: Laiyang
Agricultural College Press.
218
219
220
221
222
223
224
225
226
227
228
229
230
231
232
233
234
235
236
237
238
239
240
241
242
243
244
245
246
247
248
249
PeerJ Preprints | https://doi.org/10.7287/peerj.preprints.3214v2 | CC BY 4.0 Open Access | rec: 1 Sep 2017, publ: 1 Sep 2017
Shitan Bao, 2000. Analysis of soil agglomeration(3st ed). China Agriculture Press.
Wold S, Esbensen K, Geladi P, 1987 Principal component analysis. Chemometrics & Intelligent
Laboratory Systems. 2(1-3),37-52.
Jolliffe IT, 1986. Principal Component Analysis. Springer Berlin. 87(100),513.
Xie LW, Zhong J, Cao FX, Li JJ, Wu LC, 2015. Evaluation of soil fertility in the succession of
karst rocky desertification using principal component analysis. Solid Earth. 6(2),3333-59.
Liu XJ, 2010. Study on Soil Fertility Decline of Pinus kesiya var. langbianensis with Principal
Component Analysis. Journal of Anhui Agricultural Sciences.Zhang SQ, 2011. Evaluation on Soil Fertility Quality Based on Principal Component Analysis.
Journal of Anhui Agricultural Sciences.
Li B, Du M, Zhou J, Liu S, Xu H, Agron DO, 1992. The Application of Principal Component
Analysis on the Fertility Evaluation of "Chao" Soil. Journal of Agricultural University of
Hebei.
Qin Z, Tang J, Cao J, Wang H, Deng X, Pan B, 2015. Assessment of Soil Fertility of Continuous
Plantation of Chinese Fir Based on Principal Component and Cluster Analysis. Forest
Resources Management.
Soil taxonomy group , Institute of soil science, Chinese Academy of Science, 1991.
Classification of Soil Systems in China. Beijing: Science Press.
Liu YJ, Xu JQ, Wang S, Tian XY, Ren DM, Li GN, 2010. Influence on soil salinity and
physiological characteristic of 3 plants with integrative technique of saline-alkali
improvement in Yingkou coastal industrial base. China: Journal of Shenyang Agricultural
University. 41(3), 354-6.
Rhoades JD, Loveday J, 1990. Salinity in irrigated agriculture. Agronomy.
Xiuzhen Z, Jiang W, 1990. Studies of the Absorbing Mechanism of Natural Zeolite in the
improvement of soda saline-alkali Soil . The absorption of the main salts in soda saline-Ⅰ
alkali soil by natural Zeolite. China: Journal of Jilin Agricultural University. 1, 40-55.
Xun Z, Peihao P, Jingji L, 2011. An Experiment of Amelioration to Saline Alkali: Improved
Saline-alkali Soil by Coal Ash and Coal Gangue as An Example. China: Journal of Henan
Normal University (Natural Science Edition). 39(4), 70-4.
Nan C, 2012. The Physicochemical Characters of the Saline-Alkali Soil Improved with Fly Ash
and the Effect of the Soil on the Physiological Characters of Plants, scholarly journal.
250
251
252
253
254
255
256
257
258
259
260
261
262
263
264
265
266
267
268
269
270
271
272
273
274
275
276
277
278
279
280
PeerJ Preprints | https://doi.org/10.7287/peerj.preprints.3214v2 | CC BY 4.0 Open Access | rec: 1 Sep 2017, publ: 1 Sep 2017

Beijing University of Technology.
Wen Z, Zengchao G, Xinxiang C, Haiying G, 2013. Effects of Biomass Charcoal on Saline Soil
Improvement. Agricultural Research in the Arid Areas. 31(2), 73-7.
Wang X, Zhang F, Wang Y, Feng T, Lian X, Wang Y, 2013. Effect of irrigation and drainage
engineering control on improvement of soil salinity in Tianjin. Chinese Society of
Agricultural Engineering. 29(20), 82-8.
Jihong Z, Xiangcheng X, Yaoxian T, 1986. Application of organic manure is the basic way to
increase soil organic matter fertilization.China: Saline Soil Use. (04), 10-14.
Liang Z, Zhenan H, Ying C, Yang Z, Ting H, Jiashaung M, 2014. Effects of P Rate on Soil
Inorganic Phosphorous Forms in Grey Desert Soil. Journal of Soil and Water Conservation.
28(3),236-42.
Liangquan W, Liang W, Zhenling C, Xinping C, Fusuo Z, 2015. Basic NPK Fertilizer
Recommendation and Fertilizer Formula for Maize Production Regions in China. Acta
Pedologica Sinica. (4), 802-17.
Bo F, Lingan K, Bin Z, Jisheng S, Shengdong L, Fahong W, 2012. Effect of Nitrogen
Application Level on Nitrogen Use Efficiency in Wheat and Soil Nitrate-N Content under
Bed Planting Condition. Acta Agronomica Sinica. 38(6),1107-14.
Li G, Yin C, Lin Y, Li Z, 2002. Artifical improvement of soil fertility in a regraded forest
ecosystem by using municipal sewage sludge. The journal of applied ecology. 13(2),159.
Cui J, Liu C, Li Z, Wang L, Chen X, Ye Z, 2012. Long-term changes in topsoil chemical
properties under centuries of cultivation after reclamation of coastal wetlands in the Yangtze
Estuary, China. Soil Till Res. 123(5), 50-60.
Pinho RC, Miller RP, Alfaia SS, 2012. Agroforestry and the Improvement of Soil Fertility: A
View from Amazonia. Applied & Environmental Soil Science. 2012(1).
Li X, Kang Y, Wan S, Chen X, Chu L, 2015. Reclamation of very heavy coastal saline soil using
drip-irrigation with saline water on salt-sensitive plants. Soil Till Res. 146(146), 159-73.
Nnadi LA, Haque I, 1986. Forage legume-cereal systems: Improvement of soil fertility and
agricultural productivity with special reference to sub-Saharan Africa. Ilca.
281
282
283
284
285
286
287
288
289
290
291
292
293
294
295
296
297
298
299
300
301
302
303
304
305
306
307
308
PeerJ Preprints | https://doi.org/10.7287/peerj.preprints.3214v2 | CC BY 4.0 Open Access | rec: 1 Sep 2017, publ: 1 Sep 2017

Figure 1
Experimental sampling area and distribution map of Tianjin Port
Black triangles: Sampling sites of cropland New Coastal Region of Tianjin( Wenmei Ma, 2011) ;
Black box: Silt sampling area in Tianjin(Supported by Tianjin Port Gulf Landscaping Limited
Company). ①:Silt extracted in 2016, soil formation time was 0 years (S0). ②: Silt extracted in
2015, soil formation time was 1 year (S1). ③:Silt extracted in 2010, soil formation time was 6
years (S6). ④: Silt extracted in 2009, soil formation time was 7 years (S7). ⑤: Silt extracted in
2008, soil formation time was 8 years (S8). ⑥: Silt extracted in 2012, soil formation time was
4 years (S4).
PeerJ Preprints | https://doi.org/10.7287/peerj.preprints.3214v2 | CC BY 4.0 Open Access | rec: 1 Sep 2017, publ: 1 Sep 2017

PeerJ Preprints | https://doi.org/10.7287/peerj.preprints.3214v2 | CC BY 4.0 Open Access | rec: 1 Sep 2017, publ: 1 Sep 2017

Figure 2
Change of salinity and alkalinity in the process of dredger-fill silt soil-forming.
R-value of every fitting curve is shown in the top left corner of figure. Vertical bars indicate ±
SE.
PeerJ Preprints | https://doi.org/10.7287/peerj.preprints.3214v2 | CC BY 4.0 Open Access | rec: 1 Sep 2017, publ: 1 Sep 2017

Figure 3
Change in water-soluble ion content and comparison with cropland.
R-value of every fitting curve is shown in the top left corner of the figure. Vertical bars
indicate ± SE. The last picture is the water-soluble ions content of farmland in the New
Coastal Region of Tianjin from the literature(Wenmei Ma, 2011). The mean value of eight
samples is shown.
PeerJ Preprints | https://doi.org/10.7287/peerj.preprints.3214v2 | CC BY 4.0 Open Access | rec: 1 Sep 2017, publ: 1 Sep 2017

PeerJ Preprints | https://doi.org/10.7287/peerj.preprints.3214v2 | CC BY 4.0 Open Access | rec: 1 Sep 2017, publ: 1 Sep 2017

Figure 4
Change of effective nutrients and comparison with cropland (a~ f).
R-value of every fitting curve is shown in the top left corner of figure. Vertical bars indicate
mean ± SE; (f) The concentration of effective nutrients in cropland in New Coastal Region of
Tianjin. All data comes from literature, which were mean values of eight samples.
PeerJ Preprints | https://doi.org/10.7287/peerj.preprints.3214v2 | CC BY 4.0 Open Access | rec: 1 Sep 2017, publ: 1 Sep 2017

PeerJ Preprints | https://doi.org/10.7287/peerj.preprints.3214v2 | CC BY 4.0 Open Access | rec: 1 Sep 2017, publ: 1 Sep 2017
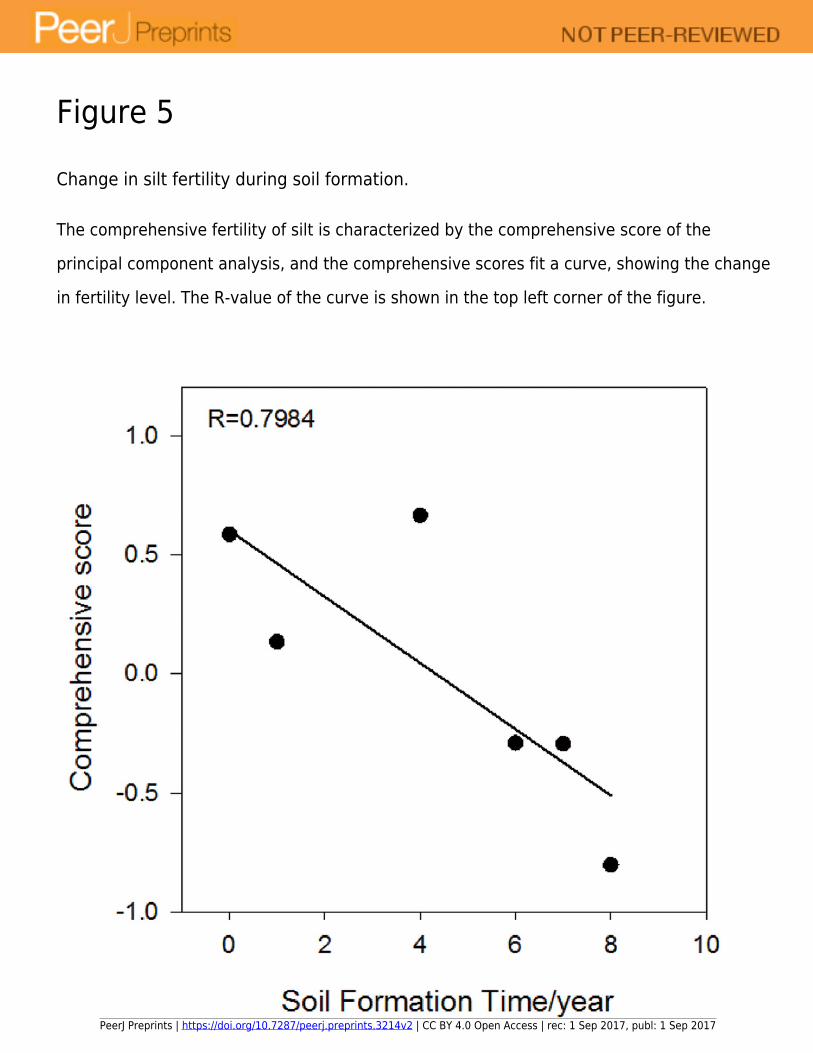
Figure 5
Change in silt fertility during soil formation.
The comprehensive fertility of silt is characterized by the comprehensive score of the
principal component analysis, and the comprehensive scores fit a curve, showing the change
in fertility level. The R-value of the curve is shown in the top left corner of the figure.
PeerJ Preprints | https://doi.org/10.7287/peerj.preprints.3214v2 | CC BY 4.0 Open Access | rec: 1 Sep 2017, publ: 1 Sep 2017

Table 1(on next page)
Chemical Properties and Fertility Analysis of Dredger-fill silt During Soil Formation: The
Tianjin Dredge–Fill Project Measured methods of chemical properties
PeerJ Preprints | https://doi.org/10.7287/peerj.preprints.3214v2 | CC BY 4.0 Open Access | rec: 1 Sep 2017, publ: 1 Sep 2017
1
Chemical
propertiesMeasured methods
pH Potentiometry (Fanggong S and Junliang L, 2004)
A-Kammonium acetate extraction and the flame photometric method
(Fanggong S and Junliang L, 2004)
A-Pmolybdenum blue colorimetric method(Fanggong S and Junliang
L, 2004)
SOM potassium dichromate method (Fanggong S and Junliang L, 2004)
EC FE3-type METTLER TOLEDO conductivity meter
K+ flame photometry(Shitan Bao, 2000)
Na+ flame photometry(Shitan Bao, 2000)
Ca2+atomic absorption spectrophotometry(422.7nm) (Shitan Bao,
2000)
Mg2+atomic absorption spectrophotometry(285.2nm) (Shitan Bao,
2000)
Cl- silver nitrate titration(Shitan Bao, 2000)
SO42- EDTA Indirect Complex metric titration(Shitan Bao, 2000)
Salinity sum of the eight major ions(Shitan Bao, 2000)
Nitrate-N continuous flow analyzer (dissolution in potassium chloride)
Ammonia-N
HCO3-
continuous flow analyzer (dissolution in potassium chloride)
Double Indicator - Neutralization Titration (Shitan Bao, 2000)
2
3
PeerJ Preprints | https://doi.org/10.7287/peerj.preprints.3214v2 | CC BY 4.0 Open Access | rec: 1 Sep 2017, publ: 1 Sep 2017

Table 2(on next page)
Chemical Properties and Fertility Analysis of Dredger-fill silt During Soil Formation: The
Tianjin Dredge–Fill Project Principal component analysis of chemical properties of silt.
PeerJ Preprints | https://doi.org/10.7287/peerj.preprints.3214v2 | CC BY 4.0 Open Access | rec: 1 Sep 2017, publ: 1 Sep 2017

1
Component scoring
coefficient
eigenvalues of the correlation
matrixProperties
f1 f2 f3
Compone
ntsEigenvalue
Proportion
%
Cumulati
ve%
Z1 HCO3- 0.163 0.022 0.034 f1 6.42 42.801 42.801
Z2 Nitrate-N 0.156 0.089 0.05 f2 5.102 34.015 76.817
Z3 SO42- 0.144 0.044 -0.099 f3 2.253 15.018 91.834
Z4 A-P 0.131 -0.068 0.238
Z5 K+ 0.112 -0.142 0.058
Z6 Salinity 0.044 0.241 -0.097
Z7 SOM 0.044 0.046 0.198
Z8 Na+ 0.043 0.241 -0.097
Z9 pH 0.014 0.095 -0.338
Z10 A-K -0.041 -0.066 0.304
Z11 Ammonia-N -0.044 -0.197 0.012
Z12 Cl- -0.06 0.166 0.001
Z13 Mg2+ -0.104 0.125 -0.018
Z14 Ca2+ -0.161 -0.052 0.146
Z15 EC -0.178 -0.019 -0.009
2
3
PeerJ Preprints | https://doi.org/10.7287/peerj.preprints.3214v2 | CC BY 4.0 Open Access | rec: 1 Sep 2017, publ: 1 Sep 2017
Table 3(on next page)
Chemical Properties and Fertility Analysis of Dredger-fill silt During Soil Formation: The
Tianjin Dredge–Fill Project Principal component score and comprehensive score of
samples
PeerJ Preprints | https://doi.org/10.7287/peerj.preprints.3214v2 | CC BY 4.0 Open Access | rec: 1 Sep 2017, publ: 1 Sep 2017
1
Samples F1 F2 F3 Comprehensive scores
S0 -0.12713 1.59001 0.6613 0.585133
S1 -0.24588 0.79137 -0.19104 0.134681
S4 1.78421 -0.38973 0.20062 0.664795
S6 0.11665 -0.23146 -1.74199 -0.28984
S7 -0.23516 -1.0934 1.19805 -0.29317
S8 -1.2927 -0.66679 -0.12694 -0.80161
2
3
PeerJ Preprints | https://doi.org/10.7287/peerj.preprints.3214v2 | CC BY 4.0 Open Access | rec: 1 Sep 2017, publ: 1 Sep 2017