chemical microbiological and toxicological …
TRANSCRIPT

CHEMICAL MICROBIOLOGICAL AND TOXICOLOGICAL
EVALUATION OF PHARMACEUTICAL EFFLUENT
WASTEWATER
BY
ALI SHARIF
(2011-VA-266)
A THESIS SUBMITTED IN THE PARTIAL FULFILLMENT OF THE
REQUIREMENT FOR THE DEGREE
OF
DOCTOR OF PHILOSOPHY
IN
PHARMACOLOGY & TOXICOLOGY
UNIVERSITY OF VETERINARY & ANIMAL SCIENCES,
LAHORE
2016

IN THE NAME OF ALLAH, THE MERCIFUL, THE
COMPASSIONATE

To,
The Controller of Examinations,
University of Veterinary & Animal Sciences,
Lahore.
We, the supervisory committee, certify that the contents and form of the thesis,
submitted by Ali Sharif, Registration number 2011-VA-266 have been found satisfactory and
recommend that it be processed for the evaluation by the External Examiner for the award of the
degree.
Prof. Dr. Muhammad Ashraf ___________________________
SUPERVISOR
Dr. Aqeel Javeed ___________________________
MEMBER
Prof. Dr. Aftab Ahmad Anjum ___________________________
MEMBER

I
DEDICATION
ALI SHARIF
I would like to dedicate my thesis to
My parents
Muhammad Sharif and Surriya Soofia
who loves me unconditionally and endorsed my decisions
My loving wife Bushra Akhtar
who encouraged and supported me during this whole journey
and to My Mentor
Professor Dr. Muhammad Ashraf
for his kind guidance throughout my career.

II
ACKNOWLEDGEMENTS
I am thankful to the most Gracious, Merciful and Almighty ALLAH who gave me the
health, thoughts and the opportunity to complete this work. I bow before my compassionate
endowments to HOLY PROPHET MUHAMMAD (P.B.U.H) who served a torch of guidance
and knowledge for humanity as a whole.
I deem it as my utmost pleasure to avail this opportunity to express the heartiest gratitude
and a deep sense of obligation to my reverend supervisor, Prof. Dr. Muhammad Ashraf (T.I),
Ex-Dean, Faculty of Biosciences, Ex-Chairman, Department of Pharmacology & Toxicology, for
his keen interest, valuable guidance, enlightened views, worthy suggestions, constructive criticism
and inspiring attitude during my studies, research project, and writing of this manuscript. .
I have been honored to express my heartiest gratitude to the member, supervisory
committee Dr. Aqeel Javeed, Associate professor, Department of Pharmacology & Toxicology
for his constructive criticism, moral support during the course work and finalizing this manuscript.
I gratefully acknowledge the invaluable help rendered by my member, supervisory
committee Prof. Dr. Aftab Ahmad Anjum, Department of Microbiology. He gave me time and
valuable suggestions during this research project.
It is a greater pleasure for me to express my heartiest gratitude and a deep sense of
appreciation to Higher Education Commission (HEC) for providing me financial support during
my whole Ph.D.
I gratefully acknowledge the invaluable help during my research Dr. Imran Altaf, Mr.
Mateen Abbas and Mr. Abdul Muqeet Khan, QOL-WTO and Dr. Saif-ur-Rehman Kashif
Department of Environmental Sciences University of Veterinary and Animal Sciences, Lahore.
They have helped me in my research work.
I am also appreciative to all the personal staff of post-graduate laboratories, Department of
Pharmacology and Toxicology, University of Veterinary and Animal Sciences (UVAS), Lahore
for providing their capabilities and keen interest which help me in conducting this research.
I am thankful to my friends, especially Muhammad Furqan Akhtar, Sajid Ali Chishti,
Sohaib Peerzada, Shehzada Khuram, Khaleeq Anwar, Irfan Hamid, Abdul Rehman and Moosa
Raza, for their moral support and encouraging opinions regarding my research work.
At the end, I would like to extend my thanks and compliments to my loving wife Bushra
Akhtar, kids Aroosh Ali and Ayesha Ali, brothers Ahmed Sharif and Usman Sharif for their
great care, affection and prayers which enabled me to continue and complete my studies
successfully.
Ali Sharif

III
TABLE OF CONTENTS
DEDICATION……………………………………………………………………………….... (I)
ACKNOWLEDGEMENTS…………………………………………………………………… (II)
TABLE OF CONTENTS……………………………………………………………………... (III)
LIST OF TABLES…………………………………………………………………………...... (IV)
LIST OF FIGURES…………………………………………………………………………... (VII)
LIST OF ABBREVIATIONS…………………………………………………………………. (IX)
SR. NO. CHAPTERS PAGE NO.
1 INTRODUCTION 1
2 REVIEW OF LITERATURE 7
3 MATERIALS AND METHODS 16
4 RESULTS 52
5 DISCUSSION 98
6 SUMMARY 111
7 LITERATURE CITED 113
8 APPENDICES 123

IV
LIST OF TABLES
TABLE
NO.
TITLE PAGE
NO.
3.1 Activation mixture composition 38
3.2 Different dilutions of pharmaceutical wastewater used for MTT assay 42
4.1 Toxic metal content in the effluent of pharmaceutical industries 53
4.2 Components found in pharmaceutical effluent PEW1 55
4.3 Compounds identified in pharmaceutical effluent waste water PEW1
using GC-MS
58
4.4 Total number of viable bacteria in pharmaceutical waste water sample
(PEW1)
61
4.5 Morphological and biochemical characteristics of bacterial isolates 62
4.6 Total number of isolated and identified bacteria from pharmaceutical
waste water (PEW1)
63
4.7 Maximum tolerable concentration of heavy metals against PEW 1
bacterial isolates
64
4.8 Antibiotic sensitivity and resistant activity of isolated bacterial isolates of
PEW1
65
4.9 Mean diameter and tail length of different pharmaceutical waste water
samples
67
4.10 Percentage fragmentation, Damage index and genetic damage index of
different pharmaceutical waste water samples
68

V
4.11 Mean diameter and tail length of different concentrations of
pharmaceutical wastewater sample (PEW 1)
73
4.12 Percentage fragmentation, damage index and genetic damage index
detected with increasing dilutions of pharmaceutical effluent (PEW 1)
74
4.13 Mean diameter and tail length of different concentrations of
pharmaceutical waste water sample (PEW 6)
75
4.14 Percentage fragmentation, damage index and genetic damage index
detected with increasing dilutions of pharmaceutical effluent (PEW 6)
76
4.15 Revertant colonies and mutagenic index obtained by exposure to
pharmaceutical waste water (plates with 30-300 colonies were selected)
80
4.16 Revertant colonies and mutagenic index obtained by exposure to
pharmaceutical waste water (PEW1) at different levels of dilutions
81
4.17 Dose dependent decrease in revertant colonies observed on exposure to
Pharmaceutical effluent waste water sample (PEW 6)
83
4.18 Quantification of viable cells in BHK-21 cell line prior to assay 85
4.19 Mean optical density (OD) and cell survival percentages against various
concentrations of PEW1 after incubation of 48 hours in MTT assay using
BHK-21 cell line
87
4.20 Mean optical density (OD) and cell survival percentages against various
concentrations of PEW6 after incubation of 48 hours in MTT assay using
BHK-21 cell line
89
4.21 Effect of vitamin E on SOD activity in rat plasma/blood, kidney and liver
caused by chronic exposure to PEW1 at different levels of concentration
92

VI
4.22 Effect of vitamin E on CAT activity in rat plasma/blood, kidney and liver
caused by chronic exposure to PEW1 at different levels of concentration
93
4.23 Effect of vitamin E on H2O2 activity in rat plasma/blood, kidney and
liver caused by chronic exposure to PEW1 at different levels of
concentration
94

VII
LIST OF FIGURES
FIGURE
NO.
TITLE PAGE
NO.
3.1 Schematic representation of chemical characterizations 18
3.2 Schematic representation of microbiological evaluation 22
3.3 Schematic representation of procedure adopted for comet assay 26
3.4 Schematic representation of procedure adopted for comet assay 33
3.5 Schematic representation of procedure adopted for MTT assay 43
4.1 Box whisker plot of heavy metal concentrations in different samples
of Pharmaceutical waste water.
54
4.2 Mass spectra of basic fraction of PEW 1 56
4.3 Mass spectra of lidocaine using DB1 column 56
4.4 Mass spectra of neutral fraction of PEW 1 57
4.5 Mass spectra of digitoxin using DB1 column 57
4.6 Mass spectra of dipyrone using DB-35ms column 59
4.7 Mass spectra of trimethoprim using DB-35ms column 59
4.8 Comets appeared in sheep lymphocytes when exposed to
pharmaceutical effluent wastewater (PEW 1)
69
4.9 Tail lengths of damage induced in sheep lymphocytes at an altered
concentration of PEW 1 (%v/v)
70
4.10 Comets appeared in sheep lymphocytes when exposed to
pharmaceutical effluent wastewater (PEW 6)
71

VIII
4.11 Tail lengths of damage induced in sheep lymphocytes at an altered
concentration of PEW 6 (%v/v)
72
4.12 Potential of mutagenicity of PEW1 in TA-100 strain in presence and
absence of metabolic activation mixture
82
4.13 Potential of mutagenicity of PEW1 in TA-102 strain in presence and
absence of metabolic activation mixture
82
4.14 Potential of mutagenicity of PEW6 in TA-100 strain in presence and
absence of metabolic activation mixture
84
4.15 Potential of mutagenicity of PEW6 in TA-102 strain in presence and
absence of metabolic activation mixture
84
4.16 Percentage survival of cells (CSP) against different log
concentrations of PEW1 on BHK-21 cell lines
88
4.17 Cell survival percentage (CSP) against different log concentrations of
PEW6 in MTT assay on BHK-21 cell lines
90
4.18 Effect of PEW1 on SOD activity in rat plasma, kidney and liver 95
4.19 Effect of PEW1 on CAT activity in rat plasma, kidney and liver 95
4.20 Effect of PEW1 on H2O2 activity in rat plasma, kidney and liver 95
4.21(a) Effect of pharmaceutical waste water on kidney 97
4.21 (b) Effect of pharmaceutical waste water on Liver 97
4.21 (c) Effect of pharmaceutical waste water on lungs 97
4.21 (d) Effect of pharmaceutical waste water on intestine 97
4.21 (e) Effect of pharmaceutical waste water on heart 97

IX
LIST OF ABBREVIATIONS
2AA 2-aminoanthracycline
AAS Atomic Absorption Spectrophotometer
BHK-21 Baby hamster kidney cell line
CAT Catalase
CuSO4 Copper Sulfate
DCM Dichloromethane
DMEM Dulbecco’s modified eagle cell culture medium
DMSO Di-methyl sulfoxide
DNA Deoxyribonucleic acid
EA Ethyl acetate
EDTA Ethylene-diamine-tetra-acetic acid
GC-MS Gas chromatograph mass spectrophotometer
GM Glucose Minimal
H2O2 Hydrogen peroxide
HCl Hydrochloric acid
IPA Isopropyl alcohol
K2Cr2O7 Potassium dichromate

X
LMPA Low melting point agarose
MCF McFarland unit
MDA Malondialdehyde
MTT Methyl thiazol tetrazolium
NaCl Sodium chloride
NaOH Sodium hydroxide
NMPA Normal melting point agarose
NOEC No observed effective concentration
PCP Pentachlorophenol
PEW Pharmaceutical effluent wastewater
ROS Reactive oxygen species
SCGE Single cell gel electrophoresis
TMP Trimethoprim
T-SOD Total superoxide dismutase
VB Vogel-Bonner

1
CHAPTER 1
INTRODUCTION
Water pollution is the direct or indirect addition of contaminating substances into the pure
water resources, which make the water inappropriate for drinking, bathing and/or for noncontact
recreation (Clark et al. 2003). During the past few years level of environmental pollutants,
agrochemicals and sewage waste has increased dramatically (Maduka 2006). Medicinal agents
have been used globally. The quantity of drugs existing in atmosphere is less, but constant input
may contribute to the potential risk to different life forms (Klavarioti et al. 2009).
There is a rapid rise in water contamination, the reason after this is a unprecedented population
growth, urbanization and industrialization (Ma et al. 2009). An agricultural country like Pakistan
has been facing the serious encounter of water contamination. Establishing of industrial
components and their makings have been tangled so there is a rise in intensity of water
contamination. Moreover the carelessness of responsiveness in guarding the environment and
improper organization of arrangements has increased the problems related to pollution of water
bodies (Zaroual et al. 2005).
Toxic chemicals such as Lead (Pb), Copper (Cu), Zinc (Zn), Mercury (Hg), Cyanide (CN)
got released into open water bodies caused mortality of fish and other beings present in water along
with lesions in humans even if present in lesser amounts.

2
An Epidemic of Minimata was linked to mercury poisoning associated with fish usage due
to discharge from mercury from a plastic industry setup. It was the first major outbreak of mercury
associated poisoning (Okoye 1992).
Different antibiotics and antiepileptic drugs were detected and their concentrations were
measured in waste waters and surface waters. The study was conducted in the Po Valley, Italy
where a waste water treatment plant was selected and the investigation was conducted in the
effluent and influent. Three sampling sites were selected and predicted concentrations were
compared with measured concentrations. Predicted and measured concentrations for ciprofloxacin,
azithromycin, trimethoprim and carbamazepine were accurately measured, whereas difference
between measured and predicted concentrations were very high for other compounds (Verlicchi et
al. 2014)
Dutch water reservoirs were studied for the detection of nine different drugs which are
metformin, metoprolol, sotalol, valsartan, losartan, irbesatran, hydrochlorothiazide, diclofenac and
carbamazepine. The predicted concentrations were compared with waste water concentrations,
removal in sewage treatment plants and recovery in regional surface water. It was suggested that
consumption data from local sources provided useful information regarding the selection of drugs
for monitoring. Metformin was found in highest concentrations in waste waters. Guanylurea which
is a biodegraded product of metformin was also detected in effluents and surface waters at concentrations
of 39-56 µg/mL and 1.8 to 3.9 µg/mL respectively (Oosterhuis et al. 2013)
Ciprofloxacin, tamoxifen and cyclophosphamide are anticancer agents frequently used in
hospitals. These agents might get released into the hospital effluents and in open environments. It
was established that concentration were low but data was not present regarding eco-toxicological
impact. Genotoxicity and cell viability was determined using comet and cell proliferative assays.
The results were compared with the standard algaltoxkit F and microtox tests. The results

3
suggested that that non-monotonic dose response was observed when cell viability was measured
using hepatic cell line HepG2. Single drug did not induced any DNA break whereas mixture of
drug combination was able to induce DNA breaks which was also confirmed by standard microtox
assay (Mater et al. 2014)
Hundreds of tons of drugs are emitted into the environment as such or their metabolites.
Most of pharmaceuticals have been reported at trace levels (hundreds of nanograms per liter) in
the rivers and lake water. It indirectly substantiates capability to persist in surface waters.
Complete data about adverse toxic effects on simple living organisms at the little amounts at which
pharmaceutical molecules are present in the environment are still lacking. The xenobiotic nature
of pharmaceuticals would suggest to impede their release to the environment by confining the
sources of pollution (Andreozzi et al. 2004). Different types of drugs and their metabolic products
have been reported in water bodies, especially water emitting from sewage treatment plants
(Halling-Sørensen et al. 1998), (Kümmerer 2009), (Sarmah et al. 2006).
The occurrence of drugs in municipal sewage was first stated in America. Drugs and
organic compounds have been reported in 139 streams of America from 1999 to 2000 (Kolpin et
al. 2002). Acidic and neutral drugs have been reported in Canada and Ontario emphasizing that
large portion of these drugs is removed partially from treatment plants (Carrara et al. 2008). This
has also been recognized as an environmental issue in Germany, where pharmaceuticals were
found in water bodies. Even the entire removal of many of these pharmaceuticals cannot be
possible with conventional sewage treatment (Brun et al. 2006).
Marine and life present on earth can be affected by components which are possibly
hazardous, when present in reduced quantities. Pharmaceuticals are lipophilic and non-

4
biodegradable along with their biological activities. These facts make them a concerning factor
when talking about the environment (Velagaleti and Burns 2006).
The concentration of individual drugs in effluent might be low, but the effect of combined
drugs with same mechanism known as additive effect and the drugs having different modes of
action called as synergism might have significant eco-toxicological effect (Brain et al. 2004). It is
suggested to evaluate the toxicity in a combination to inspect the collective consequence (Kolpin
et al. 2002), (Gros et al. 2007). Additive and synergistic effects of different drugs were observed
several times when concentration addition was investigated (Cleuvers 2003, Cleuvers 2004).
A compound alone may produce a little effect, but in mixture of compounds the effect may
be hazardous, which on the other hand might be underestimated. The compounds which are present
below the no observed effective concentration (NOEC) might contribute to the eco-toxicological
effect of mixture and a realistic picture can therefore be sketched through the analysis of mixture
of pharmaceuticals (Fent et al. 2006).
A current research project was undertaken for assessment of toxicity associated with
pharmaceutical wastewater. The entire Project was divided into three phases. Phase 1 was designed
for the characterization of pharmaceutical effluent wastewater (PEW) using atomic absorption
spectrophotometer and Gas Chromatography Mass Spectrophotometer.
During the 2nd phase microbiological evaluation was performed. Bacterial isolates were
separated from PEW and identified using different biochemical tests. Heavy metal tolerance and
antibiotic resistance were checked against different isolates identified.
During the 3rd phase toxicological evaluation was done using different biological assays.
Ames test was performed for the determination of mutagenicity, MTT assay was performed for

5
the determination of cell viability against different PEW samples. Geno toxicity was evaluated
using the alkaline comet assay.
During last stage oxidative stress was evaluated by exposing Wistar rats with PEW for 2
months and later estimating the enzyme levels spectrophotometrically using a kit method and
further evaluated for histopathological effects.
Exposure to inhabitants with untreated pharmaceutical wastewater is a serious threat. Very
few studies are available highlighting this issue. There is no data available reporting the toxic
effects of untreated pharmaceutical wastewater in Pakistan. None of previous studies regarding the
toxic potential of Pharmaceutical wastewater were performed on pure samples as such, all the
studies demonstrated some pretreatments to detect organic pollutants. Present study evaluated the
toxic effect of PEW as such. A comprehensive way was selected to determine the toxicological
profile of PEW. A comprehensive chemical characterization was performed to determine the actual
picture of organic and inorganic pollutants present in the PEW. Microbiological characterization
and the link between heavy metal tolerance and antibiotic resistance with PEW was not evaluated
before in Pakistan. None of the study previously reported the use of PEW for the assessment of
mutagenicity, genotoxicity and cytotoxicity. It was also tried to determine the effect of PEW in
animals when exposed chronically in order to establish a correlation of the toxic potential of PEW
with the emergence of diseases that are caused by imbalance of antioxidant enzymes. The
histopathological effects caused by chronic exposure of PEW were investigated. This study
evaluates certain approaches that may be applicable when assessing potential health risks
associated with direct or indirect exposure to pharmaceutical effluent wastewater.

6
Aims and Objectives
Chemical characterization of pharmaceutical effluent wastewater
Isolation and identification of bacteria from pharmaceutical effluent wastewater along with
investigation of their tolerance level for various chemicals.
Toxicological evaluation of pharmaceutical effluent wastewater using in-vitro and in-vivo
toxicity models

Review of Literature
7
CHAPTER 2
REVIEW OF LITERATURE
2.1 Organic compound
Pharmaceuticals and their metabolites enter into the environment through a variety of ways,
among them are elimination of human source, agriculture water, waste water from treatment
facilities and direct drainage in drains without treatment which is a serious cause of toxicity
(Crouse et al. 2012).
About 200 active pharmaceutical ingredients have been detected in aquatic environment
usually referred as micro pollutants, but several anthropogenic influences on aquatic environment
can be determined by using pharmaceutical compounds as tracers (Müller et al. 2012).
Physico-chemical analysis alone is not sufficient to estimate the toxicity associated with
composite water mixtures because of the synergistic, additive and antagonistic effects that might
produce in mixtures. Substitution methods for the assessment of toxicity/genotoxicity are
biological tests which have proven to produce global responses without previous knowledge of
mixture composition (Žegura et al. 2009). Both human and environmental health is endangered if
their effluent is being wrongly handled and disposed (Bakare et al. 2009), (Fick et al. 2009).
A large number of drugs detected were antibiotics, especially the fluoroquinolones, which
were expected toxic to bacteria present in water. It was a matter of serious concern that high levels
of fluoroquinolones led to the development of antibiotic resistance and production of multi
resistant pathogens al. (Li D 2008).
Production of drugs at a massive level has been identified as a source of pollution in an
environment containing active pharmaceutical ingredients. It was investigated that sewage

Review of Literature
8
treatment plant of Patancheru, near Hyderabad, India showed a high concentration of drugs
(mg/mL). This plant receives water from 90 bulk drug manufacturers of India. (Larsson et al.
2007).
Pharmaceuticals are used by people and after their application in different setups they are
entered into the environment by different pathways. The most common methods of entrance in the
environment is excretion following the ingestion of medicines and the disposing of drugs in the
form of wastewater. Sewage treatment plants do not degrade pharmaceuticals completely resulting
in discharge of significant concentrations in treated effluents. This effluent then becomes a source
of contamination in rivers and sometimes of ground water and drinking water. Sewage sludge also
proves to be a source of contamination in soil when it is applied via agricultural fields along with
manure application and its runoff which leads to a source of pharmaceuticals in agriculture fields.
The point of concern is not the high production of drugs rather their existence in the atmosphere
and biological activities (Fent et al. 2006).
Pharmaceuticals have been recognized as potential pollutants because they have similar
physicochemical properties. The least amount of pharmaceuticals (ng/L or μg/L) present in the
environment is capable of inducing toxic effects, e.g. antibiotics and steroids are capable of
inducing bacterial resistance in the natural bacterial flora and endocrine disrupting effects
(Hernando et al. 2006). Incorporation of contaminating substances, directly or indirectly in the
pure water makes the water unsuitable for any type of use (Clark et al. 2003).
Significant amounts of drugs have been found in wastewater emitting from hospitals,
wastewater from pharmaceutical units and leaching from landfill sites (Holm et al. 1995). Different
kind of medicines are being produced during any given period so the waste streams of
pharmaceutical wastewater are not always uniform (Houk 1992).

Review of Literature
9
2.2 Inorganic compounds
Water pollution in the water bodies have been aroused due to various industrial effluents
contributing serious concerns toward the environment. Drugs usually poorly absorbed when taken
orally in humans and animals excreted out via urine and feaces along with 25 to 75 % added
excipients (Krifa et al. 2013).
Pharmaceutical industries waste water may contain different heavy metals besides some
organic pollutants or phenolic compounds which are posing threat to water reservoirs (Anyakora
et al. 2011). A number of antioxidants have the capacity of chelating metal ions and reduces their
ability to form reactive oxygen species (Jomova and Valko 2011). Some elements which are toxic
to organisms might become beneficial under some other conditions (Lane et al. 2005), (Singh et
al. 2011). It has been found that redox metals like chromium, copper and iron including some other
metals have the property to induce toxic radicals. Metal ion disturbance homeostasis can lead to
generation of stress, which is characterized by the generation of toxic radicals, which can overcome
body antioxidant potential and results in DNA damage, lipid peroxidation, protein modifications
and other effects which are indicative to certain diseases which include severe disorders of heart,
metabolic disorders and central nervous system. The reason for these disorders might be attributed
to the generation of free radicals (Jomova and Valko 2011).
Heavy metals have been considered most abundant and toxic inorganic pollutants of the
environment. Metals cannot be degraded unlike many resistant pollutants which are organic in
nature but heavy metals do have a potential to accumulate in the food chain. Their genotoxic and
mutagenic effects have also been investigated in humans and characterized as priority
environmental pollutants (Martín-González et al. 2006).

Review of Literature
10
There is a strong emphasis that chronic toxic effects cannot be excluded. Individual toxicity
study of most drugs has been conducted but in the environment as a mixture of different drug
classes very few investigations were found. It is suggested and found necessary by many authors
to investigate the toxicity potential of pharmaceutical waste water mixture (Gros et al. 2007),
(Kolpin et al. 2002).
Metals bind with proteins and other structures in the body and affect the membranous
structures leading to generation of oxidative biomarkers leading to a number of diseases of various
organs (Valko et al. 2005),(MatÉs et al. 1999),(Mates 2000).
Organisms can be damaged by excessive levels of metals. Mercury and lead are not
considered vital and have no beneficial effect on organisms. Heavy metal pollution has many
negative consequences on the hydrosphere. Heavy metals have been considered most abundant
pollutants in sewage and industrial wastewaters. Certain heavy metals like Ni and Zn are
considered necessary for the growth of microorganisms in trace amounts but damages human
health at higher concentration. Heavy metals emissions might arise from casting of metals, fuel
burning, and using of antiseptics and disinfectants (Filali et al. 2000). Varying amount of heavy
metals is required by living organisms (Lane and Morel 2000). All metals are lethal at higher
concentrations (Chronopoulos et al. 1997).
2.3 Microbiology
Pharmaceutical industry being a major contributor to this risk have been involved in severe
heavy metal and drug associated toxicity. Effluent being a complex mixture is capable of altering
composition, distribution, diversity of microorganisms (Bisht et al. 2012)

Review of Literature
11
Resistant of bacteria to heavy metals have been reported previously, which have been
obtained from soils, waters and sediments. Bacterial resistance to heavy metals has been associated
with plasmid mediated mechanism which also encodes resistance to antibiotics (Filali et al. 2000).
Development of anti-biotic resistance bacteria and potential to accumulate antibiotics have
produced serious environmental concerns. Extensive usage of antibiotics in humans practice and
use as growth promoter has been involved in the generation of resistant pathogenic microbes.
Resistance of microbes to heavy metals and antibiotics is a serious concern because the mechanism
involved is plasmid mediated (Ramteke 1997). Genes responsible for heavy metals and antibiotics
resistance share same location on plasmids so it is necessary that resistant isolates should be
investigated for heavy metal tolerance (Novick et al. 1979).
2.4 Comet assay
DNA damage has been associated with a lot of substances. The reason behind the DNA
damage might be oxidation of bases, which will eventually lead to breakage of strands. DNA
damage can be accessed by comet assay. The method has been devised for the detection of damage
in DNA using different organisms (Azevedo et al. 2011).
It has become a normal practice to screen normal and wastewater for the detection of
mutagens. -Allium cepa root used to estimate the genotoxic effect in various areas of Croatia.
Sampling was performed for a three month period. Different physicochemical characters have been
studied during the study. Chromosomal aberrations, growth inhibition of roots and different
modifications in morphology have been evaluated during the study (Radić et al. 2010).
Genotoxicity of different pesticides in fresh water have been studied using two different
tests, including comet assay and micronucleus test. Micronucleus assay was conducted using blood
cells collected from different peripheral areas. (Kumar et al. 2010).

Review of Literature
12
Flame atomic absorption has been used for detecting heavy metals. High levels of heavy
metals were confirmed when samples taken from Etremoz lake waters in Northeastern Brazilian
coasts at various time intervals. The findings of the study confirmed that the quality of water has
been deteriorating in Etremoz lake due to heavy metals (Barbosa et al. 2010).
Comet assay was reported to be a delicate method for the determination of genetic damage
in the area of environmental toxicity studies as compared to micronucleus assay. It has been
influenced by the experimental conditions present in the laboratory because of its high sensitivity
(Frenzilli et al. 2009).
Metals have been associated with the production of tumors that is why genotoxicity of
these heavy metals is also necessary. Chromium is a documented genotoxic agent and exhibits its
mechanism via breakage of strand and several other mechanisms. Different streams in Brazil have
been investigated for checking the potential to induce genotoxicity with the help of comet assay
and a micronucleus assay in erythrocytes. Tannery waste water has been associated with the
greatest level of genotoxic effect. Mutagenic potential of the samples was also investigated with
the help of onion as an experimental model in the root tip test. The results validated that chromium
is the causative metal which has also been linked to mutagenicity (Matsumoto et al. 2006).
Unicellular protozoan has been evaluated in comet assay to detect the genotoxicity of
wastewater samples. Tetrahymena thermophile has been used in the assay with slight
modifications. A short term exposure was given to T. thermophila using hydrogen peroxide,
formaldehyde and phenol as controls. Waste water was checked for the genotoxic ability. The
results indicated that the effluent was less toxic than influents and treatment procedures decreased
the ability of waste water to induce genetic damage (Lah et al. 2004).

Review of Literature
13
Fish and earth worm have been the experimental subjects in determining the genotoxicity
of the waters of Noyyal River. The erythrocytes of fish were measured for the damage induced by
waste water and a ratio of damaged DNA length to width was observed. It was suggested that with
the increase of the time of exposure the damaged induced was also increased. (Rajaguru et al.
2003).
Human lymphocytes were exposed to different quantities of organic agents. These organic
agents were extracted from water samples of Tirpur collected from 12 different locations. It was
projected that all samples have a mutagenic potential and induces DNA damage in human
lymphocytes. It was further proposed that aromatic amines were responsible for this effect
(Rajaguru et al. 2002).
Silk coloring industry waste water was examined for the induction of mitotic abnormalities
in Allium cepa root system. Cytotoxicity of the effluent was studied by treating Allium cepa roots
with different concentrations of effluent (25, 50, 75, and 100%) for different durations (6, 12, 24,
and 48 h). Cell division was inhibited. A strong concentration dependent effect was evident from
a decline in the mitotic index. A wide range of mitotic abnormalities was also induced.
Abnormalities were appeared which included stickiness of chromosomes, fragments, bridges,
laggards, bi-nucleate cells and vacuolated nuclei. The results presented that silk dyeing industry
effluents act as potential mutagens (Sudhakar et al. 2001).
2.5 Ames test
Waste water was screened using different strains TA-98 and YG1041 for the mutagenic
potential. It was observed that rats pretreated with different concentrations of waste water exhibit
lesion in the colon and responded positively to both the tester strains (de Lima et al. 2007).

Review of Literature
14
The SOS chrome test was used to investigate potential of genotoxicity of waste water
collected in Rouen area. The test was performed on Escherichia coli. Also, different strains of
Salmonella typhimurium TA98, TA100 and TA102 were evaluated for mutagenicity. The
experiment was conducted with and without rat liver extract (Jolibois and Guerbet 2005).
Hospital waste water was investigated for the presence of mutagenicity using a chrome test
of mutagenicity and Ames fluctuation analysis using different strains of Salmonella typhimurium.
Sampling was performed at random for the whole day and this method was adopted for a period
of three months. It was suggested that mutagenic effect was different for samples collected at
different time intervals (Jolibois et al. 2003).
Wastewater samples were screened for mutagenicity before and after treatment. The
sampling was performed in summer and winter. Extraction was done using C18 .Wastewater
samples were collected before and after disinfection in summer and in winter. Alliumcepa test and
Tradescantia/micronuclei test was employed to access the damage induced by waste water. It was
suggested that mutagenicity was produced in experimental organisms when treated with
disinfectants especially ClO2 and ozone. (Monarca et al. 2000).
A 20 month study was conducted to check for the mutagenicity of water samples collected
from Cai River. Different strains (TA98 and TA100) were used to screen samples. The study was
conducted with and without metabolic activation system. The study concluded that TA 98 was
much more sensitive than TA100 (Vargas et al. 1993).
2.6 Cytotoxic evaluation
Two different fish cell lines PLHC-1 and RTG-2 were used to evaluate cytotoxicity of
different drugs having different modes of action. The values of effective concentration EC50 were

Review of Literature
15
calculated. The results indicated that PLHC-1 cell line produced more sensitive results than RTG-
2 cell (Caminada et al. 2006).
Fish hepatocytes were exposed to nine different drugs and cell viability was evaluated with.
MTT assay. 7-ethoxyresorufin-o-deethylase (EROD) was employed for the determination of
interaction with cytochrome P4501A (CYP1A) enzyme and di-chloro fluorescein (DCFH-DA)
assay was used to detect oxidative stress (Laville et al. 2004).
2.7 Oxidative stress
It has been found that metals have the property to yield radicals such as superoxide-
dismutase (SOD) and nitric oxide (NO) in living systems. Disturbance of metal levels can alter
oxidative biomarkers, which is characterized by the generation of reactive oxygen species (ROS)
which can overwhelm body capacity of antioxidant ion and resulted in DNA damage, protein
modifications and other effects that are indicative to certain diseases. The reason behind diseases
is the generation of superoxide associated radical, hydroxyl radical, and other ROS leading to
mutagenicity and carcinogenicity. Antioxidants like vitamin C, vitamin E and glutathione (GSH),
can chelate heavy metals and help reduce oxidative stress (Jomova and Valko 2011).
It is also found that metal-mediated formation of free radicals causes various modifications
to DNA bases, enhanced lipid peroxidation, and altered calcium and sulfhydryl homeostasis. These
processes leads to a number of diseased states including Alzheimer’s, cancer, ischemia, failures in
immunity and endocrine dysfunctions (Valko et al. 2005),(MatÉs et al. 1999),(Mates 2000).

CHAPTER 3
MATERIALS AND METHODS
3.1. Study Area
Lahore, is the second largest city of Pakistan. It is the capital of Punjab province. It is
situated on river Ravi. Lahore has been categorized among top 30 populated urban areas of the
world. The population is greater than 10 million. The weather is tremendously hot during summer.
An average rainfall of 735 mm has been reported. (Shakir et al. 2012). Lahore is located in
northeast of Pakistan and with northern India. It is the second largest city of Pakistan (Ghauri et
al. 2007). It is a metropolitan city with a population of more than 10 million and is growing at a
rate of 4% (Ali and Athar 2010).
3.2. Sampling
Samples were collected in summer season from April 2013 to June 2013. The industries
were selected at random and sampling was performed for ten pharmaceutical industries. Composite
sample was made by collecting waste water 8 times during a 24 hour time interval. It was assured
that the sample bottles did not touch the side and foot of stream flow. Samples were placed in an
ice bath during the collection procedure.
All the samples were gathered in autoclaved amber colored acid washed bottles. The
samples were used to rinse the bottles before collection. An air gap was left in each bottle at the
top. Samples were placed at 4°C. First pharmaceutical waste water sample PEW1 was divided into
two sets for the evaluation of polar contaminants (drugs) and nonpolar pollutants which are heavy
metals.

Materials and Methods
17
All the ten samples were used as such for the evaluation of toxicity using different
bioassays. However sample PEW1 and PEW6 were further diluted two fold to check for the effect
of diluted concentrations of PEW on experimental models.
Sample collection sites

Materials and Methods
18
3.3. Chemical characterization
Figure 3.1 Schematic representation of chemical characterizations
Materials and Methods
19
3.3.1. Sample preparation for nonpolar pollutants
Digestion was performed in a fume hood with concentrated HNO3. 250 mL of each sample
was subjected to digest with acid at a temperature if 150°C and then raising the temperature to
250°C. Prior to digestion, samples were placed overnight for the removal of bubbles. The end point
for digestion was considered a transparent greenish color. After cooling of samples each of the
sample was diluted to 25mL using concentrated HNO3. All the samples were analyzed after
filtration.
3.3.2. Standard preparation
Solutions were purchased from Fluka Analytical TraceCERT Reg. and Fisher Scientific
UK limited, Bishop Meadow road Leicestershire. The strength of different standards were 1000
mg. L-1. Calibration curves were drawn for all heavy metals to be analyzed. Calibration curves
were prepared from 1 mg.L-1 to 5 mg.L-1 for zinc (Zn) and Iron (Fe). Copper (Cu), Chromium (Cr),
Lead (Pb), Arsenic (As) calibration curves were made within the range of 0.2 mg.L-1 to 1 mg.L-1.
Whereas Cadmium (Cd) calibration curves were drawn in range of Serial dilutions were made in
the range of 0.02 to 0.1 mg.L-1. The apparatus used was Z-8230 Zeeman atomic absorption
spectrophotometer.
3.3.3. Sample preparation for polar pollutants
A micro filter (0.22 µm) was used to filter all the samples before analysis. Fractions of the
sample were prepared using liquid liquid extraction. (Aleem and Malik 2005) (Seiler et al. 1999).
Acidic, basic and neutral fraction of samples was prepared for GC-MS analysis as drugs exist in
these three forms.
Acidic fraction was prepared by taking 2 mL of sample mixed with 0.1 mL (1 M, NaOH)
and then incubate it at 25 °C for 10 minutes. pH was adjusted to 3 with phosphate buffer of pH 3

Materials and Methods
20
(Europe 2004) and the sample was extracted with 5 mL dichloromethane (DCM). The sample was
centrifuged at 5000g for 5 minutes and the DCM layer was dried at 50°C and used for analysis by
using DCM as solvent.
Neutral drugs fraction was prepared by taking 5 mL sample mixing it with 3 mL phosphate
buffer pH 6.
Basic fraction was prepared by taking 9 mL of sample and mixed with 2mL 0.5M Na2CO3
having a pH of 9. Extraction was performed with a mixture of DCM and isopropyl alcohol (IPA)
3:1 v/v. The organic layer was collected by centrifugation at 1500g for 5 minutes. Layer was dried
and further used for analysis by incorporating ethyl acetate.
GC-MS was conducted for the three fractions previously prepared. GC system, Agilent
Technologies 6890N was used to perform analysis, which is connected with a mass selective
spectrophotometer 5975 inert XL. The apparatus was equipped with an injector 7683 B series.
Different columns were used for the analysis. The column used were DB-1-1022, DB35-ms 122-
3832 and DB-5-122-5032 (Nikolaou et al. 2007). Comparison of mass spectra was performed
using the NIST library (Alam et al. 2009).
The method used for the column DB-1-1022 was 40°C as the initial temperature
maintained for 1 min, the temperature was increased to 290 °C by raising it at a rate of 25 °C/min,
maintained 40°C for 0.38 minutes and 290°C for 13.09 minutes. Helium was used as the carrier
gas at 25cm/s measured at 40°C. Split injection was used at a ratio of 40:1 at 250 °C along with
MSD detector at 230 °C. The Full scan run was performed at m/z 30-500 for finding of polar
contaminants.
Program conditions with the column DB35-ms 122-3832 were initial temperature at 50°C
for 1 min, raising to 50-100°C with a rate 25 °C/min and further increasing to 100-300 °C with a

Materials and Methods
21
rate of 5°C/min and reaching at a temperature of 300 °C for 5 minutes. Helium was used again as
the carrier gas at 35cm/s maintained at a temperature of 50°C. Split less injection at 250 °C was
used along with the MSD detector at 300 °C. The full scan run was directed at m/z 50-500 for
detecting polar contaminants.
A third method adopted with the column DB-5-122-5032 was a 80 °C hold for 1 minute, 80
to 280 °C at a rate of 10 °C/min, 280 °C for 9 min. Split injection 1: 40 at 250 °C was used with
helium as a carrier gas and MS detector at 230 °C with full scan at m/z 30-500.
3.4. Microbial load
Microbial loads of the pharmaceutical waste water samples were determined on tenfold
dilutions prepared under aseptic conditions. Each of these dilutions were mixed with molten
nutrient agar at a temperature of 45°C. All of these dilutions of pharmaceutical waste water were
incubated in sterilized Petri plates at a temperature of 37°C for 24 hours. Total number of viable
bacteria were counted as colony forming units per ml cfu/ml. Plates with 30 to 300 colonies were
selected for bacterial load.

Materials and Methods
22
Figure 3.2 Schematic representation of microbiological evaluation

Materials and Methods
23
3.4.1. Bacterial isolation and identification
Bacteria were isolated and identified according to Bergey’s manual of systemic
bacteriology (Goodfellow et al. 2012). All types of colonies from each plate (previously counted)
of pharmaceutical wastewater were poured on sterilized nutrient agar plates and incubated for 24
hours. Two way streaking was performed for isolation purposes. Identification was performed by
observing macroscopic characteristics such as color, size and shape, gram staining and using a
series of biochemical tests.
3.4.1.1 Glucose fermentation test
Isolated colonies were transferred to sterile tubes containing phenol red broth. The tubes
were incubated at 37°C for 24 h. Change of color from red to yellow was recorded as positive
result which was due to change in pH of media to acidic environment indicating bacteria had
fermented glucose.
3.4.1.2 Mannitol fermentation test
Isolated colonies were transferred to sterile tubes containing phenol red mannitol broth
(nutrient broth with 0.5 to 1 % mannitol). The tubes were incubated at 37°C for 24 h. Change of
color from red to yellow was recorded as positive result which was due to change in pH of media
to acidic environment indicating bacteria had fermented glucose.
3.4.1.3 Indole test
Indole test was performed on purified bacterial isolates and results were recorded. Pink to
wine color ring after addition of reagent was observed showing positive results and pale yellow
color ring was observed in case of negative results

Materials and Methods
24
3.4.1.4 Oxidase test.
A filter paper was soaked with the substrate tetra methyl-p-phenylenediamine di-
hydrochloride. It was moistened with DW. Colony was picked with platinum loop and smeared on
filter paper. Deep blue to purple color was recorded for positive result. No color was observed in
case of negative results.
3.4.1.5 Catalase test
Bacterial colony was poured on a clean dry glass slide using a sterile loop and a drop of
3% Hydrogen peroxide was poured over it. Bubbling with rapid evolution of oxygen was recorded
as positive result whereas no bubbling was exhibited for the negative result.
3.4.1.6 Coagulase test
Staphylococci colony was emulsified with a drop of water on two clean glass slides. A drop
of rabbit’s plasma was added in one slide and mixed gently. Clumping was observed within 10
seconds. No plasma was added on the second suspension which served as a control to differentiate
granular appearance and true coagulase clumping.
3.4.1.7 Starch hydrolysis test
Bacterial inoculum was streaked on agar plate’s containing starch. Inoculated plate was
incubated at 37°C for 24 h. Later iodine reagent was added. Presence of clear halos surrounding
colonies were recorded as positive result.
3.4.1.8 Mannitol salt agar test
Purified isolates were streaked on mannitol salt agar plates containing 7.5% sodium
chloride to inhibit growth of other bacteria except staphylococcus and phenol red indicator. Plates
were incubated for 24 h and change of color to yellow was recorded as positive result as mannitol
was fermented due to decrease in pH and converting neutral medium to acidic.

Materials and Methods
25
3.4.2. Tolerance assessment
The isolated and identified bacteria of pharmaceutical waste water were assessed for their
tolerance against potassium dichromate (K2Cr2O7) and Copper Sulfate (CuSO4) with
concentrations ranging from 25µg/mL to 500µg/mL with an increment of 25µg/mL. Nutrient agar
was poured in Petri plates and the required volume of metal from stock solutions were added and
allowed to solidify. Isolates were streaked on the plates with metal salts and placed in incubator at
37°C for 48 h. Maximum tolerated concentration was defined as the highest concentration of heavy
metal that allows growth of bacteria after 48 h (Bauer et al. 1966, Samanta et al. 2012)
3.4.3. Bacterial resistance
Strains isolated were analyzed for the sensitivity against different antibiotics. The selected
antibiotics were vancomycin 30 µg/disc, co-trimoxazole 35 µg/disc, methicillin 10µg/disc,
chloramphenicol 25µg/disc, streptomycin 10µg/disc and levofloxacin 5µg/disc. Mueller-Hinton
agar plates were prepared and were checked for the sterility by placing overnight in an incubator.
Bacterial isolates were spread on the plates and anti-biotic discs were placed on the agar, sealed
plates were placed in an incubator at 37°C for 24 h (Hudzicki 2009). Zones of inhibition were
calculated and isolated strains were categorized as resistant or sensitive. All experiments were
conducted in triplicate.
3.5. Comet Assay
Single cell gel electrophoresis is a valuable tool for the determination of DNA damage
induced by toxic compounds on an individual cell. It consists of a series of steps, each step is
equally vital for the successful processing of experiment. The basic processing involves the
embedding of suspension of a single cell on a cavity slide coated with agarose gel. The cells
undergo lysis in a detergent and the exposed DNA is electrophoresed. Fragments of DNA being

Materials and Methods
26
negatively charged move toward anode. The slides were stained with a fluorescent dye e.g.
ethidium bromide and observed under electron microscope.
Figure 3.3 Schematic representation of the procedure adopted for the comet assay
3.5.1. Instrumentation
Electrophoresis system, centrifuge machine, refrigerator, fluorescent microscope,
micropipette, microwave oven, tips, magnetic stirrer, pH meter, aluminum, foils, cavity slides,
steel tray with lids, pipette, coverslips, beakers, flasks, syringes, capped test tubes, test tube stands,
Eppendorf tubes, pipette, conical flasks.

Materials and Methods
27
3.5.2. Chemicals
Lymphocyte separation media, RPMI 1640, agarose, boric acid, methanol, phosphate,
sodium chloride, Trizma base, di sodium EDTA, sodium hydroxide, di-methyl sulfoxide (DMSO),
Triton X, , ethidium bromide.
3.5.3. Reagents preparation
Reagents were prepared just before the start of the experiment and all the accessories like
gloves, face mask, goggles and lab coat were used while handling the chemicals.
3.5.3.1. Phosphate buffer solution
PBS tablets commercially available were solubilized each tablet in 1000 mL of distilled
water. pH of the buffer was checked and stored at 4°C.
3.5.3.2. Normal melting point agarose
Dissolve 1000mg in 100 mL warm water. Heat it until a clear solution is formed.
3.5.3.3. Low melting point agarose
Dissolve 1000 mg of agarose in 200 mL hot distilled water and heated till it becomes a
clear solution. Before use it was placed in microwave oven and then placed in a water bath to
stabilize the temperature.
3.5.3.4. Lysing solution
1000 mL lysing solution was prepared by dissolving 146.1 gm sodium chloride (NaCl),
37.2 gm ethylene-diamine-tetra-acetic acid (EDTA) and 1.2 gm trizma base in 700 mL of distilled
water respectively. Each ingredient was added after complete dissolution of first ingredient. pH of
the solution was adjusted to 10 by using sodium hydroxide (NaOH) or hydrochloric acid (HCl).
Volume was made 890 mL using distilled water. Finally, 10% of total volume, i.e. 100 mL of
DMSO and 1% of total volume 10 mL triton-X was added.

Materials and Methods
28
3.5.3.5. Alkaline buffer solution
10 N NaOH solution 20gm in 50mL distilled water (DW) and 200mM EDTA 0.73gm in
10mL of DW were prepared. 30 mL NaOH solution and 5 mL EDTA solution were mixed in 1 L
flask and final volume was adjusted 1000 mL. The pH of the solution was raised to 13.
3.5.3.6. Electrophoresis buffer solution
Trizma base 10.8 gm, EDTA 0.93 gm and boric acid 5.5 gm were mixed in a flask by
adding in a sequential manner after complete dissolution of the first ingredient on a hot plate using
a magnetic stirrer and final volume was made up to 1000mL.
3.5.3.7. Neutralization buffer solution
48.5 gm of Tris base was dissolved in 700 mL of DW. pH of the solution raised 7.5 with
10M NaOH and volume was increased to 1000 mL with DW.
3.5.3.8. Staining solution
10 mg of ethidium bromide was dissolved in 50 mL of distilled water. It was enveloped in
aluminum foil. 10X solution of ethidium bromide was prepared by diluting 1 mL of 10X in 9 mL
DW and was used for staining of slides.
3.5.4. Experimental procedure
The sample was diluted with distilled water and six different concentrations were prepared.
Dimethyl sulfoxide 20% (DMSO) is positive control. Negative control used in the experiment was
distilled water. Comet assay was implemented based on the protocol described in (Tice et al.
2000).

Materials and Methods
29
3.5.4.1. Preparation of base slides
Slides after being sprayed with ethanol, blazing was done to remove any oily, greasy
material or dust particles. Labelling was done with the slides according to sample number. Slides
were dipped in normal melting point agarose (NMPA). In a manner that one third remained
undipped and placed on a tray after wiping off the lower area. Slides were placed in the refrigerator
for 12 h.
3.5.4.2. Procedure for cell separation
Peripheral blood of a healthy sheep was collected in a heparinized tube. 3mL of sheep
blood was layered over a 5 mL of lymphocyte separating media (LSM) in a capped glass tube
gently so that blood and LSM did not get mixed. It was centrifuged at 8000g for 45 minutes at 25
°C. Three layers were formed. Lymphocytes were present in the middle layer the Buffy coat. Cells
were sediment in the deepest layer and the plasma layer as formed on the top. Sheep was used as
an experimental organism in this assay because the experiment was standardized using sheep blood
during pilot project before conducting the study. The experiment was carried out following the
experimental protocol in agreement with the Institutional Guide Lines for Care and Use of
Laboratory Animals of University of Veterinary and Animal Sciences, Lahore, Pakistan
Buffy coat was extracted into a 5 mL of RPMI 1640. Centrifugation was performed at 300
g for 10 min until the formation of lymphocyte pellet. The lymphocytes pellet was again suspended
in RPMI 1640. Lymphocytes were counted using hemocytometer and final cell count adjusted was
2x10⁴ cells per 100 µL.

Materials and Methods
30
3.5.4.3. Preparation of test dilutions
Ten pharmaceutical effluent samples were used as such and two samples were diluted to
different concentrations to check the effect of different dilutions on genotoxicity based on comet
assay. Two fold dilution of samples was made using distilled water.
3.5.4.4. Cell exposure to test samples
1 mL of test sample and 100 µL of cell suspension were added in an Eppendorf tube, the
tubes were inverted and placed in incubation for a period of 3 h. The cells were centrifuged at 3000
rpm for 5 minutes and lymphocyte pellets were settled down at the bottom. Test chemical was
aspirated and discarded using a 1cc syringe and pellets were re suspended in RPMI 1640.
3.5.4.5. LMPA Layering
10 µL treated lymphocyte were mixed with 65 µL LMPA. It was dropped on the base slide,
the slides were refrigerated for 10 minutes so that the agarose hardens. A third layer of LMPA 90
µl was placed and again refrigerated.
3.5.4.6. Lysis solution
Lysing solution was prepared freshly in the tray along the sides gently as to minimize the
disturbance to the slides. The tray was covered and placed in refrigerator for 10 h.
3.5.4.7. Exposure to alkaline buffer solution
Lysing solution was aspirated from the tray and the freshly prepared alkaline buffer was
poured in the tray pH >13. The slides were allowed to remain there for 20 minutes, after which the
buffer solution was aspirated. An alkaline buffer causes the unwinding of DNA and damage was
expressed.

Materials and Methods
31
3.5.4.8. Electrophoresis
Electrophoresis buffer was poured into a horizontal tube of apparatus. 5 slides were
electrophoresed at one time. The power supply was given to apparatus with a 24 V and 300 mAmp
current. Slides were electrophoresed for a 30 minute period.
3.5.4.9. Neutralization process
The slides were placed in dry tray after electrophoresis were completed. Neutralization
solution was poured gently into the tray and remained there for 10 minutes, aspirated and then this
process was repeated three times.
3.5.4.10. Fluorescence dye stain
1-X solution of ethidium bromide was prepared. 70 µl of ethidium bromide was fell over
the cavity slides using a micropipette and remained there for 5 minutes. After that chilled water
was used for removing excessive stain. The slides were washed for three times.
3.5.4.11. Visualization
The slides were observed under a fluorescent microscope at the 40-X lens. All the slides
were observed immediately after processing. Intensity of light emitted was directly proportional
to the amount of due bound to DNA.
3.5.4.12. Scoring of a comet
Each slide was observed under a microscope and 50 images of comet per slides were taken.
The comets were analyzed using a software image j. Length of head diameter and migrated DNA
was documented. Percentage fragmentation and damage index of all the dilutions were calculated.
3.5.5. Controls
3.5.5.1. Negative control
1% DMSO was used as negative control (1 mL)

Materials and Methods
32
3.5.5.2. Positive control
DMSO 20 % was used as positive control (1 mL)
3.5.6. Interpretation of results
Result of come assays was interpreted using following criteria and indices.
3.5.6.1. Classification of comets
The comets were classified into following 4 categories based on tail length
Class 0 unharmed cells
Class 1 tail length was smaller than or equivalent to head diameter
Class 2 tail length larger than head diameter, but lower than double of the head diameter
Class 3 tail length bigger than double of the head diameter
3.5.6.2. Damage index
3.5.6.3. DNA fragmentation
3.5.6.4.Genetic damage index
3.6. Bacterial reverse mutation assay
Dr. Bruce Ames developed Ames assay in 1970 for the detection of mutagenicity. An
auxotroph strain of bacteria is used in this model for the determination of mutagenic probability
of test substance in which bacteria are unable to synthesize required nutrients. If test substance
proves to be mutagenic it means it has caused back mutation.

Materials and Methods
33
Figure 3.4 Schematic representation of the procedure adopted for Ames assay

Materials and Methods
34
3.6.1. Instrumentation
Petri plates, test tubes (10 mL, 20 mL), glass pipette (5 mL, 10 mL), capped test tubes,
autoclave, incubator, horizontal laminar flow hood, deep freezer, drying hot air oven, water baths,
analytical balance, Eppendorf tubes, syringes ( 1cc, 10 cc, 20 cc), micro filters (0.22 µm), Burner,
glass flasks, beakers, platinum wire loop, glass spreader, aluminum foil, face mask, magnetic
stirrer, sterile test tubes, test tube rack, micropipette.
3.6.2. Chemicals required
Distilled water, phosphate buffer, salmonella Shigella agar, purified agar, magnesium
sulfate monohydrate, nutrient agar medium, potassium phosphate dibasic anhydrous, sodium
phosphate di hydrate, dextrose.
3.6.3. Test organism
Salmonella typhimurium strains with mutations were used. These are genetically modified
and mutations are induced in different genes of histidine operon.
3.6.4. Strains used
Two strains TA 100 and TA 102 of bacterium Salmonella typhimurium were purchased
from Environmental Bio Detection Products Incorporation (EBPI) Canada.
3.6.5. Preparations of media and reagents
3.6.5.1. Nutrient broth preparation
5gm of nutrient broth was mixed with 200mL DW. The mixture was stirred to solubilize
the components. Nutrient broth was divided into four test tubes and autoclaved. Both strains TA
100 and TA 102 were grown in the test tubes for overnight in the incubator.

Materials and Methods
35
3.6.5.2. Nutrient agar preparation
Nutrient agar (1.5 gm) was dissolved in distilled water (100mL) in a flask. Solubilize it in
water and autoclaved. The medium was allowed to cool till the temperature reaches 65°C and
media was poured in petri plates. The plates were incubated at 37°C for 24 hours to validate the
sterility of media. The plates were placed in refrigerator upside down till next use.
3.6.5.3. Vogel-Bonner salt preparation
65 mL of DW was taken in 1000 mL flask and ingredients were added in the following
manner such that next salt is added after the complete dissolution of the first one on a hot magnetic
plate with continuous stirring. Magnesium sulphate 1 gm, citric acid monohydrate 10 gm,
potassium phosphate di basic anhydrous 50 gm and sodium ammonium phosphate 17.5 gm were
added according to the said order. The solution was divided into 20 mL portions in glass tubes and
autoclaved. Then they were allowed to cool, tighten up and stored at 25 °C in a dark place.
3.6.5.4. Preparation of glucose solution 10 % v/v
The solution was prepared by mixing dextrose in distilled water. 10 g of dextrose was
dissolved in 70 mL DW, mix it with the help of magnetic stirrer until a clear solution was formed
and the final volume was made up to 100mL. The solution was divided into two portions, 50 mL
each in loosely capped flasks and autoclaved. It was used immediately after cooling (Mortelmans
and Zeiger 2000).
3.6.5.5. Preparation of GM (Glucose Minimal) agar
Purified agar (15 gm), was mixed in 900 mL DW in a glass flask. It was autoclaved and
when the temperature reached to 65 °C, Vogel-Bonner salts (20mL) and glucose solution (50 mL)
were added and mixed .This mixture was uniformly poured in petri plates.

Materials and Methods
36
3.6.5.6. Preparation of ampicillin solution
pKM 101 plasmid presence in mutant strains of TA100 and A102 was confirmed by
ampicillin disk. Ampicillin solution was prepared by dissolving 80mg in 10mL of water. The
solution was filtered through 0.45µm filter before use.
3.6.5.7. Preparation of crystal violet solution (0.1%)
Crystal violet dye (10mg) was dissolved in 10 mL of DW. The solution was stored in an
amber colored bottle at 4-8 °C.
3.6.5.8. Preparation of biotin solution (0.01 %)
It was used for the enrichment of glucose minimal (GM) agar plates and used for the
detection of strain. The solution was filtered through 0.45 um filter prior to use and stored at 4°C.
1mg was dissolved in 10mL of water.
3.6.5.9. Preparation of histidine solution (0.5 % w/v)
Histidine solution was prepared by dissolving 50mg in 10mL of DW. The solution was
subjected to pass through 0.45µm filter and stored at 4°C. Histidine solution was used to check the
strain of bacteria.
3.6.5.10. Preparation of histidine/biotin solution 0.5mM
It was prepared by adding 9.6 mg of L-Histidine and 12.4mg of D-Biotin in 100mL of
water. Histidine gets dissolved immediately, while biotin dissolved slowly in DW. Histidine/biotin
solution was passed through 0.45 um syringe filter and stored at 4°C.
3.6.6. Metabolic enzyme activation system S9 mixture
S-9 fraction is a rat liver homogenate which contains microsomal supernatant portion along
with S9 cofactors; given in table no 3.1. It was obtained from EMPI Canada. As salmonella
bacteria were deficient in metabolizing capability these cofactors supplied them with the vitality

Materials and Methods
37
to regenerate the system. The system was prepared freshly and passed through 0.45 µm syringe
filter and stored at 4°C. The activation mixture was prepared as follow.

Materials and Methods
38
Table 3.1 Activation mixture composition
1. S-9 mixture components
Volume
mL µl
S9-A [Magnesium chloride+ Potassium chloride] 0.40 400
S9-B [Glucose-6-phosphate] 0.09 90
S9-C [Nicotine amide Di-nucleotide Phosphate (NADP)] 0.81 810
S9-D [phosphate Buffer Saline (PBS)] 9.98 9980
S9-E [Sterile Distilled water] 6.72 6720
S9-F [Rat liver extract] 2 2000
Final Volume 20 20, 000
0.5 mL of S-9 mixture was provided to each plate.

Materials and Methods
39
3.6.7. Preparation of lyophilized bacteria
Salmonella typhimurium TA100 and TA102 were purchased from Environmental Bio
detection Products Incorporation (EBPI) Canada. 1 mL of sterilized broth was used to cultivate
the bacteria. The culture was placed in an incubator for 24 hours. The colony was picked from
culture and streaked on nutrient agar plates.
3.6.8. Tester strain purification
A single colony was picked from plate and incubated in broth and placed in an incubator
for 24 hours. Again a single colony from culture was taken and grown on agar plates. Both TA100
and TA102 strains were purified by repeating this process thrice.
3.6.9. Genetic analysis
Several tests were conducted for the genetic identification of strains TA100 and TA102.
3.6.9.1. Biotin dependence
GM agar plates enriched with histidine were prepared. 0.5%w/v histidine was made and
0.08mL was poured on agar plates. The bacterial strains were streaked on agar plates and growth
was observed after 24 hours.
3.6.9.2. Histidine dependence
GM agar plates enriched with biotin were prepared. 0.1%w/v biotin was made and 0.08mL
was poured on agar plates. The bacterial strains were streaked on agar plates and growth was
observed after 24 hours.
3.6.9.3. Histidine/biotin dependence
GM agar plates were prepared with 0.01%biotin and 0.5%histidine. 0.08mL of each was
poured in the agar plates. The tester strains were placed on agar plates with the said amount of

Materials and Methods
40
histidine and biotin separately. The plates were placed in an incubator for 24 hours to check the
growth of bacteria.
3.6.9.4. Crystal violet test
GM agar plates augmented with histidine and biotin were streaked with TA100 and TA102
under sterile conditions. A crystal violet soaked disc prepared by dipping filter paper in 0.1 %
solution was placed in the center of both the plates. The plates were incubated to check for the
growth of bacteria.
3.6.9.5. pkM101 plasmid
GM agar plates enriched with histidine and biotin were streaked with both bacteria under
sterile conditions. Ampicillin solution 10µg/mL was placed and filter paper was soaked in the
solution which were placed in each of the two plates of both the strains and incubated at 37 °C. It
was used to access the resistance of mutant strains against Salmonella typhimurium in comparison
with wild type Salmonella typhimurium.
3.6.10. Working suspension of bacteria
Freshly prepared bacteria cultures were prepared before the start of the experiment. It was
ensured that bacteria must be in log phase when the experiment was conducted. A single colony
from each purified plate was inoculated in 5mL of autoclaved broth culture. The broth was later
incubated. The growth was confirmed using spectrophotometer and 0.5 McFarland (MCF) was
considered as standard. It equals 1-2× 10⁸ colonies. The absorbance of bacteria was adjusted to 0.1
with the help of autoclaved broth.

Materials and Methods
41
3.6.11. Experiment
Mutagenicity testing of pharmaceutical waste water was carried out using the plate
incorporation assay, with and without metabolic activation mixture. Steps below were followed
prior to pre incubation assay.
Inoculation of tester strains was done in sterilized nutrient broth 15-18 hours before the
experiment was carried out to obtain a fresh culture.
All glass equipment was sterilized and labelling was performed according to dilutions.
Metabolic activation system was prepared by mixing and placed on ice till further use. Stock
solutions and dilutions of PEW were prepared. Top agar was prepared according to the method
explained above.
3.6.11.1. Pre incubation assay in the absence of metabolic activation system
The plate incorporation assay was modified and in pre incubation assay test chemical and
bacteria were exposed prior to plating on the GM agar plate. Test dilution (0.5 mL) along with
tester strains Salmonella typhimurium (TA100 and TA102) were added in an autoclaved screw
capped test tube. Test dilution was mixed with mutant strains on a vortex and test tubes were
incubated for 20 minutes. GM agar plates already prepared with 0.5mM histidine/biotin solution
according to the method mentioned above were exposed to test dilution and mutant bacteria
mixture. The agar was allowed to cool until it was solidified. The plates were incubated at 37 °C
in an incubator for 48 hours and revertant colonies were observed and counted. Number of
revertant colonies were counted.
3.6.11.2. Pre incubation assay without metabolic activation system
Xenobiotics might become mutagenic after their metabolism through liver enzymes as their
metabolites could be mutagenic. A metabolic activation system was introduced which was

Materials and Methods
42
extracted from rat liver and the contained enzymes were provided along with test chemical and
mutant bacteria. The purpose was to obtain results which might concord with in-vivo system. 0.5
mL of a metabolic activation system was introduced in each plate along with mutant bacterial
strain and test dilution of PEW.
3.6.12. Control groups
3.6.12.1. Positive control
Positive control for TA 100 was sodium azide (5µg/plate) and to TA 102 control was 35%
hydrogen peroxide. Metabolic activation system was checked using 2-aminoanthracycline (2AA)
as a positive control.
3.6.12.2. Negative control
Negative control plate contained distilled water which was used to make dilutions of the
sample.
3.6.12.3. Dilutions preparation
Dilutions were prepared using distilled water (DW). Two fold dilution of pharmaceutical
waste water samples PEW1 and PEW6 were prepared in an autoclaved test tube using a sterilized
syringes.
Table 3.2 Different dilutions of pharmaceutical wastewater used for MTT assay
3.7. Cytotoxicity assay
Methyl thiazol tetrazolium (MTT) assay was performed for the cell viability evaluation
after exposure to PEW. MTT (3-(4, 5-dimethylthiazolyl-2)-2, 5-diphenyltetrazolium bromide) dye
was used in the experiment. This dye is reduced due to the presence of dehydrogenase enzymes in
Dilution 1 2 3 4 5
% v/v 100 50 25 12.5 6.25

Materials and Methods
43
metabolically active cells as dye crosses cell membrane and got reduced to insoluble purple colored
formazan crystals by the mitochondrial dehydrogenases. Dimethyl sulfoxide (DMSO) was added
to solubilize the cells. The cells were quantified using a spectrophotometer. Live cells have the
ability to reduce the dye which reflects metabolic activity. A confluent monolayer of baby hamster
kidney cells (BHK-21) was obtained in 96 well flat bottom cell culture plate and then treated with
each dilution of PEW.
Figure 3.5 Schematic representation of the procedure adopted for MTT assay

Materials and Methods
44
3.7.1. Instrumentation
Horizontal laminar flow hood, cell culture plates, CO2 incubator, inverted microscope,
Microtiter plate reader/ELIZA reader, Micropipette, refrigerator, sterile pipette tips, sterile test
tubes, pipette aid, syringes (1 cc and 5 cc), water bath, cell culture flasks, Neubauer’s chamber,
magnetic stirrer, syringe filters (0.22 µm), gloves, masks.
3.7.2. Materials and chemicals
3.7.2.1. Cell culture media preparation
Cell culture medium 1.2gm was dissolved in 100 mL of double distilled water. Fetal bovine
serum and maintenance medium were added along with antibiotics. Negative pressure assembly
was used to filter the sample.
3.7.2.2. Cell line
The cell line (BHK-21) was acquired from Quality Operations Laboratory (QOL),
University of Veterinary and Animal Sciences, Lahore.
3.7.2.3. Cells revival
BHK-21 was revived by defrosting the cryopreserved culture. The tubes were
decontaminated with ethanol 70%, the cells were thawed gently in a water bath at 37°C. Sample
tubes containing BHK-21 were decontaminated with 70% ethanol and thawed gently in water bath
at 37°C. Cell culture medium 10mLwas poured in a falcon tube and contents of cells were placed
in the tube. The mixture was centrifuged for 3 minutes. Washing was performed to remove DMSO
traces. 5 mL of cell culture medium was used to re-suspend cells. The flasks were sub cultured
until 80% confluence was reached.
Materials and Methods
45
3.7.2.4. Quantification
Cells were loaded in a clean hemocytometer. Coverslip was placed over it. 0.4% trypan
blue was mixed with cell suspension. The principle of loading the cells in hemocytometer was
capillary action. The hemocytometer was placed on the microscope and cells were counted. Dead
cells were stained and live cells remained unstained. Viability of cells was expressed using
following formula.
Percentage viability = number of viable cells per mL/ total number of cells/mL × 100
3.7.2.5. Seeding of BHK-21 in the cell culture plate
Plates attaining 90% confluency were selected for cytotoxic evaluation. Cell culture
medium was decanted and rinsed with phosphate buffer (PBS) medium. PBS was aspirated and
0.5 mL of 0.25% trypsin EDTA was added for the detachment of cells. Plates were incubated at
37 °C for 5 minutes. Cells were washed again with cell culture medium and pipetting was
performed to break the clumps. Suspension of cells was centrifuged at 200 rpm in a sterile falcon
tube for 5 minutes. Supernatant was decanted and cells were re-suspended in growth medium.
Concentration was adjusted to 105 cells per mL and 100µL of cell suspension was added each well
of the 96 well plate. Plates were examined under an inverted microscope for the development of
confluency.
3.7.2.6. MTT assay
Plates that have developed 80-90% confluency were used for cytotoxic evaluation of PEW.
Plates were labelled properly with the respective dilution number. Dilutions of PEW were mixed
with cell culture medium and 200µL were added to each well. Each sample dilution was analyzed
in triplicate. Plates with their lids were placed into a CO2 incubator for 72 hours. Cell culture media
was discarded from wells and 20µL of MTT solution was added to each well along with 100µL of

Materials and Methods
46
fresh media. After 3-h incubation the media was removed and 100 µL of DMSO was added so that
formazan crystals get dissolved. The intensity of the color of live cells, which developed due to
the alteration of yellow MTT dye to purple color was measured using an ELISA reader.
Absorbance was taken at 570nm.
3.7.3. Control
3.7.3.1. Positive control
Cell culture media served as a positive control because we are calculating cell survival percentage
3.7.3.2. Negative control
20% DMSO was negative control
Cell survival percentage (CSP) of BHK-21 cells were calculated using the following formula
CSP= Mean OD of PEW dilutions-Mean OD of negative control/Mean OD of positive control×100
Inhibitory concentration (IC50) of samples was calculated using Graph Pad Prism. A log dose was
plotted against the calculated cell survival percentage (CSP) and IC50 was calculated using
nonlinear regression fit.
3.8. Oxidative stress
Experimental animals, 90 days old male Wistar rats (130-150 g), were purchased from
Department of Theriogenology, University of Veterinary and Animal Sciences (UVAS) Lahore.
The rats were kept independently in steel wire netting cages, animals were kept in an air
conditioned room (temperature: 21-25 °C. The rats were divided into five groups (n=5) named as
negative control, PEW 100%, PEW 10%, PEW 1% and PEW 100% + Vitamin E respectively. The
negative group was provided with normal tap water, group 2 received pure pharmaceutical
wastewater, group 3 received 10% of pure wastewater, and group 4 was given 1% of pure waste
water, all dilutions were made with the same water used for negative control. Group five received

Materials and Methods
47
pure wastewater and vitamin E 100mg/kg body weight as an antioxidant El-Demerdash et al, 2004.
All the animals were given 10 days for acclimatization before starting the experiment and kept in
12h day/light cycle.
Vitamin E (D-α-Tocopherol-polyethylene glycol 1000 succinate) the water soluble form
was purchased from SIGMA-ALDRICH. All the rats were provided with same normal diet ad
libitum. After conducting experiments which consisted of 60 days, all rats were fasted 12 h before
sacrifice for blood and tissue collection.
3.8.1. Sample preparation
The animals were housed and cared according to guideline and principles in the Care and
Use of Animals. All the experimental protocols were approved by the Ethical Committee for the
Use of Laboratory Animals (ERCULA) of UVAS, Lahore. Rats were anesthetized (with diethyl
ether) and were fixed on the experimental desk.
3.8.2. Tissue homogenate preparation
Kidney or liver tissue 1-1.5gm weight was taken. Tissue was washed with cold normal
saline to remove adherent blood. Tissue was dried using filter paper. It was weighed to 1gm and
placed in a small beaker. 6mL of normal saline was poured into a beaker containing tissue. By
using scissors, tissue was cut with a scissor to small pieces. These tissue pieces were homogenized
in a tube for 6 minutes. Then tissues were further minced to grind it to 10% homogenates. This
tissue homogenate was centrifuged at 8500rpm for 10 minutes at 4°C and supernatant was
withdrawn for assays. 1mL of supernatant was diluted with 9mL normal saline to prepare 1% tissue
homogenate.

Materials and Methods
48
3.8.3. Plasma Preparation
2-4mL blood was withdrawn from each rat with a heart puncture in heparinized
vacutainers. Blood was centrifuged at 1000rpm for 10minutes at 4ºC. Plasma as top yellow layer
was carefully removed and store on an ice-pack for further analysis.
3.8.4. Experimental Procedure
After the 60 day period of treatments, blood was collected from rats in heparinized
vacutainers. Plasma was removed from the blood after centrifugation at 1000rpm for 10 minutes
at 4°C and stored on an ice-pack. Tissue homogenates (10%) of liver and kidney were prepared by
centrifugation at 8500rpm for 10 minutes at 4°C in normal saline. Activities of enzymes such as
T-SOD and CAT and H2O2 concentrations were measured using commercial kits.
Activity of T-SOD was measured in tissue homogenates and plasma by Xanthine Oxidase
based assays, the method of which was described previously (H et al. 1994). Activity of T-SOD
was expressed as units/mg protein (U/ mg protein) for tissue homogenates and units/mL (U/ mL)
for plasma.
Activity of CAT was measured in liver and kidney tissue homogenates and blood
spectrophotometrically at 405nm wavelength by NJBI demonstrated method (Zhang et al. 2008).
CAT activity was measured in U/ mg protein and U/ mL of blood.
H2O2 concentrations were measured in liver and kidney tissue homogenates and plasma
spectrophotometrically at 405nm wavelength (Zhang et al. 2008). H2O2 concentrations were
expressed as mmol/L.
Lowry’s method for protein estimation was used in determining the protein content.
Bovine serum albumin served as a standard (Lowry et al. 1951).

Materials and Methods
49
3.8.5. Procedure for Estimation of T-SOD Activity
Two types of T-SOD activity test tubes were prepared. One test tube was test blank for T-
SOD whereas the other was sample test tube for T-SOD (Luo et al. 2014). Preparation of these
two types of test tubes for estimation of T-SOD activity is illustrated in Table 3.6.
After vortex sample was placed at room temperature for 10 minutes. After this, absorbance
of each tube was measured at 550nm in a glass cuvette. Following formulae were used for
estimation of T-SOD activity in plasma and tissue homogenates.
1. T-SOD activity in plasma was calculated by using the following formulas:
2. T-SOD activity in tissue homogenates was calculated by using the following formula:
3.8.6. Procedure for Estimation of CAT Activity
50µL of rat blood was taken and diluted up to 10 times with double distilled water. 1mL
of tissue homogenate was taken and 9mL normal saline was added to make 1% tissue homogenate.
0.02mL of prepared sample was taken in cuvette and 3mL substrate solution was added (Zhang et
al. 2008). OD value was measured at 405nm as (OD1) and after 1minute OD value was measured
again as (OD2). CAT activity was calculated by following formula.
CAT activity (U
gmHb) = log
𝑂𝐷1
𝑂𝐷2×
2.303
60𝑠× 𝐴 ÷ 𝐵
Where OD1 represents absorbance at 405nm at t = 0
OD2 represents absorbance at 405nm when t = 60 seconds
“A” is the dilution factor of hemoglobin
“B” is the Hemoglobin concentration (gm Hb/mL)

Materials and Methods
50
3.8.7. Procedure for Estimation of H2O2 Concentration
Three types of test tubes were prepared for measurement of H2O2 which included one blank
test tube, one standard test tube and the third for test samples.
These solutions were mixed well in test tubes and then absorbance was measured at 405nm
for each tube. The following formula was used for estimation of H2O2 concentrations in different
samples.

Materials and Methods
51
3.9. Tissue pathology
Experimental animals, 90 days old male Wistar rats (130-150 g), were obtained from
Department of Theriogenology, University of Veterinary and Animal Sciences (UVAS) Lahore.
The rats were kept independently in stainless steel wire netting cages, air conditioned room
(temperature: 21-25 °C). The rats were randomized into five groups (n=5) named as negative
control, PEW 100%, PEW 10%, PEW 1% and PEW 100% + Vitamin E respectively. The negative
group was provided with normal tap water, group 2 received pure pharmaceutical wastewater,
group 3 received 10% of pure water, and group 4 was given 1% of pure waste water, all dilutions
were made with the same water used for negative control. Group five received pure wastewater
and vitamin E 100mg/kg body weight as an antioxidant. Rats were provided with feed and sample
water ad libitum for the duration of the experiment. After conducting experiments which consisted
for 60 days, all rats were fasted 12 h before further treatments.
The rats were starved for 12 h, anaesthetized with light ether then sacrificed by
decapitation following the experimental protocol in agreement with the Institutional Guide Lines
for Care and Use of Laboratory Animals of University of Veterinary and Animal Sciences, Lahore,
Pakistan. Vital organs (lung, liver, kidney, heart and brain) were carefully removed and weighed.
The tissues were fixed in 10% PFA (formaldehyde solution) and processed for histological
investigation. The tissues were embedded in paraffin wax, sectioned for 2µm thickness, mounted
on slides and were stained with haematoxylin & eosin (H&E) for routine light microscopy. The
slides were investigated for any deleterious effects or appearance of lesions appeared after
treatment with PEW (Ejaz et al. 2009).

CHAPTER 4
RESULTS
4.1 Heavy metal analysis
Iron (Fe) was present in all the samples at concentrations higher than the WHO or US EPA
safe level and with a concentration range varying from 0.5 mg.L-1 in PEW10 to 4.96 mg.L-1 in
PEW1. Chromium (Cr) was found to be higher than normal permissible limits of WHO and US
EPA and ranged from 0.18 mg.L-1 in PEW5 and PEW10 to 0.43 mg.L-1 in PEW1. Lead (Pb) also
exceeded the normal range with 0.21 mg.L-1 present in PEW1 and 0.16 mg.L-1 present in PEW2.
Arsenic (As) was present in all samples with a wide range of concentration varying from 0.1 mg.L-
1 to 0.83 mg.L-1. Cadmium (Cd) appeared to be higher than standard limits in only three samples.
Copper (Cu) concentration varied from 0.16 to 0.83 mg. L-1 which is less than normal levels. Zinc
(Zn) was present in the normal limits ranging from 0.88 to 2.01 mg. L-1. Table 4.1 represents the
levels of heavy metals present in samples of wastewater collected from different pharmaceutical
industries. Normal limits of the world health organization (WHO) and US Environmental
Protection Agency (US EPA) are also provide in the table 4.1. The results were analyzed through
box whisker plot and represented in fig. 1.

Results
53
Table 4.1 Toxic metal content in the effluent of pharmaceutical industries
Sample
number
Zn
(mg.L-1)
Fe
(mg.L-1)
Cu
(mg.L-1)
Cr
(mg.L-1)
Pb
(mg.L-1)
As
(mg.L-1)
Cd
(mg.L-1)
PEW 1 1.25 4.96 0.5 0.43 0.21 0.83 0.02
PEW 2 0.96 3.76 0.33 0.38 0.16 0.1 0.04
PEW 3 1.4 3.6 ND ND ND ND ND
PEW 4 1.03 1.85 0.16 ND ND 0.15 ND
PEW 5 1.51 1.15 0.83 0.18 ND 0.35 0.01
PEW 6 2.01 1.55 0.33 0.4 ND 0.1 ND
PEW 7 1.46 2.26 0.16 ND ND 0.5 ND
PEW 8 1.05 0.96 0.33 0.36 ND 0.13 ND
PEW 9 1.6 0.71 0.16 0.28 ND 0.41 ND
PEW 10 0.88 0.5 0.16 0.18 ND 0.25 ND
WHO
(ppm)
5 0.3 2 0.05 0.01 0.01 0.003
EPA
(ppm)
5 0.3 1.3 0.1 0.015 0.05 0.005
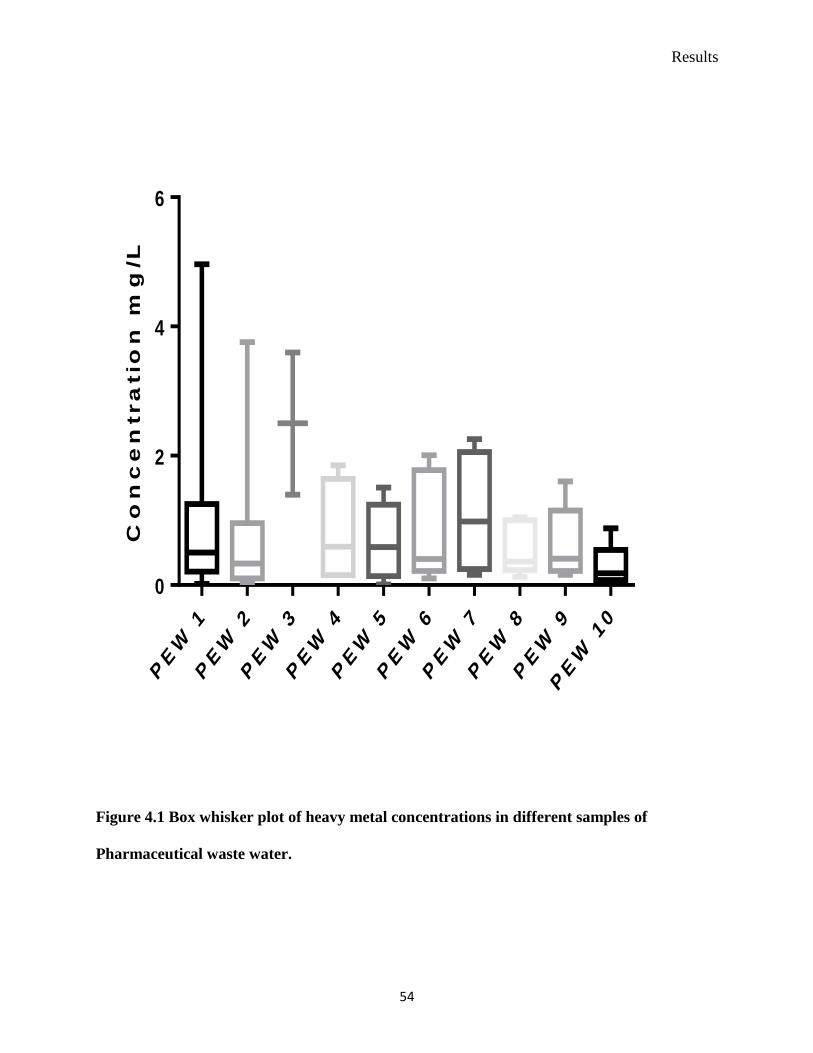
Results
54
Co
nc
en
tra
tio
n m
g/L
PEW
1
PEW
2
PEW
3
PEW
4
PEW
5
PEW
6
PEW
7
PEW
8
PEW
9
PEW
10
0
2
4
6
Figure 4.1 Box whisker plot of heavy metal concentrations in different samples of
Pharmaceutical waste water.

Results
55
4.2 GC/MS Analysis
Pharmaceutical waste water was subjected to GC-MS analysis to detect the pharmaceuticals present in wastewater. Peaks
obtained were compared with the peaks of fragments in the library. The matches are depicted in table no. 4.2. Different columns and
different methods were used for the screening of PEW. DB-35ms detected more compounds because the method adopted was EPA
8081A according to catalogue provided by manufacturer Agilent series whereas method adopted for DB-1 column was common drug
screening according to manufacture catalogue.
Table 4.2 Components found in pharmaceutical effluent PEW1
Fraction Peak
no.
Retention
time
Area % Compound m/z ratio Column
Basic 5 3.075 2.328 % Toluene 27,38,39,40,43,45,49,51,52,62,63,64,65,66,74,77,86,8
8,89,91,92,93,94
DB-1 9 16.087 0.993 % Caffeine 28,42,55,67,82,94,109,122,137,150,165,179,194
10 17.029 1.063 % Lidocaine 30,42,58,65,77,86,91,105,120,134,148,217, 234
12 17.984 0.732 % Prednisolo
ne
41,55,77,91,122,147,179,225,249,267,
300
Neutral 12 3.918 1.107 % Glycerin 31,43,55,61,74
13 16.075 0.899 % Caffeine 42,55,67,82,94,109,136,165,176,194,207
- 13.6 0.201% Digitoxin 43,113,203,246,339,401
Acidic - - - - -

Results
56
Fig. 4.2 exhibits mass spectra of basic fraction of PEW where peaks represent different
compounds present in PEW with their specific retention times and abundance. Mass spectra of the
lidocaine obtained after screening through GCMS was depicted in fig 4.3.
Figure 4.2 Mass spectra of basic fraction of PEW 1
Figure 4.3 Mass spectra of lidocaine using DB1 column

Results
57
Fig. 4.4 exhibits mass spectra of neutral fraction of PEW where peaks represent different
compounds present in PEW with their specific retention times and abundance. Mass spectra of
digitoxin, dipyrone and trimethoprim obtained after screening of PEW through GCMS are
represented in fig. 4.5, 4.6 and 4.7 respectively.
Figure 4.4 Mass spectra of neutral fraction of PEW 1
Figure 4.5 Mass spectra of digitoxin using DB1 column

Results
58
Table 4.3 Compounds identified in pharmaceutical effluent waste water PEW1 using GC-MS
Fraction Peak
no.
Retention
time
Area
%
Compound m/z ratio Column
Basic - 13.2 - Caffeine 42,55,67,82,94,109,122,136,150,165,176,194 DB –
35ms 7 11.864 2.498
%
Dipyrone 39,42,56,64,77,83,91,98,106,123,217
12 17.247 1.058
%
Trimethoprim 43,53,66,77,81,95,105,123,130,147,161,172,189,
200,215,228,243,259,275,290
13 21.434 1.480
%
Vitamin E 69,83,95,121,165,177,205,226,243,326,364,430
Neutral 6 6.788 1.773
%
Phenol,2,5-bis(1,1-
dimethyl)
41,57,64,73,91,107,115,135,147,163,176,191,206
7 7.984 1.517
%
Tridecene (Z) 41,43,51,55,65,67,69,83,91,97,111,125
8 10.256 3.385
%
E- 14-Hexadecenal 43,5569,83,97,111,125,140,154,168,182,196,203,
210
9 10.492 2.641
%
Tetra decanoic acid,
propyl ester
43,61,69,73,83,102,111,115,125,129,143,157,171
,185,199,211,229
11 11.531 4.936
%
1, 2-
Benzenedicarboxylic
acid, butyl 2-
ethylhexyl ester
41,50,56,65,76,93,104,121,132,149,160,179,191,
205,223
14 15.893 2.389
%
E- 15-Heptadecenal 41,43,51,55,57,61,67,69,79,83,91,97,
111,125,139,149
16 17.482 1.155
%
11-Tricosene 41,43,55,57,69,71,79,83,91,97,105,111,119
- 18.8 - 17- Pentatriacontene 41,43,55,57,67,69,71,79,83,85,91,97,111,125
Acidic - 9.2 - Canthaxanthin 43,55,69,83,119,145,157,173,203,229,255,281,30
7,360,413,472,485.508,549

Results
59
Figure 4.6 Mass spectra of dipyrone using DB-35ms column
Figure 4.7 Mass spectra of trimethoprim using DB-35ms column

Results
60
4.3 Microbiology
Density of microorganisms was expressed in cfu/mL. All the samples were evaluated for
the presence of bacterial load and the results were shown in table 4.4. Plates having 30-300 bacteria
were counted and mean of triplicate was taken. Mean bacterial count was multiplied with the
dilution factor of the tube exhibiting 30 to 300 colonies per plate. All the isolates found in each
plate of PEW1 were further purified and subjected to a series of identification tests. Results are
given in table 4.5 and table 4.6. Isolates of PEW 1 were evaluated for heavy metal tolerance and
antibiotic sensitivity tests. They were found to be tolerant to varying concentration of heavy
metals. Aeromonas sobria tolerated 25 µg/mL of K2Cr2O7 and 50 µg/mL of CuSO4. Micrococcus
varians maximum tolerable dose for K2Cr2O7 was 50 µg/mL and 100 µg/mL for CuSO4.
Staphyoloccus epidermidis responded to a maximum dose of 50 µg/mL of K2Cr2O7 and 400 µg/mL
of CuSO4. Staphylococcus aureus reacted to K2Cr2O7 and CuSO4 at maximum doses of 200 and
400 µg/mL. Bacillus megaterium tolerated a maximum dose of 50 and 350 µg/mL for K2Cr2O7
and CuSO4 respectively. Results are represented in table 4.7. These bacterial isolates also showed
resistance to a number of antibiotics. Staphylococcus aureus and Bacillus megaterium were found
to be resistant against all the antibiotic used. Both the bacteria showed resistance against
vancomycin 30 µg/disc, co-trimoxazole 35 µg/disc, methicillin 10µg/disc, chloramphenicol
25µg/disc, streptomycin 10µg/disc and levofloxacin 5µg/disc. The results are represented in table
4.8.

Results
61
Table 4.4 Total number of viable bacteria in pharmaceutical waste water sample (PEW1)
Sample no. Dilution factor Total number of
colonies in selected
plates
Number of Viable
bacteria CFU/mL
PEW 1 10 6 296 2.96 ×10 8±10
PEW 2 10 3 256 2.56 × 10⁴±7
PEW 3 10 7 112 1.12 × 10 9±11
PEW 4 10 4 160 1.6 × 10 6±13
PEW 5 10 4 230 2.3 × 10 6±14
PEW 6 10 5 231 2.31 × 10 7±9
PEW 7 10 7 286 2.86 × 10 9±10
PEW 8 10 6 194 1.94 × 10 8±6
PEW 9 10 5 243 2.43 × 10 7±12
PEW 10 10 5 213 2.13 × 10 7±10
Control N.D. N.D. N.D.

Results
62
Table 4.5 Morphological and biochemical characteristics of bacterial isolates
Colony
Type/Gram stain
Characteristics
Glucose
Fermentation
Mannitol
Fermentation
Indole
Oxidase Catalase Coagulase Starch
hydrolysis
Mannitol
salt agar
test
Type of
Bacteria
Identified
Yellow G +ve
Bacilli
positive positive negati
ve
negative positive - positive Bacillus
megaterium
Yellow G +ve,
Cocci
positive negative negati
ve
positive positive - - Micrococcus
varians
White Gram –ve
bacilli
Positive with gas positive positi
ve
positive positive - - Aeromonas
sobria
White to creamy
G +ve Cocci
negative negative negati
ve
negative Slight
positive
negative positive negative Staphyoloccus
saprophyticus
Off white G +ve
Cocci
positive with gas negative negati
ve
negative Slight
positive
negative negative negative Staphyoloccus
epidermidis
Cocci round G
+ve curved white
positive positive negati
ve
negative positive positive negative positive Staphylococcu
s aureus

Results
63
Table 4.6 Total number of isolated and identified bacteria from pharmaceutical waste water
(PEW1)
Sample no. Total types of isolated and
purified bacteria
Identified species of isolated bacteria
PEW 1 3 Bacillus megaterium
Micrococcus varians
Aeromonas sorbia
PEW 2 3 Staphylococcus saprophyticus
Stapyhlococcuus aureus
Aeromonas sorbia
PEW 3 3 Micrococcus varians
Aeromonas sorbia
Stapyhlococcuus epidermidis
PEW 4 2 Bacillus megaterium
Stapyhlococcuus aureus
PEW 5 3 Stapyhlococcuus aureus
Micrococcus varians
Aeromonas sorbia
PEW 6 5 Aeromonas sorbia
Stapyhlococcuus aureus
Pseudomonas aeruginosa
Bacillus megaterium
Stapyhlococcuus epidermidis
PEW 7 3 Bacillus megaterium
Aeromonas sorbia
Stapyhlococcuus epidermidis
PEW 8 2 Bacillus megaterium
Staphylococcus saprophyticus
PEW 9 2 Stapyhlococcuus aureus
Bacillus megaterium
PEW 10 2 Aeromonas sorbia
Micrococcus varians
Control N.D. N.D.

Results
64
Table 4.7 Maximum tolerable concentration of heavy metals against PEW 1 bacterial isolates
Isolated bacteria Maximum tolerated dose of
K2Cr2O7 µg/mL
Maximum tolerated dose of
CuSO4 µg/mL
Aeromonas sobria
25
50
Micrococcus varians
50
100
Staphylococcus epidermidis
50
400
Staphylococcus aureus
200
400
*Bacillus megaterium
50
350

Results
65
Table 4.8 Antibiotic sensitivity and resistant activity of isolated bacterial isolates of PEW1
Bacteria Vancomyci
n 30 µg/disc
Trimethoprim/
Sulfamethoxazole
1.25-23.75µg/disc
Methicillin 10
µg/disc
Chloramphenicol 30
µg/disc
Streptomycin 10
µg/disc
Levofloxacin 5
µg/disc
Aeromonas sobria resistant 3 mm resistant 2 mm 1 mm 4 mm
Micrococcus varians 0.1 mm 0.3 mm 0.4 mm 3 mm 1.5 mm 2 mm
Staphyoloccus epidermidis 1.4 mm resistant 0.6 mm 0.2 mm resistant 0.1 mm
Staphylococcus aureus resistant resistant resistant resistant resistant resistant
Bacillus megaterium resistant resistant resistant resistant resistant resistant
CLSI
Standards
Sensitive NS ≥16 NS ≥18 ≥15 ≥17
Resistant NS ≤10 NS ≤12 ≤11 ≤13
CLSI ~ Clinical and Laboratory Standard Guideline Standards
NS ~Not Specified

Results
66
4.4 Comet Assay
Two fold dilution of pharmaceutical waste water was made with sterilized distilled water.
Scoring of damage induced by PEW1 and PEW6 was performed (Ahuja et al. 1999) using image
J software in Fig no. 4.8 and 4.10. Mean DNA tail lengths and head diameters were calculated
(n=50) and results of all samples of PEW analyzed are represented in table 4.9. A concentration
dependent damage of DNA was observed. Comets were analyzed by comparing tail lengths which
appeared after exposure to different concentrations of waste water. One way analysis of variance
was performed to compare means as shown in Fig no. 4.9 and 4.11. The post hoc test applied was
a Dunnett’s multiple comparison test. Result showed significant difference when compared with
control group (p ˂ 0.05). Damage index (D.I) and percentage fragmentation also displayed a
concentration dependent effect. Table 4.10 depicts percentage fragmentation (%age
fragmentation), damage index (D.I) and genetic damage index (GDI) induced by pharmaceutical
wastewater samples collected from different sites (Raja et al. 2016, Ullah et al. 2016).

Results
67
Table 4.9 Mean diameter and tail length of different pharmaceutical waste water samples
Sr. no.
Sample no.
Mean DNA Tail length
um ± SD (n= 50)
Mean Head Diameter um
± SD (n=50)
1 PEW 1 6.11 ± 2.15 3.32 ± 1.33
2 PEW 2 5.24 ± 2.11 3.22 ± 1.36
3 PEW 3 5.15 ± 2.14 3.26 ± 1.30
4 PEW 4 5.37 ± 2.19 3.38 ± 1.36
5 PEW 5 4.35 ± 2.37 4.1 ± 1.67
6 PEW 6 4.94 ± 2.21 3.50 ± 1.26
7 PEW 7 5.00 ± 2.26 3.66 ± 1.50
8 PEW 8 4.96 ± 2.25 3.37 ± 1.3
9 PEW 9 4.79 ± 2.12 3.57 ± 1.46
10 PEW 10 5.08 ± 2.25 3.79 ± 1.66
Positive Control DMSO 20% 8.16 ± 2.55 3.35 ± 2.66
Negative Control Distilled Water 0.06 ± 0.04 4.66 ± 0.77

Results
68
Table 4.10 Percentage fragmentation, Damage index and genetic damage index of different
pharmaceutical waste water samples
Sr. No.
Sample no.
Class
0
Class
1
Class
2
Class
3
Fragmentation
%
Damage
Index
GDI
1 PEW 1 2 8 21 19 96 107 2.14
2 PEW 2 4 8 22 16 92 100 2
3 PEW 3 5 7 27 11 90 94 1.88
4 PEW 4 5 9 21 15 90 77 1.54
5 PEW 5 5 25 17 3 90 68 1.36
6 PEW 6 12 4 28 16 96 116 2.32
7 PEW 7 4 13 23 10 92 89 1.78
8 PEW 8 4 13 21 12 92 91 1.82
9 PEW 9 3 15 22 10 94 89 1.78
10 PEW 10 3 13 26 8 94 89 1.78
Positive
control
DMSO 20% 1 9 10 30 98 119 2.38
Negative
Control
Distilled
water
50 zero zero zero zero zero zero

Results
69
Figure 4.8 Comets appeared in sheep lymphocytes when exposed to pharmaceutical effluent
wastewater (PEW 1).

Results
70
Figure 4.9 Tail lengths of damage induced in sheep lymphocytes at different concentrations
of PEW 1 (%v/v)

Results
71
Figure 4.10 Comets appeared in sheep lymphocytes when exposed to pharmaceutical effluent
wastewater (PEW 6).

Results
72
Figure 4.11 Tail lengths of damage induced in sheep lymphocytes at different
concentrations of PEW 6 (%v/v)
Mean diameter of the head and tail lengths were calculated by exposing lymphocytes to two fold
diluted concentrations of pharmaceutical wastewater and results are represented in table 4.11 and
table 4.13. Whereas percentage fragmentation damage index and genetic damage index were also
calculated for two fold dilutions of pharmaceutical wastewater which are depicted in table no 4.12
and 4.14.

Results
73
Table 4.11 Mean head diameter and tail length of different concentrations of pharmaceutical
wastewater sample (PEW 1)
Sr. No.
Sample no. PEW 1
Mean DNA Tail
length um ± SD (n=
50)
Mean Head
Diameter um ± SD
(n=50)
1 100 % 6.11 ± 2.15 3.32 ± 1.33
2 50 % 5.40 ± 2.26 4.22 ± 0.81
3 25 % 4.74 ± 2.12 4.26 ± 0.83
4 12.5 % 3.52 ± 0.59 3.84± 1.06
5 6.25 % 1.48 ± 0.65 4.85 ± 1.82
Positive Control DMSO 20% 8.16 ± 2.55 3.35± 2.66
Negative Control DW 0.06 ± 0.04 4.66 ± 0.77

Results
74
Table 4.12 Percentage fragmentation, damage index and genetic damage index detected with
increasing dilutions of pharmaceutical effluent (PEW 1)
Sr. No. Sample no.
PEW 1
Class
0
Class
1
Class
2
Class
3
Fragmentatio
n %
Damage
Index
GDI
1 100 % 2 8 21 19 96 107 2.14
2 50 % 2 17 21 9 94 86 1.72
3 25 % 5 19 24 2 90 73 1.46
4 12.5 % 7 30 10 3 86 67 1.34
5 6.25 % 11 34 5 0 78 54 1.08
Positive
Control
DMSO
20%
1 9 10 30 98 119 2.38
Negative
Control
DW 50 0 0 0 0 0 0

Results
75
Table 4.13 Mean head diameter and tail length of different concentrations of pharmaceutical
waste water sample (PEW 6)
Sr. No.
Sample no. PEW 6
Mean DNA Tail
length um ± SD (n=
50)
Mean Head Diameter
um ± SD (n=50)
1 100 % 5.47 ± 2.19 3.24 ± 1.3
2 50 % 4.09 ± 1.46 3.53 ± 0.93
3 25 % 2.52 ± 1.05 3.55 ± 0.86
4 12.5 % 2.28 ± 1.07 3.66± 1.11
5 6.25 % 0.901 ± 0.59 4.03 ± 0.74
Positive Control DMSO 20% 8.16 ± 2.55 4.94± 4.27
Negative Control DW 0.06 ± 0.04 4.66 ± 0.77
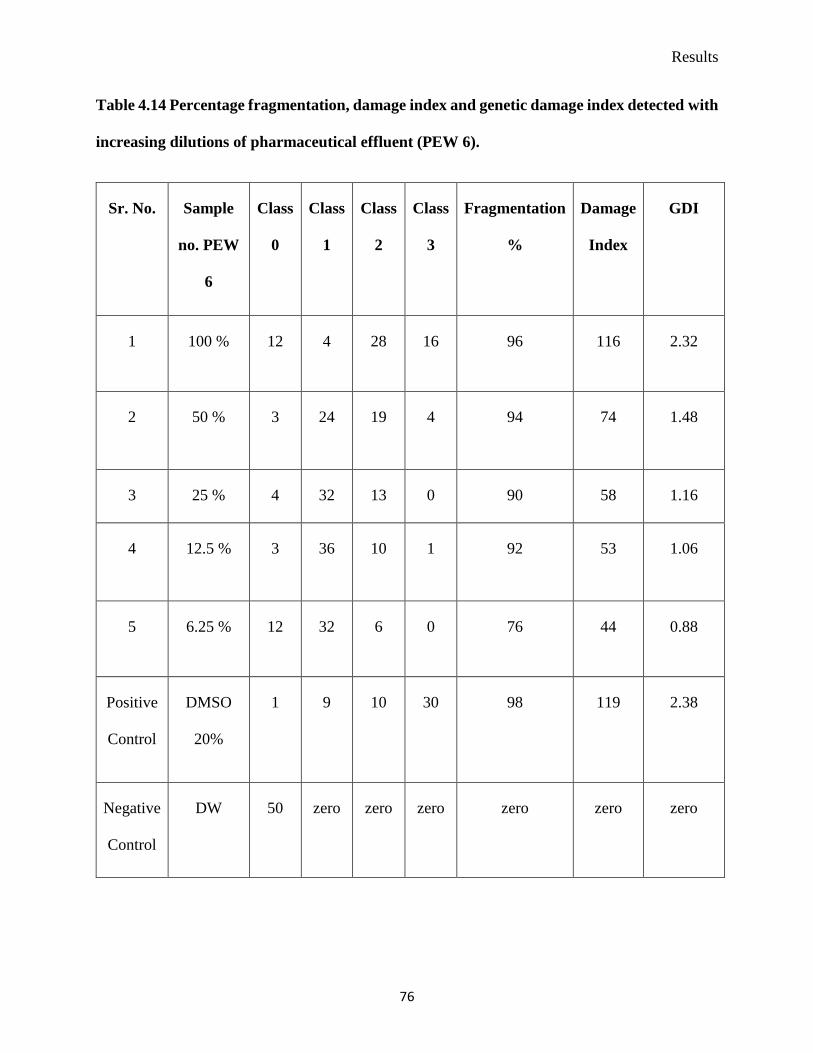
Results
76
Table 4.14 Percentage fragmentation, damage index and genetic damage index detected with
increasing dilutions of pharmaceutical effluent (PEW 6).
Sr. No. Sample
no. PEW
6
Class
0
Class
1
Class
2
Class
3
Fragmentation
%
Damage
Index
GDI
1 100 % 12 4 28 16 96 116 2.32
2 50 % 3 24 19 4 94 74 1.48
3 25 % 4 32 13 0 90 58 1.16
4 12.5 % 3 36 10 1 92 53 1.06
5 6.25 % 12 32 6 0 76 44 0.88
Positive
Control
DMSO
20%
1 9 10 30 98 119 2.38
Negative
Control
DW 50 zero zero zero zero zero zero

Results
77
4.5 Mutagenicity
4.5.1 Genetic analysis of Salmonella typhimurium strains
4.5.1.1 Histidine dependence
Plates were incubated at 37°C for 24 h. Both of the strains, i.e. TA 100 and TA-102 showed
no growth on GM agar plates depicting the dependence of these strains on histidine.
4.5.1.2 Biotin dependence
TA 100 and TA-102 showed no growth on GM agar plates showing the dependence of
these strains on biotin.
4.5.1.3 Histidine/Biotin dependence
Plates were incubated at 37°C. Both strains, i.e. TA 100 and TA-102 showed growth on
GM agar plates representing the dependence of these strains on biotin and histidine.
4.5.1.4 Surface marker test
This soaked crystal violet filter paper was placed in the middle of GM agar plates separately
for each strain and incubated for 24h at 37°C. Zone of growth inhibition was shown in both the
plates exhibiting that both the strains are permeable to test chemicals.
4.5.1.5 pKM 101 plasmid (ampicillin resistance test)
A filter paper disc containing ampicillin (10µg/mL) was placed in the center of both petri
plates. Growth was observed after 24h of incubation at 37°C even in the presence of ampicillin
disk. This showed the presence of pKM 101 plasmid because both strains showed resistance to
ampicillin.

Results
78
4.5.2 Result interpretation of bacterial reverse mutation assay
Mutagenic index was calculated using following formula
𝑀. 𝐼 =Number of Revertant colonies per plate with the test chemical dose
Number of natural Revertant colonies of the negative control plate
If the value of mutagenic index is ≥ 2 means test concentration is possible mutagenic
If the value of mutagenic index is ≥ 3 means test concentration is significant mutagenic
If the value of mutagenic index is ≥ 4 means test concentration is very strongly mutagenic
Mutagenic response was considered as positive when the number of colonies were ≥ 2 fold to the
revertant colonies of negative control (Santos et al. 2008, Ullah et al. 2016).
Mutagenic indices of all the samples were shown in table no. 4.15. All the samples were
subjected to Ames assay as mentioned above. Samples of 100% pharmaceutical wastewater were
used for the determination of mutagenic potential.
Samples PEW1 and PEW 6 were subjected to further evaluation of mutagenic potential by
diluting the samples. Two fold dilutions were made and each dilution was evaluated for the
mutagenic potential. Both PEW1 and PEW6 were subjected to chemical characterization of
organic and inorganic components. A detailed evaluation of these chemically characterized
samples was performed. Mutagenic Index (M.I) was calculated using the formula mentioned above
whereas slope (m) was calculated using graph pad prism 5 and applying a linear regression model.
The sample PEW1 was reported as potent mutagenic when evaluated for mutagenicity
against TA100 and TA-102. Slope (m) was drawn for the concentration response using graph pad
prism as shown in figure 4.12 and figure 4.13. Both the strains showed significant effect with and
without metabolic activation system. Slope values obtained were 20.74 and 5.12 for TA 100 in the
presence and absence of S9 fractions respectively. It is also confirmed from M.I which is 17.35

Results
79
and 5.12 for TA 100 with and without S9 respectively. Values of slope obtained for TA 102 strain
were 21.58 and 18.81 in the presence and absence of S9 fractions respectively. Whereas M.I.
calculated from the formula mentioned above was 17.6 and 21.62. It was demonstrated that
increasing the dilution factor decreases the mutagenic index of the waste water. Results are
presented in table 4.16.
Similarly PEW6 also showed a mutagenic potential, slope (m) of response was drawn in
the form of curves figure 4.14 and figure 4.15. Both TA 100 and TA 102 also responded well with
and without liver extract S9 fraction. The values of slope are 14.50 and 1.69 and M.I calculated
was 14.04 and 2020 for TA 100 with and without S9 respectively. Slope for TA 102 were 38.52
and 28.91 and M.I was 28 and 34.71 with and without S9 respectively. Mutagenic index decreased
(table 4.17) with the increasing dilution.
PEW 1 exhibited a strong mutagenic effect against TA-100 when compared with PEW 6.
It was evident from the Mutagenic index as well as the slopes of the linear response curves also
confirmed the results.

Results
80
Table 4.15 Revertant colonies and mutagenic index obtained by exposure to pharmaceutical
waste water (plates with 30-300 colonies were selected)
Pharmaceutical effluent waste water
Sr. No. CONC.
pure
Revertant Colonies per Plate
TA 100 TA 102
-S 9 M.I. +S 9 M.I. -S 9 M.I. +S 9 M.I.
1 PEW 1 149 1.35 225 1.85 294 3.62 315 2.60
2 PEW 2 121 1.1 213 1.76 277 3.41 327 2.70
3 PEW 3 91 0.82 110 0.90 267 3.29 309 2.55
4 PEW 4 95 0.86 104 0.85 268 3.30 375 3.09
5 PEW 5 132 1.2 222 1.83 288 3.55 391 3.23
6 PEW 6 243 2.20 260 2.14 266 3.28 313 2.58
7 PEW 7 171 1.55 209 1.72 281 3.46 379 3.13
8 PEW 8 167 1.51 211 1.74 226 2.79 361 2.98
9 PEW 9 99 0.9 117 0.96 213 2.62 307 2.53
10 PEW 10 129 1.17 191 1.57 209 2.58 311 2.57
11 -ve control 110 121 81 121
12 +ve
control
1340 12.18 3940 32.56 424 5.23 3940 32.56

Results
81
Table 4.16 Revertant colonies and mutagenic index obtained by exposure to pharmaceutical waste water (PEW1) at different
levels of dilutions
Pharmaceutical effluent waste water
Sr. No. CONC.%
v/v
Revertant Colonies per Plate
TA 100 TA 102
-S 9 M.I. +S 9 M.I. -S 9 M.I. +S 9 M.I.
1 PEW1-100%
564±2.0
8 5.12
2100±
5.5 17.35
1752±3
.78 21.62
2200
±5.50 17.6
2 PEW1-50% 149±2 1.35
915±4
.5 7.56
1176±4
.58 14.51
1500
±4.58 12
3 PEW1-25%
119±3.0
5 1.08
653±3
.21 5.39
294±2.
64 3.62
820±
1.52 6.56
4 PEW1-12.5% 89±1.52 0.80 225±2 1.85
204±2.
51 2.51
428±
4.72 3.42
5 PEW1-6.25% 77±1 0.7
113±2
.08 0.93
64±2.0
8 0.79
120±
3.05 0.96
6 -ve control 110±2.5
1
121±3
.51
81±5.6
8
125±
2.08
7 +ve control 1341±3.
61 12.19
3941±
5.51 32.57
425±2.
52 5.24
3941
±1.53 31.528
8 m 5.12 20.74 18.81 21.58
m= slope values obtained from linear regression curve using graph pad prism

Results
82
C o n c e n tra t io n (% v /v )
No
. o
f H
is-R
ev
ert
an
ts/p
late
0 5 0 1 0 0 1 5 0
0
5 0 0
1 0 0 0
1 5 0 0
2 0 0 0
2 5 0 0
w ith o u t S 9
w ith S 9
Figure 4.12 Potential of mutagenicity of PEW1 in TA-100 strain in presence and absence of
metabolic activation mixture.
C o n c e n tra t io n (% v /v )
No
. o
f H
is-R
ev
ert
an
ts/p
late
0 5 0 1 0 0 1 5 0
0
5 0 0
1 0 0 0
1 5 0 0
2 0 0 0
2 5 0 0
w ith o u t S 9
w ith S 9
Figure 4.13 Potential of mutagenicity of PEW1 in TA-102 strain in presence and absence of
metabolic activation mixture.

Results
83
Table 4.17 Dose dependent decrease in revertant colonies observed on exposure to Pharmaceutical effluent waste water sample
(PEW 6)
Pharmaceutical effluent waste water
Sr. No. CONC.%
v/v
Revertant Colonies per Plate
TA 100 TA 102
-S 9 M.I. +S 9 M.I. -S 9 M.I. +S 9 M.I.
1 PEW6-100%
243±2.2
4
2.20 1700±
2.98
14.04 2812±2
.68
34.71 3500
±4.2
28
2 PEW6-50%
137±2.3
8
1.24 797±4
.12
6.58 1300±4
.34
16.04 2600
±1.31
20.8
3 PEW6-25%
117±2.3
6
1.06 646±2
.65
5.33 597±1.
23
7.37 630±
2.41
5.04
4 PEW6-12.5%
92±1.36 0.83 532±2
.64
4.39 266±3.
15
3.28 313±
4.14
2.58
5 PEW6-6.25%
83±2.36 0.75 260±2
.48
2.14 152±4.
32
1.87 110±
2.11
0.88
6 -ve control 111±2.5
2
122±3
.52
82±5.6
9
126±
2.09
7 +ve control 1340±3.
60
12.18 3940±
5.50
32.56 424±2.
51
5.23 3940
±1.52
31.52
8 m 1.69 14.50 28.91 38.52
m= slope values obtained from linear regression curve using graph pad prism

Results
84
c o n c e n tra t io n % (v /v )
No
. o
f H
is-R
ev
erta
nts
/pla
te
0 5 0 1 0 0 1 5 0
0
5 0 0
1 0 0 0
1 5 0 0
2 0 0 0
w ith o u t S 9
w ith S 9
Figure 4.14 Potential of mutagenicity of PEW6 in TA-100 strain in presence and absence of
metabolic activation mixture.
c o n c e n tra t io n % (v /v )
No
. o
f H
is-R
ev
erta
nts
/pla
te
0 5 0 1 0 0 1 5 0
0
1 0 0 0
2 0 0 0
3 0 0 0
4 0 0 0
w ith o u t S 9
w ith S 9
Figure 4.15 Potential of mutagenicity of PEW6 in TA-102 strain in presence and absence of
metabolic activation mixture.

Results
85
4.6 MTT Colorimetric Cytotoxicity Assay
The methyl thiazole tetrazolium (MTT) assay was executed for assessment of the cytotoxic
potential of pharmaceutical waste water using a twofold dilution method. Cytotoxic effects were
quantified on Baby Hamster Kidney cell line (BHK-21). The BHK-21 cell line was exposed
against each dilution of PEW.
4.6.1 Quantification cell line:
The BHK-21 cell line was accessed for the availability of viable cells at the time of assay.
Hemocytometer/Neubauer was used and viable cells were recognized using a microscope. The
number of dead and viable cells were presented in table 4.18
Table 4.18 Quantification of viable cells in BHK-21 cell line prior to assay
Results
86
Viable cells/mL = Total no. of viable cells/Total no. of squares ×Dilution factor ×104
= 75/5 × 2×104
= 3.0 ×10⁵ viable cells
Total cells/mL = Total no. of cells/Total no. of squares ×Dilution factor ×104
= 81/5 × 2 × 104
= 3.24 × 10⁵ cells
𝑷𝒆𝒓𝒄𝒆𝒏𝒕𝒂𝒈𝒆 𝑽𝒊𝒂𝒃𝒍𝒆 𝑪𝒆𝒍𝒍𝒔 =𝑻𝒐𝒕𝒂𝒍 𝒏𝒐. 𝒐𝒇 𝒗𝒊𝒂𝒃𝒍𝒆 𝒄𝒆𝒍𝒍𝒔/𝒎𝑳
𝑻𝒐𝒕𝒂𝒍 𝒏𝒐. 𝒐𝒇 𝒄𝒆𝒍𝒍𝒔/𝒎𝑳 × 𝟏𝟎𝟎
= 3.0 × 10⁵/3.24 × 105 × 100
=92.9%
Whereas the cell survival percentage was calculated using following formula (Ullah et al. 2016)
𝑪𝑺𝑷 =𝑴𝒆𝒂𝒏 𝑶𝑫 𝒐𝒇 𝒕𝒆𝒔𝒕 𝒄𝒉𝒆𝒎𝒊𝒄𝒂𝒍 − 𝑴𝒆𝒂𝒏 𝑶𝑫 𝒐𝒇 𝒏𝒆𝒈𝒂𝒕𝒊𝒗𝒆 𝒄𝒐𝒏𝒕𝒓𝒐𝒍
𝑴𝒆𝒂𝒏 𝑶𝑫 𝒐𝒇 𝒑𝒐𝒔𝒊𝒕𝒊𝒗𝒆 𝒄𝒐𝒏𝒕𝒓𝒐𝒍 × 𝟏𝟎𝟎
Result of Cytotoxic Potential of Pharmaceutical waste water
The cytotoxic potential of PEW1 was determined using the BHK-21 cell line, ten different
dilutions of PEW were prepared and exposed to cell line. Incubation period given was 72 hours in
a CO2 incubator, cell survival percentages were given in the table 4.19.

Results
87
Table 4.19 Mean optical density (OD) and cell survival percentages against different
concentrations of PEW1 after incubation of 48 hours in MTT assay using BHK-21 cell line.
Serial number Concentration (%v/v) Mean OD ±SD Cell survival
percentage
CSP%
1 100 0.215±0.005 13.63
2 50 0.343±0.024 29.6
3 25 0.449±0.037 42.82
4 12.5 0.533±0.025 53.26
5 6.25 0.634±0.017 66.90
6 3.13 0.675±0.019 70.97
7 1.56 0.682±0.027 71.85
8 0.78 0.689±0.011 72.80
9 0.39 0.696±0.006 73.63
10 0.20 0.692±0.008 73.09
Positive control Cell culture medium - -
Negative control 20% DMSO - -

Results
88
Figure 4.16 Percentage survival of cells (CSP) against different log concentrations of PEW1
on BHK-21 cell lines
X-axis = log concentration of pharmaceutical waste water in (%v/v)
Y-axis = Cell survival percentage (CSP) BHK-21 cell lines against different dilutions of
pharmaceutical wastewater.
The cytotoxic potential of PEW6 was quantified on BHK-21 cell line. A range of ten
different concentrations of PEW6 was subjected to exposure with kidney cell line for a period of
48 hours in CO2 incubator, and cell survival percentages were presented in table 4.20.

Results
89
Table 4.20 Mean optical density (OD) and cell survival percentages against various
concentrations of PEW6 after incubation of 48 hours in MTT assay using BHK-21 cell line.
Sr no. Concentration
(%v/v)
Mean OD ±SD Cell survival
percentage
CSP%
1 100 0.193±0.004 10.93
2 50 0.320±0.001 26.73
3 25 0.413±0.003 38.37
4 12.5 0.541±0.018 54.30
5 6.25 0.679±0.007 71.47
6 3.13 0.684±0.006 72.18
7 1.56 0.686±0.021 72.34
8 0.78 0.687±0.019 72.51
9 0.39 0.690±0.015 72.84
10 0.20 0.689±0.015 72.76
Positive control Cell culture medium - -
Negative control 20% DMSO - -

Results
90
Figure 4.17 Cell survival percentage (CSP) against different log concentrations of PEW6 in
MTT assay on BHK-21 cell lines
X-axis = log concentration of pharmaceutical waste water in (%v/v)
Y-axis = Cell survival percentage (CSP) BHK-21 cell lines against different concentrations of
pharmaceutical wastewater

Results
91
4.7 Oxidative stress
4.7.1 Effect on total-superoxide dismutase (T-SOD) activity in plasma, liver and kidney
The level of T-SOD in plasma decreased significantly when compared to control on
exposure to PEW1 characterized by (p ˂ 0.05). T-SOD level also showed significant difference
when PEW1 100% were compared with control, but 1% PEW1 group did not differed significantly
when compared to control (table 4.21). The vitamin E treated group showed a significant difference
(p ˂ 0.0.5) when compared with 100 %, 10 % and 1 % PEW1 groups. Treatment with PEW1 for
2 months induced severe oxidative stress in the liver and kidney of the samples which is
characterized by a significant decrease in SOD (p ˂ 0.05) level. Vitamin E partially restored the
T-SOD levels when compared with control groups. The results are represented in fig no.
4.7.2 Effect of catalase (CAT) activity in plasma, liver and kidney
Catalase in blood, liver and kidney showed a significant decrease in its levels (table 4.22)
with PEW1 when compared to control (p ˂ 0.05) suggesting the presence of oxidative stress.
Vitamin E was able to reduce the CAT activity in blood (p ˂ 0.05). Levels of CAT were restored
partially in liver and kidney when treated with by Vitamin E.
4.7.3 Effect of hydrogen peroxide (H2O2) in plasma, liver and kidney
Elevated H2O2 concentrations were significantly tapered by Vitamin E in plasma, liver and
kidney. Changes induced by 100% PEW1 were ameliorated by vitamin E (p ˂ 0.05). All the
treatments also showed significant difference when compared with control (table 4.23).

Results
92
Table 4.21 Effect on T-SOD activity in rat plasma, kidney and liver caused by chronic
exposure to PEW1 at different concentrations with and without vitamin E
Treatments Plasma Kidney Liver
Distilled Water 92.54±0.19 65.75±0.15 57.91±0.29
100% PEW1 63.57±0.19a 32.65±0.77a 43.57±0.23a
10% PEW1 80.17±0.38a 57.54±2.53a 51.70±1.14a
1% PEW1 91.78±0.38 64.95±0.6 57.80±0.29
100% PEW+ Vitamin E 70.65±2.44a,b 43.07±0.29a,b 47.36±0.29a,b
PEW: Pharmaceutical effluent wastewater; T-SOD: total superoxide dismutase
Values are mean ± standard error (n=5)
aP ˂ 0.05 versus control
bP ˂ 0.05 100% PEW versus 100% PEW+ Vitamin E (analysis of variance followed by Tukey’s
test)
a b

Results
93
Table 4.22 Effect on CAT activity in rat blood, kidney and liver caused by chronic exposure
to PEW1 at different concentrations with and without vitamin E
Treatments Blood Kidney Liver
Distilled Water 146.5±1.32 130.7±1.75 135±2.95
100% PEW 89.25±2.03a 54.36±1.71a 62.95±2.82a
10% PEW 128.2±0.78a 73.28±4.56a 87.51±2.84a
1% PEW 141.9±0.79 116.7±3.49 89.72±1.65a
100% PEW+ Vitamin E 100.1±0.77a,b 68.11±4.55a,b 72.75±3.26a
PEW: Pharmaceutical effluent wastewaterCAT: catalase; H2O2
Values are mean ± standard error (n=5)
a P ˂ 0.05 versus control
b P ˂ 0.05 100% PEW versus 100% PEW+ Vitamin E (analysis of variance followed by Tukey’s
test)
a b

Results
94
Table 4.23 Effect on H2O2 concentrations in rat plasma, kidney and liver caused by chronic
exposure to PEW1 at different concentrations with and without vitamin E
Treatments Plasma Kidney Liver
Distilled Water 220.6±2.67 402.7±2.67 294.3±2.72
100% PEW 68.80±2.67a 243.3±5.11a 162.9±2.67a
10% PEW 107.3±2.67a 330.9±3.5a 210.5±2.67a
1% PEW 182.1±3.5a 397.6±1.75 236.8±8.76a
100% PEW+ Vitamin E 129.5±2.67a,b 279.3±1.75a,b 267.1±1.75a,b
PEW: Pharmaceutical effluent wastewater; H2O2: hydrogen peroxide
Values are mean ± standard error (n=5)
a P ˂ 0.05 versus control
b P ˂ 0.05 100% PEW versus 100% PEW+ Vitamin E (analysis of variance followed by Tukey’s
test)
a b

Results
95
Figure 4.18 Effect of PEW1 on SOD activity in rat plasma, kidney and liver
Figure 4.19 Effect of PEW1 on CAT activity in rat blood, kidney and liver
Figure 4.20 Effect of PEW1 on H2O2 activity in rat plasma, liver and kidney
* p ˂ 0.05 versus control
# p ˂ 0.05 100 % PEW versus 100 % PEW+ Vitamin E

Results
96
4.8 Histopathology
The microphotographs exhibiting pathological alterations in tissues of kidney, liver, lungs,
intestine, heart and brain of Wistar rats are presented in figure 4.21(a-e) The most severe damage
was observed in the groups treated with PEW1 100%. The histopathological changes observed in
the rats, which were subjected to PEW1 10% and PEW1 1% were of relatively moderate intensity.
In the kidney coagulative necrosis of renal epithelial cells took place and many tubular
cells were disintegrated after 100% PEW1 exposure. There was cellular swelling in some tubular
cells along with peritubular congestion fig 4.21 (a). Liver was also compromised due to exposure
with PEW1 for 60 days and severe degeneration and cellular swelling as well as coagulative
necrosis in hepatocytes of hepatic cord were observed figure 4.21 (b). Lungs were also affected to
some extent. Lungs showed atekation and emphysema of alveoli. Effects are represented in figure
4.21 (c). There were mild effects of PEW1 on intestine where there was mild degeneration and
sloughing of intestinal epithelial cells depicted in figure 4.21 (d). In a very area in endocardium
there is break down of cells and presence of some inflammatory cells figure 4.21(e). No changes
were seen in the brain (cerebellum) and (cerebrum). There was no change in cell bodies, neutrophil
areas was normal, microglial cells were intact and no obvious pathological change was seen.

Results
97
Fig. 4.21 (a-e) Representative histological images of tissue sections followed oral exposure of PEW for 60 days. a.
kidney section of rat highlighting necrosis of cells along with control group showing intact glomerulus. b. Liver
section of rat highlighting degeneration and swelling of hepatocytes along with control c. Lungs section of rat
representing atekation and emphysema of alveoli d. Intestine section of rat highlighting mild degeneration and
sloughing of intestinal epithelial cells e. Heart section of rat highlighting break down of cells in endocardium and
presence of some inflammatory cells

CHAPTER 5
DISCUSSION
In this study pharmaceutical wastewater was characterized using AAS and GCMS. Various
inorganic and organic compounds were present in PEW. Heavy metals like Fe, Cr and As and Cd
were present in higher concentrations than the normal permissible limits of WHO and US EPA.
Various organic compounds like trimethoprim, prednisolone, dipyrone, caffeine and solvents like
toluene were also detected in PEW. In this study PEW samples were used without any pre
concentration depicting a true picture of both organic and inorganic contaminants present in it.
None of the previous study reported the use pure PEW for evaluation of genotoxic, mutagenic,
cytotoxic potential in different experimental models. Genotoxicity was evaluated using comet
assay on sheep lymphocytes and PEW showed a dose dependent effect exhibiting decrease in GDI
and DF with the increasing dilution factor. Similarly mutagenicity was evaluated using Ames assay
and PEW exhibited a mutagenic potential particularly with TA 100 salmonella typhimurium strain.
Ames assay results also exhibited a dose dependent decrease in M.I with the increasing dilution
factor of PEW. Cell survival percentage was calculated using MTT assay. Effect of PEW on BHK-
21 cell lines were observed. IC-50 was calculated. CSP was increased with the decreasing
concentration of PEW. None of the previous studies reported effect of pure PEW on different
experimental models demonstrating genotoxic, mutagenic and cytotoxic potential. In this study
effect of chronic exposure of PEW was also investigated. Rats were exposed to PEW and levels
of enzymes which cope with oxidation process were measured. It is linked with oxidative stress
generation. This generation of oxidative stress caused certain histopathological changes in rat liver,
kidney, heart, lungs and epithelium. Chronic exposure of PEW is associated with the generation

Discussion
99
of oxidative stress which may induces certain changes in tissues and may be linked with the
degenerative processes in vital organs of the body.
5.1 Inorganic compounds
The investigational values of the Cd were 0.01, 0.02 and 0.04 mg/L and go beyond the
normal allowable values of US EPA and WHO. Cd has been associated with respiratory distress,
spasms, loss of consciousness, breathing complications, vomiting and nausea (Gowd and Govil
2008). Continuous contact may be associated with cardiovascular risks, hypertension and renal
diseases (Robards and Worsfold 1991).
The amount of Iron (Fe) was considered extraordinary in all the tester samples. These
results were in accordance with earlier reports (Singarea and Dhabardeb 2014). Chronic exposure
to Fe can cause gastric and esophageal ulcers both in animals and humans. Various gastrointestinal
disorders are also associated with the higher levels of Fe along with nausea, vomiting and diarrhea
(Javed and Usmani 2013). Fe higher concentrations in PEW might be due to various iron
preparations manufacturing in these pharma industries.
Chromium (Cr) concentrations were higher in all the PEW samples analyzed. Cr (VI) is a
water miscible compound and exhibits a strong oxidizing potential which is extremely lethal for
living systems and tissue layers (Gowd and Govil 2008). Different species of invertebrates can be
affected by chromium to different levels (Moore and Ramamoorthy 2012). Chromium can damage
plants which are characterized by narrowing of leaves, and making the stems, small (Singarea and
Dhabardeb 2014). In human beings, Cr compounds may cause cancer of the kidneys, urinary
bladder, prostate, testis, stomach , brain, and lungs (Costa 1997). Higher concentration of Cr found
in PEW samples advocates’ higher risk of above mentioned diseases in population.

Discussion
100
In comparison with EPA and WHO standards, concentration of Arsenic (As) were
extremely high in all samples. Skin cancer development is the outcome of oral revelation to As.
Numerous internal organs like lungs, kidneys, bladder and liver may develop cancer after exposure
to As (Tchounwou et al. 2003). Cognitive inconsistencies had resulted in the school going age
children due to the presence of Inorganic As in drinking water (Grandjean and Landrigan 2014).
Different types of neurological diseases have occurred in children who were previously exposed
to (As) containing Morinaga milk (Tanaka et al. 2010). These higher concentration of As detected
in this study strongly suggests that population especially children are at higher risk of developing
neurological disorders.
5.2 Organic compounds
GC-MS analysis was used to accomplish the drug characteristics and numerous other polar
compounds which exist in the treatment plants (Yu et al. 2013). Certain organic contaminants were
detected when PEW was subjected to GCMS analysis.
Prednisolone a glucocorticoid was detected in PEW sample. Prednisolone is persistent in
nature and was reported to occur in a number of previous studies (Chang et al. 2007) (Lozano
2013) . Owing to its endocrine disrupting effect the presence of prednisolone might be associated
with hormonal problems which might be attributed to the suppression of hypothalamus pituitary
axis leading to imbalance of hormones released via this pathway. Exposure to endocrine disrupting
chemicals like prednisolone is associated with reproductive health changes in humans including
male infertility, birth defects, breast and testicular cancer (Nikolaou et al. 2007).
Trimethoprim was also detected in PEW. It is a persistent antibiotic (Halling-Sørensen et
al. 2000). Trimethoprim was associated with carcinogenicity and mutagenicity as folate deficiency
can induce entire range of genetic events. Trimethoprim being a folate antagonist might play an

Discussion
101
important role in induction of carcinogenesis and considered a potential environmental genotoxic
agent (Park and Choi 2008).
Lidocaine is a drug which is investigated in the study in PEW sample. This compound was
not extensively investigated in the environment. Lidocaine and its metabolite
monoethylglycinexylidide are persistent in nature and provides a proof for its detection in PEW.
LD50 of lidocaine was 106 mg.L-1 suggesting its potential Eco toxicological influence.
Toxicological studies at environmental concentrations were not reported before so study of this
sample in chronic toxicity study and oxidative stress induction provides with some new
information regarding the toxic potential of drugs in the environment (Rúa-Gómez and Püttmann
2012).
A number of environmental pollutants were detected along with caffeine, which has been
reported as a waste water indicator (Seiler et al. 1999). The combination mixture of different drugs,
exerts a cumulative additive effect. Although concentrations of pharmaceuticals in waste water are
very low but the presence of a large number these compounds might suggest that in combination
they do have eco toxicological influence as reported earlier (Quinn et al. 2008), (Krifa et al. 2013).
5.3 Microbial resistance
A total of 27 isolates were obtained representing 1 aeromonas species with 7 isolates, 1
micrococcus with 4 isolates, 1 bacillus with 6 isolates and 3 staphylococcus species with 10
isolates. Frequency of isolates varied between different sites with maximum isolates obtained from
PEW6. Aeromonas species was detected in PEW samples. This bacterium is responsible for the
occurrence of hemorrhagic septicemia in humans which is a food born disease (Abou-Elela et al.
2009). Bacillus megaterium was also found in the PEW. Presence of bacillus megaterium was
previously reported in the waste water samples. The higher concentration of the bacteria was due

Discussion
102
to higher levels of heavy metals particularly chromium which is in correlation with this study.
Chromium concentrations were found higher than the normal permissible limits of US EPA. This
suggests the use of the bacillus species in biotransformation of hexavalent Cr to less toxic trivalent
form (Thacker et al. 2007). Staphylococcus species are identified in the present study.
Staphylococci are normal micro biota of air, soil, water, humans, other animals and processed food
products. It is suggested that gram positive cocci are highly tolerant to dryness, dehydration and
low water activity which is responsible for its wide spread distribution and persistence in different
environments including PEW (Thacker et al. 2007).
A large number of viable bacteria were found in all PEW samples. The presence of high
number of bacteria in wastewater samples suggests the presence of adaptive mechanisms of
resistance among these bacterial colonies. This study is unique and one of the few investigations
that reports the incidence of heavy metal and antibiotic resistance among different bacterial
species.
The occurrence of pharmaceuticals in the environment has captured attention recently.
During past few years many investigations have been made regarding the persistence of
pharmaceuticals in the waste water, surface water, ground water and soil (Krifa et al. 2013).
Heavy metals are involved in microbial resistance patterns due to development of
detoxifying mechanisms evolved by xopolysaccharides, binding with bacteria, reduction of metals
and efflux of metals from microbes. Plasmid genes are the carriers of resistance and responsible
for transfer of toxic metal resistance from one cell to another cell (Silver 1996).
Wastewater isolates have previously been studied and it was investigated that
Pseudomonas aeruginosa, Klebsiella pneumonia, Proteus mirabilis and Staphylococcus spp. were
found to be resistant to heavy metals and certain antibiotics (Filali et al. 2000). Similar results

Discussion
103
were found by (Sharma et al. 2000) where he explored cadmium resistant Klebsiella species. These
findings support the result of this study in which various bacterial isolates were found resistant to
Cu, Cr and various antibiotics. Based upon findings it is also suggested that Genes encoding for
heavy metals are located together with antibiotics. Bacteria have unspecific resistance mechanisms
which are common to different substances such as heavy metals, biocides and antibiotics. So it is
very likely that pressure, which is selective for one such compound is responsible indirectly for
resistance of other bacteria (Dalsgarrd and Guardbassi 2002).
5.4 Genotoxicity
In an ecosystem, single cell gel electrophoresis (SCGE) are most widely used assays for
detection of DNA damage. Long term contact and after separation resulted in impaired DNA,
chromosomes and exemplifies subsequent effect (Frenzilli et al. 2009). Though the mechanism of
action is unclear, but in humans Cd and As had been reported to be carcinogenic (Waalkes 2003);
(Goering et al. 1999). Metals may cause different sorts of lesions like DNA and DNA cross
connections, double and single DNA strands breaking, base pairing alterations and protein crosses
of DNA. Comet assay identifies the single strand breakage of DNA. Genotoxic agents may cause
breakdowns in DNA. Apurinic sites, which are alkali sensitive, have the ability to tear apart the
strand when electrophoresis are executed at alkaline solution
Previous studies had shown that Cd brings class 3 or 4 damage to DNA in comparison to
control cells. It has been established previously that Cd in 0.02mg/L prompted DNA breakage
(Mourón et al. 2001). It was stated that DNA lesions and cross linking ensued at high As doses
(Gebel et al. 1997). In Denmark, Blue mussels have been related to obtain waste waters. Greater
damage to DNA arisen in gills and Cd, Ni and Cr, present in wastewater, produced a concentration
dependent movement of tail (Rank et al. 2005).

Discussion
104
A chief contributor to genotoxicity is trimethoprim which is detected in the present study.
Trimethoprim (TMP)’s genotoxicity might be accredited to the generation of oxidative stress and
production of reactive oxygen species ROS (Binelli et al. 2009). TMP was reported to prompt
mitochondrial movement of electron transport in a robust fashion, as this movement is a principal
basis of generation of reactive oxygen radicals in cells.
Xenobiotics caused hydrogen peroxide production and oxidative stress generation by
aiding in withdrawal of electrons from scavenging radicals in mitochondria (Gagné et al. 2006). It
was reported earlier that membrane damage leads to active gene expression and proliferation of
cells takes place (Bengtsson et al. 2001). This is considered a marker of DNA damage. A number
of studies have been conducted on waste water samples depicting DNA damage in-vitro and in-
vivo. Toxicity of wastewater samples was attributed to the heavy metal’s presence (TÜRKEZ et
al. 2009).
5.5 Mutagenicity
A significant index for mutagenic properties is Ames plate incorporation assay, used for
mutagenic properties of numerous substances which are present in the surroundings. It is reputable
from the results that samples proved to be potent mutagenic especially when checked against
TA100 and TA102 strain. It was suggested that TA102 strain has been used to identify the
mutagenic behavior associated with reactive oxygen radicals (Tabrez and Ahmad 2011).
The study confirmed that samples from environment contained a mixture of different
hazardous components so different strains were used to access the mutagenic nature of components
present in the mixture as one strain is unable to show the real picture of mutagenic strength (Tabrez
and Ahmad 2011). Present study followed the same pattern as that of older investigations and
confirmed that the mutagenicity of sample is due to the presence of high concentrations of As, Cd

Discussion
105
and Cr along with anti-bacterial drugs and compound that are phenolic in nature. (Fatima and
Ahmad 2006); (Tabrez and Ahmad 2009). The presence of these different hazardous materials has
been confirmed in the initial part of the study. Cd concentrations were found higher than normal
permissible limits of US EPA. Cd can induce mutations by generation of oxidative stress in DNA.
It inhibits the repair of endogenous and exogenous lesions promoting the probability of mutation
that’s why mutation response was significant when PEW was treated with TA-102 strain of
Salmonella typhimurium. Excessive concentrations of Cd is linked with higher incidence of
prostate, lungs and testes cancer in the population when they get exposed to PEW. Cd may affect
cell proliferation, differentiation and do cause apoptosis (Bertin and Averbeck 2006). Higher
concentrations of As in PEW can be a contributing factor in mutagenicity. As may affect the
methylation of DNA in gene promotor regions which is responsible for gene expression along with
modifications in histone tail which is a regulator for the access of transcriptional machinery to the
gene. These two processes are responsible for the As induced mutagenicity (Bustaffa et al. 2014)
It was also proposed that mutagenicity was due to the presence of dissolved components
as compared to particles which are in suspended form. Present study concluded that TA 102 is
much more sensitive than TA100 confirming the generation of toxic radicals, which is in
accordance with studies conducted by (Fatima and Ahmad 2006), (Tabrez and Ahmad 2009).
Addition of liver extracts of rats has resulted in increase and decrease of mutagenicity
confirming that mutagens might undergo metabolism upon addition of a metabolic activation
system and ultimately the response of the components might be altered (Tabrez and Ahmad 2009).
Oxidative stress has been associated with transition mutations and TA102 responded well in this
study confirming alteration in A-T site (Aleem and Malik 2005).

Discussion
106
5.6 Oxidative stress and Histopathology
In the present study role of PEW induced oxidative stress was investigated. Its role in
facilitating renal and hepatic pathology of rats following 60 days of oral treatment with PEW was
discovered. Efficacy of vitamin E in alleviating the toxicity of PEW was also explored. The liver
and kidneys were selected because they considered to be the major target of toxicity. Liver
containing metabolizing enzymes has the ability to biotransform the xenobiotic into less toxic or
active metabolite. Liver has been a site for lipid peroxidation so considered a hallmark for the
oxidative stress tests. The kidneys do perform the same activities along with filtration (Patlolla et
al. 2009). Both kidneys and liver are vulnerable to the stress, including oxidative stress because of
their dependency on osmotic pressure and concentration gradient along with kidney which is
considered to be a site of peroxisomes that can store catalase (Hook 1993).
Cr had a potential to depress the levels of SOD, CAT, GSH-Px in rats epithelial intestinal
cell (Sengupta et al. 1990). Cr (VI) decreases the enzymatic antioxidant levels including SOD and
CAT (Susa et al. 1996). 60 days of drinking waste water resulted in induction of oxidative stress
and generation of reactive oxygen species (ROS) with a resultant decrease in GSH, SOD and CAT.
Glutathione exhaustion had been a result of declining levels of GST, SOD and CAT which are
known to be free radical scavengers (Al-Qirim et al. 2002) (Dickinson et al. 2003). Normally
enzymatic and non-enzymatic anti-oxidant systems exist in the body. Overproduction of free
radicals or diminished scavenging action of enzymes or both mechanisms are involved in lipid
peroxidation. It is a chain process, initial oxidation of few molecules leads to massive tissue
destruction and diseased organs (Zaidi and Banu 2004). Several diseases of CNS Parkinson’s,
Schizophrenia, Alzheimer have been associated with generation of reactive oxygen species and as
a result of failure of the antioxidants defense mechanism (Smythies 1999).

Discussion
107
Pb concentrations found higher than normal limits of US EPA has also been associated
with oxidative stress. Lead nitrate decreases the activities of SOD, CAT and GSH and resultant
tissues were exposed to per oxidative damage. These enzymes are metallo proteins and induct their
function enzymatically detoxifying peroxides (-OOH), H2O2 and O2* (Lakshmi et al. 2013). Pb
toxicity has also been found to be multifactorial. Possible mechanisms may involve enzyme
inhibition, competitively inhibits mineral absorption or binding with sulfhydryl groups.
As higher concentrations has also been found to exert oxidative damage in tissues by the
generation of ROS e.g. superoxide, hydroxyl and peroxyl radicals. Levels of SOD and CAT
decreased significantly in rat’s liver and kidneys when they were exposed to PEW for 60 days
suggesting the generation of oxidative stress metabolic organs. This decrease in levels of SOD
and CAT in liver of rats and increased MDA levels established the fact that rats suffered from
oxidative destruction after chronic exposure to inorganic As due to lipid peroxidation and oxidative
damage (Santra et al. 1999), (Xu et al. 2013).
The present study is in accordance with the previous investigations in which Pb, As and Cr
have been associated with decreasing levels of enzymes and induction of pathological changes in
body organs especially where the xenobiotic got transformed to other metabolites i.e. liver and
kidney (Patrick 2003).
Pharmaceutical residues, sex steroid hormones and personal care products have been
categorized as new emerging pollutants. Prednisolone was detected in the pharmaceutical waste
water. Steroids are associated with deterioration of endocrine and reproductive function. Studies
have proposed increased risk of breast, prostate and testicular carcinomas on exposure to endocrine
disrupting substances like prednisolone (Kudłak and Namieśnik 2008). Phenolic compounds are
considered potent environmental pollutants. Pharmaceutical, petroleum and chemical industries
Discussion
108
have contributed in the discharge of a large amount phenolic compounds. Phenolic compounds led
to the generation of free radicals in organs like liver leading to the generation of phenoxy radicals
and intermediate metabolites resulting in generation of superoxide radicals and hydrogen peroxide
(Michałowicz and Duda 2007). Toluene increases the formation of reactive oxygen species and
decreases oxidative stress markers like SOD, CAT, and Glutathione S-transferase when different
concentrations of toluene were exposed to Drosophila melanogaster (Singh et al. 2009).
Non-enzymatic anti-oxidants such as vitamin A, C and E have been reported to act as
effective anti-oxidants and had a potential to mitigate diseases and degenerative processes which
are known to occur with oxidative stress (Olas and Wachowicz 2002) (Chaudière and Ferrari-Iliou
1999). Administration of Vitamin E to PEW exposed rats raised the levels of SOD, CAT and H2O2.
Vitamin E administered group exhibits significant difference in raising the level of enzymes when
compared with group which was administered with PEW 100% only. Vitamin E had a primary
effect in limiting the oxidative stress in brain (Zaidi and Banu 2004). It is suggested that that liver
toxicity can be protected from oxidative damage by administering Vitamin E. Vitamin E is a
peroxyl radical scavenger and it maintains the integrity of long-chain polyunsaturated fatty acids
in the membranes of cells and maintain their bioactivity. (Onyema et al. 2006), (Rao et al. 2006).
It was in agreement with previous investigations that vitamin E do play some role in relieving
oxidative stress and improving the markers related to stress generation.
Environmental metals like lead, chromium, cadmium are known hepatotoxic agents (Cui
et al. 2004), (Mousa 2004), (Ramm and Ruddell 2005). They have a potential to cause chronic
renal diseases (Shaikh et al. 1999), (Barbier et al. 2005). It was found that a mixture of heavy
metals can induce oxidative stress in liver, kidney, brain and erythrocytes. The mechanism
involved might be lipid peroxidation along with the decreasing ability of antioxidative defense

Discussion
109
systems in male rats (Jadhav et al. 2007a), (Jadhav et al. 2006). The final observation of the study
suggested that mixture of heavy metals may cause liver injury on prolonged exposure and poses a
health risk. Kidney particularly proximal tubules have been a potential first target of toxicity
caused by heavy metals (Barbier et al. 2005), (Madden and Fowler 2000). It was accessed that the
oxidative stress inducing potential of heavy metals was maximum in the kidney as lipid
peroxidation and diminution in enzymatic and non-enzymatic antioxidant status was maximum
(Jadhav et al. 2007b). The results also suggest that the kidney was most sensitive organ making it
a sensitive and potential target and posing a danger of kidney damage both in humans and animals
when they were repeatedly exposed to heavy metals present in the environment.
In-vivo toxicological studies should include animals from both sexes. However, gender
dependent effects may be prominent in some studies. There are strong evidences of higher
antioxidant activity in female than male. Female animals are also less prone to oxidative stress
than male (Chakraborti et al. 2007).
Waste water from industries should be treated before expulsion into the environment or
open water bodies. Currently there is no waste water treatment plant operational in the industrial
areas of Lahore. There should be strict legislation regarding this issue. It is estimated that half of
the waste water produced worldwide is discarded without specific treatment (Chen et al. 2008).
Different methods are available to treat pharmaceutical waste water can be categorized as
biological processes such as aerobic and anaerobic treatments. Some advance treatments which
include membrane technology, activated carbon and membrane distillation processes are also used
to treat PEW. Advanced oxidation processes like ozone treatment, photo catalysis and Fenton
oxidation can be used to reduce the toxic potential of PEW. Heavy metals can be removed using
hybrid technologies from pharmaceutical waste water (Gadipelly et al. 2014). Several methods

Discussion
110
like ozone based processes are available to remove certain pharmaceutical compounds like
caffeine, cyclophosphamide and Diethyl meta-toluamide and it was reported in different
investigations that concentrations of persistent compounds were reduced markedly from waste
water using above mentioned treatment processes (Kim and Tanaka 2010). Biochar derived from
different sources can be used to remove heavy metals and pharmaceuticals from PEW.
It is suggested that the PEW should be treated with the above mentioned processes and
based upon the findings a cost effective method that can reduce toxic potential of PEW should be
employed in countries like Pakistan where it is difficult to install expensive treatment plants to
protect our environment from hazardous effects of Pharmaceutical waste water.

Summary
CHAPTER 6
SUMMARY
Pharmaceutical effluent being a complex mixture of drugs and heavy metals may affect
human health exhibiting a strong potential of mutagenicity, carcinogenicity, cytotoxicity and
oxidative stress induction along with pathological changes in various organs of the body. The
current study was focused to quantify the presence of heavy metals, detection of various drugs,
determining the bacterial load along with isolation and identification of different bacteria and
assessment of the mutagenic and genotoxic, cytotoxic and oxidative stress induction of
pharmaceutical effluent wastewater when exposed to sheep lymphocytes, Salmonella typhimurium
strains, cell lines and rats respectively.
Atomic absorption spectrophotometer was used to quantify heavy metals and showed the
presence of arsenic, chromium, lead and iron in concentrations above the normal limits
recommended by WHO and EPA. Gas Chromatograph mass spectrophotometer analysis shown
the presence of digitoxin, lignocaine, caffeine and trimethoprim and various other organic
pollutants.
Microbiological evaluation showed a high bacterial load in the pharmaceutical waste water.
Several bacteria were also found in PEW in the presence of different drugs and heavy metals.
Aeromonas sobria, Micrococcus varians, Staphyoloccus epidermidis, Staphylococcus aureus,
Bacillus megaterium showed tolerance to potassium di chromate and copper sulphate and
resistance to various antibiotic discs.
Ames assay revealed a strong mutagenic potential with and without the presence of
metabolic activation mixtures. A concentration dependent effect was observed when samples were
tested with increasing dilution factor.
Summary
112
MTT assay and comet assay also showed a concentration dependent effect. The BHK-21
cell line was used to evaluate cytotoxicity and cell viability decreased with increasing
concentration of PEW. Sheep lymphocytes used in comet assay exhibited a concentration
dependent DNA damage.
Different antioxidant enzymes were also evaluated. Rats were exposed to PEW at different
concentrations and following 60 days oral exposure, rats were evaluated for the presence of total
superoxide dismutase, catalase and hydrogen peroxide in kidney, liver and plasma. Exposure to
Pharmaceutical waste water significantly decreased the (TSOD), (CAT) and (H2O2) levels in
plasma, liver and kidney. Treatment with Vitamin E significantly ameliorated the levels of
enzymes.
Exposed rats were also evaluated for any pathological changes. Coagulative necrosis of
renal epithelial cells were observed along with severe degeneration and cellular swelling in
hepatocytes of hepatic cord.

CHAPTER 7
LITERATURE CITED
Abou-Elela, G. M., El-Sersy, N. A., Abd-Elnaby, H. and Wefky, S. H. 2009. Distribution and
bio-diversity of fecal indicators and potentially harmful pathogens in North Delta
(Egypt). Australian Journal of Basic and Applied Sciences, 3, 3374-3385.
Ahuja, Y., Vijayashree, B., Saran, R., Jayashri, E., Manoranjani, J. and Bhargava, S. 1999. In
vitro effects of low-level, low-frequency electromagnetic fields on DNA damage in
human leucocytes by comet assay. Indian Journal of biochemistry and biophysics, 36,
318-322.
Al-Qirim, T. M., Shahwan, M., Zaidi, K. R., Uddin, Q. and Banu, N. 2002. Effect of khat, its
constituents and restraint stress on free radical metabolism of rats. Journal of
Ethnopharmacology, 83, 245-250.
Alam, M. Z., Ahmad, S. and Malik, A. 2009. Genotoxic and mutagenic potential of agricultural
soil irrigated with tannery effluents at Jajmau (Kanpur), India. Archives of environmental
contamination and toxicology, 57, 463-476.
Aleem, A. and Malik, A. 2005. Genotoxicity of the Yamuna river water at Okhla (Delhi), India.
Ecotoxicology and environmental safety, 61, 404-412.
Ali, M. and Athar, M. 2010. Impact of transport and industrial emissions on the ambient air
quality of Lahore City, Pakistan. Environmental monitoring and assessment, 171, 353-
363.
Andreozzi, R., Campanella, L., Fraysse, B., Garric, J., Gonnella, A., Lo Giudice, R., Marotta, R.,
Pinto, G. and Pollio, A. 2004. Effects of advanced oxidation processes(AOPs) on the
toxicity of a mixture of pharmaceuticals. Water Science & Technology, 50, 23-28.
Anyakora, C., Nwaeze, K., Awodele, O., Nwadike, C., Arbabi, M. and Coker, H. 2011.
Concentrations of heavy metals in some pharmaceutical effluents in Lagos, Nigeria.
Journal of Environmental Chemistry and Ecotoxicology Vol, 3, 25-31.
Azevedo, F., Marques, F., Fokt, H., Oliveira, R. and Johansson, B. 2011. Measuring oxidative
DNA damage and DNA repair using the yeast comet assay. Yeast, 28, 55-61.
Bakare, A. A., Okunola, A. A., Adetunji, O. A. and Jenmi, H. B. 2009. Genotoxicity assessment
of a pharmaceutical effluent using four bioassays. Genetics and molecular biology, 32,
373-381.
Barbier, O., Jacquillet, G., Tauc, M., Cougnon, M. and Poujeol, P. 2005. Effect of heavy metals
on, and handling by, the kidney. Nephron Physiology, 99, p105-p110.
Barbosa, J., Cabral, T., Ferreira, D., Agnez-Lima, L. and De Medeiros, S. B. 2010. Genotoxicity
assessment in aquatic environment impacted by the presence of heavy metals.
Ecotoxicology and environmental safety, 73, 320-325.
Bauer, A., Kirby, W., Sherris, J. C., Turck and Turck, M. 1966. Antibiotic susceptibility testing
by a standardized single disk method. American journal of clinical pathology, 45, 493.
Bengtsson, Å., Lundberg, M., Avila‐Cariño, J., Jacobsson, G., Holmgren, A. and Scheynius, A.
2001. Thiols decrease cytokine levels and down‐regulate the expression of CD30 on
human allergen‐specific T helper (Th) 0 and Th2 cells. Clinical & Experimental
Immunology, 123, 350-360.

Literature Cited
114
Bertin, G. and Averbeck, D. 2006. Cadmium: cellular effects, modifications of biomolecules,
modulation of DNA repair and genotoxic consequences (a review). Biochimie, 88, 1549-
1559.
Binelli, A., Cogni, D., Parolini, M., Riva, C. and Provini, A. 2009. Cytotoxic and genotoxic
effects of in vitro exposure to triclosan and trimethoprim on zebra mussel (Dreissena
polymorpha) hemocytes. Comparative Biochemistry and Physiology Part C: Toxicology
& Pharmacology, 150, 50-56.
Bisht, S. S., Praveen, B., Rukmini, M. and Dhillon, H. 2012. Isolation and Screening of Heavy
Metal Absorbing Bacteria from the Industry Effluent Sites of the River Nagavali. Inter. J
Pharm. Sci., Res, 3, 1448-1451.
Brain, R. A., Johnson, D. J., Richards, S. M., Hanson, M. L., Sanderson, H., Lam, M. W.,
Young, C., Mabury, S. A., Sibley, P. K. and Solomon, K. R. 2004. Microcosm evaluation
of the effects of an eight pharmaceutical mixture to the aquatic macrophytes Lemna gibba
and Myriophyllum sibiricum. Aquatic toxicology, 70, 23-40.
Brun, G. L., Bernier, M., Losier, R., Doe, K., Jackman, P. and Lee, H. B. 2006. Pharmaceutically
active compounds in Atlantic Canadian sewage treatment plant effluents and receiving
waters, and potential for environmental effects as measured by acute and chronic aquatic
toxicity. Environmental toxicology and chemistry, 25, 2163-2176.
Bustaffa, E., Stoccoro, A., Bianchi, F. and Migliore, L. 2014. Genotoxic and epigenetic
mechanisms in arsenic carcinogenicity. Archives of toxicology, 88, 1043-1067.
Caminada, D., Escher, C. and Fent, K. 2006. Cytotoxicity of pharmaceuticals found in aquatic
systems: comparison of PLHC-1 and RTG-2 fish cell lines. Aquatic toxicology, 79, 114-
123.
Carrara, C., Ptacek, C. J., Robertson, W. D., Blowes, D. W., Moncur, M. C., Sverko, E. and
Backus, S. 2008. Fate of pharmaceutical and trace organic compounds in three septic
system plumes, Ontario, Canada. Environmental science & technology, 42, 2805-2811.
Chakraborti, A., Gulati, K., Banerjee, B. D. and Ray, A. 2007. Possible involvement of free
radicals in the differential neurobehavioral responses to stress in male and female rats.
Behavioural brain research, 179, 321-325.
Chang, H., Hu, J. and Shao, B. 2007. Occurrence of natural and synthetic glucocorticoids in
sewage treatment plants and receiving river waters. Environmental science & technology,
41, 3462-3468.
Chaudière, J. and Ferrari-Iliou, R. 1999. Intracellular antioxidants: from chemical to biochemical
mechanisms. Food and Chemical Toxicology, 37, 949-962.
Chen, Z., Ren, N., Wang, A., Zhang, Z.-P. and Shi, Y. 2008. A novel application of TPAD–
MBR system to the pilot treatment of chemical synthesis-based pharmaceutical
wastewater. Water research, 42, 3385-3392.
Chronopoulos, J., Haidouti, C., Chronopoulou-Sereli, A. and Massas, I. 1997. Variations in plant
and soil lead and cadmium content in urban parks in Athens, Greece. Science of the total
environment, 196, 91-98.
Clark, A., Turner, T., Dorothy, K. P., Goutham, J., Kalavati, C. and Rajanna, B. 2003. Health
hazards due to pollution of waters along the coast of Visakhapatnam, east coast of India.
Ecotoxicology and environmental safety, 56, 390-397.
Cleuvers, M. 2003. Aquatic ecotoxicity of pharmaceuticals including the assessment of
combination effects. Toxicology Letters, 142, 185-194.

Literature Cited
115
Cleuvers, M. 2004. Mixture toxicity of the anti-inflammatory drugs diclofenac, ibuprofen,
naproxen, and acetylsalicylic acid. Ecotoxicology and environmental safety, 59, 309-315.
Costa, M. 1997. Toxicity and carcinogenicity of Cr (VI) in animal models and humans. Critical
reviews in toxicology, 27, 431-442.
Crouse, B. A., Ghoshdastidar, A. J. and Tong, A. Z. 2012. The presence of acidic and neutral
drugs in treated sewage effluents and receiving waters in the Cornwallis and Annapolis
River watersheds and the Mill CoveSewage Treatment Plant in Nova Scotia, Canada.
Environmental research, 112, 92-99.
Cui, X., Li, S., Shraim, A., Kobayashi, Y., Hayakawa, T., Kanno, S., Yamamoto, M. and Hirano,
S. 2004. Subchronic exposure to arsenic through drinking water alters expression of
cancer-related genes in rat liver. Toxicologic Pathology, 32, 64-72.
Dalsgarrd, A. and Guardbassi, L. 2002. Occurrence and fate of antibiotics resistant bacteria in
sewage. Danish, EPA Environment Project.
De Lima, R. O. A., Bazo, A. P., Salvadori, D. M. F., Rech, C. M., De Palma Oliveira, D. and De
Aragão Umbuzeiro, G. 2007. Mutagenic and carcinogenic potential of a textile azo dye
processing plant effluent that impacts a drinking water source. Mutation
Research/Genetic Toxicology and Environmental Mutagenesis, 626, 53-60.
Dickinson, D. A., Moellering, D. R., Iles, K. E., Patel, R. P., Levonen, A.-L., Wigley, A.,
Darley-Usmar, V. M. and Forman, H. J. 2003. Cytoprotection against oxidative stress and
the regulation of glutathione synthesis. Biological chemistry, 384, 527-537.
Ejaz, S., Chekarova, I., Cho, J. W., Lee, S. Y., Ashraf, S. and Lim, C. W. 2009. Effect of aged
garlic extract on wound healing: a new frontier in wound management. Drug and
chemical toxicology, 32, 191-203.
Europe, C. 2004. European Pharmacopoeia 5.0. Council of Europe.
Fatima, R. A. and Ahmad, M. 2006. Genotoxicity of industrial wastewaters obtained from two
different pollution sources in northern India: a comparison of three bioassays. Mutation
Research/Genetic Toxicology and Environmental Mutagenesis, 609, 81-91.
Fent, K., Weston, A. A. and Caminada, D. 2006. Ecotoxicology of human pharmaceuticals.
Aquatic toxicology, 76, 122-159.
Fick, J., Söderström, H., Lindberg, R. H., Phan, C., Tysklind, M. and Larsson, D. 2009.
Contamination of surface, ground, and drinking water from pharmaceutical production.
Environmental toxicology and chemistry, 28, 2522-2527.
Filali, B., Taoufik, J., Zeroual, Y., Dzairi, F., Talbi, M. and Blaghen, M. 2000. Waste water
bacterial isolates resistant to heavy metals and antibiotics. Current microbiology, 41, 151-
156.
Frenzilli, G., Nigro, M. and Lyons, B. 2009. The Comet assay for the evaluation of genotoxic
impact in aquatic environments. Mutation Research/Reviews in Mutation Research, 681,
80-92.
Gadipelly, C., PeRez-GonzaLez, A., Yadav, G. D., Ortiz, I., IbaNEz, R., Rathod, V. K. and
Marathe, K. V. 2014. Pharmaceutical industry wastewater: review of the technologies for
water treatment and reuse. Industrial & Engineering Chemistry Research, 53, 11571-
11592.
Gagné, F., Blaise, C., Fournier, M. and Hansen, P. 2006. Effects of selected pharmaceutical
products on phagocytic activity in Elliptio complanata mussels. Comparative
Biochemistry and Physiology Part C: Toxicology & Pharmacology, 143, 179-186.

Literature Cited
116
Gebel, T., Birkenkamp, P., Luthin, S. and Dunkelberg, H. 1997. Arsenic (III), but not antimony
(III), induces DNA-protein crosslinks. Anticancer research, 18, 4253-4257.
Ghauri, B., Lodhi, A. and Mansha, M. 2007. Development of baseline (air quality) data in
Pakistan. Environmental monitoring and assessment, 127, 237-252.
Goering, P. L., Aposhian, H. V., Mass, M. J., Cebrián, M., Beck, B. D. and Waalkes, M. P. 1999.
The enigma of arsenic carcinogenesis: role of metabolism. Toxicological Sciences, 49, 5-
14.
Goodfellow, M., Kämpfer, P., Busse, H.-J., Trujillo, M. E., Suzuki, K.-I., Ludwig, W. and
Whitman, W. B. 2012. Bergey's manual of systematic bacteriology, Springer New York.
Gowd, S. S. and Govil, P. K. 2008. Distribution of heavy metals in surface water of Ranipet
industrial area in Tamil Nadu, India. Environmental monitoring and assessment, 136,
197-207.
Grandjean, P. and Landrigan, P. J. 2014. Neurobehavioural effects of developmental toxicity.
The Lancet Neurology, 13, 330-338.
Gros, M., Petrović, M. and Barcelo, D. 2007. Wastewater treatment plants as a pathway for
aquatic contamination by pharmaceuticals in the Ebro river basin (northeast Spain).
Environmental toxicology and chemistry, 26, 1553-1562.
H, Z., Gl, B., P, M. and Hg, S. 1994. - Oxidation pathways for the intracellular probe 2',7'-
dichlorofluorescein. Arch Toxicol, 68, 582-7.
Halling-Sørensen, B., Lützhøft, H.-C. H., Andersen, H. and Ingerslev, F. 2000. Environmental
risk assessment of antibiotics: comparison of mecillinam, trimethoprim and
ciprofloxacin. Journal of antimicrobial chemotherapy, 46, 53-58.
Halling-Sørensen, B., Nielsen, S. N., Lanzky, P., Ingerslev, F., Lützhøft, H. H. and Jørgensen, S.
1998. Occurrence, fate and effects of pharmaceutical substances in the environment-A
review. Chemosphere, 36, 357-393.
Hernando, M. D., Mezcua, M., Fernández-Alba, A. and Barceló, D. 2006. Environmental risk
assessment of pharmaceutical residues in wastewater effluents, surface waters and
sediments. Talanta, 69, 334-342.
Holm, J. V., Ruegge, K., Bjerg, P. L. and Christensen, T. H. 1995. Occurrence and distribution
of pharmaceutical organic compounds in the groundwater downgradient of a landfill
(Grindsted, Denmark). Environmental science & technology, 29, 1415-1420.
Hook, J. B. 1993. Toxicology of the Kidney, CRC Press.
Houk, V. S. 1992. The genotoxicity of industrial wastes and effluents: a review. Mutation
Research/Reviews in Genetic Toxicology, 277, 91-138.
Hudzicki, J. 2009. Kirby-Bauer disk diffusion susceptibility test protocol. Am Soc Microbiol.
Jadhav, S., Sarkar, S., Patil, R. and Tripathi, H. 2007a. Effects of subchronic exposure via
drinking water to a mixture of eight water-contaminating metals: a biochemical and
histopathological study in male rats. Archives of environmental contamination and
toxicology, 53, 667-677.
Jadhav, S., Sarkar, S. and Tripathi, H. 2006. Cytogenetic effects of a mixture of selected metals
following subchronic exposure through drinking water in male rats. Indian journal of
experimental biology, 44, 997.
Jadhav, S. H., Sarkar, S. N., Kataria, M. and Tripathi, H. C. 2007b. Subchronic exposure to a
mixture of groundwater-contaminating metals through drinking water induces oxidative
stress in male rats. Environmental toxicology and pharmacology, 23, 205-211.

Literature Cited
117
Javed, M. and Usmani, N. 2013. Assessment of heavy metal (Cu, Ni, Fe, Co, Mn, Cr, Zn)
pollution in effluent dominated rivulet water and their effect on glycogen metabolism and
histology of Mastacembelus armatus. SpringerPlus, 2, 1-13.
Jolibois, B. and Guerbet, M. 2005. Evaluation of industrial, hospital and domestic wastewater
genotoxicity with the Salmonella fluctuation test and the SOS chromotest. Mutation
Research/Genetic Toxicology and Environmental Mutagenesis, 565, 151-162.
Jolibois, B., Guerbet, M. and Vassal, S. 2003. Detection of hospital wastewater genotoxicity with
the SOS chromotest and Ames fluctuation test. Chemosphere, 51, 539-543.
Jomova, K. and Valko, M. 2011. Advances in metal-induced oxidative stress and human disease.
Toxicology, 283, 65-87.
Kim, I. and Tanaka, H. 2010. Use of ozone-based processes for the removal of pharmaceuticals
detected in a wastewater treatment plant. Water Environment Research, 82, 294-301.
Klavarioti, M., Mantzavinos, D. and Kassinos, D. 2009. Removal of residual pharmaceuticals
from aqueous systems by advanced oxidation processes. Environment International, 35,
402-417.
Kolpin, D. W., Furlong, E. T., Meyer, M. T., Thurman, E. M., Zaugg, S. D., Barber, L. B. and
Buxton, H. T. 2002. Pharmaceuticals, hormones, and other organic wastewater
contaminants in US streams, 1999-2000: A national reconnaissance. Environmental
science & technology, 36, 1202-1211.
Krifa, M., Dellai, A., Bouhlel, I., Robert, J., Cherif, A., Barillier, D., Mosrati, R., Chekir-
Ghedira, L. and Mansour, H. B. 2013. Human cell death in relation to DNA damage after
exposure to the untreated and biologically treated pharmaceutical wastewater.
Environmental Science and Pollution Research, 20, 3836-3842.
Kudłak, B. and Namieśnik, J. 2008. Environmental fate of endocrine disrupting compounds—
analytical problems and challenges. Critical Reviews in Analytical Chemistry, 38, 242-
258.
Kumar, R., Nagpure, N., Kushwaha, B., Srivastava, S. K. and Lakra, W. 2010. Investigation of
the genotoxicity of malathion to freshwater teleost fish Channa punctatus (Bloch) using
the micronucleus test and comet assay. Archives of environmental contamination and
toxicology, 58, 123-130.
Kümmerer, K. 2009. Antibiotics in the aquatic environment – A review – Part I. Chemosphere,
75, 417-434.
Lah, B., Malovrh, S., Narat, M., Cepeljnik, T. and Marinsek‐Logar, R. 2004. Detection and
quantification of genotoxicity in wastewater‐treated Tetrahymena thermophila using the
comet assay. Environmental toxicology, 19, 545-553.
Lakshmi, B., Sudhakar, M. and Aparna, M. 2013. Protective potential of Black grapes against
lead induced oxidative stress in rats. Environmental toxicology and pharmacology, 35,
361-368.
Lane, T. W. and Morel, F. M. 2000. A biological function for cadmium in marine diatoms.
Proceedings of the National Academy of Sciences, 97, 4627-4631.
Lane, T. W., Saito, M. A., George, G. N., Pickering, I. J., Prince, R. C. and Morel, F. M. 2005.
Biochemistry: a cadmium enzyme from a marine diatom. Nature, 435, 42-42.
Larsson, D., De Pedro, C. and Paxeus, N. 2007. Effluent from drug manufactures contains
extremely high levels of pharmaceuticals. Journal of hazardous materials, 148, 751-755.

Literature Cited
118
Laville, N., Aıt-Aıssa, S., Gomez, E., Casellas, C. and Porcher, J. 2004. Effects of human
pharmaceuticals on cytotoxicity, EROD activity and ROS production in fish hepatocytes.
Toxicology, 196, 41-55.
Li D, Y. M., Hu J, Ren L, Zhang Y, Li K. 2008. Determination
andfateofoxytetracyclineandrelatedcompoundsinoxytetracycline production wastewater
and the receiving river. Environ Toxicol Chem, 27, 80-86
Lowry, O. H., Rosebrough, N. J., Farr, A. L. and Randall, R. J. 1951. Protein measurement with
the Folin phenol reagent. J biol Chem, 193, 265-275.
Lozano, M. D. C. 2013. Method development for a chemical and biological analysis of
glucocorticoids in wastewater, THE UNIVERSITY OF TEXAS AT EL PASO.
Luo, Z., Wang, B., Liu, M., Jiang, K., Liu, M. and Wang, L. 2014. Effect of dietary
supplementation of vitamin C on growth, reactive oxygen species, and antioxidant
enzyme activity of Apostichopus japonicus (Selenka) juveniles exposed to nitrite.
Chinese Journal of Oceanology and Limnology, 32, 749-763.
Ma, J., Ding, Z., Wei, G., Zhao, H. and Huang, T. 2009. Sources of water pollution and
evolution of water quality in the Wuwei basin of Shiyang river, Northwest China. Journal
of environmental management, 90, 1168-1177.
Madden, E. F. and Fowler, B. A. 2000. Mechanisms of nephrotoxicity from metal combinations:
a review. Drug and chemical toxicology, 23, 1-12.
Maduka, H. C. 2006. Water pollution and man’s health. Internet J Gastroenterol, 4, 1-11.
Martín-González, A., Díaz, S., Borniquel, S., Gallego, A. and Gutiérrez, J. C. 2006. Cytotoxicity
and bioaccumulation of heavy metals by ciliated protozoa isolated from urban wastewater
treatment plants. Research in microbiology, 157, 108-118.
Mater, N., Geret, F., Castillo, L., Faucet-Marquis, V., Albasi, C. and Pfohl-Leszkowicz, A. 2014.
In vitro tests aiding ecological risk assessment of ciprofloxacin, tamoxifen and
cyclophosphamide in range of concentrations released in hospital wastewater and surface
water. Environment international, 63, 191-200.
Mates, J. 2000. Effects of antioxidant enzymes in the molecular control of reactive oxygen
species toxicology. Toxicology, 153, 83-104.
Matés, J. M., Pérez-Gómez, C. and De Castro, I. N. 1999. Antioxidant enzymes and human
diseases. Clinical biochemistry, 32, 595-603.
Matsumoto, S. T., Mantovani, M. S., Malaguttii, M. I. A., Dias, A. L., Fonseca, I. C. and Marin-
Morales, M. A. 2006. Genotoxicity and mutagenicity of water contaminated with tannery
effluents, as evaluated by the micronucleus test and comet assay using the fish
Oreochromis niloticus and chromosome aberrations in onion root-tips. Genetics and
molecular biology, 29, 148-158.
Michałowicz, J. and Duda, W. 2007. Phenols—sources and toxicity. Polish Journal of
Environmental Studies, 16, 347-362.
Monarca, S., Feretti, D., Collivignarelli, C., Guzzella, L., Zerbini, I., Bertanza, G. and
Pedrazzani, R. 2000. The influence of different disinfectants on mutagenicity and toxicity
of urban wastewater. Water Research, 34, 4261-4269.
Moore, J. W. and Ramamoorthy, S. 2012. Heavy metals in natural waters: applied monitoring
and impact assessment, Springer Science & Business Media.
Mortelmans, K. and Zeiger, E. 2000. The Ames Salmonella/microsome mutagenicity assay.
Mutation Research/Fundamental and Molecular Mechanisms of Mutagenesis, 455, 29-60.
Literature Cited
119
Mourón, S. A., Golijow, C. D. and Dulout, F. N. 2001. DNA damage by cadmium and arsenic
salts assessed by the single cell gel electrophoresis assay. Mutation Research/Genetic
Toxicology and Environmental Mutagenesis, 498, 47-55.
Mousa, S. A. 2004. Expression of adhesion molecules during cadmium hepatotoxicity. Life
sciences, 75, 93-105.
Müller, B., Scheytt, T., Asbrand, M. and De Casas, A. M. 2012. Pharmaceuticals as indictors of
sewage-influenced groundwater. Hydrogeology journal, 20, 1117-1129.
Nikolaou, A., Meric, S. and Fatta, D. 2007. Occurrence patterns of pharmaceuticals in water and
wastewater environments. Analytical and bioanalytical chemistry, 387, 1225-1234.
Novick, R., Murphy, E., Gryczan, T., Baron, E. and Edelman, I. 1979. Penicillinase plasmids of
Staphylococcus aureus: restriction-deletion maps. Plasmid, 2, 109-129.
Okoye, Z. 1992. Biochemical aspects of nutrition, Prentice Hall of India.
Olas, B. and Wachowicz, B. 2002. Resveratrol and vitamin C as antioxidants in blood platelets.
Thrombosis research, 106, 143-148.
Onyema, O. O., Farombi, E. O., Emerole, G. O., Ukoha, A. I. and Onyeze, G. O. 2006. Effect of
vitamin E on monosodium glutamate induced hepatotoxicity and oxidative stress in rats.
Indian Journal of biochemistry and biophysics, 43, 20.
Oosterhuis, M., Sacher, F. and Ter Laak, T. L. 2013. Prediction of concentration levels of
metformin and other high consumption pharmaceuticals in wastewater and regional
surface water based on sales data. Science of the Total Environment, 442, 380-388.
Park, S. and Choi, K. 2008. Hazard assessment of commonly used agricultural antibiotics on
aquatic ecosystems. Ecotoxicology, 17, 526-538.
Patlolla, A. K., Barnes, C., Yedjou, C., Velma, V. and Tchounwou, P. B. 2009. Oxidative stress,
DNA damage, and antioxidant enzyme activity induced by hexavalent chromium in
Sprague‐Dawley rats. Environmental toxicology, 24, 66-73.
Patrick, L. 2003. Toxic metals and antioxidants: part II the role of antioxidants in arsenic and
cadmium toxicity.(Toxic Metals Part II). Alternative medicine review, 8, 106-129.
Quinn, B., Gagné, F. and Blaise, C. 2008. An investigation into the acute and chronic toxicity of
eleven pharmaceuticals (and their solvents) found in wastewater effluent on the
cnidarian,< i> Hydra attenuata</i>. Science of the total environment, 389, 306-314.
Radić, S., Stipaničev, D., Vujčić, V., Rajčić, M. M., Širac, S. and Pevalek-Kozlina, B. 2010. The
evaluation of surface and wastewater genotoxicity using the Allium cepa test. Science of
the total environment, 408, 1228-1233.
Raja, S., Ashraf, M., Anjum, A. and Javeed, A. 2016. EVALUATION OF ANTI-BACTERIAL
ACTIVITY, GC/MS ANALYSIS AND GENOTOXIC POTENTIAL OF CARUM
COPTICUM ESSENTIAL OIL FRACTIONS AGAINST MULTI-DRUG RESISTANT
STAPHYLOCOCCUS AUREUS. JAPS, Journal of Animal and Plant Sciences, 26, 643-
652.
Rajaguru, P., Suba, S., Palanivel, M. and Kalaiselvi, K. 2003. Genotoxicity of a polluted river
system measured using the alkaline comet assay on fish and earthworm tissues.
Environmental and molecular mutagenesis, 41, 85-91.
Rajaguru, P., Vidya, L., Baskarasethupathi, B., Kumar, P., Palanivel, M. and Kalaiselvi, K. 2002.
Genotoxicity evaluation of polluted ground water in human peripheral blood lymphocytes
using the comet assay. Mutation Research/Genetic Toxicology and Environmental
Mutagenesis, 517, 29-37.

Literature Cited
120
Ramm, G. A. and Ruddell, R. G. Hepatotoxicity of iron overload: mechanisms of iron-induced
hepatic fibrogenesis. Seminars in liver disease, 2005. 433-449.
Ramteke, P. 1997. Plasmid mediated co-transfer of antibiotic resistance and heavy metal
tolerance in coli forms. Indian Journal of Microbiology, 37, 177-181.
Rank, J., Jensen, K. and Jespersen, P. H. 2005. Monitoring DNA damage in indigenous blue
mussels (Mytilus edulis) sampled from coastal sites in Denmark. Mutation
Research/Genetic Toxicology and Environmental Mutagenesis, 585, 33-42.
Rao, M. V., Parekh, S. S. and Chawla, S. L. 2006. Vitamin-E supplementation ameliorates
chromium-and/or nickel induced oxidative stress in vivo. Journal of health science, 52,
142-147.
Robards, K. and Worsfold, P. 1991. Cadmium: toxicology and analysis. A review. Analyst, 116,
549-568.
Rúa-Gómez, P. C. and Püttmann, W. 2012. Impact of wastewater treatment plant discharge of
lidocaine, tramadol, venlafaxine and their metabolites on the quality of surface waters
and groundwater. Journal of Environmental Monitoring, 14, 1391-1399.
Samanta, A., Bera, P., Khatun, M., Sinha, C., Pal, P., Lalee, A. and Mandal, A. 2012. An
investigation on heavy metal tolerance and antibiotic resistance properties of bacterial
strain Bacillus sp. isolated from municipal waste. J. Microbiol. Biotech. Res, 2, 178-189.
Santos, F., Tubaldini, F., Cólus, I., Andreo, M., Bauab, T. M., Leite, C. Q. F., Vilegas, W. and
Varanda, E. A. 2008. Mutagenicity of Mouriri pusa gardner and Mouriri elliptica
Martius. Food and Chemical Toxicology, 46, 2721-2727.
Santra, A., Das Gupta, J., De, B., Roy, B. and Guha Mazumder, D. 1999. Hepatic manifestations
in chronic arsenic toxicity. Indian Journal of Gastroenterology, 18, 152-155.
Sarmah, A. K., Meyer, M. T. and Boxall, A. B. 2006. A global perspective on the use, sales,
exposure pathways, occurrence, fate and effects of veterinary antibiotics (VAs) in the
environment. Chemosphere, 65, 725-759.
Seiler, R. L., Zaugg, S. D., Thomas, J. M. and Howcroft, D. L. 1999. Caffeine and
pharmaceuticals as indicators of waste water contamination in wells. Groundwater, 37,
405-410.
Sengupta, T., Chattopadhyay, D., Ghosh, N., Das, M. and Chatterjee, G. 1990. Effect of
chromium administration on glutathione cycle of rat intestinal epithelial cells. Indian
journal of experimental biology, 28, 1132-1135.
Shaikh, Z. A., Vu, T. T. and Zaman, K. 1999. Oxidative stress as a mechanism of chronic
cadmium-induced hepatotoxicity and renal toxicity and protection by antioxidants.
Toxicology and applied pharmacology, 154, 256-263.
Shakir, L., Ejaz, S., Ashraf, M., Ahmad, N. and Javeed, A. 2012. Characterization of tannery
effluent wastewater by proton-induced X-ray emission (PIXE) analysis to investigate
their role in water pollution. Environmental Science and Pollution Research, 19, 492-501.
Sharma, P. K., Balkwill, D. L., Frenkel, A. and Vairavamurthy, M. A. 2000. A new Klebsiella
planticola strain (Cd-1) grows anaerobically at high cadmium concentrations and
precipitates cadmium sulfide. Applied and environmental Microbiology, 66, 3083-3087.
Silver, S. 1996. Bacterial resistances to toxic metal ions-a review. Gene, 179, 9-19.
Singarea, P. and Dhabardeb, S. 2014. Toxic metals pollution due to industrial effluents released
along Dombivali Industrial Belt of Mumbai, India. European Journal of Environmental
and Safety Sciences, 2, 5-11.

Literature Cited
121
Singh, M. P., Reddy, M. K., Mathur, N., Saxena, D. and Chowdhuri, D. K. 2009. Induction of
hsp70, hsp60, hsp83 and hsp26 and oxidative stress markers in benzene, toluene and
xylene exposed Drosophila melanogaster: role of ROS generation. Toxicology and
applied pharmacology, 235, 226-243.
Singh, R., Gautam, N., Mishra, A. and Gupta, R. 2011. Heavy metals and living systems: An
overview. Indian Journal of Pharmacology, 43, 246.
Smythies, J. 1999. The neurotoxicity of glutamate, dopamine, iron and reactive oxygen species:
functional interrelationships in health and disease: a review—discussion. Neurotoxicity
research, 1, 27-39.
Sudhakar, R., Gowda, K. N. and Venu, G. 2001. Mitotic Abnormalities Induced by Silk Dyeing
Industry Effluents in the Cells of Allium cepa. Cytologia, 66, 235-239.
Susa, N., Ueno, S., Furukawa, Y. and Sugiyama, M. 1996. Protective effect of vitamin E on
chromium (VI)-induced cytotoxicity and lipid peroxidation in primary cultures of rat
hepatocytes. Archives of toxicology, 71, 20-24.
Tabrez, S. and Ahmad, M. 2009. Effect of wastewater intake on antioxidant and marker enzymes
of tissue damage in rat tissues: implications for the use of biochemical markers. Food and
Chemical Toxicology, 47, 2465-2478.
Tabrez, S. and Ahmad, M. 2011. Mutagenicity of industrial wastewaters collected from two
different stations in northern India. Journal of Applied Toxicology, 31, 783-789.
Tanaka, H., Tsukuma, H. and Oshima, A. 2010. Long-term prospective study of 6104 survivors
of arsenic poisoning during infancy due to contaminated milk powder in 1955. Journal of
Epidemiology, 20, 439-445.
Tchounwou, P. B., Patlolla, A. K. and Centeno, J. A. 2003. Invited reviews: carcinogenic and
systemic health effects associated with arsenic exposure—a critical review. Toxicologic
Pathology, 31, 575-588.
Thacker, U., Parikh, R., Shouche, Y. and Madamwar, D. 2007. Reduction of chromate by cell-
free extract of Brucella sp. isolated from Cr (VI) contaminated sites. Bioresource
technology, 98, 1541-1547.
Tice, R., Agurell, E., Anderson, D., Burlinson, B., Hartmann, A., Kobayashi, H., Miyamae, Y.,
Rojas, E., Ryu, J. and Sasaki, Y. 2000. Single cell gel/comet assay: guidelines for in vitro
and in vivo genetic toxicology testing. Environmental and molecular mutagenesis, 35,
206-221.
Türkez, H., Şđşman, T., Đncekara, Ü., Geyđkoğlu, F., Tatar, A. and Keleş, M. S. 2009. The
genotoxic and biochemical effects of wastewater samples from a fat plant in Erzurum.
FBI BAU Magazine, 11, 55-63.
Ullah, A., Ashraf, M., Javeed, A., Anjum, A. A., Attiq, A. and Ali, S. 2016. Enhancement of
anti-proliferative activities of Metformin, when combined with Celecoxib, without
increasing DNA damage. Environmental Toxicology and Pharmacology.
Valko, M., Morris, H. and Cronin, M. 2005. Metals, toxicity and oxidative stress. Current
medicinal chemistry, 12, 1161-1208.
Vargas, V. M. F., Motta, V. and Henriques, J. a. P. 1993. Mutagenic activity detected by the
Ames test in river water under the influence of petrochemical industries. Mutation
Research/Genetic Toxicology, 319, 31-45.
Velagaleti, R. and Burns, P. 2006. The Industrial ecology of pharmaceutical raw materials and
finished products with emphasis on supply chain management activities.
http://www.epa.gov/esd/chemistry/ppcp/images/ecology.pdf

Literature Cited
122
Verlicchi, P., Al Aukidy, M., Jelic, A., Petrović, M. and Barceló, D. 2014. Comparison of
measured and predicted concentrations of selected pharmaceuticals in wastewater and
surface water: a case study of a catchment area in the Po Valley (Italy). Science of the
Total Environment, 470, 844-854.
Waalkes, M. P. 2003. Cadmium carcinogenesis. Mutation Research/Fundamental and Molecular
Mechanisms of Mutagenesis, 533, 107-120.
Xu, Z., Wang, Z., Li, J.-J., Chen, C., Zhang, P.-C., Dong, L., Chen, J.-H., Chen, Q., Zhang, X.-T.
and Wang, Z.-L. 2013. Protective effects of selenium on oxidative damage and oxidative
stress related gene expression in rat liver under chronic poisoning of arsenic. Food and
Chemical Toxicology, 58, 1-7.
Yu, Y., Wu, L. and Chang, A. C. 2013. Seasonal variation of endocrine disrupting compounds,
pharmaceuticals and personal care products in wastewater treatment plants. Science of
the total environment, 442, 310-316.
Zaidi, S. K. R. and Banu, N. 2004. Antioxidant potential of vitamins A, E and C in modulating
oxidative stress in rat brain. Clinica Chimica Acta, 340, 229-233.
Zaroual, Z., Azzi, M., Saib, N., Karhat, Y. and Zertoubi, M. 2005. Treatment of tannery effluent
by an electrocoagulation process. The Journal of the American Leather Chemists
Association, 100, 16-21.
Žegura, B., Heath, E., Černoša, A. and Filipič, M. 2009. Combination of in vitro bioassays for
the determination of cytotoxic and genotoxic potential of wastewater, surface water and
drinking water samples. Chemosphere, 75, 1453-1460.
Zhang, Y., Luo, Y., Hou, Y.-X., Jiang, H., Chen, Q. and Tang, H.-R. 2008. Chilling acclimation
induced changes in the distribution of H2O2 and antioxidant system of strawberry leaves.
Agric J, 3, 286-291.

Appendices
123
CHAPTER 8
APPENDICES
Annexure-1
Mass spectra of neutral fraction of PEW1 using DB-35ms column

Appendices
124
Annexure-2
Mass spectra of acidic fraction of PEW1 using DB-35ms column
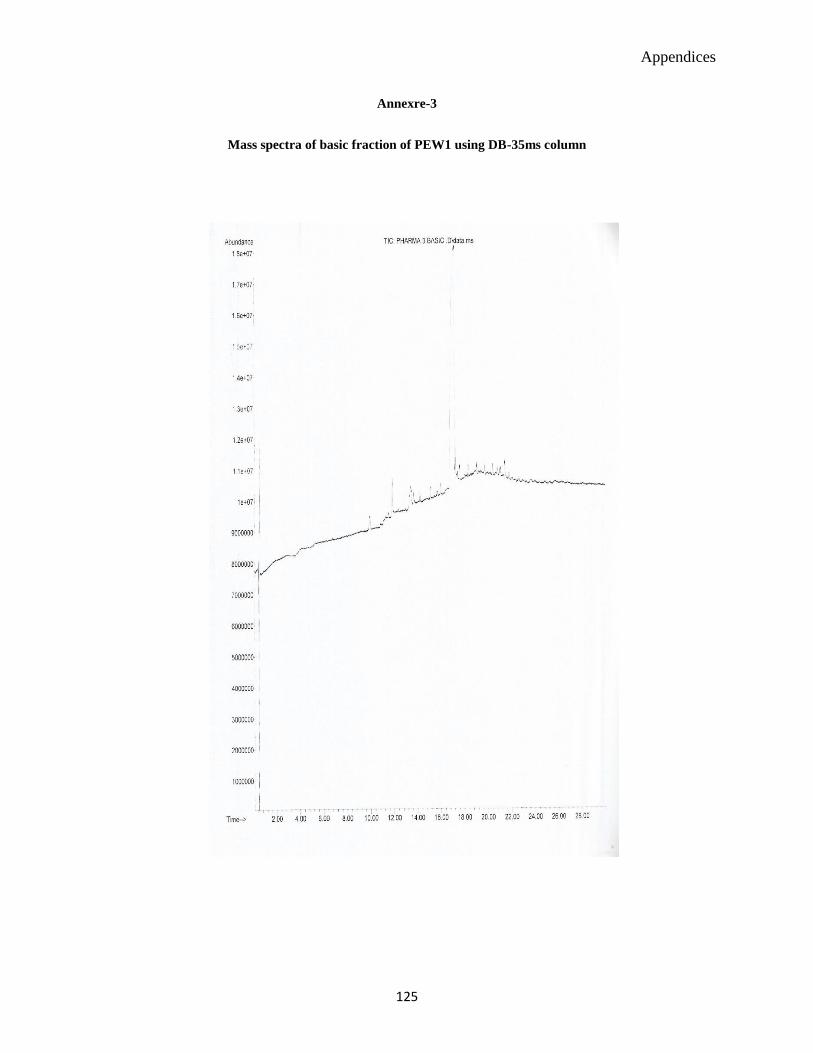
Appendices
125
Annexre-3
Mass spectra of basic fraction of PEW1 using DB-35ms column

Appendices
126
Annexure-4
Mass spectra of basic fraction of PEW6 using DB-5 column

Appendices
127
Annexure-5
Mass spectra of acidic fraction of PEW6 using DB-5 column

Appendices
128
Annexure-6
Mass spectra of neutral fraction of PEW6 DB-5 column

Appendices
129
Annexure-7
Comparison of tail lengths of comets using one way ANOVA at different concentrations of PEW 1 (%v/v)

Appendices
130
Annexure-8
Comparison of tail lengths of comets using one way ANOVA at different concentrations of PEW 6 (%v/v)

Appendices
131
Annexure-9
Mutagenic potential of PEW1 in TA-100 strain with and without S9 using nonlinear fit

Appendices
132
Annexure-10
Mutagenic potential of PEW1 in TA-102 strain with and without S9 using nonlinear fit

Appendices
133
Annexure-11
Mutagenic potential of PEW6 in TA-100 strain with and without S9 using nonlinear fit

Appendices
134
Annexure-12
Mutagenic potential of PEW6 in TA-102 strain with and without S9 using nonlinear fit

Appendices
135
Annexure-13
Cell survival percentage (CSP) against different log concentrations of PEW1 in MTT assay on BHK-21 cell
lines using nonlinear fit

Appendices
136
Annexure-14
Cell survival percentage (CSP) against different log concentrations of PEW6 in MTT assay on BHK-21 cell
lines using nonlinear fit

Appendices
137
Annexure-15
Effect of PEW1 on catalase activity in rat blood caused by chronic exposure at different concentrations using
one way ANOVA

Appendices
138

Appendices
139
Annexure-16
Effect of PEW1 on catalase activity in rat kidney caused by chronic exposure at different concentrations
using one way ANOVA

Appendices
140

Appendices
141
Annexure-17
Effect of PEW1 on catalase activity in rat liver caused by chronic exposure at different concentrations using
one way ANOVA

Appendices
142

Appendices
143
Annexure-18
Effect of PEW1 on hydrogen peroxide activity in rat kidney caused by chronic exposure at different
concentrations using one way ANOVA
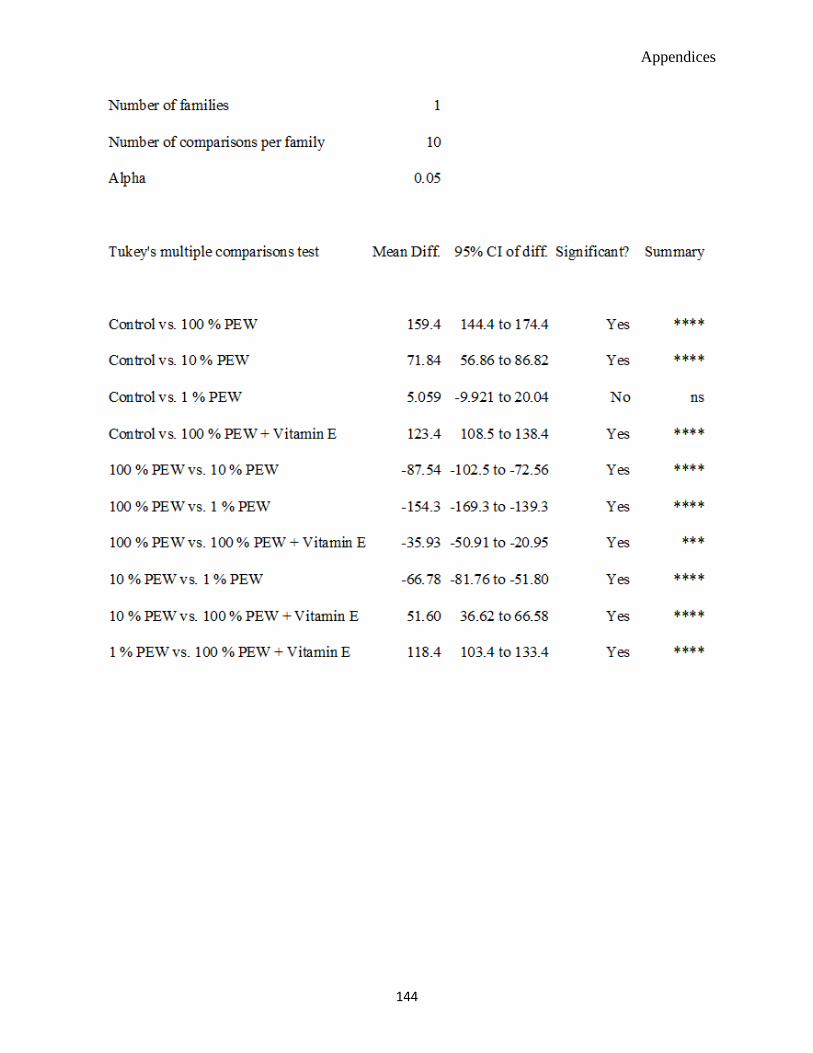
Appendices
144

Appendices
145
Annexure-19
Effect of PEW1 on hydrogen peroxide activity in rat liver caused by chronic exposure at different
concentrations using one way ANOVA

Appendices
146

Appendices
147
Annexure-20
Effect of PEW1 on hydrogen peroxide activity in rat plasma caused by chronic exposure at different
concentrations using one way ANOVA

Appendices
148

Appendices
149
Annexure-21
Effect of PEW1 on superoxide dismutase activity in rat kidney caused by chronic exposure at different
concentrations using one way ANOVA

Appendices
150

Appendices
151
Annexure-22
Effect of PEW1 on superoxide dismutase activity in rat liver caused by chronic exposure at different
concentrations using one way ANOVA

Appendices
152

Appendices
153
Annexure-23
Effect of PEW1 on superoxide dismutase activity in rat plasma caused by chronic exposure at different
concentrations using one way ANOVA

Appendices
154