chemical engineering science - ucl...
TRANSCRIPT

A model based approach for identifying robust operating conditionsfor industrial chromatography with process variability
Edward J. Close a,b, Jeffrey R. Salm c, Daniel G. Bracewell b, Eva Sorensen a,n
a Centre for Process Systems Engineering, Department of Chemical Engineering, University College London, Torrington Place, London WC1E 7JE, UKb The Advanced Centre for Biochemical Engineering, Department of Biochemical Engineering, University College London, Torrington Place,London WC1E 7JE, UKc Pfizer Biopharmaceuticals, 1 Burtt Road, Andover, Massachusetts 01810, USA
H I G H L I G H T S
� We consider a complex industrial bioseparation that experiences process variability.� A mechanistic modeling approach is used to determine how to assure product quality.� Probabilistic design spaces are generated from stochastic simulations.� The impact of process parameter mean and variance on quality assurance is determined.� Significant increases in robustness can be gained from adapting operating conditions.
a r t i c l e i n f o
Article history:Received 11 November 2013Received in revised form10 February 2014Accepted 15 March 2014Available online 1 April 2014
Keywords:Process systems modelingStochastic simulationQuality by DesignChromatographyHydrophobic interaction
a b s t r a c t
A model based approach has been developed and used to identify robust operating conditions for anindustrial hydrophobic interaction chromatography where resin lot variability, combined with feedstream variability, was resulting in serious performance issues during the purification of a multicomponent therapeutic protein from crude feed material. An equilibrium dispersive model wasformulated which successfully predicted the key product critical quality attribute during validationstudies. The model was then used to identify operating parameter ranges that assured product qualitydespite the process variability. Probabilistic design spaces were generated using stochastic simulationsthat showed the probability that each resin lot would meet product quality specifications, over a range ofpossible operating conditions, accounting for the historical variability experienced in the load materialcomposition and concentration. No operating condition was found with normal process variabilitywhere quality assurance remained 40.95 for resins that gave the highest and lowest product recoveriesduring process development. The lowest risk of batch failure found was 16%, and operating conditionswere not robust. We then extended the stochastic methodology used to generate probabilistic designspaces, to identify the level of control required on the load material composition and concentration tobring process robustness to an acceptable level, which is not possible using DOE experimental methodsdue to the impractical amount of resources that would be required. Although reducing inlet variabilityresulted in an increase in the assurance of product quality, the results indicated that changing operatingconditions according to which resin lot is in use is the favorable option.& 2014 The Authors. Published by Elsevier Ltd. This is an open access article under the CC BY license
(http://creativecommons.org/licenses/by/3.0/).
1. Introduction
There is an increasing desire within the pharmaceutical indus-try to develop and operate processes following a Quality by Design(QbD) approach, where quality is built into the product and theprocess based on a high level of product knowledge and process
understanding. In this approach, critical quality attributes (CQA) ofpharmaceutical products are defined that assure desired clinicalperformance, and then a manufacturing process is designed toconsistently meet these product attributes, thus assuring productquality (ICH, 2008a). Process characterization is conducted toidentify the impact of process parameters on the products CQA's(Jiang et al., 2010), which is then used to define a process designspace. A design space is defined by the International Conferenceon Harmonisation (ICH) guidance document as “the multidimen-sional combination and interaction of input variables and process
Contents lists available at ScienceDirect
journal homepage: www.elsevier.com/locate/ces
Chemical Engineering Science
http://dx.doi.org/10.1016/j.ces.2014.03.0100009-2509/& 2014 The Authors. Published by Elsevier Ltd. This is an open access article under the CC BY license (http://creativecommons.org/licenses/by/3.0/).
n Corresponding author.E-mail address: [email protected] (E. Sorensen).
Chemical Engineering Science 116 (2014) 284–295

parameters that have been demonstrated to provide an assurance ofproduct quality” (ICH, 2008a). Acceptable ranges for process para-meters and input variables are documented in the regulatoryfiling, and working within these ranges is not deemed to be achange from normal operating conditions. The expected benefit ofthe QbD approach is an increase in the assurance of productquality, and in turn, the FDA will allow manufacturers greaterflexibility to operate with lower regulatory burden, enablingcontinuous process improvement, as well as greater robustness(ICH, 2005, 2008a, 2008b).
The current approach to process characterization to identify thedesign space, involves first performing a qualitative risk analysis toidentify parameters for process characterization, e.g. failure modeeffects analysis or fault tree analysis (ICH, 2005, Harms et al., 2008).Based on the outcome of this assessment, design of experiment(DOE) studies are conducted to generate data amenable for use inunderstanding and defining the acceptable parameter and inputvariable ranges that make up the design space (Rathore andWinkle, 2009). An important aspect of this characterization effort isconcerned with validating that the defined design space can copewith the process variability experienced during normal operation(Rathore, 2009). This variability is a key driver in the currentapproach to the design and development of industrial biopharma-ceutical separations, which promotes a focus on identifying the mostrobust operating conditions, rather than optimizing for particularscenarios. Process robustness is typically validated via an extensiveexperimental effort directed by factorial design of experiments to testthat the product quality remains within the defined product attri-butes during normal operation, and this is approach is clearly sub-optimal, time consuming and costly.
We consider an industrial chromatographic separation whereresin lot variability, combined with a variable feed stream, hadresulted in serious performance issues during the purification of atherapeutic protein from crude feed material. The resin lotvariability occurred on a hydrophobic interaction chromatography(HIC) that provides impurity clearance whilst producing a complexproduct composed of six closely related variants of a dimer proteintherapeutic (�30 kDa), with their monomer subunits in a specificratio. Impurity removal is well understood; however, achieving thecorrect monomer subunit ratio poses a significant purificationchallenge. The desired ratio of monomer subunits must be met bythis unit operation, and is a defined CQA of the final product. Anextended range of resin lots were obtained from the supplier fortesting within normal process operating ranges during processdevelopment conducted prior to this study. All resin lots werewithin the manufacturers specifications for ligand density andchloride capacity. Despite this, many failed to meet product qualityspecifications during testing and would have incurred significantlosses if used for the large scale manufacture of the product. Nolink between resin lot specifications and successfully meetingprocess objectives was found.
Mechanistic models are ideally suited to assist in the developmentof robust purification processes, as they can efficiently investigatedesign alternatives with minimal experimentation, whilst derivingfundamental knowledge and process understanding in line with FDArecommendations. They have been successfully applied to manychromatographic separations (Melter et al., 2008; McCue et al.,2008; Nagrath et al., 2011), with useful examples on optimization(Degerman et al., 2007; Ng et al., 2012), scale up (Mollerup et al.,2007; Gerontas et al., 2010), and process development (Osberghauset al., 2012), although the practical challenges of industrial separa-tions mean their application to true industrial systems with crudefeed mixtures is not yet routine, and can involve a lengthy experi-mental effort to calibrate parameters and validate predictions (e.g.Gétaz et al., 2013a,2013b; Nfor et al., 2013). Model based approachesto sensitivity and robustness analysis are of particular relevance to
industrial separations as they can ensure purification processes arerobust, which is a key requirement for bioseparations (Jakobssonet al., 2005; Degerman et al., 2009; Westerberg et al., 2012; Borg etal., 2013). These approaches enable the impact of disturbances inprocess parameters on meeting CQA's to be quantified quickly andefficiently, thereby indicating the risk of batch failure, with minimaltime, material and analytical constraints. The additional knowledgeand process understanding gained by their use may offset the extrainvestment of time and material for model development and valida-tion, and fulfils regulatory guidance regarding the implementation ofQuality by Design and the proposed greater use of mechanisticmodels (ICH, 2008a).
In this paper, a model based approach is developed and used toidentify robust operating conditions for the HIC that ensure thedesired product quality is met, despite the resin lot and inherentbioprocess variability. The HIC had predefined mobile phaseconditions, flow rate and column dimensions that were fixed priorto this work, leaving the mass challenge and wash length as theonly manipulated variables available for adjustment. An equili-brium dispersive model with competitive Langmuir adsorption isdeveloped for the two most extreme resin lots which gave thehighest (designated high binding resin) and lowest (designatedlow binding resin) protein recoveries at normal operating condi-tions. Micro well batch adsorption and scale down columnexperiments are used for model calibration, and the model isvalidated against multiple scale down column experiments overan extended range of inlet variables and process parameters.
The validated mechanistic model is then combined with stochasticsimulation to generate probabilistic process design spaces for eachresin lot. The results show the probability of meeting product qualityspecifications (i.e. product CQA's), over a range of possible operatingconditions, whilst accounting for process uncertainty based on thehistorical variability experienced in the load material composition andconcentration. The data is used to determine operating conditions thatare eligible for all resin lots, by assuming that the operating conditionsthat assure product quality for the extreme high and low resin lots aresuitable for all other resin lots. We then demonstrated how thestochastic methodology was used to generate probabilistic designspaces can be extended, when current uncertainty results in anunsatisfactory design space, in order to identify the level of controlrequired on uncertain variables to bring process robustness to anacceptable level. The control required on the load material composi-tion and concentration is determined. The presented approach can beused with any validated mechanistic model with parameters that arevariable or uncertain, and enables the rapid exploration of the tradeoffbetween control of process parameters and the robustness of thedesign space, which is not possible using DOE experimental methodsdue to the impractical amount of resources that would be required.
FDA guidance encourages the application of mechanistic modelsto improve process understanding, based on fundamental knowledgeof the underlying causes linking process parameters to productCQA's. The methodology demonstrates how useful mechanisticmodels can be for this task, for as well as determining the functionalrelationship between process parameter values and the resultingvalue of the CQA, the use of models can quickly and efficientlydetermine the relationship between process parameter and CQAvariances, a key aspect of providing assurance of product quality.
2. Experimental materials and methods
2.1. Materials
2.1.1. Therapeutic protein and feed materialThe product of interest is a disulfide linked dimer protein molecule
(MW¼30 kDa), comprised of twomonomer subunits. Three variations
E.J. Close et al. / Chemical Engineering Science 116 (2014) 284–295 285

of the monomer subunit exist due to slight variations in the aminoacid sequence, here denoted A, A and B. This results in six possibleisoforms of the dimer (AA; AA; AA; AB; AB and BBÞ as illustrated inFig. 1. The corresponding analytical chromatogram is shown in Fig. 2A.Each form is an active component of the final product which mustcontain a specific ratio of the monomer subunits, ðAþAÞ : B, i.e. notjust one product form at a given total amount is required, but sixclosely related dimer variants, with a given ratio of their monomersubunits. Specifically, subunit B must account for between 25 and 45%of all monomer subunits in the product, i.e. 0.25oBo0.45. In additionto the product, the HIC feed material contains several product relatedimpurities accounting for up to 25% by mass of the feed material,including the individual monomer subunits (A, A and B), incorrectlyformed product species (MW¼42, 60, 80 and 100 kDa), and host cellrelated contaminants consisting of mainly host cell protein (HCP) andDNA. The corresponding analytical chromatogram is shown in Fig. 2B.
2.1.2. Chromatography resinMultiple (420) Butyl Sepharose 4B fast flow hydrophobic
interaction resin lots were obtained from GE Healthcare (Uppsala,Sweden). The two most extreme resin lots were selected for thiswork based on protein recovery in process development experi-ments (not shown), and are designated high and low bindingresin, e.g. the high binding resin gave high protein recoveries andthe low binding resin gave low protein recoveries. Both resinswere with the manufacturers' specifications.
2.1.3. EquipmentAll preparative scale laboratory experiments were carried out
using an ÄKTA FPLC chromatography system from GE Healthcare(Uppsala, Sweden). Laboratory columns were 1.1–3.2 cm in dia-meter and 7.4 cm in bed height. A GE Healthcare Mono S column(5.0 mm�50 mm) high performance liquid chromatography(HPLC) column was used for analytics.
2.2. Experimental methods
2.2.1. Hydrophobic interaction chromatographyDuring all runs, the columns were first equilibrated with
50 mM Tris, 1.0 M NaC1, 0.50 M Arg-HC1, pH 7 equilibration buffer.The elution peak from a preceding pseudo affinity capture chro-matography was brought to the correct NaCl concentration andapplied to the column at 4.2 CV/h, followed by a wash step usingthe equilibration buffer. Elution buffer consisting of 20% PropyleneGlycol, 50 mM Tris, 0.50 M Arg-HCl, pH 7 was then applied and theproduct peak collected. The pooling policy was fixed for all runs.Any remaining bound protein was removed in a strip step using0.1 M Sodium Acetate, pH 4 sanitization buffer, and the columnwas stored in storage buffer when not in use. The efficacy of theelution stage is well understood, and was experimentally validatedduring process development. Negligible amounts of proteinremain in the column after the elution stage and all mass balanceswere satisfactory during experimental runs. All experiments wereconducted between 4 and 8 1C.
2.2.2. Cation exchange HPLC assayA cation Exchange (CEX) HPLC assay was used to determine the
relative percentages of the six dimer isoforms of the product insamples, and utilized a Mono S column and a gradient of sodiumacetate, acetonitrile and sodium chloride at pH 5. The relativepercentage area of the six peaks in the chromatogram indicatedthe percentage of each isoform in the sample (Fig. 2. Top).
2.2.3. Phenyl reverse phase HPLC assayA Phenyl Reversed Phase (RP) HPLC assay was used to determine
the relative amount of product and product related impurities insamples, and utilized a TSK-Phenyl reversed phase column and awater/acetonitrile/trifluoroacetic acid gradient system (Fig. 2.Bottom).
2.2.4. Batch adsorption experimentsBatch adsorption experiments were required to generate data
for calibrating the equilibrium adsorption isotherm parameters.Purified protein solutions for batch adsorption experiments weregenerated from bulk feed material by purifying and isolatingproduct forms from impurities over multiple runs of the HIC.Batch binding studies based on the work of Coffman et al. (2008)were conducted in a 96-well filter plate and were repeated intriplicate. The filter plates used throughout the experiments were
Fig. 1. The product is a disulfide linked dimer protein therapeutic (MWE30 kDa),comprised of two monomer subunits. Three variations of the monomer subunitexist due to slight variations in the amino acid sequence, here denoted A, A and B.This results in six possible forms of the dimer, all of which are active components ofthe final product and thus must be present in the elution peak in a specificdistribution.
Fig. 2. Analytical chromatogram of Top. the product and Bottom. the feed material.(Axis values deliberately removed for confidentiality purposes).
E.J. Close et al. / Chemical Engineering Science 116 (2014) 284–295286
round-well 800 μl plates with 0.45 mm pore-size polypropylenemembrane. 25 μl of resin was taken from a bulk reservoir anddispensed by the robotic liquid handler into the individual wells as25% (v/v) slurry in the appropriate equilibration buffer. The platewas then centrifuged to evacuate excess liquid and leave dampresin. Subsequently, other solutions composed of pure product,having various total protein concentrations (0.5–1 mg/ml) andisoform distributions (each component was varied between 20and 60%) were added into wells containing the resin. The initialconcentration and component distribution for each filter platewell were fashioned by mixing together protein from bulk solu-tions of known component distributions and concentrations, withthe appropriate amount of equilibration buffer from a bulk solu-tion in order that the total volume of liquid dispensed into eachwell was 275 mL (Vtot). The resin and solutions were then agitatedon a platform shaker for 120 min. Separate batch uptake studiesindicated that equilibrium was reached in less than 30 min (notshown), and therefore that this incubation time was suitable. Foiladhesive tape was used on the underside of the filter-plate toprevent liquid loss during shaking. After incubation, a centrifugeevacuated the supernatant into a UV-transparent 96 well microplate which was stacked beneath the filter plate for analysis. Thesupernatant was then analyzed by a 96-well UV spectrophot-ometer (SpectraMax 250, Molecular Devices, Sunnyvale, CA) todetermine the concentration of protein in the supernatant, Cm
i .CEX HPLC was used to determine the percentage of each compo-nent in the supernatant, Pm
i . The concentration of the protein inthe mobile phase is calculated
Cmi ¼ CequilP
mi
100ð1Þ
where Cmi is the concentration of component i in the mobile phase
(mg/ml), Cequil is the measured concentration in the supernatant ofthe micro well, determined by UV spectroscopy, and Pm
i is thepercentage of component i in the mobile phase as determined byCEX HPLC. An elution cycle was then conducted following thesame methodology as the load cycle, where 275 mL of elutionbuffer was added to each well, the plate agitated on a platformshaker for 120 min and the supernatant subsequently collected asdescribed previously and analyzed using the spectrophotometerand CEX HPLC. The total amount of protein added to each microwell was then determined by Eq. (2)
Mt ¼Celution
Velutionþ Cequil
Vequilð2Þ
whereMt is the total amount of protein added to the microwell (mg),Celution is the concentration of the elution supernatant (mg/ml),Velution is the volume of the elution supernatant (ml), Cequil is theconcentration of the equil supernatant (mg/ml), and Vequil is thevolume of the equil supernatant (ml). The amount of proteinadsorbed per unit volume settled resin, qi (mg/ml), is calculatedusing Eq. 3:
qi ¼MtP
loadi
100 �Cmi Vequil
� �Vresin
ð3Þ
where Ploadi is the percentage of component i in the load material and
Vresin is the settled volume of resin in the microwell (25 μl).
2.2.5. Pulse injection experimentsPulse injection experiments were required to determine the
total column porosity, ϵT . Pulses of NaCl were injected onto thecolumn system and the retention time measured, accounting fordead time in the system. All experiments were performed intriplicate. The total column porosity, ϵT , was calculated by the
following equation:
ϵT ¼t0FVC
ð4Þ
where t0 is the retention time of the unretained molecule (s), F is themobile phase flowrate (ml/s), and VC is the column volume (ml).
3. Mathematical methods
3.1. Process assumptions
The similar amino acid sequence of two of the monomersubunits (A and A) results in similar separation properties of theproduct isoforms AA;AA; AA and of the product isoforms AB; AB .In order to simplify the modeling problem, the six productisotherms were reduced in the model to three components:AA; AB; and BB. We assumed that all product isoforms that remainbound to the column after the load and wash steps are subse-quently collected in the elution step, thus only the load and washstages of the separation are simulated, and that the productrelated impurities and HCP's in the feed stream had a negligibleimpact on the separation of the product of interest, as theimpurities are observed to flow through during the load phase ofthe chromatographic cycle. Both of these assumptions wereconfirmed experimentally (Close et al., 2014).
3.2. Equilibrium dispersive model
An equilibrium dispersive model was chosen to simulate theHIC (Guiochon et al., 1994; Kaczmarski et al., 2001) as it is faster tosolve than the general rate model, which was important forreducing total stochastic simulation time, and because fewermodel parameters need to be determined, whilst still predictingthe product CQA sufficiently well (as will be shown in Section 4).The model assumes that the mass transfer kinetics between themobile phase moving through the column bed and the particles isinfinitely fast. Thus the concentration of component i in themobile phase is equal to the average concentration of componenti in the intra-particular mobile phase, and the axial dispersioncoefficient is replaced with an apparent axial dispersion coeffi-cient, DA (cm2/s), which includes the contribution from themass transfer kinetics. The assumption was reasonable for thissystem due to the low flow rates (4.2 CV/h). The model has thefollowing additional assumptions: (i) The column is unidimen-sional (radially homogeneous), (ii) the chromatographic separa-tion is isothermal and adiabatic, (iii) the compressibility of themobile phase is negligible and thus the velocity profile is flat, and(iv) the mass transfer parameters are independent of componentconcentration.
Assuming that the column is radially homogeneous, the differ-ential mass balance in the bulk mobile phase is described by(Guiochon et al., 1994)
∂Cmi
∂tþð1�ϵT Þ
ϵT
∂Cspi
∂tþu
∂Cmi
∂z¼DA
∂2Cmi
∂z28 i¼ 1; 2; …; NC zAð0; LÞ
ð5Þwhere Cm
i is the concentration of component i in the mobile phase(mg/ml), t is the time (s), ϵT is the total column porosity, Csp
i is theconcentration of component i in the stationary phase (mg/ml), u isthe interstitial velocity (cm/s), z is the axial coordinate, DA is theapparent axial dispersion coefficient (cm2/s), NC is the number ofcomponents in the system, and L is the column length (cm).∂Cm
i =∂t is the rate per unit volume of accumulation of component iin the mobile phase, ðð1�ϵT Þ=ϵT Þð∂Csp
i =∂tÞ is the rate per unitvolume of accumulation of component i in the stationary phase,
E.J. Close et al. / Chemical Engineering Science 116 (2014) 284–295 287

uð∂Cmi =∂zÞ is the rate per unit volume of mass transfer by convec-
tion down the column, and DAð∂2Cmi =∂z2Þ is the rate per unit
volume of mass transfer by dispersion and particle mass transferkinetics lumped into one term.
The boundary conditions for Eq. (5) are the following:At the inlet of the column, z¼0, the mobile phase concentra-
tion, Cmi , depends on convection and dispersion:
uCmi –DA
∂Cmi
∂z
� �����z ¼ 0
¼ uCmi;0 i¼ 1; 2; …; NC ð6Þ
where Cmi;0 is the inlet concentration.
At the outlet of the column, z¼L, only convective transport isconsidered:
∂Cmi
∂z
����z ¼ L
¼ 0 8 i¼ 1; 2; …; NC ð7Þ
An initial condition is also required to solve Eq. (5), and this statesthat the rate per unit volume of accumulation in the mobile phaseof component i within the column at t¼0 is zero:
∂Cmi
∂t¼ 0 0ozoL 8 i¼ 1; 2; …; NC ð8Þ
Protein adsorption onto the stationary phase was modeled using acompetitive Langmuir adsorption isotherm (Seidel-Morgenstern,2004).
qi ¼qska;iC
mi
1þ∑ka;iCmi
8 i¼ 1; 2; …; NC zAð0; LÞ ð9Þ
where qs is the resin saturation capacity, and ka;i is the equilibriumconstant of component i, and qi represents the amount of proteinadsorbed per unit volume of settled resin. When the adsorptionisotherm (Eq. 9) is linked with the differential mass balance in thebulk mobile phase (Eq. 5), the amount of protein adsorbed per unitvolume of settled resin, qi, is converted to the amount of proteinadsorbed per unit volume of stationary phase in the packed bed,Cspi :
Cspi ¼ CFqi
ð1�ϵT Þ8 i¼ 1; 2; …; NC zAð0; LÞ ð10Þ
Where, dividing qi by ð1�ϵT Þ accounts for the phase ratio(Mollerup, 2008), and multiplying qi by a compression factor, CF ,defined as the ratio between settled bed volume and packed bedvolume, accounts for bed compression (Gerontas et al., 2010).The necessary compression had been determined experimentallyduring process development in order to prevent the formation ofcolumn headspace under flow conditions. All model equations areimplemented and solved using the dynamic simulation toolgPROMS™ (Process Systems Enterprise, 2013). Discretization ofthe column in the axial coordinate is done using the built-inorthogonal collocation on finite element method (OCFEM).
3.3. Parameter estimation
The ‘parameter estimation’ entity in gPROMS™ is based on theSRQPD sequential quadratic programming code and was used to fitadsorption isotherm parameters in Eq. (9) (qs; ka;i) and theapparent axial dispersion coefficient in Eq. (5) (DA). Parameterestimation was based on the maximum likelihood formulation,which determines values for the uncertain physical and variancemodel parameters that maximize the probability that themodel will predict measured values from development experi-ments (Process Systems Enterprise, 2013). First the adsorptionisotherm parameters are estimated by fitting the competitiveLangmuir isotherm model to the three component competitiveadsorption data from the micro well batch adsorption experiments(Section 2.2.4). For estimation of the apparent axial dispersion
coefficient, the full equilibrium dispersive model with competitiveLangmuir adsorption is fitted to experimental product form dis-tributions in samples taken every CV during the wash of a scaledown column run (Section 2.2.1.).
3.4. Stochastic simulations
The sequence of calculations is illustrated in an example shown inFig. 3, which is discussed in detail in the results and discussion sectionof this work. For variables of interest, instead of assigning a literalvalue, a stochastic value is assigned where the batch to batchvariability is accounted for by specifying the average and standarddeviation. When simulating the chromatography using the model, abuilt in function within gPROMS is used that returns a random valuesampled from a normal distribution generated using the specifiedaverage and standard deviation. Each time a simulation is run, adifferent value is picked for the variable of interest. Multiple simula-tions (45000) were conducted at each unique operating point inorder to determine how variability in the variable of interest affectsthe ability of the process to meet critical quality attributes (CQA) of theoutlet stream, as defined by the process objectives. The CQA con-sidered was the ratio of the monomer subunits, ðAþAÞ : B in theelution pool. In each individual simulation, the variable of interest israndomly assigned at the start of the simulation and the resulting CQAis recorded at the end and used to generate a probability densityfunction (PDF). By normalizing the PDF by the total number ofsimulations, the area under the PDF curve is equal to one, therefore,the area under the curve where the process objective is met is theprobability that the objective will be met at that operating point. Theprobability of meeting the process objective is calculated for allpotential operating points and combined into one graph to generatea probabilistic design space which shows the probability of meetingthe process objective at each operating point, considering processvariability.
In this work, we considered the variability in the load materialconcentration and composition, and neglected the impact of errors inmodel predictions, as well as uncertainty in controlled variables suchas ionic strength, bed height etc. Our rational for this is discussed later.The exact parameter varied in the mechanistic model was the inletconcentrations of the load material, Cm
i;0. Historical averages andstandard deviations from manufacturing data were used to generateprobabilistic design spaces for current process variability (Table 1). Inorder to identify the level of control required on uncertain variables tobring process robustness to an acceptable level when current uncer-tainty results in an unsatisfactory design space, standard deviations inmodel simulations were manually assigned assuming that bettercontrol would result in less variability, and therefore a reducedstandard deviation. Manually changing the load concentration averageis also possible, and may be of interest as feed dilution is trivial, butthis was not considered in this work.
Simulation time for each operating point was approximately20 minutes using a 3.4 GHz AMD Phenom II X4 965 processor with8 GB DDR3 RAM. A multi scale model was formulated withingPROMS and linked with Excel enabling all simulations (i.e.calculations at all operating points) to be conducted overnight,with data automatically exported to Microsoft Excel and trans-formed into probabilistic design spaces.
4. Results and discussion
4.1. Model calibration
Targeted micro well batch adsorption experimentation(Section 2.2.4.) was utilized to generate data for estimating the
E.J. Close et al. / Chemical Engineering Science 116 (2014) 284–295288

adsorption isotherm parameters, qs, ka;i. Fig. 4 shows the multi-component competitive adsorption data from the micro wellexperiments for the high and low binding resin lots, at fourdifferent load material product distributions shown on thegraphs in the ratio AA%:AB%:BB%. The product form distributionin the load material was varied to ensure that the competition
between the closely related product forms was captured inthe isotherm model. Note that although the graphs show thebound concentration, qi, of the product form as a function of itsmobile phase concentration, Ci, the mobile phase concentrationof the other two product forms are also affecting the boundconcentration.
Fig. 3. Example of the stochastic modeling technique used in this work. (A) Normal distribution of inlet concentration of example product form from historical operatingdata. (B) Example of randomly selected inlet concentrations of product form AA during the first 1000 stochastic simulations. (C) Percentage B in elution peak over the first1000 simulations. (Mass challenge 2 mg/ml, 5 CV wash length). (D) Probability density function of product CQA (%B) with area highlighted where product quality is met.
Table 1Historical average and standard deviations of product form inlet concentrations.
Variable name Variable notation Average (mg/ml) Standard deviation
AA inlet concentration Cm1;0 0.108 0.024
AB inlet concentration Cm2;0 0.127 0.023
BB inlet concentration Cm3;0 0.104 0.023
E.J. Close et al. / Chemical Engineering Science 116 (2014) 284–295 289

The estimated isotherm parameter values are shown in Table 2.The standard deviations of the estimated parameters are approxi-mately ten percent, indicating there is still some uncertainty in theparameter values. The coefficient of determination, r2, for themodel fit to experimental data was 0.93 for the high resin and 0.96for the low resin. This was found to be sufficient for satisfactoryagreement between model predictions and experimental datagiven the inherent uncertainties of the batch adsorption experi-ments (Seidel-Morgenstern, 2004). Interestingly, the estimatedsaturation capacity of the Langmuir isotherm, qs, were similarfor both resins; however, the equilibrium constants differed for allthree components. This indicated that the source of the resin lotvariability was associated with protein adsorption-desorptionkinetics and not the maximum saturation capacity. A detailedinvestigation into the exact mechanism behind this variability wasbeyond the scope of this work, but would be of great interest.
Both resin lots showed significant competition between productforms, with component BB particularly vulnerable to displacement bythe more strongly binding AA and AB forms. In graph 4C, the BBstationary phase concentrations are significantly higher compared toGraph 4B. This is due to the favorable product distribution in the loadmaterial resulting in fewer competing components, allowing more BBto bind (graph 4C load material 20% AA:25% AB:55% BB, graph 4B loadmaterial 28% AA:59% AB:13% BB). It was found that the low bindingresin had lower binding capacities than the high binding resin.This was especially clear for the BB component as shown in Fig. 4Cwhere the low binding resin BB stationary phase concentration isapproximately half that of the high binding resin.
Pulse injections onto scale down columns (Section 2.2.5) using anunretained molecule (NaCl) found that both resin lots had the sametotal column porosity, (ϵT ¼ 0.970.02), which was in agreement withthe previous literature estimations for this resin (McCue et al., 2007).
The apparent axial dispersion coefficient, DA, was estimated byfitting the full equilibrium dispersive model to experimentalproduct form distributions in samples taken every CV during thewash of a scale down column run. We found that the estimatedapparent axial dispersion coefficients, DA, for high and low bindingresin lots were very similar (high resin¼0.029 cm2/s and low
resin¼0.03 cm2/s), indicating that mass transfer was not respon-sible for differences between the resin lots.
4.2. Model validation
Multiple scale down column runs were conducted for each resinlot in order to provide a rigorous test of model predictive capacity,where the product form distribution was measured across the washphase and in the elution peak. An extensive experimental validationof model predictive capability across the complete design space tobe explored was unfeasible due to industrial time and materialconstraints. However, the isoform distribution in the load material,total load concentration and load challenge were carefully selected(Table 3) to provide wide ranging coverage of the envisaged designspace, and model predictions were also compared with existingelution peak product data from scale down experiments which hadbeen conducted previously by Pfizer purification process develop-ment, at load concentrations, load challenges and wash lengthsconsiderably different from those conducted by the authors of thiswork. The flowrate, F , wash length, t, bed compression, and bedheight, L, were kept constant throughout all runs (compressionfactor for both resins¼1.25), and a range of column volumes wereused (7, 15 and 60 ml). For both resins, the model was able to
Fig. 4. Multi-component competitive adsorption isotherms for the high and low binding resin lots, at a range of load material product distributions as shown on the graphs in theorder AA%: AB%: BB%. (All experimental points were repeated in triplicate and standard error is shown on the graphs). (A) 53:26:21, (B) 28:39:13, (C) 25:20:55 and (D) 31:37:32.
Table 2Model parameter values obtained for low and high binding resins based on batchadsorption and scale down column experiments, fitted using parameter estimationin gPROMS.
Parameter name Parameternotation
Low High
AA equilibrium constant ka;1 4.33 6.33AB equilibrium constant ka;2 1.49 2.30BB equilibrium constant ka;3 0.52 1.01Saturation capacity (mg/ml) qs 6.45 6.39Total column porosity ϵT 0.9 0.89Apparent axial dispersion coefficient(cm2/s)
DA 0.0029 0.003
E.J. Close et al. / Chemical Engineering Science 116 (2014) 284–295290

successfully predict the product form distribution across the washand in elution peaks in all scale down model validation columnruns, both from this work, and those conducted separately byPfizer. Fig. 5 shows examples where model predictions are com-pared with experiments. Model elution peak composition wasconsistently within 75% of experimentally measured values(values reported in Table 4), which was similar to the accuracyseen in design of experiment driven statistical response surfacemodels of this process at Pfizer. This is significant, as it demon-strates that despite the complex feed stream and wide range ofconditions tested, a relatively simplistic equilibrium dispersivemodel can provide similar accuracy predictions to a DOE typeapproach to design space generation, often used in industry.
4.3. Stochastic simulations
The mechanistic models developed for the high and low resinlots can determine the operating conditions where product qualityspecifications will be met for a known inlet concentration andcomposition. However, in practice, for industrial chromatographicseparations the feed material is often uncharacterised prior tocolumn loading, and will vary from batch to batch depending onupstream operations. In this work, a model based approachcombining the validated mechanistic model with stochastic simu-lation is used to account for the inherent variability of inletconcentration and composition when determining the ability ofa resin lot to meet the process objectives (or conversely the risk ofbatch failure).
The methodology is illustrated in an example which shows thedata generated at one potential mass challenge – wash lengthcombination. The component inlet concentration distributionswere generated from historical data, and are shown in Fig. 3A.Averages and standard deviations are shown in Table 1. For
illustrative purposes the first 1000 randomly generated inletconcentrations of product form AA is shown in Fig. 3B, and thecorresponding value of the product CQA (i.e. subunit B mustaccount for between 25 and 45% of all monomer subunits in theproduct, i.e. 0.25oBo0.45) is shown in Fig. 3C. It is a straightfor-ward procedure to generate useful statistical information with thisdata regarding CQA variance at each operating point, such asmoments and quartiles, as shown in Fig. 6 for the low bindingresin. The statistical data can be conveniently displayed using abox and whisker plot. The bottom and top of the box are the firstand third quartiles, and the band inside the box is the median. Theend of the lower whisker represents the datum still within1.5 interquartile range (IQR) of the lower quartile, and the end ofthe upper whisker represents the datum still within 1.5 IQR of theupper quartile. The minimum and maximum of the data isindicated in the whiskers by a straight line, and the 1% and 99%quartiles are represented by crosses. Outliers are plotted as dots.More sophisticated statistical techniques can be employed toanalyze multivariate interactions and CQA dependencies. Thederived data can play a key role in the quality risk assessmentsrecommended by FDA guidance when developing quality products(ICH, 2005). The data was transformed into probability densityfunctions which were used to calculate the probability of meetingthe product CQA as a function of inlet uncertainty, as also shownin Fig. 6. Probabilistic design spaces were then generated byplotting the probability of meeting the product CQA (B%) as afunction of available manipulated variables, e.g. mass challengeand wash length.
Table 3Model validation runs: product percentage in load, load concentration, and loadchallenge.
Run identifier Load Challenge(mg/ml resin)
Load Concentration(mg/ml)
AA % AB % BB %
A 1.5 0.26 35 35 30B 2.2 0.35 40 44 16C 2.4 0.44 14 38 48
Fig. 5. Experimental and simulated product form distributions during load, wash and in final elution peak in model validation runs. Top. High resin. Bottom. Low resin. Left.Case study A. Right. Case study B. (7 ml CV, 7.4 cm bed height, 4.2 CV/h, load details shown in Table 3).
Table 4Model validation runs: Experimental vs simulated percentage A and B inelution peaks.
Resinidentifier
Runidentifier
Exp% A
Sim% A
Difference Exp% B
Sim% B
Difference
High A 81 79 �3 19 21 þ3B 85 82 �3 15 18 þ3C 71 68 �3 29 32 þ3
Low A 90 90 0 10 10 0B 93 93 0 7 7 0C 86 81 �5 14 19 þ5
E.J. Close et al. / Chemical Engineering Science 116 (2014) 284–295 291

Accounting for uncertainty in controlled variables such as ionicstrength was beyond the scope of this work, but can be integratedinto simulations if desired. In this case, a suitable isotherm with aparameter that can be assigned uncertainty concerning ionicstrength, such as the steric mass action (SMA) isotherm, wouldbe required (Brooks and Cramer, 1992). In addition, the impact ofmodel uncertainty on stochastic predictions can be included,although this was neglected in this work as the CQA variance(e.g. 10–42% in the example shown in Fig. 6) was typically muchlarger than the largest model error found during model validationstudies (75%). Despite this, the uncertainty in model predictionscannot be easily neglected and care must be taken to ensure thatrobust operating areas identified by model predictions are testedexperimentally.
Probabilistic design spaces for the low and high resin lots areshown in Fig. 7. The design space is defined as the multidimen-sional combination and interaction of input variables and processparameters that have been demonstrated to provide assurance ofproduct quality, i.e. that the product CQA's is met. The keycharacteristic of probabilistic design spaces is that they providequantitative information on the assurance of quality, accountingfor both the mean and the variance of uncertain process para-meters and variables. No combination of mass challenge and washlength was found for either resin lot which had a probability of
1.0 for the historical variability experienced in the load material,i.e. that would guarantee the CQA is always met. However, thelarge size of regions where the probabilityo0.95 meant thatrarely would the process fail to meet its objectives if the operatingcondition was specific to the resin lot in use. The large differencebetween operating conditions that give p40.95 for each resin aresomewhat surprising given the small difference between theadsorption isotherm parameters, but are due to the very challen-ging CQA constraint, combined with the mean and variance of theinlet composition and concentration.
When the design space must be eligible for all resin lots, thenthe probability of achieving the correct product form distributionin the elution peak should be high for both resin lots. Fig. 8 showsan overlay of the two resins' probabilistic design spaces. Critically,there was no operating region where the probability of both thelow and high resin lots remained40.95, i.e. risk of batch fail-ureo5%. Even at the optimum operating condition where the twocurves intersect (e.g. mass challenge 2 mg/ml, wash length 4 CV),the probability only reaches 0.84. As a result, the operatingparameter ranges available for manufacturing are small, and atbest, 16% of batches are still predicted to fail product qualityspecifications. In addition, the product form distribution will varywithin the full allowable range (0.25oBo0.45), which is undesir-able when the objective is to produce a consistent product.
50% (Median)25% (Quartile)
75% (Quartile)
100% (Maximum)
0% (Minimum)
99%
1%
Outliers
Outliers
MOMENTS Standard deviation 3.74
Mean 23
QUARTILES100 Maximum 4299.5 3497.5 3190 2875 Quartile 2650 Median 2325 Quartile 2110 192.5 160.5 140 Minimum 10
Fig. 6. CQA data from stochastic simulation at mass challenge 2.5 mg/ml, wash length 5 CV in box plot and probability distribution form with associated moments andquartiles (low resin).
Fig. 7. Probabilistic design spaces for low binding (right) and high binding (left) resin lots, showing the probability that the resin will achieve the correct product formdistribution in the elution peak over a ranges of possible mass challenges and wash lengths.
E.J. Close et al. / Chemical Engineering Science 116 (2014) 284–295292
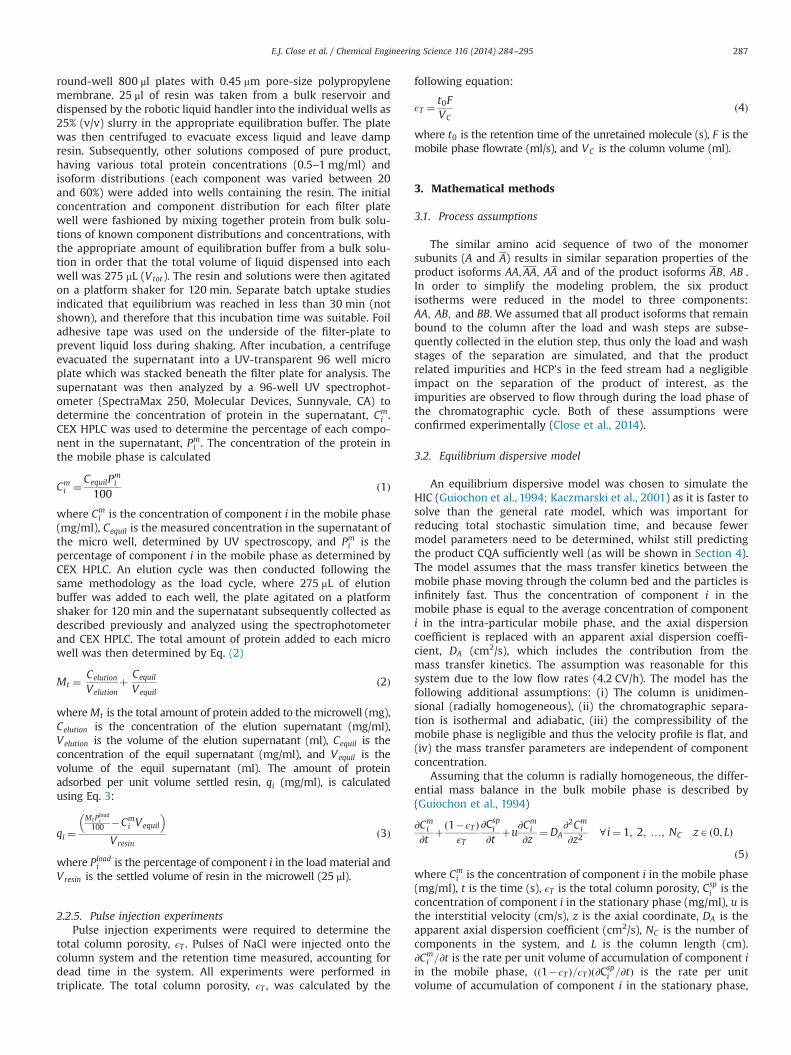
Selecting operating conditions that are eligible for all resin lotsalso means that high risk regions are selected, where deviationsfrom usual inlet stream composition can result in further perfor-mance issues. For this case study, significant increases in processrobustness can be made by adapting the design space based on theresin lot in use, rather than fixing the design space for all resin lots.In practice, this would involve varying the length of the washlength based on the resin lot in use. This adaptive approachsignificantly increases the size of potential operating regions,improves flexibility to variations in process inputs, provides amore consistent product composition, and enables operationfurther away from high risk regions. This conclusion, that adaptiveoperation can bring significant benefits is in agreement withliterature (Gétaz et al., 2013a,2013b), and is a viable mode ofoperation under FDA Quality by Design guidance (ICH, 2008a).
The probabilistic design spaces presented are particularlyuseful as they provide a quantitative measure of the assurance ofproduct quality, which either validates the robustness of potentialoperating regions, or indicates a need for process improvement.The stochastic methodology can be easily extended to identify thelevel of control required on uncertain parameters/variables toachieve adequate assurance of quality, by systematically reducing
the variance of uncertain parameters, and measuring the qualityresponse. Alternatively, when parameter variability is reduced dueto improvements and optimization by process operators as experi-ence is built over a process lifetime, the method can identify howoperating ranges can be expanded to give greater flexibility toprocess operators during manufacturing.
For this case study, the data indicates that if the operatingparameter ranges must be fixed for all resin lots, then processimprovements are needed. Without process improvements, oper-ating regions that provide assurance of product quality are smalland are not robust. We now consider how decreasing variability inthe product form inlet concentrations via increased control ofupstream unit operations can improve the assurance of qualitywhen using an operating region fixed for all resins. Better controlwas assumed to result in less variability, and therefore a reducedstandard deviation. A detailed description of how this can beachieved in practice is beyond the scope of this work, but couldinclude modifications to upstream processes such as optimizingthe elution stage of preceding affinity chromatographic separa-tions. In any case, the study is a useful exercise for illustrating howstochastic simulation and mechanistic models can be used notonly for quantifying risk associated with uncertainty, but forexploring the relationship between parameter and CQA variance,a key consideration when validating quality assurance.
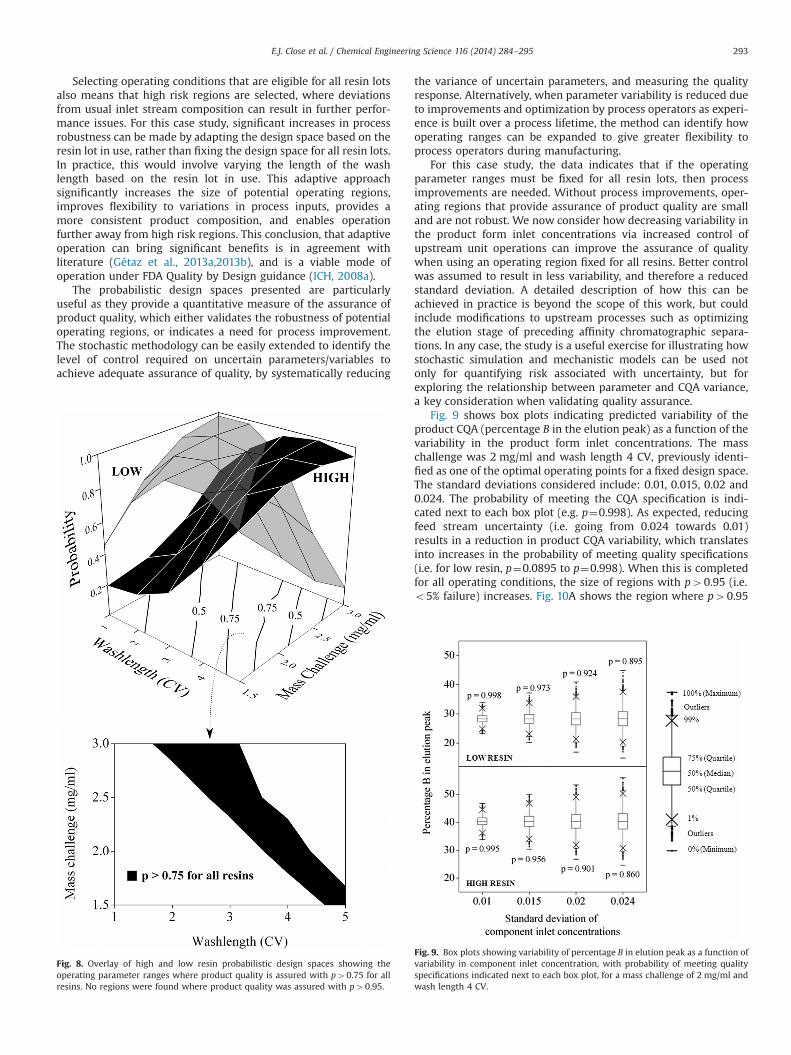
Fig. 9 shows box plots indicating predicted variability of theproduct CQA (percentage B in the elution peak) as a function of thevariability in the product form inlet concentrations. The masschallenge was 2 mg/ml and wash length 4 CV, previously identi-fied as one of the optimal operating points for a fixed design space.The standard deviations considered include: 0.01, 0.015, 0.02 and0.024. The probability of meeting the CQA specification is indi-cated next to each box plot (e.g. p¼0.998). As expected, reducingfeed stream uncertainty (i.e. going from 0.024 towards 0.01)results in a reduction in product CQA variability, which translatesinto increases in the probability of meeting quality specifications(i.e. for low resin, p¼0.0895 to p¼0.998). When this is completedfor all operating conditions, the size of regions with p40.95 (i.e.o5% failure) increases. Fig. 10A shows the region where p40.95
Fig. 8. Overlay of high and low resin probabilistic design spaces showing theoperating parameter ranges where product quality is assured with p40.75 for allresins. No regions were found where product quality was assured with p40.95.
Fig. 9. Box plots showing variability of percentage B in elution peak as a function ofvariability in component inlet concentration, with probability of meeting qualityspecifications indicated next to each box plot, for a mass challenge of 2 mg/ml andwash length 4 CV.
E.J. Close et al. / Chemical Engineering Science 116 (2014) 284–295 293

for both resins at the lowest inlet variability considered(SD¼0.01). Even with this high level of control over the feedmaterial, operating regions where p40.95 were significantlysmaller than those available if the operating conditions wereadapted according to the resin lot in use under normal inletvariability (Fig. 7). Fig. 10B shows the design space which assuresproduct quality for all resins in an ideal (but unrealistic) systemwith no inlet variability. The large difference in size betweenFig. 10A (ideal systemwith no inlet variability) and Fig. 10B (lowestinlet variability considered, SD¼0.01), provides a stark demon-stration of the importance of considering parameter varianceswhen designing chromatography processes. If this is notaccounted for, then the result may be unrealistically good expecta-tions and in turn high failure rates.
5. Conclusion
In this paper, a model based approach was used to identifyrobust operating conditions for an industrial hydrophobic interac-tion chromatography where resin lot variability, combined with avariable feed stream, was resulting in serious performance issuesduring the purification of a multi component therapeutic proteinfrom crude feed material. FDA guidance encourages the applica-tion of mechanistic models to improve process understanding,based on fundamental knowledge of the underlying causes whichare linking process parameters to product CQA's. The methodologydemonstrates how useful mechanistic models linked with sto-chastic simulation can be for this task, for as well as determiningthe functional relationship between process parameter values andthe resulting value of the CQA, the use of models can quickly andefficiently determine the relationship between process parameterand CQA variances, a key aspect of providing assurance of productquality. This was not possible for the HIC in this case study using adesign of experiment type of approach due to the impracticalamount of resources that would be required.
The model based approach combines mechanistic models andstochastic simulation, and in this work is used to predict a keyproduct CQA as function of mass challenge and wash length forpolar extreme resin lots, designated high and low binding resin,whilst also accounting for uncertainty in feed stream compositionand concentration. With normal process variability, no operatingcondition was found where the probability of both the low andhigh resin lots meeting product quality specifications remained40.95. The risk of batch failure when operating at the mostfavorable conditions found in this work was 16%, and selectingoperating conditions that were eligible for both resin lots meantthat operating conditions were not robust. Increasing control onthe inlet concentration and composition was predicted to improvefixed design space robustness, but we found that using an adaptive
design space, where operating conditions are changed accordingto which resin lot is in use, was the favorable option.
Nomenclature
Cm Mobile phase concentration (mg/ml)Csp Stationary phase concentration (mg/ml)Cequil Concentration of the equilibration supernatant (mg/ml)Celution Concentration of the elution supernatant (mg/ml)CF Compression factorDA Apparent axial dispersion coefficient (cm2/s)F Mobile phase flowrate (ml/s)i Component identifierka Equilibrium constantL Column length (cm)Mt Total amount of protein added to the micro well (mg)NC Number of componentsNp Number of theoretical plates
Ploadi Component percentage in load material
Pmi Component percentage in equilibration supernatant
qs Saturation capacity (mg/ml)q Settled resin concentration (mg/ml)t0 Retention time (1/s)t Time (s)u Interstitial velocity (cm/s)Velution Volume of the equilibration supernatant (ml)Vequil Volume of the elution supernatant (ml)Vresin Settled resin volume in microwell (ml)VC Column volume (ml)ϵT Total column porosity
Acknowledgments
The support of Pfizer, and the contributions of Jenna Davison,Andrew Wood, Victoria Brook and Tobias Neville are gratefullyacknowledged. The support of the UK Engineering and PhysicalSciences Research Council EPSRC for the Innovative ManufacturingResearch Centre (IMRC) in Bioprocessing and the EPSRC Centre forInnovative Manufacturing in Emergent Macromolecular Therapiesis acknowledged gratefully. The IMRC and the EPSRC Centre areeach part of The Advanced Centre for Biochemical Engineering,Department of Biochemical Engineering, University College Lon-don, with collaboration from a range of academic partners,biopharmaceutical and biotechnology companies.
Fig. 10. Fixed design spaces. (left) Highest level of feed stream control considered in this work, SD¼0.01. Area highlighted indicates probability of product quality assurance40.95. (right) Assuming no feed stream variability, and therefore the area highlighted shows p¼1.0.
E.J. Close et al. / Chemical Engineering Science 116 (2014) 284–295294

References
Borg, N., Westerberg, K., Andersson, N., von Lieres, E., Nilsson, N., 2013. Effects ofuncertainties in experimental conditions on the estimation of adsorptionmodel parameters in preparative chromatography. Comput. Chem. Eng. 55,148–157.
Brooks, C.A., Cramer, S.M., 1992. Steric mass-action ion exchange: displacementprofiles and induced salt gradients. AIChE J. 38, 1969–1978.
Close, E.J., Salm, J.R., Bracewell, D.G., Sorensen, E., 2014. Modelling of industrialbiopharmaceutical multicomponent chromatography. Chem. Eng. Res. Des.,http://dx.doi.org/10.1016/j.cherd.2013.10.022, in press
Coffman, J.L., Kramarczyk, J.F., Kelley, B.D., 2008. High–throughput screening ofchromatographic seperations: 1. Method development and column modeling.Biotechnol. Bioeng. 100, 605–618.
Degerman, M., Jakobsson, N., Nilsson, B., 2007. Modeling and optimization ofpreperative reversed – phase liquid chromatography for insulin purification. J.Chromatogr. A. 1162, 41–49.
Degerman, M., Westerberg, K., Nilsson, N., 2009. A Determining critical processparameters and process robustness in preparative chromatography – a modelbased approach. Chem. Eng. Technol. 32, 903–911.
Gerontas, S., Asplund, M., Hjorth, R., Bracewell, D.G., 2010. Integration of scale –
down experimentation and general rate modelling to predict manufacturingscale chromatographic seperations. J. Chromatogr. A. 1217, 6917–6926.
Gétaz, D., Stroehleina, G., Butté, A., Morbidelli, 2013a. Model-based design ofpeptide chromatographic purification processes. J. Chromatogr. A. 1284, 69–79.
Gétaz, D., Butté, A., Morbidelli, 2013b. Model-based design space determination ofpeptide chromatographic purification processes. J. Chromatogr. A 1284, 80–87.
Guiochon, G., Goldshan-Shirazi, S., Katti, A.M., 1994. Fundamentals of Preperativeand Non-linear Chromatography. Academic Press, Boston.
Harms, J., Wang, X., Kim, T., Yang, X., Rathore, A.S., 2008. Defining process designspace for biotech products: case study of pichia pastoris fermentation.Biotechnol. Prog. 24, 655–662.
International Conference of Harmonisation (2005). ICH Harmonised TripartiteGuideline: Q9 Quality Risk Management.
International Conference of Harmonisation (2008a). ICH Harmonised TripartiteGuideline: Q8 Pharmaceutical Development.
International Conference of Harmonisation (2008b). ICH Harmonised TripartiteGuideline: Q10 Pharmaceutical Quality Systems.
Jakobsson, N., Degerman, M., Nilsson, B., 2005. Optimization and robustnessanalysis of a hydrophobic interaction chromatography stepJ. Chromatogr.A 1063, 99–109.
Jiang, C., Flansburg, L., Ghose, S., Jorjorian, P., Shukla, A., 2010. Defining processdesign space for a hydrophobic interaction chromatography (HIC) purification
step: Application of quality by design (QbD) principles. Biotechnol. Bioeng. 107,985–997.
Kaczmarski, K., Antos, D., Sajonz, H., Sajonz, P., Guiochon, G., 2001. Comparitivemodeling of breakthrough curves of bovine serum albumin in anion – exchangechromatography. J. Chromatogr. A 925, 1–17.
McCue, J.T., Engel, P., Ng, A., Macniven, R., Thom̈mes, J., 2008. Modeling of protein/aggregate purification and separation using hydrophobic interaction chroma-tography. Bioprocess. Biosyst. Eng. 31, 261–275.
McCue, J.T., Cecchini, D., Chu, C., Liu, W., Spann, A., 2007. Application of a two –
dimensional model for predicting the pressure – flow and compressionproperties during column packing scale – up. J. Chromatogr. A. 1145, 89–101.
Melter, L., Butte, A., Morbidelli, M., 2008. Preperative weak cation – exchangechromatography of monoclonal antibody variants: 1. Single component adsorp-tion. J. Chromatogr. A 1200, 156–165.
Mollerup, J.M., Hansen, T.B., Kidal, S., Sejergaard, L., Hansen, E., Staby, A., 2007.Development, modelling, optimization and scale – up of chromatographicpurification of a therapeutic protein. Fluid Phase Equilib. 261, 133–139.
Mollerup, J.M., 2008. A review of the thermodynamics of protein association toligands, protein adsorption, and adsorption isotherms. Chem. Eng. Technol. 31,864–874.
Nagrath, D., Xia, F., Cramer, S.M., 2011. Characterization and modeling of nonlinearhydrophobic interaction chromatographic systems. J. Chromatogr. A. 1218,1219–1226.
Nfor, B.K., Ahamed, T., van Dedem, G.W.K., Verhaert, PDEM, van der Wielen, L.A.M.,Eppink, L.H.M., de Sandt, E.J.A.X., Ottens, M., 2013. Model-based rationalmethodology for protein purification process synthesis. Chem. Eng. Sci. 89,185–195.
Ng, C.K.S., Osuna-Sanchez, H., Valery, E., Sørensen, E., Bracewell, D.G., 2012. Designof high productivity antibody capture by protein A chromatography using anintegrated experimental and modeling approach. J Chromatogr. B 899, 116–126.
Osberghaus, A., Drechsel, K., Hansen, S., Hepbildikler, S.K., Nath, S., Haindl, M.,vonLieres, E., Hubbuch, J., 2012. Model – integrated process developmentdemonstrated on the optimization of a robotic cation exchange step. Chem.Eng. Sci. 76, 129–139.
Process Systems Enterprise, 2013. gPROMS, ⟨www.psenterprise.com/gproms⟩.Rathore, A.S., Winkle, H., 2009. Quality by design for pharmaceuticals: regulatory
perspective and approach. Nat. Biotechnol. 27, 26–34.Rathore, A.S., 2009. Roadmap for implementation of quality by design (QbD) for
Biotechnology products. Trends Biotechnol. 27, 546–555.Seidel-Morgenstern, A., 2004. Review: experimental determination of single solute
and competitive adsorption isotherms. J. Chromatogr. A 1037, 255–272.Westerberg, K., Hansen, E.B., Degerman, D., Hansen, T.B., Nilsson, B., 2012. Model-
based process challenge of an industrial ion-exchange chromatography step.Chem. Eng. Technol. 35, 183–190.
E.J. Close et al. / Chemical Engineering Science 116 (2014) 284–295 295