chemical composition of selected solid- phase … · determined for each sample by inductively...
TRANSCRIPT
DOE/ID-22173
CHEMICAL COMPOSITION OF SELECTED SOLID- PHASE SAMPLES FROM THE SNAKE RIVER PLAIN AQUIFER SYSTEM AND CONTRIBUTING DRAINAGES, EASTERN IDAHO AND WESTERN WYOMING
U.S. GEOLOGICAL SURVEY OPEN-FILE REPORT 01-36
Prepared in cooperation with the U.S. DEPARTMENT OF ENERGY
science lor a changing world

Chemical Composition of Selected Solid-Phase Samples from the Snake River Plain Aquifer System and Contributing Drainages, Eastern Idaho and Western Wyoming
By LeRoy L. Knobel, L. DeWayne Cecil, Shenean Fisher, and Jaromy R. Green
U.S. GEOLOGICAL SURVEY Open-File Report 01-36
Prepared in cooperation with U.S. DEPARTMENT OF ENERGY
Idaho Falls, Idaho January 2001
U.S. DEPARTMENT OF THE INTERIOR
BRUCE BABBITT, Secretary
U.S. GEOLOGICAL SURVEY
Charles G. Groat, Director
Any use of trade, product, or firm names is for descriptive purposes only and does not imply endorsement by the U.S. Government.
For additional information write to: Copies of this report can be purchased from:
U.S. Geological Survey U.S. Geological SurveyINEEL, MS 1160 Information ServicesP.O. Box 2230 Box 25286, Denver Federal CenterIdaho Falls, ID 83403 Denver, CO 80225
CONTENTS
Abstract...........................................................^ 1
Introduction...............................................................................................................................................^ 1
Purpose and scope............................................................................................................................................. 1
Geohydrology of the study area........................................................................................................................ 3
Previous investigations...................................................................................................................................... 4
Acknowledgments............................................................................................................................................. 5
Methods...................................................................................................................................................................... 5
Field methods..................................................................................................................................................:. 5
Analytical methods............................................................................................................................................ 5
Inductively coupled plasma-atomic emission spectroscopy (ICP-AES).................................................. 5
Instrumental neutron activation analysis (INAA)..................................................................................... 6
Loss on ignition (LOI).............................................................................................................................. 6
Ion-selective electrode potentiometry (ISEP)........................................................................................... 7
Analytical results.....................................................................^ 7
Oxides of major rock-forming elements ........................................................................................................... 7
Trace elements................................................................................................................................................... 7
Summary ........................................................................... 7
References cited......................................................................................................................................................... 8
FIGURES
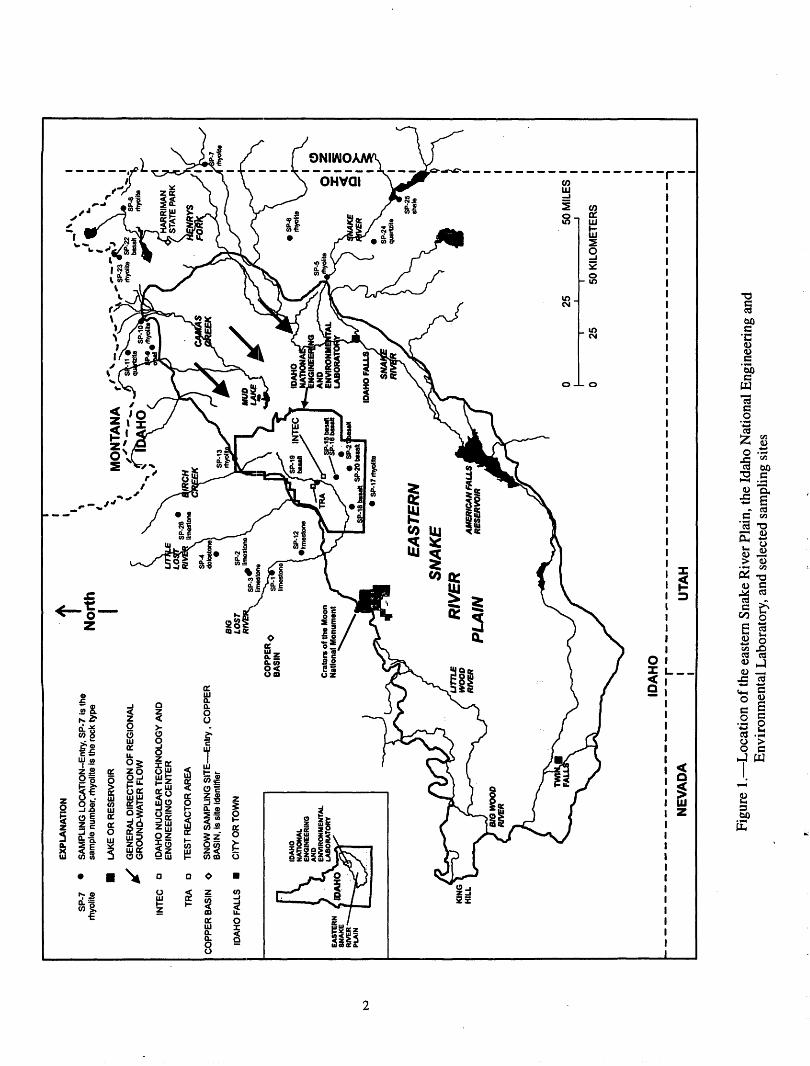
1. Map showing location of the eastern Snake River Plain, the Idaho National Engineering andEnvironmental Laboratory, and selected sampling sites...................................................................................... 2
TABLES
1. Sample collection information............................................................................................................................ 11
2. Chemical composition of major rock-forming elements (percent by weight) of selected solid-phasesamples, by major rock type, eastern Snake River Plain aquifer system, Idaho and Wyoming......................... 12
3. Chemical composition of trace elements (parts per million by weight) of selected solid-phasesamples, by major rock type, eastern Snake River Plain aquifer system, Idaho and Wyoming........................ 15
in
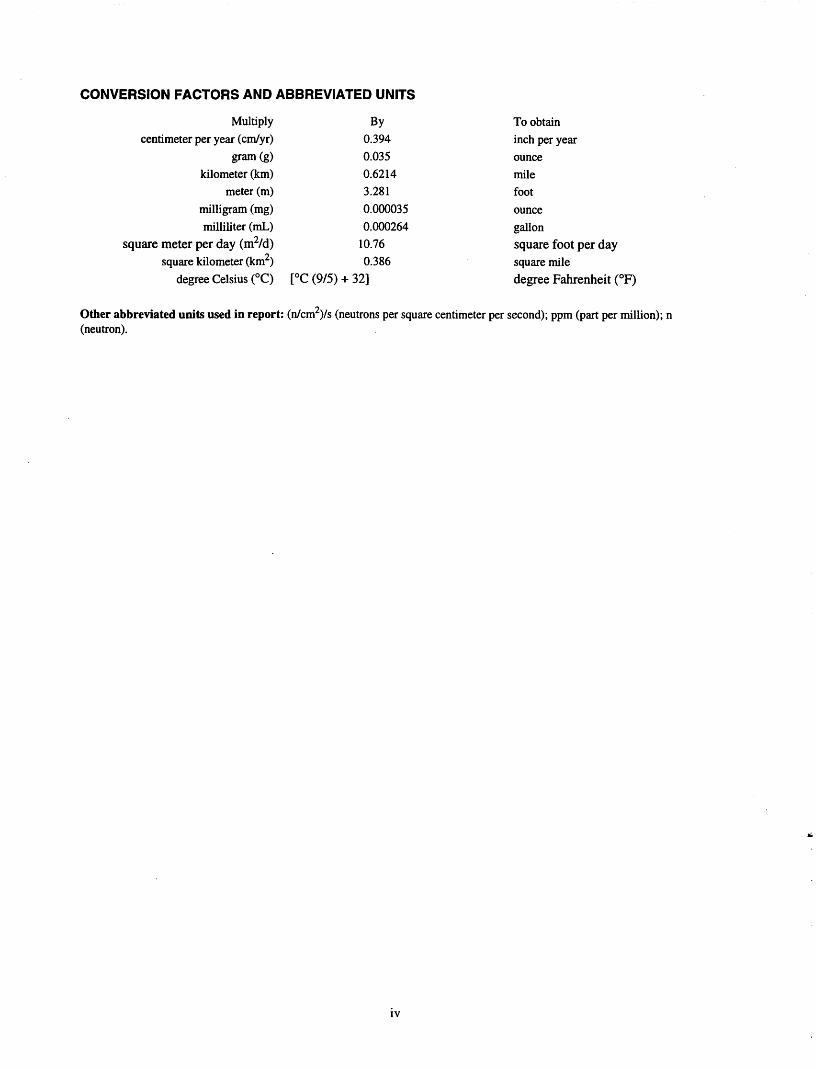
CONVERSION FACTORS AND ABBREVIATED UNITS
Multiplycentimeter per year (cm/yr)
gram(g)kilometer (km)
meter (m)milligram (mg)milliliter (mL)
square meter per day (m2/d)f\
square kilometer (km )
By 0.394 0.035 0.6214 3.281 0.000035 0.000264
10.76 0.386
degree Celsius (°C) [°C (9/5) + 32]
To obtaininch per yearouncemilefootouncegallonsquare foot per daysquare miledegree Fahrenheit (°F)
Other abbreviated units used in report: (n/cm2)/s (neutrons per square centimeter per second); ppm (part per million); n (neutron).
IV
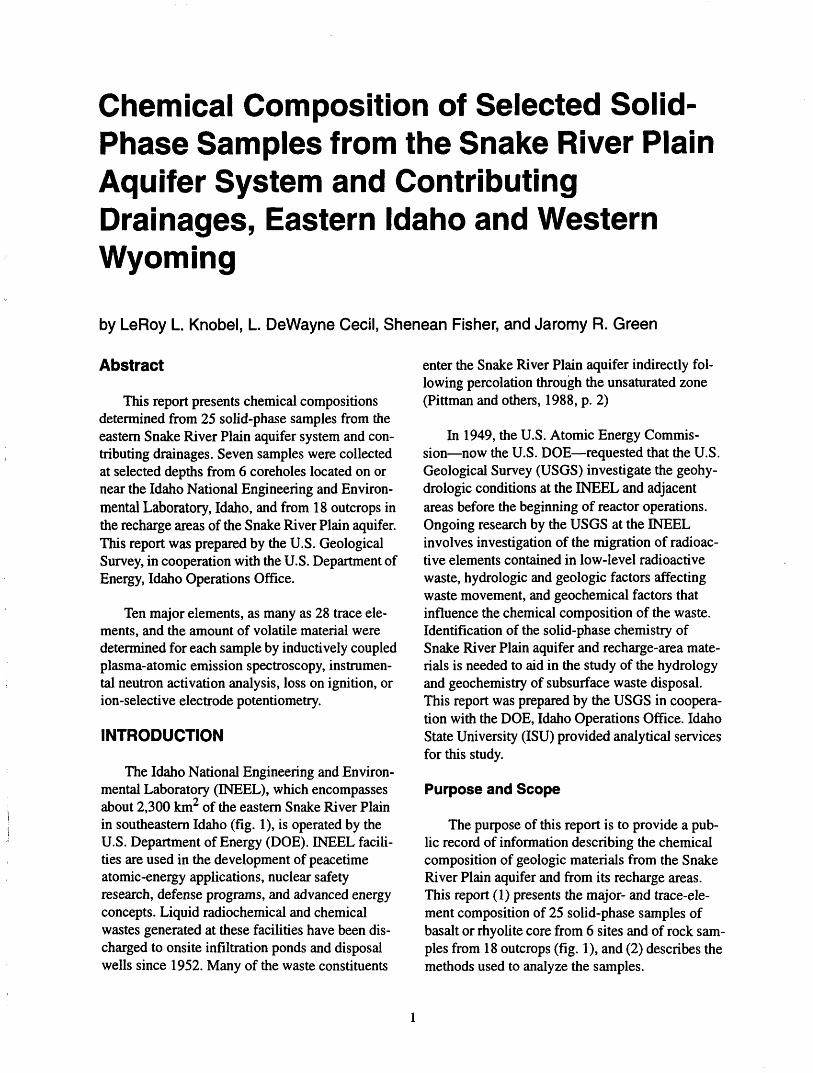
Chemical Composition of Selected Solid- Phase Samples from the Snake River Plain Aquifer System and Contributing Drainages, Eastern Idaho and Western Wyoming
by LeRoy L. Knobel, L. DeWayne Cecil, Shenean Fisher, and Jaromy R. Green
Abstract
This report presents chemical compositions determined from 25 solid-phase samples from the eastern Snake River Plain aquifer system and con tributing drainages. Seven samples were collected at selected depths from 6 coreholes located on or near the Idaho National Engineering and Environ mental Laboratory, Idaho, and from 18 outcrops in the recharge areas of the Snake River Plain aquifer. This report was prepared by the U.S. Geological Survey, in cooperation with the U.S. Department of Energy, Idaho Operations Office.
Ten major elements, as many as 28 trace ele ments, and the amount of volatile material were determined for each sample by inductively coupled plasma-atomic emission spectroscopy, instrumen tal neutron activation analysis, loss on ignition, or ion-selective electrode potentiometry.
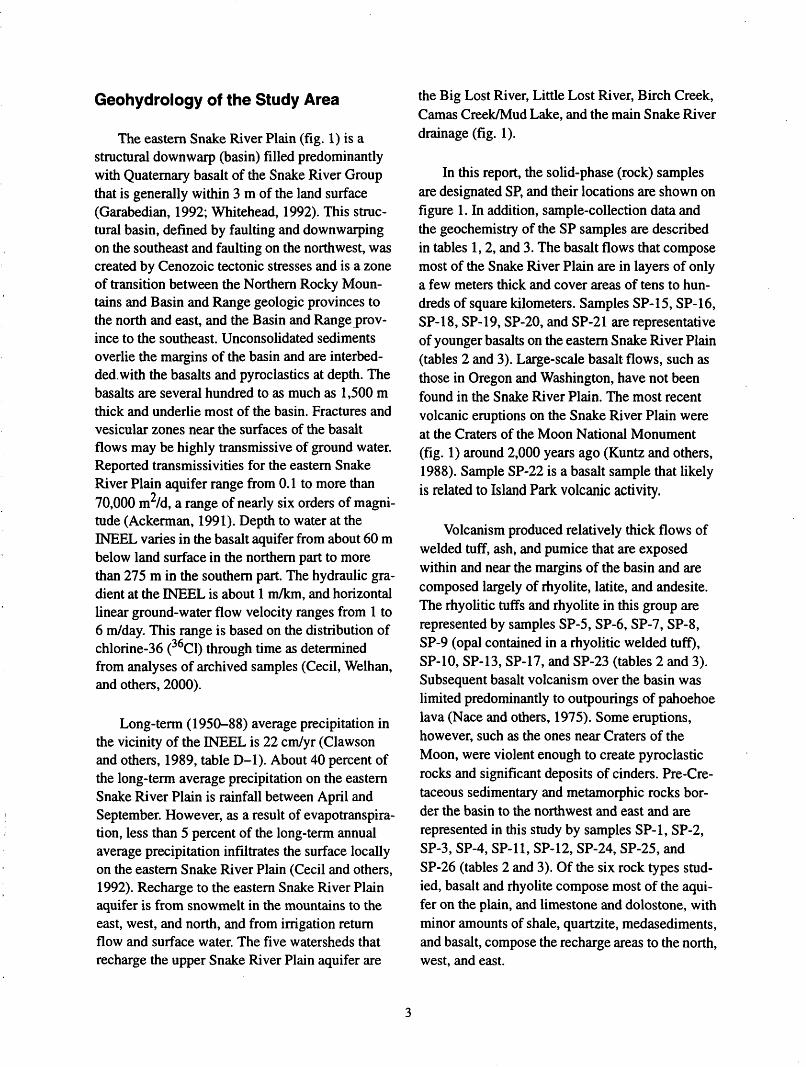
INTRODUCTION
The Idaho National Engineering and Environ mental Laboratory (INEEL), which encompasses about 2,300 km2 of the eastern Snake River Plain in southeastern Idaho (fig. 1), is operated by the U.S. Department of Energy (DOE). INEEL facili ties are used in the development of peacetime atomic-energy applications, nuclear safety research, defense programs, and advanced energy concepts. Liquid radiochemical and chemical wastes generated at these facilities have been dis charged to onsite infiltration ponds and disposal wells since 1952. Many of the waste constituents
enter the Snake River Plain aquifer indirectly fol lowing percolation through the unsaturated zone (Pittman and others, 1988, p. 2)
In 1949, the U.S. Atomic Energy Commis sion now the U.S. DOE requested that the U.S. Geological Survey (USGS) investigate the geohy- drologic conditions at the INEEL and adjacent areas before the beginning of reactor operations. Ongoing research by the USGS at the INEEL involves investigation of the migration of radioac tive elements contained in low-level radioactive waste, hydrologic and geologic factors affecting waste movement, and geochemical factors that influence the chemical composition of the waste. Identification of the solid-phase chemistry of Snake River Plain aquifer and recharge-area mate rials is needed to aid in the study of the hydrology and geochemistry of subsurface waste disposal. This report was prepared by the USGS in coopera tion with the DOE, Idaho Operations Office. Idaho State University (ISU) provided analytical services for this study.
Purpose and Scope
The purpose of this report is to provide a pub lic record of information describing the chemical composition of geologic materials from the Snake River Plain aquifer and from its recharge areas. This report (1) presents the major- and trace-ele ment composition of 25 solid-phase samples of basalt or rhyolite core from 6 sites and of rock sam ples from 18 outcrops (fig. 1), and (2) describes the methods used to analyze the samples.
SP
-7rh
yolit
e
INT
EC
o
TR
A
0
CO
PP
ER
BA
SIN
O
IDA
HO
FA
LLS
EX
PL
AN
AT
ION
SA
MP
LIN
G L
OC
AT
ION
-En
try.
SP
-7 i
s th
e sa
mpl
e nu
mbe
r, r
hyol
ite Is
the
roc
k ty
pe
LAK
E O
R R
ES
ER
VO
IR
GE
NE
RA
L D
IRE
CT
ION
OF
RE
GIO
NA
L
GR
OU
ND
-WA
TE
R F
LO
W
IDA
HO
NU
CL
EA
R T
EC
HN
OL
OG
Y A
ND
E
NG
INE
ER
ING
CE
NT
ER
MO
NT
AN
A_
*-
HO
SP
-23
rtiy
olte
S
Pba
salt
HA
RR
IMA
N
STA
TE P
AR
K
TE
ST
RE
AC
TO
R A
RE
A
SN
OW
SA
MP
LIN
G S
ITE
En
try .
CO
PP
ER
B
AS
IN,
is s
ite id
entif
ier
IDAH
ONA
TIONA
LEN
GINE
ERIN
GA
ND
EN
VIR
ON
ME
NTA
LLA
BO
RA
TOR
YA
ND
ENVI
RO
NLA
BO
R*
Cra
ter*
of t
he M
oon
Nat
iona
l Mon
umen
t
EA
ST
ER
N
SN
AK
EU
TT
LE
W
OO
D
RIV
ER
AM
ER
ICA
N H
ALL
S
RE
SE
RV
OIR
50 K
ILO
ME
TER
S
NE
VA
DA
Figu
re 1
. Loc
atio
n of
the
east
ern
Snak
e R
iver
Pla
in, t
he I
daho
Nat
iona
l Eng
inee
ring
and
E
nvir
onm
enta
l Lab
orat
ory,
and
sel
ecte
d sa
mpl
ing
site
s
Geohydrology of the Study Area
The eastern Snake River Plain (fig. 1) is a structural downwarp (basin) filled predominantly with Quaternary basalt of the Snake River Group that is generally within 3 m of the land surface (Garabedian, 1992; Whitehead, 1992). This struc tural basin, defined by faulting and downwarping on the southeast and faulting on the northwest, was created by Cenozoic tectonic stresses and is a zone of transition between the Northern Rocky Moun tains and Basin and Range geologic provinces to the north and east, and the Basin and Range prov ince to the southeast. Unconsolidated sediments overlie the margins of the basin and are interbed- ded.with the basalts and pyroclastics at depth. The basalts are several hundred to as much as 1,500 m thick and underlie most of the basin. Fractures and vesicular zones near the surfaces of the basalt flows may be highly transmissive of ground water. Reported transmissivities for the eastern Snake River Plain aquifer range from 0.1 to more than 70,000 m /d, a range of nearly six orders of magni tude (Ackerman, 1991). Depth to water at the INEEL varies in the basalt aquifer from about 60 m below land surface in the northern part to more than 275 m in the southern part. The hydraulic gra dient at the INEEL is about 1 m/km, and horizontal linear ground-water flow velocity ranges from 1 to 6 m/day. This range is based on the distribution of chlorine-36 (36C1) through time as determined from analyses of archived samples (Cecil, Welhan, and others, 2000).
Long-term (1950-88) average precipitation in the vicinity of the INEEL is 22 cm/yr (Clawson and others, 1989, table D-l). About 40 percent of the long-term average precipitation on the eastern Snake River Plain is rainfall between April and September. However, as a result of evapotranspira- tion, less than 5 percent of the long-term annual average precipitation infiltrates the surface locally on the eastern Snake River Plain (Cecil and others, 1992). Recharge to the eastern Snake River Plain aquifer is from snowmelt in the mountains to the east, west, and north, and from irrigation return flow and surface water. The five watersheds that recharge the upper Snake River Plain aquifer are
the Big Lost River, Little Lost River, Birch Creek, Camas Creek/Mud Lake, and the main Snake River drainage (fig. 1).
In this report, the solid-phase (rock) samples are designated SP, and their locations are shown on figure 1. In addition, sample-collection data and the geochemistry of the SP samples are described in tables 1,2, and 3. The basalt flows that compose most of the Snake River Plain are in layers of only a few meters thick and cover areas of tens to hun dreds of square kilometers. Samples SP-15, SP-16, SP-18, SP-19, SP-20, and SP-21 are representative of younger basalts on the eastern Snake River Plain (tables 2 and 3). Large-scale basalt flows, such as those in Oregon and Washington, have not been found in the Snake River Plain. The most recent volcanic eruptions on the Snake River Plain were at the Craters of the Moon National Monument (fig. 1) around 2,000 years ago (Kuntz and others, 1988). Sample SP-22 is a basalt sample that likely is related to Island Park volcanic activity.
Volcanism produced relatively thick flows of welded tuff, ash, and pumice that are exposed within and near the margins of the basin and are composed largely of rhyolite, latite, and andesite. The rhyolitic tuffs and rhyolite in this group are represented by samples SP-5, SP-6, SP-7, SP-8, SP-9 (opal contained in a rhyolitic welded tuff), SP-10, SP-13, SP-17, and SP-23 (tables 2 and 3). Subsequent basalt volcanism over the basin was limited predominantly to outpourings of pahoehoe lava (Nace and others, 1975). Some eruptions, however, such as the ones near Craters of the Moon, were violent enough to create pyroclastic rocks and significant deposits of cinders. Pre-Cre- taceous sedimentary and metamorphic rocks bor der the basin to the northwest and east and are represented in this study by samples SP-1, SP-2, SP-3, SP-4, SP-11, SP-12, SP-24, SP-25, and SP-26 (tables 2 and 3). Of the six rock types stud ied, basalt and rhyolite compose most of the aqui fer on the plain, and limestone and dolostone, with minor amounts of shale, quartzite, medasediments, and basalt, compose the recharge areas to the north, west, and east.
Previous Investigations
Geologic, hydrologic, and water-quality inves tigations have been conducted at the INEEL since it was selected as a reactor-testing station in 1949. Nace and others (1956; 1975) reported major rock- forming element and selected trace-element chem istry of a basalt sample from Craters of the Moon National Monument and a nephelite basalt sample from the Fort Hall Indian Reservation. Jones (1961) reported the average composition of major rock-forming elements in 38 basalt samples from the Snake River Plain. The data of Nace and others (1956; 1975) and Jones (1961) were republished by Bartholomay and others (1989).
Kuntz and Dalrymple (1979) determined major rock-forming element chemistry for 17 basalt sam ples from large volcanoes in the eastern Snake River Plain and compared the average concen trations with those of various tholeiitic basalts from other locations. Fiesinger and others (1982) ana lyzed 26 basaltic lava samples from an area south east of the eastern Snake River Plain for major rock-forming elements and compared results with basaltic lava compositions of samples from the Snake River Plain.
Leeman (1982a) provided major rock-forming element chemistry of 22 representative hybrid lava samples from the Snake River Plain. Leeman (1982b) also summarized major rock-forming ele ment and selected trace-element chemistry for basalt samples from the Snake River Plain and dis cussed two major variants of basaltic lavas that are present on the Snake River Plain. Honjo and Lee man (1987) reported major- and trace-element chemistry for selected samples of hybrid ferrolatite lavas from the Snake River Plain. The chemical data were selected from a more detailed report about the petrology and geochemistry of the Magic Reservoir eruptive center in south-central Idaho (Honjo, 1986).
Wood and Low (1988) reported average com positions of major rock-forming elements for groups of 152 and 15 basalt samples from the Snake River Plain. They also provided specific analytical results for 13 basalt samples from the Snake River Plain.
Shervais and others (1994) reported ranges of major-element oxide compositions and minor- and trace-element concentrations for 59 rock samples from 2 coreholes at the INEEL. The rock samples represented 14 major flow groups that are part of the eastern Snake River Plain aquifer system.
Anderson and Bartholomay (1995) used potas sium oxide (K2O) chemical data from several core samples taken from three coreholes near the Radio active Waste Management Complex (RWMC) in conjunction with natural-gamma logs to determine stratigraphic relations of basalt and sediment at the RWMC. The K2O values were determined by X- ray fluorescence (XRF) analysis.
Knobel and others (1995) reported the major- ion and trace-element composition of basalts from 84 samples of cores from 5 coreholes located at the INEEL. They also reported crustal abundances and descriptive statistics for the elements.
Reed and others (1997) reported major-ele ment and trace-element chemistry data for 39 basalt samples taken from 2 coreholes near the Idaho Nuclear Technology and Engineering Center (INTEC). They used the data to make geochemical and stratigraphic correlations of basalt flows between the two boreholes beneath the INTEC.
Colello and others (1998) reported selected major-element and trace-element chemistry data for 24 basalt samples taken from 3 coreholes located on the INEEL. In related studies, Pace and others (1999) reported data for 6 basalt and 5 sedi ment infill samples from a corehole near INTEC, and Liszewski and others (2000) reported data for surficial samples from 20 sites located on the INEEL. The samples and chemical data were used in experiments to determine strontium distribution coefficients of basalts, sediment infill in basalts, and surficial sediments at the INEEL.
Cecil, Knobel, and others (2000) used the data presented in this report to calculate the in situ pro duction of 36C1 in the eastern Snake River Plain aquifer and discussed the associated implications for describing ground-water contamination near the INEEL.
Acknowledgments Analytical Methods
The authors thank Roy C. Bartholomay of the USGS and Flint Hall of the State of Idaho INEEL Oversight Program for their critical review of the manuscript. Their many comments and suggestions greatly improved the manuscript.
METHODS
Twenty-five rock samples were submitted to the ISU Department of Geology, Geochemical Laboratory, for analysis of elemental chemistry. The Geochemical Laboratory prepared samples for analysis by three separate analytical methods: inductively coupled plasma-atomic emission spec- trometry (ICP-AES), instrumental neutron activa tion analysis (INAA), and loss on ignition (LOI). In addition, selected solid-phase samples were sub mitted to the USGS Branch of Geochemistry Labo ratory to determine chloride (Cl~) concentration by ion-selective electrode potentiometry (ISEP). An additional basalt sample (SP-14) was collected but was not processed because it duplicated a sample (ICPP 121 at 143 m) that was analyzed and reported by Reed and others (1997).
Field Methods
Although some of the whole-rock samples col lected for this study were from the upper 2 to 5 m of the rock formation (in caves, open-pit mines, or mineral exploration adits) or from outcrops at land surface and may have undergone some changes as a result of weathering, the chemical data presented in tables 2 and 3 are assumed to be representative of the entire depth of the rock type, both tempo rally and spatially. For basalt and rhyolite samples SP-15 through SP-21 (table 1), the depth of collec tion was greater than 50 m in all cases; these sam ples were extracted from rock cores housed in the USGS Lithologic Core Library at the INEEL. All whole-rock samples were collected from fresh exposures or cores by using standard methods (Compton, 1962, p. 13-14 and p. 178-184) and powderless gloves to minimize contamination.
Sample processing for each of these analytical methods began with the preparation of a homoge neous powdered sample. Each powdered sample subsequently underwent processing according to the specific analytical method to be applied.
Inductively coupled plasma-atomic emission spectroscopy (ICP-AES)
For analyses by ICP-AES, the sample must be prepared as a solution (Lichte and others, 1987). There are a variety of methods to prepare the solu tion, and each method has advantages that are related to sample composition. Sequential acid dis solution by hydrofluoric acid (HF), aqua regia, per chloric acid (HC1O4), and nitric acid (HNO3) is one method that has the disadvantage that silicon and boron are lost because of their volatility as flu- orides. Also, several trace minerals, including chromite, are not completely dissolved by this method. Because of the silicic composition of vol canic rocks in the Snake River Plain, a fusion method of preparing sample solutions was used by the ISU laboratory as opposed to the sequential acid dissolution method.
The fusion method uses a flux to convert the sample to a glass bead, which subsequently is dis solved in dilute HNO3 to prepare a solution for analysis. The specific method used by the ISU Geochemical Laboratory involved mixing 0.1 g of powdered sample and 0.3 g of lithium metaborate in a graphite crucible and heating in a furnace for 20 minutes at 1,050 °C. The contents of the cruci ble were poured immediately into 75 mL of 3.5- percent HNO3 in a 250-mL beaker and stirred on a magnetic stirrer for 5 minutes or until the sample was clear. The contents of the beaker then were transferred to a 100-mL volumetric flask, and more dilute HNO3 was added to bring the volume to 100 mL. The flask was capped and gently shaken to thoroughly mix the contents. A sample bottle was pretreated by rinsing with 5 mL of the sample solu tion that then was discarded. The pretreated sample bottle then was filled with 50 mL of the sample solution and was ready for analysis by ICP-AES. The ISU laboratory reported weight percent values for oxides of the following elements: silicon, tita-
nium, aluminum, manganese, magnesium, cal cium, potassium, and phosphorus. Using this method, the laboratory also determined strontium, zirconium, and yttrium concentrations in units of parts per million (ppm) by weight for all samples. ICP-AES analysis also was used to determine concentrations of vanadium, nickel, copper, lead, zinc, cadmium, and barium in ppm by weight for samples SP-1 through SP-13.
Instrumental neutron activation analysis (INAA)
For analyses by INAA, a precisely known amount of powdered sample must be prepared to undergo irradiation without the loss of sample (Baedecker and McKown, 1987). The laboratory placed 1 g or less, weighed to the nearest milli gram, into a 0.4-dram (1 apothercaries dram equals 3.887 g), reactor-safe, laboratory-grade polyvial, which then was heat sealed. The 0.4-dram polyvial then was heat sealed into a 2-dram, reactor-safe, laboratory-grade polyvial. Preparation for neutron activation then was complete. For calibration pur poses, three reference standards were included with the samples: USGS rock standards BCR-1 and BHVO-1 and the National Institute of Science and Technology (NIST) traceable coal fly ash standard reference material (SRM) 1633-A.
The prepared standards and samples were sent to the Oregon State University (OSU) Radiation Center for neutron activation in the TRIGA Reac tor. Neutron activation lasted 2 hours under a neu tron flux of 3xl0 12 (n/cm2)/s. Once activated, the standards and samples were returned to ISU for analysis. Upon arrival at the laboratory, the inner 0.4-dram poly vials were transferred into new 2-dram poly vials for gamma counting.
Activation analysis is based on measurement of activity from radioactive nuclides produced by nuclear reactions on naturally occurring isotopes of the sample elements during the activation process. Gamma-ray spectroscopy at the ISU Geochemical Laboratory employed semiconductor detectors (high-purity germanium diodes) for gamma count ing. These devices converted a gamma-ray signal from the irradiated samples to electronic pulses that could be sorted and processed by a multichan
nel analyzer and supporting electronics. The result ing spectra then were processed by computer software and the results were recorded. All stan dards and samples were counted three separate times in a sequence that optimized peak-to-back ground ratios for short-, intermediate-, and long- lived radionuclides, respectively. The first counts were for determining the short-lived radionuclides of sodium, samarium, lanthanum, and uranium, and took place about 5 days after irradiation. The count periods were between 2,000 and 4,000 sec onds. The next counts were for the intermediate- lived radionuclides of barium (for samples SP-15 through SP-26), rubidium, neodymium, ytterbium, and lutetium, and took place about 10 to 20 days after irradiation. The count periods were 8,000 to 10,000 seconds. The final counts were for the long- lived radionuclides of iron, scandium, chromium, nickel (for samples SP-15 through SP-26), cobalt, cesium, cerium, europium, terbium, thorium, hafnium, and tantalum, and took place about 30 to 40 days after irradiation. The count periods were 20,000 to 40,000 seconds. Results were reported in ppm by weight, except for sodium and iron, which were reported as oxides of the elements in weight percent.
Loss on ignition (LOI)
For analysis by LOI at the ISU Geochemical Laboratory, precisely 2 g of powdered sample weighed to within 0.0005 of a gram was placed in a clean ceramic crucible. The weight of the crucible and powder was determined and recorded. The open crucibles were heated overnight (or for about 12 hours) at 90°C. The crucibles were removed to a desiccator, cooled for 2 to 3 minutes, and reweighed. These raw weights were recorded and subtracted from the weights of the unheated cruci bles and powdered sample. The difference repre sented the weight of volatile components that are not actually part of the sample. The samples were returned to a desiccator and a muffle furnace was heated to 950°C. When the muffle furnace reached this temperature, lids were placed on the crucibles and they were heated for 1 hour. The crucibles were cooled 2 minutes, then the lids were removed and the crucibles were allowed to continue cooling in the desiccator until they reached room tempera ture (about 5 to 7 minutes). The weights of the
cooled/room-temperature crucibles were deter mined and subtracted from the raw weight of the crucible and sample determined previously. The weight difference in grams represented the LOI component of the sample. The difference was divided by the original sample weight (2±0.0005 g) and multiplied by 100. This value was reported along with the elemental oxides as LOI in weight percent.
Ion-selective electrode potentiometry (ISEP)
For analysis of Cl" by ISEP, 200 mg of pow dered sample was weighed and placed into a con fined area of the outer compartment of a Conway diffusion cell constructed of Teflon (Aruscavage, 1990). Reducing and oxidizing solutions were pre pared. The reducing solution was made of 22.6 g of potassium hydroxide (KOH) dissolved in 140 mL of deionized water (H2O) and 1.12 g of anhydrous sodium sulfite (Na2SO3). A 2.5-mL aliquot of reducing solution was pipetted into the inner com partment of the Conway diffusion cell. The oxidiz ing solution was made of 160 mL of HF added to a solution that contained 2.6 g of potassium perman ganate (KMnO4) dissolved in 50 mL of 15-percent sulfuric acid (H2SO4). A 3-mL aliquot of the oxi dizing solution was added to the outer compart ment of the Conway diffusion cell and digested the powdered sample by mixing overnight on an oscil lating platform. The evolved chlorine was con verted to Cl" by the reducing solution contained in the inner compartment of the Conway diffusion cell. Finally, the Cl" concentration was measured by ISEP. The applicable concentration range for Cl" by this method was 0.01 to 2.00 percent by weight, or 100 to 20,000 ppm by weight. Results were con verted directly to ppm by weight using the follow ing equation:
(weight percent C17100)xl, 000,000 g = ppm by weight Cl". (1)
For example,
(0.04 weight percent C17100)xl,000,000 g = 400 ppm Cl".
Fourteen solid-phase samples were selected for determination of Cl" concentration. The converted results are presented in table 3.
ANALYTICAL RESULTS
Major rock-forming element composition and trace element concentrations were determined by ICP/AES, INAA, and ISEP analysis for selected solid-phase samples. In addition, LOI analysis was used to determine the volatile component of the solid-phase samples.
Oxides of Major Rock-Forming Elements
Silicon, aluminum, titanium, manganese, cal cium, magnesium, potassium, and phosphorus were determined by ICP-AES analysis for 25 solid- phase samples. Iron and sodium were determined by INAA. Chemical composition of the samples is reported in terms of elemental oxides in units of percent by weight. The results are reported in table 2. Also listed in table 2 is the total weight percent of the volatile component of the sample (LOI). For each sample, the 11 weight percents were summed and the totals also are listed in table 2. In the solid phase, iron occurs in both ferrous and ferric form. In this report, all iron is assumed to be ferrous iron and is reported as FeO.
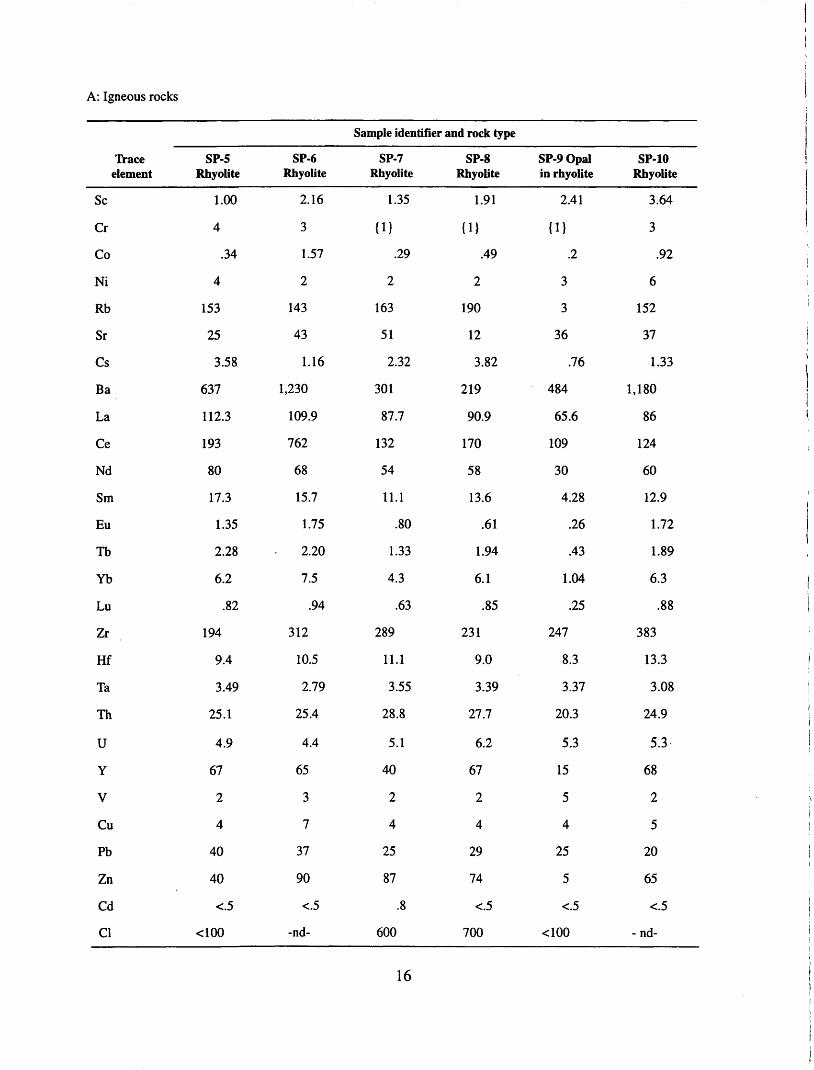
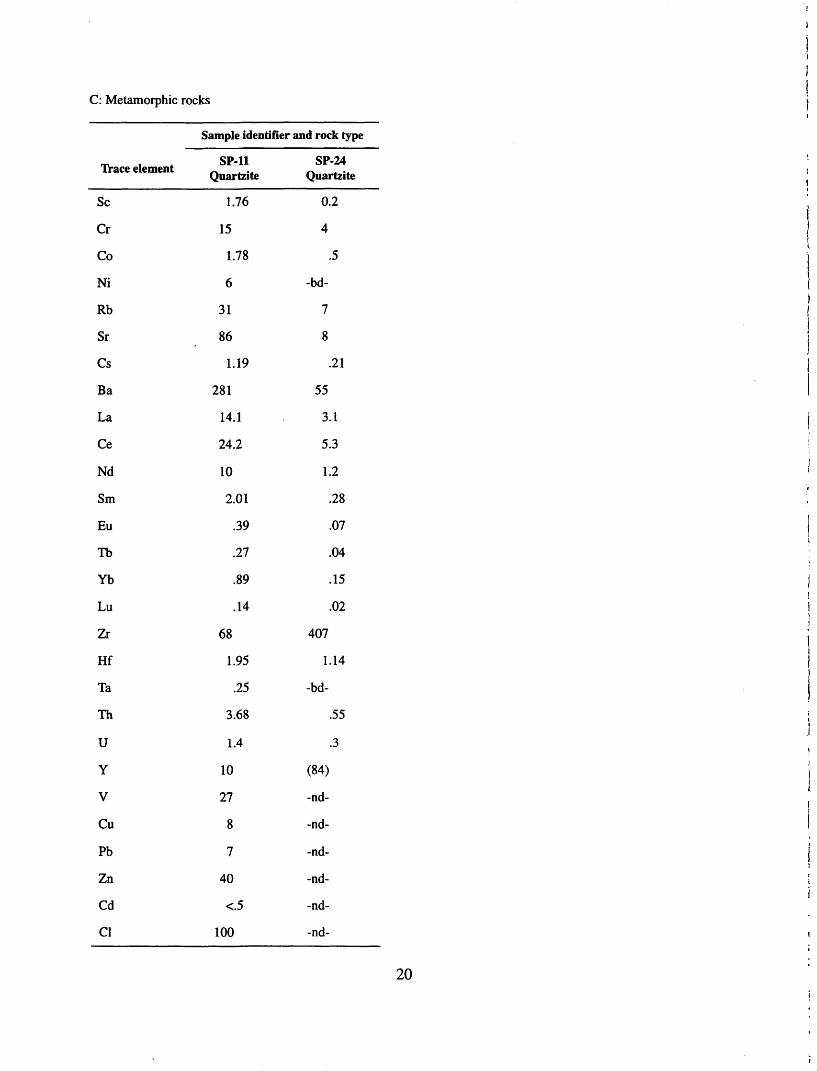
Trace Elements
As many as 28 trace-element concentrations were determined for 25 solid-phase samples by ICP/AES, INAA, or ISEP analysis. The results are reported in table 3 as ppm by weight.
SUMMARY
This report presents chemical compositions determined from 25 solid-phase samples. The 25 samples were collected at 7 selected depths from 6 coreholes and 18 outcrops located in Idaho and Wyoming. This report was prepared by the USGS, in cooperation with the DOE, Idaho Operations Office. ISU provided analytical services for this study.
Ten major elements, total volatile components, and as many as 28 trace elements were determined for each solid-phase sample by ICP/AES, INAA, LOI, or ISEP analysis.
REFERENCES CITED
Ackerman, D.J., 1991, Transmissivity of the Snake River Plain aquifer at the Idaho National Engineering Laboratory, Idaho: U.S. Geologi cal Survey Water-Resources Investigations Report 91-4058 (DOE/ID-22097), 35 p.
Anderson, S.A., and Bartholomay, R.C., 1995, Use of natural-gamma logs and cores for deter mining stratigraphic relations of basalt and sediment at the Radioactive Waste Manage ment Complex, Idaho National Engineering Laboratory, Idaho: Journal of the Idaho Acad emy of Science, v. 31, no. 1, p. 1-10.
Aruscavage, P., 1990, Determination of Cl" in geo logic materials by ion-selective electrode fol lowing KMnO4-H2SO4-HF dissolution, in Arbogast, B.F., ed., Quality assurance man ual for the Branch of Geochemistry: U.S. Geological Survey Open-File Report 90-668, p. 119-122.
Baedecker, P.A., and McKown, D.M., 1987, Instrumental neutron activation analysis of geochemical samples, in Baedecker, P.A., ed., Methods for geochemical analysis: U.S. Geo logical Survey Bulletin 1770, p. H1-H14.
Bartholomay, R.C., Knobel, L.L., and Davis, L.C., 1989, Mineralogy and grain size of surficial sediment from the Big Lost River drainage and vicinity, with chemical and physical char acteristics of geologic materials from selected sites at the Idaho National Engineering Labo ratory, Idaho: U.S. Geological Survey Open- File Report 89-384 (DOE/ID-22081), 74 p.
Cecil, L.D., Beasley, T.M., Pittman, J.R., Michel, R.L., Dubik, P.W., Sharma, P., Fehn, U., and Gove, H.E., 1992, Water infiltration rates in the unsaturated zone at the Idaho National Engineering Laboratory from chlorine-36 and tritium profiles, and neutron logging, in Khar- aka, Y.F., and Maest, A.S., eds., Water-rock interactions, v. 1: Rotterdam, A.A. Balkema, p. 709-714.
Cecil, L.D., Knobel, L.L., Green, J.R., and Frape, S.K., 2000, In situ production of chlorine-36 in the eastern Snake River Plain aquifer,
Idaho: Implications for describing ground- water contamination near a nuclear facility: U.S. Geological Survey Water-Resources Investigations Report 00-4114 (DOE/ID-22166), 35 p.
Cecil, L.D., Welhan, J.A., Green, J.R., Frape, S.K., and Sudicky, E.R., 2000, Use of chlorine-36 to determine regional-scale aquifer dispersiv- ity, eastern Snake River Plain aquifer, Idaho/USA: Nuclear Instruments and Meth ods in Physics Research B 172, p. 679-687.
Clawson, K.L., Start, G.E., and Ricks, N.R., eds., 1989, Climatography of the Idaho National Engineering Laboratory: U.S. Department of Commerce, National Oceanic and Atmo spheric Administration, DOE/ID-12118, 155 p.
Colello, J.J., Rosentreter, J.J., Bartholomay, R.C., and Liszewski, M.J., 1998, Strontium distri bution coefficients of basalt core samples from the Idaho National Engineering and Environmental Laboratory, Idaho: U.S. Geo logical Survey Water-Resources Investiga tions Report 98-4256 (DOE/ID-22153), 68 p.
Compton, R.R., 1962, Manual of field geology: New York, John Wiley and Sons, 378 p.
Fiesinger, D.W., Perkins, W.D., and Puchy, G.J., 1982, Mineralogy and petrology of Tertiary- Quaternary volcanic rocks in Caribou County, Idaho, in Bonnichsen, Bill, and Brecken- ridge, R.M., eds., Cenozoic geology of Idaho: Moscow, Idaho Bureau of Mines and Geol ogy Bulletin 26, p. 465-488.
Garabedian, S.P., 1992, Hydrology and digital simulation of the regional aquifer system, eastern Snake River Plain, Idaho: U.S. Geo logical Survey Professional Paper 1408-F, 102 p.
Honjo, Norio, 1986, Petrology and geochemistry of the Magic Reservoir eruptive center, Snake River Plain, Idaho: Houston, Tex., Rice Uni versity, M.A. Thesis, 511 p.
Honjo, Norio, and Leeman, W.P., 1987, Origin of hybrid ferrolatite lavas from Magic Reservoir eruptive center, Snake River Plain, Idaho: Contributions to Mineralogy and Petrology, v. 96, p. 163-177.
Jones, P.H., 1961, Hydrology of waste disposal, National Reactor Testing Station, Idaho, an interim report: U.S. Atomic Energy Commis sion Publication (IDO-22042), 151 p.
Knobel, L.L., Cecil, L.D., and Wood, T.R., 1995, Chemical composition of selected core sam ples, Idaho National Engineering Laboratory, Idaho: U.S. Geological Survey Open-File Report 95-748 (DOE/ID-22126), 59 p.
Kuntz, M.A., Champion, D.E., Lefevzre, R.F., and Covington, H.R., 1988, Geologic map of the Craters of the Moon, Kings Bowl, and Wapi Lava Fields in the Great Rift Volcanic Rift Zone, south-central Idaho: U.S. Geological Survey Miscellaneous Investigations Series Map 1-1632, scale 1:1,000,000.
Kuntz, M.A., and Dalrymple, G.B., 1979, Geol ogy, geochronology, and potential volcanic hazards in the Lava Ridge-Hells Half Acre area, eastern Snake River Plain, Idaho: U.S. Geological Survey Open-File Report 79-1657, 66 p.
Leeman, W.P., 1982a, Evolved and hybrid lavas from the Snake River Plain, Idaho, in Bon- nichsen, Bill, and Breckenridge, R.M., eds., Cenozoic geology of Idaho: Moscow, Idaho Bureau of Mines and Geology Bulletin 26, p. 193-202.
1982b, Olivine tholeiitic basalts of the Snake River Plain, Idaho, in Bonnichsen, Bill, and Breckenridge, R.M., eds., Cenozoic geology of Idaho: Moscow, Idaho Bureau of Mines and Geology Bulletin 26, p. 181-191.
Lichte, R.E., Golightly, D.W., and LaMothe, P.J., 1987, Inductively coupled plasma atomic emission spectrometry, in Baedecker, P.A., ed., Methods for geochemical analysis: U.S. Geological Survey Bulletin 1770, p. B1-B10.
Liszewski, M.J., Rosentreter, J.J., Miller, K.E., and Bartholomay, R.C., 2000, Chemical and physical properties affecting strontium distri bution coefficients of surficial-sediment sam ples at the Idaho National Engineering and Environmental Laboratory, Idaho: Environ mental Geology, v. 39, no. 3/4, p. 411-426.
Nace, R.L., Deutsch, Morris, and Voegeli, P.T., 1956, Geography, geology, and water resources of the National Reactor Testing Sta tion, Idaho, Part 2: Geography and geology: U.S. Atomic Energy Commission Publica tion (IDO-22033), 225 p.
Nace, R.L., Voegeli, P.T., Jones, J.R., and Deut sch, Morris, 1975, Generalized geologic framework of the National Reactor Testing Station, Idaho: U.S. Geological Survey Pro fessional Paper 725-B, 49 p.
Pace, M.N., Rosentreter, J.J., and Bartholomay, R.C., 1999, Strontium distribution coeffi cients of basalt and sediment infill samples from the Idaho National Engineering and Environmental Laboratory, Idaho: U.S. Geo logical Survey Water-Resources Investiga tions Report 99-4145 (DOE/ID-22158), 56 p.
Pittman, J.R., Jensen, R.J., and Fischer, P.R., 1988, Hydrologic conditions at the Idaho National Engineering Laboratory, 1982 to 1985: U.S. Geological Survey Water- Resources Investigations Report 89-4008 (DOE/ID-22078), 73 p.
Reed, M.F., Bartholomay, R.C., and Hughes, S.S., 1997, Geochemistry and stratigraphic correla tion of basalt lavas beneath the Idaho Chemi cal Processing Plant, Idaho National Engineering Laboratory: Environmental Geology, v. 30, no. 1/2, p. 108-118.
Shervais, John, Vetter, Scott, and Hackett, Will iam, 1994, Chemical stratigraphy of basalts in coreholes NPR-E and WO-2, Idaho National Engineering Laboratory, Idaho: Implications for plume dynamics in the eastern Snake River Plain [Abs.]: International Symposium on the Observation of the Continental Crust
Through Drilling, Vnth, Santa Fe, N. Mex., Geological Survey Professional PaperApril 25-30,1994, [Proceedings], unpagi- 1408-B, 32 p.
nated- Wood, W.W., and Low, W.H., 1988, Solutegeochemistry of the Snake River Plain
Whitehead, R.L., 1992, Geohydrologic frame- regional aquifer system, Idaho and easternwork of the Snake River Plain regional aqui- Oregon: U.S. Geological Survey Professionalfer system, Idaho and eastern Oregon: U.S. Paper 1408-D, 79 p.
10
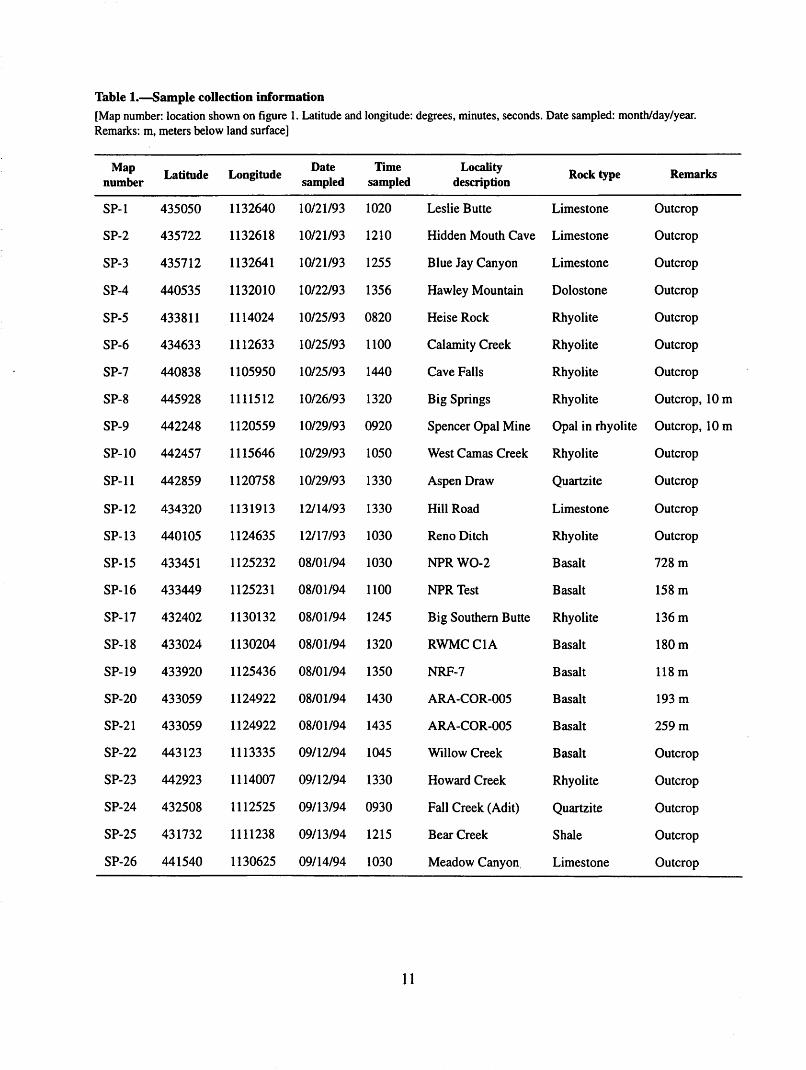
Table 1. Sample collection information[Map number: location shown on figure 1. Latitude and longitude: degrees, minutes, seconds. Date sampled: month/day/year. Remarks: m, meters below land surface]
Map number
SP-1
SP-2
SP-3
SP-4
SP-5
SP-6
SP-7
SP-8
SP-9
SP-10
SP-11
SP-12
SP-1 3
SP-15
SP-16
SP-17
SP-18
SP-19
SP-20
SP-21
SP-22
SP-23
SP-24
SP-25
SP-26
Latitude
435050
435722
435712
440535
433811
434633
440838
445928
442248
442457
442859
434320
440105
433451
433449
432402
433024
433920
433059
433059
443123
442923
432508
431732
441540
Longitude
1132640
1132618
1132641
1132010
1114024
1112633
1105950
1111512
1120559
1115646
1120758
1131913
1124635
1125232
1125231
1130132
1130204
1125436
1124922
1124922
1113335
1114007
1112525
1111238
1130625
Date sampled
10/21/93
10/21/93
10/21/93
10/22/93
10/25/93
10/25/93
10/25/93
10/26/93
10/29/93
10/29/93
10/29/93
12/14/93
12/17/93
08/01/94
08/01/94
08/01/94
08/01/94
08/01/94
08/01/94
08/01/94
09/12/94
09/12/94
09/13/94
09/13/94
09/14/94
Time sampled
1020
1210
1255
1356
0820
1100
1440
1320
0920
1050
1330
1330
1030
1030
1100
1245
1320
1350
1430
1435
1045
1330
0930
1215
1030
Locality description
Leslie Butte
Hidden Mouth Cave
Blue Jay Canyon
Hawley Mountain
Heise Rock
Calamity Creek
Cave Falls
Big Springs
Spencer Opal Mine
West Camas Creek
Aspen Draw
Hill Road
Reno Ditch
NPRWO-2
NPR Test
Big Southern Butte
RWMCC1A
NRF-7
ARA-COR-005
ARA-COR-005
Willow Creek
Howard Creek
Fall Creek (Adit)
Bear Creek
Meadow Canyon
Rock type
Limestone
Limestone
Limestone
Dolostone
Rhyolite
Rhyolite
Rhyolite
Rhyolite
Opal in rhyolite
Rhyolite
Quartzite
Limestone
Rhyolite
Basalt
Basalt
Rhyolite
Basalt
Basalt
Basalt
Basalt
Basalt
Rhyolite
Quartzite
Shale
Limestone
Remarks
Outcrop
Outcrop
Outcrop
Outcrop
Outcrop
Outcrop
Outcrop
Outcrop, 10m
Outcrop, 10 m
Outcrop
Outcrop
Outcrop
Outcrop
728m
158m
136m
180m
118m
193m
259m
Outcrop
Outcrop
Outcrop
Outcrop
Outcrop
11
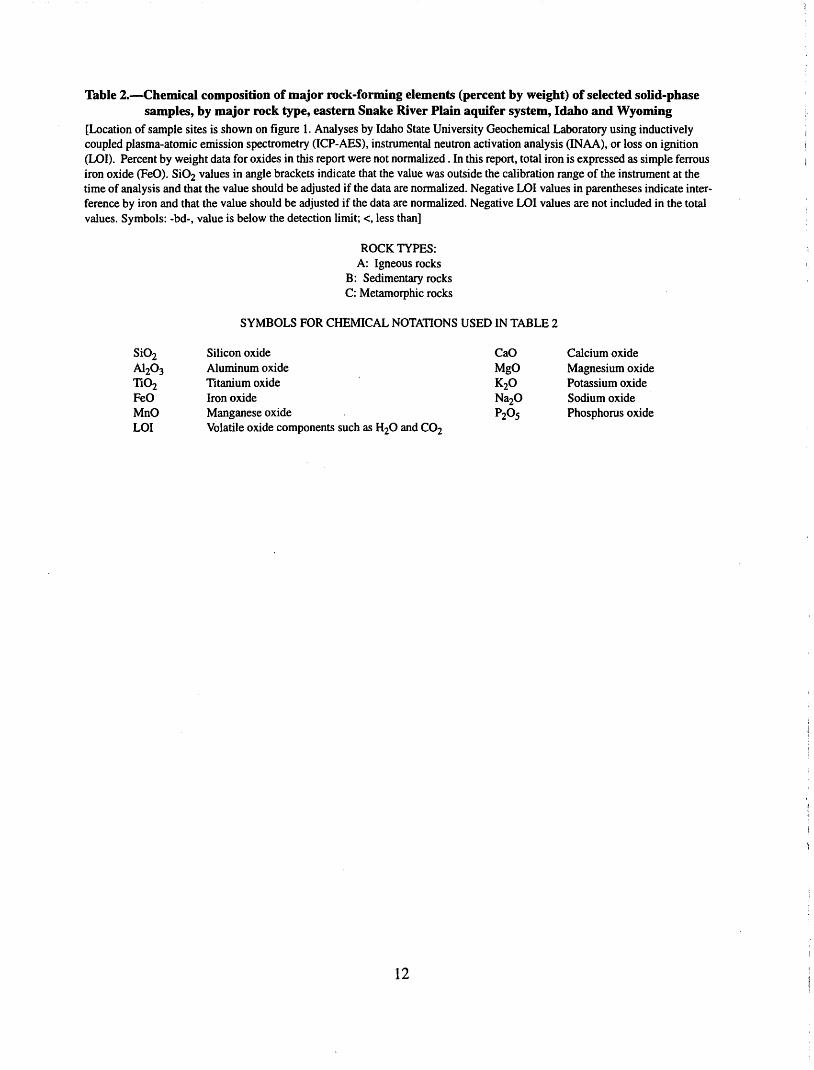
Table 2. Chemical composition of major rock-forming elements (percent by weight) of selected solid-phase samples, by major rock type, eastern Snake River Plain aquifer system, Idaho and Wyoming
[Location of sample sites is shown on figure 1. Analyses by Idaho State University Geochemical Laboratory using inductively coupled plasma-atomic emission spectrometry (ICP-AES), instrumental neutron activation analysis (INAA), or loss on ignition (LOI). Percent by weight data for oxides in this report were not normalized. In this report, total iron is expressed as simple ferrous iron oxide (FeO). SiC>2 values in angle brackets indicate that the value was outside the calibration range of the instrument at the time of analysis and that the value should be adjusted if the data are normalized. Negative LOI values in parentheses indicate inter ference by iron and that the value should be adjusted if the data are normalized. Negative LOI values are not included in the total values. Symbols: -bd-, value is below the detection limit; <, less than]
ROCK TYPES:A: Igneous rocks
B: Sedimentary rocksC: Metamorphic rocks
SYMBOLS FOR CHEMICAL NOTATIONS USED IN TABLE 2
SiO2 Sib'con oxide CaO Calcium oxideA12O3 Aluminum oxide MgO Magnesium oxideTiO2 Titanium oxide K2O Potassium oxideFeO Iron oxide Na2O Sodium oxideMnO Manganese oxide ^2^5 Phosphorus oxideLOI Volatile oxide components such as H2O and CO2
12
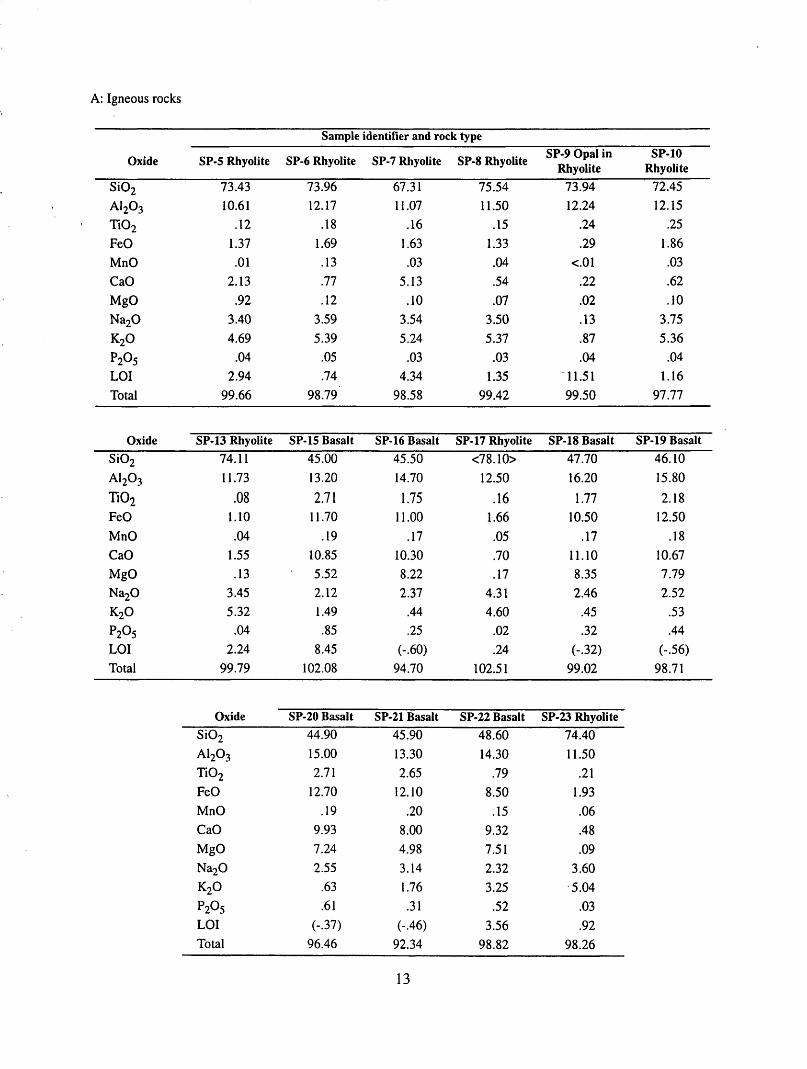
A: Igneous rocks
Sample identifler and rock type
Oxide
SiO2A12O3TiO2FeOMnOCaOMgONa2OK2OP205LOITotal
OxideSiO2A1 2O3Ti02FeOMnOCaOMgONa2OK2OP205LOITotal
SP-5 Rhyolite
73.4310.61
.121.37
.012.13
.923.404.69
.042.94
99.66
SP-13 Rhyolite74.1111.73
.081.10.04
1.55.13
3.455.32
.042.24
99.79
Oxide
SiO2A12O3TiO2FeOMnOCaOMgONa2OK2OP2°5
LOITotal
SP-6 Rhyolite
73.9612.17
.181.69.13.77.12
3.595.39
.05
.7498.79
SP-15 Basalt45.0013.20
2.7111.70
.1910.855.522.121.49.85
8.45102.08
SP-20 Basalt
44.9015.002.71
12.70.19
9.937.242.55
.63
.61(-.37)
96.46
SP-7 Rhyolite
67.3111.07
.161.63.03
5.13.10
3.545.24
.034.34
98.58
SP-16 Basalt
45.5014.70
1.7511.00
.1710.308.222.37
.44
.25(-.60)
94.70
SP-21 Basalt45.9013.302.65
12.10.20
8.004.983.141.76.31
(-.46)92.34
SP-8 Rhyolite
75.5411.50
.151.33.04.54.07
3.505.37
.031.35
99.42
SP-17 Rhyolite<78.10>
12.50
.161.66.05.70.17
4.314.60
.02
.24102.51
SP-22 Basalt48.6014.30
.798.50
.159.327.512.323.25
.523.56
98.82
SP-9 Opal in Rhyolite
73.9412.24
.24
.29<.01
.22
.02
.13
.87
.0411.5199.50
SP-18 Basalt47.7016.20
1.7710.50
.1711.108.352.46
.45
.32(-.32)
99.02
SP-23 Rhyolite74.4011.50
.211.93.06.48.09
3.605.04
.03
.9298.26
SP-10 Rhyolite
72.4512.15
.251.86.03.62.10
3.755.36
.041.16
97.77
SP-19 Basalt46.1015.80
2.1812.50
.1810.677.792.52
.53
.44(-.56)
98.71
13
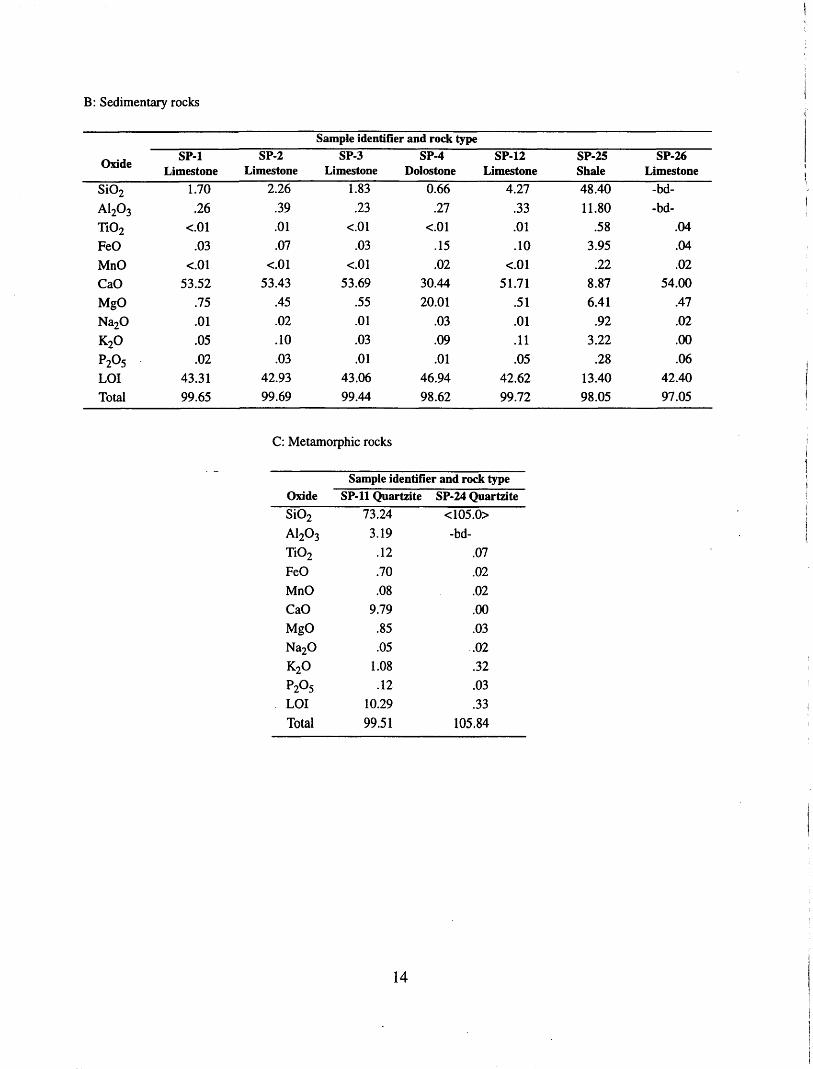
B: Sedimentary rocks
Sample identifier and rock type
Oxide
SiO2A1203Ti02FeOMnOCaOMgONa2OK2OP205LOITotal
SP-1 SP-2Limestone Limestone
1.70 2.26
.26 .39<.01 .01
.03 .07<.01 <.01
53.52 53.43.75 .45.01 .02.05 .10.02 .03
43.31 42.9399.65 99.69
SP-3Limestone
1.83.23
<.01.03
<.0153.69
.55
.01
.03
.0143.0699.44
SP-4 SP-12Dolostone Limestone
0.66 4.27
.27 .33<.01 .01
.15 .10
.02 <.0130.44 51.7120.01 .51
.03 .01
.09 .11
.01 .0546.94 42.6298.62 99.72
SP-25Shale48.4011.80
.583.95
.228.876.41
.923.22
.2813.4098.05
SP-26Limestone
-bd--bd-
.04
.04
.0254.00
.47
.02
.00
.0642.4097.05
C: Metamorphic rocks
Sample identifier and rock typeOxide
SiO2A1203TiO2FeOMnOCaOMgONa2OK2OP205LOI
Total
SP-11 Quartzite SP-24 Quartzite73.24
3.19.12.70.08
9.79.85.05
1.08.12
10.2999.51
<105.0>-bd-
.07
.02
.02
.00
.03
.02
.32
.03
.33
105.84
14
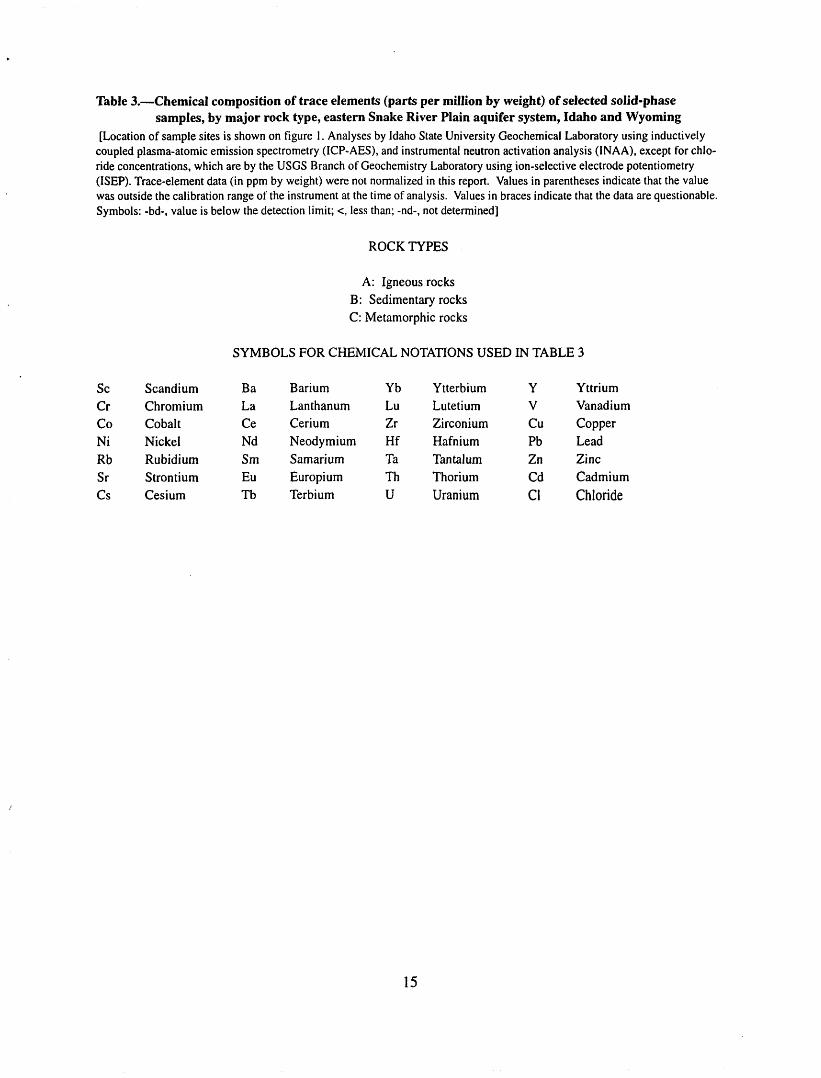
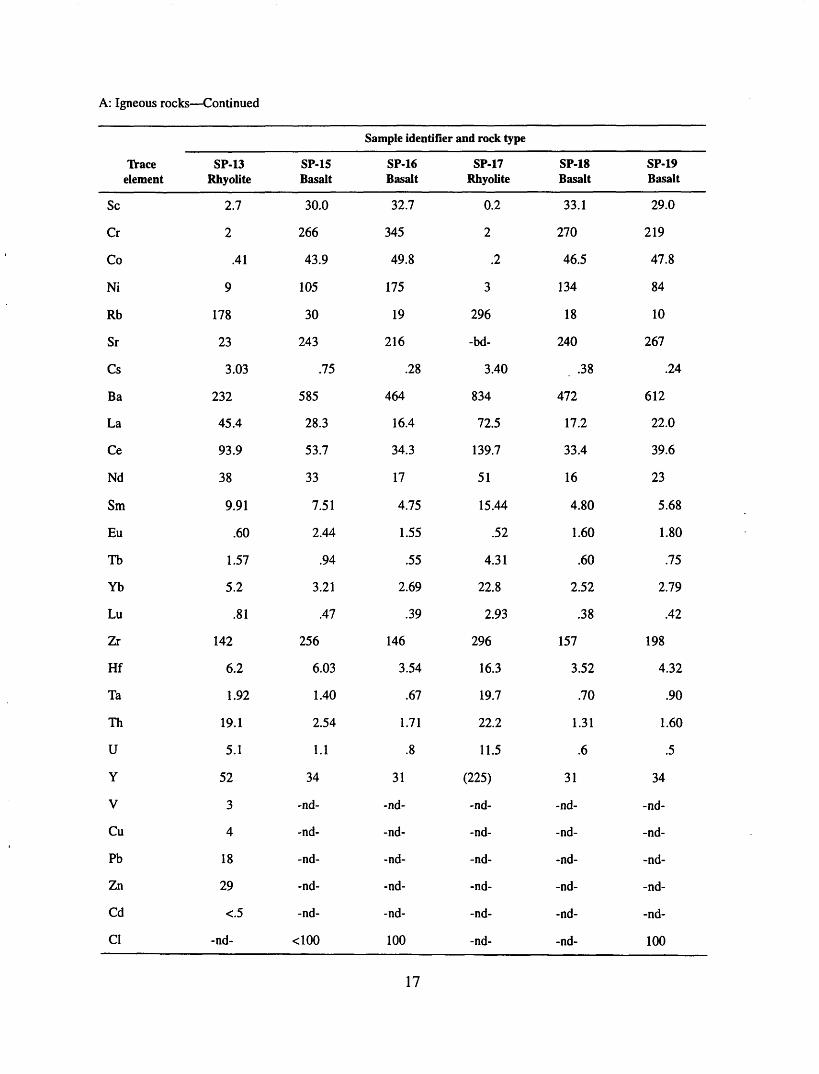
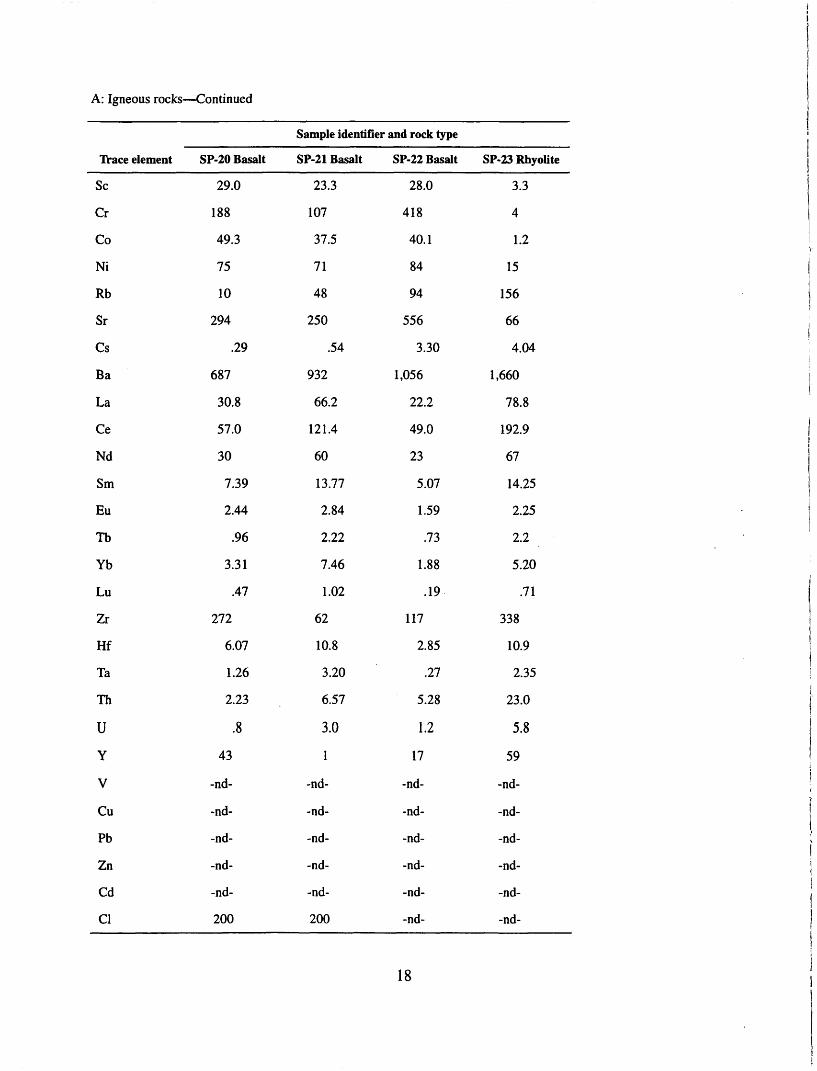
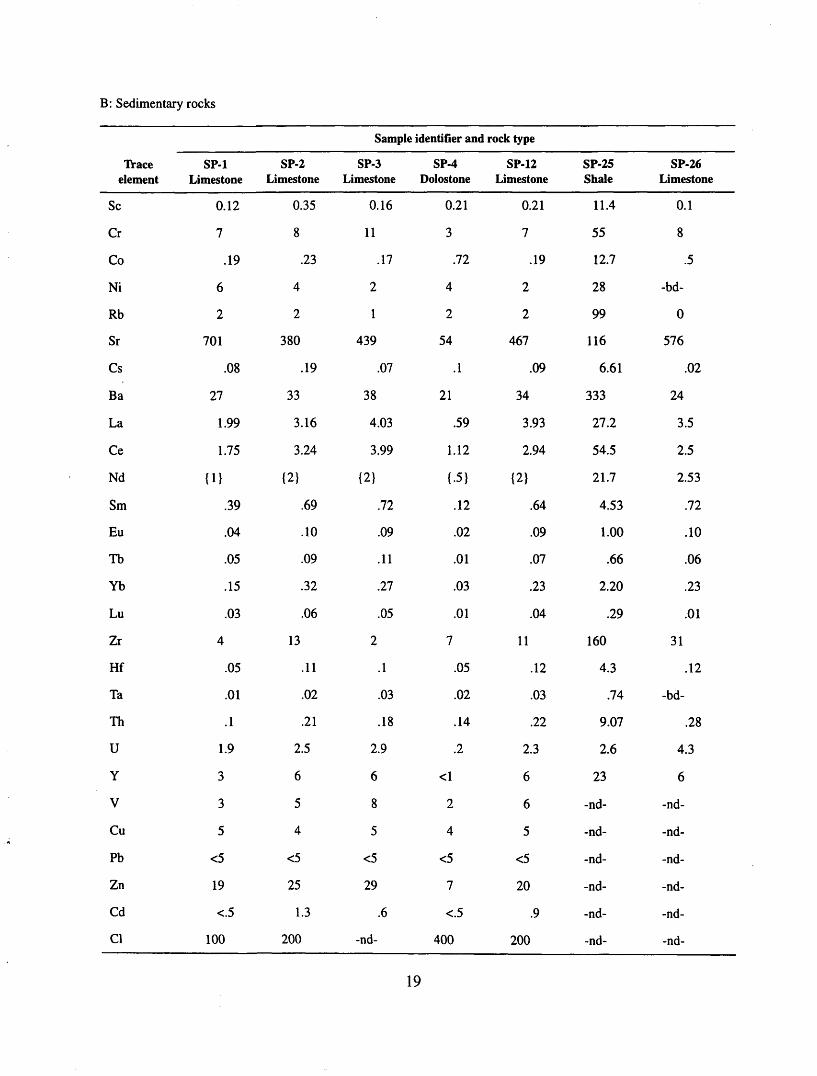
Table 3. Chemical composition of trace elements (parts per million by weight) of selected solid-phase samples, by major rock type, eastern Snake River Plain aquifer system, Idaho and Wyoming
[Location of sample sites is shown on figure 1. Analyses by Idaho State University Geochemical Laboratory using inductively coupled plasma-atomic emission spectrometry (ICP-AES), and instrumental neutron activation analysis (INAA), except for chlo ride concentrations, which are by the USGS Branch of Geochemistry Laboratory using ion-selective electrode potentiometry (ISEP). Trace-element data (in ppm by weight) were not normalized in this report. Values in parentheses indicate that the value was outside the calibration range of the instrument at the time of analysis. Values in braces indicate that the data are questionable. Symbols: -bd-, value is below the detection limit; <, less than; -nd-, not determined]
ROCK TYPES
A: Igneous rocks B: Sedimentary rocks C: Metamorphic rocks
SYMBOLS FOR CHEMICAL NOTATIONS USED IN TABLE 3
Sc Scandium Ba Barium Yb Ytterbium Y YttriumCr ChromiumCo CobaltNi NickelRb RubidiumSr StrontiumCs Cesium Tb Terbium U Uranium Cl Chloride
LaCeNdSmEu
LanthanumCeriumNeodymiumSamariumEuropium
LuZrHfTaTh
LutetiumZirconiumHafniumTantalumThorium
VCuPbZnCd
VanadiumCopperLeadZincCadmium
15
A: Igneous rocks
Sample identifier and rock type
Trace element
Sc
Cr
Co
Ni
Rb
Sr
Cs
Ba
La
Ce
Nd
Sm
Eu
Tb
Yb
Lu
Zr
Hf
Ta
Th
U
Y
V
Cu
Pb
Zn
Cd
Cl
SP-5 Rhyolite
1.00
4
.34
4
153
25
3.58
637
112.3
193
80
17.3
1.35
2.28
6.2
.82
194
9.4
3.49
25.1
4.9
67
2
4
40
40
<.5
<100
SP-6 Rhyolite
2.16
3
1.57
2
143
43
1.16
1,230
109.9
762
68
15.7
1.75
2.20
7.5
.94
312
10.5
2.79
25.4
4.4
65
3
7
37
90
<.5
-nd-
SP-7 Rhyolite
1.35
(1)
.29
2
163
51
2.32
301
87.7
132
54
11.1
.80
1.33
4.3
.63
289
11.1
3.55
28.8
5.1
40
2
4
25
87
.8
600
SP-8 Rhyolite
1.91
{1}
.49
2
190
12
3.82
219
90.9
170
58
13.6
.61
1.94
6.1
.85
231
9.0
3.39
27.7
6.2
67
2
4
29
74
<.5
700
SP-9 Opal in rhyolite
2.41
{1}
.2
3
3
36
.76
484
65.6
109
30
4.28
.26
.43
1.04
.25
247
8.3
3.37
20.3
5.3
15
5
4
25
5
<.5
<100
SP-10 Rhyolite
3.64
3
.92
6
152
37
1.33
1,180
86
124
60
12.9
1.72
1.89
6.3
.88
383
13.3
3.08
24.9
5.3
68
2
5
20
65
<.5
-nd-
16
A: Igneous rocks Continued
Sample identifier and rock type
Trace element
Sc
Cr
Co
Ni
Rb
Sr
Cs
Ba
La
Ce
Nd
Sm
Eu
Tb
Yb
Lu
Zr
Hf
Ta
Th
U
Y
V
Cu
Pb
Zn
Cd
Cl
SP-13 Rhyolite
2.7
2
.41
9
178
23
3.03
232
45.4
93.9
38
9.91
.60
1.57
5.2
.81
142
6.2
1.92
19.1
5.1
52
3
4
18
29
<.5
-nd-
SP-15 Basalt
30.0
266
43.9
105
30
243
.75
585
28.3
53.7
33
7.51
2.44
.94
3.21
.47
256
6.03
1.40
2.54
1.1
34
-nd-
-nd-
-nd-
-nd-
-nd-
<100
SP-16 Basalt
32.7
345
49.8
175
19
216
.28
464
16.4
34.3
17
4.75
1.55
.55
2.69
.39
146
3.54
.67
1.71
.8
31
-nd-
-nd-
-nd-
-nd-
-nd-
100
SP-17 Rhyolite
0.2
2
.2
3
296
-bd-
3.40
834
72.5
139.7
51
15.44
.52
4.31
22.8
2.93
296
16.3
19.7
22.2
11.5
(225)
-nd-
-nd-
-nd-
-nd-
-nd-
-nd-
SP-18 Basalt
33.1
270
46.5
134
18
240
. .38
472
17.2
33.4
16
4.80
1.60
.60
2.52
.38
157
3.52
.70
1.31
.6
31
-nd-
-nd-
-nd-
-nd-
-nd-
-nd-
SP-19 Basalt
29.0
219
47.8
84
10
267
.24
612
22.0
39.6
23
5.68
1.80
.75
2.79
.42
198
4.32
.90
1.60
.5
34
-nd-
-nd-
-nd-
-nd-
-nd-
100
17
A: Igneous rocks Continued
Sample identifier and rock type
Trace element
Sc
Cr
Co
Ni
Rb
Sr
Cs
Ba
La
Ce
Nd
Sm
Eu
Tb
Yb
Lu
Zr
Hf
Ta
Th
U
Y
V
Cu
Pb
Zn
Cd
Cl
SP-20 Basalt
29.0
188
49.3
75
10
294
.29
687
30.8
57.0
30
7.39
2.44
.96
3.31
.47
272
6.07
1.26
2.23
.8
43
-nd-
-nd-
-nd-
-nd-
-nd-
200
SP-21 Basalt
23.3
107
37.5
71
48
250
.54
932
66.2
121.4
60
13.77
2.84
2.22
7.46
1.02
62
10.8
3.20
6.57
3.0
1
-nd-
-nd-
-nd-
-nd-
-nd-
200
SP-22 Basalt
28.0
418
40.1
84
94
556
3.30
1,056
22.2
49.0
23
5.07
1.59
.73
1.88
.19
117
2.85
.27
5.28
1.2
17
-nd-
-nd-
-nd-
-nd-
-nd-
-nd-
SP-23 Rhyolite
3.3
4
1.2
15
156
66
4.04
1,660
78.8
192.9
67
14.25
2.25
2.2
5.20
.71
338
10.9
2.35
23.0
5.8
59
-nd-
-nd-
-nd-
-nd-
-nd-
-nd-
18
B: Sedimentary rocks
Sample identifier and rock type
Trace element
Sc
Cr
Co
Ni
Rb
Sr
Cs
Ba
La
Ce
Nd
Sm
Eu
Tb
Yb
Lu
Zr
Hf
Ta
Th
U
Y
V
Cu
Pb
Zn
Cd
Cl
SP-1 Limestone
0.12
7
.19
6
2
701
.08
27
1.99
1.75
{1}
.39
.04
.05
.15
.03
4
.05
.01
.1
1.9
3
3
5
<5
19
<.5
100
SP-2Limestone
0.35
8
.23
4
2
380
.19
33
3.16
3.24
{2}
.69
.10
.09
.32
.06
13
.11
.02
.21
2.5
6
5
4
<5
25
1.3
200
SP-3 Limestone
0.16
11
.17
2
1
439
.07
38
4.03
3.99
{2}
.72
.09
.11
.27
.05
2
.1
.03
.18
2.9
6
8
5
<5
29
.6
-nd-
SP-4 Dolostone
0.21
3
.72
4
2
54
.1
21
.59
1.12
{ 5}
.12
.02
.01
.03
.01
7
.05
.02
.14
.2
<1
2
4
<5
7
<.5
400
SP-12 Limestone
0.21
7
.19
2
2
467
.09
34
3.93
2.94
{2}
.64
.09
.07
.23
.04
11
.12
.03
.22
2.3
6
6
5
<5
20
.9
200
SP-25Shale
11.4
55
12.7
28
99
116
6.61
333
27.2
54.5
21.7
4.53
1.00
.66
2.20
.29
160
4.3
.74
9.07
2.6
23
-nd-
-nd-
-nd-
-nd-
-nd-
-nd-
SP-26 Limestone
0.1
8
.5
-bd-
0
576
.02
24
3.5
2.5
2.53
.72
.10
.06
.23
.01
31
.12
-bd-
.28
4.3
6
-nd-
-nd-
-nd-
-nd-
-nd-
-nd-
19
C: Metamorphic rocks
Sample identifier and rock type
Trace element
Sc
Cr
Co
Ni
Rb
Sr
Cs
Ba
La
Ce
Nd
Sm
Eu
Tb
Yb
Lu
Zr
Hf
Ta
Th
U
Y
V
Cu
Pb
Zn
Cd
Cl
SP-11 Quartzite
1.76
15
1.78
6
31
86
1.19
281
14.1
24.2
10
2.01
.39
.27
.89
.14
68
1.95
.25
3.68
1.4
10
27
8
7
40
<.5
100
SP-24 Quartzite
0.2
4
.5
-bd-
7
8
.21
55
3.1
5.3
1.2
.28
.07
.04
.15
.02
407
1.14
-bd-
.55
.3
(84)
-nd-
-nd-
-nd-
-nd-
-nd-
-nd-
20