chemical and sensory quality evaluation of newly developed...
TRANSCRIPT

CHEMICAL AND SENSORY QUALITY EVALUATION OF NEWLY DEVELOPED
TEA CLONES IN KENYA
KILEL EMILY CHERONO
A Thesis submitted to the Graduate School in partial fulfilment for the requirements of
the Master of Science Degree in Food Science of Egerton University.
Egerton University
January, 2013

ii
DECLARATION AND RECOMMENDATION
Declaration
This thesis is my original work and has not, wholly or in parts, been presented for an award
of a degree, in this or any other university.
Kilel Emily Cherono
KM16/2271/08
Signature ………………………………… Date: ……………………………………
Recommendation
This proposal is the candidate’s original work and has been prepared with our guidance and
assistance; it has been submitted with our approval as official university supervisors.
Dr. Abdul K. Faraj, PhD
Department of Dairy and Food Science and Technology,
Egerton University, P.O Box 536 - 20115, EGERTON.
Signature ………………………………… Date: ……………………………………
Dr. John K. Wanyoko, PhD
Tea Processing and Value Addition Programme (TPVA Programme),
Tea Research Foundation of Kenya, P.O Box 820 -20200, KERICHO.
Signature ………………………………… Date: ……………………………………

iii
COPY RIGHT
All rights reserved. Reproduction and dissemination of material in this thesis for
educational or other non-commercial purposes are authorized without any prior written
permission from the copyright holder provided the source is fully acknowledged.
Reproduction of material in this thesis for resale or other commercial purposes is prohibited
without written permission of the copyright holder.
© Kilel, Emily Cherono, 2013

iv
DEDICATION
I dedicate this work to my entire family and friends
v
ACKNOWLEDGEMENTS
I thank the Almighty God for his mercy and He is still sustaining me to face
challenges ahead. I salute my dear husband Mr. Bii for his overall support to me.
I acknowledge the Director, TRFK Prof. F.N. Wachira for availing me an opportunity
to conduct the research using the Foundation’s facilities.
My supervisors, Dr. J.K. Wanyoko and Dr. A. Faraj supported me unceasingly and
may God reward them here on earth and thereafter.
I acknowledge support of all staff in Dairy and Food Science and Technology for their
great support to me ever since I joined them in 2006 and Egerton University at large.
Kaisugu Tea Factory management team, Gianchore Tea Factory management team
(Rose Maraka, Mr. Mwiti, Mr. Ombae), Toror Tea Factory management team (Mr. Rono and
Mr. Rotich) and their supervisors assisted me in tasting black tea and I sincerely thank them.
Vincent Mwingirwa of KTDA Headquarters also tasted our green tea samples and I greatly
salute him.6
To Dr. S.M. Kamunya of TRFK, who exceptionally supported me during my
research, God bless you mighty. The TRFK staff right from senior staff to technical staff
overwhelmingly assisted me before, during and after research and I highly acknowledged
them.
Dr. E. Cheruiyot and Dr. J. Owuoche were resourceful during data analysis and I
highly appreciate. To my fellow Msc. students, Robert Koech, Kelvin Mosete, Dennis Gitau,
Janet Too and my Course mates, thank you for your concern. You made my life and work
easier, God bless you all.
My role models, Dr. J. Sigei (JKUAT), Mrs. Florence Bet and Mr. Alex Kirui have
been uplifting my spirit to this far, they are God sent to me, God bless them.
To all who supported and facilitated this research work in one way or another, thank you and
God bless you.

vi
ABSTRACT
A study was conducted on the newly developed purple tea clones in Kenya. Green tea quality
analyses on theanine and catechins were done using HPLC, while total polyphenols were
done using the Folin- Ciocalteu phenol reagent method. Sensory analysis was also done on
green tea samples. Plain black tea quality parameters were determined (total theaflavins and
individual theaflavins, brightness and total colour percentages, total thearubigins and
fractions and total soluble solids) for all the clones and sensory evaluation was done by
experienced tea tasters in three different tea Factories in Kericho County. Completely
randomized design with three replications was adopted for this experiment. Data analyses
were done using General Linear Model, Correlation procedures of Statistical Analysis System
(SAS, version 9.1). Means were separated by Duncan Multiple Range Test at p ≤ 0.05
significant level. Clone TRFK 91/1 had the highest theanine content of 2.18 % giving it a
flavoury taste. All the test clones had higher total polyphenol contents than the Japanese
clone Yabukita used as a standard in green tea experiment. Most test clones had lower mean
values of total catechins except for clones TRFK 73/7 and TRFK 73/4 which showed similar
total catechins like the control Yabukita with 12.15 % and 12.00 %, respectively. On the
plain black tea quality parameters, most test clones showed promising results except clones
TRFK 73/3, TRFK 73/7 and TRFK 91/1 which showed low mean values of most black tea
parameters. Clones K-Purple and TRFK 83/1 showed good quality black tea parameters. On
sensory evaluation, clones 73/3, 91/1 and TRFK 91/2 had less strength and briskness but with
flavour. Most test clones had thick liquors except TRFK 73/3, TRFK 83/1 and TRFK KS 1
which had lesser thickness. Most of the test clones also had bright liquors though with dull
infusions because of the purple colour. It was concluded that most of the test clones can make
good green tea while a few like KS 3, KS 2, 91/2, K-Purple and 14/1 can be made into black
tea.
vii
TABLE OF CONTENTS
DECLARATION AND RECOMMENDATION .................................................................. ii
DEDICATION......................................................................................................................... iv
ACKNOWLEDGEMENTS .................................................................................................... v
ABSTRACT ............................................................................................................................. vi
TABLE OF CONTENTS ...................................................................................................... vii
LIST OF TABLES .................................................................................................................. ix
LIST OF FIGURES ................................................................................................................. x
APPENDICES ........................................................................................................................ xii
LIST OF ABBREVIATIONS ............................................................................................. xiii
CHAPTER ONE ...................................................................................................................... 1
INTRODUCTION.................................................................................................................... 1 1.1 Background information .................................................................................................. 1
1.2 Statement of the problem ................................................................................................. 4
1.3 Objectives ........................................................................................................................ 4
1.3.1 General objective ...................................................................................................... 4
1.3.2 Specific objectives .................................................................................................... 5
1.4 Null hypotheses ................................................................................................................ 5
1.5 Justification ...................................................................................................................... 5
1.6 Outcome ........................................................................................................................... 6
CHAPTER TWO ..................................................................................................................... 7
LITERATURE REVIEW ....................................................................................................... 7
2.1 Chemistry of tea ............................................................................................................... 7
2.2 Tea and health .................................................................................................................. 8
2.3 Antioxidant properties of tea ........................................................................................... 9
2.4 Chemical constituents of green tea ................................................................................ 10
2.5 Anthocyanins in tea........................................................................................................ 13
2.6 Importance of anthocyanins ........................................................................................... 14
2.7 Black tea processing ...................................................................................................... 15
2.8 Plain black tea quality parameters ................................................................................. 17
CHAPTER THREE ............................................................................................................... 23
MATERIALS AND METHODS .......................................................................................... 23
3.1 Samples collection from the field .................................................................................. 23
3.2 Tea manufacture............................................................................................................. 23
3.3 Equipment, apparatus and materials .............................................................................. 23
3.4 Reagents ......................................................................................................................... 24
3.5 Determination of total polyphenols ............................................................................... 24
3.6 Determination of catechins ............................................................................................ 25
3.7 Determination of theanine in green tea .......................................................................... 26
3.8 Sensory evaluation of green tea ..................................................................................... 27
3.9 Testing of plain black tea quality parameters ................................................................ 27
3.10 Experimental design..................................................................................................... 32
CHAPTER FOUR .................................................................................................................. 33
RESULTS AND DISCUSSION ............................................................................................ 33
4.0 Introduction ................................................................................................................ 33
4.1.1 Total polyphenols.................................................................................................... 33
4.1.2 Total catechins ........................................................................................................ 34

viii
4.1.3 Non gallated catechins ............................................................................................ 35
4.1.4 Gallated catechins ................................................................................................... 37
4.1.5 Gallic acid ............................................................................................................... 39
4.1.7 Theanine .................................................................................................................. 40
4.1.8 Green tea sensory evaluation .................................................................................. 41
4.1.9 Correlation analysis ................................................................................................ 43
4.2.1 Total theaflavins...................................................................................................... 44
4.2.2 Total colour ............................................................................................................. 45
4.2.3 Brightness ............................................................................................................... 45
4.2.4 Individual theaflavins.............................................................................................. 46
4.2.5 Total thearubigins, thearubigins S I and thearubigins S II ...................................... 48
4.2.6 Total soluble solids (TSS) ....................................................................................... 50
4.2.7 Residual catechins in black tea ............................................................................... 51
4.2.8 Caffeine content ...................................................................................................... 54
4.2.9 Sensory evaluation .................................................................................................. 55
4.2.10 Correlation coefficient between the quality parameters and sensory evaluation .. 57
4.3 Discussion ...................................................................................................................... 57
CHAPTER FIVE ................................................................................................................... 65
CONCLUSIONS AND RECOMMENDATIONS ............................................................... 65
REFERENCES ....................................................................................................................... 67
APPENDICES ........................................................................................................................ 77

ix
LIST OF TABLES
Table 1: Sensory evaluation of green tea ………………………............................................42
Table 2: Correlation coefficients (r) between tea quality parameters and tasters score. N = 27
……………………………………………….. ……………………………………………...43
Table 3: Correlation coefficient matrix analyses between TPP and individual catechins. N=27
……………………………………………………………………………………….44
Table 4: Sensory evaluation of black tea ……………………………………………………56
Table 5: Matrix for tea quality parameters and tasters score. N = 75 . ………………………57
x
LIST OF FIGURES
Figure 1: Kenyan tea production and earnings trend (2007-2011) Source: Tea Board of Kenya
(2011) ......................................................................................................................................... 2
Figure 2: Chemical structures of methylxanthines .................................................................. 11
Figure 3: Chemical structures of major catechins .................................................................... 12
Figure 4: Chemical structure of L-theanine ............................................................................. 13
Figure 5: Field of anthocyanin - rich tea .................................................................................. 14
Figure 6: Catechin structures and general structure of individual theaflavins (Robertson,
1992). ....................................................................................................................................... 19
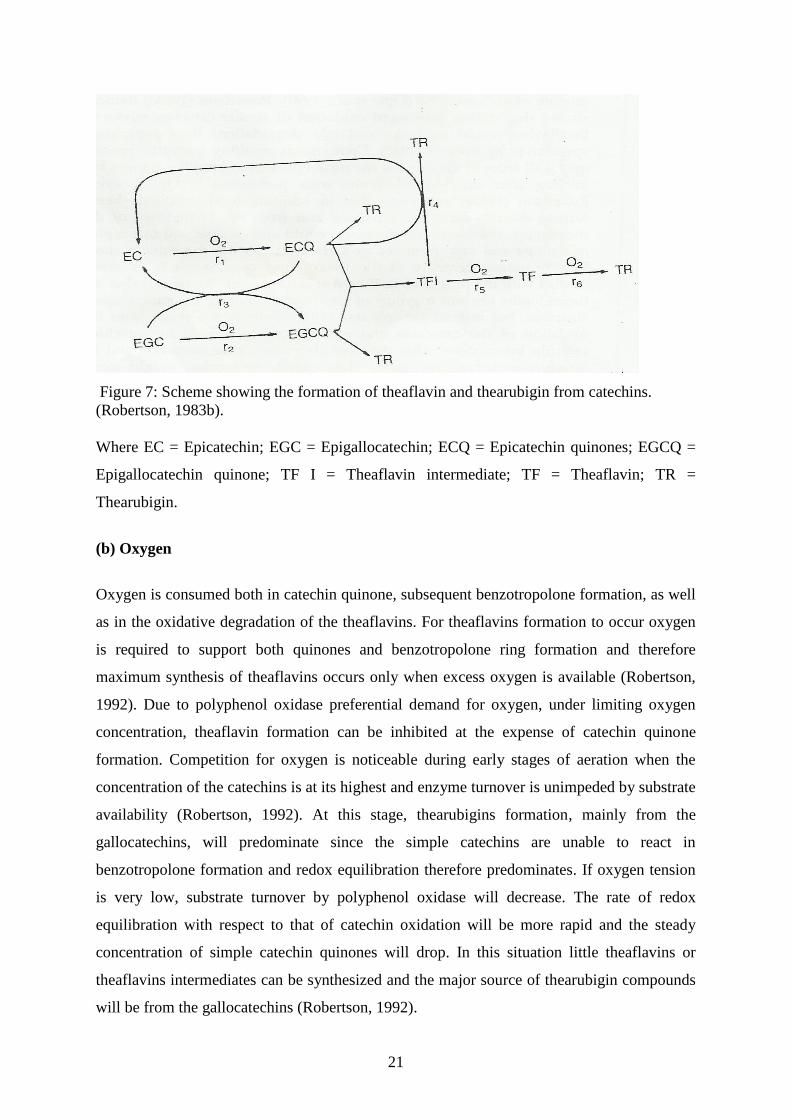
Figure 7: Scheme showing the formation of theaflavin and thearubigin from catechins.
(Robertson, 1983b). ................................................................................................................. 21
Figure 8: Modern steaming vessel used in green tea manufacture .......................................... 24
Figure 9: Display of ready- to-taste tea in a tea tasting room .................................................. 32
Figure 10: Total polyphenols content in the studied clones/varieties ...................................... 34
Figure 11: Clonal variations in total catechins in studied clones/varieties .............................. 35
Figure 12: Non gallated catechins in the studied clones / varieties ......................................... 36
Figure 13: Epigallocatechins in the studied clones/varieties ................................................... 36
Figure 14: Epicatechins in the studied clones/varieties ........................................................... 37
Figure 15: Gallated catechins in the studied clones/varieties .................................................. 38
Figure 16: Epigallocatechin gallates in the studied clones/varieties ....................................... 38
Figure 17: Epicatechin gallates in the studied clones/varieties ............................................... 39
Figure 18: Gallic acid in the studied clones/varieties .............................................................. 39
Figure 19: Caffeine content in the studied clones/varieties ..................................................... 40
Figure 20: Theanine content in the studied clones/varieties .................................................... 41
Figure 21: Total theaflavins by Flavognost method in the studied clones/varieties ................ 44
Figure 22: Total colour in the studied clones/varieties ............................................................ 45
Figure 23: Clonal variation in brightness in the studied clones/varieties ................................ 46
Figure 24: Simple theaflavins content in studied clones/varieties ........................................... 47
Figure 25: TF – 3 – monogallate content in black tea studied ................................................. 47
Figure 26: TF – 3’- monogallate content in black tea studied ................................................. 48
Figure 27: Theaflavin digallate content in studied clones/varieties......................................... 48
Figure 28: Total thearubigins and TR S I and TR S II fractions in studied ............................. 49
Figure 29: TR S I content in black tea studied......................................................................... 49

xi
Figure 30: TR S II content in black tea studied ....................................................................... 50
Figure 31: Total soluble solids content in the studied clones/varieties ................................... 51
Figure 32: Epicatechin content in the studied clones/varieties ................................................ 52
Figure 33: Epigallocatechin content in the studied clones/varieties ....................................... 52
Figure 34: Epicatechin gallate content in the studied clones/varieties .................................... 53
Figure 35: Epigallocatechin gallate content in the studied clones/varieties ............................ 54
Figure 36: Caffeine content in black tea studied ..................................................................... 55
xii
APPENDICES
Appendix I: Score sheet for green tea ...................................................................................... 77
Appendix II: Score sheet for black tea ..................................................................................... 78
Appendix III : HPLC elution of theanine in an infusion of clone TRFK 91/1 green tea......... 79
Appendix IV: HPLC elution of theaflavin fractions in an infusion of clone TRFK 6/8 black
tea ............................................................................................................................................. 80
Appendix V: HPLC elution of individual catechins in an infusion of clone 303/577 green tea.
.................................................................................................................................................. 81
Appendix VI: HPLC elution of individual catechins in an infusion of clone TRFK 6/8 black
tea ............................................................................................................................................. 82
Appendix VII: Theanine and total polyphenol (TPP) percentage in studied clones ................ 83
Appendix VIII: Clonal variation in gallic acid, caffeine and catechins (%) ............................ 84
Appendix IX: Clonal variations in individual theaflavins (µmol/g) ........................................ 85
Appendix X: Total thearubigins and their fractions in studied clones (%) .............................. 86
Appendix XI: Total soluble solids (TSS), total colour, brightness, and theaflavins (TF) ....... 87
Appendix XII: Residual catechins in black tea ........................................................................ 88
Appendix XIII: The GLM Procedure ...................................................................................... 89
Appendix XIV: The GLM Procedure ...................................................................................... 89
Appendix XV: An ANOVA Table on residual catechins on black tea.................................... 90

xiii
LIST OF ABBREVIATIONS
BOP Broken Orange Pekoe
BOPF Broken Orange Pekoe Fannings
BP I Broken Pekoe I
C Catechins
CFT Clonal Field Trial
CTC Cut Tear Curl
D I Dust I
DM Dry Matter
EC Epicatechin
ECG Epicatechin Gallate
ECQ Epicatechin Quinone
EGC Epigallocatechin
EGCG Epigallocatechin Gallate
EGCQ Epigallocatechin quinone
FBOP Flowery Broken Orange Pekoe
GDP Gross Domestic Product
HIV Human Immunodeficiency Virus
HPLC High Performance Liquid Chromatography
IBMK Isobutyl Methylketone
ISO International Organization for Standardization
JKUAT Jomo Kenyatta University of Agriculture and Technology
KTDA Kenya Tea Development Agency
LTP Laurie Tea Processor
OD Optical Density

xiv
PD Pekoe Dust
PF 1 Pekoe Fannings 1
PPO Polyphenol Oxidase
RRF Relative Response Factor
TBK Tea Board of Kenya
TC Total Catechin
TF Simple Theaflavin
TF – 3 – g Theaflavin – 3 – monogallate
TF – 3’ - g Theaflavin – 3’- monogallate
TF dg Theaflavin – 3 – digallate
TFs Theaflavins
TPP Total Polyphenol
TRs Thearubigins
TRFK Tea Research Foundation of Kenya
TR S I, TR S II Thearubigins S I type and S II type, respectively
TSS Total Soluble Solids
USD United Status of America Dollars
UV Ultra violet
1
CHAPTER ONE
INTRODUCTION
1.1 Background information
Tea (Camellia sinensis) (L.) O. Kuntze belongs to Theaceae family and is used to
process the most popular beverage worldwide after water (Wheeler and Wheeler, 2004).
Camellia sinensis consists mainly of two varieties, Camellia sinensis variety sinensis and
Camellia sinensis variety assamica (Hara et al., 1995). Tea trees can attain a height of twenty
to thirty metres in nature and its beverage is a major source of dietary flavonoids (Rijken,
2000). Tea plants are grown in a wide range of latitudes in the world, from 45 °N (Russia) to
30 °S (South Africa), and longitudes from 150 °E (New Guinea) to 60 °W (Argentina) (Hara
et al., 1995). The plant is kept as an evergreen shrub by pruning. Only the apical bud and the
first few leaves are plucked for tea processing. In tropical countries, tea leaves are harvested
all year around. In temperate countries, harvesting is seasonal. There are many different kinds
of products of different quality arising from different cultivation practices, growing
conditions and processing methods (Hara et al., 1995). Generally, tea can be broadly
classified according to the production method as unfermented tea (green tea), semi-fermented
tea (Oolong tea), fully fermented tea (black tea) or post-fermented tea (pu-erh tea) (Zhao et
al.,2006). There are other types of tea produced including white, yellow and reprocessed tea
which include flower scented tea, compressed tea, instant tea and herbal teas (Hara et al.,
1995). White and yellow teas have been regarded as two subclasses of green tea by Harbowy
and Balentine (1997). These two types of tea are different from green tea due to differences
in variety, processing, geographical and traditional distributions (Lu, 1987).
Tea was first introduced in Kenya from India by a colonial settler G.W. Caine in 1903
and in the 1930's commercial planting began (Watts, 1999). Currently Kenya is a major black
tea exporter and has one of the well established tea estates in both the smallholder grower and
large scale farms. Planted tea area in Kenya has grown from a mere 21,448 hectares in 1963
to 180,000 hectares currently (Anonymous, 2011). Tea production is split between
smallholders and large estates operated by companies such as Unilever Tea, Finlay Tea and
Eastern Produce Limited. The large plantations are organized under the Kenya Tea Growers
Association and account for about 40 % of the Kenyan tea production. Smallholders tea
farmers are organized under the Kenya Tea Development Agency (KTDA) which was set up
in 1964. KTDA operates its own tea factories and buys tea from the smallholders who

2
produce more than 60 % of Kenyan tea. Tea in Kenya is mainly grown in the Rift-valley
province in Kericho, Bomet, Sotik, and Nandi districts. In Central province tea is grown in
Kiambu, Thika, Maragua, Murang’a, Nyeri, and Kirinyaga districts, while in Eastern
province, tea is cultivated in Meru district. Kisii and Nyamira districts of Nyanza province
grow tea mainly under KTDA management. In these districts the crop experience favorable
weather patterns. The small-scale sectors in these areas have managed to achieve high quality
resulting in high auction price as compared to the multinational companies (Anonymous,
2002). Black tea is consumed worldwide, while green and Oolong teas are consumed mainly
in Asia and North Africa.
In Kenya, tea is the leading foreign exchange earner, followed by horticulture and
employs over three million people directly and indirectly. It has been established that 60 % of
Kenya’s tea is produced by over 400,000 small scale growers. Earnings from tea have been
steadily increasing every year. Kenya earned 62.1 billion shillings (US $ 774 million) from
tea exports in 2008 according to the Tea Board of Kenya (Anonymous, 2008). In 2010, tea
earnings in Kenya were 97 billion shillings compared to 69 billion shillings earned in 2009
(Anonymous, 2010). Tea production in 2010 was 399 million kg compared to 314 million kg
in 2009, accounting for increased earnings. In the year 2011, Kenya earned 109 billion
shillings from tea export which was triggered by weak shilling against the US dollars that
year (Anonymous, 2011). Summary is shown in Fig. 1.
369346
314
399
377
43
62
69
97
109
0
50
100
150
200
250
300
350
400
450
2007 2008 2009 2010 2011
YEAR
Qu
an
tity
(m
illio
n K
gs
)
0
20
40
60
80
100
120
Va
lue
(B
illio
n K
.SH
.)
QNTY
Value
Figure 1: Kenyan tea production and earnings trend (2007-2011) Source: Tea Board of Kenya
(2011)

3
Green tea (Camellia sinensis var. sinensis) originated in China where it has been used
as a beverage and medicine since 2,700 BC. Japan and China are the major green tea
producers in the world (Golding et al., 2009). In Kenya, green tea production is just emerging
so that currently very few tea factories of Unilever Tea and Finlay Tea produce green tea.
Green tea tasters, consequently, are few.
Kenya supplies 22 % of the world’s black tea and tea is the major foreign exchange
earner for the country (Anonymous, 2011), contributing about 26 % of all foreign exchange
earnings and 4 % of the gross domestic product (GDP).
World black tea production has been higher than world demand (Anonymous, 2007),
while cost of production has continued to rise (Herath and Weersink, 2007). As a result, only
producers of high quality black tea sell at reasonable prices (Anonymous, 2007). Use of
superior quality plants (Kamunya, 2003) can improve the profitability of a tea enterprise,
provided other agronomic practices are optimized (Owuor et al., 2009). Tea is still treated as
an agricultural commodity making it vulnerable to supply and demand pressures. The FAO in
2001, had predicted that Kenya would produce 304, 000 tonnes of black tea by 2010 (FAO,
2001), but in 2011, Kenya produced 377,900 tonnes (Anonymous, 2011). This shows a
higher rate of black tea production not only in Kenya but also globally. However, adverse
weather condition sometimes affects the production.
As a result of the low profits in tea enterprises, tea farmers, especially in Kenya are
yearning for clones which can fetch more money. The tea clones under study are interspecific
hybrids between tea and related Camellia species which were selected from seed plantation in
Kenya, cloned and planted at Kangaita sub-station of the Tea Research Foundation of Kenya
(Anonymous, 2006). The newly developed clones might fetch more money because of their
inherently high anthocyanin content than the commercial clones in use.
The newly developed clones include: TRFK 73/1, TRFK 73/2, TRFK 73/3, TRFK
73/4, TRFK 73/5, TRFK 73/7, TRFK 91/1, TRFK 91/2, TRFK 83/1, TRFK 14/1, K- Purple,
TRFK KS 1, TRFK KS 2 and TRFK KS 3. Most of these clones have purple red leaf
pigmentation which is due to anthocyanins. Presence of anthocyanin is a genetical
characteristic. The purple red anthocyanin pigment tends to mask the normal green colour of
chlorophyll. The clones under study were meant for value addition to the already existing tea
clones through blending but now we wish to investigate if their plain black tea quality
parameters are comparable to the released standards clones.

4
The control clones are: AHP S 15/10, TRFK 31/8, TRFK 301/1, TRFK 301/2, TRFK
6/8, TRFK 303/216, TRFK 303/577, EPK TN 14/3, GW Ejulu, ST. 543, and ST. 536 which
are released standard clones and most of them are considered the best clones for black tea.
In the tea trade, Kenyan black teas are classified as plain to medium flavoury. The
plain black teas are valued for their theaflavins content and the thearubigins. Theaflavins are
responsible for the taste, brightness and contribute to the colour of black teas. The
thearubigins are responsible for thickness and colour of both the liquors and infusion (Biswas
et al., 1973). These chemical attributes, including black tea brightness and colour are referred
to as the plain tea quality parameters (Biswas et al., 1973). Indeed theaflavins have become a
critical parameter in estimating the quality of black teas (Owuor and Obanda, 2007).
The current study aims to characterize green tea quality in terms of total polyphenols, total
catechins and theanine of the new clones against the Japanese Yabukita variety as a standard
and to determine the plain black tea quality parameters of the newly developed tea clones and
compare them with the commercially released clones chemically and through sensory
evaluation.
1.2 Statement of the problem
Currently Kenya produces mainly black tea from green tea clones which is largely
exported making Kenya the leading black tea exporter. Tea industry is currently experiencing
problems such as overproduction that is outstripping demand. Though the Mombasa auction
prices have lately improved, the cost of production has sharply increased because of escalated
fuel prices. There are, however, better prices for branded tea products and therefore Kenyan
tea industry needs to brand and diversify its tea products like producing anthocyanin rich
teas. Agronomic practices affect the quality of made tea. Little has been done to evaluate the
quality of the test clones for comparison with the existing commercial clones grown under the
same agronomical practices. The chemical parameters of the test clones need to be
ascertained before product development, hence the need for this study.
1.3 Objectives
1.3.1 General objective
The overall objective of the study was to elucidate the quality parameters of the newly
developed tea clones in Kenya.
5
1.3.2 Specific objectives
The specific objectives were;
1. To characterize green tea quality parameters; total polyphenols, total catechins and
theanine between the new clones compared to Japanese clone Yabukita.
2. To determine; (a) the total theaflavins and the ratios of the individual theaflavins in the
new tea clones and compare with the commercial clones currently in use.
(b) the total thearubigins and their fractions in the new tea clones and compare with the
commercial clones currently in use.
(c) the total soluble solids, total colour and brightness percentage in the new tea
clones and compare with the commercial clones in use currently.
(d) the residual catechins in black tea made from the test and commercial clones
3. To determine the correlation between sensory evaluation scores with the chemical
parameters in both green and black teas.
1.4 Null hypotheses
The hypotheses tested were:
1. There is no difference in the amount of total polyphenol, total catechins and theanine
between the new tea clones and Yabukita clone.
2. There is no difference between; (a) The amount of theaflavins and the ratios of the
individual theaflavins in the new tea clones and the commercial tea clones.
(b) The amount of thearubigins and their fractions in the new tea clones and the commercial
tea clones.
(c) Total soluble solids, total colour and brightness percentage of the test clones and the
commercial clones.
(d) Residual catechins in test clones and in commercial clones.
3. There is no correlation between the sensory evaluation scores with the chemical quality
parameters in both green and black teas.
1.5 Justification
The tea sub-sector has become a major foreign exchange earner in Kenya outdoing
horticulture in 2010 to become the first foreign exchange earner. Kenya is currently the
leading black tea exporter in the world. Quantification of the quality parameters of the new
tea clones will guide whether they are worth being made into black tea or green tea. Black

6
teas from these new clones could be marketed as specialty teas because of residual
anthocyanin. Quality traits of these clones such as theaflavins content, total thearubigins and
total soluble solids have not been quantified because they were developed recently. The
clones will be used as parents in the breeding programme at the Tea Research Foundation of
Kenya when their chemical and sensory qualities have been ascertained and found to be
potentially valuable. Teas from the new clones are expected to contribute to product
diversification for improved revenue generation. Green teas from the new clones will also be
sold as functional food because of anthocyanin pigment.
1.6 Outcome
The outcome of this study will include;
1. Quantifying the quality parameters of made teas (black and green) from Purple leaf
coloured teas.
2. Publication of scientific papers in refereed journals and presentation at a scientific forum.
3. Dissemination of generated data to relevant stakeholders in the tea industry.
4. Writing Master of Science thesis in Food Science.

7
CHAPTER TWO
LITERATURE REVIEW
2.1 Chemistry of tea
Tea flush (young shoots of tea) consists of the terminal bud and two adjacent leaves.
A variety of non-volatile compounds exist in fresh tea flush. These include polyphenols,
flavonols and flavonol glycosides, flavones, phenolic acids, amino acids, chlorophyll and
other pigments, carbohydrates, organic acids, caffeine and other alkaloids, minerals, vitamins,
and enzymes (Hara et al., 1995c). The chemical composition of the tea leaves depends on leaf
age, type of clone, soil and climatic conditions, and agronomic practices. The total
polyphenols in tea flush ranges from 20 % to 35 %. Flavanols which are mainly catechins are
the most important group and occupy 60–80 % of the total amount of polyphenols (Hara et
al., 1995c). Four major catechins, namely (-) - epigallocatechin-3-gallate (EGCG), (-)-
epigallocatechin (EGC), (-)-epicatechin-3-gallate (ECG), and (-) - epicatechin (EC),
constitute around 90 % of the total catechin fraction; and (+) catechin (C) and (+)-
gallocatechin (GC) constitute about 6 % of the fraction. Other minor catechins constitute less
than 2 % of the total catechins. Being water-soluble and colourless catechins contributes
astringency and bitterness in green tea (Scharbert and Hofmann, 2005). Three major flavonol
in the fresh leaf are kaempferol, quercetin and myricetin. These substances occur both as free
flavonols and as flavonol glycosides. The glycosidic group may be glucose, raminose,
galactose, arabinose and orrutinose. These compounds are considered to contribute to
bitterness and astringency in green tea (McDowell and Taylor, 1993). Amino acids constitute
around 4 % in tea flush. The most abundant amino acid is theanine (5-N-ethylglutamine)
which is unique to tea and it is found at a level of 2 % dry weight (50 % of free amino acid
fraction) ( Juneja et al.,1999). Free sugars constitute 3–5 % of the dry weight of tea flush.
They consist of glucose, fructose, sucrose, raffinose and stachyose. The monosaccharides and
disaccharides contribute to the sweet taste of tea infusion. The polysaccharides present in tea
flush can be separated into hemicellulose, cellulose and other extractable polysaccharide
fraction. Caffeine is the major purine alkaloid present in tea. The content of caffeine in tea
flush is approximately 2–5 % (dry weight basis). Theobromine and theophylline are found in
very small quantities. Traces of other alkaloids like xanthine, hypoxanthine and
tetramethyluric acid, have also been reported (Graham, 1992). Many volatile compounds,
collectively known as the aroma complex, have been detected in tea. The aroma in tea can be
8
broadly classified into primary or secondary products. The primary products are
biosynthesized by the tea plant and are present in the fresh green leaf, whilst the secondary
products are produced during tea manufacture (Sanderson and Graham, 1973). Some of the
aroma compounds, which have been identified in fresh tea leaves, are mostly alcohols
including Z-2-penten-1ol, n-hexanol, Z-3-hexen-1-ol, E-2-hexen-1-ol, linalool plus its oxides,
nerol, geraniol, benzylalcohol, 2-phenylethanol, and nerolidol (Saijo and Takeo, 1973). The
aroma complex of tea varies with the country of origin. Slight changes in climatic factors can
result in noticeable changes in the composition of the aroma complex. Notably, teas grown at
higher altitudes tend to have higher concentrations of aroma compounds and superior flavour,
as measured by the flavour index (Owuor et al., 1990). Growing tea in a shaded environment
may change the aroma composition and improves the flavour index. The aroma complex also
varies with season and these variations appear to be larger under temperate or sub-tropical
climates (Gianturco et al., 1974).
2.2 Tea and health
Tea consumption has a long history of over 2,000 years. Originated in China, drinking
tea as a habit of daily life has spread all over the world. Currently, tea is one of the most
popular beverages globally. Because tea is widely consumed by hundreds of millions of
people in a perpetual manner, the possible effects of tea on human health is of particular
importance in the field of medical, agricultural, and food research. The general view of tea
drinking has experienced a series of changes over the years. Originally in ancient China, tea
was taken as a medicine to detoxify or to cure diseases (Balentine et al., (1997). Later on, tea
was recognized as a tonic, which is beneficial to human health. In the course of development,
tea is widely accepted as a beverage. Despite those changes, tea remains a kind of medicine,
at least in part, in traditional Chinese medicine, in which tea is used alone or in most cases
used in combination with other herbs to treat a variety of disorders. Modern medical research
has found that tea and tea products display a wide spectrum of bioactivity and show
therapeutic effectiveness in a number of experimental disease models (Wolfram, 2007;
Gomes et al., 1995). The subject of bioactivity and therapeutic potential of tea and tea
products has drawn a lot of attention.
A recent study by Karori et al., (2007), found out that Kenyan black tea could
attenuate inflammation induced in Trypanosoma brucei infected mice. They showed that tea
was more efficacious than dexamethasone which is an established anti-inflammatory drug.
Some epidemiological studies have associated the consumption of tea with a lower risk of

9
several types of cancer including those of the stomach, oral cavity, oesophagus and lungs
(Hakim and Chow, 2004). Green tea polyphenols especially EGCG have been shown to be an
effective chemopreventive agent (Gosslau and Chen, 2004; Hsuu and Chen 2007). Other
health benefits, such as enhancing insulin activity (Cabrera et al., 2003), antimicrobial effect
(Stapleton, 2004; Almajano et al., 2008), antibacterial activity (Mbata et al., 2008), immuno
stimulatory effect (Matsunaga, 2002), anti-inflammatory capacities (Sato and Myata, 2000;
Karori et al., 2008), its protective effect against cardiovascular diseases (Sano, 2004; Khan
and Mukhtar, 2007) and cerebral ischemic damage (Suzuki, 2004), have been suggested.
These beneficial effects have been attributed to the presence of tea compounds such as
polyphenols, amino acids, vitamins, carbohydrates, and purine alkaloids (Bolling and Chen,
2009). Researchers have also found that Epigallocatechin gallate (EGCG), a green tea
catechin, may have anti-HIV effects when bound to CD4 receptor (Kawai, 2003). Tea has
also received a great deal of attention because of its antioxidant properties (Zhang, 2004;
Luczaj and Skrzydlewska, 2005; Gramza et al., 2006; Fu and Koo, 2006; Karori et al., 2007;
Maurya and Rizvi, 2008).
2.3 Antioxidant properties of tea
Antioxidants play an important role in the prevention of chronic diseases. Tea leaves
have high antioxidant activity (Hara et al., 1995d). Tea polyphenols can scavenge free
radicals due to possession of a phenolic hydroxyl group attached to the flavan-3-ol structure.
Hence tea has been associated with therapeutic action against free radical mediated diseases
(Amie et al., 2003). Studies have reported that green tea extract has antioxidant, antibacterial,
antiviral, anticarcinogenic and antimutagenic functions (Lin et al., 2008). Karori et al.,
(2007), compared the antioxidant activity of Kenyan black tea and popularly consumed
vegetable (spinach and onion) and showed that the antioxidant activity of tea was
significantly (P< 0.05) higher than that of the fresh unprocessed vegetable. This demonstrated
the potency of tea as health enhancing beverage.
A study done by Tsong-Ming et al., (2009), where they formulated sponge cake with
partial replacement of cake flour with up to 20 % green tea, showed that the cake had
bioactive components and pleasant tea flavour as compared to cake prepared with 100 % cake
flour. Green tea sponge cake was good in antioxidant properties. They concluded that green
tea could be incorporated into cake to have more functional components and more effective
antioxidant properties.

10
In another study done by Ercisli et al., (2008), they analyzed fresh tea leaves
sampled from Derepazari 7 clone grown in Turkey. They were investigating on the seasonal
variation of total phenolic, antioxidant activity, plant nutritional elements and fatty acids in
tea leaves of clone Derepazari 7 in three commercial harvest seasons. There were significant
differences (P < 0.05) among harvest times on antioxidant activity. The second harvest had
the highest followed by first and third harvest was last though still high. These could be
because of the effect of change of ecological parameters.
2.4 Chemical constituents of green tea
Green tea has many different components which affect the taste and therefore the quality of
the tea. These tea constituents are well characterised and can be useful for the evaluation of
tea taste quality (Caffin et al., 2004), especially in the absence of trained sensory panels. The
constituents of green tea which are of major importance to the taste of green tea are the
catechins, caffeine and an amino acid unique to tea called theanine. The catechins are
prominent compounds which give green tea its bitter and astringent taste properties (Hara,
2001). Caffeine in green tea is at levels around a third of those in coffee and is also very bitter
which adds to green tea’s sharpness. Theanine on the other hand, has a sweet and brothy taste
which counteracts the astringency and bitterness of the catechins and caffeine. The
concentrations and interactions of these different constituents in the tea will determine how
intense the tea flavours are. In general, the higher the concentrations of these components
within the tea, the more intense the tea flavours will be. However, the balance between these
components, especially between the catechins and theanine is very important for overall taste
sensation. Green tea with higher theanine fetches more money (Golding et al., 2009). There is
need therefore to screen the Kenyan clones for theanine as we try to make specific tea
products.
Tea contains several alkaloids called methylxanthines as shown in Figure 2 which
include caffeine (1, 3, 5- trimethylexanthine) and two dimethylxanthines, theophylline and
theobromine (Lin et al., 1998).
Tea leaves contain about 2 – 4 % caffeine (% dry weight) and is the major alkaloid
present in tea (Graham, 1992). The caffeine content of a typical tea beverage prepared from
2-2.5 g of tea leaves is in the range of 20-70 mg per 170 mL infusion (Caffin et al., 2004).
However, theobromine and theophyline constitute a very small percentage of tea alkaloids,
about 0.1 % (Graham, 1992). In addition to affecting the taste of tea with its sharp bitterness,

11
caffeine has mood and cognitive-enhancing properties which adds to its regard as an
important constituent of tea contributing to tea quality (Fernandez et al., 2002; Caffin et al.,
2004). Caffeine removes fatigue and sleepy feeling and has diuretic action (Snel and Lorist,
2011)
Theobromine: R1=H, R2= CH3 Caffeine: R1=R2=CH3, Theophylline: R1=CH3, R2=H
Figure 2: Chemical structures of methylxanthines
Catechins can make up to 30 % of the dry weight of fresh tea leaf extracts (Graham,
1992; Fernandez et al., 2002) and constitute 20-30 % of the dry weight of dried green tea
(Wang et al., 2000). The EGCG is considered as the most important component because it is
the most abundant catechin in tea leaves and in most green teas (Wang et al., 2000; Higdon
and Frei, 2003). The gallated catechins (EGCG, ECG) are particularly astringent while the
non-gallated catechins (EGC, EC) are far less astringent (Hara, 2001). The ECG can also
provide a bitter aftertaste while the slightly sweet aftertaste of some teas can be due to EGC
even at concentrations as low as 0.1% (w/v) in aqueous solutions (Hara, 2001). Catechins
structures are shown in Figure 3. High concentrations of catechins differentiate green tea
from black and oolong teas. In the processing of green tea, the enzyme polyphenol oxidase
(PPO) is quickly inactivated after harvest using steam in order to prevent it from oxidising
the catechins (Graham, 1992). In contrast, the processing for black tea stimulates the
oxidation of 70 % to 90 % of the catechins. In the production of oolong tea, oxidation also
occurs but it is stopped before 70 % of the catechins are oxidised.

12
(i) Epicatechin (ii) Epigallocatechin
(iii) Epicatechin gallate (iv) Epigallocatechin gallate
Figure 2: Chemical structures of major catechins
Theanine, γ-glutamylethylamide or 5-N-ethyl glutamine shown in Figure 4 is a non-
protein amino acid that was first discovered in tea leaves (Sakato, 1949). Theanine is found in
21 species from theaceae family (Ashihara et al., 2010). It is the main free amino acid in teas,
representing as much as 50 % of the total amino acids in black tea and 1–2 % of the dry
weight of green tea (Hara et al., 1995). Theanine is mainly responsible for the brothy, sweet,
and umami taste of tea and hence, plays an important role in green tea quality (Ekborg-Ott et
al., 1997). It plays an important role in the characteristic flavour, delicate taste of tea and also
shows many biological effects such as promoting relaxation, inhibiting caffeine’s negative
effects, reducing blood pressure, and enhancing anti-tumor activity (Kimura et al., 2007;
Sugiyama and Sadzuka, 2003 and Yamada and Terashima, 2009). Moreover, it has been
reported to have physiological activities including neuroprotection and anti-obesity (Cho et
al., 2008; Egashira et al., 2004 and Zheng et al., 2005).

13
L- Theanine
Figure 3: Chemical structure of L-theanine
The amino acid theanine is synthesized in the root of the tea plant with the aid of
theanine synthetase and translocated to the developing shoot tips (Ekborg-Ott et al., 1997).
Theanine is also a precursor for the biosynthesis of the catechins in tea leaves (Kito et al.,
1968). This conversion is known to be controlled by light because large quantities of theanine
accumulate instead of being converted to catechins in shaded tea leaves, and result in lower
catechin levels than that in unshaded leaves (Kito et al., 1968).
2.5 Anthocyanins in tea
Anthocyanins are members of the flavonoid group of phytochemicals and are
predominant in teas, honey, wines, fruits, vegetables, nuts, olive oil, cocoa, and cereals. The
major phytochemicals include anthocyanins like cyanidin; the flavonols like quercetin;
flavones like apigenin; flavanones like myricetin; flavan-3-ols (catechin, epicatechin,
gallocatechin) and, the isoflavones like genistein (Lila, 2004). Phytochemicals in this class
are frequently referred to as bioflavonoids due to their multifaceted roles in human health
maintenance. Anthocyanins in food are typically ingested as components of complex
mixtures of flavonoid components. Daily intake is estimated to be from 0.5g to 1g, but can be
several grams per day if an individual is consuming flavonoid supplements like grape seed
extract (Skibola and Smith, 2000).
Anthocyanins are phenolic materials, and along with catechins are important
components in the medicinal effect of tea. Purplish red tea results from an inherited reaction
to unfavourable hot and humid environmental conditions, providing the tea tree with a
mechanism for fighting scorching ultraviolet rays. In order to resist damage from this
shortwave radiation, tea leaves produce anthocyanin, which can reflect away a portion of the
ultra violet light hitting the leaves (Jansen et al., 1998).
Most of the research on anthocyanin is on fruits and recently anthocyanins were
extracted from some Kenyan tea cultivars (Kerio et al., 2011). A figure showing a field of
anthocyanin rich tea is presented in Figure 5. A review on raspberry, strawberry, blackcurrant

14
and muscadine grape juice by Tiwari et al., (2009b), showed that, the temperature during
juice extraction influences the stability of anthocyanins by affecting the enzymatic activity of
PPO, which accelerates the rate of anthocyanin degradation. Inactivation of the enzyme could
reduce the loss of anthocyanins. Polyphenol oxidase is a major enzyme found in tea and
therefore there is need to study its effect on the residual anthocyanin in black tea.
Figure 4: Field of anthocyanin - rich tea
The presence of various compounds such as ascorbic acid and other polyphenols
affects anthocyanin stability. Protective effect was observed between ascorbic acid and
retention of anthocyanins in sonicated strawberry juice as shown by Tiwari et al., (2009a). A
study by Del Pozo-Insfran et al., (2007) on the stability of high hydrostatic processed grape
juice fortified with water soluble polyphenolic cofactors from thyme (Thymus vulgaris L.),
indicated the efficacy of such additions on the stability of anthocyanins in the presence of
residual enzymatic activity of polyphenol oxidase. Copigmentation increased anthocyanin
retention.
2.6 Importance of anthocyanins
Anthocyanins are plant pigments responsible for the orange, red and blue colours
of various fruits and vegetables and are important quality indicators (Wrolstad et al., 2005).
Anthocyanins are believed to be important to plants as their colour attracts animals, leading

15
to seed dispersal and pollination. Owing to strong absorption of light, they may also be
important in protecting plants from UV-induced damage (Mazza and Miniati ,1993).
Anthocyanins are used as food colorants primarily in the beverage industry.
Consumers and food manufacturers desire colorants from natural sources since there is
increased public concern about synthetic food dyes. Synthetic dyes commonly used in the
food industry have been suspected to cause adverse behavioural and neurological effects
(McCann et al., 2007).
The low stability of these pigments, which is influenced by several factors
especially the pH of a system (low stability at high pH), limits their incorporation in foods.
They are susceptible to light, temperature and different agents like oxygen and enzymes
which can cause their degradation (Jackman and Smith, 1996).
Black carrot juice concentrate was added to enhance the colour of strawberry jams
prepared from two locally grown cultivars in Turkey, Osmanlı and Kara (Kirca et al., 2007).
The natural colorant stabilized the colour of the strawberry jam. It was also found that as the
storage temperature increased, the stability of anthocyanins decreased significantly.
Kerio et al., (2011) characterized anthocyanins in Kenyan teas and found out that the
major anthocyanin found in these teas is malvidin. The effect of this anthocyanin on tea
quality is yet to be ascertained.
2.7 Black tea processing
The general steps of processing black tea are; withering of leaves under certain
plucking standards, rolling, aerating, drying and sorting. Each step has a major influence on
the made tea quality and many chemical or physical changes occur.
2.7.1 Withering
This is the first step in processing of black tea with the major aim of reducing the moisture
content on the fresh leaves. The moisture content of green tea leaves reduces from about 80
% to about 72 % for maceration with the cut-tear-curl method. The loss in moisture makes
the leaves amenable to subsequent rolling and aeration. Many physical and biochemical
changes take place during the withering process (Hara et al., 1995; Owuor, 1996). Withering
can be divided into physical and chemical wither because of physical and chemical changes,
respectively. Usually the tea leaves are spread evenly in perforated troughs fitted with a
powerful exhaust fan underneath to draw the moisture from the tea leaves and carry the

16
humid air out of the withering area. Alternatively and especially during humid conditions, hot
air is blown from underneath the trough through the tea leaves to remove the moisture. The
physical change associated with withering is a loss of moisture from the shoot which leads to
changes in cell membrane permeability. The chemical wither involves breakdown of proteins
into amino acids and other chemical changes take place. Short chemical wither period favour
the formation of theaflavins and thus liquor brightness increases (Obanda and Owuor, 1992).
Humid conditions during withering also favour the formation of theaflavins (Obanda et al.,
1997). To ensure good quality tea, an even wither is critical (Keegal, 1950). The rate of loss
of moisture and temperature of the leaf during withering is related to surface moisture,
humidity of the air, altitude, dry-bulb and wet-bulb temperature, air flow, packing density and
whether heat is applied during withering (Johnson, 1987, 1990; Hampton, 1992).
2.7.2 Rolling
During rolling of the tea leaves, the leaves are macerated and the cell structures are
disrupted, which brings various enzymes into intimate contact with their substrates, the
polyphenols. Rolling of tea leaves may be accomplished by orthodox rollers (e. g. rotor
vanes), Lawrie Tea Processor (LTP), or crush-tear-curl (CTC) machines. Orthodox rolling is
widely used in Sri Lanka, the world’s major producer of orthodox teas (Hara et al., 1995).
India and Kenya are the major producers of CTC teas. In CTC manufacture, after
preconditioning, tea leaves are fed between a pair of stainless steel rollers with etched
surfaces, one rotating clockwise, the other anti-clockwise at different speeds. Poly phenol
oxidase enzymes are activated during rolling and their activities are enhanced with the presence of
suitable conditions like temperature, oxygen supply and moisture during rolling process. The
chemical and biochemical reactions initiated in the leaves during preconditioning proceed at
an accelerated rate during and after the rolling, before the leaves progress to the next stage of
aeration (Hara et al., 1995).
2.7.3 Aeration
The process which used to be referred to as fermentation is currently referred to as
aeration since no microorganisms are used in this kind of enzyme-oxidized black tea (Mo et
al., 2008). The ex-CTC dhool is what is aerated immediately after rolling. The high
temperature of up to 32oC is progressively reduced by subsequent supply of oxygen where
the temperature is reduced to about 22OC and maintained constant by controlling air supply.
The principal reaction in aeration is the oxidation of catechins and catechin gallates by

17
various enzymes especially polyphenol oxidase. Other enzymes like peroxidase are also
involved and some non-enzymatic reactions take place to form the unique character of black
tea (Hara et al., 1995). During the aeration process there is development of colour, strength
and quality of tea brews from the production of non-volatile compounds through the
enzymatic oxidation of catechins and their gallates to theaflavins and thearubigins (Haslam,
2003). There is also the production of volatile compounds responsible for the characteristic
aroma of black tea. The rate of aeration is profoundly influenced by genetic constitution,
seasonal and climatic factors, agronomic and management practices, and systems of
processing (Cloughley, 1980). High temperatures usually increase the rate of aeration.
2.7.4 Drying
Drying of the aerated dhool is primarily aimed at arresting the aeration through
cessation of enzymatic activity and also to reduce moisture to about 3 % dry mass. Changes
other than removal of moisture that occur during drying include a significant loss of volatile
compounds, an increase in the levels of amino acids, the binding of polyphenols to other tea
components, and an increase in carboxylic acids, and Maillard reactions. Firing at an elevated
temperature is necessary for the development of the taste, colour, and aroma of black tea
(Hara et al., 1995).
2.7.5 Sorting and grading
Sorting is done mainly to remove excess fibre in order to have clean teas. Grading
follows and it is an important stage for the marketing of tea, ensuring the correct particle size,
shape, and cleanliness. The major primary grades in Kenya are Broken pekoe 1 (BP 1), Pekoe
Fannings 1 (PF 1), Pekoe Dust (PD) and Dust 1 (D 1). In the tea trade, commonly found
grades include broken orange pekoe (BOP), flowery broken orange pekoe (FBOP), and
broken orange pekoe fannings (BOPF) (Hara et al., 1995).
2.8 Plain black tea quality parameters
Black teas are obtained from aerated green leaf while green teas are from un aerated
green tea leaf. Plain black tea quality parameters are; theaflavins, thearubigins, total colour
and brightness (Owour and Obanda, 2001). Theaflavins and thearubigins are black tea
polyphenols which occur when the tissue is deliberately damaged during cutting (Haslam,
2003). Theaflavins are bright and orange-red while thearubigins are more chemically

18
heterogeneous and tend to be brownish-red (Brown et al., 1969)). Together, these compounds
and flavonol glycosides (McDowell et al., 1991) give black tea liquor most of its taste and
colour.
2.8.1 Theaflavins
These are products formed by the enzymatic oxidation and condensation of catechins
with dihydroxylated and trihydroxylated B rings. Four major individual theaflavins are
commonly formed during black tea processing. These include simple theaflavin (TF),
theaflavin -3-monogallate (TF-3-g), theaflavin –3′-monogallate (TF-3′-g) and theaflavin-3,
3′-digallate (TFdg).
The total theaflavins (Wright et al., 2002), or derived theaflavin digallate equivalents
(Owuor and Obanda, 1997), have a dominant effect on the quality of black teas. The content
of total theaflavins in black tea does not usually exceed 2 % and can be as low as 0.3 %
(Balentine et al., 1997). Graham (1992) reported that theaflavins ranged 1.5-2.5 % in the dry
leaf. An analysis of commercial tea samples from Sri Lanka, Kenya, India and other countries
in the German market found that, the total theaflavins range 0.45-1.45 %, with an average of
0.92 % (Steinhaus and Engelhardt, 1989). A study on the commercial black tea from the
Kenyan market showed a range of total theaflavins from 1.89-2.27 %, with an average of
2.14 % (Owuor and Obanda, 1995). The formation of a single theaflavin molecule requires a
dihydroxy and a trihydroxy flavan-3-ol, as follows:-
Epicatechin (EC) + Epigallocatechin (EGC) = simple theaflavin (TF).
EC + Epigallocatechin gallate (EGCg) = Theaflavin-3-gallate (TF-3-g)
Epicatechin gallate (ECG) + EGC = Theaflavin-3’-gallate (TF-3’- g)
ECG + EGCg = Theaflavin-3, 3’-digallate (TF dg)
Thus the ratio of dihydroxy flavan-3-ol to trihydroxy flavan-3-ol in green leaf may have a
major influence on the amount of theaflavins in black tea. The correct balance and amount of
dihydroxy flavan-3-ol and trihydroxy flavan-3-ol are therefore necessary to ensure maximum
formation of the theaflavins (Wright et al., 2002). The amount of the individual theaflavins
formed are largely influenced by the amount of the precursor catechins in green leaf, their
redox potential and/or affinity for polyphenol oxidase and activity (Owour and Obanda,
2007).

19
Obanda et al., (2001), confirmed the formation of individual theaflavins according to
(Robertson, 1992) as shown in Figure 18.
O
OH
HO
OH
OH
OH
(+) Catechin (C)
O
OH
HO
OH
OH
OH
(-) Epicatechin (EC)
O
OH
HO
O
OH
OH
OH
OH
HO
O
O
OH
HO
OH
OH
OH
(-) Epicatechin gallate (ECG)
OH
(-) Epigallocatechin (EGC)
O
OH
HO
O
OH
OH
OH
OH
HO
O
OH
(-) Epigallocatechin gallate(EGCG)
HO
OH
O
O
OHO
OH
OR2
H
H
OR1
H
H
Theaflavins
TF: R1 = R2 = H ;TF-3-g: R1=H, R2= 3,4,5 trihydroxybenzoyl; TF-3’-g: R1= 3,4,5
trihydroxybenzoyl,R2= H; TF dg: R1=R2=3,4,5 trihydroxybenzoyl
Figure 6: Catechin structures and general structure of individual theaflavins (Robertson,
1992).

20
2.8.2 Thearubigins
Thearubigins is a collective name for the brown acidic pigments or the coloured
phenolic oxidation products that remains after removing of the yellow neutral pigments from
a black tea liquor (Millin, 1987). Their molecular weight and spectral characteristics are
known to be very heterogeneous. The thearubigins constitute between 10 and 20 % of the dry
weight of black tea (Roberts, 1962) and represent approximately 30-60 % of the solid in
liquors after infusion. Although thearubigins have not been fully characterised, it is clear that
this complex consists of a group of polymers with various properties. It is therefore likely that
the complex will be fully elucidated and characterised in the near future with the further
development of modern analytical techniques.
2.8.3 Factors affecting the formation and degradation of theaflavins and thearubigins
(a) Coupled oxidation
The catechins will undergo rapid redox equilibration after they are enzymatically oxidized to
their respective o-quinones because they are extremely effective electron carriers (Roberts,
1983b). This process will create an imbalance of simple quinones relative to gallocatechin
quinones drastically affecting the formation of the theaflavins which ideally require equal
concentrations of di- and trihydrolated catechins. These factors are fundamental in directing
the majority of the catechins, particularly the gallocatechins into the thearubigin fractions.
Theaflavins reduction can further be exacerbated by inherently lower levels of simple
catechins relative to gallocatechins in green tea shoots (Robertson, 1983b). As shown in
Figure 19 below, any factor which increases the rate of catechin quinone formation above
that of redox equilibration will also increase the ratio of simple to gallocatechin quinones and
thus enhance theaflavins formation. Oxygen concentration, polyphenol oxidase activity,
changes in the concentrations of the individual catechins, pH and temperature, have all been
shown to affect these rate constants (Robertson, 1983b).
21
Figure 7: Scheme showing the formation of theaflavin and thearubigin from catechins.
(Robertson, 1983b).
Where EC = Epicatechin; EGC = Epigallocatechin; ECQ = Epicatechin quinones; EGCQ =
Epigallocatechin quinone; TF I = Theaflavin intermediate; TF = Theaflavin; TR =
Thearubigin.
(b) Oxygen
Oxygen is consumed both in catechin quinone, subsequent benzotropolone formation, as well
as in the oxidative degradation of the theaflavins. For theaflavins formation to occur oxygen
is required to support both quinones and benzotropolone ring formation and therefore
maximum synthesis of theaflavins occurs only when excess oxygen is available (Robertson,
1992). Due to polyphenol oxidase preferential demand for oxygen, under limiting oxygen
concentration, theaflavin formation can be inhibited at the expense of catechin quinone
formation. Competition for oxygen is noticeable during early stages of aeration when the
concentration of the catechins is at its highest and enzyme turnover is unimpeded by substrate
availability (Robertson, 1992). At this stage, thearubigins formation, mainly from the
gallocatechins, will predominate since the simple catechins are unable to react in
benzotropolone formation and redox equilibration therefore predominates. If oxygen tension
is very low, substrate turnover by polyphenol oxidase will decrease. The rate of redox
equilibration with respect to that of catechin oxidation will be more rapid and the steady
concentration of simple catechin quinones will drop. In this situation little theaflavins or
theaflavins intermediates can be synthesized and the major source of thearubigin compounds
will be from the gallocatechins (Robertson, 1992).

22
(c) Temperature
Significant interactions exist between aeration duration, temperature and all plain
black tea quality parameters as reported by Owour and Obanda (2001). Obanda et al, (2001),
found out that theaflavins formed over time was dependent on temperature. Ngure et al.,
(2008) showed that unequal depletion ratios of di- and trihydroxylated catechins led to a
decline in total theaflavins and an increase in thearubigin levels. An equitable decline in both
groups of catechins corresponded to a subsequent rise in theaflavins content. The decline in
the catechins levels was much faster at higher temperature resulting in a shorter aeration time
to achieve a peak of the theaflavins content. In the same study by Ngure et al., (2008), it was
found out that raising the aeration temperature increases enzymatic oxidation leading to a
faster depletion of all catechins. Thearubigins percentage increases with aeration temperature
and duration. The rate of formation of chemical quality parameters within aeration
temperature and time is clonal dependant (Ngure et al., 2008). At low temperature, redox
equilibration plays the lead role with the steady state concentration of simple catechin
quinones being dependent on polyphenol oxidase activity. Tea shoots, inherently low in
polyphenol oxidase, may therefore produce improved quality black tea at higher
temperatures, while those having high enzyme activity will produce higher theaflavins to
thearubigin ratios provided enzyme concentration is not so high as to restrict the availability
of oxygen for benzotropolone ring formation.
(d) pH
Aeration pH has a major effect on the composition of the pigmented polyphenols with
theaflavins and thearubigins formation having specific optimum pH at 5 and 6, respectively
(Robertson, 1983a). This effect is due to the availability of simple catechin quinones and is
facilitated by virtue of differences in enzyme substrate specificity at these two pH values and
possibly redox equilibration reactions.

23
CHAPTER THREE
MATERIALS AND METHODS
3.1 Samples collection from the field
Fresh tea leaves for the study were plucked from a Clonal Field Trial (CFT), from the
Kangaita sub- station field of TRFK planted in 1999 at Kirinyaga, (0o26” south and 37
o 15”
east elevation 2020 m above mean sea level). The CFT consisted of all the commercial clones
and putative test clones planted in three replicated plots. Most commercial clones are the
released standard clones while the putative test clones are the ones under study yet to be
released to tea farmers.
3.2 Tea manufacture
Young tender shoots of the youngest two leaves and a bud were harvested and processed into
green and black tea. Green tea (unaerated) were manufactured by steaming the leaf at 100oC
for 1 min, macerated and dried at 120 – 150 oC in a fluidized bed drier ( Tea Craft, UK) for
30 min. Black tea was manufactured by physically withering the leaf for 18 – 22 h to reduce
moisture content to between 50 % and 65 % and macerated using a Crush, Tear and Curl
(CTC) machine. The crushed leaf was then aerated for 90 min and then dried at the same
temperature as for green tea. Both tea products were then milled and stored at 25oC in sealed
aluminium packets for further analysis.
3.3 Equipment, apparatus and materials
The following equipment were used; analytical balance capable of weighing to an accuracy
of ± 0.001 g, vortex mixer, volumetric flasks, stainless steel electric kettle, 475ml thermos
flasks, test tubes, conical flasks, pipettes, measuring cylinders , aluminium dishes, Cecil
Digital grating spectrophotometer CE393 series 2 ( Cambridge, England), aluminium dishes,
mechanical shaker, hot plate, Whatman 541 filter papers, markers, cotton wool, aluminium
lined sachets, centrifuge (capable of 2000 Relative Centrifugal Force (typically 3500 r/min),
extraction tubes, HPLC , vials, oven at 103 ± 2oC and magnetic stirrer

24
Figure 8: Modern steaming vessel used in green tea manufacture
3.4 Reagents
The following reagents were used; Isobutyl methyl ketone (IBMK), ethanol, oxalic acid,
distilled water, methanol. Flavognost reagent, ethyl acetate, Sodium hydrogen carbonate (1%
and 2.5%), anti-bumping granules, 1 % acetic acid, acetonitrile, Folin-Ciocalteu phenol
reagent, Gallic acid, Sodium carbonate, L – theanine standard and caffeine standard
3.5 Determination of total polyphenols
Tea sample of a coarse granular structure were milled before analysis. A sample
weighing 2 g was put on a pre-weighed aluminium dish and left for 16 hours in an oven at
103oC ± 2
oC to dry for the determination of dry matter. For analysis, 0.2g was weighed into
an extraction tube. Five millilitres of hot 70 % v/v methanol/distilled water was dispensed
into the sample as an extraction mixture and vortexed. Heating of the extraction tube was
continued in the water bath maintained at 70oC for 10 minutes with mixing in the vortex
mixer after every 5 minutes (the sample is vortexed at zero minute, after 5 minutes and after
10 minutes). The samples were then centrifuged at 3500 revolution per minute (rpm) for 10

25
minutes. The supernatant was decanted into a graduated tube and the extraction procedure
repeated. The extracts were combined and made up to 10ml with cold 70 % methanol/water
mixture.
The Folin-Ciocalteu phenol reagent method was used to determine total polyphenols
as described by Pourmorad et al., (2006).The reagent was used because it contains
phosphotungistic acid as oxidants. One millilitre of the sample extract was transferred to a
100ml volumetric flask and topped to the mark with distilled water and mixed. One millilitre
of the diluted sample extract was transferred in duplicate into separate tubes. Five millilitre of
ten percent (10 % v/v) of dilute Folin-Ciocalteu reagent was pipetted into each tube and
mixed. Within 3 - 8 minutes after addition of the Folin-Ciocalteu phenol reagent, 4ml of 7.5
% w/v sodium carbonate solution was added to each tube then a stopper was fitted and mixed
well. The mixture was allowed to stand at room temperature for 60 minutes and then optical
densities (OD) measured using a CE 393 Cecil digital grating spectrophotometer set at
765nm. A calibration curve was obtained for gallic acid over a concentration range of
10μg/ml to 50µg/ml. The OD readings of the test samples were referenced to the calibration
curve to determine the total polyphenols content of the tea samples.
3.6 Determination of catechins
Sample preparation procedure is just like for total polyphenols as described above. A
modified HPLC method of (Zuo et al., 2002) was used to assay for the tea catechins. A
Shimadzu LC 20 AT HPLC system fitted with a SIL 20A auto sampler and a SPD-20 UV
visible detector with a class LC 10 chromatography workstation was used for analysis of the
prepared samples. A Gemini 5 Um C6- phenyl, 250mm x 4.6 mm (Phenomenex, Torrance,
CA, USA) separation column with a Reodyne precolumn filter disk was used. A gradient
elution was carried out using the following solvent system: Mobile phase A
(acetonitrile/acetic acid/ double distilled water – 9/2/89 v/v/v), mobile phase B
(acetonitrile/acetic acid/ double distilled water – 80/2/18 v/v/v). The mobile phase
composition for a binary gradient condition started at 100% solvent A for 10 minutes then
over 15 minutes a linear gradient to 60 % mobile phase A ,32 % mobile phase B and held at
this composition for 7 minutes. The condition was reset to 100 % mobile phase A and then
allowed to equilibrate for 10 minutes before the next injection. The flow rate of mobile phase
was 1 ml/min and the temperature in the column was maintained at 35±0.50C.

26
The identification of individual catechins was carried out by comparing the retention times
and UV – absorbance of unknown peaks with peaks obtained from the mixed known catechin
standards under the same conditions. The quantification of catechins was performed at
278nm and was achieved using a caffeine standard with a calibration curve R2
= 0.9984 in
conjunction with the consensus individual catechin relative response factor (RRF) values
with respect to caffeine calculated on a dry matter basis. Total catechin as percentage by mass
on a sample dry matter basis was given on the summation of individual catechins.
% Total catechins = [% ECG + % EC + % ECCG + % C] content
3.7 Determination of theanine in green tea
One gram of finely ground green tea sample was weighed into a 200 ml beaker and
100ml of boiling double distilled water added then allowed to brew for 5 minutes in a
magnetic stirrer (500 rpm). The tea brew was allowed to cool down and made to volume with
cold double distilled water before putting the extract in vials ready for analysis.
Standard stock solution- 50mg of pure L-theanine was weighed into a 50ml volumetric
flask and dissolved with double distilled water by aid of sonication and made to volume with
double distilled water. This stock solution was diluted with double distilled water to prepare
the standard working solutions in the concentration range of 20-80 mg/L.
An ISO developed HPLC method was used to essay for the green tea theanine. A
Shimadzu LC 20 AT HPLC system fitted with SIL 20A auto sampler and a SPD-20 UV
visible detector with a class LC 10 chromatography workstation was used for the analysis. A
reverse phase 18 column (phenomenex Aqua 250 x 4.6 mm i.d) was used. Injection volume
was 20µL and detection wavelength was 210nm. A gradient elution was carried out using the
following solvent system: Mobile phase A (double distilled water), mobile phase B (100 %
acetonitrile). Analysis time was 10 minutes with 100 % mobile phase A, and then the next 8
minutes was wash time with 20 % mobile phase A and 80 % mobile phase B. The next 20
minutes was conditioning with 100 % mobile phase A before the next injection. The flow rate
of mobile phase was 1ml per minute and the temperature in the column was maintained at 35
± 0.50C. Theanine peak eluted at the sixth minute after injection. To calculate theanine, a
theanine calibration graph was drawn using concentration of theanine in the working
solutions against theanine peak area and calibration line slope and intercept value ( m and b
27
as in y=mx + b) were obtained. The theanine content, Wtheanine , expressed as a percentage by
mass on a sample dry matter basis, is given by the following formula;
Wtheanine = [(Asample – bintercept) x Vsample x d x 100] / [mstd x Msample x 10000 x wDM,sample]
Where
Asample is the peak area obtained for the sample test solution;
bintercept is the y – intercept;
mstd is the slope obtained from the best – fit linear calibration;
Msample is the mass, in grams of the sample test portions;
d is the dilution factor used prior to the injection on to an HLPC;
wDMsample is the dry matter content, expressed as a mass fraction in percent of the test
sample determined as; 2 grams of the sample was put into aluminium dishes and heated in an
oven at 103 ± 20 C for 16 hours to constant weight. The percentage dry matter (DM) in the
sample was then calculated when all the moisture has been removed. Dry matter was
necessary since all the parameters are expressed on dry weight basis.
3.8 Sensory evaluation of green tea
Five grams of the sample were transferred to infusion cup and boiling water added,
covered and left to steep for five minutes. It was then filtered into infusion bowl and the
residue (infusion) was collected on the infusion cup lid. Both the liquor and infusion were
then analysed accordingly. The liquor was sipped by the taster with a spontaneous breath
which brought the liquor in contact with the tongue and other parts of the mouth, sensitive to
astringency and flavour. The tasters were allowed to describe the quality then scoring was
done using the score sheet shown in Appendix I.
3.9 Testing of plain black tea quality parameters
3.9.1 Dry matter content
Black tea weighing approximately 2 grams was put into aluminium dishes and heated
in an oven at 103 ± 20 C for 16 hours to constant weight. The percentage dry matter (DM) in
the sample was then calculated when all the moisture has been removed. Dry matter was
necessary since all the parameters are expressed on dry weight basis.
28
3.9.2 Total theaflavins content analysis
Flavognost method (Hilton, 1973), was used to determine total theaflavins content. A
tea infusion was made by adding 375 ml boiling distilled water into a vacuum flask with 9 g
of black tea and shaken for ten minutes in a mechanical shaker. The infusion was filtered
through a cotton wool into a flat bottomed flask and allowed to cool to room temperature
before pipetting 10 ml of it into a 25 ml volumetric flask. Addition of 10 ml of IBMK was
done before shaking for 15 minutes and the mixture transferred to a test tube so as to allow
layers to separate. From the upper layer, 2 ml was pipetted into a test tube then 4 ml ethanol
and 2 ml flavognost reagent was added and the mixture was shaken in a vortex mixer for 2
minutes before allowing colour development for 15 minutes. Absorbance was read at 625 nm
after setting the machine with blank of ethanol/IBMK (1: 1 v/v).
Theaflavin (µmol/g) = A625nm x 47.9 x 100/DM
The factor 47.9 is a conversion factor attributed to the dilution effect in theaflavins analysis
3.9.3 Individual theaflavins ratios determination
High performance liquid chromatography (HPLC) with reverse phase C18 ODS
column was used to determine the ratios of individual theaflavins (Mcdowell et al., 1991).
Using a 475ml thermos flask, 4g of milled black made tea was weighed and a tea infusion
was made with 200ml boiling double distilled water. Shaking for ten minutes was done
before filtering through a cotton wool into a 250ml conical flask. Dilution of 1:1 with double
distilled water was done then 20 µL was injected onto HPLC. The wavelength was set at
378nm and flow rate was set at 1.5ml/min. Solvent A was 1% acetic acid while acetonitrile
was solvent B. A linear gradient from 8 % to 31% solvent B over 60 minutes was used
(Bailey et al., 1990). The total amount of theaflavins was allocated to the individual
theaflavins, according to the ratios determined by HPLC, assuming the molar absorption
coefficients of the four theaflavins are similar at 378nm (Steinhaus and Engelhardt, 1989).
Individual theaflavin in µmoles/g = (its peak area/Total peak area)* TFµmoles/g of that clone
determined by Flavognost method.
3.9.4 Total colour measurement
The tea infusion of 1ml (9 g black tea in 375ml boiling distilled water in a thermos
flask) was mixed with 9ml of distilled water and topped with methanol in a 25ml volumetric

29
flask. Its optical density (E) was read at 460nm using the 1ml cell. Distilled water was used
as blank.
% Total colour = 6.25 x 4E x DM %
3.9.5 Total thearubigins (TR) and fractions (TR S1 and TR S11) measurement
Roberts and Smith method (1963) was used to determine total thearubigins. Four
solutions were made (solution A, B, C and D). First, 50ml of the cooled, well shaken and
filtered tea infusion was mixed with 50ml IBMK and gently shaken to avoid formation of an
emulsion and the layers were allowed to separate. Solution A, a 4ml portion of the IBMK
layer was taken and made up to 25ml with methanol in a volumetric flask. Solution B, 2ml
portion of the aqueous (lower layer) was diluted with 8ml distilled water and made up to
25ml with methanol. Solution C, 25ml portion of the IBMK layer was mixed with 25ml of
freshly prepared 2.5 % aqueous sodium hydrogen carbonate. The mixture was shaken
vigorously and the layers were allowed to separate before discarding the lower layer. A 4ml
portion of washed IBMK layer was made up to 25ml with methanol. Solution D, 2ml portion
of the aqueous layer was diluted with 6ml distilled water and 2ml of a saturated oxalic acid
added before topping to 25 ml with methanol in a volumetric flask.
The absorbance AA,AB,AC and AD of solution A,B,C and D, respectively were read at
380nm and 460nm using a Cecil Digital grating spectrophotometer with distilled water as the
blank. The mean absorbance of TR fractions at 380nm is 0.733 (Roberts and Smith, 1963).
The value AA-AC represents the absorbance due to the IBMK- solution free acid thearubigins
S1 type for which A0.2%
460nm = 0.138.
At 460nm and following the above partitioning procedures
% TR S1 = (375 x 0.02 x 6.25 [AA – AC] )/(0.138 x 9 x DM/100)
The value AB represents the absorbance of the IBMK-insoluble thearubigins of S11
type and after acidification with oxalic acid, this change to AD. These acidified S11 type
thearubigins has A0.2%
460nm of 0.233, and are deeply coloured than the S1 type (Roberts and
Smith,1963).
Hence at 460nm;
% TR S11 = (375 x 0.02 x 12.5 AD)/(0.233 x 9 x DM/100).
Total thearubigins were calculated using a method described by Obanda et al., (2001) as;
At 380nm,
% Total TR = (375 x 0.02 x 6.25 [2AD + AA - AC]) / (0.733 x 9 x DM/100)

30
3.9.6 Determination of liquor brightness
The above procedure used in determining total thearubigins was followed where four
solutions were made (A, B, C and D). Their corresponding absorbances were read at 460nm.
Brightness percentage was calculated as follows;
Brightness % = (100 x AC)/ (AA + 2AB) (Obanda et al., 2001). Where AA, AB and
AC are the absorbance of solution A, B and C respectively read at 460nm.
3.9.7 Determination of total soluble solids (TSS) in black tea (Beverages method)
Made black tea of 2g was weighed into a 500ml conical flask and a few anti-bumping
granules and 200ml of boiling distilled water was added to the flask. The flask was refluxed
gently on a hot plate for one hour, swirling occasionally. The infusion was then filtered
through a Whatman 541 filter paper carefully to avoid infused leaf going with the liquor to
hasten filtration. The hotter the liquor, the faster was the filtration. Ambient temperatures also
influence the rate of filtration, the warmer the faster the filtration. Hot distilled water was
used to rinse out the liquor until there was no liquor seen in the flask used in refluxing. The
filtrate was allowed to cool to room temperature then transferred to a 250ml volumetric flask
and made to the volume with cold distilled water. Thorough mixing was done before 50ml
was drawn and put in an already weighed beaker (W1) and placed in an oven at 100oC ± 2
0C
and left for 16 hours. The beaker was then transferred to a desiccator to allow it to cool and
then weighed to the nearest milligram (W2).
% TSS = (W2-W1) x (250/50/2) x 100 x (100/DM)
DM = Dry matter
3.9.8 Residual catechins in black tea
A modified HPLC method of Zuo et al., (2002) was used to assay for the tea
catechins. A Shimadzu LC 20 AT HPLC system fitted with a SIL 20A auto sampler and a
SPD-20 UV visible detector with a class LC 10 chromatography workstation was used for
analysis of the prepared samples. A Gemini 5 Um C6- phenyl, 250mm x 4.6 mm
(Phenomenex, Torrance, CA, USA) separation column with a Reodyne precolumn filter disk
was used. A gradient elution was carried out using the following solvent system: Mobile
phase A (acetonitrile/acetic acid/ double distilled water – 9/2/89 v/v/v), mobile phase B
(acetonitrile/acetic acid/ double distilled water – 80/2/18 v/v/v). The mobile phase
composition for a binary gradient condition started at 100% solvent A for 10 minutes then
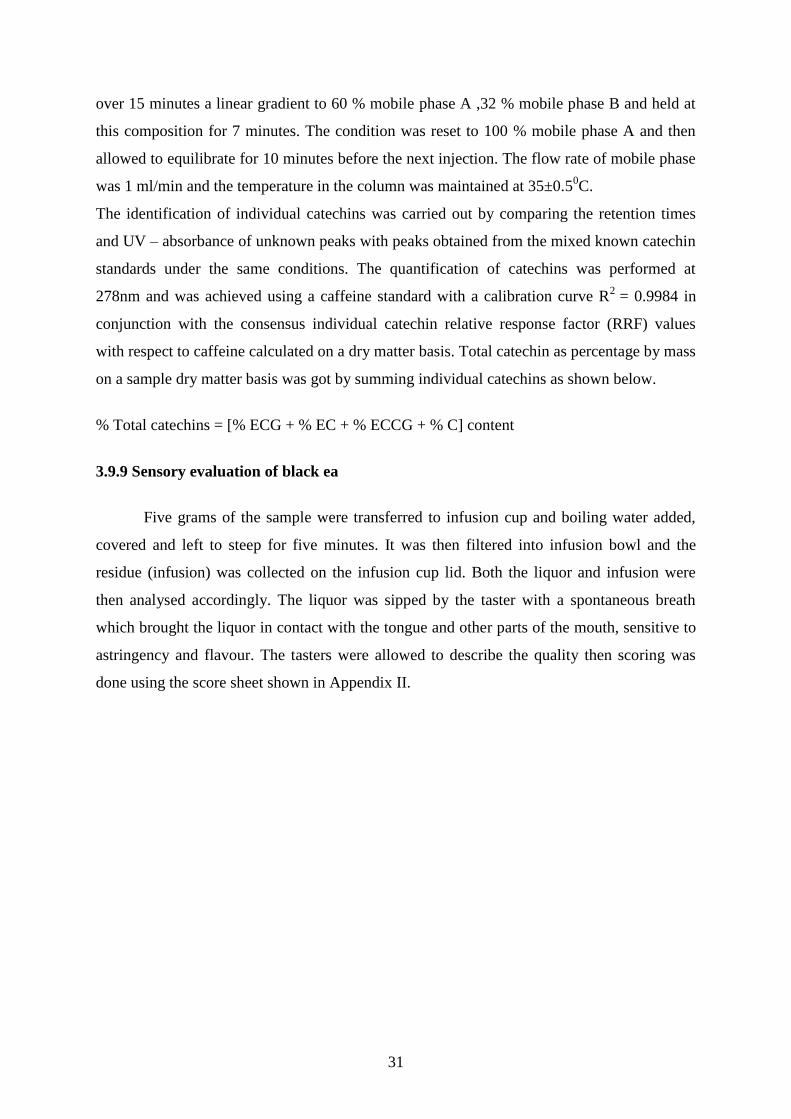
31
over 15 minutes a linear gradient to 60 % mobile phase A ,32 % mobile phase B and held at
this composition for 7 minutes. The condition was reset to 100 % mobile phase A and then
allowed to equilibrate for 10 minutes before the next injection. The flow rate of mobile phase
was 1 ml/min and the temperature in the column was maintained at 35±0.50C.
The identification of individual catechins was carried out by comparing the retention times
and UV – absorbance of unknown peaks with peaks obtained from the mixed known catechin
standards under the same conditions. The quantification of catechins was performed at
278nm and was achieved using a caffeine standard with a calibration curve R2
= 0.9984 in
conjunction with the consensus individual catechin relative response factor (RRF) values
with respect to caffeine calculated on a dry matter basis. Total catechin as percentage by mass
on a sample dry matter basis was got by summing individual catechins as shown below.
% Total catechins = [% ECG + % EC + % ECCG + % C] content
3.9.9 Sensory evaluation of black ea
Five grams of the sample were transferred to infusion cup and boiling water added,
covered and left to steep for five minutes. It was then filtered into infusion bowl and the
residue (infusion) was collected on the infusion cup lid. Both the liquor and infusion were
then analysed accordingly. The liquor was sipped by the taster with a spontaneous breath
which brought the liquor in contact with the tongue and other parts of the mouth, sensitive to
astringency and flavour. The tasters were allowed to describe the quality then scoring was
done using the score sheet shown in Appendix II.

32
Figure 9: Display of ready- to-taste tea in a tea tasting room
3.10 Experimental design
Leaf for manufacture for each clone was randomly plucked from the three plots. The
manufacture was repeated three times in order to have replicated treatments. Completely
randomized design with three replications was adopted for this experiment. Data analysis on
all chemical parameters was done using General Linear Model, Correlation procedures of
Statistical Analysis System (SAS, version 9.1). Data on sensory evaluation were subjected to
analysis of variance using MSTAT version 2.10. Means were separated using Duncan
multiple range test.
33
CHAPTER FOUR
RESULTS AND DISCUSSION
4.0 Introduction
The results are presented graphically in a descending order for ease of comprehension
whenever necessary and the test clones are shaded purple (light) while the commercial clones
are shaded black (dark) in all the results. Yabukita variety from Japan was used as a control
in green tea experiment, while TRFK 6/8 was used in black tea experiment because of their
respective good green and black tea quality.
4.1.1 Total polyphenols
Total polyphenols (TPP) results are presented in Figure 7 and Appendix VII. There were
significant differences (p≤ 0.05) observed in TPP. All the test clones had a mean value above
20 % total polyphenols. Among the commercial clones, GW Ejulu and TRFK 6/8 showed
relatively higher mean values of TPP % with 27.27 % and 26.54 % respectively. Most
commercial clones which are known to produce good black tea like TRFK 301/1, TRFK
303/577, and TRFK 303/216 also showed relatively high mean values of TPP. Yabukita and
Hanlu tea varieties which are green varieties used in Japanese and Chinese, respectively
showed the lowest TPP. Clones K-Purple and TRFK 91/1 showed relatively higher mean
values of TPP among the test clones with 25.86 % and 23.87 % TPP, respectively. These
values are higher than some commercial clones mean values.

34
16
18
2 0
2 2
2 4
2 6
2 8G
W E
julu
TR
FK
6/8
TR
FK
301
/1
K-P
urpl
e
TR
FK
303
/216
TR
FK
303
/577
TR
FK
31/
8
TR
FK
91/1
EP
K T
N 1
4/3
TR
FK
73/
5
TR
FK
73/
2
TR
FK
83/
1
TR
FK
KS
1
TR
FK
73/
3
TR
FK
301
/2
AH
P S
15/1
0
ST
.543
TR
FK
14/
1
TR
FK
91/
2
TR
FK
73/
4
TR
FK
73/
1
TR
FK
KS
3
TR
FK
KS
2
TR
FK
73/
7
ST
536
Han
lu
Yab
ukita
Clones
To
tal P
oly
ph
eno
ls (%
)
Figure 10: Total polyphenols content in the studied clones/varieties
4.1.2 Total catechins
The results are presented in Figure 8 and Appendix VIII. There were significant
differences (p≤ 0.05) noted in total catechins. Some test clones like; TRFK 73/4, TRFK 73/7,
TRFK 73/1, TRFK 83/1, TRFK 73/2, TRFK KS 2 and TRFK KS 3 showed higher mean
values among the test clones than Yabukita clone. The rest of the test clones showed lower
mean values than the standard clone. Most test clones showed mean values above 8.5 % total
catechins except clone TRFK 73/3 which had relatively low total catechins. Clone TRFK
301/2 showed the highest mean value of total catechins with 13.79 % among the commercial
clones. Hanlu had relatively high mean value of total catechins than Yabukita. Clone TRFK
6/8 and TRFK 303/577 had low total catechins though with high TPP.

35
4.8
5.8
6.8
7.8
8.8
9.8
10.8
11.8
12.8
13.8
TR
FK
301
/2
ST
.536
Han
lu
TR
FK
73/
7
TR
FK
73/
4
TR
FK
73/
1
TR
FK
83/
1
TR
FK
KS
2
TR
FK
73/
2
TR
FK
KS
3
EP
K T
N 1
4/3
GW
Eju
lu
Yab
uku
ta
AH
P S
15/
10
TR
FK
KS
1
TR
FK
73/
5
TR
FK
14/
/1
TR
FK
303
/577
K-P
urp
le
TR
FK
303
/216
TR
FK
301
/1
TR
FK
91/
1
ST
.543
TR
FK
91/
2
TR
FK
31/
/8
TR
FK
6/8
TR
FK
73/
3
Clones
To
tal c
ate
ch
in (
%)
Figure 11: Clonal variations in total catechins in the studied clones/varieties
4.1.3 Non gallated catechins
Free catechins include Epigallocatechins (EGC) and Epicatechins (EC) and the results are
presented in Figures 9, 10, 11 and in Appendix VIII. There were significant differences (P<
0.05) observed in EGC among the studied clones. Some test clones like TRFK 83/1, TRFK
73/2, TRFK 73/7 and TRFK 73/1 had higher mean values of EGC than the standard clone
Yabukita. GW Ejulu had the lowest EGC among the commercial clones. Clones TRFK 91/2,
TRFK 91/1 and K-Purple showed the lowest mean values of EGC with 1.3 %, 0.46 % and
0.38 %, respectively. Significant difference (P< 0.05) was also noted in EC mean values.
Most test clones had higher EC than the standard clone Yabukita except clones TRFK 83/1,
TRFK 73/5, K-Purple, TRFK KS 1, TRFK 73/3, TRFK 91/2 and TRFK 91/1. Clones TRFK
73/7 and TRFK 73/1 had relatively high mean values of EC among the test clones while
TRFK 91/2 and TRFK 91/1 had low mean values. Among the commercial clones, TRFK
301/2 and ST.536 showed relatively high mean values of EC while TRFK 31/8 showed the
lowest mean values.

36
0.14
1.14
2.14
3.14
4.14
5.14
6.14
TR
FK
91
/1
TR
FK
91
/2
TR
FK
KS
3
TR
FK
KS
1
TR
FK
KS
2
TR
FK
73
/7
TR
FK
73
/3
TR
FK
73
/1
TR
FK
73
/2
TR
FK
73
/4
TR
FK
83
/1
K-P
urp
le
TR
FK
73
/5
TR
FK
14
/1
ST
.54
3
ST
.53
6
GW
Eju
lu
TR
FK
30
1/1
TR
FK
31
/8
EP
K T
N 1
4/3
TR
FK
30
1/2
TR
FK
30
3/5
77
TR
FK
30
3/2
16
TR
FK
6/8
AH
P S
15
/10
Ha
nlu
Ya
bu
ku
ta
Clones
No
n g
alla
ted
ca
tec
hin
s (
%)
EGC
EC
Figure 12: Non gallated catechins in the studied clones / varieties
0.2
1.2
2.2
3.2
4.2
5.2
6.2
TR
FK
83/1
TR
FK
73/2
TR
FK
73/7
TR
FK
73/1
TR
FK
301/2
TR
FK
KS
3
ST
.536
TR
FK
73/5
TR
FK
KS
2
Hanlu
EP
K T
N 1
4/3
TR
FK
14/1
TR
FK
73/4
Yabukuta
TR
FK
303/2
16
TR
FK
6/8
TR
FK
31/8
TR
FK
303/5
77
ST
.543
TR
FK
KS
1
TR
FK
301/1
TR
FK
73/3
TR
FK
91/2
AH
P S
15/1
0
GW
Eju
lu
TR
FK
91/1
K-P
urp
le
Clones
Ep
iga
llo
ca
tec
hin
s %
Figure 13: Epigallocatechins in the studied clones/varieties

37
0.15
0.35
0.55
0.75
0.95
1.15
1.35
1.55
1.75
TR
FK
73
/7
TR
FK
30
1/2
TR
FK
73
/1
ST
.53
6
TR
FK
KS
2
EP
K T
N 1
4/3
TR
FK
30
1/1
Ha
nlu
TR
FK
14
/1
AH
P S
15
/10
TR
FK
KS
3
TR
FK
73
/2
GW
Eju
lu
TR
FK
73
/4
Ya
bu
ku
ta
ST
.54
3
TR
FK
83
/1
TR
FK
30
3/5
77
TR
FK
6/8
TR
FK
73
/5
K-P
urp
le
TR
FK
30
3/2
16
TR
FK
KS
1
TR
FK
73
/3
TR
FK
31
/8
TR
FK
91
/2
TR
FK
91
/1
Clones
Ep
ica
tec
hin
s %
Figure 14: Epicatechins in the studied clones/varieties
4.1.4 Gallated catechins
These include Epigallocatechin gallates (EGCG) and Epicatechin gallates (ECG). The results
are presented in Figures 12, 13 and 14 below and in Appendix VIII. Significant differences
(P< 0.05) were noted in both EGCG and ECG. EGCG was the most dominant in all the
clones except in K-Purple which had ECG dominating. Clone TRFK 73/4 had the highest
mean value of EGCG with 6.25 % and did not differed significantly (P< 0.05) with TRFK
301/2 which had 5.97 %. Clone TRFK 91/1 also had relatively high EGCG but low free
catechins. Some test clones like TRFK KS 3, TRFK 73/1, TRFK 91/2, TRFK 83/1, K-Purple,
TRFK 14/1, TRFK 73/5 and TRFK 73/3 showed lower EGCG percent than the Yabukita
clone. There were significant differences (P< 0.05) noted in ECG where we had clone GW
Ejulu having the highest ECG content and did not differed significantly (P< 0.05) with K-
Purple. Clones TRFK 73/7, TRFK 73/4, TRFK KS 2 and TRFK KS 3 had higher ECG
content than Yabukita clone. Clone TRFK 14/1 had the lowest ECG content among the test
clones while TRFK 6/8 had the lowest mean value among the commercial clones.

38
0.6
1.6
2.6
3.6
4.6
5.6
6.6T
RF
K 9
1/1
TR
FK
91/2
TR
FK
KS
3
TR
FK
KS
1
TR
FK
KS
2
TR
FK
73/7
TR
FK
73/3
TR
FK
73/1
TR
FK
73/2
TR
FK
73/4
TR
FK
83/1
K-P
urp
le
TR
FK
73/5
TR
FK
14/1
ST
.543
ST
.536
GW
Eju
lu
TR
FK
301/1
TR
FK
31/8
EP
K T
N14/3
TR
FK
301/2
TR
FK
303/5
77
TR
FK
303/2
16
TR
FK
6/8
AH
P S
15/1
0
Hanlu
Yabukuta
Clones
Ga
lla
ted
ca
tec
hin
s (
%)
EGCG
ECG
Figure 15: Gallated catechins in the studied clones/varieties
1.8
2.3
2.8
3.3
3.8
4.3
4.8
5.3
5.8
6.3
TR
FK
73
/4
TR
FK
30
1/2
Ha
nlu
ST
.53
6
GW
Eju
lu
EP
K T
N1
4/3
TR
FK
91
/1
AH
P S
15
/10
TR
FK
73
/1
TR
FK
KS
1
TR
FK
KS
2
TR
FK
73
/2
Ya
bu
ku
ta
TR
FK
KS
3
TR
FK
73
/7
TR
FK
91
/2
TR
FK
30
3/5
77
TR
FK
83
/1
K-P
urp
le
TR
FK
30
3/2
16
TR
FK
31
/8
TR
FK
14
/1
ST
.54
3
TR
FK
30
1/1
TR
FK
73
/5
TR
FK
6/8
TR
FK
73
/3
Clones
Ep
iga
llo
ca
tec
hin
ga
lla
tes
%
++
Figure 16: Epigallocatechin gallates in the studied clones/varieties
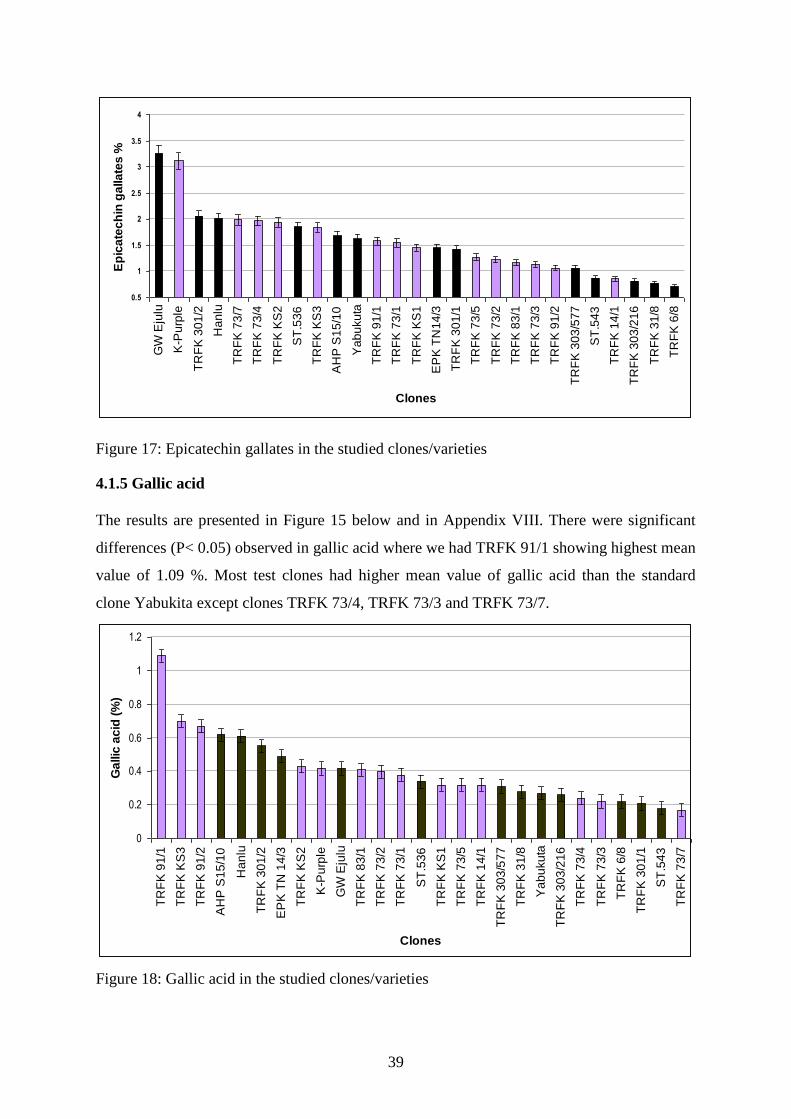
39
0.5
1
1.5
2
2.5
3
3.5
4
GW
Eju
lu
K-P
urp
le
TR
FK
30
1/2
Ha
nlu
TR
FK
73
/7
TR
FK
73
/4
TR
FK
KS
2
ST
.53
6
TR
FK
KS
3
AH
P S
15
/10
Ya
bu
ku
ta
TR
FK
91
/1
TR
FK
73
/1
TR
FK
KS
1
EP
K T
N1
4/3
TR
FK
30
1/1
TR
FK
73
/5
TR
FK
73
/2
TR
FK
83
/1
TR
FK
73
/3
TR
FK
91
/2
TR
FK
30
3/5
77
ST
.54
3
TR
FK
14
/1
TR
FK
30
3/2
16
TR
FK
31
/8
TR
FK
6/8
Clones
Ep
ica
tec
hin
ga
lla
tes
%
Figure 17: Epicatechin gallates in the studied clones/varieties
4.1.5 Gallic acid
The results are presented in Figure 15 below and in Appendix VIII. There were significant
differences (P< 0.05) observed in gallic acid where we had TRFK 91/1 showing highest mean
value of 1.09 %. Most test clones had higher mean value of gallic acid than the standard
clone Yabukita except clones TRFK 73/4, TRFK 73/3 and TRFK 73/7.
0
0.2
0.4
0.6
0.8
1
1.2
TR
FK
91
/1
TR
FK
KS
3
TR
FK
91
/2
AH
P S
15
/10
Ha
nlu
TR
FK
30
1/2
EP
K T
N 1
4/3
TR
FK
KS
2
K-P
urp
le
GW
Eju
lu
TR
FK
83
/1
TR
FK
73
/2
TR
FK
73
/1
ST
.53
6
TR
FK
KS
1
TR
FK
73
/5
TR
FK
14
/1
TR
FK
30
3/5
77
TR
FK
31
/8
Ya
bu
ku
ta
TR
FK
30
3/2
16
TR
FK
73
/4
TR
FK
73
/3
TR
FK
6/8
TR
FK
30
1/1
ST
.54
3
TR
FK
73
/7
Clones
Ga
llic
ac
id (
%)
Figure 18: Gallic acid in the studied clones/varieties

40
4.1.6 Caffeine
Caffeine content results are presented in Figure 16 and in Appendix VIII. Significant
difference (P< 0.05) was noted in caffeine content in the studied clones with clone TRFK KS
3 having the highest (2.33 %) mean value among the test clones. AHP S 15/10, EPK TN
14/3, TRFK 301/2, Hanlu and GW Ejulu had relatively higher caffeine content among the
commercial clones. Most test clones had lower caffeine than Yabukita clone except clones
TRFK KS 3, TRFK KS 2 and TRFK 83/1. Clone TRFK 73/5 had the lowest caffeine content
with 1.16 % among the test clones but higher than TRFK 6/8 which had the lowest on the
studied clones.
0.5
1
1.5
2
2.5
3
3.5
AH
P S
15
/10
EP
K T
N1
4/3
TR
FK
30
1/2
Ha
nlu
GW
Eju
lu
TR
FK
KS
3
TR
FK
KS
2
TR
FK
83
/1
ST
.53
6
K-P
urp
le
Ya
bu
ku
ta
TR
FK
73
/1
TR
FK
73
/2
TR
FK
14
/1
TR
FK
73
/7
ST
.54
3
TR
FK
73
/3
TR
FK
73
/4
TR
FK
30
3/5
77
TR
FK
91
/1
TR
FK
30
3/2
16
TR
FK
KS
1
TR
FK
30
1/1
TR
FK
91
/2
TR
FK
31
/8
TR
FK
73
/5
TR
FK
6/8
Clones
Ca
ffe
ine
(%
)
Figure 19: Caffeine content in the studied clones/varieties
4.1.7 Theanine
The results are presented in Figure 17 and Appendix VII. The results showed that
most of the clones had theanine percentage above one percent on dry weight basis except
clone TRFK 6/8. It can also be observed that most clones meant for black tea like TRFK
303/577 and TRFK 31/8 showed lower theanine percentage with clone TRFK 303/577 being
not significantly different (P< 0.05) from TRFK 6/8. As presented in Figure 17 below, there
were significant differences (P< 0.05) observed in theanine levels. Clone TRFK 91/1 had the
highest level theanine with 2.18 % followed by TRFK KS 3, TRFK 73/3 among the test
clones. Clone TRFK 301/1 had relatively higher percentage of theanine among the
commercial clones and it also showed good results as a black tea. Clones TRFK 83/1 and K-
Purple showed relatively low levels of theanine with 1.1 % each.

41
0.6
0.8
1
1.2
1.4
1.6
1.8
2
2.2
2.4
TR
FK
91
/1
TR
FK
30
1/1
TR
FK
KS
3
TR
FK
73
/3
ST
. 5
36
TR
FK
91
/2
TR
FK
30
1/2
TR
FK
73
/4
TR
FK
73
/5
TR
FK
14
/1
TR
FK
KS
1
TR
FK
73
/7
AH
P S
15
/10
TR
FK
73
/2
EP
K T
N 1
4/3
TR
FK
73
/1
TR
FK
KS
2
ST
.54
3
GW
Eju
lu
Ya
bu
kita
TR
FK
30
3/2
16
Ha
nlu
TR
FK
83
/1
K-P
urp
le
TR
FK
31
/8
TR
FK
30
3/5
77
TR
FK
6/8
Clones
Th
ea
nin
e (
%)
Figure 20: Theanine content in the studied clones/varieties
4.1.8 Green tea sensory evaluation
The results are presented in Table 1. Significant difference (P< 0.05) was observed in
all the tea tasting parameters accept in liquor body. The samples were coded 1-27 such that a
taster could not know which clone is which but we had our reference. Green tea taster could
distinguish TRFK KS 1 as a purple tea. From the lab results, clone TRFK KS I had average
mean values of catechins, TPP and even theanine but its taste was distinctly of purple tea.
Clones TRFK 91/1, ST.536, TRFK 73/3 and TRFK 73/4 were said to have some flavour. The
above first three clones were also noted to have flavour in black tea. Their flavoury
characteristic could be attributed to relatively high levels of theanine as seen from the results.
Most liquors both of test and commercial clones were thick, strong and brisk. The liquors
were, however, not as green as is desired in most clones except for clones TRFK KS 2, TRFK
73/3, TRFK 73/1, TRFK 73/2, TRFK 83/1 and TRFK 14/1 which showed good green liquor.
Clone TRFK 91/1, TRFK K S I, TRFK 73/7, TRFK 73/4, K-Purple and TRFK 73/5 had
greenish liquors. Clones TRFK 91/2 and TRFK K S 3 had bright amber liquors. Most clones
had thick liquors except clones TRFK 31/8, TRFK 303/216 and TRFK 73/4 which had fairly
thick liquors. Clones TRFK 73/2 and TRFK 83/1 had very strong liquors while clones TRFK
91/1, TRFK 91/2, TRFK K S1, TRFK 73/3 and TRFK 14/1 had strong liquors. Clone TRFK
73/1 scored last in liquor strength as all commercial clones produce strong liquors. Most
liquors were brisk, some were astringent like GW Ejulu, TRFK 301/1, TRFK 6/8, TRFK
91/2, TRFK KS 2, TRFK 73/3 and TRFK 73/5. Yabukita clone scored last in briskness with
3.33, others with fairly brisk liquors were, TRFK 303/216, ST. 536, TRFK 73/7 and TRFK

42
83/1. Most commercial clones had fairly bright liquors except clones TRFK 303/216, ST.536
which had bright infusions. Among the test clones, TRFK K S 1, TRFK K S 2, TRFK 73/7,
TRFK 73/2, TRFK 83/1, K-Purple and TRFK 14/1 had bright infusions. Clone TRFK 73/4
had very bright infusions with a score of one.
Table 1: Sensory evaluation of green tea
Liqour Liqour Liquor Liqour Infusion Average
Colour Body strength Briskness Colour
Commercial clones
GW Ejulu 4.33ab
2.00a 2.00
bcd 1.00
e 3.17
abc 2.50
TRFK 301/1 4.33ab
2.00a 1.67
cd 1.33
de 3.67
a 2.60
TRFK 31/8 3.33bcde
3.00a 2.00
bcd 1.5
de 3.33
ab 2.63
EPK TN
14/3 5.00a 2.00
a 2.33
bcd 2.00
cd 3.33
ab 2.93
TRFK 301/2 3.00bcde
2.00a 2.00
bcd 2.00
cd 3.67
a 2.53
TRFK
303/577 3.00bcde
2.00a 2.00
bcd 1.67
cde 3.00
abc 2.33
TRFK
303/216 3.67abcd
3.00a 1.67
cd 3.00
ab 2.33
bc 2.73
TRFK 6/8 4.33ab
2.00a 2.00
bcd 1.00
e 3.33
ab 2.53
AHP S
15/10 5.00a 2.00
a 2.00
bcd 2.00
cd 3.00
abc 2.80
ST.543* 4.00abc
2.00a 2.00
bcd 2.00
cd 2.33
bc 2.47
ST.536* 2.00e 2.00
a 2.50
bcd 3.00
ab 2.33
bc 2.37
Hanlu* 4.00abc
2.00a 2.50
bcd 2.00
cd 3.00
abc 2.70
Yabukita 3.00bcde
2.67a 2.00
bcd 3.33
a 3.33
ab 2.87
Test clones
TRFK 91/1* 3.50abcde
2.50a 2.00
bcd 2.33
bc 3.67
a 2.80
TRFK 91/2 4.00abc
2.00a 2.00
bcd 1.67
cde 3.67
a 2.67
TRFK KS 3 4.00abc
2.00a 3.00
b 2.00
cd 3.67
a 2.93
TRFK KS 1 3.67abcd
2.00a 2.00
bcd 2.00
cd 2.00
cd 2.33
TRFK KS 2 2.00e 2.00
a 3.00
b 1.00
e 2.00
cd 2.00
TRFK 73/7 3.50abcde
2.00a 3.00
b 3.00
ab 2.00
cd 2.70
TRFK 73/3* 2.00e 2.67
a 2.00
bcd 1.50
de 3.00
abc 2.23
TRFK 73/1 2.00e 2.00
a 5.00
a 2.00
cd 3.00
abc 2.80
TRFK 73/2 2.00e 2.00
a 1.50
d 2.00
cd 2.33
bc 1.97
TRFK 73/4* 3.67abcd
3.00a 3.00
b 2.00
cd 1.00
d 2.53
TRFK 83/1* 2.33de
2.00a 1.50
d 3.00
ab 2.00
cd 2.17
K-purple 3.67abcd
2.00a 3.00
b 2.33
bc 2.33
bc 2.67

43
TRFK 73/5 3.67abcd
2.00a 3.00
b 1.67
cde 2.33
bc 2.53
TRFK 14/1 2.67cde
2.50a 2.00
bcd 2.00
cd 3.00
abc
2.43
CV % 29.27 43.78 27.02 22.8 26.61 * Flavoury
Note : The scores ranged from 1 – 5, with 1 being the best and 5 is the poorest score.
4.1.9 Correlation analysis
Quality parameters including theanine, total polyphenols and total catechins were
correlated with tasters score on liquor colour, liquor strength, liquor briskness and infusion
colour. The results are presented in Table 2. There was no correlation between total catechins
and liquor characteristics. A weak correlation however was observed between theanine, TPP
and liquor colour. Correlation exists between infusion and theanine with correlation
coefficient (r) of 0.524. A strong correlation was observed between TPP and theanine with an
r-value of 0.95. Total polyphenol was also correlated with individual catechins and
coefficients are presented in Table 3. Strong correlation exists between the total polyphenols
and the individual catechins.
Table 2: Correlation coefficients (r) between tea quality parameters and tasters score. N = 27
L/Colour L/Body L/Strength Briskness Infusion Theanine TPP T/Catechin
L/Colour 1
L/Body - 0.121 1
L/Strength - 0.181 -0.155 1
Briskness - 0.203 0.197 -0.018 1
Infusion 0.277 -0.118 -0.185 -0.262 1
Theanine 0.477 -0.030 -0.331 -0.302 0.524* 1
TPP 0.427 -0.044 -0.286 -0.262 0.450 0.950*** 1
T/Catechin - 0.086 -0.238 0.353 -0.204 0.212 -0.004 0.080 1
* Correlation significant at the p ≤ 0.05 level
*** Correlation significant at the p ≤ 0.001 level
L/Colour = Liqour colour
L/Body = Liqour bod
L/ strength = Liqour strength
TPP = Total polyphenols
T/catechin = Total catechins

44
Table 3: Correlation coefficient matrix analyses between TPP and individual catechins. N=27
EGCG EGC ECG EC TPP
EGCG 1
EGC 0.983*** 1
ECG 0.958*** 0.962*** 1
EC 0.983*** 0.974*** 0.941*** 1
TPP 0.961*** 0.959*** 0.922*** 0.978*** 1
*** Correlation significant at the p ≤ 0.001 level
EGCG Epigallocatechin EGC Epigallocatechin
ECG Epicatechin gallate EC Epicatechin
TPP Total polyphenols
4.2.1 Total theaflavins
The results are presented in Figure 21 and in Appendix XI. Clone TRFK 6/8 was used as a
standard clone in this set of experiment because of its proven high quality. The clones under
study differed significantly (p ≤ 0.05) in total theaflavins determined using Flavognost
method. Clone TRFK 6/8 showed the highest mean value of 25.07µmol/g while TRFK 91/1
had the lowest mean value of the same with 9.54 µmol/g. Clones TRFK 303/577, EPK TN
14/3, TRFK 301/1 and TRFK 303/216 were also among the commercial clones with
relatively high levels of TF. Most test clones had mean values above 16 µmol/g but clones
TRFK 91/1, TRFK 73/3 had lower than 16 µmol/g values of theaflavins. TRFK KS 3 had the
highest theaflavins (23.47µmol/g) among the test clones.
8
10
12
14
16
18
20
22
24
26
28
TR
FK
6/8
TR
FK
303
/216
TR
FK
301
/1
EP
K T
N 1
4/3
TR
FK
KS
3
TR
FK
303
/577
TR
FK
301
/2
TR
FK
73/
2
TR
FK
73/
1
TR
FK
83/
1
TR
FK
KS
2
TR
FK
14/
1
TR
FK
31/
8
ST
.543
AH
P S
15/
10
TR
FK
73/
5
GW
Eju
lu
K-P
urp
le
TR
FK
KS
1
ST
.536
TR
FK
73/
4
TR
FK
91/
2
TR
FK
73/
7
TR
FK
73/
3
TR
FK
91/
1
Clones
To
tal th
ea
fla
vin
s (
µm
ol/g
)
Figure 21: Total theaflavins by Flavognost method in the studied clones/varieties

45
4.2.2 Total colour
Results are presented in Figure 22 and in Appendix XI. There was a significant
difference (p ≤ 0.05) observed in total colour in the studied clones. Most commercial clones
had better colour than the test clones. Clones TRFK 301/1 and TRFK 303/216 had high mean
values of total colour among the commercial clones while clones ST.536 and ST.543 showed
the lowest total colour. Most test clones had colour values below 5 % total colour with clone
TRFK KS 3 showing the highest mean value with 5.72 % total colour.
3.5
4
4.5
5
5.5
6
6.5
7
TR
FK
301
/1
TR
FK
303
/216
EP
K T
N 1
4/3
AH
P S
15/
10
TR
FK
6/8
TR
FK
303
/577
TR
FK
301
/2
TR
FK
KS
3
TR
FK
31/
8
GW
Eju
lu
TR
FK
14/
1
TR
FK
91/
2
TR
FK
73/
1
TR
FK
KS
2
TR
FK
83/
1
K-P
urpl
e
TR
FK
73/
2
TR
FK
73/
5
ST
.543
TR
FK
91/
1
TR
FK
73/
4
TR
FK
73/
7
TR
FK
KS
1
TR
FK
73/
3
ST
.536
Clones
To
tal c
olo
ur
(%)
Figure 22: Total colour in the studied clones/varieties
4.2.3 Brightness
The results for brightness are presented in Figure 23 and Appendix XI. There was a
significant difference (p≤ 0.05) observed in brightness percentage measured by
spectrophotometer. Clone EPK TN 14/3 had the highest mean value of 34.38 % while clone
AHP S 15/10 showed the lowest mean value of brightness among the commercial clones.
Among the test clones, clones TRFK 91/1 and TRFK 91/2 showed low levels of brightness
with 10.79 % and 17.20 %, respectively as TRFK 73/2 showed the highest mean value of
33.35 % which never differed significantly (p≤ 0.05) with TRFK 6/8. TRFK K S 3 and TRFK
K S 2 were also among the test clones with relatively higher brightness.
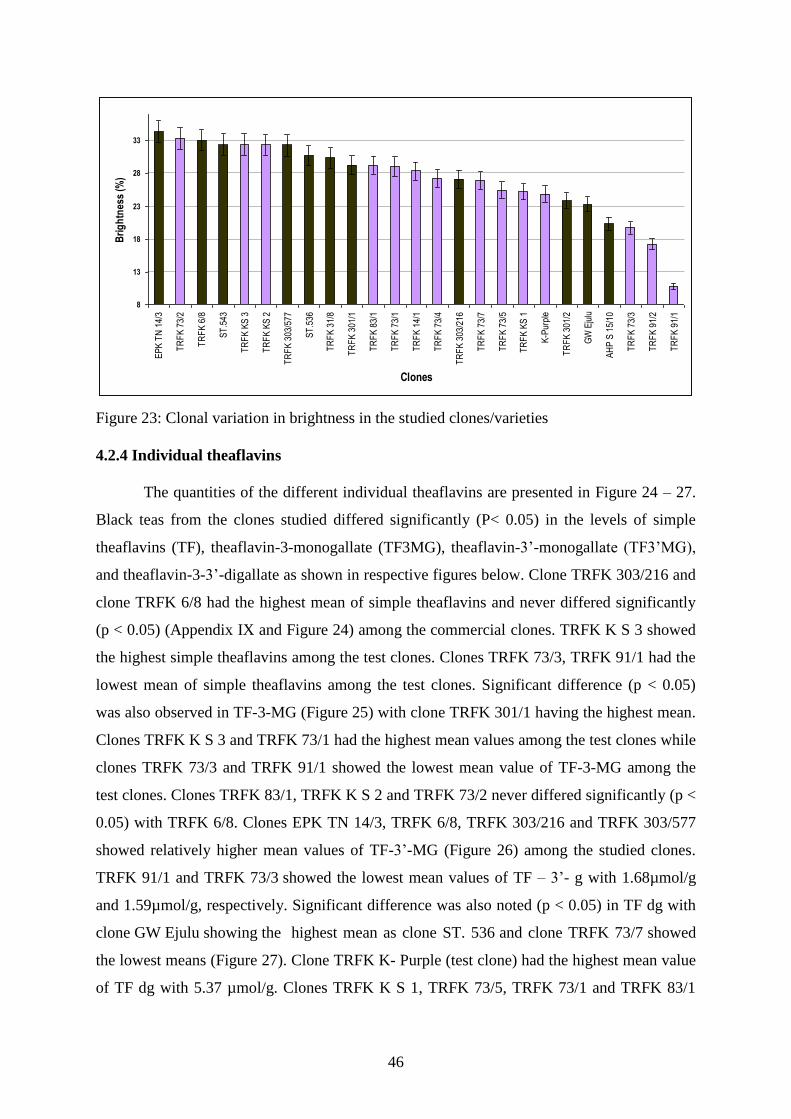
46
8
13
18
23
28
33
EP
K T
N 1
4/3
TR
FK
73/
2
TR
FK
6/8
ST
.543
TR
FK
KS
3
TR
FK
KS
2
TR
FK
303
/577
ST
.536
TR
FK
31/
8
TR
FK
301
/1
TR
FK
83/
1
TR
FK
73/
1
TR
FK
14/
1
TR
FK
73/
4
TR
FK
303
/216
TR
FK
73/
7
TR
FK
73/
5
TR
FK
KS
1
K-P
urpl
e
TR
FK
301
/2
GW
Eju
lu
AH
P S
15/
10
TR
FK
73/
3
TR
FK
91/
2
TR
FK
91/
1
Clones
Bri
gh
tnes
s (%
)
Figure 23: Clonal variation in brightness in the studied clones/varieties
4.2.4 Individual theaflavins
The quantities of the different individual theaflavins are presented in Figure 24 – 27.
Black teas from the clones studied differed significantly (P< 0.05) in the levels of simple
theaflavins (TF), theaflavin-3-monogallate (TF3MG), theaflavin-3’-monogallate (TF3’MG),
and theaflavin-3-3’-digallate as shown in respective figures below. Clone TRFK 303/216 and
clone TRFK 6/8 had the highest mean of simple theaflavins and never differed significantly
(p < 0.05) (Appendix IX and Figure 24) among the commercial clones. TRFK K S 3 showed
the highest simple theaflavins among the test clones. Clones TRFK 73/3, TRFK 91/1 had the
lowest mean of simple theaflavins among the test clones. Significant difference (p < 0.05)
was also observed in TF-3-MG (Figure 25) with clone TRFK 301/1 having the highest mean.
Clones TRFK K S 3 and TRFK 73/1 had the highest mean values among the test clones while
clones TRFK 73/3 and TRFK 91/1 showed the lowest mean value of TF-3-MG among the
test clones. Clones TRFK 83/1, TRFK K S 2 and TRFK 73/2 never differed significantly (p <
0.05) with TRFK 6/8. Clones EPK TN 14/3, TRFK 6/8, TRFK 303/216 and TRFK 303/577
showed relatively higher mean values of TF-3’-MG (Figure 26) among the studied clones.
TRFK 91/1 and TRFK 73/3 showed the lowest mean values of TF – 3’- g with 1.68µmol/g
and 1.59µmol/g, respectively. Significant difference was also noted (p < 0.05) in TF dg with
clone GW Ejulu showing the highest mean as clone ST. 536 and clone TRFK 73/7
showed
the lowest means (Figure 27). Clone TRFK K- Purple (test clone) had the highest mean value
of TF dg with 5.37 µmol/g. Clones TRFK K S 1, TRFK 73/5, TRFK 73/1 and TRFK 83/1

47
never differed significantly (p < 0.05) with TRFK 6/8 (Appendix IX). Most clones had
simple theaflavins dominating among the four theaflavins. Clone Ejulu had theaflavin
digallate dominating whereas clones AHP S 15/10, TRFK 301/1, TRFK 301/2, TRFK 73/5,
TRFK 91/2, TRFK 91/1, TRFK KS 1 and K-Purple had theaflavins-3-monogallate
dominating. Clone TRFK 91/1 had the lowest values of all the theaflavins with theaflavin
digallate dominating and simple theaflavins was the least.
1.2
3.2
5.2
7.2
9.2
11.2
TR
FK
303
/216
TR
FK
6/8
TR
FK
303
/577
TR
FK
KS
3
TR
FK
301
/1
EP
K T
N 1
4/3
TR
FK
73/
2
ST
.543
TR
FK
14/
1
TR
FK
73/
1
TR
FK
301
/2
TR
FK
83/
1
ST
.536
TR
FK
31/
8
TR
FK
73/
7
TR
FK
KS
2
TR
FK
73/
5
AH
P S
15/
10
TR
FK
KS
1
TR
FK
73/
4
K-P
urp
le
TR
FK
91/
2
GW
Eju
lu
TR
FK
73/
3
TR
FK
91/
1
Clones
Sim
ple
th
ea
fla
vin
s (
µm
ol/
g)
Figure 24: Simple theaflavins content in the studied clones/varieties
2.6
3.6
4.6
5.6
6.6
7.6
8.6
9.6
TR
FK
301
/1
TR
FK
301
/2
TR
FK
KS
3
TR
FK
73/
1
EP
K T
N 1
4/3
TR
FK
303
/216
TR
FK
6//8
TR
FK
73/
2
TR
FK
KS
2
TR
FK
83/
1
TR
FK
14/
1
TR
FK
303
/577
TR
FK
73/
5
ST
.543
K-P
urp
le
GW
Eju
lu
TR
FK
31/
/8
AH
P S
15/
10
TR
FK
KS
1
ST
.536
TR
FK
73/
4
TR
FK
91/
2
TR
FK
73/
3
TR
FK
73/
7
TR
FK
91/
1
Clones
TF
-3-m
on
og
alla
te (
µm
ol/
g)
Figure 25: TF – 3 – monogallate content in black tea studied
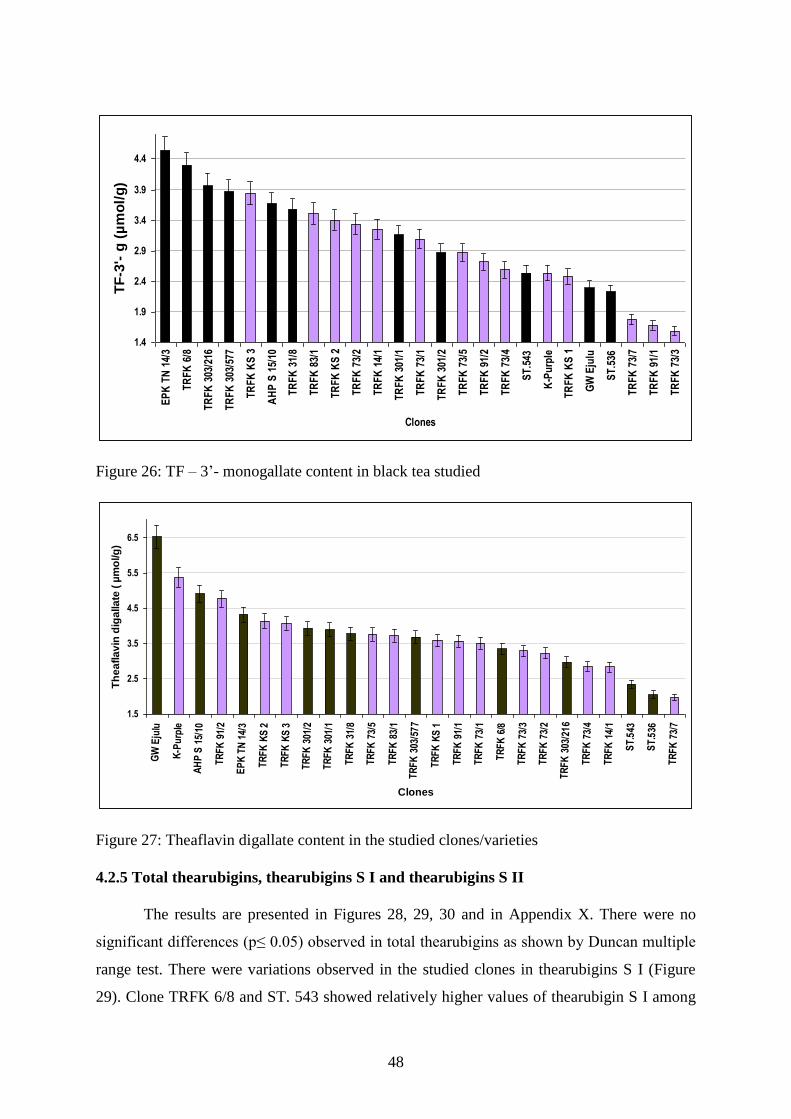
48
1.4
1.9
2.4
2.9
3.4
3.9
4.4E
PK
TN
14/
3
TR
FK
6/8
TR
FK
303
/216
TR
FK
303
/577
TR
FK
KS
3
AH
P S
15/
10
TR
FK
31/
8
TR
FK
83/
1
TR
FK
KS
2
TR
FK
73/
2
TR
FK
14/
1
TR
FK
301
/1
TR
FK
73/
1
TR
FK
301
/2
TR
FK
73/
5
TR
FK
91/
2
TR
FK
73/
4
ST
.543
K-P
urp
le
TR
FK
KS
1
GW
Eju
lu
ST
.536
TR
FK
73/
7
TR
FK
91/
1
TR
FK
73/
3
Clones
TF
-3'-
g (
µm
ol/
g)
Figure 26: TF – 3’- monogallate content in black tea studied
1.5
2.5
3.5
4.5
5.5
6.5
GW
Eju
lu
K-P
urp
le
AH
P S
15/
10
TR
FK
91/
2
EP
K T
N 1
4/3
TR
FK
KS
2
TR
FK
KS
3
TR
FK
301
/2
TR
FK
301
/1
TR
FK
31/
8
TR
FK
73/
5
TR
FK
83/
1
TR
FK
303
/57
7
TR
FK
KS
1
TR
FK
91/
1
TR
FK
73/
1
TR
FK
6/8
TR
FK
73/
3
TR
FK
73/
2
TR
FK
303
/21
6
TR
FK
73/
4
TR
FK
14/
1
ST
.543
ST
.536
TR
FK
73/
7
Clones
Th
ea
fla
vin
dig
alla
te (
µm
ol/g
)
Figure 27: Theaflavin digallate content in the studied clones/varieties
4.2.5 Total thearubigins, thearubigins S I and thearubigins S II
The results are presented in Figures 28, 29, 30 and in Appendix X. There were no
significant differences (p≤ 0.05) observed in total thearubigins as shown by Duncan multiple
range test. There were variations observed in the studied clones in thearubigins S I (Figure
29). Clone TRFK 6/8 and ST. 543 showed relatively higher values of thearubigin S I among

49
the commercial clones with 4.87 % and 4.82 %, respectively. Clone TRFK 73/1 and clone
TRFK KS 3 showed higher values among the test clones with 5.18 % and 6.30 % TR S I,
respectively while clone TRFK 91/1 showed the lowest mean value of thearubigin S I with
1.69 %. Clones TRFK 6/8 and TRFK 301/2 were among the commercial clones with
relatively high thearubigins S II with 12.40 % and 11.57 %, respectively (Figure 30). Clones
ST.536 and ST. 543 showed the lowest mean values of thearubigins S II as 5.57 % and 7.49
%, respectively. Clone TRFK 91/2 showed the highest thearubigin S II among the test clones,
followed by TRFK 91/1 with 12.28 % and 10.73 %, respectively. As shown in Figure 28, TR
S II dominates TR S I across all the clones.
1.20
6.20
11.20
16.20
21.20
TR
FK
30
3/5
77
EP
K T
N 1
4/3
TR
FK
31
/8
ST
.53
6
AH
P S
15
/10
TR
FK
30
1/1
TR
FK
6/8
GW
Eju
lu
TR
FK
30
1/2
ST
.54
3
TR
FK
30
3/2
16
TR
FK
91
/2
TR
FK
73
/4
TR
FK
73
/3
TR
FK
83
/1
TR
FK
73
/5
TR
FK
73
/7
TR
FK
73
/2
TR
FK
KS
2
TR
FK
91
/1
TR
FK
14
/1
TR
FK
KS
1
TR
FK
73
/1
TR
FK
KS
3
K-
PU
RP
LE
Clones
Th
ea
rub
igin
s (
%)
TR %
TR S I %
TR S II %
Figure 28: Total thearubigins and TR S I and TR S II fractions in the studied clones/varieties
1.65
2.65
3.65
4.65
5.65
6.65
TR
FK
KS
3
TR
FK
73
/1
TR
FK
6/8
ST
.54
3
TR
FK
30
3/2
16
TR
FK
73
/5
TR
FK
KS
1
TR
FK
30
1/2
TR
FK
30
1/1
EP
K T
N 1
4/3
TR
FK
30
3/5
77
TR
FK
31
/8
TR
FK
83
/1
GW
Eju
lu
ST
.53
6
K-
PU
RP
LE
AH
P S
15
/10
TR
FK
91
/2
TR
FK
KS
2
TR
FK
14
/1
TR
FK
73
/2
TR
FK
73
/3
TR
FK
73
/7
TR
FK
73
/4
TR
FK
91
/1
Clones
TR
S I (
%)
Figure 29: TR S I content in black tea studied
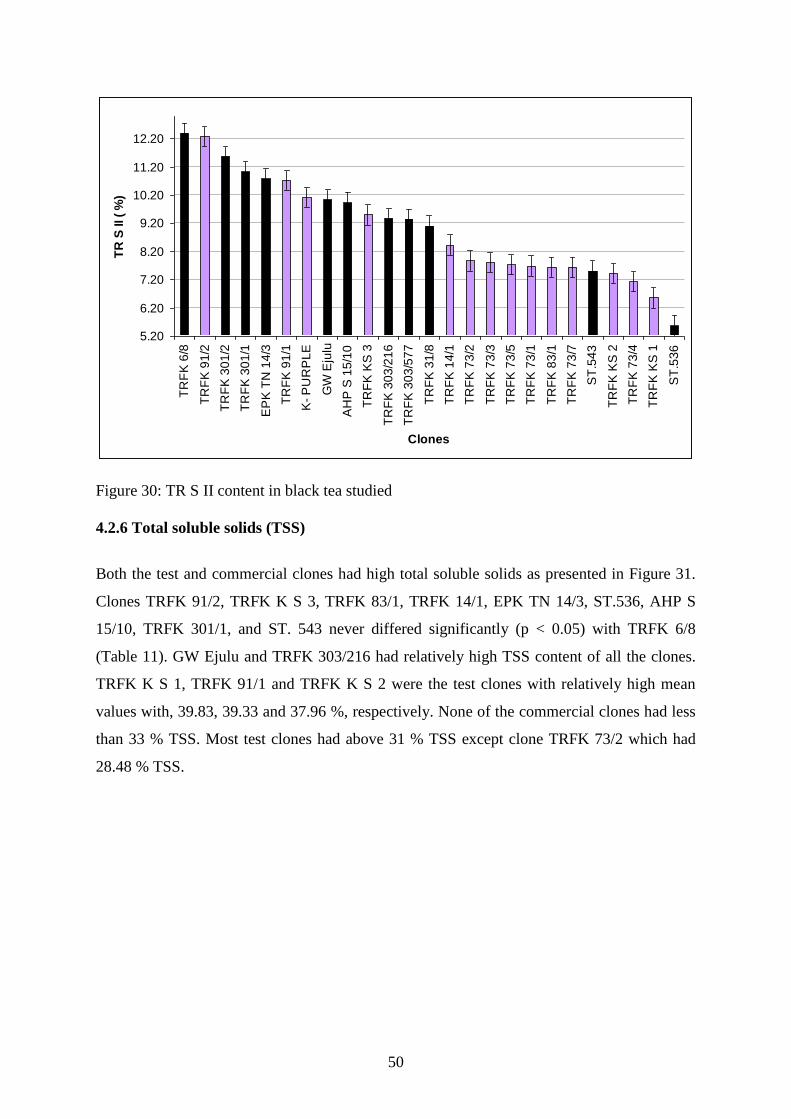
50
5.20
6.20
7.20
8.20
9.20
10.20
11.20
12.20
TR
FK
6/8
TR
FK
91
/2
TR
FK
30
1/2
TR
FK
30
1/1
EP
K T
N 1
4/3
TR
FK
91
/1
K-
PU
RP
LE
GW
Eju
lu
AH
P S
15
/10
TR
FK
KS
3
TR
FK
30
3/2
16
TR
FK
30
3/5
77
TR
FK
31
/8
TR
FK
14
/1
TR
FK
73
/2
TR
FK
73
/3
TR
FK
73
/5
TR
FK
73
/1
TR
FK
83
/1
TR
FK
73
/7
ST
.54
3
TR
FK
KS
2
TR
FK
73
/4
TR
FK
KS
1
ST
.53
6
Clones
TR
S II (
%)
Figure 30: TR S II content in black tea studied
4.2.6 Total soluble solids (TSS)
Both the test and commercial clones had high total soluble solids as presented in Figure 31.
Clones TRFK 91/2, TRFK K S 3, TRFK 83/1, TRFK 14/1, EPK TN 14/3, ST.536, AHP S
15/10, TRFK 301/1, and ST. 543 never differed significantly (p < 0.05) with TRFK 6/8
(Table 11). GW Ejulu and TRFK 303/216 had relatively high TSS content of all the clones.
TRFK K S 1, TRFK 91/1 and TRFK K S 2 were the test clones with relatively high mean
values with, 39.83, 39.33 and 37.96 %, respectively. None of the commercial clones had less
than 33 % TSS. Most test clones had above 31 % TSS except clone TRFK 73/2 which had
28.48 % TSS.

51
28.00
30.00
32.00
34.00
36.00
38.00
40.00
42.00
44.00
GW
Eju
lu
TR
FK
30
3/2
16
TR
FK
KS
1
TR
FK
91
/1
TR
FK
KS
2
TR
FK
31
/8
EP
K T
N 1
4/3
AH
P S
15
/10
TR
FK
91
/2
TR
FK
14
/1
TR
FK
6/8
TR
FK
30
1/1
TR
FK
KS
3
ST
.53
6
ST
.54
3
TR
FK
73
/3
TR
FK
73
/4
TR
FK
73
/1
TR
FK
30
3/5
77
K-
PU
RP
LE
TR
FK
30
1/2
TR
FK
73
/5
TR
FK
83
/1
TR
FK
73
/7
TR
FK
73
/2
Clones
To
tal s
olu
ble
so
lid
s (
%)
Figure 31: Total soluble solids content in the studied clones/varieties
4.2.7 Residual catechins in black tea
The major catechins presented here are four, namely; Epicatechins (EC), Epigallocatechins
(EGC), Epicatechin gallate (ECG) and Epigallocatechin gallate (EGCG).
EC results are presented in Figure 32 and Appendix XII. Significant difference (p < 0.05) was
observed in EC where TRFK KS I had the highest mean value. TRFK 6/8 followed with 0.78
% and never differed significantly (p < 0.05) with TRFK 303/216 which had 0.76 %. Clones
TRFK 73/3 and TRFK 83/1 had relatively lower mean values among the test clones.

52
0.15
0.25
0.35
0.45
0.55
0.65
0.75
0.85
0.95
TR
FK
KS
1
TR
FK
6/8
TR
FK
30
3/2
16
GW
Eju
lu
TR
FK
30
1/1
TR
FK
91
/2
TR
FK
73
/2
TR
FK
31
/8
AH
P S
15
/10
TR
FK
KS
3
TR
FK
73
/1
TR
FK
73
/4
TR
FK
14
/1
TR
FK
KS
2
ST
. 5
36
TR
FK
73
/5
TR
FK
73
/7
TR
FK
91
/1
EP
K T
N 1
4/3
ST
. 5
43
TR
FK
30
3/5
77
K-p
urp
le
TR
FK
83
/1
TR
FK
30
1/2
TR
FK
73
/3
Clones
Ep
ica
tec
hin
(%
)
Figure 32: Epicatechin content in the studied clones/varieties
EGC results are presented in Figure 33 and Appendix XII. There was significant difference (p
< 0.05) observed in EGC and TRFK 6/8 had the highest mean value while K-Purple had the
lowest
0.50
1.00
1.50
2.00
2.50
3.00
3.50
4.00
TR
FK
6/8
TR
FK
30
3/2
16
TR
FK
KS
3
TR
FK
KS
2
ST
. 5
36
TR
FK
73
/4
TR
FK
73
/2
TR
FK
83
/1
AH
P S
15
/10
EP
K T
N 1
4/3
TR
FK
73
/1
TR
FK
14
/1
TR
FK
30
1/1
TR
FK
30
3/5
77
TR
FK
91
/2
TR
FK
30
1/2
ST
. 5
43
TR
FK
73
/7
TR
FK
91
/1
TR
FK
73
/3
TR
FK
KS
1
GW
Eju
lu
K-p
urp
le
Clones
Ep
iga
llo
ca
tec
hin
(%
)
Figure 33: Epigallocatechin content in the studied clones/varieties

53
ECG results are presented in Figure 34 and Appendix XII. GW Ejulu had the highest mean
value of 1.95 % while ST.543 had the lowest mean value of 0.60 %. K-Purple had the highest
mean value among the test clones with a mean of 1.80 %.
0.50
0.70
0.90
1.10
1.30
1.50
1.70
1.90
2.10
GW
Eju
lu
K-p
urp
le
TR
FK
30
1/1
TR
FK
KS
1
TR
FK
73
/5
TR
FK
73
/2
TR
FK
73
/4
TR
FK
30
3/5
77
TR
FK
73
/1
TR
FK
KS
2
TR
FK
73
/7
TR
FK
6/8
TR
FK
14
/1
TR
FK
91
/2
TR
FK
73
/3
TR
FK
83
/1
ST
. 5
36
TR
FK
31
/8
TR
FK
91
/1
TR
FK
30
3/2
16
TR
FK
KS
3
EP
K T
N 1
4/3
AH
P S
15
/10
TR
FK
30
1/2
ST
. 5
43
Clones
Ep
ica
tec
hin
ga
lla
te (
%)
Figure 34: Epicatechin gallate content in the studied clones/varieties
EGCG results are presented in Figure 35 and Appendix XII. There was a significant
difference (p < 0.05) observed in EGCG where TRFK 73/7 had the highest mean value of
1.53 %. Clones TRFK 91/1 and TRFK 301/2 had the lowest mean values of EGCG with 0.36
%.

54
0.30
0.50
0.70
0.90
1.10
1.30
1.50
TR
FK
73
/7
TR
FK
KS
1
TR
FK
91
/2
ST
. 5
36
TR
FK
KS
2
TR
FK
31
/8
TR
FK
73
/5
TR
FK
6/8
TR
FK
83
/1
TR
FK
73
/4
TR
FK
30
3/2
16
TR
FK
14
/1
TR
FK
73
/2
GW
Eju
lu
TR
FK
KS
3
TR
FK
73
/1
TR
FK
73
/3
TR
FK
30
1/1
AH
P S
15
/10
ST
. 5
43
TR
FK
30
3/5
77
EP
K T
N 1
4/3
K-p
urp
le
TR
FK
91
/1
TR
FK
30
1/2
Clones
Ep
iga
llo
ca
tec
hin
ga
lla
te (
%)
Figure 35: Epigallocatechin gallate content in the studied clones/varieties
4.2.8 Caffeine content
Results are presented in Figure 36 and Appendix XII. Significant difference (p < 0.05) was
observed in caffeine content where TRFK 301/1 had the highest mean value of 3.96 % while
TRFK 91/1 had the lowest with 1.96 %. Most test clones had lower caffeine content than the
commercial clones.

55
1.80
2.30
2.80
3.30
3.80TR
FK 3
01
/1
TRFK
31
/8
TRFK
KS
3
GW
Eju
lu
TRFK
30
3/5
77
EPK
TN
14
/3
AH
P S
15
/10
TRFK
30
3/2
16
TRFK
30
1/2
TRFK
91
/2
ST. 5
43
K-p
urp
le
TRFK
73
/3
TRFK
14
/1
TRFK
6/8
TRFK
73
/7
TRFK
83
/1
TRFK
73
/4
ST. 5
36
TRFK
KS
2
TRFK
73
/2
TRFK
73
/4
TRFK
73
/5
TRFK
KS
1
TRFK
91
/1
Clones
Ca
ffe
ine
(%
)
Figure 36: Caffeine content in black tea studied
4.2.9 Sensory evaluation
The taster’s score on black tea is presented in Table 4 where mean scores are shown. The
scores are from 1-5. The lowest score represent the best quality and the highest score,
represent lowest quality as shown in Appendix II. There was a significant difference (P<
0.05) observed in all the sensory parameters. In this study, it was found out that, most clones
showed bright liquors. Some were brighter like clone EPK TN 14/3, TRFK 301/1, TRFK
301/2, TRFK 91/2 and clone TRFK 73/3. Clones TRFK 91/2 and clone TRFK73/3 are
coloured clones and their infusion colour was also bright as oppose to other coloured clones
which were fairly bright at best otherwise dull. Clones TRFK KS1 and TRFK KS 3 were
fairly bright in their liquors but dull and fairly bright infusions, respectively. On liquor body
(thickness), most clones were thick with a few test clones being fairly thick (TRFK 73/3,
TRFK 83/1 and TRFK KS1). Clones TRFK 73/2, TRFK 73/4, TRFK 73/7, TRFK KS1 and
K-Purple had liquors which were tending soft. Clone TRFK 73/3 and clone TRFK 14/1
among the test clones had strong liqours. Most test clones had brisk liquors - scores between
2 and 3 (Table 4) – but clone K-Purple was the most brisk with a score of 1.72. TRFK 73/7
scored last in briskness. Infusion colour varied, with most test clones showing dull infusions.
The tea leaves colour intensity differ such that more purplish tea leaves appear duller in the

56
infusion. Some test clones e.g TRFK 14/1 and TRFK 91/2 however, had bright infusions
though the former is green and the latter is a purple clone.
Table 4: Sensory evaluation of black tea
Liqour
colour
Liqour
body
Liqour
strength
Liqour
briskness
Infusion
colour Average
score
Commercial clones
TRFK 303/577
3.11abc
3.00ab
3.22abcd
2.78abcd
1.61j 2.74
EPK TN 14/3
2.92bc
3.25ab
3.53abc
2.39abcde
3.39abcde
3.10
TRFK 31/8 3.00bc
3.50ab
3.33abcd
2.78abcd
2.28fghij
2.98
ST.536* 3.11abc
3.92a 3.67
abc 2.78
abcd 2.28
fghij 3.42
AHP S 15/10
3.00bc
3.08ab
3.00abcde
2.72abcde
2.28fghij
2.92
TRFK 301/1 2.83bc
3.08ab
3.56abc
2.89abc
2.28fghij
2.88
TRFK 6/8 3.11abc
3.08ab
2.73cde
2.39abcde
2.28fghij
2.69
GW Ejulu 3.11abc
3.00ab
3.72ab
2.50abcde
2.28fghij
2.87
TRFK 301/2 2.92bc
3.00ab
3.83ab
2.22cde
2.28fghij
2.89
ST.543 3.00bc
3.33ab
3.78ab
3.08ab
2.28fghij
3.20
TRFK 303/216
3.22abc
3.00ab
3.78ab
2.89abc
2.28fghij
3.01
Test clones
TRFK 91/2* 2.77c 3.08
ab 3.00
abcde 2.44
abcde 1.97
ij 2.65
TRFK 73/4 3.08abc
3.08ab
3.92a 2.33
bcde 4.08
a 3.30
TRFK 73/3 2.92bc
3.69ab
2.11e 2.83
abcd 2.92
cdefg 2.89
TRFK 83/1 3.11abc
3.67ab
2.89bcde
2.06de
3.36abcde
3.02
TRFK 73/5 3.11abc
3.00ab
2.89bcde
2.28cde
3.44abcde
2.94
TRFK 73/7 3.11abc
3.00ab
3.78ab
3.17a 4.00
a 3.41
TRFK 73/2 3.00bc
2.92ab
3.50abc
2.97abc
2.86defgh
3.05
TRFK KS 2 3.00bc
3.14ab
3.36abcd
2.78abcd
3.06bcdef
3.07
TRFK 91/1 3.03abc
3.00ab
3.45abc
2.72abcd
3.39abcde
3.12
TRFK 14/1 3.08abc
3.00ab
2.44de
2.44abcde
2.61efghi
2.71
TRFK KS 1 3.78ab
3.44ab
3.61abc
2.50abcde
4.00a 3.47
TRFK 73/1 3.08abc
2.78b 3.50
abc 2.78
abcd 3.86
ab 3.20
TRFK KS 3 3.99a 3.08
ab 3.39
abc 2.61
abcd 2.67
efghi 3.15
K-Purple 3.00bc
3.00ab
3.58abc
1.72e 3.75
abc 3.01
CV % 18.69 20.93 17.48 18.4 18.48

57
*Flavoury. Means followed by the same letter along the column are not significantly different
at p< 0.05. n= 75.
4.2.10 Correlation coefficient between the quality parameters and sensory evaluation
Results on correlation are shown in Table 5 below. There was a significant correlation
between total thearubigins and tasters score on the liquor body and strength with r - value of
0.587 and 0.5568, respectively. The low r - value when thearubigin was correlated with liqour
briskness shows there was no correlation. There was, however, a weaker correlation with an r
– value of 0.4021 between the total theaflavins and total colour scored by the tasters,
compared to stronger correlation between TF and tasters score on briskness of the liquor with
an r - value of 0.6137. The correlation between total colour and liquor strength, briskness was
very strong with r - values of 0.9737 and 0.8330, respectively. Correlation between
brightness percentage and liquor body and briskness was also very strong with r - values of
0.9093 and 0.9960, respectively. The correlation between total soluble solids and liquor body
was weak with an r - value of 0.3997.
Table 5: Matrix for tea quality parameters and tasters score. N = 75
Liqour colour
Liqour body
Liqour strength
Liqour briskness TR
Total colour Brightness TSS TF
Liqour colour 1
Liqour body 0.3 1
Liqour strength 0.03 0.76*** 1
Liqour briskness 0.75*** 0.01 0.07 1
TR 0.13 0.59* 0.56* 0.04 1
Total colour 0.39 0.02 0.97*** 0.83*** 0.68** 1
Brightness 0.4 0.91*** 0.23 0.99*** 0.59* 0.81*** 1
TSS 0.1 0.4 0.05 0.16 0.08 0.35 0.57* 1
TF 0.4 0.12 0.03 0.61** 0.3 0.54* 0.65** 0.62** 1
* Correlation significant at the p ≤ 0.05 level
** Correlation significant at the p ≤ 0.01 level
*** Correlation significant at the p ≤ 0.001 level
TR = Total Thearubigins
TSS = Total soluble solids; TF = Total theaflavins
4.3 Discussion
Total polyphenols is a general term referring to catechins, catechin gallates, phenolic acids
and flavonoid glycosides. The level of total polyphenols of fresh tea shoots is important to tea
quality, and may be a reliable parameter for identifying and propagating potential high

58
quality clonal tea plants (Obanda et al., 1997). At The Research Foundation of Kenya, clone
6/8 is used as a reference clone in total polyphenol such that teas can be categorized as
follows;
High quality teas have 24.80 - 27.07 % TPP; Medium high quality have 22.47- 24.40 % TPP;
Medium quality have 19.57 – 22.33 % TPP; Low quality teas have 17.53 – 19.17 % TPP.
From the results of this study, we can group the test clones as;
High quality only K- Purple ; Medium high quality, include, TRFK 91/1, TRFK 91/2, TRFK
KS1, TRFK 73/3, TRFK KS3, TRFK 83/1, TRFK 73/5 and TRFK 73/2; Medium quality,
include, TRFK 14/1, TRFK 73/4, TRFK 73/1, TRFK 73/7 and TRFK KS2. There were no
low quality teas as far as TPP is concerned. Most test clones had a mean above 21 % on TPP
except clone TRFK 73/7 which had 20.82 %, though better than the control clone Yabukita
which had 17.16 %. The differences in polyphenol content among the clones could be due to
differences in their botanical origin. Yabukita clone is a Japanese clone while K-purple which
had high total polyphenol is of Kenyan origin. The high polyphenol content in Kenyan tea is
expected since the tea breeding programme in Kenya has indirectly and consistently selected
tea germplasm for high total phenol content to produce good teas with high levels of
theaflavins and thearubigins. A study by Wachira and Kamunya, (2005), confirmed the
superiority of Kenyan tea germplasm in total polyphenol content and that is why Kenyan teas
are used for blending in other countries. Tea germplasm from Japan and China that is
traditionally used for green tea manufacture has low total polyphenols and consequently low
in astringency and bitterness. Usually green teas originating from India or Sri Lanka have
higher polyphenol content than those from China (Harbowy and Balentine, 1997). The 73
series clones (TRFK 73/1, TRFK 73/2, TRFK 73/4, and TRFK 73/5) are from China
seedlings while TRFK 91/1 and TRFK 91/2 are a selection from C. irrawadiensis seedlings
from Tocklai, India (Anonymous, 1998). The variation in TPP could also be genetic since
clones TRFK 303/577 and TRFK 303/216 are progenies of TRFK 6/8 which they all had high
TPP content.
The major catechins in green tea leaf consist of (-) epicatechin , (-) epigallocatechin,
(-) epigallocatechin gallate and epicatechin gallate. The low mean values of total catechins in
clones TRFK 91/1, TRFK 73/3, TRFK 91/2 could be attributed to high mean values of
theanine content and this trend was vice versa for clone TRFK 83/1. The low mean values of
total catechins in K-Purple could be because of low precursor theanine as shown by the
results. This is supported by work done by Kito et al., 1968. It is expected that those clones
with high TPP should be having high total catechins but from the results, though clones
59
TRFK 6/8 and TRFK 31/8 had high TPP, they showed low total catechins. This shows that
other phenolic compounds could be contributing to TPP. Individual catechins were also
investigated and this was necessary since it can help predict expected theaflavins in black tea
manufacture.
Caffeine and gallic acid (GA; 3, 4, 5-trihydroxybenzoic acid), are important natural
polyphenolic compounds in tea. Phenolic acids are aromatic secondary plant metabolites,
widely spread through the plant kingdom (Anonymous, 2009). The basic feature of phenolic
acids is the presence of one or more hydroxylated benzene rings. High gallic acid content can
be found in gallnuts, grapes, sumac, witch hazel, tea leaves, hops, and oak bark. Caffeine
content decreases with increasing leaf maturity of tea. Gallic acid is commonly used in the
pharmaceutical industry (Fiuza et al., 2004). It is also used as a standard for determining the
phenol content of various analytes by the Folin - Ciocalteau assay. The high levels of gallated
catechins shown by clone TRFK 91/1 is because of high gallic acid. AHP S 15/10 had high
gallation probably because of low free catechins and high galloyl catechins. Caffeine is
responsible for the briskness of tea liquors and these can explain the astringency noted in
clones; GW Ejulu, TRFK K S 2, TRFK 73/3. Caffeine in tea prevents tumorigenesis (Lin and
Liang, (2000). These results can guide breeders for selection of low caffeine tea or otherwise.
This study found TRFK 6/8 and TRFK 73/3 having low caffeine and this is important when
low caffeine tea is required.
Most of the test clones had above 1.5 % theanine except clones K- Purple and TRFK
83/1 which both had 1.10 %. Subsequently the tea taster’s comments on clone K-purple
reflected the results, in the sense that, though it was bright and thick, it had fair strength and
briskness. Taster’s comments on clone TRFK 83/1 were, however, better, meaning the
theanine content in this clone were sufficient enough to make good tea liqour. The two clones
(K-Purple and TRFK 83/1) were also found to be flavoury by the taster and this can be
attributed to theanine content because it’s sweet and brothy (Hara et al., 1995c). The taster’s
comment on the rest of the test clones were good except a few which fermented slightly may
be because of the long time of processing considering the many samples handled. Theanine is
a precursor for the biosynthesis of the catechins in tea leaves (Kito et al., 1968). This
conversion is known to be controlled by light because large quantities of theanine accumulate
instead of being converted to catechins in shaded tea leaves and result in lower catechin
levels than that in unshaded leaves (Kito et al., 1968). In this study some clones showed this
trend of high theanine, low total catechins like clone TRFK 301/1. Some clones however,
showed low theanine and low catechin levels like clone TRFK 6/8 but high total polyphenols.

60
The astringency showed by some clones could be attributed to high total polyphenol and
Yabukita clone which had the lowest TPP had the lowest score in briskness.
Most clones had good liquor body because most of them had high TPP though
Yabukita showed low liquor body may be because of low TPP. The flavoury taste in clones,
ST.536, TRFK 91/1, TRFK 73/3 and TRFK 73/4 can be attributed to high levels of theanine.
The green tea liquors in this study were generally of good briskness because of the displayed
high quality parameters. Infusion colour of all clones studied were good, displaying high
quality teas even in clones generally meant for black tea. The low strength liquor of K-
Purple could be due to the low theanine content. GW Ejulu was astringent and this could be
because of high levels of ECG since gallated catechins are particularly astringent (Hara,
2001). From the average scores, it was observed that, most test clones, in fact the first best
five, were the test clones including TRFK 73/2, TRFK KS 2, TRFK 83/1, TRFK 73/3 and
TRFK K S 1. TRFK KS 3 had the poorest average among the test clones but indeed had good
black tea quality parameters. TRFK 303/577 had good sensory scores both in green and black
tea. TRFK 73/1 scored poorly in sensory evaluation both as green and black tea.
There was no correlation found between some variables, however, the strong
correlation between TPP and individual catechins is expected since catechins constitutes 60-
80 % of the total amount of polyphenols (Hara et al., 1995c).
For the purpose of discussion in black tea experiment, clone TRFK 6/8 will be used as
a reference standard. Clone TRFK 6/8 is used at the Tea Research Foundation of Kenya as
quality standard clone in most trials.
The standard clone TRFK 6/8 had the highest mean value of TF by Flavognost
method supporting its known superiority in quality. TRFK KS3 had the highest mean value
among the test clones with 23.47µmoles/g. This might have contributed to the good liquor
colour and briskness noted by the tea tasters. Other test clones were of average theaflavins
mean values as shown in Figure 21 except clone TRFK 73/3 and TRFK 91/1 which showed
relatively low mean values. The tasters noted the low strength in TRFK 91/1 though it was
rated as flavoury. Theaflavins affects the total colour of the tea infusion, as observed from the
results, those clones showing high values of theaflavins showed high total colour (Figure 22).
Brightness percentage measured by spectrophotometer, showed clone TRFK 73/2 having
higher mean value than the standard TRFK 6/8 with 33.35 % and 33.07 %, respectively
though not significantly different (p < 0.05) (Figure23). This can be attributed to high mean

61
values of theaflavins. This is because theaflavins contribute to brightness of the liquor (Hilton
and Ellis, 1972). Most of the test clones had mean values above 20 % brightness though
clones TRFK 73/3, TRFK 91/2 and TRFK 91/1 had lower mean values of brightness. These
clones also had less strength and briskness but had flavour. This could be because of the
relatively low values of theaflavins, both simple and total theaflavins (Figures 24 and 21).
The low percentage brightness in clones TRFK 73/3, TRFK 91/2 and TRFK 91/1 could also
be attributed to the relatively higher mean values of TR S II. This is because TR S II
influences liquor brightness negatively (Obanda et al., 2001). The dull infusion colour shown
by most test clones could be because of the purplish colour of the leaves. The tea leaves
colour intensity differ such that more purplish tea leaves appear duller in the infusion. Some
test clones e.g TRFK 14/1 and TRFK 91/2 however, had bright infusions though the former is
green and the later is a purple clone. Clone TRFK 14/1 infusion brightness could be because
of high TF by Flavognost method.
There was no significant difference (p< 0.05) noted between the standard and the
test clones in total thearubigins as reported in Appendix XI. This could be because same
duration and time of fermentation was used uniformly during black tea manufacture. This
trend of non-significance also may indicate that total thearubigins might not be used in clonal
selection in quality experiments. There was, however, significant difference (p< 0.05) noted
in TR S 1 and TR S 11. TR S 11 has been found to have more influence in liquor brightness
(Obanda et al., 2001) than TR S 1 may be because of its relatively higher amount. Clones
TRFK 91/2, TRFK 91/1 and K-purple had mean values above 10 % of TR S II. These high
values could be because of the high total polyphenols which these clones had as shown in
green tea experiment.
Total soluble solids results are impressive since nearly all clones had above 33 %
except TRFK 73/2 which had 28.48 % though it had high TPP and total theaflavins. This
shows this clone can still make good black tea.
As reported in literature, the formation of a single theaflavins molecule requires a
dihydroxy and a trihydroxy flavan-3-ol (Obanda et al., 2001). The formation is as follows;
Epicatechin (EC) + Epigallocatechin (EGC) = simple theaflavin (TF).
EC + Epigallocatechin gallate (EGCg) = Theaflavin-3-gallate (TF-3-g)
Epicatechin gallate (ECG) + EGC = Theaflavin-3’-gallate (TF-3’-g)
ECG + EGCg = Theaflavin-3, 3’-digallate (TF dg).

62
According to Owuor and Obanda, (2007), the amount of the individual theaflavins formed are
largely influenced by the amounts of the precursor catechins in green leaf, their redox
potential and / or affinity for polyphenol oxidase and activity. Clones TRFK 303/216 and
TRFK 6/8 had high residual EC and EGC (Figures 32 and 33) and consequently relatively
high simple theaflavins (Figure 24). Clones TRFK 91/1, TRFK 73/3, K-Purple and GW Ejulu
on the other hand had relatively low EC, EGC and consequently low simple theaflavins mean
values. The relatively high mean value of TF- 3-g showed by clone TRFK 303/1 could be
attributed to the relatively high EC content (Appendix IX). Clones TRFK 73/3 and TRFK
91/1 on the other hand showed low TF-3-g mean values may be because of relatively low EC
and EGCG values. It’s however worth noting here that, TRFK 301/2 had low EC and EGCG
(Appendix VIII) but high TF-3-g (Figure 23). Clones TRFK 6/8, TRFK 303/216 and TRFK
K S3 had relatively high TF-3’-g and this may be attributed to the relatively high EGC
though TRFK had low ECG. The relatively low TF-3’-g mean values by clones TRFK 91/1,
TRFK 73/3 and TRFK 73/7 could be attributed to the low values of EGC. GW Ejulu had high
ECG, low EGC and consequently low TF-3’-g meaning that EGC is a limiting factor in
theaflavin formation. Clones GW Ejulu and K-Purple had relatively higher TF dg may be
because of the relatively high ECG mean values. The two clones never had high EGCG
meaning that, it is ECG which is limiting the formation of TF dg. The low TF dg mean value
showed by clone ST. 543 can be attributed to the low ECG and EGCG (Appendix VIII).
Residual catechins results reveals that despite the oxidation which takes place during
aeration, some catechins remains unoxidised though when compared to green tea is relatively
low. Special interest is on EGCG which is the most abundant and bioactive tea catechin
(Cabrera et al., 2006). It has potential health benefits including cancer chemoprevention
(Hsuuw and Chen, 2007), improving cardiovascular health (Hirai et al., 2007), and
antioxidant properties (Fu and Koo, 2006). There is however evidence that EGCG is a pro-
oxidant in higher concentrations (Bandele and Sheroff, 2008; Lambert et al., 2010, Rohde et
al., 2011) and this warrant clear clinically proven recommended tolerant concentrations.
Caffeine acts as a diuretic, cardiac muscle stimulant, central nervous system
stimulant, smooth muscle relaxant, gastric acid secretion stimulant, elevates plasma free fatty
acids and glucose (Harbowy and Balentine, 1997). Caffeine levels vary from 5.30 % for 1
bud 1 leaf; to 4.20 % for 1 bud 2 leaves; to 3.80 % for 1 bud 3 leaves; and to 3.20 % for 1 bud
4 leaves (Dev Choudhury et al., 1991). Thus, the caffeine content decreases as the leaf ages

63
or matures. Accordingly, teas made from pruned shoots have higher caffeine contents
because of more young tender shoots. During withering and the entire processing of black
tea, caffeine content increases marginally. This explains why caffeine is higher in black tea
than in green tea (Appendix XII and Appendix VIII). Caffeine of an infused brew is
responsible for the briskness of the tea liquor; this is due to its association with theaflavins.
Results of this study found out the clonal variations in caffeine levels. The levels ranged from
3.95 – 1.96 %, though the samples were the same in quality (2 leaves and a bud), meaning
caffeine levels vary from clone to clone. These results can guide on clonal selection for low
or high caffeine tea products.
During the sensory evaluation of black tea, the tasters’ judgement is usually based on
the colour, strength, briskness, flavour and overall quality of the tea (Hilton and Ellis, 1972).
Theaflavins contribute to all of these characteristics but some other components such as
thearubigins, caffeine and volatile flavour compounds also have some effects (Owuor, 1982).
Theaflavin digallate can better describe the quality of Kenyan black teas than the use of total
theaflavins (Owour and Obanda, 1995). Among the four common theaflavins, (TF, TF-3-g,
TF-3’-g and TF dg) theaflavin digallate (TF dg), influences tea liquor characteristic even at
very low concentration because it possesses the strongest astringency (Owour and Obanda,
1995). The tasters noted low liquor briskness in clone TRFK 73/7 and this can be attributed
to low TF dg. Clone TRFK 73/4 had tea liquor tending to soft and this can also be attributed
to the low TF dg mean values displayed by this clone. From the results, it can be seen, TF dg
was a dominating theaflavin in GW Ejulu clone. These results agree with an earlier study
done by Owour et al., (2006), where they found most commercial Kenyan cultivars have
simple theaflavin dominating including TRFK 6/8 but GW Ejulu had TF dg dominating. The
good briskness of K – Purple and GW Ejulu can be attributed to the high TF dg they
displayed. K-Purple had high TFdg because it had low EGC hence allowing the reaction
between EGCG and ECG to form high TF dg. K- purple’s high briskness is also necessitated
by high residual ECG because retention of higher epicatechin gallate (ECG) and
epigallocatechin gallate (EGCg) levels produce more brisk tea liquors (Obanda et al.,2001).
From the average scores, TRFK 91/2 and TRFK 14/1 had the best score value of 2.65 and
2.71, respectively with the former scoring best in infusion colour and the latt78iujer in liquor
strength and briskness. TRFK 91/2 had relatively high amount of theaflavin digallate, TR S II
and even caffeine giving good liquor briskness. TRFK 14/1 had high total theaflavins and
consequently total colour and brightness though it had low theaflavins digallate. These results

64
showed that many factors including the above determine the liquor strength and briskness
alongside theaflavins digallate. TRFK K S 1 and TRFK 73/7 averaged poorest with 3.47 and
3.41 scores, respectively but particularly poor in infusion colour. TRFK K S I however, had
good liquor briskness. It is also worth noting here that, TRFK K S I was among the best in
green tea.

65
CHAPTER FIVE
CONCLUSIONS AND RECOMMENDATIONS
5.1 Conclusions
(1) Most test clones had more theanine content than the control clone Yabukita except clone
TRFK 83/1 and K- Purple. All the test clones had higher total polyphenols than the Japanese
clone (Yabukita) showing superiority of Kenyan green tea. Except for clones TRFK 73/7 and
TRFK 73/4 which had similar total catechins as Yabukita, the rest of the test clones had
lower mean values of total catechins than the control (Yabukita).
(2) (a) Most commercial clones had more total theaflavins than the test clones, however,
clone TRFK KS 3 had more total theaflavins than some commercial clones. The control
clone, TRFK 6/8, however had more total theaflavins than all the test clones. Among
individual theaflavins, theaflavin digallate is the most important in liquor quality because it
influences astringency even at very low concentration. Some test clones like K- Purple,
TRFK KS 3, TRFK KS 2 and TRFK 91/2 had more theaflavins digallate than clone TRFK
6/8. Some test clones however had lower theaflavins digallate like clone TRFK 73/7, TRFK
14/1 and TRFK 73/4 than the control clone, TRFK 6/8.
(b) There is no significant difference (p > 0.05) among the test clones and commercial clones
on total thearubigins. Clones TRFK K S 3 and TRFK 73/1 had higher TR S I fraction than the
standard clone TRFK 6/8. The rest of the test clones had lower mean values of TR S I than
the reference clone. Clone TRFK 91/2 had higher TR S II percentage than the rest of the test
clones and even higher than the standard clone.
(c) Clones TRFK 91/1, TRFK K S I, TRFK KS II and TRFK 83/1 had relatively higher total
soluble solids than TRFK 6/8, while the rest of the test clones had lower or equal percent of
total soluble solids. Clone TRFK 73/2 had similar brightness as clone TRFK 6/8 but the rest
had lower brightness than the control. All the test clones were lower in total colour than clone
TRFK 6/8. Some however, can still make good black tea as seen from the sensory evaluation.
(3) Total colour and brightness correlate strongly with liquor briskness and strength meaning,
the higher the above parameters, the stronger and brisker the liquor. Total soluble solids also
affect the strength of the liquor such that the more the soluble solids, the higher the tea liquor
strength.

66
5.2 Recommendations
Low levels of catechins and theanine in K-Purple should be investigated. Low
catechins and high total polyphenols in TRFK 91/1 warrant an investigation.
Other polyphenols apart from catechins should be studied since it might not be true
that the higher the catechins the higher the total polyphenols.
When theanine is the target parameter, the teas should be shaded or harvested at night
since in presence of sunlight, theanine is converted to catechins
Since this work was done using samples from Kangaita only , I recommend that these
test clones be planted in other areas and their quality assessed.
Optimal manufacturing conditions of each clone especially those that can be made
black should be confirmed since all the clones were manufactured using same
standard time of 90 minutes and uniform controlled aeration.
Study on the variation of theanine levels with seasons should be done in these clones.
The effect of anthocyanin presence in relation to black tea quality paratemers
(theaflavins and Thearubigins) should be studied in details.
Recommended clones for green tea; TRFK 91/1, TRFK 91/2, TRFK 73/2, TRFK
73/3, TRFK 73/4, TRFK 73/5 , TRFK 83/1, TRFK K S 1,TRFK K S 2, TRFK K S 3
Since the taster could repeatedly identify TRFK K S 1 as a purple tea, it can be used
as a reference standard for green purple tea.
Recommended clones for black tea based on these findings; TRFK K S 3, TRFK 91/2,
K- Purple, TRFK K S 2, TRFK 14/1
67
REFERENCES
Almajano, P.M., Rosa, C., Jimenez, L., and Gordon, H. (2008). Antioxidant and
antimicrobial activities of tea infusions. Food Chem., 108: 55-63.
Amie, D., Amie, DD., Beslo, D. and Trinajstie, N. (2003). Structure-radical scavenging
activity relationships of flavonoids. Croat.Chem. Acta.76:55-61.
Anonymous. (1998). TRFK Annual Report for 1998. Tea Research Foundation of Kenya. pp
32-33.
Anonymous, (2002). The Tea Growers Hand Book. 5th
Edn. The Tea Research Foundation of
Kenya Printing Services, pp: 31.
Anonymous (2006). Annual technical report. Tea Research Foundation of Kenya. (TBK),
48-49.
Anonymous (2007). Annual bulletin of statistics. International Tea Committee (London).
Anonymous, (2008). Tea Board of Kenya Annual report and accounts. Tea Board of Kenya
Anonymous. (2009). Food and Agricultural Organization of the United Nations, (FAO)
Anonymous, (2010). Kenyan tea industry performance in 2010. The Tea Board of Kenya.
Anonymous (2011). Kenya Tea Industry Performance in 2011. The Tea Board of Kenya.
Anonymous, (2011). Tea Board of Kenya Statistics.Nairobi: Tea Board of Kenya.
Ashihara, H., Deng, W.W. and Ogita, S. (2010). Distribution and biosynthesis of theanine in
Theaceae plants. Plant Phy. And Biochem. 48 (1): 70-72.
Bailey, R.G., McDowell, I. and Nursten, H.E. (1990). Use of an HPLC Photodiode-Array
detector in a study of the nature of black tea liquor. J. of Sci. and Food Agric. 52:
509–525.
Balentine, D.A., Wiseman, S.A. and Bouwens, L.C.M. (1997). The chemistry of tea
flavonoids. Crit. Rev. Food Sci. Nutr. 37(8): 693-704.
Bandele, O.J. and Osheroff, N. (2008). (-)-epigallocatechin gallate, a major constituent of
green tea, poisons type II topoisomerases. Chem. Res. Toxicol., 21: 936-943.
Biswas, A. K.,Sarkar, A. R., and Biswas, A. K. (1973). Biological and chemical factors
affecting the valuations of North East India planters. III. Statistical evaluation of the
biochemical constituents and their effects on colour, brightness, and strength of black
teas. J. Sci. and Food Agric. 24: 1457–1477.
Bolling, B.W. and Chen, C.Y. (2009). Tea and health: Preventive and therapeutic usefulness
in the elderly. Current Opinion in Clinical Nutrition and Metabolic Care. 12: 42–48.

68
Brown, A.G., Eyton, W.B., Hohnes, A. and Ollis, W.D. (1969). The identification of
thearubigins as polymeric proanthocyanidins. Phytochem., 8: 2333–2340.
Cabrera, C., Gimenez, R., and López, M.C. (2003). Determination of tea components with
antioxidant activity. J. Agric. Food Chem., 51 (15): 4427-4435.
Cabrera, C., Artacho, R. and Gimenez, R. (2006). Beneficial effects of green tea - A review.
J. Am.Coll. Nutr., 25: 79-99.
Caffin, N., D'Arcy, B., Yao, L. and Rintoul, G. (2004). Developing an index of quality for
Australian tea. Rural Industries Research and Development Corporation Publication
No. 04/033. ISBN 0 642 58743 4.
Cho, H.S., Kim, S., Lee, S.Y., Park, J.A., Kim, S.J. and Chun, H.S. (2008). Protective effect
of the green tea component, l-theanine on environmental toxins-induced neuronal cell
death. Neuro Toxicol. 29: 656–662.
Cloughley, J.B. (1980a). The effect of fermentation temperature on the quality parameters
and price evaluation of Central African black teas. J. Sci. Food Agric. 31: 911-919.
Del Pozo-Insfran, D., Del Follo-Martinez, A., Talcott, S.T. and Brenes, C.H. (2007). Stability
of copigmented anthocyanins and ascorbic acid in muscadine grape juice processed
by high hydrostatic pressure. J. Food Sci. 72 (4): 247–253.
Dev Choudhury, M.N., Rahman, F. and Barbora, B.C. (1991). Caffeine content in teas of
North East India - a review. Two and A Bud. 38(1/2): 3-8.
Egashira, N., Hayakawa, K., Mishima, K., Kimura, H., Iwasaki, K. and Fujiwara, M. (2004).
Neuroprotective effect of γ-glutamylethylamide (theanine) on cerebral infarction in
mice. Neuroscie. Letters. 36: 58–61.
Ekborg-Ott, K. H., Taylor, A., and Armstrong, D. W. (1997). Varietal differences in the total
and enantiomeric composition of theanine in tea. J. of Agric. and Food Chem. 45:353-
363.
Ercisli, S., Orhan, E., Ozdemir, O., Sengul, M. and Gungor, N. (2008). Seasonal variation of
total phenolic, antioxidant activity, plant nutritional elements, and fatty acids in tea
leaves (Camellia sinensis var. sinensis clone Derepazari 7) grown in Turkey.
Pharmac. Biol. 46 (10): 683-687.
Fernandez, P. L., Pablos, F., Martin, M. J. and Gonzalez, A. G. (2002). Study of catechin and
xanthine tea profiles as geographical tracers. J. of Agric. and Food Chem. 50: 1833-
1839.
Fiuza, S.M., Gomes, C., Teixeira, L.J.,Giraoda cruz M.T., Cordeiro M.N., Milhazes N.,
Borges F. and Maques M.P. (2004). Phenolic acid derivatives with potential

69
anticancer properties – a structure – activity relationship study. Part 1. Methyl,prophyl
and octyl esters of caffeic and gallic acids. Bioorg. Med. Chem. 12(13): 3581- 3589.
Food and Agricultural Organization of the United (FAO) corporate document repository,
(2001). Committee on commodity problems. Fourteenth session of the
Intergovernmental Group on Tea, New Delhi,India, 10-11 Oct. 2001.
Fu, Y. and Koo, M.W. (2006). EGCG protects HT-22 cells against glutamate - induced
oxidative stress. Neur. Res., 10: 23-30.
Graham, H.N. (1992). Green tea composition, consumption, and polyphenol chemistry. Prev.
Med. 21: 334-350.
Gianturco, M.A., Biggers, R.E., Riddling, B.H. (1974). Seasonal variations in the
composition of the volatile constituents of black tea. A numerical approach of the
correlation between composition and quality of tea aroma. J. Agric. Food Chem. 22:
758–764.
Golding, J. Roach, P. and Parks, S. (2009). Production of high quality export green tea
through intergrated management. Rural Industries Research & Development
corporation publication No. 09/124 pp. 1 and 43.
Gomes, A., Veda Siromoni,J.R.,Das,M.,Sharma,R.M. and Ganguly, D.K. (1995). Anti-
hyperglycemic effect of black tea (Camellia Sinensis) in rat. J.Ethnopharmacol.
45(3):223-226.
Gosslau, A. and Chen, K.Y. (2004). Nutraceuticals, apoptosis, and disease prevention. Nutr.
20 (1): 95-101.
Graham, H.N. (1992). Green tea composition, consumption, and polyphenol chemistry. Prev.
med. 21(3): 334-350.
Gramza, A., Khokhar, S., Yoko, S., Swiglo, A.G., Hes, M., and Korczak, J. (2006).
Antioxidant activity of tea extracts in lipids and correlation with polyphenol content.
Eur. J. Lipid Sci. Tech.,108: 351-362.
Hakim, I.A. and Chow, S.H. (2004). Green tea, polyphenol and cancer prevention in:
“Proceedings International Conference on Ocha (Tea) Culture and Science”. Nov 4-6,
2004. Shizuoka. Japan
Hampton, M. G. (1992). Production of black tea. In Tea Cultivation to Consumption, ed. K.
C. Willson & M. N. Clifford. Chapman and Hall, London, pp. 459-511.
Hara, Y., Luo, S.J., Wickremasinghe, R.L. and Yamanishi, T. (1995). Special issue on
tea. Food Rev. Int. 11(3): 371-545.

70
Hara, Y., Luo, S.J., Wickremasinghe, R. L. and Yamanishi, T. (1995c). Chemical
composition of tea. Foods Rev. Int. 11: 435-456.
Hara, Y., Luo, S.J., Wickremasinghe, R. L. and Yamanishi, T. (1995d). Biochemistry and
processing black tea. Foods Rev. Int. 11: 457-471.
Hara, Y. (2001). Green tea: Health benefits and applications. Marcel Dekker, Inc., New
York, USA.
Harbowy, M.E. and Balentine, D.A. (1997). Tea chemistry. Crit. Rev. Plant Sci. 16(5): 415–
480.
Haslam, E. (2003). Review on the chemistry of tea leaf fermentation. Phytochem. 64 (1): 61-
73.
Herath, D. and Weersink, A. (2007). Peasants and plantations in the Sri Lanka tea sector:
Causes of change in their relative viability. Aust. J. of Agric. Res. Econ. 51:73–89.
Higdon, J. V. and Frei, B. (2003). Tea catechins and polyphenols: Health effects, metabolism,
and antioxidant functions. Critical Reviews in Food Sci. and Nutr. 43: 89-143.
Hilton, P.J. and Ellis, R.T. (1972). Estimation of the market value of Central African tea by
theaflavins analysis. J. Sci. Food Agric. 23: 227-232.
Hilton, P. J. (1973). Tea. In:. Ency.of Indust. Chem. Analysis. Snell, F.D. and Ettre, L.C. 18:
455-516. John Wiley, New York.
Hirai, M., Hotta, Y., Ishikawa, N., Wakida, Y., Fukuzawa, Y., Isobe, F., Nakano, A., Chiba,
T. and Kawamura, N. (2007). Protective effects of EGCG or GCG, a green tea
catechin epimer against postischemic myocardial dysfunction in guinea-pig hearts.
Life Sci., 80: 1020-1032.
Hsuuw, Y. and Chen, W. (2007). Epigallocatechin gallate dose-dependently induces
apoptosis or necrosis in Human MCF-7 cells. Ann. N.Y. Acad. Sci., 1095: 428-440.
Jackman, R. L. and Smith, J. L. (1996) In: Natural Food Colorants. Hendry G. A. F. and
Houghton J.D. (Ed.), London, Glasgow. PP 244-309.
Jansen, M. A. K., Gaba, V. and Greenberg, B.M. (1998). Higher plants and UV-B radiation
balancing damage, repair and acclimation. Trends in Plant Sci. 3:131-135.l
Johnson, A. L. (1987). Some comments on withering. Tea Research Foundation (Central
Africa), P.O. Box 51, Mulanje, Malawi.
Johnson, A. L. (1990). Manufacture - Section 14, Tea Planters Handbook. Tea Research
Foundation (Central Africa), P.O. Box 51, Mulanje, Malawi

71
Juneja, L. R., Chu, D.C., Okubo, T., Nagato, Y., and Yokogoshi, H. (1999). L-theanine--a
unique amino acid of green tea and its relaxation effect in humans. Trends in Food
Sci. and Technol. 10: 199-204.
Kamunya, S. M. (2003). Tea improvement: Strides, constraints and opportunities. Tea. 24:
38– 47.
Karori, S.M.,Wachira, F. N., Wanyoko, J. K. and Ngure, R. M. (2007). Antioxidant capacity
of different types of tea products. Afri. J. Biotechnol. 6 (19): 2287-2296.
Karori, S.M., Ngure, R.M., Wachira, F.N., Wanyoko, J.K. and Mwangi, J.N. (2008).
Different types of tea products attenuate inflammation induced in Trypanosoma
brucei infected mice. Parasit. Int., 57: 325-333.
Kawai, K. (2003). Epigallocatechin gallate, the main component of tea polyphenol, binds to
CD4 and interferes with gp120 binding. J. Allergy Clin Immunol. 112 (5): 951-957.
Keegal, E. L. (1950). Quick withering at high temperature. TRIP Ceylon Bulletin, 32:32-33.
Kerio, L.C., Wachira, F.N., Wanyoko, J.K. and. Rotich, M.K. (2011). Characterization of
anthocyanins in Kenyan teas: Extraction and identification. Food Chem.131 (1): 31-
38.
Khan, N. and Mukhtar, H. (2007). Tea polyphenols for health promotion. Life Sci. 81: 519–
533.
Kimura, K., Ozeki, M., Juneja, L.R., and Ohira, H. (2007). L-theanine reduces psychological
and physiological stress responses. Bio. Psych. 74: 39–45.
Kirca, A., Ozkan, M. and Cemeroglu, B. (2007). Storage stability of strawberry jam colour
enhanced with black carrot juice concentrate. J. Food Proc. and Pres.31 (5): 531-545.
Kito, M., Kokura, H., Izaki, J., and Sasaoka, K. (1968). Theanine, a precursor of the
phloroglucinol nucleus of catechins in tea plants. Phytochem. 7: 599-603.
Lambert, J.D., Kennet, M.J., Sang, S., Reuht, K.R., Ju, J, and Yang, C.S. (2010).
Hepatotoxicity of high oral dose (-)-epigallocatechin-3-gallate in mice. Food Chem.Toxicol.,
48: 409-416.
Lila, M.A. (2004). Anthocyanins and human health: An in vitro investigative approach. J.
Biomed. Biotechnol.5:306-313.
Lin, J.K., Lin, C.L., Liang, Y.C., Lin-Shiau, S.Y., and Juan, I.M. (1998). Survey of catechins,
gallic Acid, and methylxanthines in green, oolong, pu-erh, and black teas. J. of Agric.
and Food Chem. 46:3635-3642.
Lin, J.K. and Liang, Y.C. (2000). Cancer chemoprevention by tea poluphenols. Proc Natl.
Sci. Counc. Repub. China B. 24(1):1-13.

72
Lin, S. D., Lin, E. H. and Mau, J.L. (2008). Effects of different brewing methods on
antioxidant properties of steaming green tea. IWT- Food sci. and Technol. 41:1616-
1623.
Lu, S. H. (1987). Tea Evaluation and Inspection. 2nd edition. Agric. Press. Beijing
Luczaj, W. and Skrzydlewska, E. (2005). Antioxidative properties of black tea- A review.
Prev. Med. 40: 910-918.
Matsunaga, K. (2002). Epigallocatechin gallate, a potential immunomodulatory agent of tea
components, diminishes cigarette smoke condensate-induced suppression of anti-
Legionella pneumophila activity and cytokine responses of alveolar macrophages.
Clin. Diagn. Lab. Immunol. 9 (4): 864-71.
Maurya, P.K. and Rizvi, S.I. (2008). Protective role of tea catechins on erythrocytes subjected
to oxidative stress during human aging. Nat. Prod. Res., pp. 1-8.
Mazza, G. and Miniati, E. (1993). Grapes. In Anthocyanins in Fruits, Vegetables and Grains,
ed. G. Mazza, E. Miniati, pp. 149–99. Boca Raton, FL: CRC Press.
Mbata, T. I., Debiao, L. U. and Saikia, A. (2008). Antibacterial activity of the crude extract
of Chinese green tea (Camellia sinensis) on Listeria Monocytogenes. Afr. J. of
Biotech. 7 (10): 1571-1573.
McCann, D. Barrett, A. Cooper, A. Crumpler, D. and Dalen, L. (2007). Food additives and
hyperactive behavior in 3-year-old and 8/9-year-old children in the community: a
randomised, double- blinded, placebo controlled trial. Lancet. 370:1560–67.
McDowell, I., Feakes, J. and Gay, C. (1991). Phenolic composition of black tea liquors as a
means of predicting price and country of origin. J. Sci. Food Agric. 55: 627–641.
McDowell, I. and Taylor, S. (1993). Tea: types, production and trade. In R.Macrae, R.K.
Robinson and M.J.Sadler, (eds). Encyclo. of Food Sci., Food Technol. and Nutr.,
Academic Press, London. 7: 4521–4533.
Millin, D.J. (1987). Factors affecting the quality of tea. In. Quality Cont. in the Food Indust.
S.M. Herschdoerfer (Ed). 4: 127-160. Academic Press. London.
Mo, H., Zhu, Y. and Chen, Z. (2008). Microbial fermented tea- a potential source of natural
food preservatives. Trends in Food Sci. and Technol. 19: 124-130.
Ngure, F. M., Wanyoko, J. K., Mahungu, S. M. and Shitandi, A.A. (2008). Catechin
depletion patterns in relation to theaflavins and thearubigin formation. Food
Chem.115 (1): 8-14.
Obanda, M. and Owuor, P.O. (1992). The effect of chemical wither duration and dryer
type on quality of black tea manufactured in a commercial factory. Tea

73
13(1): 50-61.
Obanda, M., Owuor, P.O. and Bore, J.K. (1997). Effects of moisture loss and
temperature of leaf during withering on black tea quality parameters. Tea.
18(1): 45-50.
Obanda, M. Owuor, P.O. and Taylor, S.J. (1997). Flavanol composition and caffeine content
of green leaf as quality potential indicators of Kenyan black teas. J. Sci. Food Agric.
74 (2): 209-215.
Obanda, M., Owour, P.O. and Mangoka, R. (2001). Changes in the chemical and sensory
quality parameters of black tea due to variations of fermentation time and
temperature. Food chem., 75: 395-404.
Owuor, P.O. 1982. Can theaflavins content alone be adequate parameter in black tea quality
estimation? A review. Tea. 3: 36-40.
Owour, P.O and Obanda, M. (1995). Clonal variations in the individual theaflavins levels and
their impact on astringency and sensory evaluations. Food chem. 54: 273-277.
Owuor, P.O. (1996). Development of reliable quality parameters for black tea and
their application to quality improvement in Kenya. Tea. 17(2): 82-90.
Owuor, P.O and Obanda, M. (1997). The effects of some agronomic and processing practices
and clones on the relative composition of the theaflavins in black tea. Food
Sci.Technol. Int. Tokyo 3 (4): 344–347.
Owuor, P. O. and Obanda, M. (2001). Comparative responses in plain black tea quality
parameters of different tea clones to fermentation temperature and duration. Food
Chem. 72: 319-327.
Owuor, P.O, Obanda, M., Nyirenda, H. E., Mphangwe, N. I K., Wright, L. P. and Apostolides
Z. (2006). A relationship between some chemical parameters and sensory evaluations
for plain black tea (Camellia Sinensis) produced in Kenya and comparison with
similar teas from Malawi and S.Africa. Food Chem. 97 (4): 644- 653.
Owuor, P. O., and Obanda, M. (2007). The use of green tea (Camellia sinensis) leaf flavan-3-
ol composition in predicting plain black tea quality potential. Food Chem. 100:873–
884.
Owuor, P. O., Kamau, D. M., and Jondiko, E. O. (2009). Response of clonal tea to location of
production and plucking intervals. Food Chem. 115: 290–296.
Owuor, P.O., Obaga, S.O., Othieno, C.O. (1990). Effects of altitude on the chemical
composition of back tea. J. Sci. Food Agric. 50: 9–17.

74
Pourmorad, F., Husseinimehr, S.J. and Shahabimajd, N. (2006). Antioxidant, phenol and
flavanoid contents of some selected Iranian medicinal plants. Afric. J. of Biotech.
5:1142-1145.
Rijken, P.J. (2000). Antioxidant and other properties of green and black tea. in: E.Cadenas
and L.Packer . Handbook of Antioxidants. 2nd
ed. 19: 371-399. Marcel Dekker, New
York.
Roberts, E.A.H. (1962). Economic importance of flavonoid substances: tea fermentation. In:
The Chemistry of Flavonoid Compounds. T.A. Geissman (Ed). pp 409-512. Pergamon
press, Oxford.
Roberts, E.A.H. and Smith, R.F. (1963). Phenolic substances of manufactured tea.11.
Spectrophotometric evaluation of tea liquors. J. Sci. Food Agri. 14: 689-700.
Robertson, A. (1983a). Effects of physical and chemical conditions on the in vitro oxidation
of tea leaf catechins. Phytochem. 22 (4): 889-896.
Robertson, A. (1983b). Effect of catechin concentration on the formation of black tea
polyphenols during in vitro oxidation. Phytochem. 22 (4): 897-903.
Robertson, A. (1992). The chemistry and biochemistry of black tea production, the non
volatiles. In: Tea: Cultivation to consumption. pp 555-601; K.C. Wilson and M.N.
Clifford, Ed., Chapman and Hall: London, U.K.
Rohde, J., Jacobsen, C. and Kromann-Andersen, H. (2011). Toxic hepatitis triggered by green
tea. Ugeskr Laeger, 173: 205-206.
Saijo, R., and Takeo, T. (1973). Volatile and non-volatile forms of aroma compounds in tea
leaves and their changes due to injury. Agric. Biol. Chem. 37: 1367–1373.
Sakato, Y. (1949). The chemical constituents of tea III. A new amide theanine. J. of Agric.
and Food Chem. 23: 262–267.
Sanderson, G.W. and Graham, H.N. (1973). On the formation of black tea aroma. J. Agric.
Food Chem. 21: 576–585.
Sano, J. (2004). Effects of green tea intake on the development of coronary artery disease.
Circ J. 68: 665-70.
Sato, T. and Myata, G.(2000). The nutraceutical benefit, Part I: Green tea. Nutr. 16: 315-317.
Sharbert, S. and Hofmann, T. (2005). Molecular definition of black tea taste by means of
quantitative studies, taste reconstitution and omission experiments. J. of Agric. and
Food Chem. 53:5337-5384.
Skibola, C. and Smith, M. (2000). Potential health impacts of excessive flavonoid intake.
Free Radic. Biol. Med. 29 (3-4):375–383.

75
Snel, J. and Lorist, M.M. (2011). Effects of caffeine on sleep and cognition. Prog. Brain
Res.190:105-117.
Stapleton, P.D. (2004). Modulation of β-lactam resistance in Staphylococcus aureus by
catechins and gallates. I. J. Antimic. Ag. 23: 462-7.
Steinhaus, B. and Engelhardt, U.H. (1989). Comparison of the flavognost and HPLC
analysis of theaflavins- Preliminary results. Z. Lebensm. Unters Forsch. 188: 509–
511.
Sugiyama, T. and Sadzuka, Y. (2003). Theanine and glutamate transporter inhibitors enhance
the antitumor efficacy of chemotherapeutic agents. Biochimica et Biophysica Acta.
1653: 47–59.
Suzuki, M. (2004). Protective effects of green tea catechins on cerebral ischemic damage.
Med. Sci. Monit. 10 (6): 166-74.
Tiwari, B.K., O'Donnell, C.P., Patras, A., Brunton, N.P. and Cullen, P.J. (2009a). Effect of
ozone processing on anthocyanins and ascorbic acid degradation of strawberry juice.
Food Chem. 113 (4): 1119–1126.
Tiwari, B.K., O’Donnell, C.P. and Cullen, P.J. (2009b). Effect of non thermal processing
technologies on the anthocyanin content of fruit juices. Trends in Food Sci. &
Technol. 20 (3-4):137-145.
Tsong- Ming, L., Lee, C.C. Mau, J. L. and Lin, S. D. (2009). Quality and antioxidant
property of green tea sponge cake. Food Chem., 119 (3):1090 – 1095.
Wachira, F.N. and Kamunya, S. (2005). Kenyan teas are rich in antioxidant.Tea.26:81-89.
Wang, H., Provan, G. J. and Helliwell, K. (2000). Tea flavonoids: their functions, utilisation
and analysis. Trends in Food Sci. and Technol. 11: 152-160.
Watts, R., (1999). Improving farmer's income. Africa Farming and Food Processing, 9: 26-
28.
Wheeler, D.S., and Wheeler, W.J., (2004). The medicinal chemistry of tea. Drug Dev. Res.
61:45-65.
Wolfram, S. (2007). Effects of green tea and EGCG on cardiovascular and metabolic health.
J.Am.Coll.Nutr.26 (4):3735-3885.
Wrolstad, R.E., Durst, R.W. and Lee, J. (2005). Tracking color and pigment changes in
anthocyanin products. Trends Food Sci. Technol. 16: 423-428.

76
Wright, L.P., Mphangwe, N.I.K., Nyirenda, H.E. and Apostolides, Z. (2002). Analysis of the
theaflavin composition in black tea (Camellia sinensis) for predicting the quality of
tea produced in Central and Southern Africa. J. Sci. Food Agric. 82:517–525.
Yamada, T. and Terashima, T. (2009). Theanine, γ-glutamylethylamide, a unique amino acid
in tea leaves, modulates neurotransmitter concentrations in the brain striatum
interstitium in conscious rats. Amino Acids. 36: 21–27.
Zhang, M.H. (2004). Determination of total antioxidant capacity in green tea by near-infrared
spectroscopy and multivariate calibration. Talant. 62: 25-35.
Zhao, J.W., Chen, Q.S. and Huang, X.Y. (2006). Qualitative identification of tea categories
by near infrared spectroscopy and support vector machine, J. of Pharmac. and
Biomed. Anal. 41: 1198–1204.
Zheng, G., Bamba, K., Okubo, T., Juneja, L.R., Oguni, I. and Sayama, I.K. (2005). Effect of
theanine, γ-glutamylethylamide, on bodyweight and fat accumulation in mice, Animal
Sci. J. 76: 153–157.
Zuo,Y., Chen, H. and Deng, Y. (2002). Simultaneous determination of catechins, caffeine
and gallic acid in green tea, Oolong, black and Puerh teas using HPLC with a
photodiode array detector. Talanta 57: 307-361.
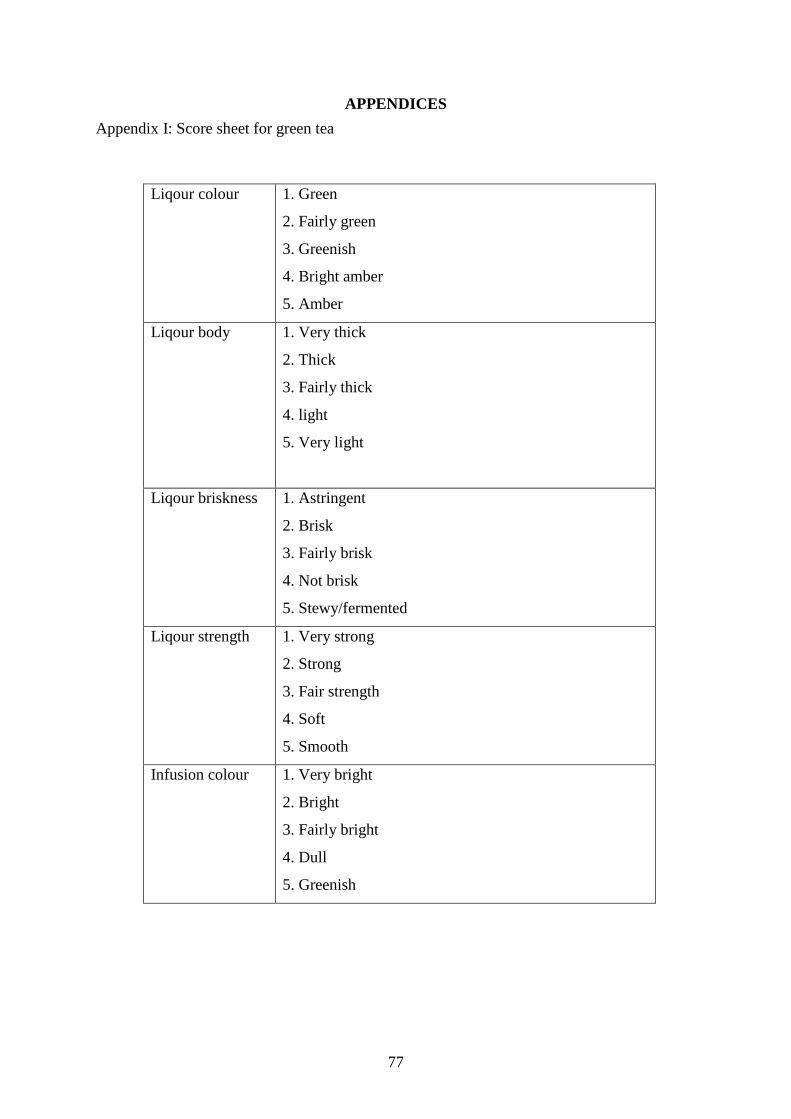
77
APPENDICES
Appendix I: Score sheet for green tea
Liqour colour 1. Green
2. Fairly green
3. Greenish
4. Bright amber
5. Amber
Liqour body 1. Very thick
2. Thick
3. Fairly thick
4. light
5. Very light
Liqour briskness 1. Astringent
2. Brisk
3. Fairly brisk
4. Not brisk
5. Stewy/fermented
Liqour strength 1. Very strong
2. Strong
3. Fair strength
4. Soft
5. Smooth
Infusion colour 1. Very bright
2. Bright
3. Fairly bright
4. Dull
5. Greenish

78
Appendix II: Score sheet for black tea
Liqour colour 1. Coppery
2. Very bright
3. Bright
4. Fairly bright
5. Dull
Liqour body 1. Creamy
2. Very thick
3. Thick
4. Fairly thick
5. Light
Liqour briskness 1. Very brisk
2. Brisk
3. Fairly brisk
4. Not brisk
5. Coarse
Liqour strength 1. Pungent
2. Strong
3. Fair strength
4. Soft
5. Harsh
Infusion colour 1. Very bright
2. Bright
3. Fairly bright
4. Dull
5. Greenish
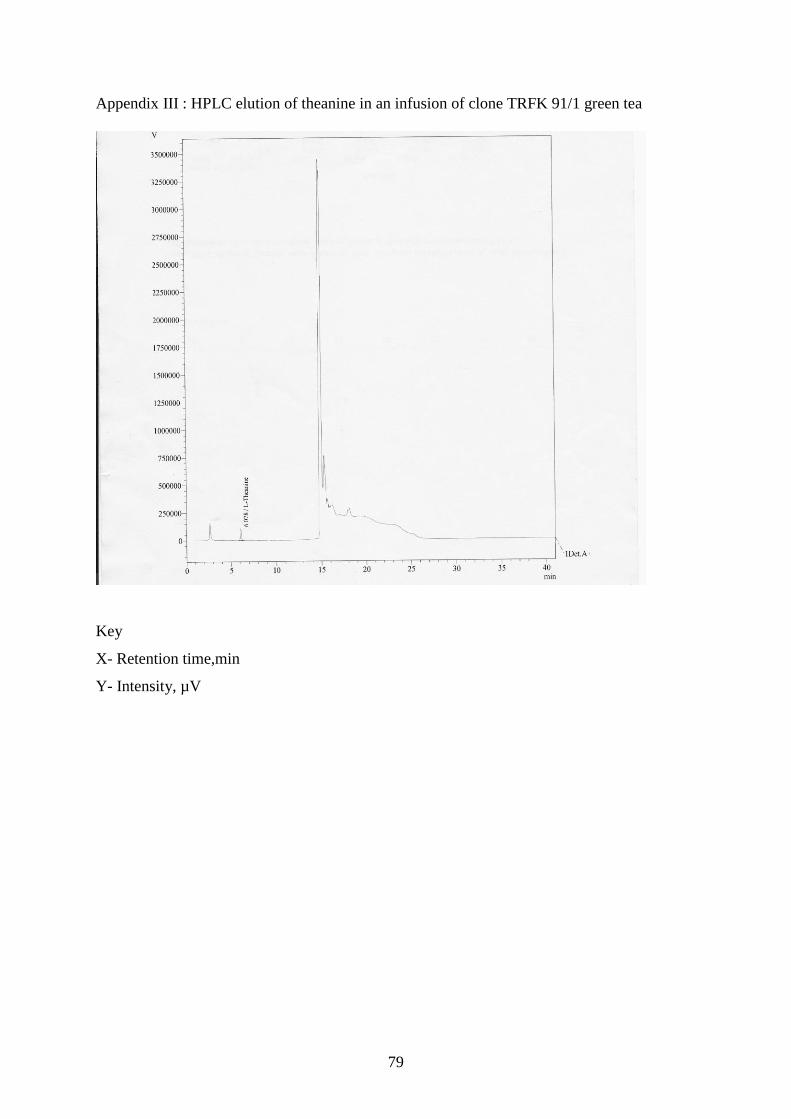
79
Appendix III : HPLC elution of theanine in an infusion of clone TRFK 91/1 green tea
Key
X- Retention time,min
Y- Intensity, µV

80
Appendix IV: HPLC elution of theaflavin fractions in an infusion of clone TRFK 6/8 black
tea
Key
X- Retention time,min
Y- Intensity, µV
TF Simple theaflavins
TF-3-MG Theaflavin -3-monogallate
TF- 3’-MG Theaflavin- 3’- monogallate
TF-DG Theaflavin digallate
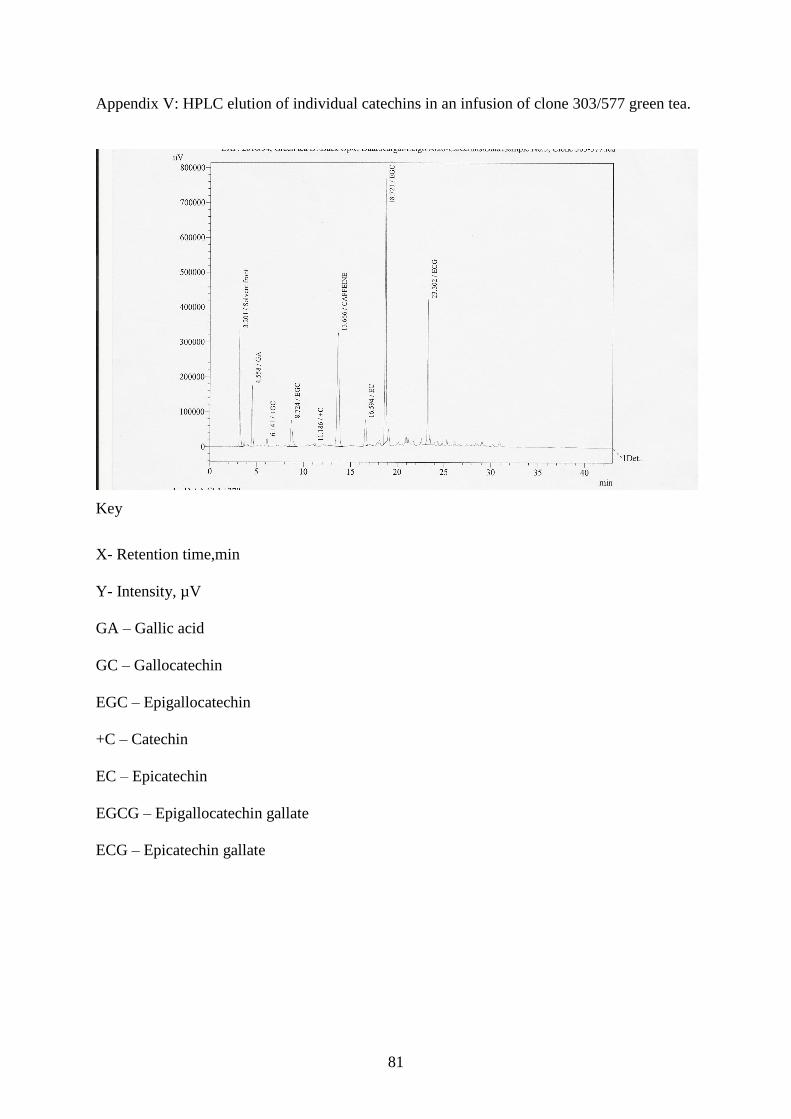
81
Appendix V: HPLC elution of individual catechins in an infusion of clone 303/577 green tea.
Key
X- Retention time,min
Y- Intensity, µV
GA – Gallic acid
GC – Gallocatechin
EGC – Epigallocatechin
+C – Catechin
EC – Epicatechin
EGCG – Epigallocatechin gallate
ECG – Epicatechin gallate
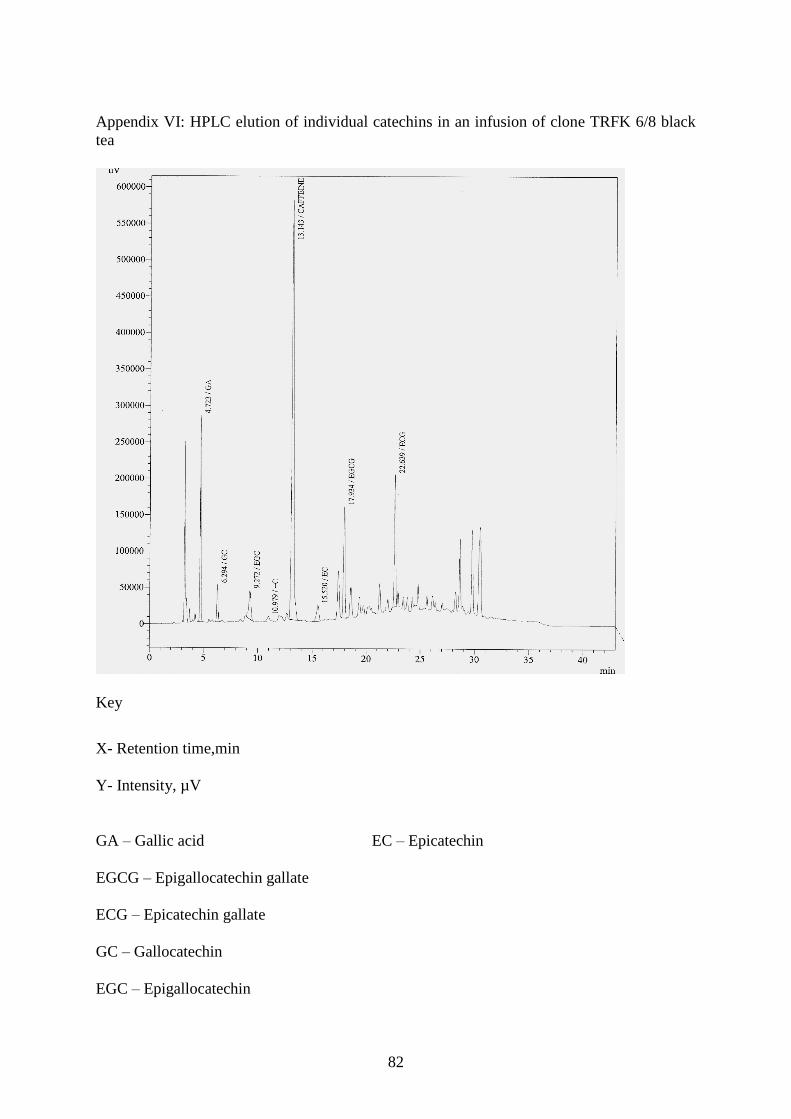
82
Appendix VI: HPLC elution of individual catechins in an infusion of clone TRFK 6/8 black
tea
Key
X- Retention time,min
Y- Intensity, µV
GA – Gallic acid EC – Epicatechin
EGCG – Epigallocatechin gallate
ECG – Epicatechin gallate
GC – Gallocatechin
EGC – Epigallocatechin

83
+C – Catechin
Appendix VII: Theanine and total polyphenol (TPP) percentage in studied clones
Means followed by the same letter along the same column are not significantly different at p<
0.05. n = 81.
Theanine
TPP
Test clones
TRFK91/1 2.18a 23.87
bcdef
TRFK 91/2 1.83abcd
21.88bcdef
TRFK KS3 1.99ab
21.79defg
TRFK KS1 1.55cdef
23.07bcdefg
TRFK KS2 1.50defg
21.09efg
TRFK 73/7 1.53def
20.82efg
TRFK 73/3 1.97abc
22.79cdefg
TRFK 73/1 1.51defg
21.81defg
TRFK 73/2 1.52defg
23.28bcdef
TRFK 73/4 1.79abcd
21.83defg
TRFK 83/1 1.10gh
23.15bcdefg
K-Purple 1.10gh
25.86abc
TRFK 73/5 1.79abcd
23.32bcdef
TRFK 14/1 1.59bcde
22.07defg
Commercial clones
ST.543 1.47defg
22.18defg
ST. 536 1.87abcd
20.41fg
GW Ejulu 1.47defg
27.27a
TRFK 301/1 2.03a 25.87
abc
TRFK 31/8 1.01h 24.21
abcde
EPK TN 14/3 1.51defg
23.36bcdef
TRFK 301/2 1.79abcd
22.69cdefg
TRFK 303/577 1.0h 24.23
abcde
TRFK 303/216 1.26efgh
24.80abcd
TRFK 6/8 0.92h 26.54
ab
AHP S15/10 1.52defg
22.38cdefg
Hanlu 1.12fgh
19.70gh
Yabukita 1.44defg
17.16h
CV 14.34 7.62

84
Appendix VIII: Clonal variation in gallic acid, caffeine and catechins (%)
Gallic acid Caffeine EGC EGCG C EC ECG TC
Test clones
TRFK 91/1 1.09a 1.54
efgh 0.46
l 4.53
cd 0.14
hijk 0.18
n 1.58
def 6.88
ijk
TRFK 91/2 0.67bc
1.38gh
1.30k 3.55
efgh 0.24
cdef 0.49
m 1.07
ijk 6.65
jk
TRFK KS3 0.70b 2.33
bc 3.72
cd 3.89
def 0.22
defgh 1.16
efgh 1.84
bcd 10.82
cd
TRFK KS1 0.32ijkjm
1.40fgh
1.88ij 4.30
de 0.21
defghi 0.66
klm 1.46
efg 8.50
efg
TRFK KS2 0.43fgh
2.22bcd
3.57def
4.24de
0.16efghijk
1.53c 1.94
bc 11.43
bcd
TRFK 73/7 0.17o 1.80
defg 4.54
b 3.62
efg 0.21
defghi 1.79
a 1.99
bc 12.15
b
TRFK 73/3 0.22mno
1.67hi 1.33
k 1.93
k 0.14
ghijk 0.66
klm 1.14
hij 5.20
l
TRFK 73/1 0.38ghijk
1.87cdef
4.09c 4.43
cd 0.34
b 1.55
bc 1.55
def 11.95
b
TRFK 73/2 0.40fghij
1.82defg
4.78b 4.08
def 0.23
defg 1.12
efgh 1.22
ghi 11.41
bcd
TRFK 73/4 0.24lmno
1.55efgh
2.62gh
6.25a 0.14
hijk 1.03
ghi 1.97
bc 12.00
b
TRFK 83/1 0.41fghij
2.21bcd
6.12a 3.35
fghi 0.27
bcd 0.89
ij 1.16
ghij 11.78
bc
K-Purple 0.42fghi
2.04bcd
0.38l 2.93
ghij 0.32
bc 0.69
kl 3.12
a 7.42
hij
TRFK 73/5 0.32ijklm
1.16hi 3.63
cde 2.35
jk 0.18
efghij 0.72
jk 1.27
fghi 8.15
fgh
TRFK 14//1 0.32ijklm
1.82defg
2.66g 2.79
hij 0.28
bcd 1.20
efg 0.86
jkl 7.78
fghi
Commercial clones
ST.543 0.18o 1.75
defg 2.14
hi 2.58
ijk 0.15
fghijk 0.97
hi 0.87
jkl 6.70
ijk
ST.536 0.34hijkl
2.12bcd
3.68cd
5.22bc
0.15fghijk
1.55bc
1.86bcd
12.45b
GW Ejulu 0.42fghi
2.34bc
1.03k 4.66
cd 0.62
a 1.10
fgh 3.26
a 10.66
d
TRFK 301/1 0.21no
1.40fgh
1.51jk 2.49
jk 0.22
defgh 1.30
de 1.43
efgh 6.94
ijk
TRFK 31//8 0.28klmn
1.37gh 2.33ghi
2.84ghij
0.12jk 0.52
lm 0.78
kl 6.59
jk
EPK TN 14/3 0.49ef 2.98
a 3.12
f 4.58
cd 0.15
ghijk 1.40
cd 1.46
efg 10.71
d
TRFK 301/2 0.55de
2.92a 3.89
cd 5.97
a 0.16
efghijk 1.72
ab 2.06
b 13.79
a
TRFK 303/577 0.31jklm
1.55efgh
2.20ghi
3.43fgh
0.08k 0.85
ijk 1.07
ijk 7.62
ghij
TRFK 303/216 0.26lmno
1.52efgh
2.39gh
2.89ghij
0.24cde
0.68kl 0.82
kl 7.02
ijk
TRFK 6/8 0.22mno
0.86i 2.39
gh 2.23
jk 0.22
defgh 0.74
jk 0.71
l 6.28
k
AHP S 15/10 0.62bcd
3.07a 1.25
k 4.52
cd 0.13
ijk 1.20
efg 1.69
cde 8.79
ef
Hanlu 0.61cd
2.42b 3.18
ef 5.75
ab 0.13
ijk 1.25
def 2.02
b 12.32
b
Yabukuta 0.27lmno
2.00bcde
2.56gh
4.06def
0.16efghijk
1.00hi 1.63
de 9.41
e
CV 13.33 13.06 9.82 21.02 9.72 11.09 10.79 6.06
Means followed by the same letter along the same column are not significantly different at p<
0.05. n = 81.

85
Appendix IX: Clonal variations in individual theaflavins (µmol/g)
Test clones TF TF-3-g TF-3’-g TF dg
TRFK 91/1
TRFK 91/2
TRFK 73/1
TRFK 73/2
TRFK 73/3
TRFK 73/4
TRFK 73/5
TRFK 73/7
TRFK KS 1
TRFK KS 2
TRFK KS 3
TRFK 83/1
TRFK 14/1
K-Purple
1.43h
2.88gh
7.66b
8.16b
2.33h
4.76efg
5.38cde
6.81bcde
5.12def
6.70bcde
8.58b
7.24bc
7.80b
3.33fgh
2.86h
4.21g
6.92bc
6.54bcd
3.98gh
4.50fg
5.80cde
3.90gh
5.49def
6.50bcd
6.98bc
6.36bcd
6.28cd
5.69cdef
1.68kl
2.72efghi
3.10cdefghi
3.34cdefg
1.59 l
2.59fghij
2.87defghi
1.78jkl
2.48ghijk
3.40cdef
3.84abc
3.51bcde
3.26cdefg
2.54fghij
3.57fgh
4.77bcd
3.51efgh
3.22fghi
3.28fghi
2.84hij
3.76efgh
1.97j
3.59efgh
4.14cdef
4.07cdef
3.73efgh
2.83hij
5.37b
Commercial
clones
TRFK 303/577
EPK TN 14/3
TRFK 31/8
ST.536
AHP S 15/10
TRFK 301/1
TRFK 6/8
GW Ejulu
TRFK 301/2
ST.543
TRFK 303/216
8.62b
8.46b
6.83bcde
6.87bcd
5.27cdef
8.50b
10.85a
2.68h
7.52b
7.95b
11.32a
6.19cd
6.66bcd
5.54def
4.70efg
5.54def
9.12a
6.57bcd
5.56def
7.62b
5.70cdef
6.65bcd
3.87abc
4.54a
3.58bcde
2.23ijkl
3.67bcd
3.16cdefg
4.30ab
2.29hijkl
2.87defghi
2.54fghij
3.97abc
3.68efgh
4.32cde
3.77efgh
2.05j
4.90bc
3.90defg
3.34efgh
6.52a
3.93defg
2.35ij
2.97ghi
CV 17.06 11.61 14.95 13.68
Means followed by the same letter along the same column are not significantly different at p<
0.05. n = 75.
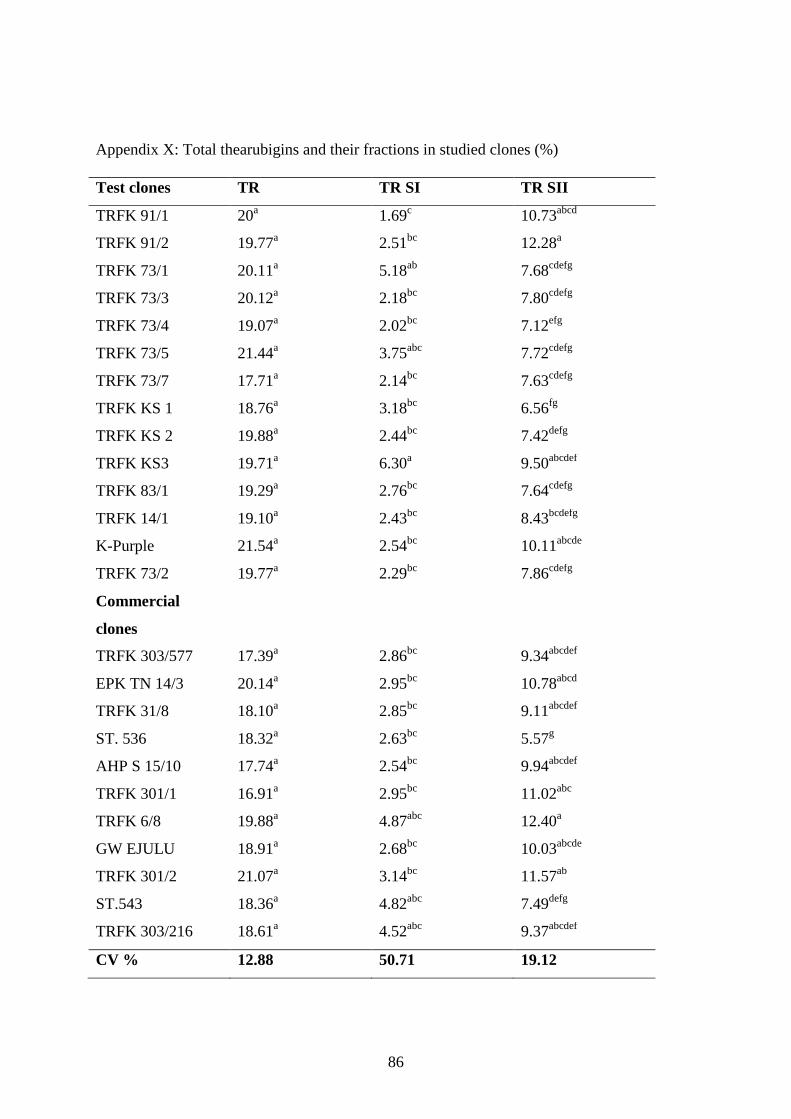
86
Appendix X: Total thearubigins and their fractions in studied clones (%)
Test clones TR TR SI TR SII
TRFK 91/1 20a 1.69
c 10.73
abcd
TRFK 91/2 19.77a 2.51
bc 12.28
a
TRFK 73/1 20.11a 5.18
ab 7.68
cdefg
TRFK 73/3 20.12a 2.18
bc 7.80
cdefg
TRFK 73/4 19.07a 2.02
bc 7.12
efg
TRFK 73/5 21.44a 3.75
abc 7.72
cdefg
TRFK 73/7 17.71a 2.14
bc 7.63
cdefg
TRFK KS 1 18.76a 3.18
bc 6.56
fg
TRFK KS 2 19.88a 2.44
bc 7.42
defg
TRFK KS3 19.71a 6.30
a 9.50
abcdef
TRFK 83/1 19.29a 2.76
bc 7.64
cdefg
TRFK 14/1 19.10a 2.43
bc 8.43
bcdefg
K-Purple 21.54a 2.54
bc 10.11
abcde
TRFK 73/2 19.77a 2.29
bc 7.86
cdefg
Commercial
clones
TRFK 303/577 17.39a 2.86
bc 9.34
abcdef
EPK TN 14/3 20.14a 2.95
bc 10.78
abcd
TRFK 31/8 18.10a 2.85
bc 9.11
abcdef
ST. 536 18.32a 2.63
bc 5.57
g
AHP S 15/10 17.74a 2.54
bc 9.94
abcdef
TRFK 301/1 16.91a 2.95
bc 11.02
abc
TRFK 6/8 19.88a 4.87
abc 12.40
a
GW EJULU 18.91a 2.68
bc 10.03
abcde
TRFK 301/2 21.07a 3.14
bc 11.57
ab
ST.543 18.36a 4.82
abc 7.49
defg
TRFK 303/216 18.61a 4.52
abc 9.37
abcdef
CV % 12.88 50.71 19.12

87
Means followed by the same letter along the same column are not significantly different at p<
0.05. n = 75.
Appendix XI: Total soluble solids (TSS), total colour, brightness, and theaflavins (TF)
Test clones TSS (%) Brightness (%) Total colour (%) TF µmoles/g
TRFK 91/1 39.33abc
10.79g
4.41
ijkl
9.54
j
TRFK 91/2 36.33abcde
17.20fg
5.20defghi
14.59hi
TRFK 73/1 34.54bcde
29.09abcd
4.99efghij
21.19abcde
TRFK 73/2 28.48f
33.35
ab
4.68
ghijk
21.26
abcde
TRFK 73/3 35.08bcde
19.74ef
4.04
kl
11.19
ij
TRFK 73/4 34.55bcde
27.29abcde
4.21jkl
14.69hi
TRFK 73/5 33.02def
25.49abcdef
4.66ghijk
17.82defgh
TRFK 73/7 31.18ef
26.89
abcde
4.20
jkl
14.48
hi
TRFK KS 1 39.86abc
25.24abcdef
4.19jkl
16.68fgh
TRFK KS 2 37.96abcd
32.33abc
4.91fghijk
20.73abcdef
TRFK KS 3 35.63abcde
32.38abc
5.72abcdef
23.47ab
TRFK 83/1 37.03abcde
29.23abcd
4.89fghijk
20.84abcdef
TRFK 14/1 36.32abcde
28.35abcde
5.28cdefghi
20.16bcdefg
K-Purple 33.87bcdef
24.93bcdef
4.83fghijk
16.93efgh
Commercial clones
TRFK
303/577
34.44bcde
32.30abc
5.84abcde
22.37abc
EPK TN 14/3 37.34abcde
34.38a
6.16
abc
23.99
ab
TRFK 31/8 37.90abcd
30.42abc
5.38abcdefg
19.72bcdefg
ST.536 35.61abcde
30.74abc
3.66 l
15.86
gh
AHP S 15/10 37.03abcde
20.35def
6.15abc
18.38cdefgh
TRFK 301/1 35.77abcde
29.31abcd
6.26a
24.69
a
TRFK 6/8 36.29abcde
33.07ab
6.07abcd
25.07a
GW Ejulu 41.28a
23.34
cdef
5.33
bcdefgh
17.05
efgh
TRFK 301/2 33.73cdef
23.90cdef
5.84abcde
21.95abcd
ST.543 35.43abcde
32.39abc
4.46hijkl
18.53cdefgh
TRFK
303/216
39.95ab
27.13abcde
6.19ab
24.92a
CV % 8.65 16.81 9.16 12.05
Means followed by the same letter along the same column are not significantly different at p< 0.05. n
= 75
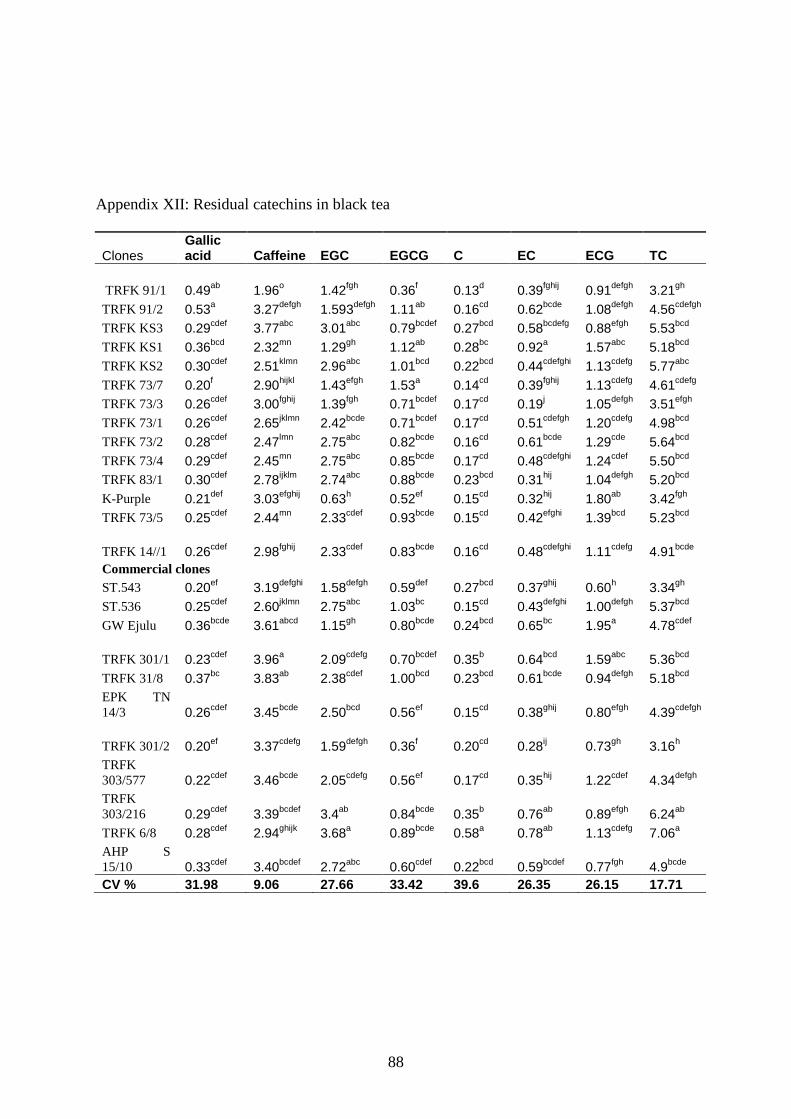
88
Appendix XII: Residual catechins in black tea
Clones Gallic acid Caffeine EGC EGCG C EC ECG TC
TRFK 91/1 0.49ab
1.96o 1.42
fgh 0.36
f 0.13
d 0.39
fghij 0.91
defgh 3.21
gh
TRFK 91/2 0.53a 3.27
defgh 1.593
defgh 1.11
ab 0.16
cd 0.62
bcde 1.08
defgh 4.56
cdefgh
TRFK KS3 0.29cdef
3.77abc
3.01abc
0.79bcdef
0.27bcd
0.58bcdefg
0.88efgh
5.53bcd
TRFK KS1 0.36bcd
2.32mn
1.29gh
1.12ab
0.28bc
0.92a 1.57
abc 5.18
bcd
TRFK KS2 0.30cdef
2.51klmn
2.96abc
1.01bcd
0.22bcd
0.44cdefghi
1.13cdefg
5.77abc
TRFK 73/7 0.20f 2.90
hijkl 1.43
efgh 1.53
a 0.14
cd 0.39
fghij 1.13
cdefg 4.61
cdefg
TRFK 73/3 0.26cdef
3.00fghij
1.39fgh
0.71bcdef
0.17cd
0.19j 1.05
defgh 3.51
efgh
TRFK 73/1 0.26cdef
2.65jklmn
2.42bcde
0.71bcdef
0.17cd
0.51cdefgh
1.20cdefg
4.98bcd
TRFK 73/2 0.28cdef
2.47lmn
2.75abc
0.82bcde
0.16cd
0.61bcde
1.29cde
5.64bcd
TRFK 73/4 0.29cdef
2.45mn
2.75abc
0.85bcde
0.17cd
0.48cdefghi
1.24cdef
5.50bcd
TRFK 83/1 0.30cdef
2.78ijklm
2.74abc
0.88bcde
0.23bcd
0.31hij
1.04defgh
5.20bcd
K-Purple 0.21def
3.03efghij
0.63h 0.52
ef 0.15
cd 0.32
hij 1.80
ab 3.42
fgh
TRFK 73/5 0.25cdef
2.44mn
2.33cdef
0.93bcde
0.15cd
0.42efghi
1.39bcd
5.23bcd
TRFK 14//1 0.26cdef
2.98fghij
2.33cdef
0.83bcde
0.16cd
0.48cdefghi
1.11cdefg
4.91bcde
Commercial clones
ST.543 0.20ef 3.19
defghi 1.58
defgh 0.59
def 0.27
bcd 0.37
ghij 0.60
h 3.34
gh
ST.536 0.25cdef
2.60jklmn
2.75abc
1.03bc
0.15cd
0.43defghi
1.00defgh
5.37bcd
GW Ejulu 0.36bcde
3.61abcd
1.15gh
0.80bcde
0.24bcd
0.65bc
1.95a 4.78
cdef
TRFK 301/1 0.23cdef
3.96a 2.09
cdefg 0.70
bcdef 0.35
b 0.64
bcd 1.59
abc 5.36
bcd
TRFK 31/8 0.37bc
3.83ab
2.38cdef
1.00bcd
0.23bcd
0.61bcde
0.94defgh
5.18bcd
EPK TN
14/3 0.26cdef
3.45bcde
2.50bcd
0.56ef 0.15
cd 0.38
ghij 0.80
efgh 4.39
cdefgh
TRFK 301/2 0.20ef 3.37
cdefg 1.59
defgh 0.36
f 0.20
cd 0.28
ij 0.73
gh 3.16
h
TRFK
303/577 0.22cdef
3.46bcde
2.05cdefg
0.56ef 0.17
cd 0.35
hij 1.22
cdef 4.34
defgh
TRFK
303/216 0.29cdef
3.39bcdef
3.4ab
0.84bcde
0.35b 0.76
ab 0.89
efgh 6.24
ab
TRFK 6/8 0.28cdef
2.94ghijk
3.68a 0.89
bcde 0.58
a 0.78
ab 1.13
cdefg 7.06
a
AHP S
15/10 0.33cdef
3.40bcdef
2.72abc
0.60cdef
0.22bcd
0.59bcdef
0.77fgh
4.9bcde
CV % 31.98 9.06 27.66 33.42 39.6 26.35 26.15 17.71

89
Appendix XIII: The GLM Procedure
Dependent Variable: TR
Source DF Sum of Squares mean Square F Value Pr > F
Model 26 129.896 4.996 0.81 0.7125
Error 48 295.431 6.155
Corrected Total 74 425.328
R-Square Coeff Var Root MSE TR Mean
0.305 12.876 2.481 19.268
Source DF Type I SS Mean Square F Value Pr > F
Rep 2 24.499 12.249 1.99 0.148
Clone 24 105.398 4.392 0.71 0.813
Source DF Type III SS Mean Square F Value Pr > F
Rep 2 24.499 12.249 1.99 0.148
Clone 24 105.398 1qa 4.392 0.71 0.813
Appendix XIV: The GLM Procedure
Dependent Variable: Theanine
Source DF Sum of Squares Mean Square F Value Pr > F
Model 28 9.930 0.355 7.35 <.0001
Error 51 2.461 0.048
Corrected Total 79 12.391
R-Square Coeff Var Root MSE Thea Mean
0.801 14.336 0.219 1.532
Source DF Type I SS Mean Square F Value Pr > F
rep 2 0.809 0.405 8.38 0.0007
clone 26 9.121 0.351 7.27 <.0001
Source DF Type III SS Mean Square F Value Pr > F
rep 2 0.794 0.397 8.23 0.0008

90
clone 26 9.121 0.351 7.27 <.0001
Appendix XV: An ANOVA Table on residual catechins on black tea
Dependent variable: EGC
K Degrees of Sum of Mean F
Value Source Freedom Squares Square Value Prob
-----------------------------------------------------------------------------
1 Replication 2 5.202 2.601 7.0380 0.0021
2 Factor A 24 41.807 1.742 4.7139 0.0000
-3 Error 48 17.738 0.370
-----------------------------------------------------------------------------
Total 74 64.746
-----------------------------------------------------------------------------
Coefficient of Variation: 27.66%
s_ for means group 1: 0.1216 Number of Observations: 25
y
s_ for means group 2: 0.3510 Number of Observations: 3
y
Appendix XVI: Submitted Papers
1. Kilel, E.C., Wanyoko, J.K.*, Faraj, A. K., Wachira F. N. and Mwingirwa, V. Green tea
from purple leaf coloured tea clones in Kenya – their quality characteristics. Food
Chemistry. Submitted on 28/9/2012, expected to be published Jan. 2013.
2. Kilel, E.C., Wanyoko, J.K.*,Faraj, A.K. and Wachira, F.N. Plain black tea quality
parameters of purple leaf coloured tea clones in Kenya. Food Research International.
Submitted on 30/8/2012, expected to be published Jan. 2013