check point inhibitors when to use combination or single
TRANSCRIPT

Check Point Inhibitors
When to Use Combination or
Single Agent Therapy?
Sanjiv S. Agarwala, MDProfessor of Medicine
Temple University School of Medicine
Chief, Oncology & Hematology
St. Luke’s Cancer Center, Bethlehem, PA

Check-Point Inhibitors
Approved for Melanoma
• Anti CTLA4 (ipilimumab)
• Anti PD-1 (pembrolizumab, nivolumab)
• Combination anti CTLA-4 and anti-PD1
(ipilimumab and nivolumab)

Overview
• Data with ipilimumab monotherapy
• Data with anti-PD1 monotherapy
• Data with Combination ipi-nivo
• Choosing the right treatment

CTLA-4 Affects The Priming Phase of
T-Cell Activation1
CTLA-4 = cytotoxic T-lymphocyte antigen 4.
1. Pardoll DM. Nat Rev Cancer. 2012;12:252–264; 2. Ribas A. N Engl J Med. 2012;366:2517–2519; 3. Topalian SL et al. Curr Opin Immunol.
2012;24:207–212.
Dendritic cell Inactivated T cell
Priming (Early Stage)
Phase of Activation
CTLA-4
• In healthy tissues, CTLA-4 is
thought to function as a
dominant “off switch” broadly
shutting down T-cell activity
to prevent autoimmunity1-3

Clinical Results with Ipilimumab (2nd and 1st line)Ipilimumab vs vaccine and Ipi + DTIC vs DTIC
HR: 0.66 and 0.68Pre-treated ptsIpi 3 mg/kg +/- gp100
HR: 0.72First line
Ipi 10 mg/kg + DTIC
Hodi FS, et al. N Engl J Med. 2010;363:711-23. Robert C, et al. N Engl J Med. 2011;364:2517-26.
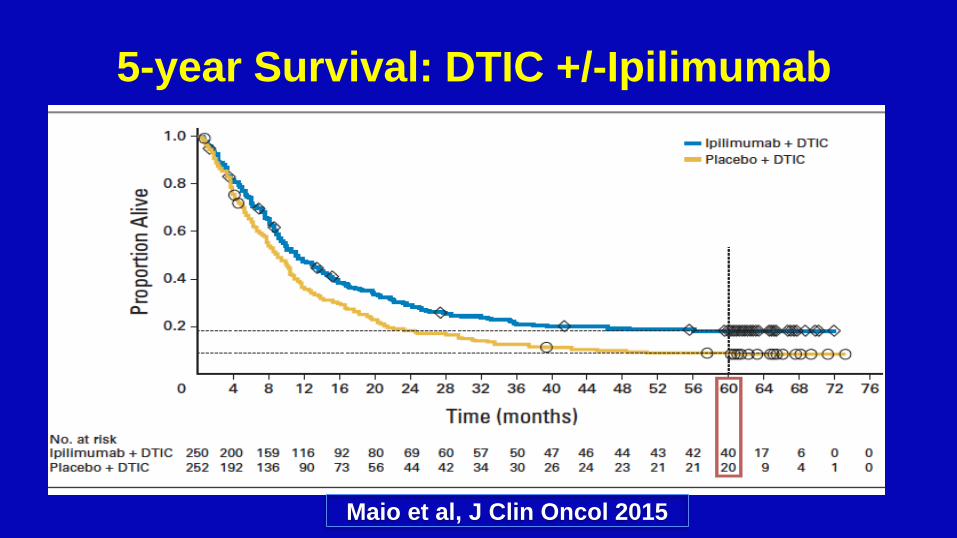
Maio et al, J Clin Oncol 2015
5-year Survival: DTIC +/-Ipilimumab

0 1 2 3 4 5 6 7 8 9 10
100
90
80
70
60
0
50
40
30
20
10
Ove
rall
Su
rviv
al (%
)
Years
IPI (Pooled analysis)1
N=1,861
7
Immune Checkpoint Inhibitors Provide Durable Long-term Survival for Patients with Advanced Melanoma
1. Schadendorf et al. J Clin Oncol 2015;33:1889-1894; 2. Current analysis; 3. Poster presentation by Dr. Victoria Atkinson at SMR 2015 International Congress.

Ipilimumab Summary
• Superior to chemotherapy
• Durable Benefit of 20%
• Approximately 35% grade 3-4 IRAE

Overview
• Data with ipilimumab monotherapy
• Data with anti-PD1 monotherapy
• Data with Combination ipi-nivo
• Choosing the right treatment

PD-1 affects Mainly the Effector Phase of T-cell Activity
Reprinted by permission from Macmillan Publishers Ltd: Nat Rev Cancer,1 copyright 2012.
PD-1 = programmed cell death protein 1; TCR = T-cell receptor; MHC = major histocompatibility complex; PD-L1 = programmed cell death ligand 1;
PD-L2 = programmed cell death ligand 2.
1. Pardoll DM. Nat Rev Cancer. 2012;12:252–64.
Dendritic cell Naïve T cell Activated T cell Tumor cell
PD-1
Antigen
PD-1PD-L2
MHCTCR
• Emerging research has
identified PD-1 as an
immune checkpoint
pathway that tumor cells
may exploit to evade
immune surveillance
• Tumor cells may block
immune responses via the
PD-1 immune checkpoint
pathway by expressing the
dual PD-1 ligands, PD-L1
and PD-L2
Priming Phase of
ActivationEffector Phase
PD-L1

KEYNOTE-001: Melanoma Cohorts

KN-001: Pembrolizumab All Pts (n=655)

KEYNOTE-001 – 5 Year Survival (ASCO 2018)
ASCO 2018 13

KEYNOTE-001 – 5 Year Duration of Response
2018-06-04ASCO 2018 14

Keynote-006 Front-line Pembrolizumab vs Ipilimumab
• Primary end points: PFS and OS• Secondary end points: ORR, duration of
response, safety
Patients
• Unresectable, stage III or IV melanoma
• ≤1 prior therapy, excluding anti–CTLA-4,
PD-1, or PD-L1 agents
• Known BRAF statusb
• ECOG PS 0-1
• No active brain metastases
• No serious autoimmune disease
Pembrolizumab
10 mg/kg IV Q2W
Pembrolizumab
10 mg/kg IV Q3W
R
1:1:1
Stratification factors:
• ECOG PS (0 vs 1)
• Line of therapy (first vs second)
• PD-L1 status (positivec vs negative)
Ipilimumab
3 mg/kg IV Q3W
x 4 doses
aPatients enrolled from 83 sites in 16 countries.bPrior anti-BRAF targeted therapy was not required for patients with normal LDH levels and no clinically significant tumor-related symptoms or evidence of rapidly progressing disease.cDefined as membranous PD-L1 expression in ≥1% of tumor cells as assessed by IHC using the 22C3 antibody.

Baseline Characteristics

Response (irRC, investigator review)<br />Median Follow-Up 45.9 (0.3-50.0) Months

Duration of Response (irRC, investigator)

Overall Survival<br />Median Follow-Up 45.9 (0.3-50.0) Months

Progression-Free Survivala<br />Median Follow-Up 45.9 (0.3-50.0) Months

Poststudy Drug Therapya

Disposition of Patients Completing <br />≥94 Weeks of Pembrolizumab Treatment
Abstract 9503, 2018 ASCO Annual Meeting

PFSa in Patients Who Completed Protocol-Specified Time on Pembrolizumab (n = 103)
Abstract 9503, 2018 ASCO Annual Meeting

PFSa in Patients Who Completed Protocol-Specified Time on Pembrolizumab (n = 103)
Abstract 9503, 2018 ASCO Annual Meeting
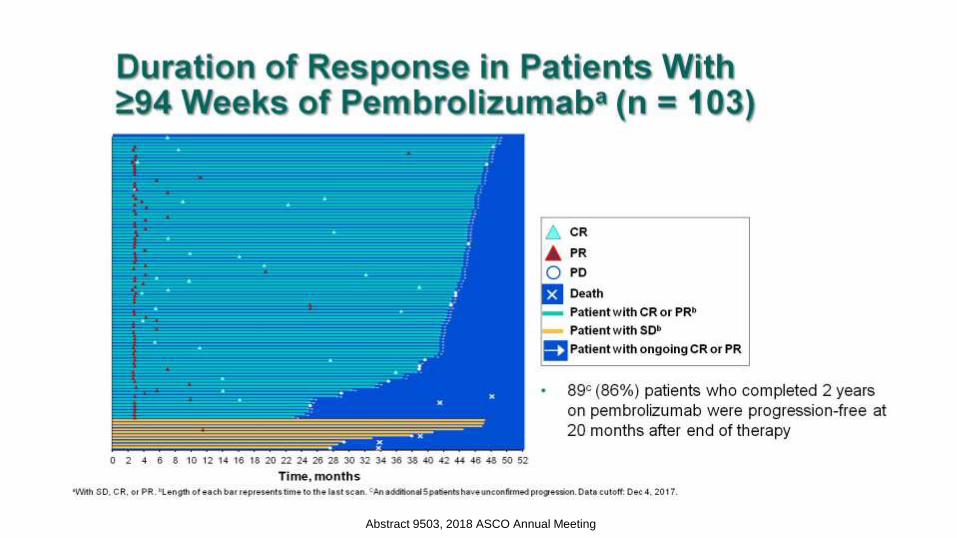
Duration of Response in Patients With ≥94 Weeks of Pembrolizumaba (n = 103)
Abstract 9503, 2018 ASCO Annual Meeting

Outcome of 19 Progressors After ≥94 Weeks of Pembrolizumab (n = 103)
Abstract 9503, 2018 ASCO Annual Meeting

Pattern of Recurrence and Response in Patients on 2nd Course of Pembrolizumab
Abstract 9503, 2018 ASCO Annual Meeting

Immune Mediated AEs and Infusion Reactions for Patients on 1st and 2nd Course of Pembrolizumab
Abstract 9503, 2018 ASCO Annual Meeting

Treatment Exposure and Duration of Response in Patients on 2nd Course of Pembrolizumab
Abstract 9503, 2018 ASCO Annual Meeting

PD-1 Monotherapy: Summary
• Superior to ipilimumab
• Lower toxicity
• Durable benefit – double that of
ipilimumab

Overview
• Data with ipilimumab monotherapy
• Data with anti-PD1 monotherapy
• Data with Combination ipi-nivo
• Choosing the right treatment

Blocking CTLA-4 and PD-1
Nivolumab
Pembrolizumab
Spartalizumab
Ipilimumab and TremelimumabAtezolizumab
Durvalumab
Avelumab

Slide 6

CM-67 Response to treatment
Database lock May 24, 2017 Wolchok, NEJM, 2017
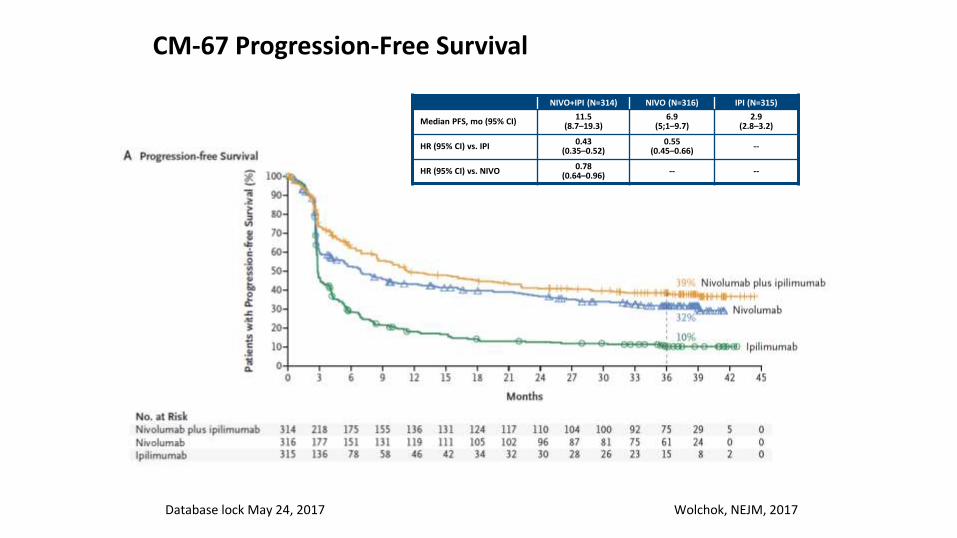
CM-67 Progression-Free Survival
Database lock May 24, 2017
NIVO+IPI (N=314) NIVO (N=316) IPI (N=315)
Median PFS, mo (95% CI)11.5
(8.7–19.3)6.9
(5;1–9.7)2.9
(2.8–3.2)
HR (95% CI) vs. IPI0.43
(0.35–0.52)0.55
(0.45–0.66)--
HR (95% CI) vs. NIVO0.78
(0.64–0.96)-- --
Wolchok, NEJM, 2017

CM-67 Overall Survival
Database lock May 24, 2017
*P<0.0001
NIVO + IPI (N=314)
NIVO (N=316) IPI (N=315)
Median OS, months (95% CI) 38.2-NR37.6
(29.1-NR)19.9
(16.9-24.6)
HR (99.5% CI) vs. IPI0.55
(0.45–0.69)*0.65
(0.53–0.80)*-
HR (99.5% CI) vs. NIVO0.85
(0.68-1.07)- -
Wolchok, NEJM, 2017

Combo Ipi-Nivo Summary
• Superior to ipilimumab monotherapy
• Improves RR and PFS over nivolumab
alone
• OS improvement over nivo not statistically
significant
• Toxicity is higher (~55% grade 3-4)

Overview
• Data with ipilimumab monotherapy
• Data with anti-PD1 monotherapy
• Data with Combination ipi-nivo
• Choosing the right treatment

Decision Point….
Immunotherapy
PD-1 alonePD-1/CTLA-4
Combination

Checkmate 067: Safety Summary• With an additional 19 months of follow-up, safety was consistent with the initial report1
• Most select AEs were managed and resolved within 3-4 weeks (85–100% across organ categories)
• ORR was 70.7% for pts who discontinued NIVO+IPI due to AEs, with median OS not reached
40
NIVO+IPI(N=313)
NIVO
(N=313)IPI
(N=311)
Patients reporting event, % Any Grade Grade 3-4 Any Grade Grade 3-4 Any Grade Grade 3-4
Treatment-related adverse event (AE)
95.8 58.5 86.3 20.8 86.2 27.7
Treatment-related AE leading to discontinuation
39.6 31.0 11.5 7.7 16.1 14.1
Treatment-related death, n (%) 2 (0.6)a 1 (0.3)b 1 (0.3)b
aCardiomyopathy (NIVO+IPI, n=1); Liver necrosis (NIVO+IPI, n=1). Both deaths occurred >100 days after the last treatment.bNeutropenia (NIVO, n=1); colon perforation (IPI, n=1).1
1. Larkin J, et al. NEJM 2015;373:23‒34.

Skin (n=18)
Skin (n=5)
Gastrointestinal (n=46)
Gastrointestinal (n=7)
Endocrine (n=15)
Endocrine (n=2)
Hepatic (n=60)
Hepatic (n=8)
Pulmonary (n=3)
Pulmonary (n=1)
Renal (n=6)
Renal (n=1)0 10 20 30 40 50 60Weeks
5.6 (0.1 – 55.0)
19.4 (1.3 – 50.9)
7.4 (1.0 – 48.9)
26.3 (13.1 – 57.0)
12.1 (2.9 – 17.0)
28.6 (19.1 – 38.1)
7.4 (2.1 – 48.0)
14.1 (1.9 – 25.1)
3.7 (3.7 – 9.4)
6.7 (6.7 – 6.7)
11.3 (3.3 – 23.7)
50.9 (50.9 – 50.9)
NIVO+IPI
NIVO
Checkmate 067: SafetyOnset Grade 3–4 Treatment-Related Select AEs
Circles represent medians; bars signify ranges
Larkin J et al ECC 2015
Toxicity EarlierLonger Time to Resolution


Can a biomarker help us
decide?

Keynote 001 Pembrolizumab
PD-L1 Expression and Response
APS, Allred proportion score.Analysis cut-off date: October 18, 2014.
PD-L1 Positive
1-10% Staining
APS = 2
PD-L1 Negative
0% Staining
APS = 0
PD-L1 Positive
10-33% Staining
APS = 3
PD-L1 Positive
66-100% Staining
APS = 5
0
10
20
30
40
50
60
70
80
90
100
OR
R, %
(9
5%
CI)
ORR, RECIST v1.1
APS 0n = 28
APS 1n = 24
APS 2n = 72
APS 3n = 54
APS 4n = 32
APS 5n = 34
PositiveNegative
Daud A et al, ASCO 2015

<1% PD-L1 NIVO+IPI NIVO IPI
Median OS, mo
(95% CI)
NR
(26.5–NR)
23.5
(13.0–NR)
18.6
(13.7–23.2)
HR (95% CI)
vs NIVO
0.74
(0.52–1.06)─ ─
≥1% PD-L1 NIVO+IPI NIVO IPI
Median OS, mo
(95% CI)NR NR
22.1
(17.1–29.7)
HR (95% CI)
vs NIVO
1.03
(0.72–1.48)─ ─
OS
(%
)
Months
0
10
20
30
40
50
60
70
80
90
100
0 39363330272421181512963
60%
49%
41%
OS
(%
)
Months
0
10
20
30
40
50
60
70
80
90
100
0 39363330272421181512963
113 0IPI 11032434450576171798796
117 0NIVO 216505557596265737686103
123 0NIVO+IPI 4186672747479828291102113
164 0IPI 2216474778389102115126138155
171 0NIVO 13698109112117122131139148158165
155 0NIVO+IPI 3278599101102105112116127132144
67%
67%
48%
OS by Tumor PDL-1 Expression at a 1% Cutoff
45
PD-L1 Expression Level <1% PD-L1 Expression Level ≥1%
Patients at risk: Patients at risk:
• ORR of 65.2% for NIVO+IPI and 55.0% for NIVO • ORR of 54.5% for NIVO+IPI and 35.0% for NIVO

Subgroup
Patients Unstratified Hazard Ratio Unstratified Hazard Ratio (95% CI)
NIVO+IPI NIVO PFS OS PFS OS
Overall 314 316 0.77 0.89
<65 years 185 198 0.74 0.81
≥65 years 129 118 0.82 0.99
BRAF Mutant 102 98 0.60 0.71
BRAF Wild-type 212 218 0.86 0.97
ECOG PS = 0 230 237 0.79 0.91
ECOG PS = 1 83 78 0.72 0.82
M0/M1a/M1b 129 132 0.67 0.84
M1c 185 184 0.83 0.90
LDH ≤ ULN 199 197 0.72 0.89
LDH > ULN 114 112 0.79 0.86
LDH > 2 x ULN 37 37 0.70 0.71
PD-L1 ≥5% 68 80 0.87 1.05
PD-L1 <5% 210 208 0.73 0.84
PFS and OS Subgroup Analyses (All Randomized Patients)Descriptive comparison between NIVO+IPI and NIVO
46NIVO+IPI NIVO
20 1
NIVO+IPI NIVO
20 1

The Facts & The Choice….
• Monotherapy with PD-1 works well
– Low toxicity
– 4 year survival in KN-06 is 44%
• Combination Ipi-Nivo also works well!
– Superior to monotherapy for RR and PFS
– But not statistically superior for OS
– Higher Toxicity

The Bottom Line…
• Treatment must be individualized
• It is not an exact science
• Choices will depend upon many factors
– Patients wishes
– Availability and other practical issues

Decision Point….
Age, PS
Tumor PDL-1
Combination
Ipi- Nivo
Monotherapy
Pembro or Nivo
Older Patient,
PS 1 or higher
Younger Patient
Good PS
PDL-1 < 5%

If you cannot make up your mind…
• Have a caipirinha before making your
decision!