charts inflation report 3/05. 1 monetary policy assessments and strategy
TRANSCRIPT

ChartsInflation Report 3/05

1 Monetary policy assessments and strategy

Chart 1.1 CPI. Moving 10-year average1) and variation2). Per cent. Annual figures. 1980 – 20053)
0
2
4
6
8
10
12
14
1980 1985 1990 1995 2000 20050
2
4
6
8
10
12
14
CPI
Inflation target
1) The moving average is calculated 7 years back and 2 years ahead. 2) The band around the CPI is the variation in the period, measured by +/- one standard deviation. 3) Projections for 2005 – 2007 from this Report form the basis for this estimate.
Sources: Statistics Norway and Norges Bank

1) The output gap measures the difference between actual and projected potential mainland GDP.2) The band shows the variation in the output gap measured by + one standard deviation. The variation is estimated as average standard deviation in a 10-year period, 7 years back and 2 years ahead.
Source: Norges Bank
Chart 1.2 Estimates for the output gap. Level1) and variation2). Per cent. Annual figures. 1980 – 2005
-8
-4
0
4
8
1980 1985 1990 1995 2000 2005-8
-4
0
4
8
-4
-2
0
2
4
6
2002 2003 2004 2005-4
-2
0
2
4
6
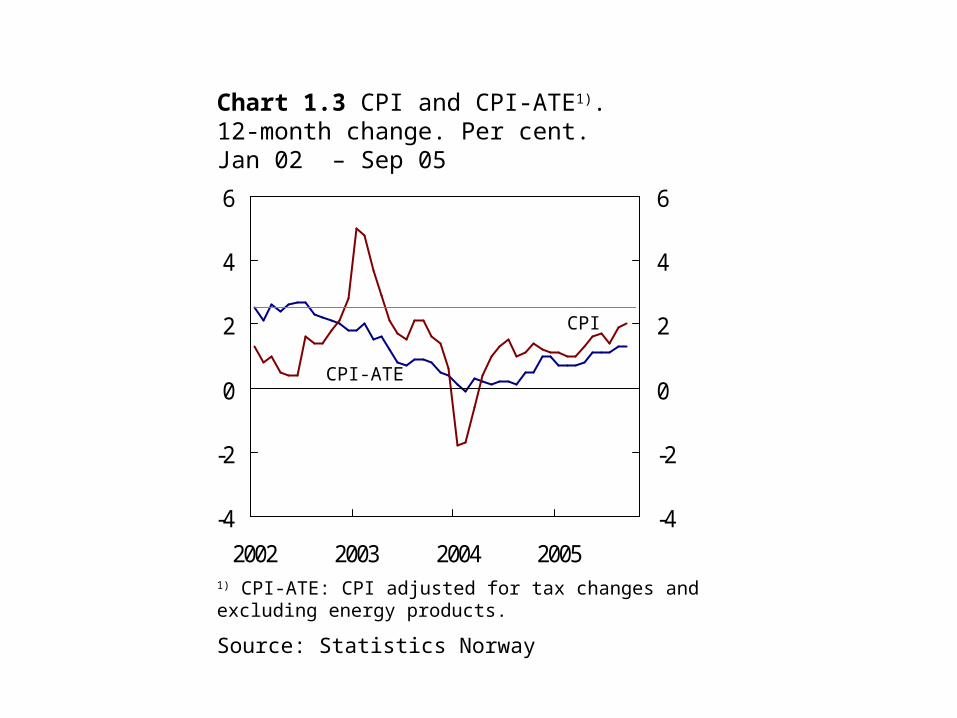
Chart 1.3 CPI and CPI-ATE1). 12-month change. Per cent. Jan 02 – Sep 05
1) CPI-ATE: CPI adjusted for tax changes and excluding energy products.
Source: Statistics Norway
CPI-ATE
CPI

Chart 1.4 3-month real interest rate1) and the neutral real interest rate in Norway. Per cent. Quarterly figures. 96 Q1 – 08 Q42)
0
1
2
3
4
5
6
1996 1998 2000 2002 2004 2006 20080
1
2
3
4
5
6
Interval for neutral real interest rate
Real interest rate
1) 3-month money market rate deflated by inflation measured by the CPI-ATE.2) The projected real interest rate for the period 05 Q4 – 08 Q4 is based on the baseline scenario.
Source: Norges Bank
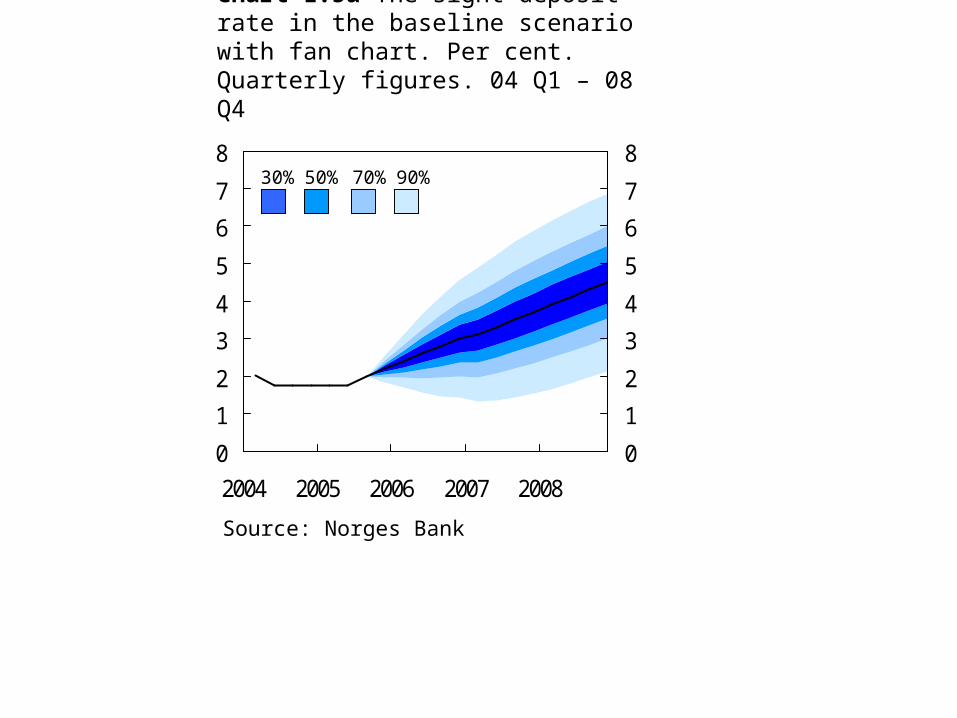
Chart 1.5a The sight deposit rate in the baseline scenario with fan chart. Per cent. Quarterly figures. 04 Q1 – 08 Q4
0
1
2
3
4
5
6
7
8
2004 2005 2006 2007 20080
1
2
3
4
5
6
7
830% 50% 70% 90%
Source: Norges Bank

Chart 1.5b Import-weighted exchange rate (I-44)1) in the baseline scenario with fan chart. Quarterly figures. 04 Q1 – 08 Q4
70
80
90
100
110
2004 2005 2006 2007 200870
80
90
100
11030% 50% 70% 90%
1) A rising curve denotes a weaker krone exchange rate. It is assumed that strengthening by a certain percentage is just as likely as weakening by the same percentage.
Source: Norges Bank

Chart 1.5c Projected CPI-ATE in the baseline scenario1) with fan chart. 4-quarter change. Per cent. 04 Q1 – 08 Q4
0
1
2
3
4
2004 2005 2006 2007 20080
1
2
3
430% 50% 70% 90%
1) Other measures of underlying inflation are shown in a separate box in Section 2.
Sources: Statistics Norway and Norges Bank

-2
-1
0
1
2
2004 2005 2006 2007 2008-2
-1
0
1
2
Chart 1.5d Estimated output gap in the baseline scenario1) with fan chart. Per cent. Quarterly figures. 04 Q1 – 08 Q4
30% 50% 70% 90%
1) Uncertainty concerning the current situation is not taken into account in the calculation.
Source: Norges Bank

Chart 1.6a Interest rate projections for trading partners and interest rate differential. Quarterly figures. 04 Q1 – 08 Q4
-1
0
1
2
3
4
5
2004 2005 2006 2007 2008-1
0
1
2
3
4
5
1) Estimated as a weighted average of trading partners' forward rates. Forward rate at 27 October.2) As in the two previous reports, the forward rate is adjusted somewhat as from 2007.3) Interest rate differential against trading partners in the baseline scenario from 05 Q4 (broken line).
Source: Norges Bank
Interest rate differential against trading partners3)
Forward interest rates trading partners1)
Baseline scenario 2)

Chart 1.6b Trading partners' interest rates1) in the baseline scenario with fan chart2). Per cent. Quarterly figures. 04 Q1 – 08 Q4
0
1
2
3
4
5
6
7
8
2004 2005 2006 2007 20080
1
2
3
4
5
6
7
830% 50% 70% 90%
1) 3-month money market rate.2) Fan chart is based on prices for interest rate options.
Sources: Reuters and Norges Bank

Chart 1.7 Projections for the CPI-ATE and output gap in the baseline scenario. Quarterly figures. Per cent. 04 Q1 – 08 Q4
-2
-1
0
1
2
3
2004 2005 2006 2007 2008-2
-1
0
1
2
3
Sources: Statistics Norway and Norges Bank
CPI-ATE
Output gap

1) Projections for 2005.
Sources: Statistics Norway, Norwegian Association of Real Estate Agents (NEF), Association of Real Estate Agency Firms (EFF), FINN.no, ECON and Norges Bank
Chart 1.8a House prices deflated by the house rent index in the CPI, building costs, household disposable income and total wage income. Indices, 1985 = 100. Annual figures. 1985 – 20051)
0
50
100
150
200
1985 1990 1995 2000 20050
50
100
150
200Deflated by house rent
Deflated by building costs
Deflated by total wage income
Deflated by disposable income

1) Projections for 2005 ― 2008.
Sources: Norwegian Association of Real Estate Agents, Association of Real Estate Agency Firms, Finn.no, ECON and Norges Bank
-10
-6
-2
2
6
10
14
18
1992 1996 2000 2004 2008-10
-6
-2
2
6
10
14
18
Chart 1.8b House prices. Annual rise. Per cent. 1992 ― 20081)

Chart 1.8c Credit to households (C2). Annual percentage change in credit. 1992 – 20081)
-202468
101214
-202468101214
1992 1996 2000 2004 20081) Projections for 2005 ― 2008.
Source: Norges Bank

Chart 1.9a Sight deposit rate in the baseline scenario and in the alternatives with stronger trade shifts and lower wage growth (red line) and higher inflation (yellow line). Per cent. Quarterly figures. 04 Q1 – 08 Q4
0
1
2
3
4
5
6
7
8
2004 2005 2006 2007 20080
1
2
3
4
5
6
7
830% 50% 70% 90%
Source: Norges Bank
Stronger trade shifts
Higher inflation

Chart 1.9b Projected CPI-ATE in the baseline scenario and in the alternatives with stronger trade shifts and lower wage growth (red line) and higher inflation (yellow line). 4-quarter change. Per cent. 04 Q1 – 08 Q4
0
1
2
3
4
2004 2005 2006 2007 20080
1
2
3
430% 50% 70% 90%
Sources: Statistics Norway and Norges Bank
Stronger trade shifts
Higher inflation

Chart 1.9c Estimated output gap in the baseline scenario1) and in the alternatives with stronger trade shifts and lower wage growth (red line) and higher inflation (yellow line). Per cent. Quarterly figures. 04 Q1 – 08 Q4
-2
-1
0
1
2
2004 2005 2006 2007 2008-2
-1
0
1
230% 50% 70% 90%
1) Uncertainty concerning the current situation is not taken into account in the calculation.
Source: Norges Bank
Stronger trade shifts
Higher inflation

Chart 1.10 3-month money market rate in the baseline scenario1) and band with highest and lowest forward interest rate last 10 days.2) Per cent. Quarterly figures. 05 Q4 ― 08 Q4
0
1
2
3
4
5
6
Oct 05 Oct 06 Oct 07 Oct 080
1
2
3
4
5
6
Baseline scenario
1) The money market rate is normally about ¼ percentage point higher than the sight deposit rate.2) Highest and lowest forward interest rate in the period 14 – 27 Oct 2005.
Source: Norges Bank
Highest and lowest forward interest rate

Chart 1.11 Sight deposit rate, Taylor rule, Orphanides rule and rule with external interest rates. Inflation as in the baseline scenario. Quarterly figures. Per cent. 00 Q1 ― 06 Q2
0
2
4
6
8
2000 2001 2002 2003 2004 2005 20060
2
4
6
8Taylor rate (blue line)
Sight deposit rate (red line)Orphanides’
rule(yellow line)
Source: Norges Bank
Rule with external interest rates
(green line)
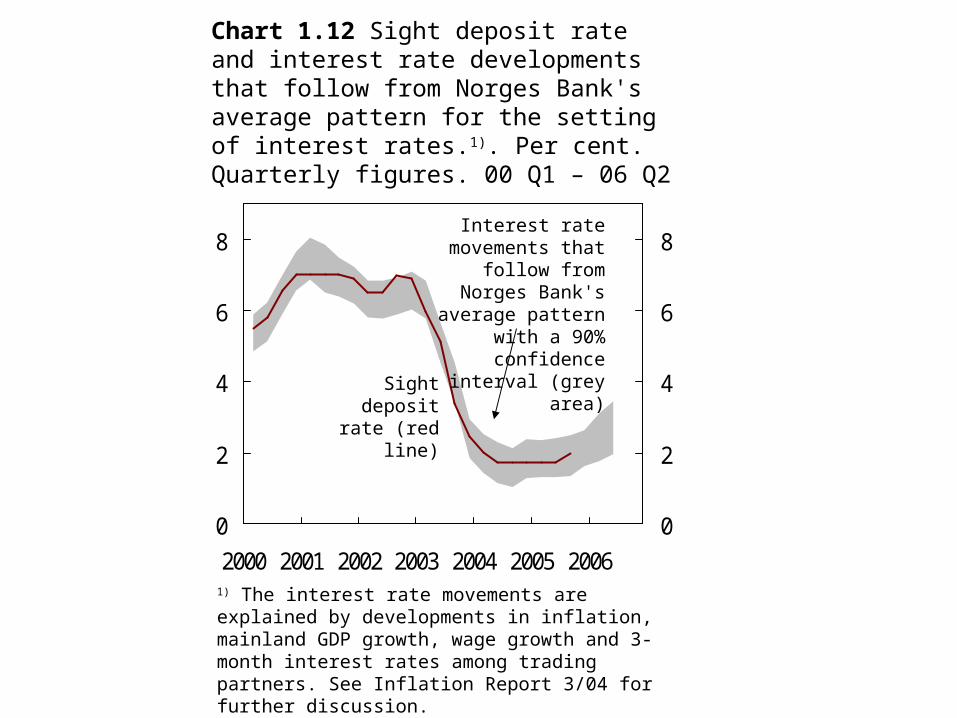
Chart 1.12 Sight deposit rate and interest rate developments that follow from Norges Bank's average pattern for the setting of interest rates.1). Per cent. Quarterly figures. 00 Q1 – 06 Q2
0
2
4
6
8
2000 2001 2002 2003 2004 2005 20060
2
4
6
8
1) The interest rate movements are explained by developments in inflation, mainland GDP growth, wage growth and 3-month interest rates among trading partners. See Inflation Report 3/04 for further discussion.
Source: Norges Bank
Interest rate movements that follow from Norges Bank's average pattern with a 90% confidence
interval (grey area)
Sight deposit rate (red line)

0.0
0.2
0.4
0.6
0.8
1.0
1.2
1.4
1960 1970 1980 1990 20000.0
0.2
0.4
0.6
0.8
1.0
1.2
1.4
Chart 1.13 CPI and scaled money supply (M2)1).
Index, 2000 = 1. Annual figures. 1960 – 2004
1) M2 is scaled by GDP at constant prices.
Sources: Statistics Norway and Norges Bank
CPI(blue line)
M2(red line)

1) Actual M2 growth is smoothed. Trend growth is estimated using a Hodrick-Prescott filter (λ = 100 000). The confidence intervals are based on the standard deviation calculated using the deviation between actual M2 growth and trend growth.
Source: Norges Bank
0
2
4
6
8
10
12
14
1993 1995 1997 1999 2001 2003 20050
2
4
6
8
10
12
1430% 50% 70% 90%
Chart 1.14 Money supply (M2). 12-month growth, estimated trend growth and intervals.1) Per cent. Monthly figures. Jan 93 ― Aug 05

2 The economic situation

Chart 2.1 GDP growth in the US, the euro area and Japan. Seasonally adjusted volume growth on previous quarter. Per cent. 03 Q1 – 05 Q2
-2
-1
0
1
2
3
2003 2004 2005-2
-1
0
1
2
3
US
Euro area
Sources: EcoWin and Norges Bank
Japan
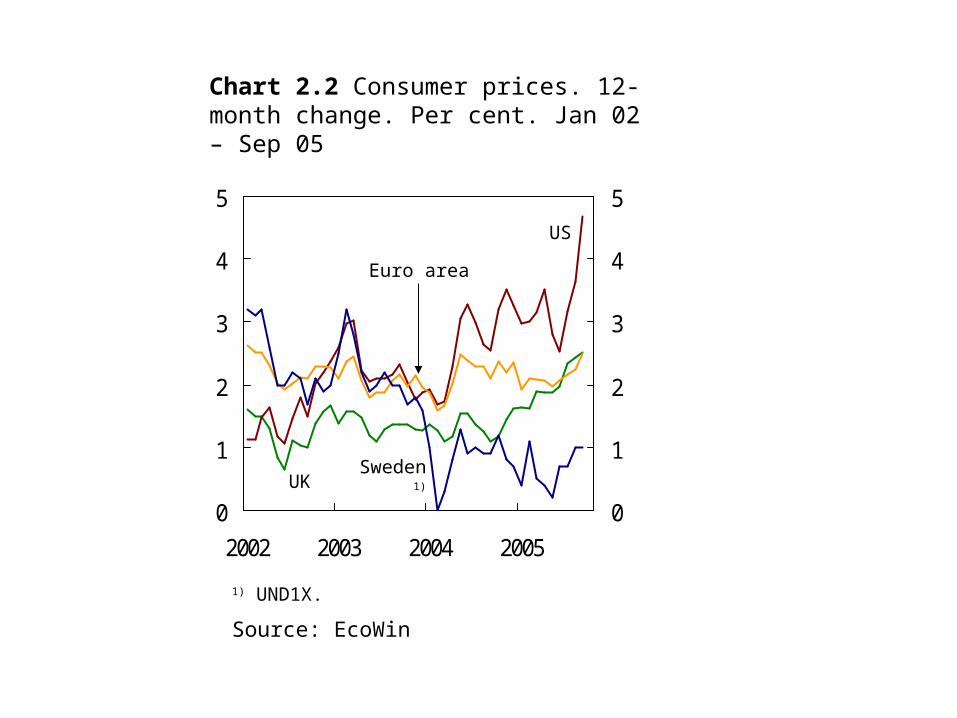
Chart 2.2 Consumer prices. 12-month change. Per cent. Jan 02 – Sep 05
0
1
2
3
4
5
2002 2003 2004 20050
1
2
3
4
5
US
Sweden1)
1) UND1X.
Source: EcoWin
Euro area
UK
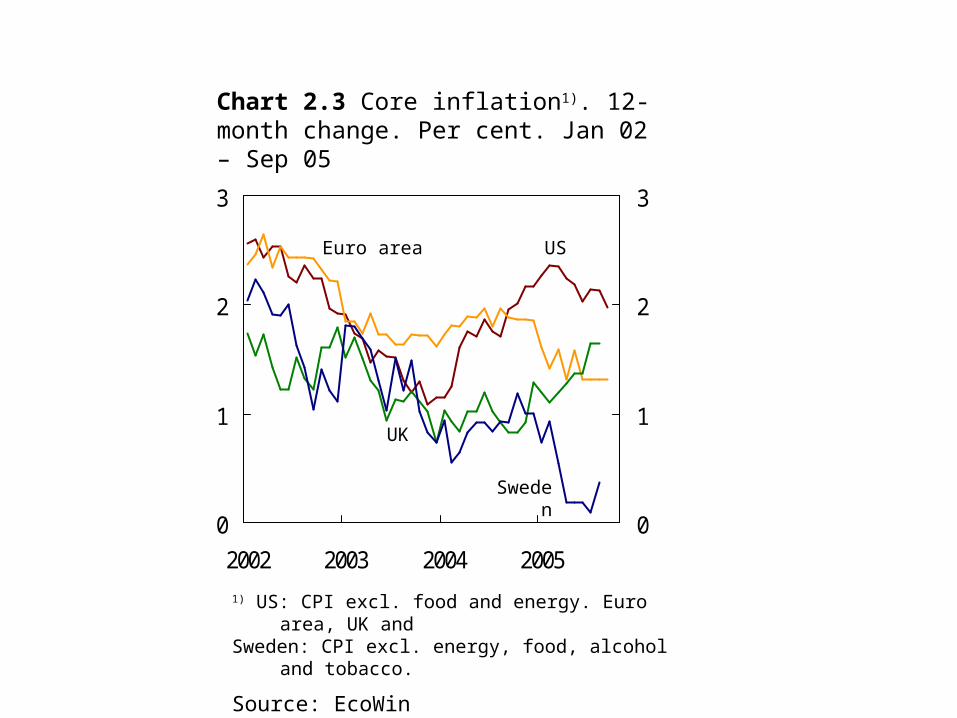
Chart 2.3 Core inflation1). 12-month change. Per cent. Jan 02 – Sep 05
0
1
2
3
2002 2003 2004 20050
1
2
3
US
Sweden
Euro area
UK
1) US: CPI excl. food and energy. Euro area, UK and Sweden: CPI excl. energy, food, alcohol and tobacco.
Source: EcoWin

Chart 2.4 Oil price. Brent Blend spot and light crude oil for future delivery. USD per barrel. Daily figures. 1 Jan 02 – 27 Oct 05
15
25
35
45
55
65
2002 2003 2004 200515
25
35
45
55
65
Delivery in 6-7 years
Spot
Sources: Reuters and EcoWin

Chart 2.5 Petrol and crude oil prices. Index, Jan 02 = 100. Daily figures. 1 Jan 04 – 27 Oct 05
100
200
300
400
500
Jan 04 Jul 04 Jan 05 Jul 05100
200
300
400
500
Crude oil
Source: EcoWin
Unleaded petrol

0
20
40
60
80
100
Aug Sep Oct Nov0
20
40
60
80
100Katrina
Source: Energy Administration Information
Rita Wilma
Ivan
Chart 2.6 Crude oil production in the Gulf of Mexico shut down due to hurricanes. Share of total produc-tion capacity. Per cent. Daily figures. 29 Aug – 30 Nov in 2004 (Ivan) and 2005 (Katrina, Rita and Wilma)

0
1
2
3
4
5
6
2003 2004 2005 20060
1
2
3
4
5
6
US
Euro area
NorwayUK
1) Broken lines show expectations at 27 October 2005. Dotted lines show expectations at 24 June 2005 (IR 2/05). Based on FRAs and futures contracts adjusted for the estimated difference between 3-month money market rates and the key rate.
Sources: Reuters and Norges Bank
Sweden
Chart 2.7 Interest rate expectations. Actual and expected key rate1) at 27 Oct 05 and 24 Jun 05. Daily figures. 2 Jan 03 – 1 Nov 06

85
90
95
100
105
1102000 2001 2002 2003 2004 2005
-15
-10
-5
0
5
10
15
1) A rising curve denotes a stronger krone exchange rate.2) Figures for Oct 05 are the average for the period 1 – 27 Oct 2005.3) Deviation from average 1970 -2004.4) 2005 is based on wage growth in the baseline scenario and TWI from 1 Jan – 27 Oct 2005.
Source: Norges Bank
Chart 2.8 The krone exchange rate (I-44)1). Monthly figures. Jan 00 – Oct 052). Relative labour costs in common currency3). Annual figures. Per cent. 2000 – 20054)
I-44(left-hand scale)
Relative labour costs in manufacturing (right-hand scale)

Chart 2.9 Non-oil government budget deficit and petroleum investment. In billions of NOK. Annual figures. 2000 – 20061)
0
50
100
150
200
2000 2003 20060
50
100
150
200
1) Projections for 2005 -2006.
Sources: Statistics Norway, Ministry of Finance andNorges Bank
Non-oil deficitPetroleum investment
50
150
250
350
450
550
1996 1998 2000 2002 200450
150
250
350
450
550
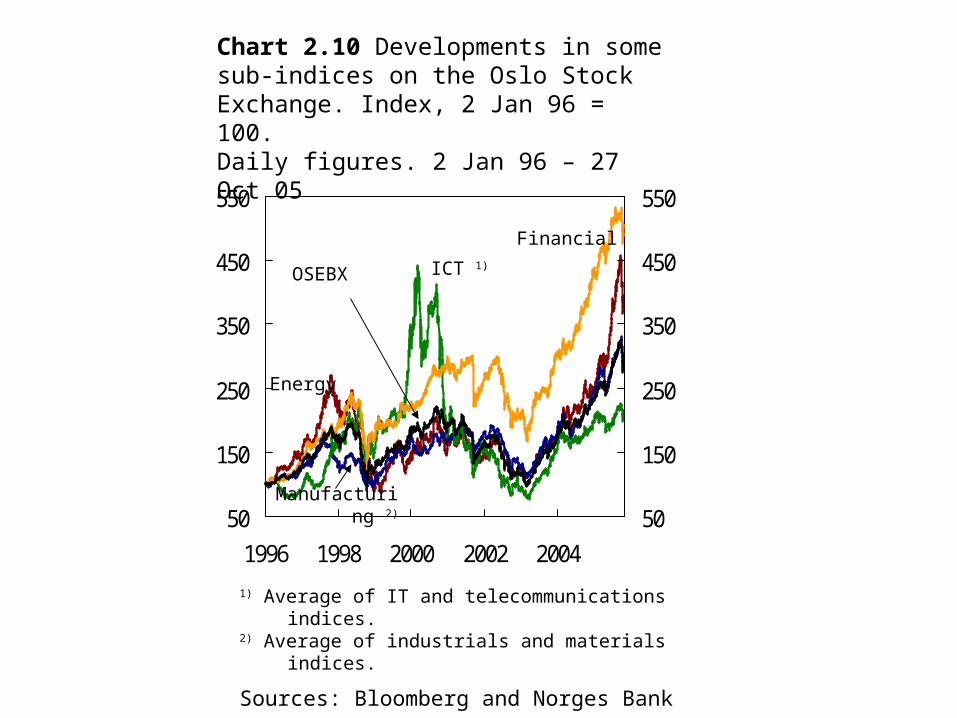
OSEBX
Financial
Manufacturing 2)
ICT 1)
Energy
1) Average of IT and telecommunications indices.2) Average of industrials and materials indices.
Sources: Bloomberg and Norges Bank
Chart 2.10 Developments in some sub-indices on the Oslo Stock Exchange. Index, 2 Jan 96 = 100.Daily figures. 2 Jan 96 – 27 Oct 05

0
5
10
15
20
25
30
Priv.cons.
Publiccons.
Mainl.investm.
Petr.investm.
Exp.trad.
goods
0
5
10
15
20
25
30First 5 quarters
Last 4 quarters
1) 03 Q2 – 05 Q2.
Sources: Statistics Norway and Norges Bank
Chart 2.11 Demand. Average quarterly growth (annualised) in the upturn of the last 9 quarters1). Per cent

Chart 2.12 Credit to households1) and enterprises2). 12-month change. Per cent. Jan 02 – Aug 05
-3
0
3
6
9
12
15
2002 2003 2004 2005-3
0
3
6
9
12
15
Enterprises
1) From domestic sources (C2).2) Total credit to mainland Norway (C3).
Source: Norges Bank
Households

Chart 2.13 Turnover rate1) for new dwellings in Eastern Norway. Per cent. Feb 02 – Oct 05
0
5
10
15
2002 2003 2004 20050
5
10
15
1) Dwellings sold in last 2 months as a percentage of total number of new dwellings for sale in building projects.
Source: ECON
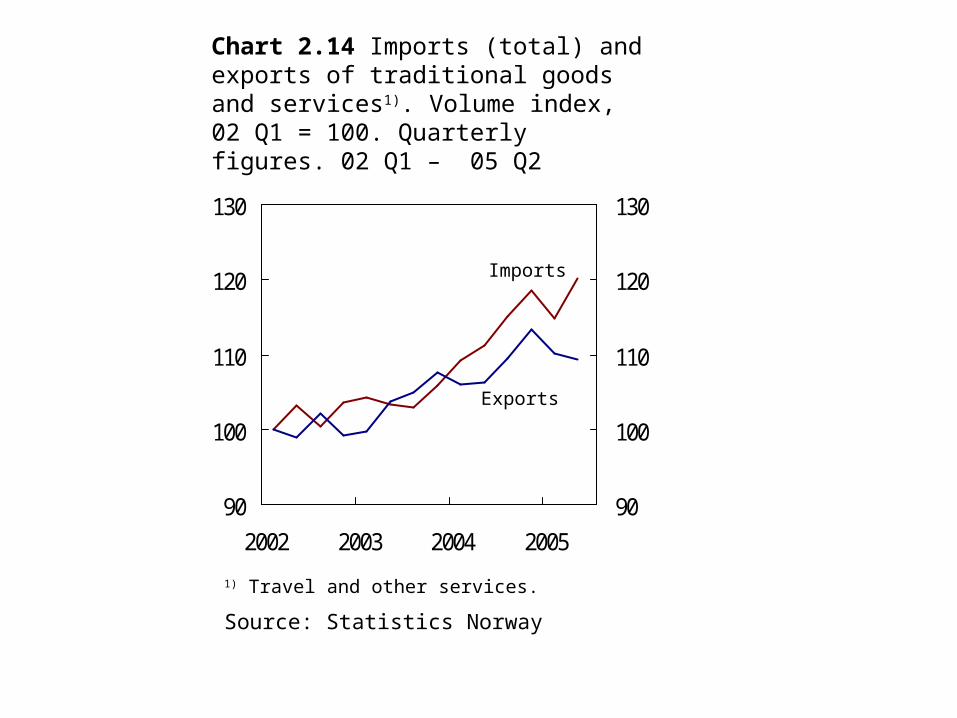
Chart 2.14 Imports (total) and exports of traditional goods and services1). Volume index, 02 Q1 = 100. Quarterly figures. 02 Q1 – 05 Q2
90
100
110
120
130
2002 2003 2004 200590
100
110
120
130
1) Travel and other services.
Source: Statistics Norway
Imports
Exports
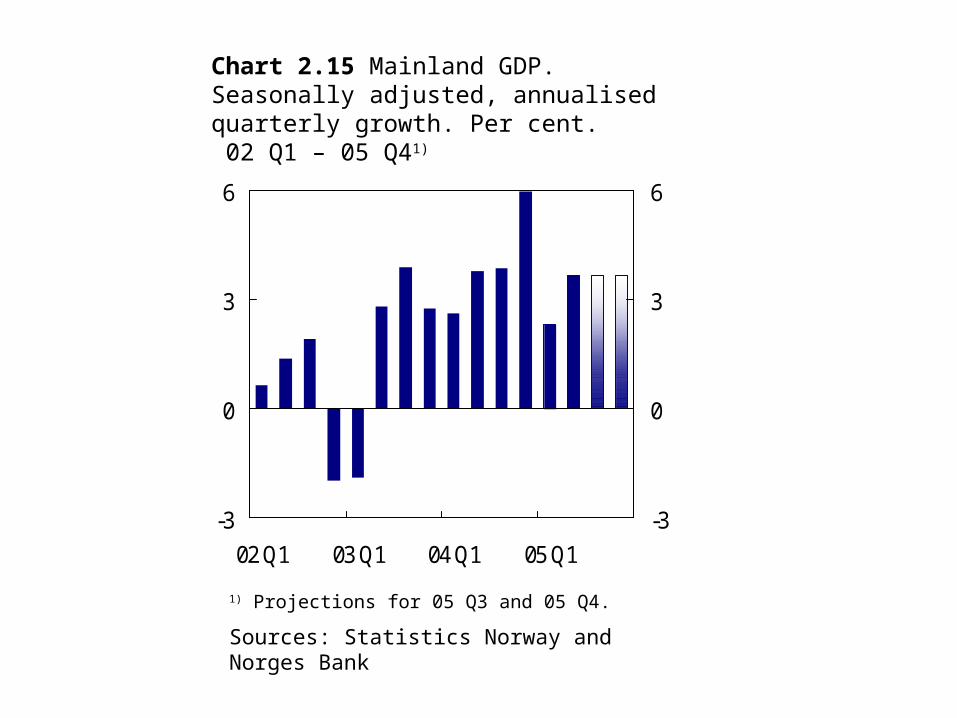
Chart 2.15 Mainland GDP. Seasonally adjusted, annualised quarterly growth. Per cent. 02 Q1 – 05 Q41)
-3
0
3
6
02 Q1 03 Q1 04 Q1 05 Q1-3
0
3
6
1) Projections for 05 Q3 and 05 Q4.
Sources: Statistics Norway and Norges Bank

1) Gross product per person-hour.2) 03 Q2 – 05 Q2.
Sources: Statistics Norway and Norges Bank
0
1
2
3
4
5
MainlandGDP
No.employed
Person-hours
worked
Productivity0
1
2
3
4
5First 5 quarters
Last 4 quarters
Chart 2.16 Mainland GDP, employment and productivity1). Average quarterly growth (annualised) in the upturn of the last 9 quarters2). Per cent

98
102
106
110
-3 0 3 6 9 12 1598
102
106
110
Chart 2.17 Number employed. Developments after the start of a cyclical upturn. Index, quarter 0 = 100
Sources: Statistics Norway and Norges Bank
91 Q482 Q4
03 Q1
Quarters

50
75
100
125
2000 2001 2002 2003 2004 200550
75
100
125
Chart 2.18 Unemployed. LFS unemployment, registered unemployed and persons on ordinary labour market programmes. In thousands. Seasonally adjusted. Monthly figures. Jan 00 – Oct 05
Sources: Statistics Norway and the Directorate of Labour
Registered unemployed and on labour market programmes
LFS unemployment
Registered unemployed

-5
-3
-1
1
3
5
1983 1987 1991 1995 1999 2003-5
-3
-1
1
3
5
Chart 2.19 Estimates for the output gap. Per cent. Annual figures. 1983 – 2005
Source: Norges Bank

75
77
79
81
83
85
1990 1994 1998 200275
77
79
81
83
85
Chart 2.20 Capacity utilisation in manufacturing. Trend. Per cent. Quarterly figures. 90 Q1 – 05 Q2
Sources: Statistics Norway and Norges Bank
Average

-5
-3
-1
1
3
5
1982 1986 1990 1994 1998 2002-5
-3
-1
1
3
5
Chart 2.21 Employment and person-hours worked. Percentage deviation from trend1). Quarterly figures. 82 Q2 – 05 Q2
1) Trend calculated using HP filter. See Staff Memo 2005/2(www.norges-bank.no) for further information.
Sources: Statistics Norway and Norges Bank
Man-hours gap
Employment gap

Chart 2.22 CPI-ATE1). Seasonally adjusted monthly change. 3-month moving average (centred), annualised. Jan 05 – Dec 052)
-2
0
2
4
Jan 05 Apr 05 Jul 05 Oct 05-2
0
2
4
1) CPI-ATE: CPI adjusted for tax changes and excluding energy products.2) Projections for Sep 05 – Dec 05.
Sources: Statistics Norway and Norges Bank
40
50
60
70
80
90
100
2001 2002 2003 2004 200540
50
60
70
80
90
100
Volume
Value
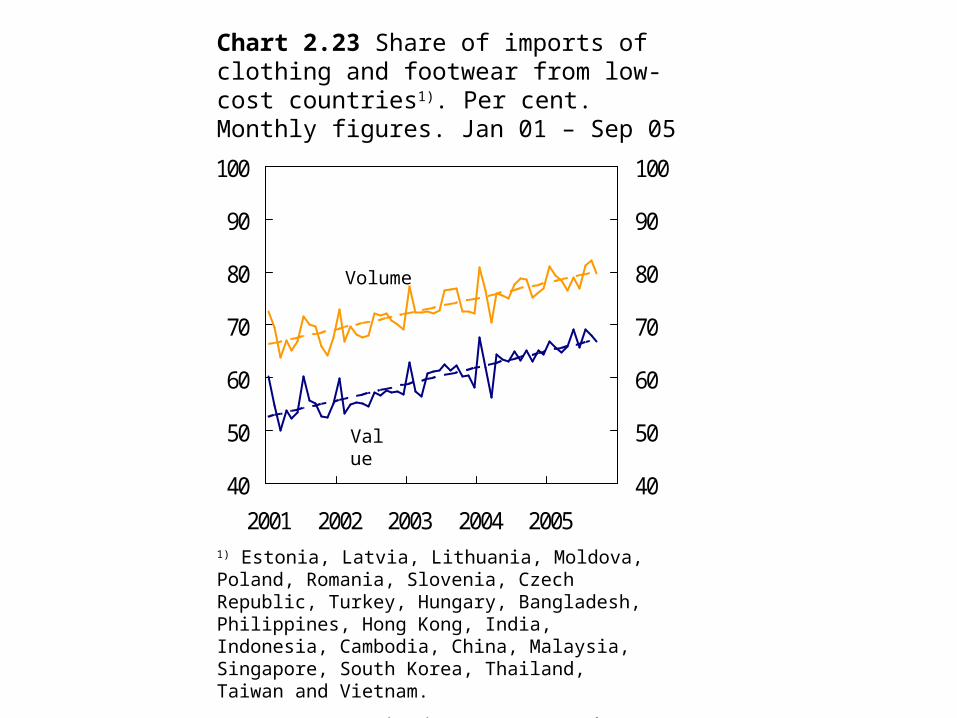
Chart 2.23 Share of imports of clothing and footwear from low-cost countries1). Per cent. Monthly figures. Jan 01 – Sep 05
1) Estonia, Latvia, Lithuania, Moldova, Poland, Romania, Slovenia, Czech Republic, Turkey, Hungary, Bangladesh, Philippines, Hong Kong, India, Indonesia, Cambodia, China, Malaysia, Singapore, South Korea, Thailand, Taiwan and Vietnam.
Sources: Statistics Norway and Norges Bank

0
10
20
30
40
50
60
2001 2002 2003 2004 20050
10
20
30
40
50
60
Volume
Value
Chart 2.24 Share of imports of audiovisual equipment from low-cost countries1). Per cent. Monthly figures. Jan 01 – Sep 05
1) Estonia, Latvia, Lithuania, Moldova, Poland, Romania, Slovenia, Czech Republic, Turkey, Hungary, Bangladesh, Philippines, Hong Kong, India, Indonesia, Cambodia, China, Malaysia, Singapore, South Korea, Thailand, Taiwan and Vietnam.
Sources: Statistics Norway and Norges Bank

0
10
20
30
40
2001 2002 2003 2004 20050
10
20
30
40
Volume
Value
Chart 2.25 Share of imports of furniture and white goods from low-cost countries1). Per cent. Monthly figures. Jan 01 – Sep 05
1) Estonia, Latvia, Lithuania, Moldova, Poland, Romania, Slovenia, Czech Republic, Turkey, Hungary, Bangladesh, Philippines, Hong Kong, India, Indonesia, Cambodia, China, Malaysia, Singapore, South Korea, Thailand, Taiwan and Vietnam.
Sources: Statistics Norway and Norges Bank

-6
-4
-2
0
2
4
6
2002 2003 2004 2005-6
-4
-2
0
2
4
6
Chart 2.26 CPI-ATE1). Total and by supplier sector2). With projections from IR 2/05 (broken line). 12-month change. Per cent. Jan 02 – Sep 05
1) CPI-ATE: CPI adjusted for tax changes and excluding energy products.2) Norges Bank's projections.
Sources: Statistics Norway and Norges Bank
Goods and services produced in Norway
CPI-ATE
Imported consumer goods

Chart 2.27 CPI-ATE1) and estimates for the output gap2). Quarterly figures. Per cent. 00 Q1 – 05 Q43)
-2
0
2
4
2000 2001 2002 2003 2004 2005-2
0
2
4
CPI-ATE
Output gap
1) CPI-ATE: CPI adjusted for tax changes and excluding energy products.2) Quarterly figures for the output gap have been derived from the annual figures. 3) CPI-ATE projection for 05 Q4.
Sources: Statistics Norway and Norges Bank

3 Developments ahead

52
54
56
58
60
62
1978 1983 1988 1993 1998 2003 200852
54
56
58
60
62
Chart 3.1 Private consumption as a share of mainland GDP. Constant and current prices. Annual figures. Per cent. 1978 – 20081)
Share of consumption, value
Share of consumption, volume
1) Projections for 2005 – 2008.
Sources: Statistics Norway and Norges Bank

Chart 3.2 Real growth in household disposable income1) and consumption. Annual figures. Per cent. 1990 – 20082)
-2
0
2
4
6
8
1990 1993 1996 1999 2002 2005 2008-2
0
2
4
6
8
1) Adjusted for estimated reinvested share dividends since 2001.2) Projections for 2005 – 2008.
Sources: Statistics Norway and Norges Bank
Real income growthReal growth in consumption

-15
-10
-5
0
5
10
1980 1985 1990 1995 2000 2005-15
-10
-5
0
5
10
Chart 3.3 Household saving ratio and net lending as a share of disposable income.1) Annual figures. 1980 – 20082)
Saving ratio
Net lending
1) Adjusted for estimated reinvested share dividends since 2001.2) Projections for 2005 – 2008.
Sources: Statistics Norway and Norges Bank

Chart 3.4 Underlying spending growth in the government budget and nominal growth in mainland GDP. Growth on previous year. Per cent. 1985 – 20061)
0
3
6
9
12
15
0
3
6
9
12
15
1985 1988 1991 1994 1997 2000 2003 2006
1) Projections for 2005 and 2006 from the Ministry of Finance.
Sources: Ministry of Finance (National Budget 2006) and Statistics Norway
Underlying spending growth
Nominal growth in mainland GDP

Chart 3.5 Structural non-oil deficit and expected real return on the Government Petroleum Fund. In billions of 2006-NOK. Annual figures. 2001 – 2010
0
20
40
60
80
100
120
2001 2003 2005 2007 20090
20
40
60
80
100
120
Source: Ministry of Finance (National Budget 2006)
Use of petroleum revenues over and above the 4 per cent ruleExpected real return

Chart 3.6 Oil price (Brent Blend) in USD per barrel. Futures prices from 24 Jun 05 and 27 Oct 05. Daily figures. 2 Jan 02 – 27 Oct 08
15
25
35
45
55
65
2002 2004 2006 200815
25
35
45
55
65
24 June 2005IR 2/05
27 October 2005
Source: Reuters

Chart 3.7 Investment intentions survey for oil and gas activities incl. pipeline transport. Estimated and actual investment. In billions of NOK
0
20
40
60
80
0
20
40
60
80
2002
2003
2005
2004
Estimate published previous year
Estimate published same year
Source: Statistics Norway
Final figures
May Aug Nov Feb May Aug Nov Feb
2006

Chart 3.8 Investment in oil and gas recovery incl. pipeline transport. Investment level in billions of NOK (constant 2002-prices) and annual growth in per cent. 1995 – 20081)
-30
-20
-10
0
10
20
30
50
60
70
80
90
100
1995 1998 2001 2004 2007
1) Projections for 2005 – 2008.
Sources: Statistics Norway and Norges Bank
Investment level (right-hand scale)
Annual growth(left-hand scale)

Chart 3.9 Investment intentions survey for power supply sector. Estimated and actual investment. In billions of NOK
0
2
4
6
8
10
12
0
2
4
6
8
10
12
2002
2003
20052004
Estimate published previous year
Estimate published same year
Source: Statistics Norway
Final figures
May Aug Nov Feb May Aug Nov Feb
2006

-20
-10
0
10
20
1980 1985 1990 1995 2000 2005-4
-2
0
2
4
Fixed investment, (left-hand scale)
GDP(right-hand scale)
1) Trend calculated using HP filter. See Staff Memo 2005/2 (www.norges-bank.no) for further details.2) Based on annual projections for 2005 – 2008.
Sources: Statistics Norway and Norges Bank
Chart 3.10 GDP and fixed investment. Mainland Norway. Percentage deviation from trend1). Quarterly figures. Per cent. 80 Q1 – 08 Q22)

Chart 3.11 Oil price in NOK and terms of trade. Export price index relative to import price index, 1990 = 1. Quarterly figures. 90 Q1 – 05 Q2
0
100
200
300
400
1990 1993 1996 1999 2002 20050.8
1
1.2
1.4
Traditional goods and services
(right-hand scale)
Oil price in NOK (left-hand scale)
Sources: EcoWin and Statistics Norway
Total goods and services
(right-hand scale)

60
80
100
120
140
160
2002 2003 2004 200560
80
100
120
140
160
Chart 3.12 International prices for industrial commodities in USD. Indices, 2000 = 100. Weekly figures. Week 1 2002 – Week 42 2005
Agricultural products excl. food
Metals
Total industrials
Source: EcoWin

Chart 3.13 Change in employment on previous year. Per cent. Unemployment1) as a percentage of labour force. Annual figures. 1980 – 20082)
-4
-2
0
2
4
0
2
4
6
8
1980 1985 1990 1995 2000 2005
1) LFS unemployment.2) Projections for 2005 – 2008.
Sources: Statistics Norway and Norges Bank
LFS unemployment rate (right-hand scale)
Number employed (left-hand scale)

Chart 3.14 Labour force as a percentage of population aged 16 – 74 (labour force participation rate). Per cent. Annual figures. 1980 – 20081)
65
67
69
71
73
75
65
67
69
71
73
75
1980 1984 1988 1992 1996 2000 2004 2008
1) Projections for 2005 – 2008.
Sources: Statistics Norway and Norges Bank

-2
-1
0
1
2
16-19 20-29 30-39 40-54 55-66 67-74-2
-1
0
1
2
Sources: Statistics Norway and Norges Bank
(49.1) (76.5) (87.1) (87.3) (62.3) (18.7)
Chart 3.15 Composition of the population. Change for various age groups from 2004 to 2008. Percentage points. Labour force participation rates for 2004 in brackets
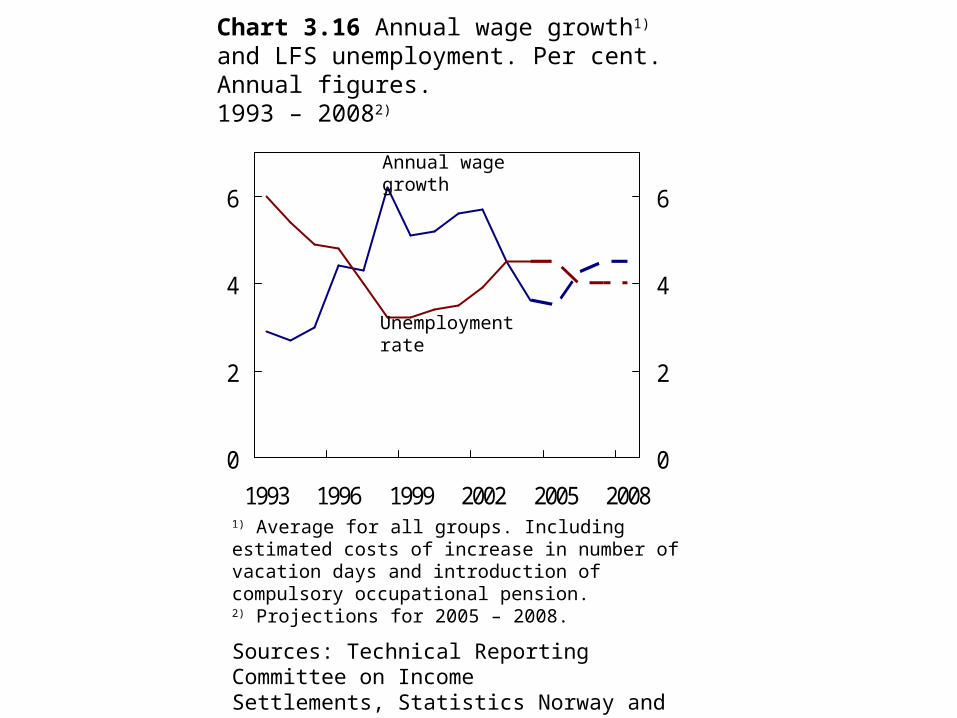
Chart 3.16 Annual wage growth1) and LFS unemployment. Per cent. Annual figures. 1993 – 20082)
0
2
4
6
1993 1996 1999 2002 2005 20080
2
4
6
Unemployment rate
Annual wage growth
1) Average for all groups. Including estimated costs of increase in number of vacation days and introduction of compulsory occupational pension.2) Projections for 2005 – 2008.
Sources: Technical Reporting Committee on IncomeSettlements, Statistics Norway and Norges Bank

Chart 3.17 CPI and CPI-ATE1). 12-month change. Per cent. Jan 02 – Dec 082)
-2
0
2
4
6
2002 2004 2006 2008-2
0
2
4
6
1) CPI-ATE: CPI adjusted for tax changes and excluding energy products.2) Projections for Oct 05 – Dec 08.
Sources: Statistics Norway and Norges Bank
CPI-ATE
CPI

-6
-4
-2
0
2
4
6
1990 1993 1996 1999 2002 2005-6
-4
-2
0
2
4
6
Chart 3.18 Consumer prices adjusted for tax changes1). Imported consumer goods. 12-month change. Per cent. Jan 90 – Sep 05
1) Norges Bank's calculations up to December 2003.
Sources: Statistics Norway and Norges Bank

Chart 3.19 Indicator of external price impulses to imported consumer goods measured in foreign currency. Annual figures. Per cent. 1995 – 20081)
1) Projections for 2005 – 2008.
Source: Norges Bank
-3
-2
-1
0
1
2
-3
-2
-1
0
1
2
1995 1998 2001 2004 2007

Chart 3.20 CPI-ATE1). Total and by supplier sector2). 12-month change. Per cent. Jan 02 – Dec 083)
-6
-4
-2
0
2
4
6
2002 2004 2006 2008-6
-4
-2
0
2
4
6
1) CPI-ATE: CPI adjusted for tax changes and excluding energy products.2) Norges Bank's calculations.3) Projections for Oct 05 – Dec 08.
Sources: Statistics Norway and Norges Bank
Goods and services produced in Norway
CPI-ATE
Imported consumer goods

Boxes

Uncertainty surrounding future interest rate
developments

Chart 1 3-month money market rate and forward rates at time of publication of the Inflation Report. Per cent. Quarterly figures. 99 Q1 – 05 Q3
0
2
4
6
8
1999 2000 2001 2002 2003 2004 20050
2
4
6
8
Source: Norges Bank
IR 2/99
IR 2/00
IR 2/01IR 2/02
IR 1/03
IR 2/03
IR 2/04
3-month money market rate
Forward interest rates

Chart 2 Average deviation between forward interest rates and actual 3-month money market rate in the period 1999 – 2005. Absolute value. Percentage points
0.0
0.5
1.0
1.5
2.0
2.5
3.0
1 2 3 4 5 6 7 8 9 10 11 120.0
0.5
1.0
1.5
2.0
2.5
3.0
Source: Norges Bank
Quarters ahead

Chart 3a Sight deposit rate in the baseline scenario with fan chart based on historical interest rate developments. Per cent. Quarterly figures. 05 Q1 – 08 Q3
0
2
4
6
8
2005 2006 2007 20080
2
4
6
830% 50% 70% 90%
Source: Norges Bank

Chart 3b Sight deposit rate in the baseline scenario with fan chart based on interest rate options1). Per cent. Half-yearly figures. 05 H1 – 08 H2
0
2
4
6
8
2005 2006 2007 20080
2
4
6
830% 50% 70% 90%
1) Based on options prices at 27 October 2005.
Source: Norges Bank

Chart 4a US. 3-month money-market rate and forward interest rate with fan chart based on options prices calculated in June 2002. Per cent. Half-yearly figures. 01 H1 – 05 H1
0
2
4
6
8
10
12
2001 2002 2003 2004 20050
2
4
6
8
10
1230% 50% 70% 90%
Source: Norges Bank
Actual interest rate
Forward interest rate

Chart 4b Norway. 3-month money-market rate and forward interest rate with fan chart based on options prices calculated in June 2002. Per cent. Half-yearly figures. 01 H1 – 05 H1
0
2
4
6
8
10
12
2001 2002 2003 2004 20050
2
4
6
8
10
1230% 50% 70% 90%
Source: Norges Bank
Actual interest rate
Forward interest rate

Chart 5 The sight deposit rate in the baseline scenario with fan chart. Per cent. Quarterly figures. 04 Q1 – 08 Q4
0
1
2
3
4
5
6
7
8
2004 2005 2006 2007 20080
1
2
3
4
5
6
7
830% 50% 70% 90%
Source: Norges Bank

Chart 6 Projected CPI-ATE in the baseline scenario1) with fan chart. 4-quarter change. Per cent. 04 Q1 – 08 Q4
0
1
2
3
4
2004 2005 2006 2007 20080
1
2
3
430% 50% 70% 90%
1) Other measures of underlying inflation are shown in a separate box in Section 2.
Sources: Statistics Norway and Norges Bank

Accuracy of short-term interest rate expectations

0
2
4
6
8
2003 2004 20050
2
4
6
8
Chart 1 Interval for the sight deposit rate at the end of each strategy period and actual developments. Daily figures. Per cent. 1 Jan 03 – 27 Oct 05
1/03
Sight deposit rate
2/03
3/031/04
Strategy period
2/04 1/053/04
Source: Norges Bank
3/02
2/05

Monetary policy since 30 June 2005

0
2
4
6
8
2003 2004 20050
2
4
6
8
Chart 1 Interval for the sight deposit rate at the end of each strategy period and actual developments. Daily figures. Per cent. 1 Jan 03 – 27 Oct 05
1/03
Sight deposit rate
2/03
3/031/04
Strategy period
2/04 1/053/04
Source: Norges Bank
3/02
2/05

Price developments

Chart 1 CPI, CPI-AT1) and CPI-ATE2). 12-month change. Per cent. Jan 02 – Sep 05
-4
-2
0
2
4
6
2002 2003 2004 2005-4
-2
0
2
4
6
1) CPI-AT: CPI adjusted for tax changes.2) CPI-ATE: CPI adjusted for tax changes and excluding energy products.
Source: Statistics Norway
CPI
CPI-ATE
CPI-AT

Chart 2 CPI-ATE1) incl. and excl. prices for clothing and footwear2). Monthly change. Per cent. Jun 03 – Sep 05
-1.0
-0.5
0.0
0.5
1.0
Jun 03 Dec 03 Jun 04 Dec 04 Jun 05-1.0
-0.5
0.0
0.5
1.0
1) CPI-ATE: CPI adjusted for tax changes and excluding energy products.2) Norges Bank's calculations.
Sources: Statistics Norway and Norges Bank
CPI-ATE
CPI-ATE excluding clothing and footwear

Chart 3 Prices for some imported consumer goods. 12-month change. Per cent. Jan 02 – Sep 05
-15
-10
-5
0
5
2002 2003 2004 2005-15
-10
-5
0
5
Source: Statistics Norway
Cars
Clothing and footwear
Audiovisual equipment

Chart 4 Prices for goods and services produced in Norway1). 12-month change. Per cent. Jan 02 – Sep 05
-3
-1
1
3
5
7
2002 2003 2004 2005-3
-1
1
3
5
7
1) Adjusted for tax changes and excluding energy products. Percentage share of CPI-ATE in brackets. Norges Bank's calculations up to December 2003.2) Excluding energy and agricultural and fish products.
Sources: Statistics Norway and Norges Bank
Consumer goods produced in Norway2) (20)
House rents (18)
Services with wages as a dominant factor (7)
Other services (20)

Chart 5 Three indicators of underlying inflation. 12-month change. Per cent. Jan 02 – Sep 05
-1
0
1
2
3
4
5
2002 2003 2004 2005-1
0
1
2
3
4
5
Weighted median1)
CPI-ATE
Trimmed mean2)
1) Estimated on the basis of 93 sub-groups of the CPI.2) Price changes accounting for 20 per cent of the weighting base are eliminated.
Source: Statistics Norway

0
10
20
30
40
Oil price Petrol inCPI
Transportservices in
CPI
CPI0
10
20
30
40
1) Brent Blend spot.
Sources: Statistics Norway and Reuters
Chart 6 Oil price1) and components of the CPI that are particularly affected by the oil price. 12-month change. Per cent. Sep 05
Output gap uncertainty

Chart 1 Estimate and uncertainty for the output gap. Per cent. Quarterly figures. 04 Q1 – 05 Q2
-3
-2
-1
0
1
2
3
Mar 04 Sep 04 Mar 05-3
-2
-1
0
1
2
3
Source: Norges Bank

Increased imports from low-cost countries

Chart 1 Cumulative change in share of imports from various segments since 2000. Percentage points
-30
0
30
-30
0
30
2001 2002 2003 2004China US and Japan
-15
0
15
-15
0
15
2001 2002 2003 2004Europe excl. EU 15 and EFTA
Sources: Statistics Norway and Norges Bank
-10
0
10
-10
0
10
2001 2002 2003 2004EU15 and EFTA Asia ex. Jap. and China
Furniture and household articles Audiovisual equipment Clothing and footwear
90
95
100
105
1998 2000 2002 200490
95
100
105
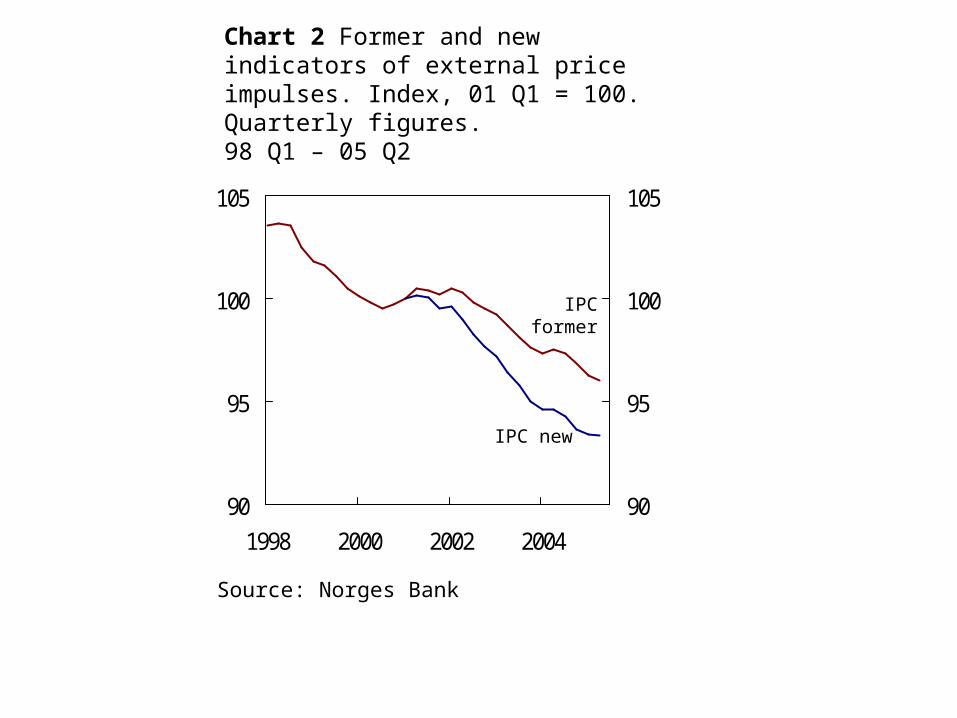
Chart 2 Former and new indicators of external price impulses. Index, 01 Q1 = 100. Quarterly figures. 98 Q1 – 05 Q2
Source: Norges Bank
IPC former
IPC new

70
80
90
100
110
2001 2003 200570
80
90
100
110
70
80
90
100
110
2001 2003 2005
70
80
90
100
110
2001 2003 2005
Chart 3 Former and new indicators of external price impulses to some product groups.Index, 01 Q1 = 100. Quarterly figures. 01 Q1 – 05 Q2
Source: Norges Bank
IPC former
Furniture and household articles Audiovisual equipment Clothing and footwear
IPC new
IPC former
IPC former
IPC new
IPC new

Effects of high oil prices on the world economy

-5.0
-2.5
0.0
2.5
5.0
0
10
20
30
40
1970 1980 1990 2000
G7 (left-hand scale) OECD
(left-hand scale)
Sources: OECD Economic Outlook, EcoWin, Reuters and Norges Bank
Oil price (right-hand scale)
Chart 1 Oil price and estimates of the output gap (per cent) in the OECD countries and G7. Oil price in USD per barrel. Annual figures. 1971 – 2004

Chart 2 Oil intensity. Kilos oil per unit of real GDP adjusted for purchasing power parity. Index, 1971 = 100. Annual figures. 1971 – 2004
0
20
40
60
80
100
120
1970 1980 1990 20000
20
40
60
80
100
120
Sources: IMF and Norges Bank
Non-OECD countries
OECD

0
20
40
60
80
100
120
1970 1980 1990 20000
20
40
60
80
100
120Real oil price
Nominal oil price
Chart 3 Real oil price and nominal oil price. USD per barrel. Real price in 2004-USD, deflated by the CPI in the US. Monthly figures. Jan 70 – Sep 05
Sources: EcoWin, Reuters and Norges Bank

The projections in Inflation Report 2/05 and 3/05

-4
-2
0
2
4
Jan 04 Jul 04 Jan 05 Jul 05-4
-2
0
2
4
Chart 1 CPI-ATE1). Total and by supplier sector2). Actual inflation and projections in IR 2/05 (broken line). 12-month change. Per cent. Jan 04 – Dec 05
1) CPI-ATE: CPI adjusted for tax changes and excluding energy products.2) Norges Bank's calculations.
Sources: Statistics Norway and Norges Bank
Goods and services produced in Norway
CPI-ATE
Imported consumer goods

0.5
0.7
0.9
1.1
1.3
1.5
Jan 05 Mar 05 May 05 Jul 05 Sep 050.5
0.7
0.9
1.1
1.3
1.5
Chart 2 CPI-ATE. Projections in IR 2/05, projections from a time series model and actual price movements. 12-month change. Per cent. Jan 05 – Sep 05
Sources: Statistics Norway and Norges Bank
Time seriesmodel
Actual CPI-ATE
Projections IR 2/05

Chart 3 3-month money market rate1) in baseline scenario in IR 2/05 and 3/05. Fan around interest rate from IR 2/05. Per cent. Quarterly figures. O4 Q1 – 08 Q4
0
1
2
3
4
5
6
7
8
2004 2005 2006 2007 20080
1
2
3
4
5
6
7
830% 50% 70% 90%
1) The money market rate is normally about ¼ percentage point higher than the sight deposit rate.
Source: Norges Bank
Interest rate in IR 3/05Interest rate in IR 2/05

Chart 4 Krone exchange rate (I-44)1) in baseline scenario in IR 2/05 and 3/05. Fan around exchange rate from IR 2/05. Quarterly figures. 04 Q1 – 08 Q4
70
80
90
100
110
2004 2005 2006 2007 200870
80
90
100
11030% 50% 70% 90%
1) A rising curve denotes a weaker krone exchange rate. It is assumed that strengthening by a certain percentage is just as likely as weakening by the same percentage
Source: Norges Bank
I-44 in IR 3/05I-44 in IR 2/05

-2
-1
0
1
2
2004 2005 2006 2007 2008-2
-1
0
1
2
Chart 5 Estimates for output gap1) in IR 2/05 and 3/05. Fan2) around estimate in IR 2/05. Per cent. Quarterly figures. 04 Q1 – 08 Q4
1) The output gap measures the difference between actual and trend mainland GDP.2) Uncertainty concerning the current situation is not taken into account in the calculation.
Sources: Norges Bank
30% 50% 70% 90%
Output gap in IR 3/05Output gap in IR 2/05

Chart 6 Projections for CPI-ATE1) in IR 2/05 and 3/05. Fan around projection in IR 2/05. Per cent. Quarterly figures. 04 Q1 – 08 Q4
-1
0
1
2
3
4
2004 2005 2006 2007 2008-1
0
1
2
3
430% 50% 70% 90%
1) CPI-ATE: CPI adjusted for tax changes and excluding energy products
Sources: Statistics Norway and Norges Bank
CPI-ATE in IR 3/05CPI-ATE in IR 2/05

0
1
2
3
4
0
1
2
3
4
Chart 7 Mainland GDP. The last two projections published for 20061). Percentage growth
May Oct Jun Sep NovJun
1) All projections published in 2005.
Sources: Revised National Budget 2005, National Budget 2006, Economic Survey 2/05and 3/05, Inflation Report 2/05 and 3/05Consensus Forecasts June and October 2005
SNFIN NBCFOctJun

Chart 8 CPI-ATE. The last two projections published for 20061). Percentage rise
0.0
0.5
1.0
1.5
2.0
2.5
0.0
0.5
1.0
1.5
2.0
2.5
Jun Sep NovJunMay Oct
1) All projections published in 2005.
Sources: Revised National Budget 2005, National Budget 2006, Economic Survey 2/05and 3/05, Inflation Report 2/05 and 3/05
SNFIN NB

Annex I
Regional network

Chart 1 Norges Bank’s regional network: demand and production. Index1). Oct 02 – Sep 05
-5
-3
-1
1
3
5
2002 2003 2004 2005-5
-3
-1
1
3
5Suppliers to the petroleum industry
Export industry
All industries
Construction
1) The scale runs from -5 to +5, where -5 indicates a large fall and +5 indicates strong growth. See article "Norges Bank's regional network" in Economic Bulletin 3/05 for further information.
Source: Norges Bank

Chart 2 Norges Banks regional network: investment plans. Change in investment in next 6 – 12 months. Index1). Oct 02 – Sep 05
-5
-3
-1
1
3
5
2002 2003 2004 2005-5
-3
-1
1
3
5
Retail tradeMunicipal and hospital sector
ServicesManufacturing
1) The scale runs from -5 to +5, where -5 indicates a large fall and +5 indicates strong growth. See article "Norges Bank's regional network" in Economic Bulletin 3/05 for further information.
Source: Norges Bank
Annex II
Charts

0
2
4
6
8
10
1995 1996 1997 1998 1999 2000 2001 2002 2003 2004 20050
2
4
6
8
10
Source: Norges Bank
Sight deposit rate
3-month money market rate
Chart 1 Norwegian interest rates. 3-month money market rate, sight deposit rate and 10-year government bond yield. Monthly figures. Jan 95 – Sep 05
10-year government bond yield

0
2
4
6
8
10
1995 1996 1997 1998 1999 2000 2001 2002 2003 2004 20050
2
4
6
8
10
Euro area1)
US
Japan
Chart 2 3-month interest rates in the US, the euro area and Japan. Monthly figures. Per cent. Jan 95 – Sep 05
1) Theoretical ECU rate up to and including December 1998.
Source: EcoWin

0
2
4
6
8
10
1995 1996 1997 1998 1999 2000 2001 2002 2003 2004 20050
2
4
6
8
10
Sources: EcoWin and Norges Bank
UK
Sweden
Chart 3 3-month interest rates in the UK, Sweden and among trading partners. Per cent. Monthly figures. Jan 95 – Sep 05
Trading partners

85
90
95
100
105
110
115
1995 1996 1997 1998 1999 2000 2001 2002 2003 2004 200585
90
95
100
105
110
115
Import-weighted exchange rate, I-44
(1995 = 100)
Trade-weighted exchange rate index, TWI (1990 = 100)
Chart 4 Trade-weighted exchange rate index (TWI) and import-weighted exchange rate (I-44).1) Monthly figures. Jan 95 – Sep 05
1) A rising curve denotes a weaker krone exchange rate.
Source: Norges Bank

5
6
7
8
9
10
1995 1996 1997 1998 1999 2000 2001 2002 2003 2004 200560
70
80
90
100
110
1) A rising curve denotes a weaker krone exchange rate.
Source: Norges Bank
NOK/EUR(left-hand scale)
NOK/SEK(right-hand scale)
Chart 5 Bilateral exchange rates1). Monthly figures. Jan 95 – Sep 05
NOK/USD(left-hand scale)
0
5
10
15
20
1997 1998 1999 2000 2001 2002 2003 2004 20050
5
10
15
20
Source: Norges Bank
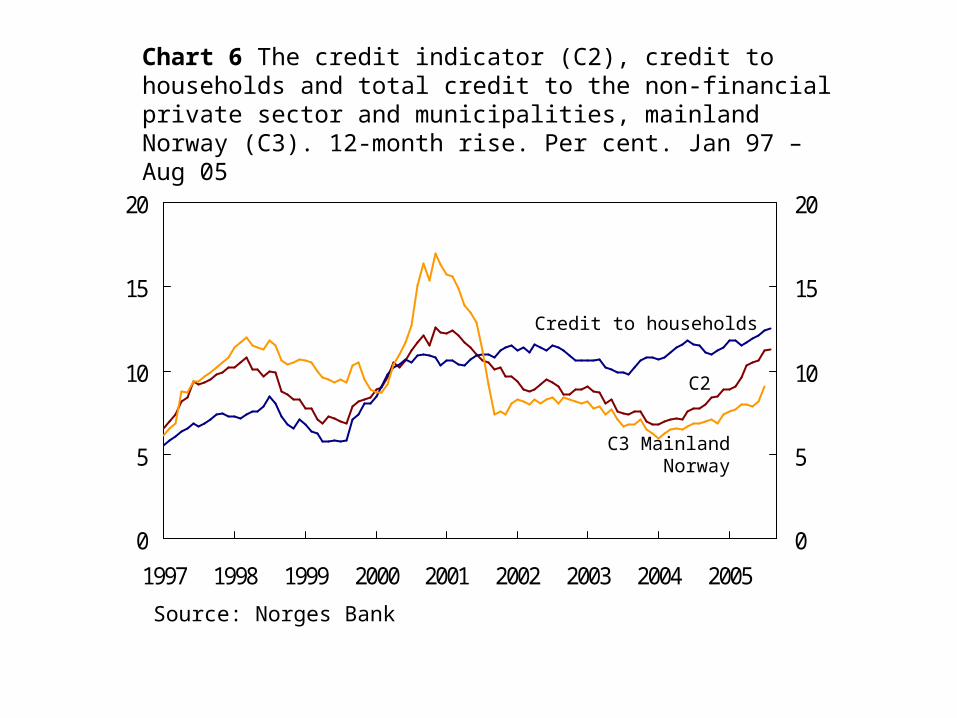
Credit to households
C2
Chart 6 The credit indicator (C2), credit to households and total credit to the non-financial private sector and municipalities, mainland Norway (C3). 12-month rise. Per cent. Jan 97 – Aug 05
C3 Mainland Norway