charts for interpreting wildland fire behavior … · united states department of agriculture...
TRANSCRIPT
United States Department of Agriculture Charts for Forest Serv~ce
Intermountain Forest and Range Experiment Station Ogden, UT 84401
Interpreting Wildland General Technical Report INT-131
Fire Behavior September 1982 Characteristics
Patricia L. Andrews and Richard C. Rothermel
This file was created by scanning the printed publication.Errors identified by the software have been corrected;
however, some errors may remain.

THE AUTHORS PATRICIA L. ANDREWS is a mathematician stat~oned at the Northern Forest Fire Laboratory in Missoula, Mont. She rece~ved her B.A. in mathematics and chemistry from Eastern Montana College, Bill~ngs, in 1970, and her M.A. in mathematics and computer science in 1973 from the University of Montana, Missoula. She has been employed at the Northern Forest Fire Laboratory since 1973.
RICHARD C. ROTHERMEL is a research engineer stationed at the Northern Forest Fire Laboratory in Missoula, Mont. Rothermel received his B.S. degree in aeronautical engineering at the University of Washington, Seattle, in 1953. He served in the U.S. Air Force as a special weapons aircraft development officer from 1953-55. Upon his discharge he was employed at Douglas Aircraft Company as a designer and troubleshooter in the Armarnent Group. From 1957 to 1961 Rothermel was em- ployed by General Electric Co. in the aircraft nuclear pro- pulsion department at the National Reactor Testing Station in Idaho. In 1961, Rothermel joined the Northern Forest Fire Laboratory where he has been engaged in research on the mechanisms of fire spread. He received his master's degree in mechanical engineering at the University of Colorado, Fort Collins, in 1971. He was project leader of the Fire Fundamentals research work unit from 1966 until 1979, and is currently project leader of the Fire Behavior research work unit at the fire laboratory.
RESEARCH SUMMARY The fire characteristics chart is proposed as a
graphical method of presenting two primary character- istics of fire behavior: spread rate and intensity. Its primary use is communicating and interpreting either site- specific predictions of fire behavior or National Fire- Danger Rating System (NF3RS) indexes and components. Rate of spread, heat per unit area, flame length, and fireline intensity are plotted on a fire behavior chart. Spread component, energy release component, and burning index are plotted on an NFDRS chart.
Specific examples illustrate use of a fire characteristics chart in conjunction with fire prescriptions, fire behavior forecasts, fire .management plans, and briefings.
The equations used in creating the charts are given; and a method of obtaining heat per unit area from fire behavior nomograms is illustrated.
The use of trade, firm, or corporation names in this publication is for the information and convenience of the reader. Such use does not constitute an official endorsement or approval by the U.S. Department of Agriculture of any product or service to the exclusion of others which may be suitable.
Approved for publication by Intermountain Station September 1981

United States Department of Agricullure Charts for Forest Serv~ce
Intermountain Forest and Range Experiment Station
Interpreting Wildland Ogden, UT 84401
General Techn~cal Report INT-131
Fire Behavior September 1982 Characteristics
Patricia L. Andrews and Richard C. Rothermel
FIRE CHARACTERISTICS CHARTS A fire characteristics chart is a graph that illustraies
the two primary characteristics of fire behavior-spread rate and intensity. Overall fire severity, as well as the character of the fire, can be inferred from the location of a point representing the fire on the chart. The chart is mainly useful a s a communication aid. The fire char- acteristics chart can be used for site-specific predictions of fire behavior (fig. 1) or for National Fire-Danger Rat- ing System (NFDRS) indexes and components (fig 2).
There is a pressing need for analysis of fire behavior and a clear understanding of the analysis a t all levels of management. Fire policy on National Forests has shifted emphasis from fire control to fire management. In addition to traditional fire control and use activitles, a successful fire manager must also evaluate altcrnative fire management strategies in relation to land and resource management objectives. A vital part of this process is communication with other resource special- ists who may not be familiar with the National Fire- Danger Rating System or methods for predicting slte- specific fire behavior. Quantitative descriptors of fire behavior are becoming more widely used due to the prevalence of automated systems (Rothermel 1980). The hand-held TI-59 calculator with a Fire DangeriFire Behavior Custom Read Only Memory (CROM) is an examplc of techllology that is reaching every level of lire manager- from dispatchers to regional planners (Burgan 1980). Fire characteristics charts allow graphic presentation of quantitative fire behavior information in a form that is readily understood.
Fire Characteristics Chart
0
HEAT PER UNIT AREA, BTUl FT2
Figure I.-Fire behavior fire characteristics chart.

Fire Characteristics C h a r t
ENERGY RELEASE COMPONENT, ERC
F~gure 2.-Natronal F~re-Danger Rating System (NFDRS) frre characterrstrcs chart.
FIRE BEHAVIOR CHARTS The values that are plotted on the fire behavior charts
are based on a mathematical model for predicting fire spread in wildland fuels (Rothermel 1972). Calculations are made using nomograms (Albini 1976a), computer (Albini 1976b), or calculator (Burgan 1979). The model estimates actual fire behavior from specific descriptions of fuel type, fuel moisture, topography, and wind. The four descriptors of fire behavior that are plotted as a single point on the chart are:
1. Rate of spread (chainslhour), the forward rate of spread at the head of a surface fire.
2. Heat per unit area ( ~ t u l f t ~ ) , a measure of the amount of heat that is released by a square foot of fuel while the flaming zone of the fire is in that area. (Procedures for obtaining this value from nomograms and the equation for modifying existing computer pro- grams are given in appendix A.)
3. Flame length (feet), the length of the flame at the head of the fire measured from the middle of the com- bustion zone to the average position of the flame tip. Flame length is determined by the rate of spread and the heat per unit area of the fire.
4. Fireline intensity (Btulftls], the amount of heat released per second by a foot-wide slice of the flaming
combustion zone (Byram 1959). This value has been directly related to flame length, an observable char- acteristic of fire behavior. Fireline intensity is indicative of the heat that would be experienced by a person working near the fire.
Flame length and fireline intensity can be interpreted in terms of suppression capabilities as shown in table 1. The curved lines on the fire behavior chart define the areas of interpretations shown in table 1. The inter- pretations range from fires being easily controlled by hand crews, to fire o ich equipment can be effec- tive, lo fires on whlcl ,trol effort a t the head will be ineffective.
As an illustration of how the fire behavior chart works, the fire behavior prediction values listed in table 2 are plotted in figure 3. These predictions are for fires in three fuel types burning under the same wind, slope, and fuel moisture conditions. The fuel types were chosen from the 13 stylized fire behavior fuel models (Anderson 1982). Fuel model 1 represents continuous stands of arid western grass: fuel model 10, litter and understory of a timber stand with heavy accumi~lations of deadfall; and fuel model 8, short-needle litter.
The differences among the characteristics of the fires in these three fuel types are readily apparent from their
r-
FIRE BEHAVIOR Fire Characteristics Chart
.t\f ' b
HEAT PER U N I T AREA. BTUI Fr2
Figure 3.-Fire behavior predictions from table 2 plotted on a fire behavior chart.
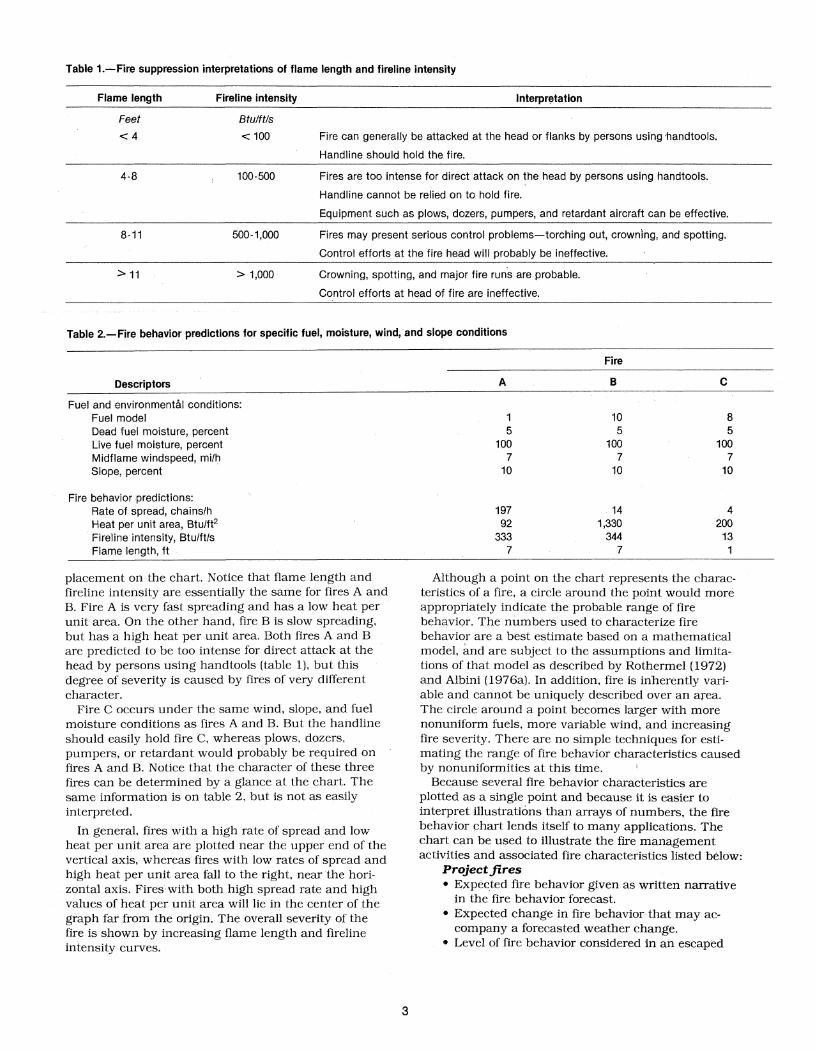
Table 1.-Fire suppression interpretations of flame length and fireline intensity
Flame length Fireline internsity Interpretation
Feet
< 4
B tulf tls
< 100 Fire can generally be attacked at the head or flanks by persons using handtools.
Handline should hold the lire.
4-8 100-500 Fires are too intense for direct attack on the head by persons using handtools.
Handline cannot be relied on to hold fire.
Equipment such as plows, dozers, pumpers, and retardant aircraft can be effective.
500 - 1,000 Fires may present serious control problems-torching out, crowning, and spotting.
Control efforts at the fire head will probably be ineffective.
' 11 > 1,000 Crowning, spotting, and major fire run's are probable.
Control efforts at head of fire are ineffective.
Table 2.-Fire behavior predictions for specific fuel, moisture, wind, and slope conditions
Fire
Descriptors
Fuel and environmenthl conditions: Fuel model Dead fuel moisture, percent Live fuel moisture, percent Midflame windspeed, milh Slope, percent
Fire behavior predictions: Rate of spread, chainslh Heat per unit area, Btulft2 Fireline intensity, Btulftls Flame length, ft
placement on the chart. Notice that flame length and fireline intensity are essentially the same for fires A and B. Fire A is very fasi spreading and has a low heat per unit area. On the other hand, fire B is slow spreading, but has a high heat per unit area. Both fires A and B are predicted to be too intense for direct attack at the head by persons using handtools (table l) , but this degree of severity is caused by fires of very different character.
Fire C occurs under the same wind, slope, and fuel moisture conditions a s fires A and B. But the handline should easily hold fire C, whereas plows, dozers. pumpers, or retardant would probably be required on fires A and B. Notice that the character of these three fires can be determined by a glance at the chart. The same information is on table 2, but is not as easily interpreted.
In general, fires with a high rate of spread and low heat per unit area are plotted near the upper end of the vertical axis, whereas fires with low rates of spread and high heat per unit area fall to the right, near the hori- zontal axis. Fires with both high spread rate and high values of heat per unit area will lie in the center of the graph far from the origin. The overall severity of the fire is shown by increasing flame length and fireline intensity curves.
Although a point on the chart represents the charac- teristics of a fire, a circle around the point would more appropriately indicate the probable range of fire behavior. The numbers used to characterize fire behavior are a best estimate based on a mathematical model, and are subject to the assumptions and limita- tions of that model as described by Rothermel (1972) and Albini (1976a). In addition, fire is inherently vari- able and cannot be uniquely described over an area. The circle around a point becomes larger with more nonuniform fuels, more variable wind, and increasing fire severity. There are no simple techniques for esti- mating the range of fire behavior characteristics caused by nonuniformities at this time. I
Because several fire behavior characteristics are plotted a s a single point and because it is easier to interpret illustrations than arrays of numbers, the fire behavior chart lends itself to many applications. The chart can be used to illustrate the fire management activities and associated fire characteristics listed below:
Project fires Expected fire behavior given as written narrative in the fire behavior forecast. Expected change in fire behavior that may ac- company a forecasted weather change.
@ Level of fire behavior considered in an escaped

fire analysis. Expected change in fire behavior with a change in fuel type.
Prescribedfire Fire characteristics required to achieve specific burn objectives. Fire behavior expected under a range of weather conditions. Behavior of a n escaped fire. Conditions that will require using ignition patterns to draw the fire and produce the desired intensity. Behavior of strip fires-bracketed by plotting the behavior of a backing fire and a free-burning head fire.
Long-range planning Variation of fire behavior between planning units under the same weather conditions. Effect of a change in fuel type on fire behavior.
Application of Fire Behavior Charts EXAMPLE: FIRE PRESCRIPTIONS
Successful prescribed burning requires planning. Fischer (1978) propbses a four-point fire use plan and report: treatment area and objectives, fire prescription,
Part 2 - Fire Prescription
2.1 Treatment Specifications
2.11 Desired Accomplishment
- Kiii shrubs and trees C5" D.B.H. without kiillng the overstory of western larch.
- Expose mineral soils over 60% of the area
- Reduce duff by 86%.
2.12 Desired Fire Behavior
- The fiame iength must be iess than 4 feet to ensure that less than 60% of the crowns will be scorched, therefore aliowlng the larch to survive.
- Due to dlscontinulty of fuels, a head flre wlth a flame length of at least 2 feet IS required to achleve a unlform burn pattern
- The fiame iength should be iess than 4 feet to reduce the risk of torching and spot fires. The burn area is within a mile of some 2.year old logging siash. if a spot f r e occurs in the siash, it wiii require pumpers and possibiy retaidant for control.
- Under the burning conditions that are required to meet desired duff reduction objectives, a free-burning, forward. spreadng fire would make torching. crowning, and spottirig probable. Strip headfires will be used to keep the fire behavior wthin the required range.
2.13 Required Environmental Conditions
Relative Humidity - 20.30% Temperature - 70-80 F Windspeed (midflame) - N-NW - 3-7 1.H Fuel Moisture - 10.14% 10.H Fuel Moisture - 12.14% Live Fuel Moisture - 75.125% Duff Moisture - 50%
Figure 4.-The fire prescription part of a fire use plan and report.
burning plan, and report. The fire prescription portion includes a section on fire behavior and associated en- vironmental conditions desired to meet burn objectives.
Increasingly specific fire management objectives have created a need for more quantitative descriptions of fire behavior. Rate of spread described a s fast or slow, or fire intensity as hot or cool, is often not adequate. The four values plotted on the fire cliaracteristics chart describe aspects of fire behavior that are important in both fire control and fire effects considerations. Flame length and fireline intensity are directly related Lo the effectiveness of control forces. Many prescribed burns are conducted under conditions that produce flame lengths less than 3 feet. Rothermel and Deeming (1980) have suggested that fireline intensity be correlated to fire effects in the flames or in the convection column, and heat per unit area be correlated to fire effects near the base of the fire in the duff and litter. Fire behavior can be quantified on a fire characteristic chart without dwelling on tables and numbers. An example of a sec- tion of a fire use plan and report and the associated fire behavior chart are shown in figures 4 and 5.
HEAT PER U N I T AREA, BTUI d2
300
250
200
Figure 5.-Use of a fire characteristics chart to illustrate the desired fire behavior portion of the prescription given in figure 4.
0 500 1000 1500 2000
-
-.
-
FIRE BEHAVIOR Fire Characteristics Chart
4 s Fee - bumin he~dGre 4 B : Backin Cire 9 c: Desired &.;-re behavior

EXAMPLE: FIRE BEHAVIOR FORECAST A fire behavior officer (FBO) is normally part of an
overhead team on a project fire. His duties include identifying critical fire behavior conditions and project- ing fire size. He prepares a fire behavior forecast which includes a written narrative describing potential fire behavior. This is done for briefing the fire overhead team and is revised whenever conditions warrant a new appraisal of fire behavior. One of the tools the FBO uses in his job is the fire behavior model in the form of
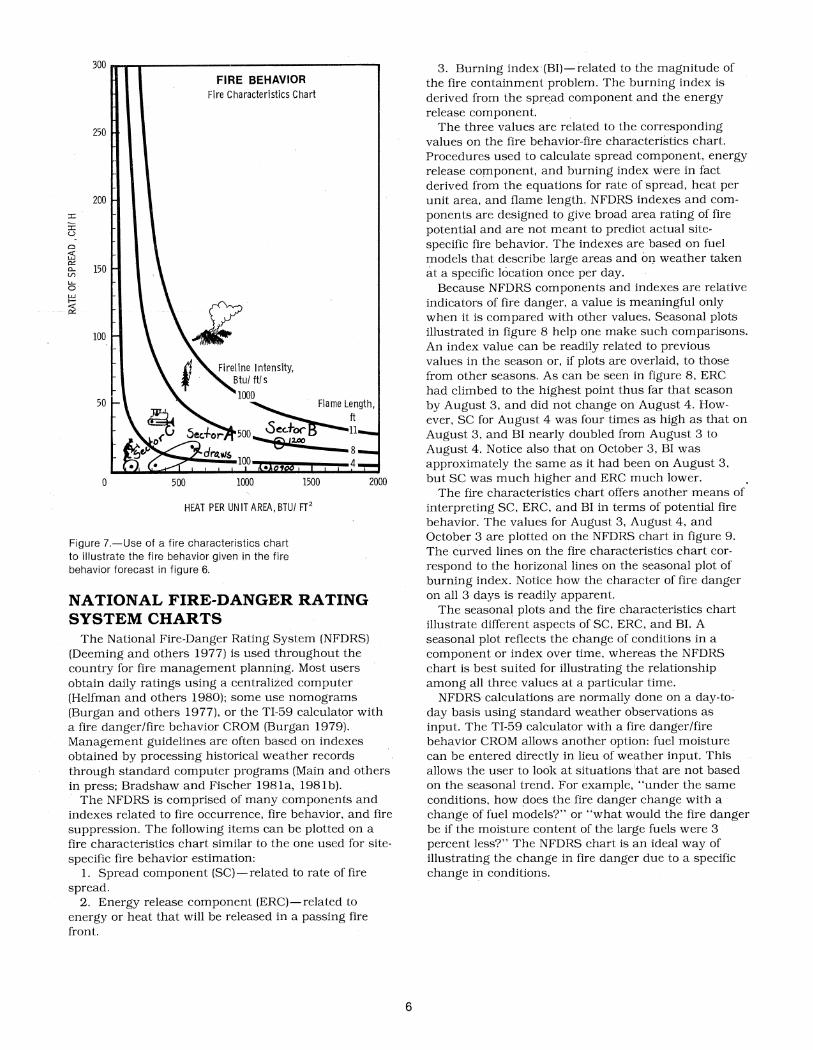
nomograms or the TI-59 calculator. The numerical out- put from the model must be interpreted by the FBO before it is communicated. In addition to the narrative fire behavior forecast and a map indicating expected fire growth, a fire characteristics chart can be used in the oral briefing to illustrate potential fire behavior for different sectors of the fire. A fire behavior forecast and the associated fire characteristics chart are shown in figures 6 and 7.
FlRE BEHAVIOR FORECAST NO.
NAME OF FIRE: PREDICTION FOR: Day SHIFT
FOREST: SHIFT DATE:
TIME AND DATE FORECAST ISSUED: 0900 SIGNED:
FlRE BEHAVIOR OFFICER
WEATHER SUMMARY RED FLAG ALERT SEE ATTACHED SPOT FORECAST
Note Terrain channeling of the general wind up the river will produce up-canyon winds of 5 to 10 milh along the lower slopes and 10 to 15 milh along upper slopes by early afternoon.
FlRE BEHAVIOR GENERAL: Fire will be relatively inactive until the inversion breaks, about 1200. Fire activity will
increase sharply at that time with fire spread mainly up-canyon to the southwest. Some torching will occur where fuel concentrations exist with short range spotting possible.
SPECIFIC: SECTOR A. Fire spread will be relatively low on this sector (3 chains per hour), but rolling fire-
brands will be a problem, especially in the small draws to the south. Roll into unburned fuels will result in upslope runs with some torching and short range spotting.
SECTOR B. This will be a hot sector on the fire today. Direct attack with hand crews will be marginal until 1100 and impossible after the inversion breaks. Roll and spotting will cause short runs to the ridge, especially in the small draws to the south.
SECTOR C. The fire will back slowly down canyon against the wind. Rolling material may cause some problems, but this will be the coolest sector on the fire. Conditions will be good for direct attack to succeed.
AIR OPERATIONS: Strong inversion will limit air operations until about noon. Any thunderstornls that occur later in the day will produce turbulent flying conditions.
SAFETY: Crews should be alert to the danger of roll igniting fuels below them on steep slopes. If thunderstorms enter the fire area, be alert for the possibility of erratic fire behavior from down-
draft winds. A weather watch has been established to give warning of approaching thunderstorms.
Figure 6.-F~re behavior forecast.
HEAT PER UNIT AREA, BTUI FT2
Figure 7.-Use of a fire characteristics chart to illustrate the fire behavior glven in the f ~ r e behavior forecast in figure 6.
NATIONAL FIRE-DANGER RATING SYSTEM CHARTS
The National Fire-Danger Rating System [NFDRS) (Deeming and others 1977) is used throughout the country for fire management planning. Most users obtain daily ratings using a centralized computer (Helfman and others 1980): some use nomograms (Burgan and others 1977), or the TI-59 calculator with a fire dangerifire behavior CROM (Burgan 1979). Management guidelines are often based on indexes obtained by processing historical weather records through standard computer programs (Main and others in press: Bradshaw and Fischer 1981a, 1981b).
The NFDRS is comprised of many components and indexes related to fire occurrence, fire behavior, and fire suppression. The following items can be plotted on a fire characteristics chart similar to the one used for site- specific fire behavior estimation:
1. Spread component (SC)-related to rate of fire spread.
2. Energy release component (ERC)-related to energy or heat that will be released in a passing fire front.
3. Burning index (B1)-related to the magnitude of the fire containment problem. The burning index is derived from the spread component and the energy release component.
The three values are related to the corresponding values on the fire behavior-fire characterisiics chart. Procedures used to calculate spread component, energy release component, and burning index were in fact derived from the equations for rate of spread, heat per unit area, and flame length. NFDRS indexes and com- ponents are designed to give broad area rating of fire potential and are not meant to predict actual site- specific fire behavior. The indexes are based on fuel models that describe large areas and on weather taken a t a specific location once per day.
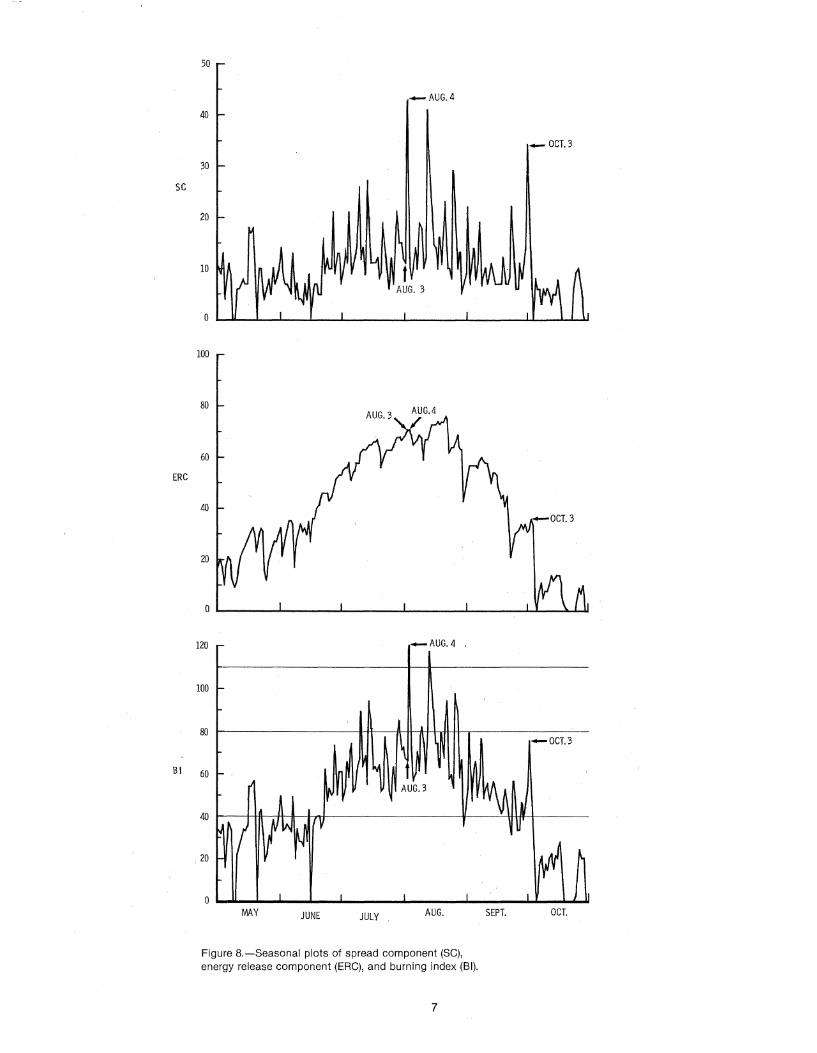
Because NFDRS components and indexes are relative indicators of fire danger, a value is meaningful only when it is compared with other values. Seasonal plots illustrated in figure 8 help one make such comparisons. An index value can be readily related to previous values in the season or, if plots are overlaid, to those from other seasons. As can be seen in figure 8, ERC had climbed to the highest point thus far that season by August 3, and did not change on August 4. How- ever, SC for August 4 was four times as high a s that on August 3, and BI nearly doubled from August 3 to August 4. Notice also that on October 3, BI was approximately the same as it had been on August 3, but SC was much higher and ERC much lower.
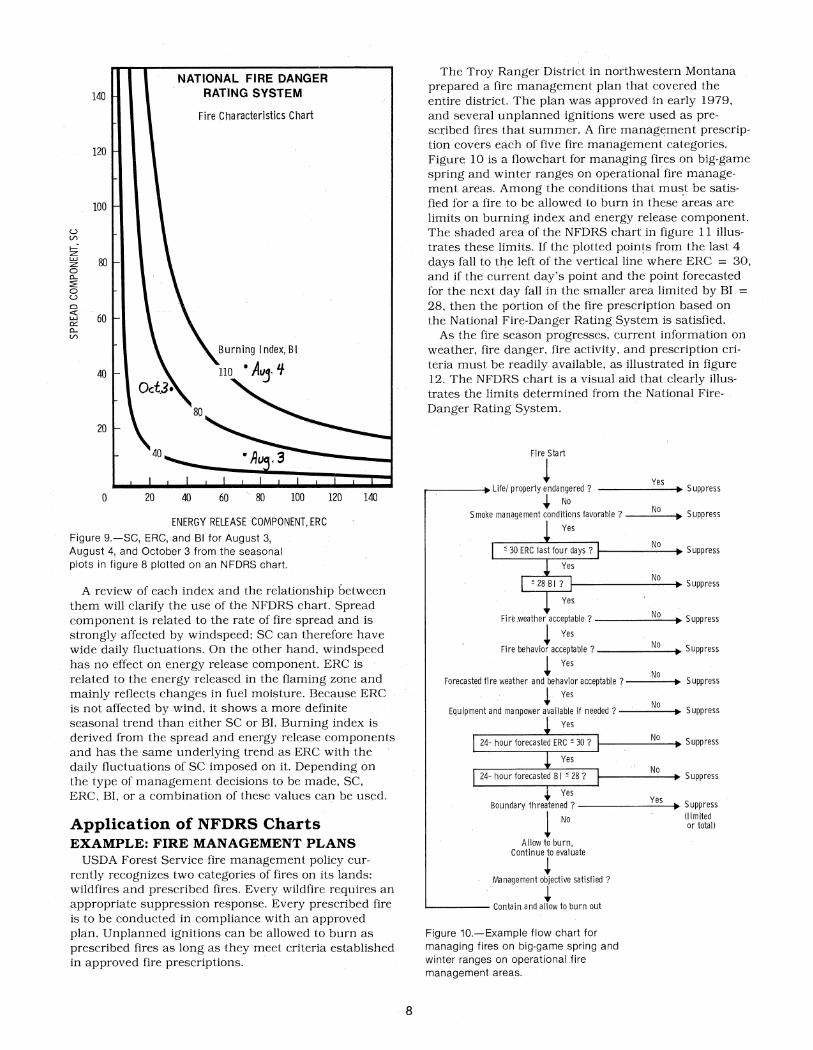
The fire characteristics chart offers another means of interpreting SC, ERC, and BI in terms of potential fire behavior. The values for August 3, August 4, and October 3 are plotted on the NFDRS chart in figure 9. The curved lines on the fire characteristics chart cor- respond to the horizonal lines on the seasonal plot of burning index. Notice how the character of fire danger on all 3 days is readily apparent.
The seasonal plots and the fire characteristics chart illustrate different aspects of SC, ERC, and BI. A seasonal plot reflects the change of conditions in a component or index over time, whereas the NFDRS chart is best suited for illustrating the relationship among all three values a t a particular time.
NFDRS calculations are normally done on a day-to- day basis using standard weather observations as input. The TI-59 calculator with a fire dangerlfire b;havior CROM allows another option: fuel moisture can be entered directly in lieu of weather input. This allows the user to look at situations that are not based on the seasonal trend. For example, "under the same conditions, how does the fire danger change with a change of fuel models?" or "what would the fire danger be if the moisture content of the large fuels were 3 percent less?" The NFDRS chart is a n ideal way of illustrating the change in fire danger due to a specific change in conditions.
ERC
MAY J U N E JULY AUG. SEPT. OCT.
Figure 8.-Seasonal plots of spread component (SC), energy release component (ERC), and burnrng index (BI).
NATIONAL FIRE DANGER RATING SYSTEM
Fire Characteristics Chart
E N E R G Y RELEASE COMPONENT, E R C F~gure 9 -SC, ERC, and BI for August 3, August 4, and October 3 from the seasonal plots In f~gure 8 plotted on an NFDRS chart.
A review of each index and the relationship between them will clarify the use of the NFDRS chart. Spread component is related to the rate of fire spread and is strongly affected by windspeed; SC can therefore have wide daily fluctuations. On the other hand. windspeed has no effect on energy release component. ERC is related to the energy released in the flaming zone and mainly reflects changes in fuel moisture. Because ERC is not affected by wind, it shows a more definite seasonal trend than either SC or BI. Burning index is derived from the spread and energy release components and has the same underlying trend as ERC with the daily fluctuations of SC imposed on it. Depending on the type of management decisions to be made, SC, ERC, BI, or a combination of these values can be used.
Application of NFDRS Charts EXAMPLE: FIRE MANAGEMENT PLANS
USDA Forest Service fire management policy cur- rently recognizes two categories of fires on its lands: wildfires and prescribed fires. Every wildfire requires an appropriate suppression response. Every prescribed fire is to be conducted in compliance with an approved plan. Unplanned ignitions can be allowed to burn a s prescribed fires as long a s they meet criteria established in approved fire prescriptions.
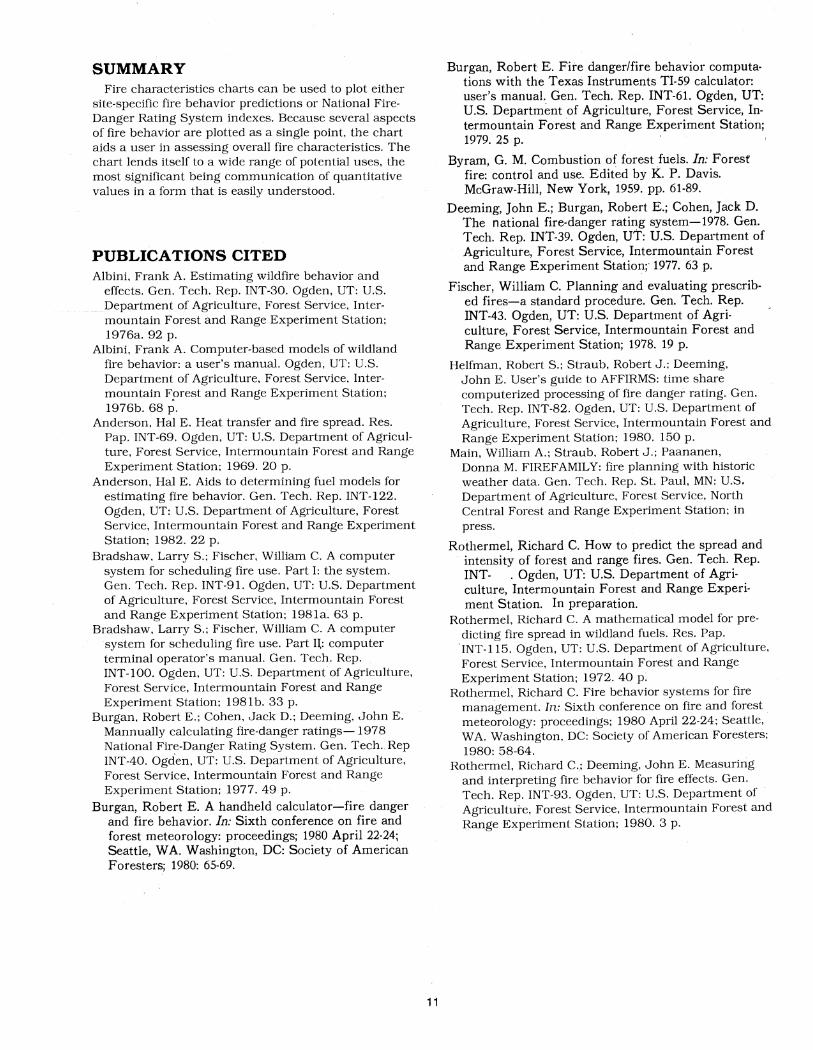
The Troy Ranger District in northwestern Montana prepared a fire management plan that covered the entire district. The plan was approved in early 1979, and several unplanned ignitions were used a s pre- scribed fires that summer. A fire management prescrip- tion covers each of five fire management categories. Figure 10 is a flowchart for managing fires on big-game spring and winter ranges on operational fire manage- ment areas. Among the conditions that must be satis- fied for a fire to be allowed to burn in these areas are limits on burning index and energy release component. The shaded area of the NFDRS chart: in figure 11 illus- trates these limits. If the plotted points from the last 4 days fall to the left of the vertical line where ERC = 30, and if the current day's point and the point forecasted for the next day fall in the smaller area limited by BI = 28. then the portion of the fire prescription based on the National Fire-Danger Rating System is satisfied.
As the fire season progresses, current information on weather, fire danger, fire activity, and prescription cri- teria must be readily available, as illustrated in figure 12. The NFDRS chart is a visual aid that clearly illus- trates the limits determined from the National Fire- Danger Rating System.
F i re S ta r t
I + Yes -, Lifei property endangered ? - Suppress
4 Smoke management condi t ions favorable ? Suppress
I Yes
Suppress
Yes
I + Fi re weather,acceptable ? Nob Suppress 1 Yes
F i re behavior acceptable ? Nob Suppress
I Yes + NO Forecasted f i r e weather and behavior acceptable ? .-p Suppress
I Yes + NO 1 Equipment and manpower a,vailabe i f needed ? -p Suppress
No , Suppress
No , Suppress
/ Yes Boundary threatened ? Yes+ Suppress
1 Al low t o b u r n ,
Con t inue t o evaluate I +
Management objective satisfied ? I
Conta in and a$\hl to b u r n ou t
Figure 10.-Example flow chart for managing fires on big-game spring and winter ranges on operational fire management areas.
( l im i ted o r total)

0 20 40 60 80 100 120 140
E N E R G Y RELEASE COMPONENT, ERC
F~gure 11 -NFDRS chart used to illustrate the llm~ts on BI and ERC glven In the flow chart In flgure 10 For the port~on of thls flre prescr~pt~on that IS based on NFDRS Indexes to be satsfled, plotted polnts from the last 4 days must fall to the left of the vertlcal llne where ERC = 30 and the current day's polnt and the polnt forecasted for the next day must fall In the smaller area llmlted by the BI = 28 Ilne.
Figure 12.-The fire characteristics chart can be part of a display that includes current information on weather, fire danger, fire activity, and prescription criteria that a fire manager uses to make decisions.
EXAMPLE: BRIEFINGS During the fire season, briefings are often held to
describe the general fire situation. The audience can include members of the news media, staff personnel, or others who are not familiar with the National Fire- Danger Rating System. Statements such as "the fire danger is high" or "the burning index is 85" can be misinterpreted. The NFDRS chart can serve as a yisual aid and focal point for discussion. The chart can be explained easily: a s a point falls farther to the right on the chart, there is an indication that fires will be hotter. A point falling farther up on the chart indicates the potential for faster spreading fires. Overall severity increases as a point falls farther from the origin in either direction.
Consider the following briefing of fire danger of a USDA Forest Service region, represented by the fire characteristics chart in figure 13.
The fire danger of most of the west side of the region is low a s indicated by point A, although there are a couple of districts that may cause prob- lems [point B). Point C refers to the fire danger on the east side of the region. If we have another week of dry weather, the situation on the east side could become critical (point D).
RATING SYSTEM
Fire Characteristics C h a r t
E N E R G Y RELEASE COMPONENT, E R C
Figure 13.-NFDRS chart used in a briefing of current and potential fire danger.

FORMS OF THE CHART The fire behavior chart and the NFDRS chart illus-
trated in figures 1 and 2 have scales that do not cover the entire range of possible values. The scales were chosen to give resolution to the lower values and allow the majority of values to be plotted on the chart. Never- theless, some points will fall beyond the limits of the graph. A form of the fire behavior chart that overcomes this limitation uses logarithmic scales on the axes. In this way the entire range of values can be covered. The curved flame length lines become straight lines on the log scale version of the chart.
Figure 14 shows six points plotted on both linear and logarithmic scale fire behavior charts. This illustrates that a relatively small change in the behavior of a low- intensity fire is amplified, and a large change in the behavior of a high-intensity fire is compressed on the logarithmic chart. Because a primary purpose of the fire characteristics chart is to visually illustrate changes in fire behavior, care should be taken in interpretation of relative location or points plotted on the logarithmic chart.
11 may be necessary to change the scales of a chart primarily used for a specific fuel type. For example, a chart primarily used to display fire behavior predictions in logging slasli should have a n expanded heat-per-unit- area axis and a truncated rate-of-spread axis. Such a chart is shown in appendix B, along with other full-size charts suitable for reproduction. Appendix A offers the equations used in creating the fire characteristics charts.
An NFDRS chart can illustrate NFDR manning classes for a specific area. USDA Forest Service fire specialists generally determine manning classes from the 90th and 97th percentile burning index values for a specific station and fuel model. The percentile values are determined from historical fire weather obser- vations and provide criteria for ranking the relative severity of the burning conditions on a given day. Appendix A includes an example showing how to design a n NFDRS chart where BI lines designate manning class levels.
FIRE BEHAVIOR F i re C t ia rac te r i s t i cs C h a r t
(Lcqar i thm ic Scale)
HEAT PER UNIT AREA, BTUl FTZ 148
Figure 14.-The same six points (A, B, C. X, Y. Z) plotted for comparison on both a linear scale (A) and a logarithmic scale (B) fire behavior chart.
SUMMARY Fire characteristics charts can be used to plot either
site-specific fire behavior predictions or National Fire- Danger Rating System indexes. Because several aspects of fire behavior are plotted as a single point, the chart aids a user in assessing overall fire cliaracteristics. The chart lends itself to a wide range of potential uses, the most significant being communication of quantitative values in a form that is easily understood.
PUBLICATIONS CITED Albini, Frank A. Estimating wildfire behavior and
effects. Gen. Tech. Rep. INT-30. Ogden, UT: U.S. Department of Agriculture, Forest Service, Inter- mountain Forest and Range Experiment Station; 1976a. 92 p.
Albini, Frank A. Computer-based models of wildland fire behavior: a user's manual. Ogden, UT: U.S. Department of Agriculture, Forest Service, Inter- mountain Fprest and Range Experiment Station; 1976b. 68 p.
Anderson, Hal E. Heat transfer and fire spread. Res. Pap. INT-69. Ogden, UT: U.S. Department of Agricul- ture, Forest Service, Intermountain Forest and Range Experiment Station; 1969. 20 p.
Anderson, Hal E. Aids to determining fuel models for estimating fire behavior. Gen. Tech. Rep. INT-122. Ogden, UT: U.S. Department of Agriculture, Forest Service, Intermountain Forest and Range Experiment Station; 1982. 22 p.
Bradshaw, Larry S.; Fischer, William C. A computer system for scheduling fire use. Part I: the system. Gen. Tech. Rep. INT-9 1. Ogden, UT: U.S. Department of Agriculture, Forest Service, Intermountain Forest and Range Experiment Station; 1981a. 63 p.
Bradshaw, Larry S.; Fischer, William C. A computer system for scheduling fire use. Part II,: computer terminal operator's manual. Gen. Tech. Rep. INT-100. Ogden, UT: U.S. Department of Agriculture, Forest Service, Intermountain Forest and Range Experiment Station; 1981b. 33 p.
Burgan, Robert E.; Cohen, Jack D.; Deeming, John E. Mannually calculating fire-danger ratings- 1978 National Fire-Danger Rating System. Gen. Tech. Rep INT-40. Ogden, UT: U.S. Department of Agriculture, Forest Service, Intermountain Forest and Range Experiment Station; 1977. 49 p.
Burgan, Robert E. A handheld calculator-fire danger and fire behavior. In: Sixth conference on fire and forest meteorology: proceedings; 1980 April 22-24; Seattle, WA. Washington, DC: Society of American Foresters; 1980: 65-69.
Burgan, Robert E. Fire dangerlfire behavior computa- tions with the Texas Instruments TI-59 calculator: user's manual. Gen. Tech. Rep. INT-61. Ogden, UT: U.S. Department of Agriculture, Forest Service, In- termountain Forest and Range Experiment Station; 1979. 25 p.
Byram, G. M. Combustion of forest fuels. In: Forest' fire: control and use. Edited by K. P. Davis. McGraw-Hill, New York, 1959. pp. 61-89.
Deeming, John E.; Burgan, Robert E.; Cohen, Jack D. The national fire-danger rating system-1978. Gen. Tech. Rep. INT-39. Ogden, UT: U.S. Department of Agriculture, Forest Service, Intermountain Forest and Range Experiment Station; 1977. 63 p.
Fischer, William C. Planning and evaluating prescrib- ed fires-a standard procedure. Gen. Tech. Rep. INT-43. Ogden, UT: U.S. Department of Agri- culture, Forest Service, Intermountain Forest and Range Experiment Station; 1978. 19 p.
Helfman, Robert S.; Straub, Robert J.: Deeming, John E. User's guide to AFFIRMS: time share computerized processing of fire danger rating. Gen. Tech. Rep. INT-82. Ogden, UT: U.S. Department of Agriculture, Forest Service, Intermountain Forest and Range Experiment Station; 1980. 150 p.
Main, William A.; Straub, Robert J.; Paananen, Donna M. FIREFAMILY: fire planning with historic weather data. Gen. Tech. Rep. St. Paul, MN: U.S. Department of Agriculture, Forest Service, North Central Forest and Range Experiment Station; in press.
Rothermel, Richard C. How to predict the spread and intensity of forest and range fires. Gen. Tech. Rep. INT- . Ogden, UT: U.S. Department of Agri- culture, Intermountain Forest and Range Experi- ment Station. In preparation.
Rothermel, Richard C. A mathematical model for pre- dicting fire spread in wildland fuels. Res. Pap. INT-115, Ogden, UT: U.S. Department of Agriculture, Forest Service, Intermountain Forest and Range Experiment Station; 1972. 40 p.
Rothermel, Richard C. Fire behavior systems for fire management. In: Sixth conference on fire and forest meteorology: proceedings; 1980 April 22-24; Seattle, WA. Washington, DC: Society of American Foresters; 1980: 58-64.
Rothermel, Richard C.; Deeming, John E. Measuring and interpreting fire behavior for fire effects. Gen. Tech. Rep. INT-93. Ogden, UT: U.S. Department of Agriculture, Forest Service, Intermountain Forest and Range Experiment Station; 1980. 3 p.

APPENDIX A Equations for Compiling the Fire Characteristics Charts
The equation used to plot the curves on the NFDRS chart is
0.091 x B I ~ . " SC =
ERC
where SC = spread component ERC = energy release component BI = burning index.
The equation used to plot the curves on the fire behavior chart
where R = rate of spread, chainslh IB = fireline intensity, Btulftls
HA = heat pkr unit area, ~ t u l f t ~ .
The relationship between fireline intensity and flame length is given by the following equation:
F, = 0.45 1~0.4" (3)
where FL = flame length, ft IB = fireline intensity, Btulftls.
Determination of Heat Per Unit Area Heat per unit area is a direct output of the TI-59 fire
behavior program. However, it cannot be read directly from the nomograms, nor is it an output value from most available computer programs. Although a point can be plotted on the fire behavior chart given rate of spread and fireline intensity or flame length, it is easier if a heat per unit area value is available.
To modify an existing computer program, use a reformulation of equation (2)
where
HA = heat per unit area, ~ t u l f t ~ IB = fireline intensity, Btu/ft/s R = rate of spread, chainslh.
The X axis of the upper right-hand graph of the nomograms as originally published by Albini (1976a) is reaction intensity (Btulft21min). The label was eliminated on subsequent revisions for fire behavior officer (FBO) training. The nomograms to be published by Rothermel (in preparation) will have heat per unit area on that axis,
The relationship between reaction intensity and heat per unit area is
where
HA = heat per unit area, Btulft2 IR = reaction intensity, Btu/ft2/min
= characteristic surface-area-to-volume ratio of the fuel array, ft2/ft3
384 = residence time, min (Anderson 1969). m 0
The labels for heat per unit area can be added to the horizontal axis on the upper right-hand quadrant of the nomograms, using the scales given in figure 15. The scale is the same for both the low and high windspeed options on all versions of the nomograms. Use of the nomograms does not change, as illustrated in the example in figure 16. Heat per unit area is read where the first constructed vertical line intersects the newly labeled axis.

FUEL MODEL
1 HEAT PER UNIT AREA, BTU IFT2
r I 1 1 I 1 I
FUEL MODEL HEAT PER UNIT AREA, BTU I F T ~
8 1 I I 1 I I 0 50 150 250
Frgure 15.-Heat-per-unrt-area scales can be transferred to the high or low w~ndspeed optrons of the frre behav~or nomograms (FBO or Albrnr 1976a). The scale for the approprrate fuel model IS transferred to the horrzontal axis of the upper r~ght-hand graph
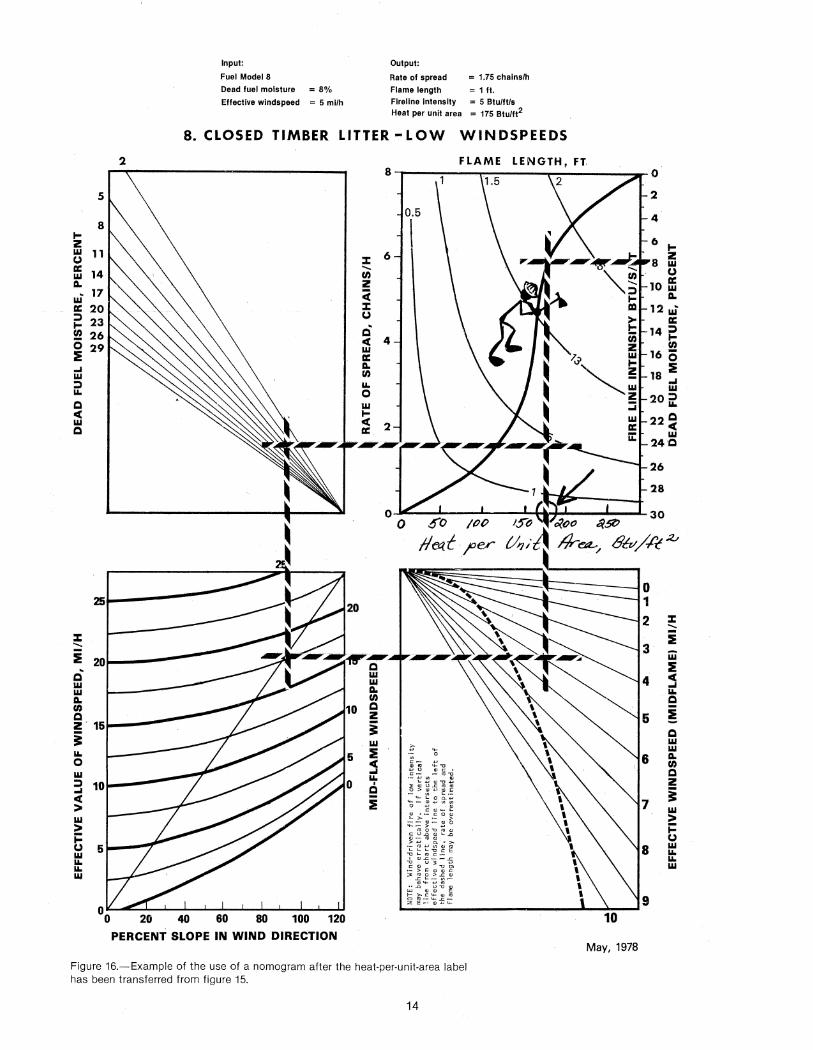
Input: Output:
Fuel Model 8 Rate of spread = 1.75 chainslh Dead fuel moisture = 8% Flame length = I ft. Effective windspeed = 5 milh Fireline intensity = 5 Btulltls
Heat per unit area = 175 ~ f u l f t ~
8. C L O S E D T I M B E R L I T T E R - L O W W I N D S P E E D S
2 FLAME LENGTH. FT
Figure 16.-Example of the use of a nomogram after the heat-per-unit-area label has been transferred from figure 15.
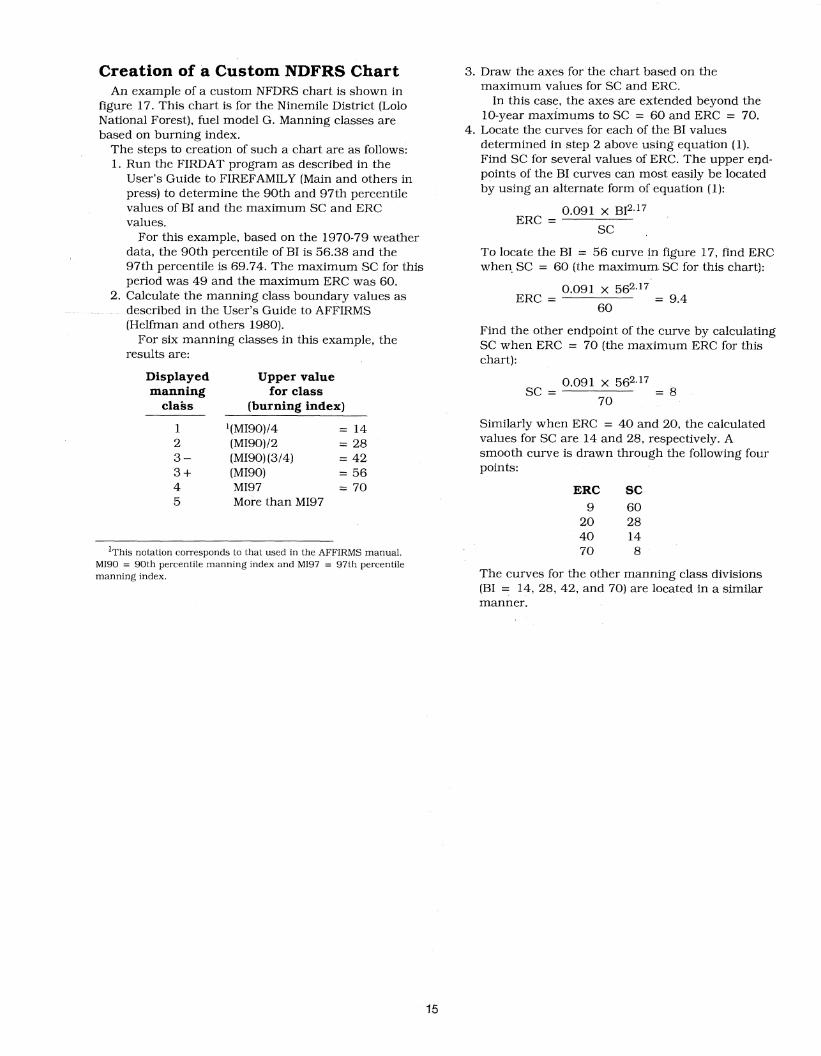
Creation of a Custom NDFRS Chart An example of a custom NFDRS chart is shown in
figure 17. This chart is for the Ninemile District (Lolo National Forest), fuel model G. Manning classes are based on burning index.
The steps to creation of such a chart are as follows: 1. Run the FIRDAT program as described in the
User's Guide to FIREFAMILY (Main and others in press) lo determine the 90th and 97th percentile values of BI and the maximum SC and ERC values.
For this example, based on the 1970-79 weather data, the 90th percentile of BI is 56.38 and the 97th percentile is 69.74. The maximum SC for this period was 49 and the maximum ERC was 60.
2. Calculate the manning class boundary values as described in the User's Guide to AFFIRMS (Helfman and others 1980).
For six manning classes in this example, the results are:
Displayed Upper value manning for class
class (burning index)
1 l(M190)/4 = 14 2 (MI90)12 = 28 3 - (MI90) (3/4) = 42 3 + (MI90) = 56 4 MI97 = 70 5 More than MI97
ni his notation corresponds to that used in the AFFIRMS manual MI90 = 90th percentile m a n n ~ n g index and MI97 = 97th percentile manning index.
3. Draw the axes for the chart based on the maximum values for SC and ERC.
In this case, the axes are extended beyond the 10-year maximums to SC = 60 and ERC = 70.
4. Locate the curves for each of the BI values determined in step 2 above using equation (1). Find SC for several values of ERC. The upper e ~ d - points of the BI curves can most easily be located by using an alternate farm of equation (1):
0.091 x ~ 1 2 . l ~ ERC =
SC
To locate the BI = 56 curve in figure 17, find ERC when SC = 60 (the maximum SC for this chart):
0.091 x 562.17 ERC = = 9.4
60
Find the other endpoint of the curve by calculating SC when ERC = 70 (the maximum ERC for this chart):
Sirnilarly when ERC = 40 and 20, the calculated values for SC are 14 and 28, respectively. A smooth curve is drawn through the following four points:
ERC SC 9 60
20 28 40 14 70 8
The curves for the other manning class divisions (BI = 14, 28, 42, and 70) are located in a similar manner.

I \ \ NATIONAL FIRE DANGER RATING SYSTEM
L F i r e Charac te r i s t i cs C h a r t
NINEMILE DISTRICT
FUEL MODEL G
\ M a n n i n g Class 5
\ 4 \ Burnina
ENERGY RELEASE COMPONENT, ERC F~gure 17 -Example of a custom NFDRS chart, where the BI l~nes correspond to manning class cutoff values. Mann~ng classes are based on 1970-79 weather for Ninem~le Ranger Statlon (241507)

APPENDIX B Fire Characteristics Charts Suitable for Copying

0 500 1000 1500 2000
HEAT PER UNIT AREA, BTUl FT*
GTR.INT-131 Charts for Interpreting Wildland Fire Behavior Characteristics
18

0 50
0 10
00
1500
20
00
2500
30
00
3500
40
00
HEAT
PER
UN
IT A
REA,
BTU
l FT
~

FIRE BEHAVIOR F i re Charac te r i s t i cs C h a r t
(Loqar i thmic Scale)
HEAT PER UNIT AREA, BTUI FT2
GTR-INT-131 Charts for Interpreting Wildland Fire Behavior Characteristics
20
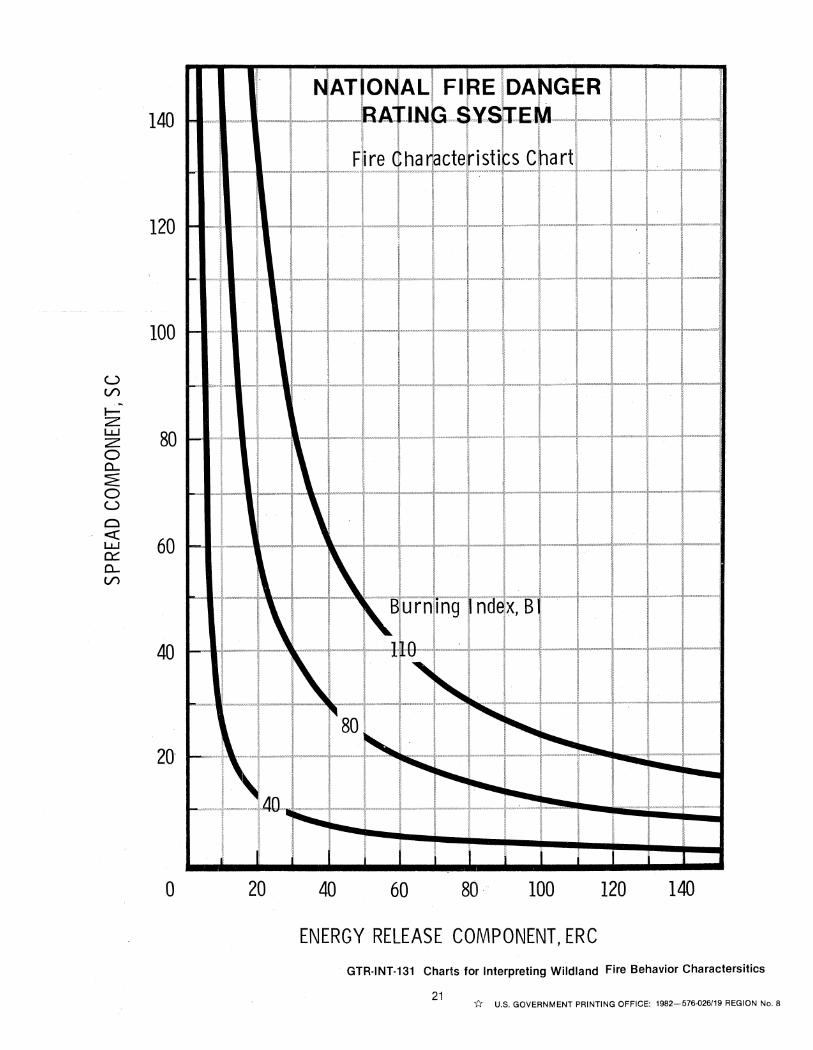
ENERGY RELEASE COMPONENT, ERC
GTR-INT-131 Charts for Interpreting Wildland Fire Behavior Charactersitics
21 %' US. GOVERNMENT PRINTING OFFICE: 1982-576.026119 REGION No. 8

Andrews, Patricia L.; Rothermel, Richard C. Charts for interpreting w~ldland fire behavior characteristics. Gen. Tech. Rep. INT-131. Ogden, UT: U.S. Department of Agriculture, Forest Service, Intermountain Forest and Range Experiment Station; 1981. 21 p.
The fire characteristics chart is proposed a s a graphical method of presenting two primary characteristics of fire behavior-spread rate and intensity. Its primary use is communica t~ng and interpreting either site-specific predictions of fire behavior or National Fire-Danger Rating System (NFDRS) indexes and components. Rate of spread, heat per unit area, flame length, and fireline intensity, are plotted on a fire behavior chart. Spread component , energy release component, and burning index are plotted on a n NFDRS chart. Specific examples illustrate potential application.
1 KEYWORDS: fire behavior, fire spread, fire intensity, fire-danger rating, National Fire-Danger Rating System !
The Intermountain Station, headquarted in Ogden, Utah, is one of eight regional experiment stations charged with prov'i,ding scientific knowledge to help resource managers meet human needs and protect forest and range ecosystems.
The Intermountain Station includes the States of Montana, Idaho, Utah, Nevada, and western Wyoming. About 231 million acres, or 85 percent, of the land area in the Station territory are classified as forest and rangeland. These lands include grasslands, deserts, shrublands, alpine areas, and well-stocked forests. They supply fiber for forest industries; minerals for energy and industrial development; and water for domestic and industrial con- sumption. They also provide recreation opportunities for millions of visitors each year.
Fi$lcj,programs and research work units o f the Station are maintained-in
Boise, Idaho
Bbzeman, Montana (in cooperation with Montana State University)
Logan, Utah (in cooperation with Utah State University)
Missoula, Montana (in cooperation with the University of Montana)
Moscow, Idaho (in cooperation with the University of Idaho)
Provo, Utah (in cooperation with Brigham Young University)
Reno, Nevada (in cooperation with the Univer- sity of Nevada)