charting the projections: 2010–20 · charting the projections: 2010–20 (a special issue) 43...
TRANSCRIPT

U.S. Department of LaborU.S. Bureau of Labor StatisticsWinter 2011–12
Occupational Outlook QuarterlyOccupational Outlook QuarterlyOccupational Outlook Quarterly
Charting the projections: 2010–20
A special issue
Occupational employment
Economic growth
Inside, projections of:
Labor force
Industry employment

U.S. Department of LaborHilda L. Solis, Secretary
U.S. Bureau of Labor StatisticsJohn M. Galvin, Acting Commissioner
Read the OOQ online at www.bls.gov/ooq
New subscriptions2 years $34 ($47.60 foreign)1 year $17 ($24.80 foreign)Single copy $7 ($9.80 foreign)
Be certain to receive our next biennial projections issue by ordering a 2-year subscription!
To subscribe to the Occupational Outlook Quarterly,
Order online: http://bookstore.gpo.gov
Telephone: 1 (866) 512–1800 (toll-free) (202) 512–1706 (D.C. area) (202) 512–2250 (fax)
Write: Superintendent of Documents U.S. Government Printing Office P.O. Box 979050 St. Louis, MO 63197–9000 When writing or faxing, cite Occupational Outlook Quarterly (OOQ). Include your address, phone number, and check or VISA, MasterCard, Discover/NOVUS, or American Express number and expiration date.
NoteThe Occupational Outlook Quarterly (USPS 492–690) (ISSN 0199–4786) is published four times a year by the Office of Occupational Statistics and Employment Projections, U.S. Bureau of Labor Statistics, U.S. Department of Labor. The Secretary of Labor has determined that the publication of this periodical is necessary in the transaction of the public business required by law of this Department. Government agencies, industrial organizations, professional societies, trade associations, and unions often provide career information that is valuable to counselors and jobseekers. Many Quarterly articles provide, as a convenience to readers, organizations’ mailing addresses, telephone numbers, and, in some cases, Internet addresses. Although these references were carefully selected, the U.S. Bureau of Labor Statistics has neither the authority nor the facilities to investigate the organizations or the information that they may send in response to a request, including the accuracy of such information. Therefore, a reference to an organization in no way constitutes an endorsement or recommendation by the Bureau either of the organization and its activities or of the information it may provide.
Postmaster: Send address changes to the Occupational Outlook Quarterly, Superintendent of Documents, Attn: Chief, Mail List Branch, Mail Stop: SSOM, Washington, DC 20402–0001. Second-class postage paid at Washington, D.C., and at additional mailing offices.
Index of OOQ articles Each year’s winter issue includes a 5-year index.
Questions about current subscriptions and address changes Telephone: 1 (866) 512–1800 (toll-free) (202) 512–1706 (D.C. area)
Write or fax your mailing label and new address to: Superintendent of Documents Attn: Chief, Mail List Branch Mail Stop: SSOM Washington, DC 20402-0001 (202) 512–2168 (fax)
Editorial mattersAll text, charts, and tables are in the public domain and, with appropriate credit, may be reproduced without permission. Most photographs and illustrations are protected by copyright. To discuss editorial matters (not subscriptions) or request permission to reprint articles (although permission is not required), contact the editor. E-mail: [email protected]: (202) 691–5717Write: Occupational Outlook Quarterly U.S. Department of Labor U.S. Bureau of Labor Statistics Room 2135 2 Massachusetts Ave., NE Washington, DC 20212–0001
For the sensory impaired Upon request, people with sensory impairments may obtain information in this publication by telephone at (202) 691–5200 or by Federal Relay Service at 1 (800) 877–8339 (toll-free).

Occupational Outlook QuarterlyWinter 2011–12 • Volume 55, Number 4
Editorial staff
Kathleen Green, EditorJohn Mullins, Managing editorDrew Liming, Contributing editorElka Maria Torpey, Contributing editorDennis Vilorio, Contributing editorMaureen Soyars, Associate editorBruce Boyd, Design consultantKeith Tapscott, Design consultant
Occupational Outlook Quarterly
Charting the projections: 2010–20(A special issue)
Index to the OOQ, 2007–1143
Overall economyProjected output of the economy, including gross domestic product (GDP).
40
Industry employmentProjected employment change by industry and industry sector.
33
How BLS develops and charts the projections.
2by Dixie Sommers
Projected employment change by occupation and occupational group, including:
6
Labor force
Occupational employment
Getting started
26Projected changes in the labor force by age, sex, race, and ethnic origin.
11 Fastest growing occupations12 Occupations adding the most jobs13 Occupations with the most job openings14 Job growth and openings by education assignment

2 Occupational Outlook Quarterly • Winter 2011–12
I n an uncertain economy, reliable information about tomorrow’s labor market can be a valuable tool in career planning. Understanding the future workforce
helps you prepare for your place in it.When choosing among careers—or assisting others
who are making such choices—it helps to know a few basics: the types and number of jobs likely to be available, the wages of workers in those occupations, and the typical ways of preparing for them. And that’s just to get started.
The U.S. Bureau of Labor Statistics (BLS) provides this information and more. The 2012–13 Occupational Outlook Handbook describes hundreds of occupations in detail, cataloging data on employment, wages, projections, education, and job duties. And the January 2012 issue of the Monthly Labor Review includes comprehensive descriptions of the data, analysis, and methods BLS uses in the projections.
This special issue of the Occupational Outlook Quarterly offers a graphic summary of the latest projec-tions, those covering the decade from 2010 to 2020.
How the recent recession affects the projections
Our usual practice is to prepare new projections every other year, with the base year of the projections decade being an even-numbered year. For this set of projections, the base year, 2010, follows a severe downturn in the U.S. economy. Total employment of wage and salary workers fell by nearly 7.8 million between 2007 and 2010. The
construction and manufacturing industry sectors, along with occupations that are concentrated in these industries, were hit particularly hard.
When developing long-term projections, our focus is on long-term trends in population, labor force, productiv-ity, and output growth. The population and the labor force have been aging and their growth rates slowing. These long-term trends are expected to continue, regardless of the fluctuations in the economy.
Readers should keep in mind, however, that the projected changes in employment between 2010 and 2020 include regaining jobs that were lost during the downturn. Total employment is projected to reach nearly 164 million by 2020, reflecting the addition of about 20 million new jobs between 2010 and 2020. About 7.8 million of these jobs are needed just to return total employment to its level before the recession.
The recession had a particularly severe impact on jobs in construction. Although employment in construction is projected to grow rapidly, it is not expected to return to its pre-recession employment level by 2020. Similarly, employment in the transportation and material moving and production occupations groups is also expected to grow, but not enough to return to 2006 levels.
Individual industry and occupation groups were affected in different ways by the recession. Some were severely affected, some mildly so, and others seem not to have been affected at all. Some industries and occupa-tions are not expected to recover completely; others are expected to recover and have continued growth, and still others are projected to keep on growing.
Dixie Sommers is the Assistant Commissioner of the Office of Occupational Statistics and Employment Projections, BLS. She is available at (202) 691-5701 or at [email protected].
by Dixie SommersGetting started

Winter 2011–12 • Occupational Outlook Quarterly 3
Getting started
The charts for occupations, the labor force, industries, and the overall economy depict the major findings beyond the trends in total employment.
Occupations• The office and administrative support
occupations group is expected to add the most new jobs and produce the largest num-ber of job openings. (See pages 9–10.)
• Among all occupations, personal care aides and home health aides are expected to have the fastest employment growth. (See page 11.)
• Registered nurses, retail salespersons, and home health aides are expected to gain the most new jobs. Each of these occupa-tions will add more than 700,000 jobs. (See page 12.)
• Most job openings for workers enter-ing an occupation come from the need to replace workers who have left the occupa-tion, rather than from the need to fill newly created jobs. The 20 occupations that are expected to have the most openings from growth and replacement needs are diverse. The list includes occupations from nine different groups, with the largest number from the office and administrative support occupations group and the sales and related occupations group. (See page 13.)
• The 20 occupations expected to have the most openings also range widely in 2010 median annual wages, from nearly $65,000 for registered nurses to about $18,000 for combined food preparation and serving workers, including fast food. (See page 13.)
• With these projections, BLS intro-duces a new way of depicting the education needed for entry into an occupation. The charts group occupations by typical entry-level education, from graduate degree to less than a high school diploma, and they also indicate whether workers typically need experience in a related occupation and whether they need training on the job after employment. In general, workers in
occupations that typically need more educa-tion, experience, and training earn higher wages. (See pages 14–23.)
• Wage and salary employment of farm-ers, ranchers, and other agricultural manag-ers is projected to decline. However, this occupation also had the most self-employed workers in 2020. (See pages 24–25.)
The labor force• By 2020, the number of people in the
labor force—those working or looking for work—is expected to increase by more than 10 million. This is a smaller gain than the more than 11 million people added to the labor force during the previous decade. (See page 27.)
• As the baby-boom generation ages, the number of people in the labor force ages 65 and older is projected to grow very rapidly, about 11 times faster than for the total labor force. The number in the 55- to 64-year-olds group is expected to grow nearly four times as fast as the total labor force. At the same time, younger age groups in the labor force are expected to either decline or increase at much slower rates. (See page 28.)
• Labor force participation rates are pro-jected to decline slightly for both men and women by 2020, when about 68 percent of men and 57 percent of women are expected to be in the labor force. The annual growth of the labor force participation rate for women (0.7 percent) is expected to be slightly higher than that for men (0.6 percent). (See page 29.)
• The labor force will continue to become more diverse. The share of the labor force that is Asian, black, or in other non-white race groups is expected to increase to 21 percent, up from 19 percent a decade earlier. And Hispanics are expected to constitute nearly 19 percent of the labor force in 2020, up from 15 percent in 2010. (See pages 30 and 32.)
The charts project 2010–20 changes in occupational employment, the labor force, industry employment, and the overall economy. You will get the most out of the charts if you understand how BLS publishes data in these areas.
“Occupation” classifies jobs according to the type of work performed. People who provide routine health care to individuals in their homes are in the occupation of home health aides, for example.
“Industry,” on the other hand, classifies jobs in businesses according to the type of good produced or service provided. For example, any job in hospice care services—from home health aide to secretary—is classified as part of the home health care services industry.
“Labor force” is a measure of the number of people available for work. It includes both individu-als who are employed and those who are unemployed (those not working but actively looking for a job).
“Overall economy” includes several concepts. The most important is the value of final goods pro-duced and services pro-vided, which is known as the gross domestic product, or GDP.
About the sections
(Continued on page 5)

4 Occupational Outlook Quarterly • Winter 2011–12
Getting started
The charts in this issue provide graphic answers to some basic questions about employment: How many new jobs will there be? How fast is the number of jobs changing? How many job openings will be available for new entrants to the labor force?
How many new jobs will there be? Charts that show numeric change illustrate how many new jobs there will be (the actual number of jobs gained or lost over the projections decade). In general, the occupations and industries with the greatest numeric increases are those that already have large numbers of workers.
How fast is the number of jobs changing? Charts showing percent change illustrate how fast the number of jobs is changing (the rate of job growth or decline during the decade). The fastest rates of growth are usu-ally found in occupations and industries that have fewer workers.
Fast growth does not always mean many new jobs. See, for example, the charts below. They show the projected increase in employment for cashiers compared with that for biomedical engineers. In numeric terms, as
shown in the chart at upper left, more than 25 times as many new jobs are projected for cashiers as for biomed-ical engineers between 2010 and 2020.
Percent change tells a different story. As the chart at lower left shows, employment of biomedical engineers is expected to grow more than 8 times faster than that of cashiers—even though biomedical engineers are projected to gain fewer jobs.
How many job openings will there be? Some charts go beyond showing the expected change in the total number of jobs and show how many job openings are expected for workers who are new to an occupation. Job openings for workers new to an occupation include not only openings from growth in the number of jobs but also openings from the need to replace workers who retire or leave an occupation for some other reason. The chart below at right shows how many job openings for cashiers are expected to result from job growth and how many are expected to result from the need to replace existing cashiers who leave the occupation.
Reading the charts
Numeric employment growth in two occupations, projected 2010–20, in thousands of jobs
Biomedical engineers
Cashiers 250
10
Job openings for cashiers, projected 2010–20, in thousands of openings
Cashiers 250 1,526 1,776
From growth From replacement needs
Percent employment growth in two occupations, projected 2010–20
Biomedical engineers
Cashiers
62%
7

Winter 2011–12 • Occupational Outlook Quarterly 5
Getting started
Industries• Job growth over the 2010–20 decade will be concen-
trated in service-providing industries. In 2020, service-providing industries are expected to account for 131 million out of 150 million wage and salary jobs overall. (See page 34.)
• The health care and social assistance sector is pro-jected to gain the most new jobs, more than 5.6 million, as well as to be the fastest growing, increasing by 34 percent over the decade. Employment is expected to grow slowly in mining but to decline in manufacturing and the federal government. (See page 36.)
• Among detailed industries, the home health care services industry is projected to be the fastest growing, with an increase of 81 percent. The next fastest growing detailed industry, individual and family care services, is projected to grow by 70 percent over the decade. (See page 37.)
• Among goods-producing industries, the construction sector is projected to gain the most new jobs, 1.8 million. All of this growth is to regain jobs lost during the 2007–09 recession, however, and the construction sector is not projected to regain enough jobs to return to its employ-ment level before the recession. (See page 38.)
Overall economy• The overall growth in the economy, as measured by
gross domestic product (GDP), is projected to increase by 3.0 percent per year, on average, between 2010 and 2020. This is much faster than the 1.6 percent annual growth for 2000–10, which was pulled down by two recessions dur-ing the decade, including the severe 2007–09 downturn. Slow growth rates for most components of GDP reflect that downturn and the fact that the economy had not fully recovered by 2010. (See page 42.)
How we develop the BLS projections
BLS economists in the Office of Occupational Statistics and Employment Projections develop the projections in a number of steps, first analyzing broad trends and then examining several hundred industries and occupations.
We begin with how much the U.S. population and labor force are expected to grow over the next 10 years.
We use population projections from the U.S. Census Bureau, which take into account trends in births, deaths, and immigration. We combine the population projections with our own estimates of what portion of the population will be in the labor force, based on historical trends for each age, gender, and race or ethnic group. The result is a projection of the labor force—an estimate of the total sup-ply of workers in the future economy.
We then create a model of an economy that is oper-ating at full potential, given the labor force and several other factors. Using this framework, we estimate the dollar value of each industry’s total output of goods or services. Some of these goods and services are sold to other industries; for example, steel is used in making cars. Other output—such as the cars themselves or the repair services for maintaining them—is sold directly to con-sumers.
We also study trends in productivity—the amount of output produced per hour of work—and use this infor-mation to translate projected output into the number of jobs needed in each industry to produce these goods and provide these services.
Next, we project how the jobs in each industry will be distributed by occupation. To do this, we make exten-sive use of the BLS Occupational Employment Statistics survey, as well as of information from other sources for sectors that are not covered by the survey, to depict how employment in each of nearly 300 industries is distrib-uted across more than 700 occupations. (For the 2010–20 projections, we used 2010 employment data.) We analyze how this distribution is likely to change over the decade by studying trends in technology, changing skill require-ments, and other factors. Using this analysis, along with the survey data and our industry employment projections, we project employment by occupation—in this set of projections, for 2020.
Our projection methods are based on the fact that employment trends in most occupations are closely tied to the trends in particular industries. For example, in 2010, about 59 percent of registered nurses worked in hospi-tals. So an increase in the demand for hospital services between 2010 and 2020 will increase the need for these workers. Based on changes in demand, we project that the real output of the hospital industry will increase over the decade, and about 389,200 more registered nurses will be needed in hospitals to provide this output. As a result, this industry is projected to account for about 55 percent of the roughly 711,900 new jobs for registered nurses.
(Continued from page 3)

6 Occupational Outlook Quarterly • Winter 2011–12
W hen choosing a career, jobseekers often want to know which occupations offer the best prospects. Generally, occupations that
have rapid job growth, many new jobs, or many job openings—and good wages—promise better opportuni-ties.
This section shows how employment in particular occupations is projected to change from 2010 to 2020. Many of the charts in this section show which occu-pations or occupational groups are expected to grow fastest (highest percent growth) or gain the most jobs (highest numeric growth).
Between 2010 and 2020, overall employment is pro-jected to grow by about 14 percent. This rate is shown as a dotted vertical line in the chart on page 11.
But when it comes to employment prospects, job growth tells only part of the story. Job openings for workers also come from the need to replace work-ers who retire or permanently leave an occupation for other reasons. Some charts show which occupations are expected to have the most openings for workers who are entering the occupation. These charts show projected openings both from job growth and from replacement needs (the need to replace workers who leave).
Growth by occupational groupMost charts in this section focus on detailed occupa-tions. To better illustrate general employment trends, however, charts at the beginning of the section show
employment growth in broad groups of similar occupa-tions.
The federal government classifies workers into cat-egories using the Standard Occupational Classification (SOC) system. All of the SOC occupations are included in these 12 broad groups:
Management, business, and financial occupa-tions. Examples include logisticians, construction man-agers, and personal financial advisors.
Computer, engineering, and science occupa-tions. Examples are computer programmers, nuclear engineers, landscape architects, chemists, and political scientists.
Education, legal, community service, arts, and media occupations. Examples include teachers, court reporters, social workers, graphic designers, and editors.
Healthcare practitioners and technical occupa-tions. Examples of these workers include dentists, physical therapists, and veterinarians.
Service occupations. This group includes work-ers who assist the public, including healthcare support occupations. Firefighters, dental assistants, bartenders, barbers, and pest control workers are examples.
Sales and related occupations. Examples include cashiers, insurance sales agents, and retail salespersons.
Office and administrative support occupations. Examples include order clerks, customer service repre-sentatives, tellers, and medical secretaries.
Occupational employment

Winter 2011–12 • Occupational Outlook Quarterly 7
Occupational employment
Farming, fishing, and forestry occupations. Examples include forest and conservation workers, animal breeders, and logging equipment operators. Workers who manage farms or ranches are counted in the management occupations group rather than in this group.
Construction and extraction occupations. This group includes workers in construction and building trades, such as boilermakers and roofers. It also includes occupations in oil and gas extraction and mining, such as roustabouts and mining machine operators.
Installation, maintenance, and repair occupa-tions. Examples include home appliance repairers, millwrights, and small engine mechanics.
Production occupations. Examples include machinists, power plant operators, welders, and tailors.
Transportation and material moving occupations. Examples include air traffic controllers, railroad con-ductors, taxi drivers, and dredge operators.
Growth by education assignmentTo help guide students and jobseekers, some charts show occupations by education assignment. These charts are grouped by the typical level of education most workers need to enter an occupation: graduate degree, bachelor’s degree, associate’s degree, post-secondary non-degree award, high school diploma or equivalent, and less than a high school diploma.
• Completion of a graduate degree typically requires a bachelor’s degree plus 1 or 2 years of full-time study for a master’s degree or at least 3 years of full-time study for a doctoral or professional degree.
• Completion of a bachelor’s degree typically requires at least 4 years of full-time study beyond high school.
• Completion of an associate’s degree typically requires 2 years of full-time study beyond high school. Postsecondary non-degree award programs typically last from several weeks to 1 year or more beyond high school.
Although the charts in this section are arranged by education assignment, columns within each chart also provide information about the experience and training assignments for the occupations. Assignments for work experience in a related occupation are indicated in the appropriate column as follows: more than 5 years (5+), 1 to 5 years (1–5), less than 1 year (<1), or none (N).
Assignments for on-the-job training typically needed to attain competency are indicated in the appro-priate column as follows: internship/residency (I/R), apprenticeship (A), long-term (L), moderate-term (M), short-term (S), or none (N).
• Internship and residency assignments include only those required for workers to be employed in an occupation. They may be paid or unpaid and vary from 1 to 8 years.
• Apprenticeships combine paid on-the-job train-ing with occupation-specific instruction. Most programs last between 3 and 5 years.
• Long-term on-the-job training lasts more than 12 months and includes either on-the-job train-ing or combines work experience with formal instruction.
• Moderate-term on-the-job training includes informal instruction and on-the-job training that lasts between 1 and 12 months.
• Short-term on-the-job training includes infor-mal, on-the-job training or experience of 1 month or less.
For complete information, see www.bls.gov/emp/ep_education_training_system.htm.
WagesWages include hourly, weekly, or annual pay that people receive for the work that they do. Sales commissions, tips, and production bonuses also are part of the wages shown in these charts, but overtime and nonproduction bonuses are not.
For individual occupations, most charts include 2010 median annual wage data from the BLS Occu-pational Employment Statistics (OES) program. The median wage is the point at which half of the workers in an occupation earned more than the amount, and half earned less. In May 2010, the median annual wage for all workers was $33,840.
The highest median annual wage among the occupations in a given chart is in boldface type. For occupations with a median annual wage of more than $166,400, a specific wage figure is not given because the OES survey does not publish wage data above this amount. In these cases, the charts show that the median wage was greater than or equal to (≥) $166,400.
Wages in these charts are for wage and salary work-ers only. Self-employed workers are not included in these measurements.
8 Occupational Outlook Quarterly • Winter 2011–12
Occupational employment
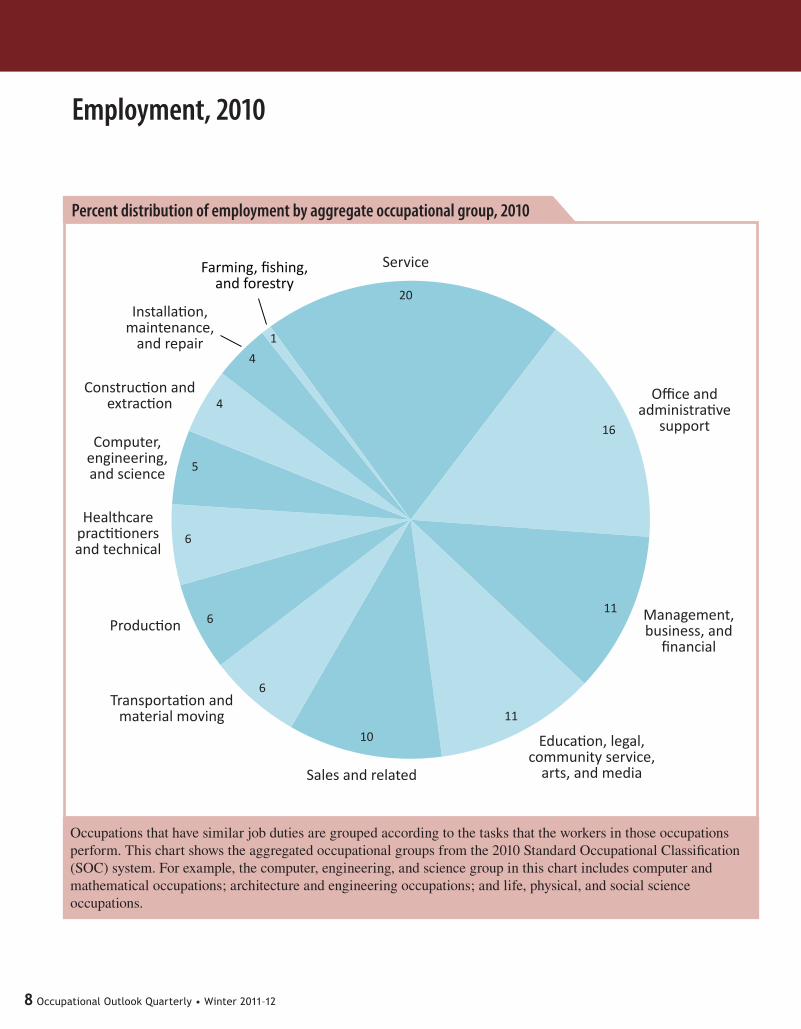
Employment, 2010
Percent distribution of employment by aggregate occupational group, 2010
Occupations that have similar job duties are grouped according to the tasks that the workers in those occupations perform. This chart shows the aggregated occupational groups from the 2010 Standard Occupational Classification (SOC) system. For example, the computer, engineering, and science group in this chart includes computer and mathematical occupations; architecture and engineering occupations; and life, physical, and social science occupations.
Service
Sales and related
Education, legal, community service,
arts, and media
Management, business, and
financial
Transportation and material moving
Healthcare practitioners and technical
Computer, engineering, and science
Production
Construction and extraction
Installation, maintenance,
and repair
Farming, fishing, and forestry
Office and administrative
support
20
11
11
16
6
5
10
6
6
4
4
1

Winter 2011–12 • Occupational Outlook Quarterly 9
Occupational employment
Numeric change in employment by major occupational group, projected 2010–20, in thousands of jobs
This chart shows the 22 major occupational groups from the SOC. All of the major groups except one are projected to gain jobs.
Office and administrative support
Healthcare practitioners and technical
Construction and extraction
Personal care and service
Installation, maintenance, and repair
Computer and mathematical
Building and grounds cleaning and maintenance
Management
Community and social service
Protective service
Arts, design, entertainment, sports, and media
Life, physical, and social science
Legal
Farming, fishing, and forestry
Transportation and material moving
Sales and related
Healthcare support
Education, training, and library
Business and financial operations
Food preparation and serving related
Production
Architecture and engineering
2,336
2,020
1,869
1,444
1,407
1,404
1,337
1,329
1,173
1,093
800
778
664
616
582
365
357
343
253
191
131
-19

10 Occupational Outlook Quarterly • Winter 2011–12
Occupational employment
Job openings by major occupational group, projected 2010–20, in thousands of openings
Employment prospects depend on more than job growth. Openings for new workers occur not only when jobs are added to the economy but also when current workers leave an occupation permanently. In most occupations, the need to replace workers who leave an occupation is expected to create more openings than job growth will.
Office and administrative support
Healthcare practitioners and technical
Construction and extraction
Personal care and service
Installation, maintenance, and repair
Computer and mathematical
Building and grounds cleaning and maintenance
Management
Community and social service
Protective service
Arts, design, entertainment, sports, and media
Life, physical, and social science
Legal
Farming, fishing, and forestry
Transportation and material moving
Sales and related
Healthcare support
Education, training, and library
Business and financial operations
Food preparation and serving related
Production
Architecture and engineering
7,450
6,454
5,103
3,597
3,591
3,398
2,760
2,583
2,568
2,555
2,231
2,026
2,042
1,655
1,438
1,196
1,098
1,067
798
546
344
291
From growth
From replacement needs

Winter 2011–12 • Occupational Outlook Quarterly 11
Occupational employment
Fastest growing occupations
Percent growth in employment, projected 2010–20
Six of the occupations in this chart are construction occupations. The construction and extraction occupations group is projected to grow rapidly, by about 22 percent, and add 1.4 million jobs. However, employment in 2020 in this group is expected to remain below its 2006 level, before the 2007–09 recession.
Personal care aides
Home health aides
Biomedical engineers
Helpers—brickmasons, blockmasons, stonemasons, and tile and marble setters
Helpers—carpenters
Veterinary technologists and technicians
Physical therapist aides
Medical secretaries
Marriage and family therapists
Market research analysts and marketing specialists
Physical therapists
Physical therapist assistants
Meeting, convention, and event planners
Occupational therapy assistants
Glaziers
Interpreters and translators
Brickmasons and blockmasons
Reinforcing iron and rebar workers
Helpers—pipelayers, plumbers, pipefitters, and steamfitters
Diagnostic medical sonographers
Median annual wages, May 2010
$19,640
20,560
81,540
25,760
26,740
49,690
38,430
64,380
45,260
23,680
51,010
36,640
43,300
46,930
30,530
45,720
60,570
76,310
29,710
27,780
70%
69
62
60
56
52
49
46
45
44
44
43
43
42
42
41
41
41
41
39
Overall growth, all occupations = 14%

12 Occupational Outlook Quarterly • Winter 2011–12
Occupational employment
Numeric growth in employment, projected 2010–20, in thousands of jobs
These 20 occupations are projected to gain the most new jobs between 2010 and 2020 and account for about 36 percent of all jobs projected to be added over the decade. These occupations have a range of wages, job duties, and education and training requirements. Registered nurses had the highest wage in May 2010 among occupations projected to gain the most new jobs.
Most new jobs
Registered nurses
Retail salespersons
Home health aides
Combined food preparation andserving workers, including fast food
Office clerks, general
Personal care aides
Childcare workers
Janitors and cleaners, except maids and housekeeping cleaners
Landscaping and groundskeeping workers
Sales reps, wholesale and manufacturing, except technical and scientific products
Construction laborers
Heavy and tractor-trailer truck drivers
Nursing aides, orderlies, and attendants
Bookkeeping, accounting, & auditing clerks
Cashiers
Elementary school teachers, except special education
Receptionists and information clerks
Customer service representatives
Laborers and freight, stock, and material movers, hand
Postsecondary teachers
Median annual wages, May 2010
$64,690
20,670
20,560
26,610
23,460
62,050
37,770
30,460
24,010
19,300
34,030
18,500
51,660
25,240
22,210
23,400
52,440
29,280
17,950
19,640
712
707
706
607
398
338
330
319
306
302
262
259
250
249
249
246
241
223
212
490

Winter 2011–12 • Occupational Outlook Quarterly 13
Occupational employment
Job openings due to growth and replacement needs, projected 2010–20, in thousands of openings
Retail salespersons and cashiers are expected to have the most job openings over the projections decade. For most of the occupations in this chart, the need to replace workers leaving the occupation is projected to create more openings than job growth will.
Most job openings
Registered nurses
Waiters and waitresses
Retail salespersons
Home health aides
Combined food preparation and serving workers, including fast food
Office clerks, general
Personal care aides
Childcare workers
Janitors and cleaners, except maids and housekeeping cleaners
Sales reps, wholesale and manufacturing, except technical and scientific products
Heavy and tractor-trailer truck drivers
Nursing aides, orderlies, and attendants
First-line supervisors of office and administrative support workers
First-line supervisors of retail sales workers
Cashiers
Elementary school teachers, except special education
Receptionists and information clerks
Customer service representatives
Laborers and freight, stock, and material movers, hand
Postsecondary teachers
Median annual wages, May 2010
$20,670
18,500
18,330
17,950
20,560
22,210
30,460
23,460
19,640
19,300
37,770
62,050
47,460
51,660
25,240
52,440
35,820
24,010
26,610
64,690
1,959
1,776
1,324
1,207
1,147
1,012
980
960
838
682
675
666
649
586
584
573
566
560
514
496
From growth From replacement needs

14 Occupational Outlook Quarterly • Winter 2011–12
Occupational employment
Graduate degree
Occupations that have the most growth and have a master’s, doctoral, or professional degree as the typical level of education needed to enter the occupation, projected 2010–20, in thousands of jobs
Most high-growth occupations in these educational categories are related to healthcare, education, and social services. The projected increase in the number of postsecondary teachers reflects expanding college enrollments.
1–5
1–5
5+
N
N
N
N
N
N
N
N
N
N
N
N
N
N
N
N
N N
N
N
N
N
N
N
N
N
N
N
N
N
N
N
N
I/R
I/R
I/R
I/R
¹ Indicates whether work experience in a related occupation is also typically needed for entry into the occupation. Assignments are more than 5 years (5+), 1–5 years (1–5), less than 1 year (<1), or none (N).
² Indicates whether on-the-job training is typically needed to attain competency in the occupation. Assignments are internship/residency (I/R), apprenticeship (A), long-term (L), moderate-term (M), short-term (S), or none (N).
Training2Experience1Median annual
wages, May 2010
Postsecondary teachers 306 $62,050
Physical therapists 77 76,310
Lawyers 74 112,760
Pharmacists 70 111,570
Educational, guidance, school, and vocational counselors 53 53,380
Healthcare social workers 51 47,230
Rehabilitation counselors 37 32,350
Occupational therapists 36 72,320
Medical scientists, except epidemiologists 36 76,700
Speech-language pathologists 29 66,920
Physician assistants 25 86,410
Veterinarians 22 82,040
Chiropractors 15 67,200
Physicians and surgeons 168 ≥166,400
Mental health counselors 44 38,150
Clinical, counseling, and school psychologists 34 66,810
Dentists, general 28 141,040
Education administrators, postsecondary 28 83,710
Instructional coordinators 27 58,830
Education administrators,elementary and secondary school 23 86,970

Winter 2011–12 • Occupational Outlook Quarterly 15
Occupational employment
Graduate degree
Occupations that have the most job openings and have a master’s, doctoral, or professional degree as the typical level of education needed to enter the occupation, projected 2010–20, in thousands of openings
Workers in seven of the occupations in this chart typically need either experience or training in addition to a graduate degree.
Median annual wages, May 2010
Postsecondary teachers 586 $62,050
Physical therapists
112,760Lawyers
111,570Pharmacists
53,380Educational, guidance, school, and vocational counselors
76,310
Healthcare social workers
90 86,970
Rehabilitation counselors
82 66,810
Occupational therapists
69 38,150
Medical scientists, except epidemiologists
69 83,710
Speech-language pathologists
64 32,350
Librarians 51 54,500
Veterinarians
41 86,410Physician assistants
34 82,040
Physicians and surgeons 305
212
140
114
101
≥166,400
Mental health counselors
87 47,230
Clinical, counseling, and school psychologists
66 141,040Dentists, general
57 72,320
Education administrators, postsecondary
58 58,830Instructional coordinators
52 66,920
Education administrators,elementary and secondary school
43 76,700
From growth From replacement needs
1–5
1–5
5+
N
N
N
N
N
N
N
N
N
N
N
N
N
N
N
N
N N
N
N
N
N
N
N
N
N
N
N
N
N
N
N
N
I/R
I/R
I/R
I/R
¹ Indicates whether work experience in a related occupation is also typically needed for entry into the occupation. Assignments are more than 5 years (5+), 1–5 years (1–5), less than 1 year (<1), or none (N).
² Indicates whether on-the-job training is typically needed to attain competency in the occupation. Assignments are internship/residency (I/R), apprenticeship (A), long-term (L), moderate-term (M), short-term (S), or none (N).
Training2Experience1

16 Occupational Outlook Quarterly • Winter 2011–12
Occupational employment
Bachelor’s degree
Occupations that have the most growth and have a bachelor’s degree as the typical level of education needed to enter the occupation, projected 2010–20, in thousands of jobs
Of the occupations shown here, computer and information systems managers had the highest wage in May 2010. They typically need more than 5 years of experience in a related occupation.
Median annual wages, May 2010
249 $51,660
Management analysts 78,160
Software developers, applications 87,790
Software developers, systems software 94,180
Market research analysts and marketing specialists
Middle school teachers, except special and career/technical educationNetwork and computer systems
administrators
Elementary school teachers, except special education
77,740Computer systems analysts
60,570
97 69,160
Medical and health services managers
72 53,230Secondary school teachers, except special and career/technical education
Sales reps, wholesale & manufacturing, technical & scientific products
Computer and information systems managers
68 84,270
Personal financial advisors
Cost estimators
66 64,750
Training and development specialists
Public relations specialists
62 54,160
Child, family, and school social workers 58 40,210
56 115,780
Accountants and auditors 191
157
144
127
120
117
108
61,690
51,960
68 57,860
66 73,710
Information security analysts 66 75,660
Recreation workers 64 22,260
58 52,090
1–5
1–5
5+
N
N
N
N
N
N
N
N
N
N
N
N
N
N
N
N
N
N
N
N
N
N
N
N
N
N
N
N
N
N
N
N
I/R
I/R
I/R
M
M
¹ Indicates whether work experience in a related occupation is also typically needed for entry into the occupation. Assignments are more than 5 years (5+), 1–5 years (1–5), less than 1 year (<1), or none (N).
² Indicates whether on-the-job training is typically needed to attain competency in the occupation. Assignments are internship/residency (I/R), apprenticeship (A), long-term (L), moderate-term (M), short-term (S), or none (N).
Training2Experience1

Winter 2011–12 • Occupational Outlook Quarterly 17
Occupational employment
Bachelor’s degree
Occupations that have the most job openings and have a bachelor’s degree as the typical level of education needed to enter the occupation, projected 2010–20, in thousands of openings
The large number of projected openings for teachers reflects the size of teaching occupations, the need to replace teachers who are expected to retire, and rising student enrollments.
Median annual wages, May 2010
573 $51,660
Management analysts
53,230
Software developers, applications
78,160
Software developers, systems software
51,960
Market research analysts and marketing specialists
Middle school teachers, except special and career/technical education
Network and computer systems administrators
Elementary school teachers, except special education
77,740Computer systems analysts
87,790
94,180
Medical and health services managers
73,710
Secondary school teachers, except special and career/technical education
Sales reps, wholesale & manufacturing, technical & scientific products
Securities, commodities, andfinancial services sales agents
69,160
Graphic designers
Sales managers
Financial managers
84,270
Computer programmers
Public relations specialists
71,380
Child, family, and school social workers
43,500
22,260
Accountants and auditors 452
356
274
249
223
198
192
168
160
155
143
142
140
134
128
128
127
124
119
61,690
60,570
103,910
70,190
98,530
Recreation workers
40,210
52,090
From growth From replacement needs
1–5
1–5
5+
N
N
N
N
N
N
N
N
N
N
N
N
N
N
N
N
N N
N
N
N
N
N
N
N
N
N
N
N
N
N
M
M
M
I/R
I/R
I/R
¹ Indicates whether work experience in a related occupation is also typically needed for entry into the occupation. Assignments are more than 5 years (5+), 1–5 years (1–5), less than 1 year (<1), or none (N).
² Indicates whether on-the-job training is typically needed to attain competency in the occupation. Assignments are internship/residency (I/R), apprenticeship (A), long-term (L), moderate-term (M), short-term (S), or none (N).
Training2Experience1

18 Occupational Outlook Quarterly • Winter 2011–12
Occupational employment
Associate’s degree or postsecondary non-degree award
Occupations that have the most growth and have an associate’s degree or postsecondary non-degree award as the typical level of education needed to enter the occupation, projected 2010–20, in thousands of jobs
At these levels of education, occupations that are projected to gain the most jobs are largely related to healthcare, reflecting the growing medical needs of an aging population.
Median annual wages, May 2010
712 $64,690
Licensed practical andlicensed vocational nurses 40,380
Preschool teachers, exceptspecial education 25,700
Hairdressers, hairstylists, andcosmetologists 22,760
Heating, air conditioning, and refrigeration mechanics and installers
Construction managers
General and operations managers
33,470Dental assistants
42,530
94,400
Dental hygienists
75
98
92
90
87
82
30,360Emergency medical technicians and paramedics
Medical records andhealth information technicians
Firefighters
69 68,250
Paralegals and legal assistants
Radiologic technologists & technicians
47 46,680
Massage therapists 31 34,900
Telecom equipment installers and repairers, except line installers 28 54,710
27 45,250
Nursing aides, orderlies, and attendants
Registered nurses
302
169
114
24,010
83,860
61 54,340
38 32,350
Veterinary technologists & technicians 42 29,710
Respiratory therapists 31 54,280
Physical therapist assistants 31 49,690
1–5
5+
N
N
N
N
N
N
N
N
N
N
N
N
N
N
N
N
N
N
N
N
N
N
N
N
N
N
N
N
N
N
N
N
N
N
N
L
L
M
¹ Indicates whether work experience in a related occupation is also typically needed for entry into the occupation. Assignments are more than 5 years (5+), 1–5 years (1–5), less than 1 year (<1), or none (N).
² Indicates whether on-the-job training is typically needed to attain competency in the occupation. Assignments are internship/residency (I/R), apprenticeship (A), long-term (L), moderate-term (M), short-term (S), or none (N).
Training2Experience1

Winter 2011–12 • Occupational Outlook Quarterly 19
Occupational employment
Associate’s degree or postsecondary non-degree award
Occupations that have the most job openings and have an associate’s degree or postsecondary non-degree award as the typical level of education needed to enter the occupation, projected 2010–20, in thousands of openings
Over the 2010–20 decade, registered nurses are expected to have more than twice as many job openings as any other occupation with these levels of education.
Median annual wages, May 2010
1,207 $64,690
94,400
40,380
25,700
22,760
33,470
30,360
83,860
45,250
54,340
29,860
34,900
29,710
496
410
369
232
218
154
138
121
120
112
105
95
88
83
74
60
59
56
56
24,010
42,530
68,250
46,680
53,090
32,350
54,710
From growth From replacement needs
Licensed practical andlicensed vocational nursesPreschool teachers, except
special educationHairdressers, hairstylists, and
cosmetologists
Heating, air conditioning, and refrigeration mechanics and installers
Construction managers
General and operations managers
Dental assistants
Dental hygienists
Emergency medical technicians and paramedics
Medical records andhealth information technicians
First-line supervisors of production and operating workers
Firefighters
Paralegals and legal assistants
Radiologic technologists & technicians
Massage therapists
Telecom equipment installers and repairers, except line installers
Nursing aides, orderlies, and attendants
Registered nurses
Veterinary technologists & technicians
Library technicians
5+
1–5
1–5
N
N
N
N
N
N
N
N
N
N
N
N
N
N
N
N
N N
N
N
N
N
N
N
N
N
N
N
N
N
N
N
N
N
M
L
L
¹ Indicates whether work experience in a related occupation is also typically needed for entry into the occupation. Assignments are more than 5 years (5+), 1–5 years (1–5), less than 1 year (<1), or none (N).
² Indicates whether on-the-job training is typically needed to attain competency in the occupation. Assignments are internship/residency (I/R), apprenticeship (A), long-term (L), moderate-term (M), short-term (S), or none (N).
Training2Experience1

20 Occupational Outlook Quarterly • Winter 2011–12
Occupational employment
High school diploma or equivalent
Occupations that have the most growth and have a high school diploma or equivalent as the typical level of education needed to enter the occupation, projected 2010–20, in thousands of jobs
Occupations at this education level need different types of training, ranging from short-term on-the-job training to apprenticeships. The four fastest growing occupations in this chart typically need short-term on-the-job training.
Median annual wages, May 2010
490 $26,610
Heavy and tractor-trailer truck drivers 37,770
Childcare workers 19,300
Bookkeeping, accounting, and auditing clerks 34,030
Sales reps, wholesale & manufacturing, except technical & scientific products
Medical secretaries
First-line supervisors of office and administrative support workers
25,240Receptionists and information clerks
52,440
47,460
Security guards
39,530Carpenters
Maintenance & repair workers, general
Automotive service technicians and mechanics
23,920
Medical assistants
Teacher assistants
28,860
Electricians 48,250
Light truck or delivery services drivers 28,630
35,790
Customer service representatives
Office clerks, general
338
330
262
259
249
223
210
203
196
195
191
163
156
142
136
134
131
126
125
30,460
30,530
23,220
34,730
Executive secretaries andexecutive administrative assistants 43,520
First-line supervisors ofretail sales workers 35,820
First-line supervisors of construction trades and extraction workers 58,680
1–5
1–5
1–5
1–5
5+
N
N
N
N
N
N
N
N
N
N
N
N
N
N
N
N
N
N
N
S
S
S
S
S
A
S
S
A
S
L
M
M
M
M
M
¹ Indicates whether work experience in a related occupation is also typically needed for entry into the occupation. Assignments are more than 5 years (5+), 1–5 years (1–5), less than 1 year (<1), or none (N).
² Indicates whether on-the-job training is typically needed to attain competency in the occupation. Assignments are internship/residency (I/R), apprenticeship (A), long-term (L), moderate-term (M), short-term (S), or none (N).
Training2Experience1

Winter 2011–12 • Occupational Outlook Quarterly 21
Occupational employment
High school diploma or equivalent
Occupations that have the most job openings and have a high school diploma or equivalent as the typical level of education needed to enter the occupation, projected 2010–20, in thousands of openings
Of the occupations shown here, first-line supervisors of construction trades and extraction workers had the highest wage in May 2010. They also typically need more than 5 years of experience in a related occupation.
Median annual wages, May 2010
1,012 $26,610
19,300
37,770
47,460
25,240
52,440
23,220
34,030
39,530
34,730
28,630
30,530
58,680
960
666
649
584
566
560
514
482
468
408
391
379
360
322
312
296
289
278
260
30,460
35,820
30,830
43,520
23,920
35,790
48,250
From growth From replacement needs
Heavy and tractor-trailer truck drivers
Childcare workers
Bookkeeping, accounting, and auditing clerks
Sales reps, wholesale & manufacturing, except technical & scientific products
First-line supervisors of office and administrative support workers
Receptionists and information clerks
Security guards
Carpenters
Maintenance & repair workers, general
Automotive service technicians and mechanics
Medical secretaries
Teacher assistants
Electricians
Light truck or delivery services drivers
Customer service representatives
Office clerks, general
Executive secretaries andexecutive administrative assistants
Secretaries and admin assistants, except legal, medical, and executive
First-line supervisors ofretail sales workers
First-line supervisors of construction trades and extraction workers5+
1–5
1–5
1–5
1–5
N
N
N
N
N
N
N
N
N
N
N
N
N
N
N
N
N
N
N
S
S
S
S
S
S
S
A
A
S
L
S
M
M
M
M
¹ Indicates whether work experience in a related occupation is also typically needed for entry into the occupation. Assignments are more than 5 years (5+), 1–5 years (1–5), less than 1 year (<1), or none (N).
² Indicates whether on-the-job training is typically needed to attain competency in the occupation. Assignments are internship/residency (I/R), apprenticeship (A), long-term (L), moderate-term (M), short-term (S), or none (N).
Training2Experience1

22 Occupational Outlook Quarterly • Winter 2011–12
Occupational employment
Less than a high school diploma
Occupations that have the most growth and have less than a high school diploma as the typical level of education needed to enter the occupation, projected 2010–20, in thousands of jobs
Workers might not need a high school diploma to enter these occupations, but they typically need on-the-job training to attain competency.
Median annual wages, May 2010
707 $20,670
Personal care aides 19,640
17,950
Laborers and freight, stock, and material movers, hand
Combined food preparation and serving workers, including fast food
23,460
Janitors and cleaners, except maids and housekeeping cleaners
Landscaping and groundskeeping workers
18,500Cashiers
22,210
29,280
Cooks, restaurant
18,330Waiters and waitresses
Construction laborers
Industrial truck and tractor operators
Cleaners of vehicles and equipment
22,140
Food preparation workers
Maids and housekeeping cleaners
19,100
Packers and packagers, hand
Nonfarm animal caretakers
Cement masons & concrete finishers
Counter and rental clerks
19,630
22,100
35,450
Home health aides
Retail salespersons
706
607
398
319
250
246
241
212
196
118
112
84
72
62
60
58
53
51
50
20,560
23,400
19,300
29,780
Painters, construction & maintenance 34,280
19,680
19,550
<1
<1
N
N
N
N
N
N
N
N
N
N
N
N
N
N
N
N
N
N
S
S
S
S
S
S
S
S
S
S
S
S
S
S
S
S
S
M
M
M
¹ Indicates whether work experience in a related occupation is also typically needed for entry into the occupation. Assignments are more than 5 years (5+), 1–5 years (1–5), less than 1 year (<1), or none (N).
² Indicates whether on-the-job training is typically needed to attain competency in the occupation. Assignments are internship/residency (I/R), apprenticeship (A), long-term (L), moderate-term (M), short-term (S), or none (N).
Training2Experience1

Winter 2011–12 • Occupational Outlook Quarterly 23
Occupational employment
Less than a high school diploma
Occupations that have the most job openings and have less than a high school diploma as the typical level of education needed to enter the occupation, projected 2010–20, in thousands of openings
Construction laborers, the highest paid occupation in this chart, had a wage that was lower than $33,840—the median annual wage for all workers in May 2010.
Median annual wages, May 2010
1,959
1,776
1,324
1,147
$20,670
18,330
17,950
23,460
20,560
22,210
21,290
23,400
19,100
18,370
19,630
18,960
18,680
980
838
682
675
465
444
377
352
350
313
292
269
252
246
227
221
18,500
19,640
19,300
29,280
22,140
18,150
18,450
From growth From replacement needsTraining2Experience1
<1
N
N
N
N
N
N
N
N
N
N
N
N
N
N
N
N
N
N
N
N
S
S
S
S
S
S
S
S
S
S
S
S
S
S
S
S
S
S
M
Waiters and waitresses
Laborers and freight, stock, and material movers, hand
Combined food preparation and serving workers, including fast food
Janitors and cleaners, except maids and housekeeping cleaners
Personal care aides
Home health aides
Cooks, restaurant
Counter attendants, cafeteria,food concession, and coffee shop
Landscaping and groundskeeping workers
Stock clerks and order fillers
Construction laborers
Dishwashers
Food preparation workers
Maids and housekeeping cleaners
Packers and packagers, hand
Hosts and hostesses, restaurant, lounge, and coffee shop
Bartenders
Miscellaneous agricultural workers
Cashiers
Retail salespersons
¹ Indicates whether work experience in a related occupation is also typically needed for entry into the occupation. Assignments are more than 5 years (5+), 1–5 years (1–5), less than 1 year (<1), or none (N).
² Indicates whether on-the-job training is typically needed to attain competency in the occupation. Assignments are internship/residency (I/R), apprenticeship (A), long-term (L), moderate-term (M), short-term (S), or none (N).

24 Occupational Outlook Quarterly • Winter 2011–12
Occupational employment
Most job losses
Decline in employment by occupation, projected 2010–20, in thousands of jobs
These occupations are expected to lose jobs for many reasons, including increasing worker productivity. Even in occupations that are not expected to gain jobs, however, the need to replace existing workers who leave should create some opportunities.
Median annual wages, May 2010
-96
-69
-42
-38
-33
-32
-19
-16
-13
-12
-11
-10
-9
-8
-7
-7
-7
-7
-6
-19
$60,750
20,600
53,860
24,920
53,100
18,960
27,450
33,400
22,190
29,100
19,400
60,300
23,610
53,080
18,100
48,130
36,280
25,090
36,930
27,080
Sewing machine operators
Postal service mail carriers
Switchboard operators, includinganswering service
Cooks, fast food
Postal service clerks
Miscellaneous agricultural workers
File clerks
Data entry keyers
Word processors and typists
Prepress technicians and workers
Computer operators
Door-to-door sales workers, news andstreet vendors, and related workers
Food service managers
Electrical and electronic equipment assemblers
Pressers, textile, garment, and related materials
Office machine operators, except computer
Floral designers
Postmasters and mail superintendents
Postal service mail sorters, processors, and processing machine operators
Farmers, ranchers, and otheragricultural managers

Winter 2011–12 • Occupational Outlook Quarterly 25
Occupational employment
Most self-employed
Occupations with the most self-employed jobs, projected 2020, in thousands of jobs
Most of the new jobs added to the economy are expected to be for wage and salary workers; employment of self-employed and unpaid family workers is projected to grow slowly through 2020. Farmers, ranchers, and other agricultural managers are projected to have the most jobs for self-employed workers in 2020.
361
420
422
489
860
308
307
228
222
217
191
187
177
173
158
152
146
144
136
134
Carpenters
Construction managers
First-line supervisors of retail sales workers
Hairdressers, hairstylists, and cosmetologists
Construction laborers
Landscaping and groundskeeping workers
First-line supervisors of non-retail sales workers
Maids and housekeeping cleaners
Painters, construction and maintenance
Real estate sales agents
Property, real estate, andcommunity association managers
Retail salespersons
Management analysts
Lawyers
Heavy and tractor-trailer truck drivers
Automotive service technicians & mechanics
Door-to-door sales workers, news and street vendors, and related workers
Food service managers
Childcare workers
Farmers, ranchers, and otheragricultural managers
Total employment, projected 2020*
142
848
1,935
4,968
322
440
802
876
413
1,211
1,756
1,544
1,106
310
1,539
463
1,392
726
610
1,198
* Total employment includes self-employed jobs, wage and salary jobs, and jobs for unpaid family workers.

26 Occupational Outlook Quarterly • Winter 2011–12
T he labor force is the number of people ages 16 or older who are either working or looking for work. It does not include active-duty military personnel
or the institutionalized population, such as prison inmates. Determining the size of the labor force is a way of deter-mining how big the economy can get.
The size of the labor force depends on two factors. The first is the size of the population, which is determined by rates of birth, immigration, and death. The second is the labor force participation rate—the percent of the pop-ulation that is working or actively seeking employment.
Labor force participation rates vary significantly between men and women and among different age, racial, and ethnic groups. Population growth rates also vary from one group to another. These variations change the compo-sition of the labor force over time.
The charts that follow show how the labor force is projected to change among age groups, between men and women, among racial groups (Asians, blacks, whites, and others), and among ethnic groups (Hispanics and non-Hispanics of any race). The U.S. Census Bureau uses these categories to produce the demographic data on which BLS projections are based.
Total labor force growth is expected to be about 0.7 percent annually between 2010 and 2020. This average is shown as a dotted vertical line in the chart on page 28.
As in previous years, the labor force is projected to grow more slowly than the number of jobs, but this is not an indication of a labor shortage. Instead, this discrepancy reflects that these two measures are based on different concepts.
Labor force

Winter 2011–12 • Occupational Outlook Quarterly 27
Labor force
Both the population and the labor force are projected to continue growing slowly. By 2020, the number of people working or looking for work is expected to reach about 164 million. That number excludes people younger than 16 years of age and those who are active-duty members of the U.S. Armed Forces, are inmates of penal or mental institutions, or are in homes for the aged.
Population and labor force, 2000, 2010, and projected 2020, in millions of people
213
238
143154
164
263
Civilian noninstitutional population,16 years and older Labor force
20002010Projected 2020
Annual growth rates in population and labor force, 2000–10 and projected 2010–20, in percent
Between 2010 and 2020, both the population and the labor force are expected to grow more slowly than they did during the previous decade.
1.1%
0.8
0.7
1.0%
Civilian noninstitutional population,16 years and older Labor force
2000–10Projected 2010–20

28 Occupational Outlook Quarterly • Winter 2011–12
Labor force
Annual growth rate in labor force by age, projected 2010–20, in percent
Thanks to advances in medicine, people now enjoy better health as they age and, as a result, are able to remain in the labor force longer than workers in previous generations did. A variety of economic factors—an increase in the Social Security eligibility age, for example—create incentives for people to keep working. Because of these factors, the number of people in the labor force ages 65 and older is expected to grow about 11 times faster than the total labor force.
Numeric change in labor force by age, projected 2010–20, in thousands of people
The aging of the baby-boom generation (those born between 1946 and 1964) increases the share of the older age groups in the population. As baby boomers age over the projections decade, the number of people in the labor force ages 55 to 64 is expected to increase by more than 6 million, and the number of people ages 65 and older is projected to increase by more than 5 million. The number of 45– to 54–year-olds in the labor force is expected to shrink as baby boomers shift into older groups.
-2,604 Ages 16 to 24
Ages 25 to 34
Ages 45 to 54
Ages 55 to 64
Ages 65 and older
Ages 35 to 44
-2,909
1,781
6,001
5,396
2,807
-1.2%
0.8
0.5
2.3
8.0
-0.8
16 to 24
25 to 34
45 to 54
55 to 64
65 and older
35 to 44
Average, total labor force = 0.7

Winter 2011–12 • Occupational Outlook Quarterly 29
Labor force
Annual growth rate in labor force for men and women, projected 2010–20, in percent
Between 2010 and 2020, the increase in the number of women in the labor force is expected to be greater than the increase in the number of men.
Women Men Total labor force
0.7% 0.7
0.6
Labor force participation rates for men and women, 1960–2010 and projected 2020
The labor force participation rates for both men and women are expected to decline slightly over the projections decade. By 2020, about 68 percent of men and 57 percent of women are expected to be in the labor force.
The aging of the population will be a factor driving down labor force participation rates. Despite working longer than previous generations, baby boomers will still have lower levels of labor force participation than those in younger age groups. The baby-boom generation is becoming a larger segment of the total population, driving down overall participation in the labor force.
Men
Total
Women
1960
40
60
80
100%
1970 1980 1990 2000 2010 Projected2020
(Percent of people in the labor force)

30 Occupational Outlook Quarterly • Winter 2011–12
Labor force
Percent distribution of labor force by race, projected 2020
Although whites will continue to be the largest racial category in the labor force, other racial groups are projected to make up 21 percent of the labor force by 2020.
White
All otherAsian
Black
79
36
12
Percent distribution of labor force by race, 2010
Whites made up 81 percent of the labor force in 2010.
White
All otherAsian
Black
81
25
12

Winter 2011–12 • Occupational Outlook Quarterly 31
Labor force
Annual growth rate in labor force by race, projected 2010–20, in percent
Although Asians will remain a small part of the labor force, they will have the fastest rate of labor force growth between 2010 and 2020. This growth is due to increased immigration and high labor force participation rates.
The “all other races” category includes American Indians and Alaska Natives, Native Hawaiians and other Pacific Islanders, multiracial individuals, and any other people who do not identify themselves as white, black, or Asian.
0.7%
Total White Black Asian All other
1.0
2.7
2.5
0.4

32 Occupational Outlook Quarterly • Winter 2011–12
Labor force
Percent distribution of labor force by ethnic origin, 2010
...leading to an increased share of the labor force: from 15 percent in 2010...
Hispanic
Non-Hispanic
15
85
Percent distribution of labor force by ethnic origin, projected 2020
...to 19 percent in 2020.
Hispanic
Non-Hispanic
19
81
The Hispanic labor force is growing faster than any other ethnic group because of overall population growth—due to higher births and increased immigration—and because of significantly higher labor force participation rates...
3.0
0.7%
0.2
Non-HispanicHispanicTotal
Annual growth rate in labor force by ethnic origin, projected 2010–2020, in percent

Winter 2011–12 • Occupational Outlook Quarterly 33
Industry employment
T his section illustrates projected employment change for industries over the 2010–20 decade. Workers are grouped into an industry accord-
ing to the type of good produced or service provided by the establishment for which they work. For example, everyone who is on a construction company’s payroll is part of the construction industry, regardless of his or her job duties. The construction industry includes not only construction workers, such as carpenters and roofers, but also other workers, such as office managers and truck drivers.
Industry employment projections are shown in terms of numeric change (growth or decline in the total number of jobs) and percent change (the rate of job growth or decline). Unlike the employment totals in the occupational charts, however, the employment totals in this section cover only wage and salary workers and do not include self-employed or unpaid family workers.
Employment growth for all wage and salary work-ers is projected to average about 15 percent between 2010 and 2020. This average is shown as a dotted verti-cal line in two charts.
As discussed in the introduction to this issue of the Quarterly, job growth or decline in some industries affects particular occupations significantly. The num-ber of jobs for registered nurses, for example, is highly dependent on the growth of the hospital industry. Many occupations, however—from accountants to computer systems analysts—are found in nearly every industry.
Employment growth in industries depends on industry output (the total amount produced) and worker
productivity (how much each worker produces). Labor-saving technologies and methods can increase pro-ductivity, limiting employment growth even as output increases. For example, even as domestic manufactur-ing output is projected to increase, employment in factories is projected to decline as advanced methods and machines reduce the number of workers needed to produce goods.
Industries shown in the charts are defined primarily according to the 2007 North American Industry Clas-sification System (NAICS), a system used by the federal government to classify establishments into industry categories. Industries fall into one of two groups: goods producing or service providing.
The goods-producing industries are as follows:• Construction. Examples of establishments in
this sector include electrical contracting firms and excavating companies.
• Manufacturing. Examples include businesses that make motor vehicle parts, snack foods, and other goods.
• Mining. Establishments in this sector include quarries, mines, and oil and gas extraction companies.
The service-providing industries are as follows:• Educational services. This sector includes
local, state, and private schools and other providers of education.
• Financial activities. This sector includes banks, insurance companies, real estate offices, and rental services organizations.
Industry employment

34 Occupational Outlook Quarterly • Winter 2011–12
Industry employment
• Health care and social assistance. Health care and social assistance providers—including public and private providers of health care and private providers of social assistance—are part of this sector. Examples include medical labora-tories, optometrists’ offices, and nursing homes.
• Information. This sector includes print, soft-ware, and database publishing firms; broadcast-ing and telecommunications providers; and information and data processing providers.
• Leisure and hospitality. Examples include hotels, restaurants, theme parks, and perform-ing arts companies.
• Professional and business services. Examples include law firms, consulting services, and temporary help firms.
• Public administration. This sector consists of government establishments that administer programs and provide for public safety. Federal, state, and local government (except education and hospitals) are classified here.
• Trade, transportation, and utilities. Included here are wholesale and retail trade establish-ments, taxi services, and sewage treatment facilities.
Wage and salary employment by industry type, 2010 and projected 2020, in millions of jobs
Service-providing industries are projected to account for the most job growth between 2010 and 2020. In goods-producing industries, employment is projected to stay about the same over the decade.
131
19
Projected 20202010
113
18
Service providing Goods producing
130*
150
*Note: Data do not sum to total because of rounding.

Winter 2011–12 • Occupational Outlook Quarterly 35
Industry employment
Employment, 2010
Percent distribution of wage and salary employment by industry sector, 2010
In 2010, four industry sectors—retail trade and wholesale trade, state and local government, professional and business services, and health care and social assistance—accounted for more than half of all employment.
Goods producing
Service providing1, Mining
Construction
Manufacturing
Transportation and utilities
Financial services
Professional and business servicesEducational services
Health care andsocial assistance
Leisure andhospitality
Other services
Federal government
State and local government
Retail trade andwholesale trade
Information
4
9
4
15
6
132
13
10
5
2
15
2

36 Occupational Outlook Quarterly • Winter 2011–12
Industry employment
Employment change
Numeric change in employment of wage and salary workers by industry sector, projected 2010–20, in thousands of jobs
Employment is projected to increase by more than 5.6 million in the health care and social assistance sector. Home health care services and individual and family services are expected to lead growth in this sector. Growth in professional and business services is expected to be led by providers of management, scientific, and technical consulting services.
Service providing
Goods producing
5,6373,807
2,5101,839
1,6391,341
819819817780
14025
-74-372
Health care and social assistance
Other servicesTransportation and utilities
Financial activitiesInformation
MiningManufacturingFederal government
State and local governmentLeisure and hospitality
Educational services
Professional and business servicesRetail trade and wholesale trade
Construction
Both the health care and social assistance sector and the construction sector are projected to grow more than twice as fast as the average for all industries between 2010 and 2020. Growth in health care and social assistance is expected to be driven by increased demand from an aging population. In construction, projected rapid employment growth represents a partial recovery of significant job losses that occurred between 2007 and 2009.
Percent change in employment of wage and salary workers by industry sector, projected 2010–20
Service providing
Goods producing
Health care and social assistance
Other services
Transportation and utilities
Financial activities
InformationMining
ManufacturingFederal government Average, all wage and salary workers = 15%
State and local government
Leisure and hospitality
Educational services
Professional and business services
Retail trade and wholesale trade
Construction34%
33
26
23
17
14
13
10
10
-13
8
54
-1

Winter 2011–12 • Occupational Outlook Quarterly 37
Industry employment
Fastest growing industries
Percent growth in employment of wage and salary workers by detailed industry, projected 2010–20
Nearly all of the detailed industries that are projected to grow fastest between 2010 and 2020 are service-providing ones. Five of these are related to healthcare.
Home health care services
Individual and family services
Offices of health practitioners
Construction
Nursing and residential care facilities
Truck transportation
Employment services
Hospitals
Services to buildings and dwellings
Wholesale trade
Retail trade
Food services and drinking places
Child day care services
Management, scientific, andtechnical consulting services
Computer systems design andrelated services
Outpatient, laboratory, and otherambulatory care services
Junior colleges, colleges, universities, and professional schools
Architectural, engineering, andrelated services
State educational services
Local educational services
81%
70
58
47
37
36
33
29
28
28
26
24
23
19
17
14
12
12
9
9
Average, all wage and salary workers = 15%
Goods producing
Service providing

38 Occupational Outlook Quarterly • Winter 2011–12
Industry employment
Most new jobs
Numeric growth in employment of wage and salary workers by detailed industry, projected 2010–20, in thousands of jobs
All of the projected growth in construction is to regain jobs that were lost during the 2007–09 recession, but these 1.8 million jobs will not be enough to return construction employment to its pre-recession level. Five other indus-tries projected to gain the most jobs are related to health care: offices of health practitioners; hospitals; home health care services; nursing and residential care facilities; and outpatient, laboratory, and other ambulatory care services.
Construction
Retail trade
Offices of health practitioners
Hospitals
Home health care services
Food services and drinking places
Employment services
Services to buildings and dwellings
Truck transportation
State educational services
Child day care services
Nursing and residential care facilities
Computer systems design and related services
Management, scientific, andtechnical consulting services
Junior colleges, colleges, universities, and professional schools
Outpatient, laboratory, and other ambulatory care services
Architectural, engineering, and related services
Individual and family services
Wholesale trade
Local educational services
1,391
878
872
859
851
822
743
740
671
631
575
284
249
300
302
358
394
477
1,767
1,839
Goods producing
Service providing

Winter 2011–12 • Occupational Outlook Quarterly 39
Industry employment
Most job losses
Numeric decline in employment of wage and salary workers by detailed industry, projected 2010–20, in thousands of jobs
Declines in industry employment are usually the result of falling demand for specific goods and services, increased imports that reduce domestic production, or the use of technology that increases worker productivity. Declining employment may lead to unfavorable job prospects, but the need to replace workers who leave an industry often creates some job openings.
Motor vehicle parts manufacturing
Basic chemical manufacturing
Metalworking machinery manufacturing
Fiber, yarn, and thread mills
Printing and related support activities
Communications equipment manufacturing
State government enterprises
Drycleaning and laundry services
Other miscellaneous manufacturing
Apparel knitting mills
U.S. Postal Service
Federal defense government
Federal nondefense government
Crop production
Motion picture, video, andsound recording industries
Semiconductor and other electronic component manufacturing
Electric power generation, transmission, and distribution
Navigational, measuring, electromedical, and control instruments manufacturing
Computer and peripheral equipment manufacturing
Newspaper, periodical, book, anddirectory publishers
Goods producing
Service providing
-182
-122
-92
-62
-52
-43
-44
-50
-40
-36
-36
-33
-32
-32
-25
-21
-20
-23
-32
-33

40 Occupational Outlook Quarterly • Winter 2011–12
T he economy’s need for workers originates in the demand for the goods and services that these workers provide. So, to project employ-
ment, BLS starts by estimating the components of gross domestic product (GDP) for 2020. GDP is the value of the final goods produced and services provided in the United States.
Then, BLS estimates the size—in inflation-adjusted dollars—of the five major categories of production. The categories are as follows:
• Personal consumption expenditures. This category includes purchases made by individu-als, including goods (such as cameras, appli-ances, and food) and services (such as public transportation, personal care, and household maintenance).
• Gross private domestic investment. This category includes business investment in equip-ment and software; the construction of houses, factories, hospitals, and other structures; and changes in business inventories.
• Government consumption expenditures and gross investment. This category includes goods and services bought by federal, state, and local governments.
• Exports. These are goods and services pro-duced in the United States and purchased in foreign countries.
• Imports. Imports are goods and services produced abroad and purchased in the United
States. Because GDP measures production in the United States, the value of imports is sub-tracted from the other four categories of GDP.
Next, BLS breaks down these major categories into more detailed ones, such as the production of automo-biles or the provision of medical services.
Changes in the level and composition of goods produced and services provided often affect industry employment levels. For example, an increased level of business investment in computer software may increase employment in the computer industry and in all those industries that provide inputs—either products or services—to the computer industry. In turn, employ-ment in occupations in those industries would grow.
Industry employment levels are also affected by changes in labor productivity—the amount an employee produces per hour of work. Because of technologi-cal advances, for example, some industries are able to increase output with fewer employees.
Unlike previous sections, the growth charts in this section show annual rates of change instead of the percent change over the entire projections decade. Annual rates are used here, in part, because they are the measure used for other economic indicators, including inflation.
To show changes in demand more accurately, dollar amounts in these charts are given not in current dollars but in 2005 chain-weighted dollars. This means that amounts have been adjusted for changing prices over time.
Overall economy

Winter 2011–12 • Occupational Outlook Quarterly 41
Overall economy
Annual growth in productivity by decade, 1970–2010 and projected 2010–20, in percent
Growth in GDP is due, in part, to increasing productivity. Productivity is projected to grow 2.0 percent annually over the 2010–20 decade.
Projected 2010–202000–101990–20001980–901970–80
1.7%1.6
2.1
2.5
2.0
GDP in 1990, 2000, 2010, and projected 2020
By 2020, the value of goods produced and services provided (gross domestic product, or GDP) in the United States is projected to reach more than $17.5 trillion.
$8,027
11,217
13,088
17,513
1990 Projected 202020102000
(Billions of chained 2005 dollars)*
*Note: Chain-weighted dollars have been adjusted to reflect price changes that occur over time.
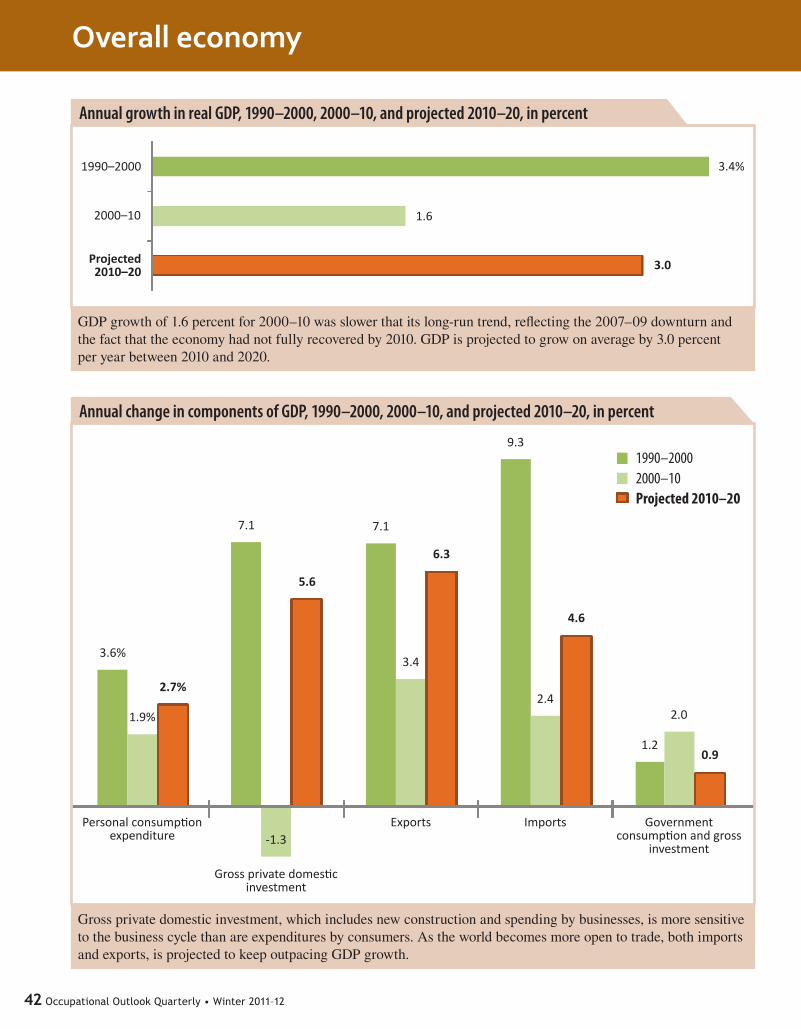
42 Occupational Outlook Quarterly • Winter 2011–12
Overall economy
Annual growth in real GDP, 1990–2000, 2000–10, and projected 2010–20, in percent
GDP growth of 1.6 percent for 2000–10 was slower that its long-run trend, reflecting the 2007–09 downturn and the fact that the economy had not fully recovered by 2010. GDP is projected to grow on average by 3.0 percent per year between 2010 and 2020.
Annual change in components of GDP, 1990–2000, 2000–10, and projected 2010–20, in percent
Gross private domestic investment, which includes new construction and spending by businesses, is more sensitive to the business cycle than are expenditures by consumers. As the world becomes more open to trade, both imports and exports, is projected to keep outpacing GDP growth.
3.6%
7.1
5.6
7.1
6.3
3.4
9.3
2.4
-1.3
4.6
1.2
2.0
0.9
1.9%
2.7%
Personal consumption expenditure
Gross private domestic investment
Exports Imports Governmentconsumption and gross
investment
1990–20002000–10Projected 2010–20
1990–2000
2000–10
Projected 2010–20
3.4%
1.6
3.0

Winter 2011–12 • Occupational Outlook Quarterly 43
2007–11
Choosing and changing jobsCareer beginnings for business
majors. Winter 08–09Career planning the second time
around. Summer 09Gap year: Time off, with a plan.
Fall 09Employment matchmakers: Pairing
people and work. Winter 07–08Focused jobseeking: A measured
approach to looking for work. Spring 11
Flexible work: Adjusting the when and where of your job. Summer 07
Informational interviewing: Get the inside scoop on careers. Summer 10
Job openings by industry, March 2008 (chart). Summer 08
Job outlook by education, 2006–16. Fall 08
Mapping out a career: An analysis of geographic concentration of occupations. Fall 10
Résumés, applications, and cover letters. Summer 09
What can I do with my liberal arts degree? Winter 07–08
Earnings and benefitsBeyond averages: Other ways to
look at occupational wages. Winter 07–08
Class of 1993: Earnings and occupations by college major, 1 and 10 years after graduation, The. Summer 08
Earnings data from BLS: What we have and how to find it. Summer 07
Education pays: More education leads to higher earnings, lower unemployment (chart). Summer 10
Employment and wages in selected healthcare practitioners and
technical occupations and health-care support occupations, May 2008 (chart). Spring 10
Good-for-you benefits on the rise (chart). Spring 07
Health benefit costs by occupation: An employer’s perspective (chart). Fall 08
Large occupations with higher-than-median wages, May 2008 (chart). Fall 09
Road to high wages, The (chart). Winter 10–11
Serving, learning, and earning: An overview of three organizations. Summer 11
Education and training Employment, trends, and training in
information technology. Spring 09Extracurricular activities: The after-
school connection. Winter 08–09Finishing high school leads to better
employment prospects (chart). Summer 11
Paving the occupational path: A new system for assigning education and training. Fall 11
Occupations and industries2010 SOC, The: A classification
system gets an update. Summer 10Admissions consultant. (You’re a
what?) Spring 08Automation technician. (You’re a
what?) Spring 10Career beginnings for business
majors. Winter 08–09Careers in auto racing: Work in the
fast lane. Fall 09Careers in forensics: Analysis,
evidence, and law. Spring 09Careers in organic food production.
Fall 10
Careers in wind energy. Winter 10–11
Cartoonist. (You’re a what?) Fall 08Chimney sweep. (You’re a what?)
Summer 10Cobbler. (You’re a what?)
Summer 07Commercial diver. (You’re a what?)
Winter 07–08Consulting careers: A profile of three
occupations. Spring 11Employment matchmakers: Pairing
people and work. Winter 07–08Employment, trends, and training in
information technology. Spring 09.Fix-it careers: Jobs in repair. Fall 10Foley artist. (You’re a what?)
Spring 11Framer. (You’re a what?) Spring 07Futurist. (You’re a what?) Spring 09Garden-variety job growth (chart).
Spring 11Genetic counselors. (You’re a what?)
Summer 11Going “green”: Environmental
jobs for scientists and engineers. Summer 09
Healthcare jobs you might not know about. Summer 08
Health educators: Working for wellness. Summer 07
Home stager. (You’re a what?) Summer 08
House work: Jobs in residential upkeep. Winter 10–11
Helping those in need: Human service workers. Fall 11
Limnologist. (You’re a what?) Winter 08–09
Making the news: Jobs in TV journalism. Spring 09
Medical physicists and health physicists: Radiation occupations. Summer 11

44 Occupational Outlook Quarterly • Winter 2011–12
2007–11
Metrology careers: Jobs for good measure. Fall 09
Military training for civilian careers (Or: How to gain practical experi-ence while serving your country). Spring 07
More than food and drink: Careers in restaurants. Spring 09
Museum work: Put your skills on exhibit. Summer 10
Nursing jobs in nursing homes. Spring 11
Occupational employment of work-ers without disabilities and work-ers with disabilities, April 2009 (chart). Summer 09
On the grid: Careers in energy. Fall 08
Paid to persuade: Careers in sales. Summer 11
Patent work: The other side of invention. Fall 09
Policy analysts: Shaping society through research and problem-solving. Spring 07
Psychometrician. (You’re a what?) Fall 11
Recycling coordinator. (You’re a what?) Winter 10–11
Sky-high careers: Jobs related to airlines. Summer 07
Solar photovoltaic installer. (You’re a what?) Fall 09
Spectator sports employment by metropolitan area, 2007 annual averages (chart). Spring 09
STEM occupations: High-tech jobs for a high-tech economy. Spring 07
Toy jobs: Work in the business of play. Winter 08–09
Voice actor. (You’re a what?) Summer 09
Wind turbine service technician. (You’re a what?) Fall 10
Work for play: Careers in video game development. Fall 11
Working in politics. Summer 08Working vacations: Jobs in tourism
and leisure. Winter 10–11
Outlook and trends2006–16 job outlook in brief, The.
Spring 082008–18 job outlook in brief, The.
Spring 10Charting the projections: 2006–16.
Fall 07Charting the projections: 2008–18.
Winter 09–10Charting the projections: 2010–20.
Winter 11–12Employment, trends, and training in
information technology. Spring 09Fifty years of career information:
The Occupational Outlook, vol. 1, no. 1. Spring 07
Going “green”: Environmental jobs for scientists and engineers. Summer 09
Men and women in the working world (chart). Winter 08–09
Multiple jobholders, 2006 (chart). Winter 07–08
On the clock at 2 a.m. (chart). Spring 08
Parents and work, 2006 (chart). Summer 07
Quits versus layoffs (chart). Fall 11Temporary measures (chart). Fall 10Job outlook by education, 2006–16.
Fall 08
You’re a what?Admissions consultant. Spring 08Automation technician. Spring 10Cartoonist. Fall 08Chimney sweep. Summer 10Cobbler. Summer 07
Commercial diver. Winter 07–08Foley artist. Spring 11Framer. Spring 07Futurist. Spring 09Genetic counselors. Summer 11Home stager. Summer 08Limnologist. Winter 08–09Psychometrician. Fall 11Recycling coordinator. Winter 10–11Solar photovoltaic installer. Fall 09Voice actor. Summer 09Wind turbine service technician.
Fall 10
See the complete OOQ Online index atwww.bls.gov/ooq/ooqindex.htm

UNITED STATES POSTAL SERVICE™Statement of Ownership, Management, and Circulation (Required by 39 U.S.C. 3685)1. Publication Title Occupational Outlook Quarterly2. Publication No. 492-6903. Filing Date January 9, 20124. Issue Frequency Quarterly5. No. of Issues Published Annually 46. Annual Subscription Price $157. Complete Mailing Address of Known Office of Publication U.S. Department of Labor, Bureau of Labor Statistics 2 Massachusetts Avenue NE., Washington, DC 20212–00018. Complete Mailing Address of Headquarters or General Business Office of Publisher U.S. Department of Labor, Bureau of Labor Statistics 2 Massachusetts Avenue NE., Washington, DC 20212–00019. Full Names and Complete Mailing Address of Publisher, Editor, and Managing Editor Publisher U.S. Department of Labor, Bureau of Labor Statistics 2 Massachusetts Avenue NE., Washington, DC 20212–0001 Attn: Emily Lloyd Liddell Editor: Kathleen T. Green 2 Massachusetts Avenue NE., Washington, DC 20212–0001 Managing Editor: Drew Liming 2 Massachusetts Avenue NE., Washington, DC 20212–000110. Owner U.S. Department of Labor, Bureau of Labor Statistics 2 Massachusetts Avenue NE., Washington, DC 20212–000111. Known Bondholders, Mortgagees, and Other Security Holders Owning or Holding 1 Percent or More of Total Amount of Bonds, Mortgages, or Other Securities. If none, check here. x None12 Tax Status (Check one) The purpose, function, and nonprofit status of this organization and the exempt status for federal income tax purposes: ) x Has Not Changed During Preceding 12 Months Has Changed During Preceding 12 Months13. Publication Title Occupational Outlook Quarterly 14. Issue Date for Circulation Data Below Winter 2011–12
15. Extent and Nature of Circulation: Average no. No. copies copies each of single issue issue during published preceding 12 nearest to months filing date
a. Total No. Copies (Net Press Run) 5,155 5,155b. Paid Circulation (By Mail and Outside the Mail) (1) Mailed Outside-County Paid Subscriptions Stated on Form 3541 (Include paid distribution above nominal rate, advertiser’s proof copies, and exchange copies) 1,931 1,821 (2) Mailed In-County Paid Subscriptions Stated on PS Form 3541 (Include paid distribution above nominal rate, advertiser’s proof copies, and exchange copies) N/A N/A (3) Paid Distribution Outside the Mails Including Sales Through Dealers and Carriers, Street Vendors, and Counter Sales, and other Paid Distribution Outside USPS® 56 5 (4) Paid Distribution by Other Classes of Mail Through USPS N/A N/Ac. Total Paid Distribution (Sum of 15b (1), (2), (3), and (4)) 1,987 1,826 d. Free or Nominal Rate Distribution (by Mail and Outside the Mail) (1) Free or Nominal Rate Outside-County Copies Included on PS Form 3541 2,038 2,038 (2) Free or Nominal Rate In-County Copies Included on PS Form 3541 N/A N/A (3) Free or Nominal Rate Copies Mailed at Other Classes Through USPS 65 65 (4) Free or Nominal Rate Distribution Outside the Mail (Carriers or other means) 375 375e. Total Free or Nominal Rate Distribution (Sum of 15d (1), (2), (3), and (4)) 2,478 2,478f. Total Distribution (Sum of 15c and 15e) 4,465 4,465g. Copies Not Distributed 399 399h. Total (Sum of 15f and g) 4,864 4,864i. Percent Paid (15c divided by 15f times 100) 44.5% 40.9%
16. If the publication is a general publication, publication of this statement is required. Will be printed in the Winter 2011–12 issue of this publication. 17. Signature and Title of Editor, Publisher, Business Manager, or Owner Date
(signed) Kathleen T. Green 01/09/2012
I certify that all information furnished on this form is true and complete. I understand that anyone who furnishes false or misleading information on this form or who omits material or information requested on the form may be subject to criminal sanctions (including fines and imprisonment) and/or civil sanctions (including civil penalties).
Available online in 2012:
• Detailed articles about the projections (February 2012 Monthly Labor Review)• Completely revised online edition of Occupational Outlook Handbook (spring 2012)• “The job outlook in brief,” summarizing the Handbook (spring 2012 OOQ) For more information, visit the Employment Projections website, www.bls.gov/emp.
They’re here: 2010–20 projections!Biennial projections of occupations, industries, the labor force, and the economy between 2010 and 2020 from the U.S. Bureau of Labor Statistics

U.S. BUREAU OF LABOR STATISTICSPostal Square Building, Rm. 28502 Massachusetts Ave., NEWashington, DC 20212–0001
Inside this special issue:
2010–20 projections of• Occupationalemployment• Laborforce• Industryemployment• Economicgrowth