charter school performance in texas - stanford university 2017.pdf · level administrative records...
TRANSCRIPT

authorize
8/2/2017
Charter School Performance in Texas
ii
© 2017 CREDO Center for Research on Education Outcomes Stanford University Stanford, CA http://credo.stanford.edu CREDO, the Center for Research on Education Outcomes at Stanford University, was established to improve empirical evidence about education reform and student performance at the primary and secondary levels. CREDO at Stanford University supports education organizations and policymakers in using reliable research and program evaluation to assess the performance of education initiatives. CREDO’s valuable insight helps educators and policymakers strengthen their focus on the results from innovative programs, curricula, policies and accountability practices.
Acknowledgements
CREDO gratefully acknowledges the support of Texas Education Agency who contributed their data to this partnership. Our data access partnerships form the foundation of CREDO's work, without which studies like this would be impossible. We strive daily to justify the confidence you have placed in us.
The views expressed herein do not necessarily represent the positions or policies of the organizations noted above. No official endorsement of any product, commodity, service or enterprise mentioned in this publication is intended or should be inferred. The analysis and conclusions contained herein are exclusively those of the authors, are not endorsed by any of CREDO’s supporting organizations, their governing boards, or the state governments, state education departments or school districts that participated in this study. The conclusions of this research do not necessarily reflect the opinions or official position of the Texas Education Agency, the Texas Higher Education Coordinating Board, or the State of Texas.

iii
Introduction ................................................................................................................................................. 1
Study Approach ............................................................................................................................................ 3
1. Texas Charter School Landscape ............................................................................................................. 7
Texas Charter School Demographics ............................................................................................. 7
Overall Charter School Impact ..................................................................................................... 11
Charter School Impact for the 2011-2014 Cohort ........................................................................ 13
Charter School Impact by Growth Period .................................................................................... 14
TPS and Charter Mean Achievement ............................................................................................ 15
2. Overall Charter Student Analysis ........................................................................................................... 19
Charter School Impact by Race/Ethnicity .................................................................................... 19
Charter School Impact with Students in Poverty ........................................................................ 23
Charter School Impact with Race/Ethnicity and Poverty ............................................................ 24
Charter School Impact with Special Education Students ........................................................... 28
Charter School Impact with English Language Learners ............................................................ 30
Charter School Impact by Students’ Years of Enrollment ........................................................... 31
3. Overall Charter School Analysis ............................................................................................................. 33
School–level Analysis .................................................................................................................... 33
Charter School Impact by School Locale ..................................................................................... 36
Charter School Impact by School Level ....................................................................................... 37
4. Analysis by Charter School Type ............................................................................................................ 39
Impact of Charter Management Organizations ........................................................................... 39
Impact of Charter School Networks ............................................................................................. 41
Impact of Online Charter Schools ................................................................................................ 43
Impact of Campus and Open-Enrollment Charter Schools ......................................................... 45
Impact of Campus and Open-Enrollment Charter Schools by Race/Ethnicity ........................... 48
Impact of Campus and Open-Enrollment Charter Schools on Students in Poverty .................. 50
Table of Contents

iv
Impact of Campus and Open–Enrollment Charter Schools on Students in Special Education 51
Impact of Campus and Open-Enrollment Charter Schools on English Language Learners ...... 53
Impact of Campus and Open-Enrollment Charter Schools by School Level .............................. 55
Alternative Education Campuses ................................................................................................. 58
Impact of Dropout Recovery Charter Schools ............................................................................. 62
School Closure and School Replication ....................................................................................... 62
Synthesis and Conclusions ........................................................................................................................ 70
Implications ................................................................................................................................................ 73
Technical Appendix .................................................................................................................................... 75

v
Figure 1: CREDO Virtual Control Record Methodology .............................................................................. 5
Figure 2: Opened and Closed Charter Campuses, 2011 to 2014 ............................................................... 7
Figure 3: Average Learning Gains in Texas Charter Schools Compared to Gains for VCR Students ...... 12
Figure 4: Comparison of Texas Growth from the 2013 National Charter Study, Texas 2015 Study and
Texas 2017 Study ...................................................................................................................................... 14
Figure 5: Impact by Growth Period, 2013-2015 ........................................................................................ 15
Figure 6: TPS VCR and Charter Reading Mean Achievement ................................................................... 17
Figure 7: TPS VCR and Charter Math Mean Achievement ........................................................................ 17
Figure 8: Learning Gains of Black Students Benchmarked Against Learning Gains of White TPS
Students .................................................................................................................................................... 20
Figure 8a: Relative Learning Gains for Black Charter School Students Benchmarked Against their
Black TPS Peers ......................................................................................................................................... 21
Figure 9: Learning Gains of Hispanic Students Benchmarked Against Learning Gains of White TPS
Students .................................................................................................................................................... 22
Figure 9a: Relative Learning Gains for Hispanic Charter School Students Benchmarked Against their
Hispanic TPS Peers ................................................................................................................................... 23
Figure 10: Overall Learning Gains for Students in Poverty Compared to Students not in Poverty, TPS
and Charter ................................................................................................................................................ 24
Figure 11: Learning Gains of Black Students in Poverty Benchmarked Against Learning Gains of White
TPS Students not in Poverty ..................................................................................................................... 25
Figure 11a: Relative Learning Gains for Black Charter School Students in Poverty Benchmarked
Against their Black TPS Peers in Poverty ................................................................................................. 26
Figure 12: Learning Gains of Hispanic Students in Poverty Benchmarked Against Learning Gains of
White TPS Students not in Poverty .......................................................................................................... 27
Figure 12a: Relative Learning Gains for Hispanic Charter School Students in Poverty Benchmarked
Against their Hispanic TPS Peers in Poverty ............................................................................................ 28
Table of Figures
vi
Figure 13: Overall Learning Gains for Students in Special Education Compared to Students not in
Special Education, TPS and Charter ........................................................................................................ 29
Figure 14: Overall Learning Gains for Students with ELL Designation Compared to non-ELL Students,
TPS and Charter ........................................................................................................................................ 30
Figure 15: Impact by Students’ Growth Period ........................................................................................ 32
Figure 16: Impact by School Locale .......................................................................................................... 37
Figure 17: Impact by School Level ............................................................................................................ 38
Figure 18: Average Student Learning Gains of CMO Charter Schools and Non-CMO Charter Schools
Benchmarked Against the Statewide Average TPS Student Learning Gains ......................................... 40
Figure 18a: Relative Student Learning Gains of CMO Charter Schools Benchmarked Against Learning
Gains of Non-CMO Charter Schools .......................................................................................................... 41
Figure 19: Comparison of Student Learning Gains for Students in Online and Brick and Mortar Charter
Schools Benchmarked against Learning Gains for TPS Students ........................................................... 44
Figure 19a: Comparison of Student Learning Gains in Online Charter Schools Benchmarked against
their Peers in Brick and Mortar Charter Schools ...................................................................................... 45
Figure 20: Comparison of Student Learning Gains in Campus and Open-Enrollment Charter Schools
Benchmarked against Learning Gains of TPS Students .......................................................................... 46
Figure 20a: Relative Learning Gains for Students in Campus Charter Schools Benchmarked against
their Peers in Open-Enrollment Charter Schools .................................................................................... 47
Figure 21: Learning Gains of Black Students in Campus Charters, Open-Enrollment Charters and TPS
Benchmarked Against Learning Gains of White TPS Students ............................................................... 48
Figure 22: Learning Gains of Hispanic Students in Campus Charters, Open-Enrollment Charters and
TPS Benchmarked Against Learning Gains of White TPS Students ........................................................ 49
Figure 23: Overall Learning Gains for Students in Poverty compared to Students not in Poverty; TPS,
Campus Charters and Open-Enrollment Charters ................................................................................... 51
Figure 24: Overall Learning Gains of Students in Special Education Compared to Students not
enrolled in Special Education; TPS, Campus Charters and Open-Enrollment Charters ........................ 52
Figure 25: Overall Learning Gains of ELL Students Compared to non-ELL Students; TPS, Campus
Charter and Open-Enrollment Charter .................................................................................................... 54
Figure 26: Learning Gains of Campus and Open-Enrollment Charter School Students by School Level
Benchmarked Against Learning Gains of TPS Students – Reading ......................................................... 56

vii
Figure 27: Learning Gains of Campus and Open-Enrollment Charter School Students by School Level
Benchmarked Against Learning Gains of TPS Students – Math .............................................................. 57
Figure 28: Relative Learning Gains of Campus Charter School Students by School Level Benchmarked
Against their Peers in Open-Enrollment Charter School ......................................................................... 58
Figure 29: Average Student Learning Gains of Alternative Education Charter Campuses and Non-
Alternative Charter Schools Benchmarked Against Statewide Average TPS Student Learning Gains . 60
Figure 29a: Relative Student Learning Gains of Alternative Education Charter Campuses
Benchmarked Against Student Learning Gains of Non-Alternative Charter Schools ............................ 61
Figure 30: Closure Scenarios: Reading ..................................................................................................... 65
Figure 31: Closure Scenarios: Math .......................................................................................................... 65
Figure 32: Replication Scenarios: Reading ............................................................................................... 68
Figure 33: Replication Scenarios: Math .................................................................................................... 68

viii
Table 1: Demographic Comparison of Students in TPS, Feeders and Charters (SY 2014-15) .................. 8
Table 2: Demographic Composition of Charter Students in the Study..................................................... 9
Table 3: Transformation of Average Learning Gains in Reading and Math ............................................ 13
Table 4: Charter School Impact on Student Subgroup Performance ..................................................... 31
Table 5: Performance of Charter Schools Compared to Their Local Schools in Texas .......................... 34
Table 6: Reading Growth and Achievement ............................................................................................. 35
Table 7: Math Growth and Achievement .................................................................................................. 36
Table 8: Top 10 Percent of Charter School Networks in Texas based on Growth Effect Size ................ 42
Table 9: Bottom 10 Percent of Charter School Networks in Texas based on Growth Effect Size .......... 43
Table 10: Campus and Open-Enrollment Charter School Impact on Student Subgroup Performance 55
Table 11: Number of Schools Closed Under Each Scenario .................................................................... 63
Table 12: Effects of Closure Scenarios ..................................................................................................... 64
Table 13: Number of Schools Replicated Under Each Scenario ............................................................. 66
Table 14: Effects of Replication Scenarios ............................................................................................... 67
Appendix Table 1: Summary of Statistical Significance of Findings for Texas Charter School Students
Benchmarked Against White TPS Students (unless otherwise specified) .............................................. 75
Appendix Table 2: Number of Observations for All Results ..................................................................... 77
Appendix Table 3: Subgroups with a Small N .......................................................................................... 78
Appendix Table 4: Charter School Networks in Texas Reading and Math Growth Effect Size ............... 79
Table of Tables

1
Introduction In an evolving public education landscape, charter school education reaches increasing numbers of students each year. While the expansion of charter schools may be evident, questions about their efficacy still arise. Similar debate has occurred in Texas since before the passage of the first enabling law in 1995. Charter school advocates hail the benefits of the sector such as increasing parental choice and introducing new school models. Opponents decry the reallocation of funds away from district schools as an existential threat to district organizations and the mismatch between district and charter student profiles as evidence of neglecting hard to serve students. Only a fraction of that debate is grounded in well researched evidence about charter schools’ impact on student outcomes. The need for evidence about charter school performance is especially strong in Texas. During the 2013-14 legislative session, the Texas State Senate passed Senate Bill 2 ushering in stricter charter school regulations. In particular, SB2 requires the Texas Education Agency to revoke a school’s charter if that school fails to meet academic and/or financial accountability benchmarks for three consecutive years. This report provides evidence for charter students’ performance in Texas over four years of schooling, beginning with the 2011-2012 school year and ending with the 2014-2015 school year. The added benefit of this particular data window is the ability to see if the updated charter School Law (SB2) has had any effect on overall charter school performance. The current study was supported by The Brackenridge Foundation and the Ewing Halsell Foundation. With the cooperation of the Texas Education Agency (TEA), CREDO obtained historical sets of student-level administrative records through the Texas Schools Project (TSP) at the University of Texas at Dallas. The support of the TEA and TSP staff was critical to CREDO's understanding of the character and quality of the data we received. However, it is important to note that those interactions dealt only with technical issues related to the data. CREDO has developed the findings and conclusions presented here independently. This report is the third in-depth examination of the impact of charter schools in Texas on student performance. Earlier studies of the performance of charter schools in Texas can be found on the CREDO website. 1 This current report has two main benefits. First, it provides a rigorous and independent view of the current performance of the state’s charter schools. Second, the study design is consistent with CREDO’s reports on charter school performance in other locations, making the results amenable to benchmarking Texas results over time and against charter schools in other locations. There are six areas of analyses contained within the four sections of the report. We first present the effects of charter schools on student academic performance. These results are expressed in terms of
1 CREDO. Charter School Performance in Texas (2015). http://credo.stanford.edu/pdfs/Texas_report_2015.pdf

2
the academic progress that a typical charter school student in Texas would realize from a year of enrollment in a charter school. To help the non-technical reader grasp the findings, we translate the scientific estimates into estimated days of learning based on a typical 180-day school year. The second set of findings concerns the impact of charter schooling at the school level and by school locale. Both legislation and public policy operate to influence school level decisions so it is important to understand the range of performance for these schools. These findings look at the performance of students by school and present school average results. The third set of analyses examines the performance of charter schools grouped by charter school networks. In Texas, as in the rest of the nation, charter school networks are comprised of either charter management organizations or management service companies, or a combination of both. These analyses aim to discern whether there are differences between schools that are part of these charter networks versus charter schools that operate independently. The fourth set of analyses illustrates the impact of online charter schools in Texas, also referred to as cyber charter schools. Online education in Texas is part of a growing landscape aiming to serve students with unique learning circumstances and students who experience a great deal of mobility. Our analysis focuses on charter schools that provide full-time online education and excludes programs that incorporate online instruction as a portion of a blended educational model. The fifth set of analyses examines the performance of campus charter schools and open-enrollment charter schools. In Texas, charter schools can be funded in two ways: Open-Enrollment Charter Schools receive funding directly from budgets approved by the Texas Education Agency; Campus Charter Schools receive money indirectly from an independent school district which allocates the funds coming from the TEA. This portion of the report will compare the growth of campus charter students to the growth of their peers in open-enrollment charter schools. This analysis will also compare the growth of students attending either campus charter schools or open-enrollment charter schools with the growth of students attending traditional public schools. The sixth set of analyses examines the impact of alternative charter education campuses on the learning outcomes of Texas students. In Texas, alternative schools are defined as having 75 percent of their students at risk of dropping out. In Texas, a student meets the “at-risk” designation if they fall into one of 13 categories including: having ever been retained in grade, currently homeless, or being an English Language Learner.2 These analyses examine how Texas’ alternative charter campuses academically serve their unique populations.
2 A full list of Texas education Agency’s “At Risk” Indicators: http://ritter.tea.state.tx.us/peims/standards/1314/index.html?e0919

3
The findings of this study show that on average, charter students in Texas experience stronger annual growth in reading and similar growth in math compared to the educational gains of their matched peers who enroll in the traditional public schools (TPS) the charter school students would otherwise have attended. The impact on reading gains is statistically significant. Thinking of a 180-day school year as "one year of learning", an average Texas charter student exhibits growth equivalent to completing 17 additional days of learning in reading each year. When compared to the findings of earlier studies of Texas charter school performance, the overall results show improvement in both subjects. The average learning impacts of the two earlier studies were statistically significantly negative for both reading and math. With a positive and significant impact for reading gains and break-even results for math progress, the collective performance of Texas charter schools has improved. This trend is reinforced by the year-by-year results. Looking at the three growth year periods of this study separately, the trends for reading and math are both positive. By the final period of the study there is statistically significant growth in both reading and math. Additionally, the analysis reveals certain subgroup differences: Hispanic charter students and Hispanic charter students in poverty exhibit stronger growth than their TPS peers, but Black charter students do not. Students in Special Education and English Language Learners fare equal or better in TPS than in charter schools.
Study Approach
This study of charter schools in Texas focuses on the academic progress (growth) of enrolled and tested students in Texas’ charter schools. Whatever else charter schools may provide their students, their contributions to their students’ readiness for secondary education, high school graduation, and post-secondary life remains of paramount importance. If charter schools do not succeed in forging strong academic futures for their students, it is unclear whether social and emotional skills can compensate. Furthermore, current data limitations prevent the inclusion of non-academic outcomes in this analysis. This statewide analysis uses the Virtual Control Record (VCR) methodology that has been used in previous CREDO publications.3,4,5 The approach is a quasi-experimental study design with matched
3 Cremata, Edward, D. Davis, K. Dickey, K. Lawyer, Y. Negassi, M. Raymond and J.Woodworth. National Charter School Study 2013 (2013). http://credo.stanford.edu. 4 CREDO Urban Charter School Study (2015). http://urbancharters.stanford.edu/download/Urban%20Charter%20School%20Study%20Report%20on%2041%20Regions.pdf

4
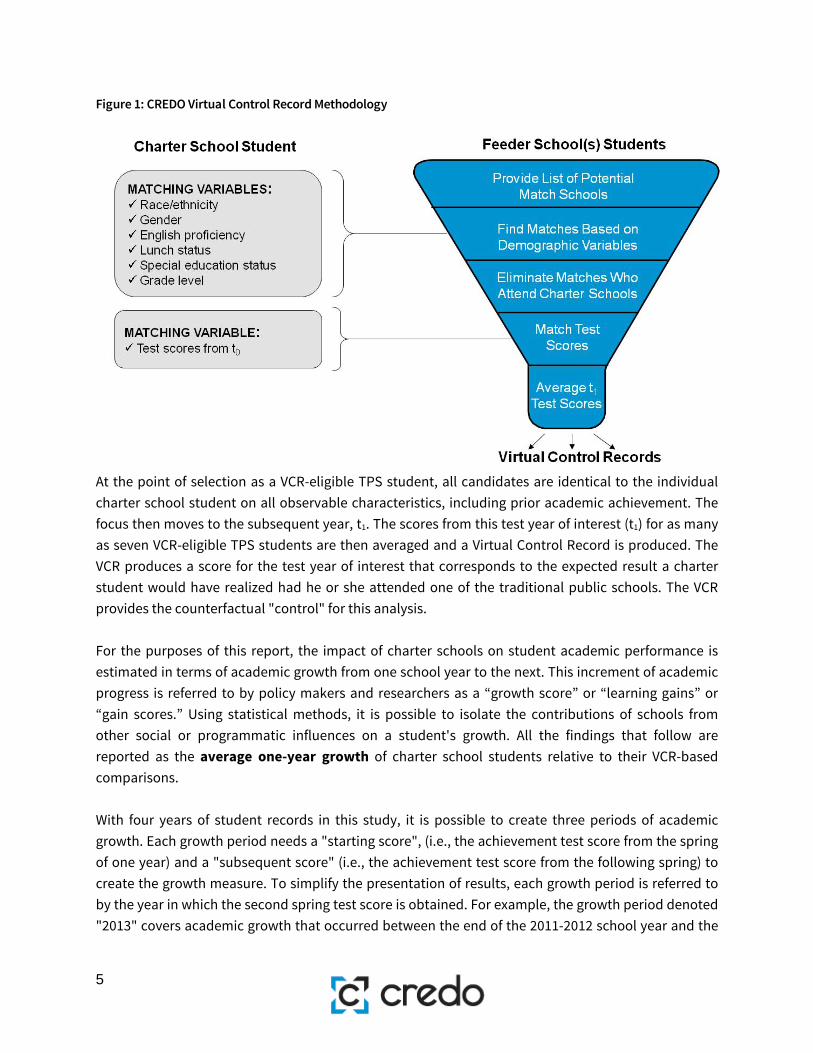
student records that are followed over time. The current analysis examines whether students in charter schools in Texas outperform their traditional public school (TPS) counterparts. This general question is then extended to consider whether the observed charter school performance is consistent when the charter school population is disaggregated along a number of dimensions, such as race/ethnicity and years enrolled in a charter school. In order to answer these questions, we must isolate the effect of both the charter schools and the traditional public schools from other potentially confounding influences. For this reason, the analysis includes controls for student characteristics: prior academic achievement, race/ethnicity, special education status, poverty (measured by participation in free or reduced price lunch program) English proficiency, grade level, and retention in grade. To create a reliable comparison group for our study, we strive to build a VCR for each charter school student. A VCR is a synthesis of the actual academic experiences of students who are identical to the charter school student, except for the fact that the VCR students attend a TPS that each charter school’s students would have attended if not enrolled in the charter school. We refer to the VCR as a ‘virtual twin’ because it consolidates the experience of multiple ‘twins’ into a single synthesis of their averaged academic performance. This synthesized record is then used as the counterfactual condition to the charter school student’s performance. Our approach is displayed in Figure 1. We identify all the traditional public schools whose students transfer to a given charter school; each of these schools is designated as a “feeder school.” Once a TPS qualifies as a feeder school for a particular charter school, all the students in that traditional public school become potential matches for a student in that particular charter school. All the student records from all the feeder schools are pooled to become the source of records for creating the virtual match. Using the records of the students in those schools in the year prior to the test year of interest (t0), CREDO selects all of the available TPS students that match each charter school student. Match factors include:
• Grade level • Gender • Race/Ethnicity • Free or Reduced Price Lunch Status • English Language Learner Status • Special Education Status • Prior test score on Texas state achievement tests
5 Woodworth, James, K. Chirbas, M. Gonzalez, Y. Negassi, M. Raymond W. Snow, and C. VanDonge. Online Charter School Study (2015). https://credo.stanford.edu/pdfs/Online%20Charter%20Study%20Final.pdf.
5
Figure 1: CREDO Virtual Control Record Methodology
At the point of selection as a VCR-eligible TPS student, all candidates are identical to the individual charter school student on all observable characteristics, including prior academic achievement. The focus then moves to the subsequent year, t1. The scores from this test year of interest (t1) for as many as seven VCR-eligible TPS students are then averaged and a Virtual Control Record is produced. The VCR produces a score for the test year of interest that corresponds to the expected result a charter student would have realized had he or she attended one of the traditional public schools. The VCR provides the counterfactual "control" for this analysis. For the purposes of this report, the impact of charter schools on student academic performance is estimated in terms of academic growth from one school year to the next. This increment of academic progress is referred to by policy makers and researchers as a “growth score” or “learning gains” or “gain scores.” Using statistical methods, it is possible to isolate the contributions of schools from other social or programmatic influences on a student's growth. All the findings that follow are reported as the average one-year growth of charter school students relative to their VCR-based comparisons. With four years of student records in this study, it is possible to create three periods of academic growth. Each growth period needs a "starting score", (i.e., the achievement test score from the spring of one year) and a "subsequent score" (i.e., the achievement test score from the following spring) to create the growth measure. To simplify the presentation of results, each growth period is referred to by the year in which the second spring test score is obtained. For example, the growth period denoted "2013" covers academic growth that occurred between the end of the 2011-2012 school year and the

6
end of the 2012-2013 school year. Similarly, the growth period denoted "2014" corresponds to the year of growth between the 2012-2013 and the 2013-2014 school years. With four years of data, each subject-grade-year group of scores has slightly different mid-point averages and distributions. For end-of-course assessments (EOCs) there are only subject-year groups because EOCs are not grade specific. This means a student takes this assessment after completing the course, no matter what grade they are in. Scores for all these separate tests are transformed to a common scale. All test scores have been converted to "bell curve" standardized z-scores to allow year-to-year computations of growth.6 When scores are standardized into z-scores, every student is placed relative to their peers in the entire state of Texas. A student scoring in the 50th percentile in Texas receives a z-score of zero, while a z-score one standard deviation above that would place a student in the 84th percentile. Students who maintain their relative place from year to year would have a growth score of zero, while students who make larger gains relative to their peers will have positive growth scores. Conversely, students who make smaller academic gains than their peers will have negative growth scores in that year.
6 For each subject-grade-year set of scores, scores are centered around a standardized midpoint of zero, which corresponds to the actual average score of the test before transformation. Then each score of the original test is recast as a measure of deviation around that new score of zero, so that scores that fall below the original average score are expressed as negative numbers and those that are larger receive positive values. These new values are assigned such that in every subject-grade-year test, 68 percent of the original test scores fall within a given distance, known as the standard deviation.

7
1. Texas Charter School Landscape
Texas Charter School Demographics The Texas charter school sector has grown since its inception in 1996. Figure 2 notes the newly opened, continuing, and closed charter school campuses from the Fall of 2011 (the Fall of the first growth period covered by the current study) to the Fall of 2014 (the Fall of the last potential growth period for the current study).7 According to the National Center for Education Statistics (NCES), there were 724 charter schools open in Texas during the 2014-15 school year. Figure 2: Opened and Closed Charter Campuses, 2011 to 2014
Figure 2 shows that SB 2 has had a clear impact on the continuation of schools in Texas. The number of schools whose status changed to “closed” in the 2014-2015 school year is nearly triple the number in earlier years. Additionally, the number of charter schools that opened each year has declined by over half. While many factors influence the pipeline of school openings, the steep drop in openings
7 “Opened schools” indicates schools opened as new schools in the fall of the displayed year. “Continuing schools” indicates schools that were opened prior to the fall of the displayed year and remain open into the next school year (i.e. a school listed as continuing in the 2014-15 column opened some time prior to 2014-15 and did not close in 2014-15) “Closed schools” indicates schools that ceased operation by the spring of the displayed year (i.e. a school listed as closed in the 2014-15 column had its last year of operation in 2014-15 and closed at the end of that school year)
4490 65 26
537565 631
638
9
17 21 60
0
100
200
300
400
500
600
700
800
900
2011-12 2012-13 2013-14 2014-15
# Opened # Continuing # Closed

8
suggest more rigorous review of a smaller pool of applications. Both factors are responses to the higher quality standards now operating in the legislative and regulatory environment. Charter schools are able to choose their location and thus the demographics of the charter sector may not mirror that of the TPS sector as a whole. Further, charter schools offer different academic programs and alternate school models which may disproportionately attract particular groups of students relative to TPS. In addition, parents and students choose to attend charter schools for a variety of reasons, such as location, school safety, small school size, academic focus, or special interest programs. The cumulative result of all these forces is that the student populations at charter schools and their TPS feeders may differ. Table 1 compares three student populations in the 2014-2015 school year: the full set of Texas traditional public schools, the subset of TPS from which charter schools draw, and the charter schools themselves. Table 1 shows the student profiles for the 659 charter schools in which students took reading and/or math assessments. Note that NCES reports 724 charter schools open in 2014-15. The difference stems from the fact that 65 charter schools did not have tested grades in 2014-2015. Table 1: Demographic Comparison of Students in TPS, Feeders and Charters (SY 2014-15)
Table 1 indicates that more than half of TPS in Texas are feeder schools for the state’s charters. The demographics for the feeders are nearly identical to the TPS population in Texas as a whole. However, the charter school population in Texas differs from both the Texas TPS and feeder populations on several demographic variables. Charter schools have a much smaller share of White students than other Texas public schools. Conversely, the proportion of Black students, Hispanic students, and students in poverty enrolled in charter schools is noticeably larger than in traditional public schools.
TPS Feeders Charters
Number of schools 8,089 4,967 659
Average enrollment per school 607 783 364
Total number of students enrolled 4,908,744 3,888,204 240,191
Students in Poverty 60% 60% 72%
English Language Leaners 17% 18% 20%
Special Education Students 9% 9% 7%
White Students 30% 27% 17%
Black Students 12% 13% 21%
Hispanic Students 51% 53% 60%
Native American Students 0% 0% 1%
Asian/Pacific Islander Students 4% 4% 6%
Multi-Racial Students 2% 2% 3%

9
Asian/Pacific Islander students and English Language Learners are also slightly more prevalent in charter schools than in other public schools. Policymakers and stakeholders continue to examine the degree to which students with special needs enroll in charter schools. The proportion of students in charter schools who are receiving Special Education services is a particular topic of debate. Table 1 shows nine percent of students in feeders and TPS overall have Special Education needs. In contrast, seven percent of the Texas charter school population has a designated Special Education status. This difference in percentages is smaller in Texas than other states. Table 2: Demographic Composition of Charter Students in the Study
The current study examines performance of students in charter schools who participated in annual accountability testing in Texas, occurring in grades 3 – 8 and in whatever grade the end-of-course assessment were taken. The test scores allow us to use a common measure of performance across schools and over time. However, in each period of the study, students who are enrolled in non-tested grades are not included in the study. This partially accounts for the differences in school and student counts compared to other published figures about the charter school population in Texas. For this analysis, we follow a total of 248,782 charter school students from 659 charter schools for as many years as data are available.8 The students are drawn from Grades 3 – 11, the grades covered by the state achievement testing program for reading and math or by the state end-of-course assessments. High school students are included for reading and math whenever they take the end-of-course assessment sequence in consecutive years, e.g., Algebra I, Geometry, and Algebra II. An identical number of virtual comparison records are included in the analysis in each subject. In Texas, it was possible to create virtual matches for 88 percent of the tested charter school students in both
8 Schools that opened recently or that only recently begun serving tested grades will not have three growth periods of experience to include. These schools are still included in the analysis for the years in which data are available
Number Percent Number PercentTexas Charter Students 283,415 248,782% Matched 248,782 88%Unique TX Charter Students Tested 186,600 157,047Black Students 34,524 19% 28,232 18%Hispanic Students 111,008 59% 97,141 62%White Students 29,363 16% 24,075 15%Students in Poverty 126,227 68% 107,950 69%Special Education Students 10,858 6% 6,931 4%English Language Learners 28,346 15% 23,514 15%Grade Repeating Students 8,478 5% 4,337 3%
Student GroupAll Charter Students Tested Matched Charter Students

10
reading and math.9 This proportion assures the results reported here are indicative of the overall performance of charter schools in the state. The total number of observations is large enough to have confidence that the tests of effect detect real differences between charter school and TPS student performance at the statistically acceptable standard of p<.05. Each student subgroup examined also had an acceptable number of observations, as reported in Table 2. Additional descriptive demographics can be found in Appendix Table 1.
9 This match rate compares favorably with the 85% match rate reported in the National Charter School Study 2013. https://credo.stanford.edu/documents/NCSS%202013%20Final%20Draft.pdf. p.18.

11
Overall Charter School Impact
The primary question of this study is whether charter schools differ overall from traditional public schools in how much their students learn. To answer this question, we examine academic gains of students from the Spring of one school year to the Spring of the next year on state standardized assessments. This increment of learning is referred to as academic growth or gains. To estimate the impact of charter schooling in general, we average all the one-year gains for all students attending Texas charter schools during the most recent three growth periods and compare the resulting average gain with that of the VCR students. The bars in Figure 3 represent the typical difference in the annual growth of charter school students compared to their VCR peers from the feeder schools. On average, students in Texas charter schools experience stronger growth than students in Texas TPS (the VCR students) in reading. Texas charter students show similar but non-significant growth in math. Based on the transformations we present in Table 3, this advantage for charter students is equivalent to approximately 17 additional days of learning in reading in a 180-day school year. Because student growth in math was not statistically significant, Texas charter students experienced similar growth in the 180 day period as they would have in a traditional school setting.
Graphics Roadmap
The graphics in this report have a common format.
Each graph presents the average performance of charter students relative to their pertinent comparison student. The reference group differs depending on the specific comparison. Where a graph compares student subgroup performance, the pertinent comparison student is the same for both subgroups. Each graph is labeled with the pertinent comparison group for clarity.
The height of the bars in each graph reflects the magnitude of difference between traditional public school and charter school performance over the period studied.
Stars are used to reflect the level of statistical significance of the difference between the group represented in the bar and its comparison group of similar students in TPS. The absence of stars means that the schooling effect is not statistically different from zero.

12
Figure 3: Average Learning Gains in Texas Charter Schools Compared to Gains for VCR Students
The data are analyzed in units of standard deviations of growth so that the results can be assessed for statistical differences. Unfortunately, these units do not have much meaning for the average reader. Transforming the results into more accessible units is challenging and can be done only imprecisely. Table 3 below presents a translation of standard deviation units to Days of Learning. While we can be confident of the transformation of values close to the zero mean, extreme values in excess of .25 standard deviations may be less accurate.10
10 The Days of Learning computation uses 4th and 8th grade test scores from the National Assessment of Educational Progress and individual state test results developed by Hanushek et al. The values in Table 3 are updated from past reports using more recent NAEP scores, which show slower absolute annual academic progress than earlier administrations. Hanushek, Eric A. P.E. Peterson, & L. Woessmann. Achievement Growth: International and U.S. State Trends In Student Performance. Education Next, (2012) Vol. 12, 1–35.
.03**
.01
-57
-29
00
29
57
-.10
-.05
.00
.05
.10
Days
of L
earn
ing
Grow
th (i
n st
anda
rd d
evia
tion
s)
* Significant at p < 0.05 ** Significant at p < 0.01
Reading Math

13
Table 3: Transformation of Average Learning Gains in Reading and Math
In order to understand “days of learning,” consider a student whose academic achievement is at the 50th percentile in one grade and the next year also at the 50th percentile in the following grade. That particular student is the benchmark of one year of academic progress over that period. We equate that increment to 180 days of learning. Every other student’s progress is then transformed using the values in Table 3 against the 180 days-of-learning benchmark. Thus a student with academic growth of .05 standard deviations would have yearly progress of 209 days of learning (180 days plus 29) over the period. It is possible to translate the standard deviations of growth from our models based on that 180-day average year of learning. Students with positive effect sizes have additional growth more than the expected 180 days of academic progress in a year’s time. Those students with negative effect sizes have fewer days of academic progress in that same 180-day period of time.
Charter School Impact for the 2011-2014 Cohort
Given the growing number of charter schools in Texas, charter performance has considerable influence on the fates of large numbers of Texas school children and on the larger picture of charter schools across the nation. CREDO has focused on Texas repeatedly over the years. This section provides a comparison between the performances of Texas charter schools across three of CREDO’s studies: CREDO’s 2013 study on national charter school performance11, CREDO’s 2015 study on the Texas charter school performance 12 , and this current 2017 study on Texas charter school performance.
11 CREDO. National Charter School Study (2013). https://credo.stanford.edu/documents/NCSS%202013%20Final%20Draft.pdf 12 CREDO. Charter School Performance in Texas (2015). https://credo.stanford.edu/pdfs/Texas_report_2015.pdf
Growth (in standard deviations)
Gain (in days of math
learning)0.00 00.05 290.10 570.15 860.20 1140.25 1430.30 1710.35 200

14
Figure 4 shows Texas charter schools have improved over time. The current study reports stronger academic growth in both reading and math compared to the earlier reports. In the 2013 report, Texas charter school students experienced growth equivalent to 17 fewer days of learning in reading and 23 fewer days in math when compared to their VCRs. In the 2015 report on Texas Charter School Performance, charter students experienced growth equivalent to 11 fewer days in reading and 23 fewer days in math than their VCRs. Figure 4: Comparison of Texas Growth from the 2013 National Charter Study, Texas 2015 Study and Texas 2017 Study
The most recent results are positive in two ways. Not only do they show a positive shift over time, but the values themselves are both positive for the first time. We explore that result further in the following section.
Charter School Impact by Growth Period
To determine whether performance was consistent over recent time, the average charter school effects were disaggregated into the three growth periods of this 2017 study. Results are shown in Figure 5.
-.03**-.02**
.03**
-.04** -.04**
.01
-57
-29
00
29
57
-.10
-.05
.00
.05
.10
Texas Growth from 2013National Charter Study
2015 Texas Study 2017 Texas Study
Days
of L
earn
ing
Grow
th (i
n st
anda
rd d
evia
tion
s)
* Significant at p < 0.05 ** Significant at p < 0.01
Reading Math
15
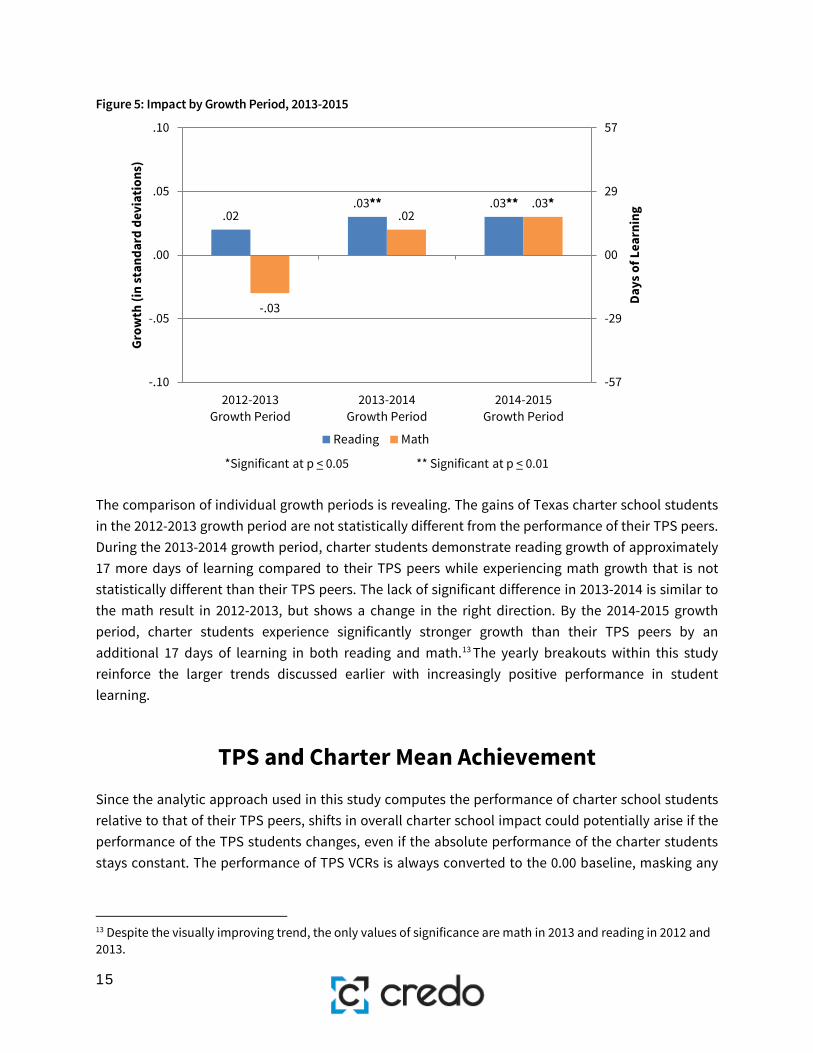
Figure 5: Impact by Growth Period, 2013-2015
The comparison of individual growth periods is revealing. The gains of Texas charter school students in the 2012-2013 growth period are not statistically different from the performance of their TPS peers. During the 2013-2014 growth period, charter students demonstrate reading growth of approximately 17 more days of learning compared to their TPS peers while experiencing math growth that is not statistically different than their TPS peers. The lack of significant difference in 2013-2014 is similar to the math result in 2012-2013, but shows a change in the right direction. By the 2014-2015 growth period, charter students experience significantly stronger growth than their TPS peers by an additional 17 days of learning in both reading and math.13 The yearly breakouts within this study reinforce the larger trends discussed earlier with increasingly positive performance in student learning.
TPS and Charter Mean Achievement
Since the analytic approach used in this study computes the performance of charter school students relative to that of their TPS peers, shifts in overall charter school impact could potentially arise if the performance of the TPS students changes, even if the absolute performance of the charter students stays constant. The performance of TPS VCRs is always converted to the 0.00 baseline, masking any
13 Despite the visually improving trend, the only values of significance are math in 2013 and reading in 2012 and 2013.
.02.03** .03**
-.03
.02.03*
-57
-29
00
29
57
-.10
-.05
.00
.05
.10
2012-2013Growth Period
2013-2014Growth Period
2014-2015Growth Period
Days
of L
earn
ing
Grow
th (i
n st
anda
rd d
evia
tion
s)
*Significant at p < 0.05 ** Significant at p < 0.01
Reading Math

16
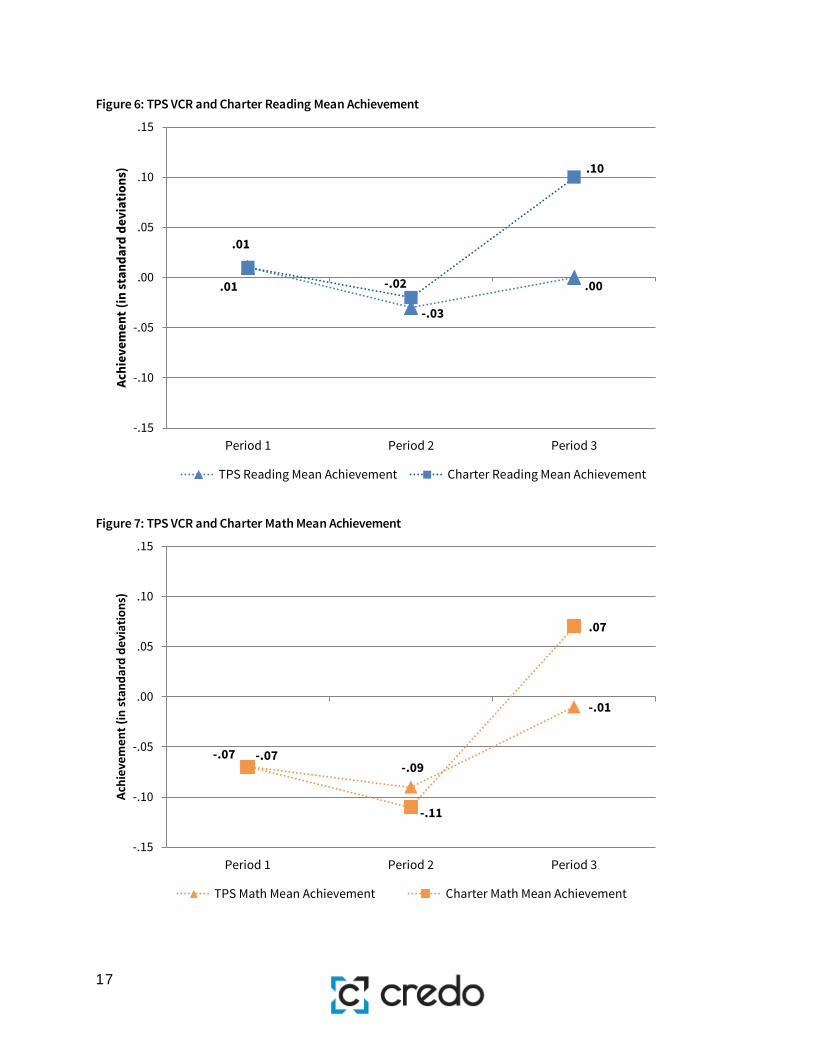
possible trends. To check this possibility, we graphed the achievement of charter students and their TPS VCRs to calculate reading and math trends across the years of the study. Our matching methods force the first-observed achievement scores to be the same for TPS and charter students. This appears in Figures 6 and 7 as overlapping data points. The concurrent dips in mean achievement in both subjects for charter and TPS VCR students coincide with the phasing out of the Texas Assessment of Knowledge and Skills (TAKS) in the spring of 2012 in favor of the State of Texas Assessments of Academic Readiness (STAAR) tests.14 Unfamiliarity with a new test can often affect student achievement levels in the year that the test is implemented. In Figure 6, the charter students and their TPS VCRs share a common level of reading achievement in the first period before demonstrating a drop in achievement during the second period. By the final period of the study, charter student achievement has outpaced that of their TPS VCRs. The VCRs show increased achievement between the final two periods, but their growth is not as dramatic as their charter counterparts. Figure 7 tells a similar story in math. Charter students and their VCRs exhibit similar achievement in their first period and charter math achievement dips below that of their VCRs in the second period. By the third period, charter achievement has again outpaced that of TPS VCRs, though the VCRs also exhibit increased achievement in final period.
14 Texas Education Agency (2017) http://tea.texas.gov/student.assessment/staar/
17
Figure 6: TPS VCR and Charter Reading Mean Achievement
Figure 7: TPS VCR and Charter Math Mean Achievement
.01
-.03
.00
.01
-.02
.10
-.15
-.10
-.05
.00
.05
.10
.15
Period 1 Period 2 Period 3
Achi
evem
ent (
in st
anda
rd d
evia
tion
s)
TPS Reading Mean Achievement Charter Reading Mean Achievement
-.07-.09
-.01
-.07
-.11
.07
-.15
-.10
-.05
.00
.05
.10
.15
Period 1 Period 2 Period 3
Achi
evem
ent (
in st
anda
rd d
evia
tions
)
TPS Math Mean Achievement Charter Math Mean Achievement

18
These figures lend credence to the charter growth effects found in this report. We see that the charter effect is not due to demonstrably poor achievement of the TPS students over time, but rather an increase in achievement for the charter school students.

19
2. Overall Charter Student Analysis
Charter School Impact by Race/Ethnicity Since the federal government’s passage of the No Child Left Behind Act in 2001, stakeholders have examined the difference between achievement levels for students of specific racial and ethnic backgrounds (also known as student subgroups). The same interest applies to charter schools, both in terms of overall achievement (what students know) and progress (how much students’ learning changes over time.) As shown in Table 2, Texas charter schools serve a diverse student population; their ability to support the progress of all students is an important focus of this study. This is particularly germane since many charter school providers intentionally locate their schools with an aim to serve communities where students have not been well served in the past. The data supports analysis of the learning outcomes of Black and Hispanic students. The small number of students who identify as Asian/Pacific Islander, Native American and Multi-Racial prevent separate breakouts for them, despite interest in the progress of those groups. The impact of charter schools on the academic gains of Black and Hispanic students is presented in Figures 8 through 9a below. Before sharing the findings, it is helpful to explain the way the results are presented. The results for each subgroup are presented in a pair of graphs, as follows:
1. The first graph displays the typical growth of TPS students and charter students in a particular subgroup of interest compared to the growth of the "average White VCR." The performance of the average White VCR is set to zero and the academic progress of the subgroup is displayed relative to the zero baseline. In this comparison, the White student is male and does not qualify for subsidized school meals, Special Education services, or English Language Learner support, and is not repeating his current grade. The values that appear in the left hand set of vertical bars represent the difference between the typical TPS student in the subgroup against the White TPS comparison student. The values in the right hand set of vertical bars represent the difference between the typical charter school student in the same subgroup of interest and the White VCR comparison student. The stars indicate the level of statistical significance. Thus, if there are no stars, we interpret the difference in growth as similar because we cannot determine if the observed differences are due to chance. If there is no difference in growth, the bar would be missing entirely. If the growth of the student group in question is weaker than the comparison baseline, the bar is negative. If the growth is stronger than the comparison, the bar is positive.
2. Graphs that include the designation “a” in the figure title display the results of a second
comparison testing whether the growth in the charter school student subgroup differs significantly from their VCRs in the same student subgroup. As with the first graph, stars denote statistical significance.
20
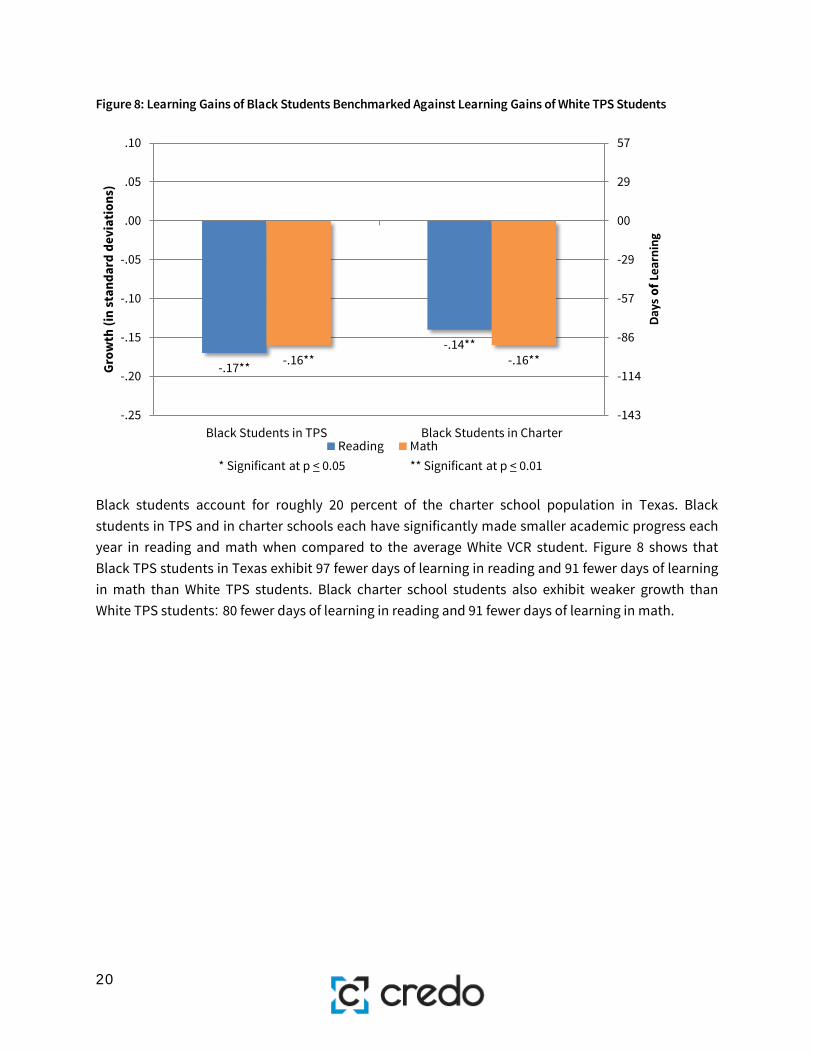
Figure 8: Learning Gains of Black Students Benchmarked Against Learning Gains of White TPS Students
Black students account for roughly 20 percent of the charter school population in Texas. Black students in TPS and in charter schools each have significantly made smaller academic progress each year in reading and math when compared to the average White VCR student. Figure 8 shows that Black TPS students in Texas exhibit 97 fewer days of learning in reading and 91 fewer days of learning in math than White TPS students. Black charter school students also exhibit weaker growth than White TPS students: 80 fewer days of learning in reading and 91 fewer days of learning in math.
-.17**
-.14**-.16** -.16**
-143
-114
-86
-57
-29
00
29
57
-.25
-.20
-.15
-.10
-.05
.00
.05
.10
Black Students in TPS Black Students in Charter
Days
ofL
earn
ing
Grow
th (i
n st
anda
rd d
evia
tion
s)
* Significant at p < 0.05 ** Significant at p < 0.01Reading Math

21
Figure 8a: Relative Learning Gains for Black Charter School Students Benchmarked Against their Black TPS Peers
Figure 8a displays the differences in learning growth between Black students enrolled in TPS and Black students enrolled in charter schools. In Texas, Black charter school students experience similar growth to their Black TPS peers in reading and math. While the current study finds similar growth for Black students in TPS and charter schools, it is important to note that the 2015 CREDO study on Texas charter school performance found Black charter students lagging behind their Black TPS peers in days of learning for both reading and math. Thus, the results for Black students in charter schools indicate improvement over time. Hispanic students make up the largest group of charter school students in Texas, amounting to nearly 60 percent of the population. Hispanic students in both settings have significantly weaker academic growth in math and reading compared to the average White TPS student. Compared to White TPS students, Hispanic TPS students experience 63 fewer days of learning in both reading and math in a year. Hispanic students in charter schools experience 34 fewer days of learning in reading and 46 fewer days of learning in math compared to White TPS students over the same time period.
.02.00
-143
-114
-86
-57
-29
00
29
57
-.25
-.20
-.15
-.10
-.05
.00
.05
.10
Days
of L
earn
ing
Grow
th (i
n st
anda
rd d
evia
tion
s)
* Significant at p < 0.05 ** Significant at p < 0.01Reading Math

22
Figure 9: Learning Gains of Hispanic Students Benchmarked Against Learning Gains of White TPS Students
Figure 9a displays the relative differences in learning between Hispanic students enrolled in TPS and Hispanic students enrolled in charter schools. Hispanic students in charter schools perform significantly better in both subjects than Hispanic students attending traditional public schools. Hispanic charter students experience the equivalent of 29 and 17 additional days of learning in reading and math respectively, compared to their Hispanic TPS VCRs. Similar to Black charter students, these findings demonstrate a marked improvement in performance since the 2015 CREDO study on Texas charter school performance. These findings have considerable weight in the overall performance of charter schools as a whole.
-.11**
-.06**
-.11**
-.08**
-114
-86
-57
-29
00
29
57
-.20
-.15
-.10
-.05
.00
.05
.10
Hispanic Students in TPS Hispanic Students in Charter
Days
of L
earn
ing
Grow
th (i
n st
anda
rd d
evia
tion
s)
* Significant at p < 0.05 ** Significant at p < 0.01
Reading Math
23
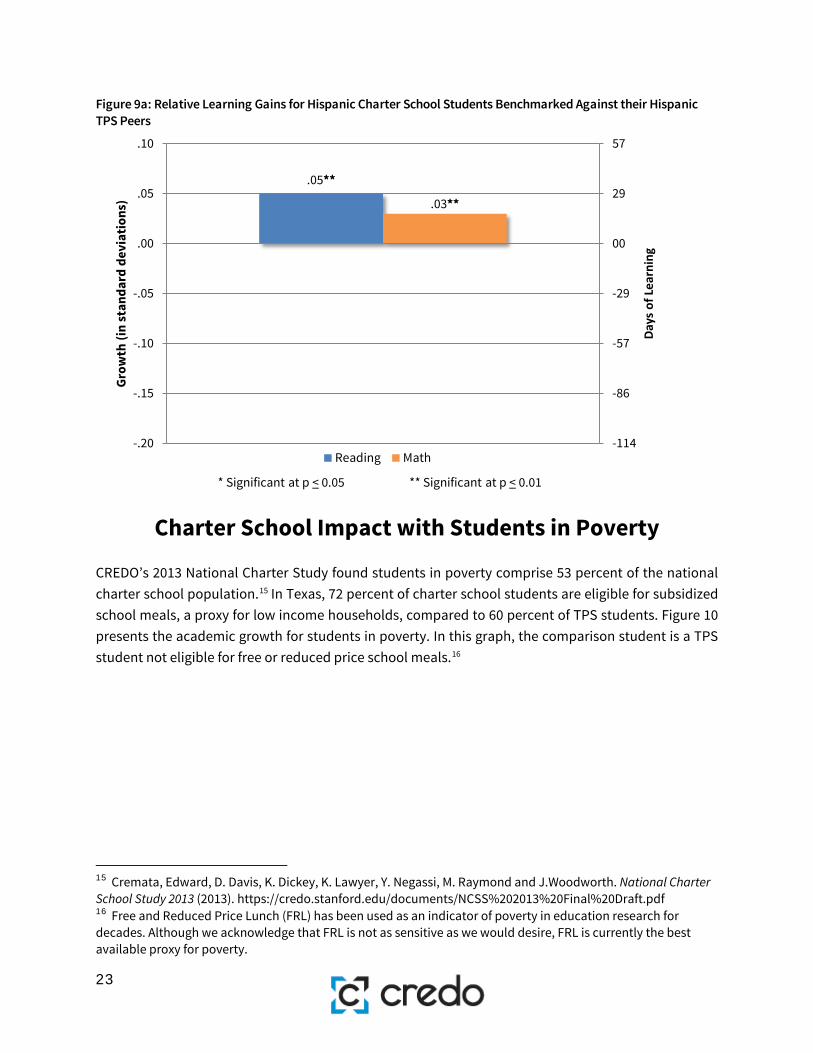
Figure 9a: Relative Learning Gains for Hispanic Charter School Students Benchmarked Against their Hispanic TPS Peers
Charter School Impact with Students in Poverty
CREDO’s 2013 National Charter Study found students in poverty comprise 53 percent of the national charter school population.15 In Texas, 72 percent of charter school students are eligible for subsidized school meals, a proxy for low income households, compared to 60 percent of TPS students. Figure 10 presents the academic growth for students in poverty. In this graph, the comparison student is a TPS student not eligible for free or reduced price school meals.16
15 Cremata, Edward, D. Davis, K. Dickey, K. Lawyer, Y. Negassi, M. Raymond and J.Woodworth. National Charter School Study 2013 (2013). https://credo.stanford.edu/documents/NCSS%202013%20Final%20Draft.pdf 16 Free and Reduced Price Lunch (FRL) has been used as an indicator of poverty in education research for decades. Although we acknowledge that FRL is not as sensitive as we would desire, FRL is currently the best available proxy for poverty.
.05**
.03**
-114
-86
-57
-29
00
29
57
-.20
-.15
-.10
-.05
.00
.05
.10
Days
of L
earn
ing
Grow
th (i
n st
anda
rd d
evia
tion
s)
* Significant at p < 0.05 ** Significant at p < 0.01
Reading Math

24
Figure 10: Overall Learning Gains for Students in Poverty Compared to Students not in Poverty, TPS and Charter
Since the standard for comparing students in poverty in both TPS and charter schools is a non-poverty TPS peer, the picture for charter students in poverty involves two sources of difference. First, students in poverty make less progress than their non-poverty peers, regardless of the school setting. For charter students there is the additional difference of charter versus TPS schooling. The values that appear for charter school students in poverty are the sum of both the overall difference between charter students and their TPS VCRs (.03 in reading and .01 in math) and the difference between charter students in poverty and charter students not in poverty (-.08 in reading and -.06 in math). Combining the two sets of differences results in the values in Figure 10 shows charter students in poverty fare better than their TPS VCRs in both reading and math by about 17 days of learning per year.
Charter School Impact with Race/Ethnicity and Poverty
According to the National Center for Education Statistics, Black and Hispanic students comprise the two race/ethnicity subgroups with the largest percentages of school-aged children in poverty. In 2015, 36 percent of Black children and 31 percent of Hispanic children were living in poverty. 17 These groups have the largest gaps in achievement compared to White non-poverty students. Remedies must address these disparities if equity in outcomes is to be attained. Funders and policy makers
17 Kids Count Data Center | Annie E. Casey Foundation (2016). http://datacenter.kidscount.org/data/tables/44-children-in-poverty-by-race-and-ethnicity#detailed/1/any/false/573,869,36,868,867/10,11,9,12,1,185,13/324,323
-.08**
-.05**
-.08**
-.05**
-86
-57
-29
00
29
57
-.15
-.10
-.05
.00
.05
.10
TPS Students in Poverty Charter Students in Poverty
Days
of L
earn
ing
Grow
th (i
n st
anda
rd d
evia
tion
s)
* Significant at p < 0.05 ** Significant at p < 0.01
Reading Math

25
include gap-closing among the desired results for charter schools. We subset the Black and Hispanic students in poverty to highlight the difference in impact for students in charter schools and their VCR peers and to examine the extent gaps are being addressed. The impact of Texas charter schools on the academic gains of Black students living in poverty is presented in Figures 11 and 11a. The impact of charter schools on Hispanic students living in poverty is presented in Figures 12 and 12a below. Adding the variable of poverty to the race/ethnicity analysis produces similar results to the earlier analysis on race/ethnicity alone. Figure 11: Learning Gains of Black Students in Poverty Benchmarked Against Learning Gains of White TPS Students not in Poverty
As shown in Figure 11, Black students living in poverty, enrolled in either TPS or charters, make less academic progress annually than White students who are not living in poverty. In Texas, Black TPS students in poverty experience approximately 148 fewer days of learning in reading and 143 fewer days of learning in math than White TPS students. Black charter students in poverty experience 131 fewer days of learning in reading and 137 fewer in math than White TPS students. Black students in poverty attending TPS or charter schools have weaker growth than White students are not living in poverty. Black students in poverty in TPS and charter have experienced improved performance since CREDO’s previous 2015 study on charter school performance in Texas.
-.26**-.23**-.25** -.24**
-171
-143
-114
-86
-57
-29
00
29
57
-.30
-.25
-.20
-.15
-.10
-.05
.00
.05
.10
Black TPS students in poverty Black Charter students in poverty
Days
of L
earn
ing
Grow
th (i
n st
anda
rd d
evia
tion
s)
* Significant at p < 0.05 ** Significant at p < 0.01
Reading Math

26
Figure 11a: Relative Learning Gains for Black Charter School Students in Poverty Benchmarked Against their Black TPS Peers in Poverty
Figure 11a shows Black charter students living in poverty experiencing equivalent growth in both subjects compared to Black TPS students living in poverty; neither difference is statistically significant. These findings reflect improvement in the outcomes of Black students in poverty in charter schools; in the 2015 Texas study, performance of Black charter school students in poverty was significantly behind that of their TPS peers in both reading and math. Figure 12 shows Hispanic students living in poverty exhibit weaker performance in both reading and math than White TPS students not living in poverty, regardless of what school setting they attend. Hispanic TPS students living in poverty experience, on average, the equivalent of 114 fewer days of learning in both reading and math compared to White TPS students not living in poverty. Hispanic charter school students in poverty experience 80 fewer days of learning in reading and math compared to White TPS students not in poverty.
.03.01
-171
-143
-114
-86
-57
-29
00
29
57
-.30
-.25
-.20
-.15
-.10
-.05
.00
.05
.10
Days
of L
earn
ing
Grow
th (i
n st
anda
rd d
evia
tion
s)
* Significant at p < 0.05 ** Significant at p < 0.01
Reading Math

27
Figure 12: Learning Gains of Hispanic Students in Poverty Benchmarked Against Learning Gains of White TPS Students not in Poverty
The difference in outcomes for Hispanic students in poverty favors those in charter schools. Figure 12a shows the difference between Hispanic charter students living in poverty and Hispanic TPS students living in poverty. In Texas, Hispanic charter students in poverty experience stronger reading and math growth than Hispanic TPS students in poverty, a difference of approximately 34 days in both subjects. Each of the findings in Figure 12a is statistically significant. As with the findings for Black students in poverty, these results for Hispanic students in poverty in charter schools are much stronger than reported in the 2015 study, indicating an important area of improvement.
-.20**
-.14**
-.20**
-.14**
-143
-114
-86
-57
-29
00
29
57
-.25
-.20
-.15
-.10
-.05
.00
.05
.10
Hispanic TPS students in poverty Hispanic Charter students in poverty
Days
of L
earn
ing
Grow
th (i
n st
anda
rd d
evia
tion
s)
* Significant at p < 0.05 ** Significant at p < 0.01
Reading Math
28
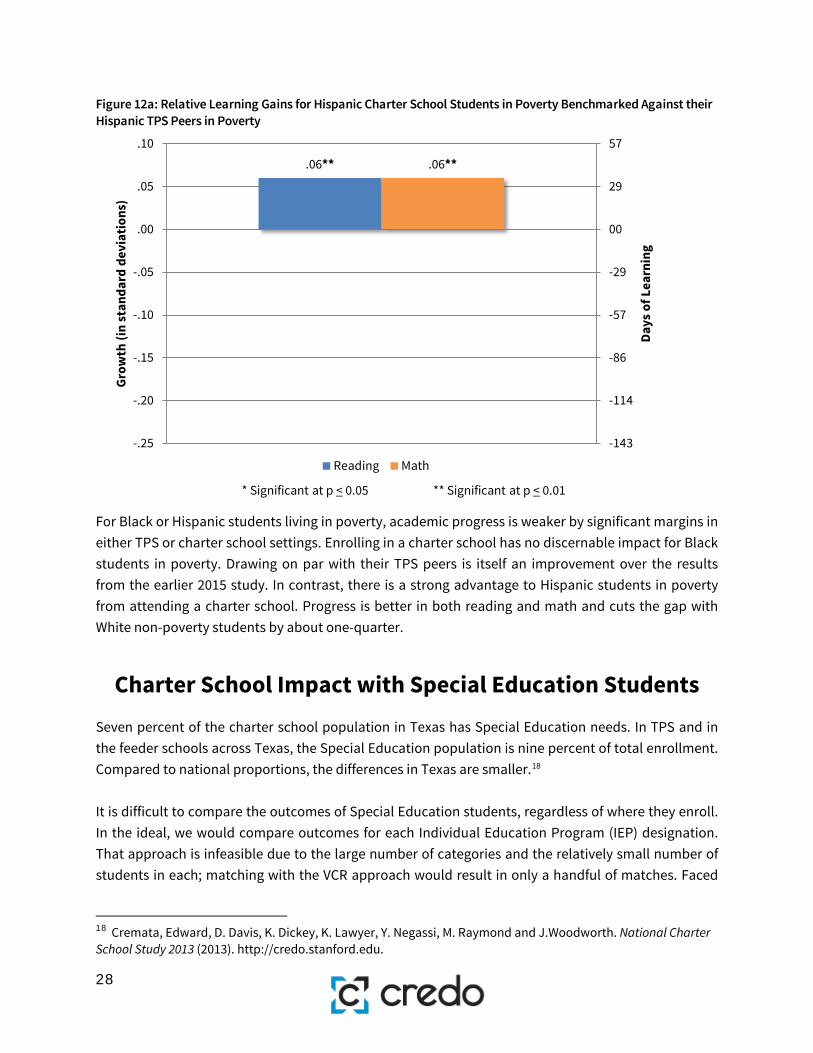
Figure 12a: Relative Learning Gains for Hispanic Charter School Students in Poverty Benchmarked Against their Hispanic TPS Peers in Poverty
For Black or Hispanic students living in poverty, academic progress is weaker by significant margins in either TPS or charter school settings. Enrolling in a charter school has no discernable impact for Black students in poverty. Drawing on par with their TPS peers is itself an improvement over the results from the earlier 2015 study. In contrast, there is a strong advantage to Hispanic students in poverty from attending a charter school. Progress is better in both reading and math and cuts the gap with White non-poverty students by about one-quarter.
Charter School Impact with Special Education Students
Seven percent of the charter school population in Texas has Special Education needs. In TPS and in the feeder schools across Texas, the Special Education population is nine percent of total enrollment. Compared to national proportions, the differences in Texas are smaller.18 It is difficult to compare the outcomes of Special Education students, regardless of where they enroll. In the ideal, we would compare outcomes for each Individual Education Program (IEP) designation. That approach is infeasible due to the large number of categories and the relatively small number of students in each; matching with the VCR approach would result in only a handful of matches. Faced
18 Cremata, Edward, D. Davis, K. Dickey, K. Lawyer, Y. Negassi, M. Raymond and J.Woodworth. National Charter School Study 2013 (2013). http://credo.stanford.edu.
.06** .06**
-143
-114
-86
-57
-29
00
29
57
-.25
-.20
-.15
-.10
-.05
.00
.05
.10
Days
of L
earn
ing
Grow
th (i
n st
anda
rd d
evia
tion
s)
* Significant at p < 0.05 ** Significant at p < 0.01
Reading Math
29
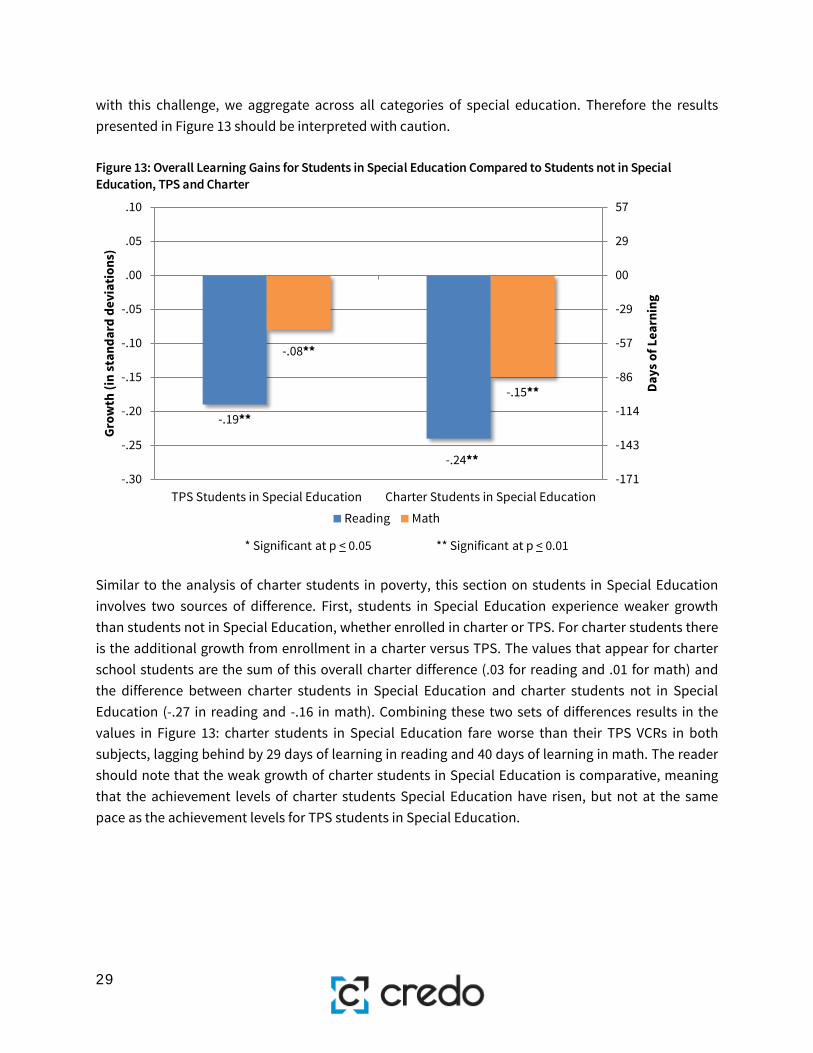
with this challenge, we aggregate across all categories of special education. Therefore the results presented in Figure 13 should be interpreted with caution. Figure 13: Overall Learning Gains for Students in Special Education Compared to Students not in Special Education, TPS and Charter
Similar to the analysis of charter students in poverty, this section on students in Special Education involves two sources of difference. First, students in Special Education experience weaker growth than students not in Special Education, whether enrolled in charter or TPS. For charter students there is the additional growth from enrollment in a charter versus TPS. The values that appear for charter school students are the sum of this overall charter difference (.03 for reading and .01 for math) and the difference between charter students in Special Education and charter students not in Special Education (-.27 in reading and -.16 in math). Combining these two sets of differences results in the values in Figure 13: charter students in Special Education fare worse than their TPS VCRs in both subjects, lagging behind by 29 days of learning in reading and 40 days of learning in math. The reader should note that the weak growth of charter students in Special Education is comparative, meaning that the achievement levels of charter students Special Education have risen, but not at the same pace as the achievement levels for TPS students in Special Education.
-.19**
-.24**
-.08**
-.15**
-171
-143
-114
-86
-57
-29
00
29
57
-.30
-.25
-.20
-.15
-.10
-.05
.00
.05
.10
TPS Students in Special Education Charter Students in Special Education
Days
of L
earn
ing
Grow
th (i
n st
anda
rd d
evia
tion
s)
* Significant at p < 0.05 ** Significant at p < 0.01
Reading Math
30
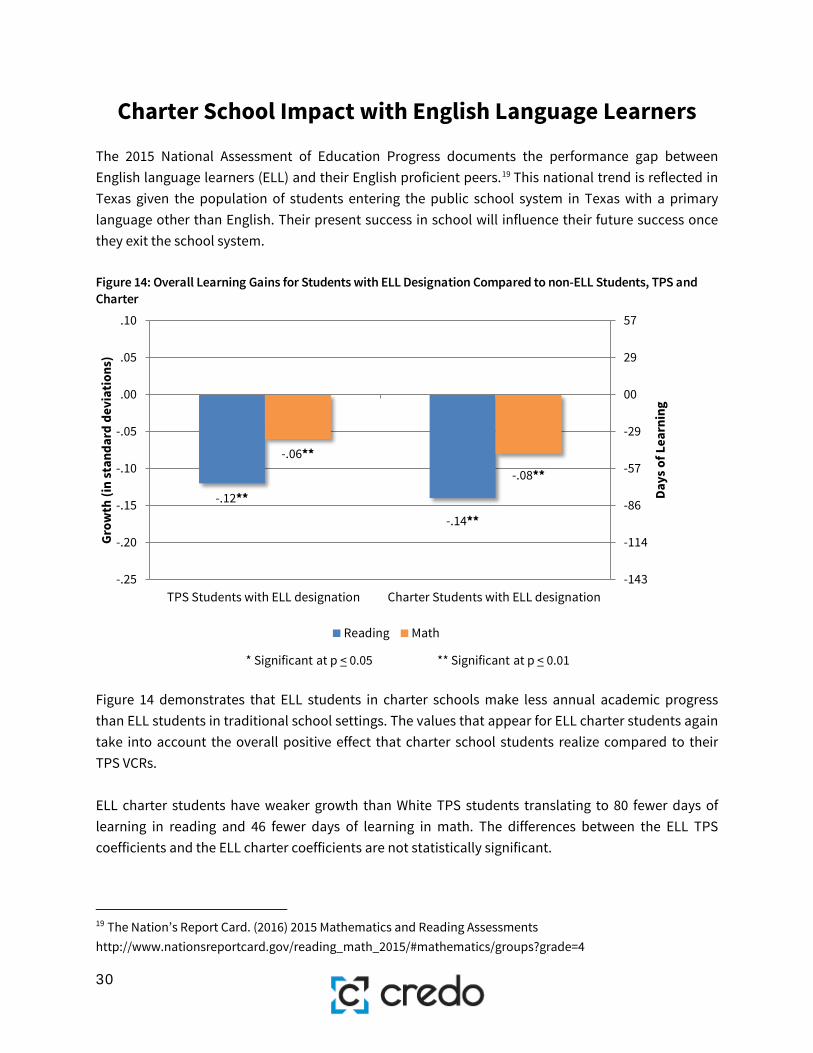
Charter School Impact with English Language Learners The 2015 National Assessment of Education Progress documents the performance gap between English language learners (ELL) and their English proficient peers.19 This national trend is reflected in Texas given the population of students entering the public school system in Texas with a primary language other than English. Their present success in school will influence their future success once they exit the school system. Figure 14: Overall Learning Gains for Students with ELL Designation Compared to non-ELL Students, TPS and Charter
Figure 14 demonstrates that ELL students in charter schools make less annual academic progress than ELL students in traditional school settings. The values that appear for ELL charter students again take into account the overall positive effect that charter school students realize compared to their TPS VCRs. ELL charter students have weaker growth than White TPS students translating to 80 fewer days of learning in reading and 46 fewer days of learning in math. The differences between the ELL TPS coefficients and the ELL charter coefficients are not statistically significant.
19 The Nation’s Report Card. (2016) 2015 Mathematics and Reading Assessments http://www.nationsreportcard.gov/reading_math_2015/#mathematics/groups?grade=4
-.12**
-.14**
-.06**-.08**
-143
-114
-86
-57
-29
00
29
57
-.25
-.20
-.15
-.10
-.05
.00
.05
.10
TPS Students with ELL designation Charter Students with ELL designation
Days
of L
earn
ing
Grow
th (i
n st
anda
rd d
evia
tion
s)
* Significant at p < 0.05 ** Significant at p < 0.01
Reading Math

31
Table 4 summarizes the effect that charter schools have on student group populations. The coefficients represent the growth of each group relative to their peer group in TPS. Charter school students in poverty, for example, experience additional reading growth of .03 (17 days) compared to TPS students in poverty. Table 4: Charter School Impact on Student Subgroup Performance
Charter School Impact by Students’ Years of Enrollment Charter schools use their autonomy in different ways to provide educational designs for students. A different approach to schooling may be both attractive to parents and challenging for students to master. Accordingly, academic growth in charter schools may change the longer a student is enrolled in their charter school. To test this, we look at growth by the consecutive years of enrollment in a charter school. To ensure an accurate measure of the effect of continued enrollment, we need to restrict the analysis to charter students for whom we observe an initial enrollment. This limits the sample to those who enroll for the first time in a charter school between the 2011-12 and 2013-14 school years and their VCR peers. Because this analysis contains a subset of the full study sample, the results should not be directly compared with other findings in this report. The results are shown below in Figure 15.
Student Group
Reading MathCharter School Students in Poverty .03** .03 Black Charter Students .03 .00 Black Charter Students in Poverty .03 .01 Hispanic Charter Students .05** .03**Hispanic Charter Students in Poverty .06** .06**Special Education Charter Students -.05** -.07**English Language Learner Charter Students -.02 -.02 Overall Charter Effect .03** .01
Charter Effect on Student Groups Benchmarked against their TPS Peers

32
Figure 15: Impact by Students’ Growth Period
As Figure 15 shows, Texas charter school students experience poorer academic growth in reading and math in their first year attending a charter school compared to their TPS peers. Compared to these TPS peers, charter students experience about 40 fewer days of learning in reading and 63 fewer days in math. After the first year, the evidence turns to favor enrollment in charter schools. Students’ second year of enrollment suggests the beginning of an upward trend as the charter students have stronger growth than their TPS counterparts by 23 days of learning in reading and 40 days of learning in math. The third year continues this trend with charter school students achieving their strongest growth, gaining an additional 40 days of learning in reading and 46 days of learning in math. The results show that charter school students in Texas are better off overall after their third year.
-.07**
.04**
.07**
-.11**
.07**.08**
-86
-57
-29
00
29
57
-.15
-.10
-.05
.00
.05
.10
First Year Second Year Third Year
Days
of L
earn
ing
Grow
th (i
n st
anda
rd d
evia
tion
s)
* Significant at p < 0.05 ** Significant at p < 0.01
Reading Math

33
3. Overall Charter School Analysis
School–level Analysis Comparative School-level Quality While the numbers reported above represent the typical learning gains at the student level across the state, the results do not let us discern if some charter schools are better than others. Since school-level results are of interest to policy makers, parents and the general public, we roll up the performance to the school level for each charter school in the state with sufficient numbers of tested students to make a reliable inference on performance. It is important to understand the counterfactual in this section. As demonstrated in Table 1 earlier in the report, the student populations differ within the typical charter school and their feeder schools, making whole-school to whole-school comparisons unhelpful. Instead, we use the VCRs developed from the array of feeder schools to roll up to a simulated TPS school and to serve as the control condition for testing the performance of charter schools. This simulated TPS reflects a precise estimate of the alternative local option. In order to determine the current distribution of charter school performance, the learning impact of charter schools for the 2014 and 2015 growth periods is used.20 This measure is called the school’s “effect size” and it is expressed in standard deviations of growth when referring to the overall and by-year impacts. As noted in Table 1, charter schools are smaller on average than their corresponding feeder schools and some charter schools elect to open with a single grade and add an additional grade each year thereafter. Researchers must be careful when making school-level comparisons to ensure the number of tested students in a school is sufficient to provide a fair representation of the school’s impact. Our criteria for including any school in this analysis were at least 60 matched charter student records over the two growth periods under examination or at least 30 matched charter records for new schools with only one year of data. Our total sample consists of 530 schools with reading test scores and 485 schools with math scores in the 2014 and 2015 growth periods. Table 5 shows the breakout of performance for the Texas charter schools that meet our criteria for inclusion by having a sufficient number of charter student records.
20 Growth Period 2014 represents growth between spring of 2013 and spring of 2014. Growth period 2015 represents growth between spring of 2014 and spring of 2015. We chose to include only the two most recent growth periods in this analysis in order to produce a highly relevant contemporary distribution of charter school performance.

34
Table 5: Performance of Charter Schools Compared to Their Local Schools in Texas
In reading, 33 percent of charter schools perform significantly better than their peer traditional public schools. In math, 38 percent of charter schools post growth that is significantly better than their TPS counterparts. Each of these results shows growth ahead the national average. To benchmark these figures nationally, 25 percent of charter schools outperform their local counterparts in reading and 29 percent do so in math.21 Twenty percent of Texas charter schools have reading results that are significantly weaker than the local TPS option as compared to the national figure of 19 percent. In math, 30 percent of charter schools post results weaker than the local TPS option compared to the national figure of 31 percent. In reading, nearly half of charters in Texas (47 percent) do not differ significantly from traditional public schools in their communities. In math, only 32 percent of charter schools have growth performance that is indistinguishable from TPS. It is important to realize that “no difference in growth” does not reflect the actual amount of growth – there are some charters with high levels of growth that are similar to their peer schools, and the reverse is also true.
Impact of Growth on Achievement The analyses of charter school impact on progress relative to local competition are informative for many questions, but they do not indicate how well
21CREDO (2013). National Charter School Study 2013. http://credo.stanford.edu.
Subject Number Percent Number Percent Number PercentReading 108 20% 247 47% 175 33%
Math 144 30% 155 32% 186 38%
Significantly WorseNot Significantly
Different Significantly Better
A Note about Tables 6 and 7
There are four quadrants in each table. Each quadrant is then further divided into four sections. The value in each colored box represents the percentage of charter schools with the corresponding combination of growth and achievement. The value in the center of each four colored boxes is a sum of those boxes. These percentages are generated from the 2014 and 2015 growth periods. The uppermost box on the left denotes the percentage of charters with very low average growth but very high average achievement. The box in the bottom left corner depicts low-growth, low-achieving schools. Similarly, the uppermost box on the right contains the percentage of charters with very high average growth and very high average achievement. The bottom right corner contains high-growth, low-achieving schools. The major quadrants were delineated using national charter school data. We would expect the majority of schools to have an effect size between -0.15 and 0.15 standard deviations of growth (the two middle columns). Similarly, we would expect about 40% of schools to achieve between the 30th and 70th percentiles. These expectations are based on how we view a normal distribution with the majority of the sample falling within one standard deviation of the mean.
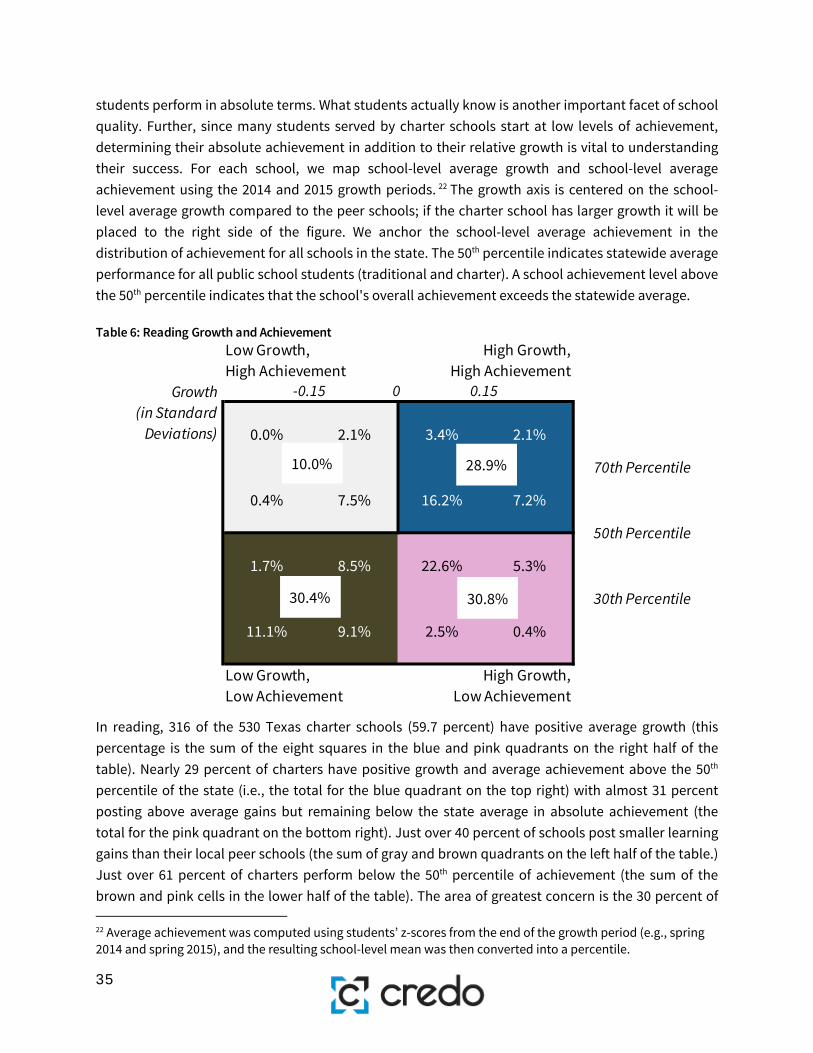
35
students perform in absolute terms. What students actually know is another important facet of school quality. Further, since many students served by charter schools start at low levels of achievement, determining their absolute achievement in addition to their relative growth is vital to understanding their success. For each school, we map school-level average growth and school-level average achievement using the 2014 and 2015 growth periods. 22 The growth axis is centered on the school-level average growth compared to the peer schools; if the charter school has larger growth it will be placed to the right side of the figure. We anchor the school-level average achievement in the distribution of achievement for all schools in the state. The 50th percentile indicates statewide average performance for all public school students (traditional and charter). A school achievement level above the 50th percentile indicates that the school's overall achievement exceeds the statewide average. Table 6: Reading Growth and Achievement
In reading, 316 of the 530 Texas charter schools (59.7 percent) have positive average growth (this percentage is the sum of the eight squares in the blue and pink quadrants on the right half of the table). Nearly 29 percent of charters have positive growth and average achievement above the 50th percentile of the state (i.e., the total for the blue quadrant on the top right) with almost 31 percent posting above average gains but remaining below the state average in absolute achievement (the total for the pink quadrant on the bottom right). Just over 40 percent of schools post smaller learning gains than their local peer schools (the sum of gray and brown quadrants on the left half of the table.) Just over 61 percent of charters perform below the 50th percentile of achievement (the sum of the brown and pink cells in the lower half of the table). The area of greatest concern is the 30 percent of 22 Average achievement was computed using students’ z-scores from the end of the growth period (e.g., spring 2014 and spring 2015), and the resulting school-level mean was then converted into a percentile.
70th Percentile
30th Percentile
50th Percentile
2.1%
16.2% 7.2%
22.6% 5.3%
2.5% 0.4%
3.4%
Growth (in Standard
Deviations)
Low Growth,Low Achievement
-0.15 0.150
8.5%
11.1% 9.1%
0.0% 2.1%
0.4% 7.5%
1.7%
High Growth,High Achievement
Low Growth, High Achievement
High Growth,Low Achievement
10.0% 28.9%
30.4% 30.8%

36
Texas charter schools that fall into the lower left quadrant of the table. These schools are characterized by both low achievement and low growth in reading. Table 7: Math Growth and Achievement
In math, 263 of the 485 Texas charter schools (just over 54 percent) have positive average growth in math, as seen in the combined orange and pink quadrants on the right half of the table. Approximately 28 percent of charters have positive growth and average achievement above the 50th percentile (the orange quadrant in the upper right of the table). Approximately 64 percent of charters post achievement results below the 50th percentile of the state (the sum of cells in the lower half of the table). In the pink quadrant in the lower right of the table, 26 percent (126 schools) of Texas charter schools classified as having low achievement have high growth and appear to be on an upward trajectory. As in the previous table, the schools of greatest concern are those schools in the lower left (brown) quadrant that demonstrate both low achievement and low growth; they account for 184 nearly (38 percent) of the charter schools in Texas.
Charter School Impact by School Locale
While charter schools exist in a variety of locales, charter schools in urban areas often receive the bulk of media attention. The results in Figure 16 represent the disaggregated charter impact for urban,
0.4% 1.2%
1.9% 4.3%
1.9% 4.7%
9.7%
70th Percentile
50th Percentile
30th Percentile
-0.15 0 0.15
12.0%
6.0% 9.1%
14.4% 8.5%
12.0% 10.3%
3.3% 0.4%
Growth (in Standard
Deviations)
Low Growth, High Achievement
High Growth,High Achievement
High Growth,Low Achievement
Low Growth,Low Achievement
7.8% 28.2%
37.9% 26.0%

37
suburban, town, and rural charter schools. In this breakout, charter students in different locales are compared with their virtual twins in the same locale.23 Figure 16: Impact by School Locale
Figure 16 shows urban charter students post reading growth equivalent to 17 more days of learning compared to their TPS counterparts. Charter students in town locales have weaker growth than their TPS peers equal to about 40 fewer days of learning in reading. It should be noted that charter students in towns comprise only two percent of the matched charter students in this study (approximately 6,000 students). Charter students in suburban and rural settings experience similar reading growth to their TPS peers. All locales show math growth that is not significantly different than charter and TPS students.
Charter School Impact by School Level
CREDO disaggregates charter school impacts for different grade spans using the designations of “elementary school” “middle school” “high school” or “multi-level school” assigned by the National Center for Education Statistics.24 Looking at performance by level helps build an understanding of the
23 The National Center for Education Statistics defines 12 urban-centric locales which are divided into four main locale types: city, suburb, rural and town. 24 CREDO does not assign school levels, but rather retains grade levels that are assigned to schools by the National Center for Education Statistics. The sole exception is that CREDO considers a school to be a high school if the lowest grade served is ninth grade or above.
.03** .03.02
-.07**
.02
-.03
-.01
-.06
-57
-29
00
29
-.10
-.05
.00
.05
Urban Suburban Rural Town
Days
of L
earn
ing
Grow
th (i
n st
anda
rd d
evia
tion
s)
* Significant at p < 0.05 ** Significant at p < 0.01
Reading Math

38
circumstances in which charter schools perform well. It also informs the question of whether specialization in a specific range of grades produces better results. Charter schools often exercise their autonomy by choosing which grade levels to serve. Some charter operators focus on particular ages, some seek to serve a full range of grades, and others build by adding one additional grade each year. Multi-level charter schools serve grade ranges that span two or more grade spans. The outcomes of students disaggregated by the grade span of the charter school they attended appear in Figure 17 below. Figure 17: Impact by School Level
The results indicate the strongest charter school performance is observed in elementary schools. Elementary charter school students see stronger average growth than their TPS counterparts in both subjects. This growth translates to 23 additional days of learning in reading and 29 additional days of learning in math. Charter students in middle school show growth in reading translating to an additional 17 days of learning compared to TPS peers. In math, charter middle school students show similar growth to their TPS peers. The remaining data show that high school and multi-level charter students and their TPS peers exhibit growth that is not significantly different.
.04**
.03*
.01.02
.05**
.02
.00
-.03
-57
-29
00
29
57
-.10
-.05
.00
.05
.10
Elementary Middle High Multi-level
Days
of L
earn
ing
Grow
th (i
n st
anda
rd d
evia
tion
s)
* Significant at p < 0.05 ** Significant at p < 0.01
Reading Math

39
4. Analysis by Charter School Type
Impact of Charter Management Organizations Charter Management Organizations (CMOs) hold charters for multiple schools, typically sharing common leadership and practices. CMOs may have some operational advantages in their ability to spread administrative fixed costs over a larger number of schools or students, thus providing the possibility of greater efficiency. In addition, CMOs may be able to support additional programs and more robust staffing in their networks due to having more schools and students than a single charter school. These benefits may not be available to independent charter schools; since support for CMOs is a policy option employed by states and charter authorizers, we are interested to see if CMO affiliation provides additional returns to student learning. Within our analysis, we include both non-profit and for-profit entities. This analysis only includes schools physically located in Texas, even if a CMO also operates schools in other states. This CMO analysis includes 471 charter schools operating under 67 CMOs.25 The following analysis examines the comparative performance of charter schools that belong to charter management organizations (CMOs) and those that operate on a stand-alone basis. As with the earlier statewide graphs, each graph in this section displays two distinct comparisons:
1. The first graph compares the performance of charter students enrolled in schools that belong to CMOs, as well as charter students in schools that do not belong to CMOs, to the average performance of the "average statewide student in TPS." The values that appear in each vertical bar indicate the magnitude of difference from this comparison student. The stars indicate the level of statistical significance. If there are no stars, we interpret the difference in learning gains as similar to TPS because we cannot be certain the observed difference is not due to chance. If there is no difference in the learning gains, the bar would be missing entirely. If the learning of the CMO charter student group is not as great as the statewide comparison baseline, the bar is below the 0.00 line. If the learning gains exceed the statewide comparison baseline, the bar is above the line.
2. The second graph compares the difference in performance between charter students who
attend CMO charter schools and those who attend charters that are not a part of CMOs. In these graphs, the 0.00 line represents the performance of the average non-CMO charter student. As with all graphs in this report, stars indicate the level of statistical significance.
Figure 18 separates the overall charter effect into the impact of CMO charter schools and that of non-CMO charter schools on their respective students’ math and reading growth. This growth is
25 The 471 CMO-affiliated schools and 33 MSC-affiliated schools sum to the total of 504 network schools mentioned later in the “Charter School Network” section.

40
benchmarked against growth of an average White TPS student. As with the previous graphs, stars indicate the level of statistical significance. Figure 18: Average Student Learning Gains of CMO Charter Schools and Non-CMO Charter Schools Benchmarked Against the Statewide Average TPS Student Learning Gains
In reading, Texas students enrolled in a CMO charter exhibit stronger average growth translating to approximately 17 additional days of learning in reading than their TPS peers. The CMO charter students exhibit similar growth in math to their TPS peers. The graph also indicates students enrolled in non-CMO charters show no significant difference in either reading or math growth compared to their TPS peers. Figure 18a displays the learning difference between students who attend CMO charters and those who attend non-CMO charters. The figure shows CMO charter students exhibit growth that is not significantly different in math and reading to non-CMO charter students.
.03**
.01.02
-.01
-57
-29
00
29
57
-.10
-.05
.00
.05
.10
CMO Charter Non-CMO Charter
Days
of L
earn
ing
Grow
th (i
n st
anda
rd d
evia
tion
s)
* Significant at p < 0.05 ** Significant at p < 0.01
Reading Math

41
Figure 18a: Relative Student Learning Gains of CMO Charter Schools Benchmarked Against Learning Gains of Non-CMO Charter Schools
It may seem surprising that the differences in Figure 18a are not significant. Probing the results, we found that at the school level, independent charter schools have more varied mean effects than charter schools belonging to CMOs. The greater variation makes it more difficult for significant differences to occur.
Impact of Charter School Networks
CREDO defines a charter school network as a single organization overseeing the operations of three or more charter schools. In Texas, there are two types of charter school networks, Management Service Companies (MSCs) and charter management organizations (CMOs). Management Service Companies are networks with contractual agreements to staff and manage some or all of a charter school’s operations; MSCs do not hold the charters for these schools and do report to the charter school governing body. As explained previously, CMOs hold the charters for three or more schools and govern the organization with Boards of Directors. CMOs may operate the schools directly or may contract with an MSC. At the time of this study, 69 charter networks operated within the state of Texas. Two of them are management service companies. Collectively, the networks operated 504 charter schools. These 504 schools serve 68 percent of Texas charter students. The tables below offer a glimpse at the top and bottom ten percent of charter school networks, based on growth effect size. These charter schools networks are listed below by name. Any network that
.02.03
-57
-29
00
29
57
-.10
-.05
.00
.05
.10
Days
of L
earn
ing
Grow
th (i
n st
anda
rd d
evia
tion
s)
* Significant at p < 0.05 ** Significant at p < 0.01
Reading Math

42
meets our 3-school threshold but that has only 1 or 2 Texas charter schools with tested grades during the study period, is included in the analysis. Table 8 displays the top 10 percent of charter school networks based on their effect size in reading and math. Neither of the MSCs had results that placed them in the list. In reading, students in the top performing network experience approximately 245 extra days of learning. In math, students within the top performing network experience approximately 268 additional days of learning. Table 8: Top 10 Percent of Charter School Networks in Texas based on Growth Effect Size
Table 9 displays the bottom ten percent of charter school networks based on their growth effect size. Students attending charter schools in the lowest-performing network exhibit 234 fewer days of learning and reading and 257 fewer days of learning in math. It should be noted that eight of the ten network listed in Table 9 do contain alternative schools or residential programs.
Network Name Growth Effect Size
Days of Learning
Number of TX Schools
Number of Enrolled Students
ReadingLa Amistad Love & Learning Academy .43** 245 3 196Tekoa Academy of Accelerated Studies .32** 182 4 398Two Dimensions Preparatory Charter .18** 103 3 329Houston Gateway Academy .15** 86 4 1886IDEA Public Schools .13** 74 37 19227
‡ .13** 74 1 273‡ .11** 63 2 392
MathTekoa Academy of Accelerated Studies .47** 268 4 426Houston Gateway Academy .42** 239 4 1886Two Dimensions Preparatory Charter .29** 165 3 533KIPP Austin .15** 86 9 3861Nova Academy .15** 86 3 945
‡ .15** 86 2 730El Paso Education Initiative, Inc. .14** 80 3 1307Number of students reflect 2014-15 Enrollment figures‡ The Charter School Network is not identified because it has fewer than three charter schools with tested students within the state of Texas during the time of the study

43
Table 9: Bottom 10 Percent of Charter School Networks in Texas based on Growth Effect Size
Nearly a full standard deviation separates the best from the worst networks. A full list of how networks performed over the years of the study appears in the Appendix Table 4.
Impact of Online Charter Schools
Online charter schools have a small but rapidly growing presence in the educational landscape nationally and in Texas. With no physical or geographic barriers to enrollment, these online charter schools draw students from across the state, providing online instruction to students who have higher mobility rates than students enrolled in TPS.26 These online charter schools use online instruction as the primary method of curriculum delivery to their students.27 In Texas, there are five providers of online charter education.28 We estimate the impact on learning of these providers based on the experience of roughly 16,000 online charter students in math and 13,000 online charter students for reading.
26 Woodworth, J., Raymond, M., Chirbas, K., Gonzalez, M., Negassi, Y., Snow, W., VanDonge, C. Online Charter School Study (2015). https://credo.stanford.edu/pdfs/Online%20Charter%20Study%20Final.pdf 27 Woodworth, J., Raymond, M., Chirbas, K., Gonzalez, M., Negassi, Y., Snow, W., VanDonge, C. Online Charter School Study (2015). https://credo.stanford.edu/pdfs/Online%20Charter%20Study%20Final.pdf 28 Texas Education Agency: Texas Virtual School Network Online School Campuses (2016) https://www.txvsn.org/OLS-Campuses
Network Name Growth Effect Size
Days of Learning
Number of TX Schools
Number of Enrolled Students
ReadingExcel Academy -.41** -234 5 476Evolution Academy -.37** -211 3 794Richard Milburn Academies -.36** -205 9 1705Information Referral Resource Assistance, Inc. -.28** -160 6 1219Por Vida, Inc. -.27** -154 3 352Winfree Academy Charter School -.27** -154 6 1248John H. Wood Jr. Public Charter District -.25** -143 5 542
MathExcel Academy -.45** -257 5 476University of Texas - University Charter School -.34** -194 17 739Responsive Education Solutions* -.33** -188 3 6520Southwest Winners Foundation, Inc. -.32** -182 5 898
‡ -.31** -177 2 823Priority Charter Schools -.30** -171 5 914Trinity Charter Schools -.30** -171 3 291Number of students reflect 2014-15 Enrollment figures
* Responsive Education Solutions does not represent the entire "supernetwork", but only students in Texas
‡ The Charter School Network is not identified because it has fewer than three charter schools with tested students within the state of Texas during the time of the study.

44
This analysis examines the growth of Texas students enrolled in online charter schools benchmarked against the growth of their peers (VCRs) enrolled in brick and mortar TPS. Recall that the only difference between the online charter student and their comparison student in brick-and-mortar TPS is the difference in the delivery of their education. We also look at the impact of online charter schools benchmarked against brick and mortar charter schools. We refer to schools (either charter or TPS) as “brick and mortar” when referring to schools that deliver content in a physical building. Figure 19: Comparison of Student Learning Gains for Students in Online and Brick and Mortar Charter Schools Benchmarked against Learning Gains for TPS Students
Figure 19 indicates students attending online charter schools have weaker growth in both reading and math than their peers attending brick and mortar TPS. Specifically, students attending online charter schools experience 46 fewer days of learning in reading and 165 fewer days of learning in math than their peers in brick and mortar TPS. The figure also illustrates that students in brick and mortar charters exhibit stronger growth in both reading and math that their TPS peers, gaining 17 additional days of learning in reading and 11 additional days of learning in math. Figure 19a illustrates students enrolled in online charter schools exhibit weaker growth than their peers in brick and mortar charter schools (whose performance is represented by the 0.00 line). The coefficients indicate online charter students lag behind their brick and mortar charter peers by 63 days in reading. The difference is greater in math. Online charter students experience 177 fewer days of growth in math than students in brick and mortar charter schools.
-.08**
.03**
-.29**
.02**
-228
-200
-171
-143
-114
-86
-57
-29
00
29
57
-.40
-.35
-.30
-.25
-.20
-.15
-.10
-.05
.00
.05
.10
Online Charter Brick and Mortar Charter
Days
of L
earn
ing
Grow
th (i
n st
anda
rd d
evia
tion
s)
* Significant at p < 0.05 ** Significant at p < 0.01
Reading Math

45
Figure 19a: Comparison of Student Learning Gains in Online Charter Schools Benchmarked against their Peers in Brick and Mortar Charter Schools
Figures 19 and 19a illustrate two important points: first, online charter students in Texas exhibit weak growth in reading and very weak growth in math compared to brick and mortar TPS or brick and mortar charter students. Second, the weak growth of Texas online charter students weakens the overall charter school effect shown in Figure 3.
Impact of Campus and Open-Enrollment Charter Schools
Another way to probe the Texas charter school landscape is to examine the differences in performance of open-enrollment charter schools and campus charter schools. In Texas, open-enrollment charter schools are authorized by the Texas Education Agency Commissioner. They have independent non-profit corporate status and are governed by boards of directors empowered with legal oversight authority. Further, open-enrollment charter schools receive their funding directly from the state, creating fiscal autonomy. They also have programmatic autonomy in matters of staffing, curriculum and instructional practice. Campus charter schools are authorized and monitored by a school board or designated authority of an independent school district. Campus charter schools are accountable to their districts for program and staffing decisions. State funding for campus charter schools flows through the independent school district. School districts in Texas use the campus charter school option strategically and, with
-.11**
-.31**
-228
-200
-171
-143
-114
-86
-57
-29
00
29
57
-.40
-.35
-.30
-.25
-.20
-.15
-.10
-.05
.00
.05
.10
Days
of L
earn
ing
Grow
th (i
n st
anda
rd d
evia
tion
s)
* Significant at p < 0.05 ** Significant at p < 0.01
Reading Math
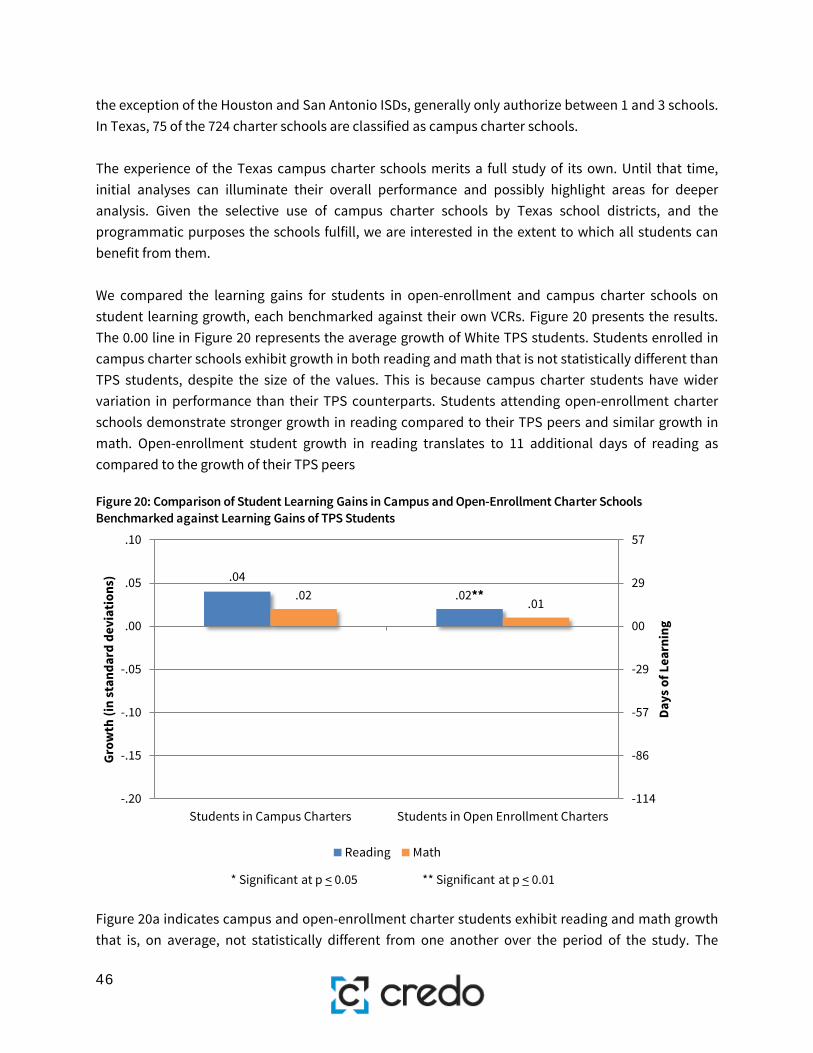
46
the exception of the Houston and San Antonio ISDs, generally only authorize between 1 and 3 schools. In Texas, 75 of the 724 charter schools are classified as campus charter schools. The experience of the Texas campus charter schools merits a full study of its own. Until that time, initial analyses can illuminate their overall performance and possibly highlight areas for deeper analysis. Given the selective use of campus charter schools by Texas school districts, and the programmatic purposes the schools fulfill, we are interested in the extent to which all students can benefit from them. We compared the learning gains for students in open-enrollment and campus charter schools on student learning growth, each benchmarked against their own VCRs. Figure 20 presents the results. The 0.00 line in Figure 20 represents the average growth of White TPS students. Students enrolled in campus charter schools exhibit growth in both reading and math that is not statistically different than TPS students, despite the size of the values. This is because campus charter students have wider variation in performance than their TPS counterparts. Students attending open-enrollment charter schools demonstrate stronger growth in reading compared to their TPS peers and similar growth in math. Open-enrollment student growth in reading translates to 11 additional days of reading as compared to the growth of their TPS peers Figure 20: Comparison of Student Learning Gains in Campus and Open-Enrollment Charter Schools Benchmarked against Learning Gains of TPS Students
Figure 20a indicates campus and open-enrollment charter students exhibit reading and math growth that is, on average, not statistically different from one another over the period of the study. The
.04.02**.02
.01
-114
-86
-57
-29
00
29
57
-.20
-.15
-.10
-.05
.00
.05
.10
Students in Campus Charters Students in Open Enrollment Charters
Days
of L
earn
ing
Grow
th (i
n st
anda
rd d
evia
tion
s)
* Significant at p < 0.05 ** Significant at p < 0.01
Reading Math

47
nominal achievement of the VCRs factors heavily into this graph. In reading, campus charter students outpace the declining mean achievement of their VCR peers, while open-enrollment charter students greatly outpace the increasing mean achievement of their VCRs. In math, campus charter students and their VCRs show increased achievement levels over the course of the study. The comparative effect of campus charters on student growth appears lesser due to the increase in achievement levels of their VCRs. Although open-enrollment charter students exhibit lower mean achievement than campus charter students, their mean achievement leapfrogs that of their VCR peers over the course of the study. Figure 20a displays coefficients for reading and math growth, and neither of these coefficients has significance. Digging deeper we see the lack of significance arises from the performance of each group relative to their VCRs and the size of the samples in the study (the population of open-enrollment charter students is five times larger than the population of campus charter students). Figure 20a: Relative Learning Gains for Students in Campus Charter Schools Benchmarked against their Peers in Open-Enrollment Charter Schools
Overall, campus charter students experience similar math and reading growth to White TPS students, while open-enrollment charter school students exhibit stronger reading growth than White TPS students and similar math growth. Students attending campus charters experience similar growth in both reading and math to their peers in open-enrollment charters.
.02.01
-114
-86
-57
-29
00
29
57
-.20
-.15
-.10
-.05
.00
.05
.10
Days
of L
earn
ing
Grow
th (i
n st
anda
rd d
evia
tion
s)
* Significant at p < 0.05 ** Significant at p < 0.01
Reading Math

48
Impact of Campus and Open-Enrollment Charter Schools by Race/Ethnicity
In Figure 21, we see that Black students enrolled in campus and open-enrollment charters, as well as Black TPS students, generally demonstrate less growth than their White TPS peers, benchmarked to zero for comparison. Black campus charter students experience reading growth equivalent to 51 fewer days of learning compared to White TPS students. In math, Black campus charter students experience growth that is not significantly different than White TPS students. Within this matched data set only two percent of the students are Black campus charter students - approximately 5,000 students. Additionally, for Black campus charter students, the comparison group for math demonstrates slightly more growth than the comparison group in reading. Black students attending open-enrollment charter schools experience weaker growth than White TPS students with 86 fewer days of learning in reading and 97 fewer days of learning in math. The direct comparison of gains between Black students in open-enrollment charter schools and those in campus charter schools reveals that campus charter students exhibit 34 additional days of learning in math and 46 additional days of learning in reading than their Black peers in open-enrollment charters. Figure 21: Learning Gains of Black Students in Campus Charters, Open-Enrollment Charters and TPS Benchmarked Against Learning Gains of White TPS Students
Below, Figure 22 indicates Hispanic students enrolled in campus charter schools exhibit similar growth to their White TPS peers in both math and reading. This similar growth reinforces the earlier finding showing Hispanic charter students outperforming Hispanic TPS students in math and reading.
-.17**
-.09*
-.15**-.16**
-.09
-.17**
-143
-114
-86
-57
-29
00
29
57
-.25
-.20
-.15
-.10
-.05
.00
.05
.10
Black Students in TPS Black Students in CampusCharters
Black Students in OpenEnrollment Charters
Days
of L
earn
ing
Grow
th (i
n st
anda
rd d
evia
tion
s)
* Significant at p < 0.05 ** Significant at p < 0.01Reading Math

49
Within this data set almost ten percent of the students are Hispanic campus charter students - approximately 27,000 students. Hispanic students enrolled in open-enrollment charter schools exhibit less growth than the average White TPS student, representing 34 fewer days of learning in reading and 46 fewer days of learning in math than the average White TPS student. When students in the two types of charter schools are compared to each other, Hispanic students in campus charter schools exhibit 23 additional days of learning in reading and 34 additional days of learning in math than their peers in open-enrollment charters. While Hispanic campus charter students exhibit similar growth to their White TPS peers, the reader should be mindful that the comparison group (VCRs for Hispanic campus charter students) exhibits lower levels of achievement over the course of the study, exaggerating comparative growth. Figure 22: Learning Gains of Hispanic Students in Campus Charters, Open-Enrollment Charters and TPS Benchmarked Against Learning Gains of White TPS Students
Both Black and Hispanic students attending open-enrollment charter schools exhibit weaker reading and math growth than the average White TPS student. For Black and Hispanic students attending campus charter schools, the results differ. Black students attending campus charter schools exhibit weaker growth in reading but not significantly different growth in math compared to the average White TPS student. Hispanic students attending campus charter schools exhibit similar growth in reading and math to the average White TPS student. Both Black and Hispanic students attending campus charter schools exhibit stronger reading and math growth than their Black and Hispanic peers in open-enrollment charter schools.
-.11**
-.02
-.06**
-.11**
-.02
-.08**
-86
-57
-29
00
29
57
-.15
-.10
-.05
.00
.05
.10
Hispanic Students in TPS Hispanic Students inCampus Charters
Hispanic Students inOpen Enrollment Charters
Days
of L
earn
ing
Grow
th (i
n st
anda
rd d
evia
tion
s)
* Significant at p < 0.05 ** Significant at p < 0.01Reading Math

50
Impact of Campus and Open-Enrollment Charter Schools on Students in Poverty
The results presented earlier in this study indicate that charter school students in poverty outpace the gains of their TPS peers in poverty in both reading and math. We pursued the question of how that result splits across campus charter schools and open-enrollment charter schools. Figure 23 demonstrates students in poverty attending campus and open-enrollment charter schools also exhibit weaker growth than their peers attending campus and open-enrollment charters who are not in poverty. Figure 23 involves two sources of difference when looking at students in poverty attending campus or open-enrollment charter schools. First, students in poverty experience weaker growth than students not in poverty regardless of the type of charter school they are attending. For charter students in campus or open-enrollment charters, there is the additional growth of being enrolled in either type of charter versus TPS. The values that appear in Figure 23 for campus charter school students are the sum of this overall campus charter difference (.04 for reading and .02 for math) and the difference between campus charter students in poverty and campus charter students not in poverty (-.12 in reading and -.13 in math). Combining these two sets of differences results in coefficients that show campus charter students in poverty faring not significantly differently than their TPS VCRs in poverty in reading and exhibiting 17 fewer days of learning in math. In Figure 23, the values that appear for open-enrollment charter school students are the sum of the overall open-enrollment charter difference (.02 for reading and .01 for math) and the difference between open-enrollment charter students in poverty and open-enrollment charter students not in poverty (-.07 in reading and -.05 in math). Combining these two sets of differences results in the coefficients showing open-enrollment charter students in poverty faring better than their TPS VCRs in poverty in both subjects, demonstrating growth of 17 days of learning in reading and 23 days of learning in math. Comparing results for students in poverty across all three groups, we can conclude that students in poverty have stronger outcomes when attending open-enrollment charter schools.

51
Figure 23: Overall Learning Gains for Students in Poverty compared to Students not in Poverty; TPS, Campus Charters and Open-Enrollment Charters
Impact of Campus and Open–Enrollment Charter Schools on Students in Special Education
As discussed earlier, charter schools, on a national level, serve fewer Special Education students than TPS in both number and percentage of total enrollment. We did not find this same difference to exist in Texas, Figure 24 illustrates how campus and open-enrollment charter schools impact the learning of their Special Education population. Figure 24 indicates students in Special Education experience weaker growth than students not in Special Education regardless of the type of charter school they attend. For campus or open-enrollment charter students, there is the additional growth of being enrolled in either type of charter school versus TPS. The values that appear in Figure 24 for campus charter school students are the sum of this overall campus charter difference (.04 for reading and .02 for math) and the difference between campus charter students in Special Education and campus charter students not in Special Education (-.22 in reading and -.11 in math). Combining these two sets of differences shows Special Education students who attend campus charter schools do not perform significantly differently than their TPS VCRs in Special Education in either subject. Both the charter campus students and their comparison VCR groups show rising levels of achievement, limiting the comparative growth effect of campus charters on students in Special Education.
-.08** -.08**
-.05**
-.08**-.11**
-.04**
-114
-86
-57
-29
00
29
57
-.20
-.15
-.10
-.05
.00
.05
.10
TPS Students in Poverty Campus Charter Studentsin Poverty
Open-Enrollment CharterStudents in Poverty
Days
of L
earn
ing
Grow
th (i
n st
anda
rd d
evia
tion
s)
* Significant at p < 0.05 ** Significant at p < 0.01
Reading Math

52
Also in Figure 24, the values that appear for open-enrollment charter school students are the sum of the overall open-enrollment charter difference (.02 for reading and .01 for math) and the difference between open-enrollment charter students in Special Education and open-enrollment charter students not in Special Education (-.27 in reading and -.16 in math). Combining these two sets of differences shows that open-enrollment charter school students in Special Education fare worse than their TPS VCRs in Special Education in both subjects, lagging behind by 40 days of learning in reading and 34 days of learning in math. The figure demonstrates students enrolled in Special Education attending TPS, campus charters, or open-enrollment charters exhibit weaker growth than their peers attending TPS, campus charters, and open-enrollment charters who are not in Special Education. Further, the results indicate that the average TPS student enrolled in Special Education would expect similar outcomes in a campus charter and significantly worse outcomes in an open-enrollment charter. Figure 24: Overall Learning Gains of Students in Special Education Compared to Students not enrolled in Special Education; TPS, Campus Charters and Open-Enrollment Charters
-.19** -.18**
-.25**
-.08** -.09**
-.15**
-171
-143
-114
-86
-57
-29
00
29
57
-.30
-.25
-.20
-.15
-.10
-.05
.00
.05
.10
Special Education Studentsin TPS
Special EducationStudents
in Campus Charters
Special Education Studentsin Open-Enrollment
Charters
Days
of L
earn
ing
Grow
th (i
n st
anda
rd d
evia
tion
s)
* Significant at p < 0.05 ** Significant at p < 0.01
Reading Math

53
Impact of Campus and Open-Enrollment Charter Schools on English Language Learners
As of the 2013-14 school year, the National Center for Education Statistics reported English Language Learners comprise about nine percent of the student population of public schools across the country. 29 In Texas, 20 percent of enrolled charter students are classified as English Language Learners, compared to 17 percent of enrolled TPS students. Figure 25 depicts the differences in growth for ELL students enrolled in TPS, campus charters, and open-enrollment charters compared to non-ELL students enrolled in similar school settings. Figure 25 shows ELL students in campus charter schools fare worse than their ELL TPS VCRs, lagging behind by 34 days of learning in both subjects. The values that appear for ELL campus charter students take into account the overall positive effect that campus charter school students realize compared to their TPS VCRs. Figure 25 also shows ELL open-enrollment charter students fare worse than their ELL TPS VCRs in both subjects, lagging behind by 11 days of learning in reading and math. Again, the values that appear for ELL open-enrollment charter students take into account the overall positive effect that open-enrollment charter school students realize compared to their TPS VCRs.
29 National Center for Education Statistics (2017) https://nces.ed.gov/programs/digest/d15/tables/dt15_204.20.asp

54
Figure 25: Overall Learning Gains of ELL Students Compared to non-ELL Students; TPS, Campus Charter and Open-Enrollment Charter
Figure 25 indicates that ELL students experience better outcomes in TPS when compared to campus or open-enrollment charter schools. However, within the charter sector, ELL students in open-enrollment charters outperform ELL students in campus charters. Table 10 summarizes the growth effects of campus and open-enrollment charter schools on student subgroups compared to their TPS peers in the same subgroup. Again, we see Hispanic students showing strong growth in both types of charter schools. Students in Special Education and ELL students enrolled in either campus or open-enrollment charters show growth that is weaker or not significantly different than their TPS peers.
-.12**
-.18**
-.14**
-.06**
-.12**-.08**
-171
-143
-114
-86
-57
-29
00
29
57
-.30
-.25
-.20
-.15
-.10
-.05
.00
.05
.10
ELL Students in TPS ELL Students in CampusCharters
ELL Students in Open-Enrollment Charters
Days
of L
earn
ing
Grow
th (i
n st
anda
rd d
evia
tion
s)
* Significant at p < 0.05 ** Significant at p < 0.01Reading Math

55
Table 10: Campus and Open-Enrollment Charter School Impact on Student Subgroup Performance
Impact of Campus and Open-Enrollment Charter Schools by School Level
Charter school impacts can differ depending on the range of grades that these schools choose to serve. The following analysis looks at the impacts of campus and open-enrollment charter schools based upon the grade spans that they serve. Earlier, Figure 20 illustrated the learning gains of campus and open-enrollment charter school students benchmarked against the learning gains of White TPS students. Figures 26 and 27 below take the overall effect of campus charters and the overall effect of open-enrollment charters and separate these effects out by school level. Figure 28 displays the relative gains, by school level, of students attending campus charter schools benchmarked against their peers in open-enrollment charter schools. As shown in Figure 26, students attending campus charter elementary, middle and multi-level schools experience similar reading growth to White TPS students. There is a significant difference for students attending campus charter high schools; they experience reading growth translating to 97 additional days of learning. Throughout this analysis, almost 20 percent of the campus charter high schools are additionally classified as magnet schools offering a specialized program of study. These magnet programs are available to students who apply and qualify for these specialized areas of interest. This
Student Group
Reading MathBlack Campus Charter Students .08* .07* Hispanic Campus Charter Students .09** .09* Campus Charter Students in Poverty .00 -.03**Special Education Campus Charter Students .01 -.01 English Language Learner Campus Charter School Students -.06** -.06**Overall Campus Charter Effect .04 .02
Student Group
Reading MathBlack Open-Enrollment Charter Students .02 -.01 Hispanic Open-Enrollment Charter Students .05** .03 Open-Enrollment Charter Students in Poverty .03 .04** Special Education Open-Enrollment Charter Students -.07** -.06** English Language Learner Open-Enrollment Charter School Students -.02** -.02* Overall Open-Enrollment Charter Effect .02** .01
Student Group
Reading MathBlack Campus Charter Students .06* .08* Hispanic Campus Charter Students .04* .06* Campus Charter Students in Poverty -.03* -.07* Special Education Campus Charter Students .07* .06* English Language Learner Campus Charter School Students -.04* -.04* Overall Charter Effect .03** .01
Campus Charter Effect on Student Groups Benchmarked against their TPS Peers
Open-Enrollment Charter Effect on Student Groups Benchmarked against their TPS Peers
Campus Charter Effect on Student Groups Benchmarked against their Open-Enrollment Charter Peers
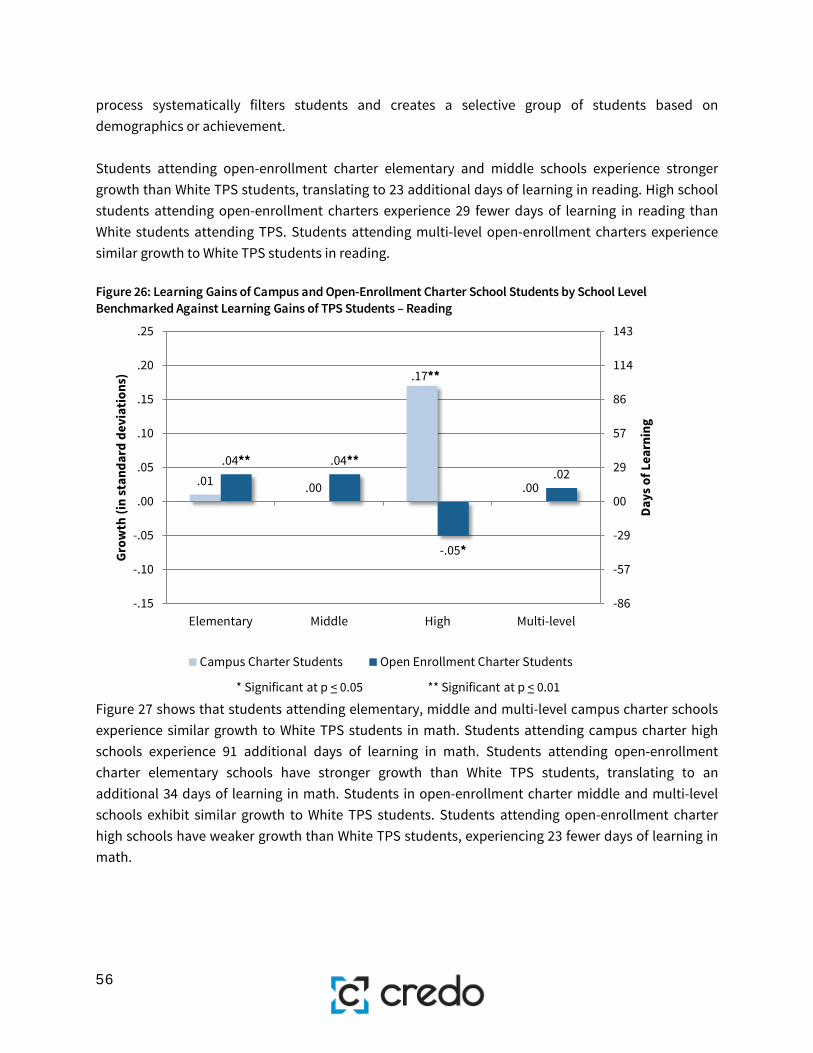
56
process systematically filters students and creates a selective group of students based on demographics or achievement. Students attending open-enrollment charter elementary and middle schools experience stronger growth than White TPS students, translating to 23 additional days of learning in reading. High school students attending open-enrollment charters experience 29 fewer days of learning in reading than White students attending TPS. Students attending multi-level open-enrollment charters experience similar growth to White TPS students in reading. Figure 26: Learning Gains of Campus and Open-Enrollment Charter School Students by School Level Benchmarked Against Learning Gains of TPS Students – Reading
Figure 27 shows that students attending elementary, middle and multi-level campus charter schools experience similar growth to White TPS students in math. Students attending campus charter high schools experience 91 additional days of learning in math. Students attending open-enrollment charter elementary schools have stronger growth than White TPS students, translating to an additional 34 days of learning in math. Students in open-enrollment charter middle and multi-level schools exhibit similar growth to White TPS students. Students attending open-enrollment charter high schools have weaker growth than White TPS students, experiencing 23 fewer days of learning in math.
.01 .00
.17**
.00
.04** .04**
-.05*
.02
-86
-57
-29
00
29
57
86
114
143
-.15
-.10
-.05
.00
.05
.10
.15
.20
.25
Elementary Middle High Multi-level
Days
of L
earn
ing
Grow
th (i
n st
anda
rd d
evia
tion
s)
* Significant at p < 0.05 ** Significant at p < 0.01
Campus Charter Students Open Enrollment Charter Students

57
Figure 27: Learning Gains of Campus and Open-Enrollment Charter School Students by School Level Benchmarked Against Learning Gains of TPS Students – Math
Figure 28 indicates similar reading and math growth between campus and open-enrollment charter students in elementary, middle and multi-level schools. High school level campus charter school students experience stronger growth in reading and math than their peers in open-enrollment charter high schools. This growth translates into 125 days of learning in reading and 114 days of learning in math.
.02.03
.16**
-.11
.06**
.02
-.04*-.03
-86
-57
-29
00
29
57
86
114
143
-.15
-.10
-.05
.00
.05
.10
.15
.20
.25
Elementary Middle High Multi-level
Days
of L
earn
ing
Grow
th (i
n st
anda
rd d
evia
tion
s)
* Significant at p < 0.05 ** Significant at p < 0.01
Campus Charter Students Open Enrollment Charter Students

58
Figure 28: Relative Learning Gains of Campus Charter School Students by School Level Benchmarked Against their Peers in Open-Enrollment Charter School
This breakout by charter type and school level indicates that campus charter students enrolled in high school outperform their TPS peers in reading and math. When compared to one another, campus charter students exhibit stronger reading and math growth than their open-enrollment charter peers in high school. Open-enrollment charter students enrolled in elementary or middle schools either outperform or show no significant difference in performance compared to their TPS peers in reading and math. These strong findings would normally suggest that districts can be effective in authorizing campus charter high schools. However, we must account for the impact of magnet programs in these campus charter high schools and their selective application processes.
Alternative Education Campuses
During the 1995-1996 school year, Texas implemented a set of alternative performance measures for campuses serving at-risk students. In Texas, Alternative Education Campuses (AEC) have the option of being evaluated under Alternative Education Accountability (AEA) provisions. As of the 2014-2015 school year, 394 schools were registered for evaluation under the 2015 AEA provisions.30 There are two ways in which a school can be identified as a pre-registered AEA campus. Within the criteria listed below, a campus can either meet criteria one and two or meet criteria three.
30 https://rptsvr1.tea.texas.gov/perfreport/account/2015/aea_campus.pdf
-.03 -.04
.22**
-.02-.04
.01
.20**
-.08
-86
-57
-29
00
29
57
86
114
143
-.15
-.10
-.05
.00
.05
.10
.15
.20
.25
Elementary Middle High Multi-level
Days
of L
earn
ing
Grow
th (i
n st
anda
rd d
evia
tion
s)
* Significant at p < 0.05 ** Significant at p < 0.01
Reading Math

59
1. 75% of the student population within the campus meets at least one of the “at-risk of dropping out of school” criteria (as specified by the TEA).31
and 2. 50% of the student population is enrolled in grades 6-12.
or 3. A Dropout Recovery School (DRS) is considered to be an AEC if at least 50 percent of the student
population is 17 years of age or older. Figure 29 illustrates the growth for students enrolled in AECs. The two bars on the left are unusual in that they are strongly negative and lack significance. The lack of significance arises because students attending AECs comprise fewer than 1 percent of the study population, approximately 1,000 students. The specific criteria for AECs present a challenge when matching students. The analysis does not draw significance from such a small portion of the sample, no matter how large the coefficients are. The figures for the non-alternative charter campuses show students in these schools have stronger growth in reading than the average White TPS student, and similar growth in math. The coefficients for non-alternative charters are similar to the overall charter effect seen in Figure 3, meaning the large negative coefficients seen with the alternative charter campuses do not weaken the overall charter effect.
31 Texas Education Agency 2015 Accountability Manual (p. 75-77) https://rptsvr1.tea.texas.gov/perfreport/account/2015/manual/Chapter%2006_Final.pdf
A Note about Significance During the study we stress the importance of growth that is similar or translates into differential days of learning. This relies on significance levels and p-values, but we note that occasionally the study has coefficients that are not significant but still important. Due to the granularity of some of the analyses, certain sample sizes are either too low to report, or sufficiently low enough to affect p-value assigned to the coefficient. The population of students attending alternative charter schools comprises less than one percent of the study population. This offers little statistical power. In Figure 29, the coefficient for math growth of -.17 has a p-value of 0.16. The reading growth coefficient is -.10 but due to the small size the p-value is 0.27.

60
Figure 29: Average Student Learning Gains of Alternative Education Charter Campuses and Non-Alternative Charter Schools Benchmarked Against Statewide Average TPS Student Learning Gains
Figure 29a shows the difference in reading and math growth between students attending alternative charters and those attending non-alternative charters. Again the results show large coefficients, and no statistical significance in reading and math growth.
-.10
.03**
-.17
.01
-114
-86
-57
-29
00
29
57
-.20
-.15
-.10
-.05
.00
.05
.10
Alternative Charter Schools Non-Alternative Charter Schools
Days
of L
earn
ing
Grow
th (i
n st
anda
rd d
evia
tion
s)
* Significant at p < 0.05 ** Significant at p < 0.01
Reading Math

61
Figure 29a: Relative Student Learning Gains of Alternative Education Charter Campuses Benchmarked Against Student Learning Gains of Non-Alternative Charter Schools
Figures 29 and 29a show large negative coefficients when comparing AEC students to their non-alterative TPS or non-alternative charter peers. The small sample size prevents these coefficients from being significant, but the size of the coefficient remains noteworthy. A larger sample size of alternative charter campus students may allow for these coefficients to have significance. The study could then accurately translate the weaker growth into days of learning. A larger sample size would also allow us to say with confidence whether AECs weaken the overall charter school effect and to what magnitude. There are three main reasons why this comparison proves difficult. In probing the Texas education landscape we see that charter schools serve a disproportionate amount of alternative students when compared to traditional public schools, specifically over the course of the study. This is a trend that warrants greater discussion and further research. Ultimately, this skew also means that we simply cannot perform a rigorous analysis as there are not enough alternative TPS students to support the matching process with alternative charter students. The AEA criteria are also so vast as to provide a great deal of heterogeneity among the alternative population. These factors all combine to create a challenge when attempting to find matches for the alternative charter students.
-.13
-.18-114
-86
-57
-29
00
29
57
-.20
-.15
-.10
-.05
.00
.05
.10
Days
of L
earn
ing
Grow
th (i
n st
anda
rd d
evia
tion
s)
* Significant at p < 0.05 ** Significant at p < 0.01
Reading Math

62
Impact of Dropout Recovery Charter Schools Dropout Recovery Charter Schools are a distinct subset of Texas’ alternative education campuses. In order to remain classified as a dropout recovery charter, these 101 schools must serve students in grades 9 through 12 while 50 percent of their total enrollment must be 17 years of age or older.32 Throughout the study, analysis is based on having robust match rates (approximately 88 percent) that assure that the majority of tested students are included in the study. The characteristics of students in dropout recovery charter schools bring the average match rate down to approximately 37 percent. Specifically, the demographics of students served in dropout charters leads to difficulty in finding matching VCR students. Complicating this match process is the dearth of identifiable alternative TPS schools. These limitations should be considered when viewing the average effects of dropout recovery charters on their students. We separate the dropout recovery charter schools from the rest of the matched schools, and calculate fixed effects only for schools that have data in the final two growth periods of the study. We calculate a mean fixed effect for these dropout recovery charter schools, which was negative and significant for both reading and math compared to TPS. In reading, the average fixed effect for dropout recovery schools (-.24*) translates to 137 fewer days of learning. In math the average fixed effect (-.14*) translates to 80 fewer days of learning. As a specific subset of the alternative charter population, students in dropout recovery charter schools experience weaker average growth in reading and math than the alternative charter sector as a whole. Dropout Recovery Charter students fare worse, on average, than TPS students, charter students, and students in the alternative charter sector as a whole. The overall alternative charter effect is weakened by dropout recovery students in both reading and math, suggesting that there is stronger growth for those alternative charter students who are not enrolled in dropout recovery schools.
School Closure and School Replication
A portion of CREDO’s 2015 report on charter school performance in Texas simulated the potential impact of closing low performing or failing schools on the overall quality of the charter school landscape.33 The simulation is recreated here with more recent data. In addition to exploring the impact of school closure on the quality of the Texas charter school sector, we extend the simulation to explore the possible impact of replicating good schools.
32 Texas Education Code Chapter 100, Subchapter BB §100.1003 http://ritter.tea.state.tx.us/rules/tac/chapter100/ch100aa.html#division1 33 CREDO. 2013. https://credo.stanford.edu/documents/NCSS%202013%20Final%20Draft.pdf

63
To illustrate the sector shifts we would expect as a result of stronger policies around school closure, we have created a set of five closure scenarios. CREDO’s criteria for closure differ – some are based on academic growth, some are based on persistently low achievement, and others are based on underperformance relative to the local TPS alternatives. Each scenario involves removing a portion of the charter schools from the population of schools included in the analyses in this report. The five closure scenarios are presented below. Closure Scenarios
1. Every charter school with growth less than -0.4 standard deviation units is closed. 2. Every charter school with significantly lower growth than its peer TPS is closed. 3. Every charter school in the bottom 10 percent of schools by growth is closed. 4. Every charter school with achievement less than -0.4 standard deviations is closed. 5. Every charter school in the bottom 10 percent of achievement is closed.
The simulation is conducted for reading and math separately. Each of the five scenarios described above was explored independently. If a school met the criteria for closure as specified by each scenario, then students from that school were eliminated. The potential impact of closing schools meeting this criterion is seen through the estimated growth effect of the remaining schools (without the effect of the eliminated schools). The comparison group consists of the remaining TPS VCR students. Table 11 below displays the alternative criteria for closure, and how many schools included in this analysis would be affected if their selection were based on either their reading or math performance. Table 11: Number of Schools Closed Under Each Scenario
Closure Scenarios Reading Math
1 Growth Less Than -0.4 Standard Deviation Units 15 132 Significantly Lower Growth Than TPS 108 1443 Bottom 10% of Schools By Growth 54 494 Achievement Less than -0.4 Standard Deviation Units 161 1655 Bottom 10% of Achievement 53 49

64
Table 12: Effects of Closure Scenarios
The impacts of the closure scenarios on the overall quality of the charter sector differ strikingly, as displayed in Table 12 and shown in Figures 30 and 31. In each subject, the starting point is the current overall average charter school effect (.03 in reading and .01 in math). In reading, Scenarios 2 through 5 result in an increase in average annual academic growth with Scenario 2 resulting in a substantial gain of 34 additional days of learning per year than in comparable TPS. In math, Scenario 1 produced no change in the sector’s overall reading performance. Scenarios 2 through 4 result in additional growth with Scenario 2 translating to 46 additional days of learning in math. Scenarios 1 and 5 result in no significant difference from comparable TPS. Figure 30 presents the impacts of the closure scenarios on charter school reading performance
Closure Scenarios Reading Effect
Days of Learning (Reading)
Math Effect
Days of Learning
(Math)
Baseline Levels .03 17 .01 61 Growth Less Than -0.4 Standard Deviation Units .03 17 .01 62 Significantly Lower Growth Than TPS .06 34 .08 463 Bottom 10% of Schools By Growth .04 23 .03 174 Achievement Less than -0.4 Standard Deviation Units .05 29 .06 345 Bottom 10% of Achievement .04 23 .02 11

65
Figure 30: Closure Scenarios: Reading
Figure 31 presents the impacts of the closure scenarios on charter school math performance. Figure 31: Closure Scenarios: Math
Scenario 1
Scenario 2
Scenario 3Scenario 4
Scenario 5
00
29
57
.00
.01
.02
.03
.04
.05
.06
.07
.08
.09
.10
Days
of L
earn
ing
Grow
th (i
n st
anda
rd d
evia
tion
s)
Scenario 1 Scenario 2 Scenario 3 Scenario 4 Scenario 5
.03*
Scenario 1
Scenario 2
Scenario 3
Scenario 4
Scenario 5
0
18
36
54
.00
.01
.02
.03
.04
.05
.06
.07
.08
.09
Days
of L
earn
ing
Grow
th (i
n st
anda
rd d
evia
tion
s)
Scenario 1 Scenario 2 Scenario 3 Scenario 4 Scenario 5
.01

66
For both reading and math, Scenario 2 produces the largest effect, informing us that the hypothetical closing of charter schools with significantly weaker growth than TPS would most benefit charter students’ academic growth. Implementing Scenario 1, closing charter schools that have growth of less than 0.4 standard deviations, results in fewer schools closed and produces no aggregate effect on reading or math performance. For Texas, substantial performance gains through closure could only be achieved through Draconean efforts. Another method to increase the overall existing quality of the charter schools in Texas would be to stimulate the expansion of schools that are posting positive academic gains for their students. To illustrate the sector shifts expected to result from replicating schools with strong performance, we created five replication scenarios. Each scenario considers different subsets of the charter schools from the full set included in this report. As with the closure scenarios, the criteria for replication differ – some are based on academic growth, some are based on persistently high achievement, and others are based on outperforming the local TPS. The five replication scenarios are presented below. Replication Scenarios
1. Every charter school with growth more than 0.2 standard deviation units is replicated. 2. Every charter school with significantly higher growth than its peer TPS is replicated. 3. Every charter school in the top 25 percent of schools by growth is replicated. 4. Every charter school with achievement more than 0.2 standard deviations is replicated. 5. Every charter school in the top 25 percent of achievement is replicated.
Each of the five scenarios described above was explored separately using performance data for reading and math. Students attending schools that met the criteria of each replication scenario were included in this analysis to determine the potential impact of replicating only those schools which met the identified replication criteria. Table 13 below displays these alternative criteria for replication, and how many schools included in this analysis would be affected if selection was based on their reading or their math performance, respectively. The impacts of each replication scenario on the overall quality of the charter sector are seen in Table 14 and illustrated in Figures 32 and 33. Table 13: Number of Schools Replicated Under Each Scenario
Replication Scenarios Reading Math
1 Growth More Than 0.2 Standard Deviation Units 54 982 Significantly Higher Growth Than TPS 175 1863 Top 25% of Schools By Growth 124 1224 Achievement Greater than 0.2 Standard Deviation Units 121 1035 Top 25% of Achievement 133 122

67
Table 14: Effects of Replication Scenarios
Similar to the closure scenarios, the starting point in each subject is the current overall average charter school effect. Table 14 shows each replication scenario resulting in an increase in average reading growth. Scenario 1 results in the largest reading growth of nearly .25 standard deviations, a gain of 143 more days of learning in reading per year than in comparable TPS. In math, every replication scenario results in an average growth increase beyond the overall average charter school effect, which is similar to TPS. Again, Scenario 1 results in the largest growth of .24 standard deviations, a gain of approximately 137 more days of learning per year than in comparable TPS. Figure 32 illustrates the extent to which Scenario 1 outpaces the rest of the replication scenarios in reading.
Replication ScenariosReading
Effect
Days of Learning (Reading)
Math Effect
Days of Learning
(Math)Baseline Levels .03 17 .01 6
1 Growth More Than -0.2 Standard Deviation Units .25 143 .24 1372 Significantly Higher Growth Than TPS .12 68 .16 913 Top 25% of Schools By Growth .17 97 .21 1204 Achievement Greater than 0.2 Standard Deviation Units .08 46 .12 685 Top 25% of Achievement .08 46 .12 68

68
Figure 32: Replication Scenarios: Reading
Figure 33 show that all replication scenarios have significant impacts on student growth in math. Figure 33: Replication Scenarios: Math
Scenario 1
Scenario 2
Scenario 3
Scenario 4Scenario 5
0
36
72
108
144
180
216
.00
.05
.10
.15
.20
.25
.30
Days
of L
earn
ing
Grow
th (i
n st
anda
rd d
evia
tion
s)
Scenario 1 Scenario 2 Scenario 3 Scenario 4 Scenario 5
.03*
Scenario 1
Scenario 2
Scenario 3
Scenario 4
Scenario 5
0
36
72
108
144
180
216
.00
.05
.10
.15
.20
.25
.30
Days
of L
earn
ing
Grow
th (i
n st
anda
rd d
evia
tion
s)
Scenario 1 Scenario 2 Scenario 3 Scenario 4 Scenario 5
.01

69
In the hypothetical scenarios in which Texas authorizers diligently replicate successful schools, Scenario 1 results in the largest effect size on reading and math growth. This scenario calls for the replication of charter schools that have growth of more than 0.2 standard deviations, or 114 extra days of learning. The weakest growth for reading and math occurs under Scenarios 4 and 5. Scenario 4 calls for the replication of schools with achievement more than 0.2 standard deviations from the mean. Scenario 5 calls for the replication of schools within the top 25% of achievement. Again, Texas would have to employ extreme measures to achieve the greatest performance gains if it were to only replicate the small slice of schools with the strongest growth.

70
Synthesis and Conclusions This study examined the academic progress of charter school students in Texas over a four year period. Our data window ranges from the 2011-2012 to the 2014-2015 school year, amounting to three annual growth periods. Over that time, the typical charter school student in Texas had stronger academic growth in reading and similar math growth as compared to their TPS counterpart. In reading, the learning difference amounted to 17 additional days for charter students when compared to their TPS counterparts. The trend across the three growth periods indicated the learning gains for charter school students showed a slight trend of improvement in reading and math. Our approach with repeated study of Texas charter schools is to shift the data window, dropping earlier periods and updating prior work with more recent performance data. Since we use the same methodology each time, a set of multiple CREDO studies provides a time series on performance. In Texas, the trend in both reading and math is positive. This study’s subgroup analyses show how the overall positive charter growth affects different student groups within the charter population. Appendix Table 1 shows the difference in performance that students in particular subgroups realize when compared with their TPS peers. Compared to the other student groups included in the study, Hispanic students and Hispanic students in poverty exhibit, on average, the best outcomes when enrolled in a charter school compared to TPS. These findings are present in both campus and open-enrollment charter schools. These are noteworthy findings given that Hispanic students make up approximately 64 percent of charter students and 74 percent of charter students in poverty.34 The study also shows that the gaps in growth between Black and White TPS students and Black and White charter students are still significant but they have become smaller than what we reported in CREDO’s previous 2015 study on Texas charters. The school level analysis showed that charter elementary schools are responsible for much of the improvement in charter school growth performance reported in this study. The report also found stronger growth in middle school while all other school levels showed growth that was not significantly different than TPS. In analyzing the effects of locales, the results indicate that charter students in suburban and rural locales perform similarly to their TPS peers in district schools in those locales. Students attending charter schools in towns exhibit, on average, the weakest outcomes compared to TPS students in their comparable locale. In Texas, urban charter students outperform their TPS counterparts in urban district schools. Approximately 70 percent of the state’s charter school population attends urban charter schools, representing the fastest growing segment of charters. Therefore, the performance of urban charters holds distinct and special interest.
34 Based on the students in our sample.

71
Charter schools’ service to students with Special Education needs and English Language Learners garners outsized attention in discussions about charter school. Texas charter schools enroll students with Special Education needs at similar percentages to district schools around the state. The proportion of ELL students in Texas charters is slightly higher than district schools. This study illustrates that ELL charter students exhibit similar growth to their ELL TPS peers. However, students with Special Education needs exhibit stronger outcomes in TPS, on average, than in charter schools. The study also addresses whether charter schools are helping students achieve at high academic levels. Since CREDO’s 2015 analysis of Texas charter school performance, the share of students above the 50th percentile of achievement has increased in both reading and math. In addition, sixty percent of Texas charter schools demonstrate positive academic growth in reading and 54 percent do so in math relative to their local TPS. Additionally, since the 2015 report, fewer charters in Texas fall into the category of having both below average growth and below average achievement. This study includes a brief analysis of Texas’ alternative charter schools. Due to the qualifying criteria for a school’s inclusion in Texas’ alternative accountability provisions, the number of students attending these schools represents less than one percent of the study population. This small sample size may contribute to the lack of significance seen in the reading and math growth effects. Thus growth for alternative charter schools must be considered not significantly different from either average TPS students or from students attending non-alternative charter schools. The additional factors of having the majority of the alternative population in charter schools and the heterogeneity of the population also prevent rigorous analysis at this time. In Texas, approximately 68 percent of charter schools belong to a network, either a Management Service Company (MSC) or a Charter Management Organization (CMO). The 2015 study on Texas Charter School Performance looked only at CMOs. When looking at network effects, this current study looks at CMOs and MSCs and shows student growth depending less on a school belonging to a network and more on the specific network to which a school belongs. Across CMOs, the strongest outcomes occur in math when compared to TPS. CREDO’s 2015 Online Charter School Study illustrated that overall, online (cyber) charter schools exhibit weaker growth in reading and math compared to traditional TPS and brick and mortar charter schools. The current study enforces these results showing students in online charter schools in Texas exhibiting weaker growth in reading and math than their peers in TPS and in brick and mortar charter schools. This study also examined any differences in reading or math growth attributable to campus charters compared to open-enrollment charter schools. The estimates of academic effects show similar reading and math growth for students attending campus charter schools and increased reading growth for students in open-enrollment charter schools. Black and Hispanic students achieve, on
72
average, better outcomes when attending campus charter schools than TPS. Hispanic students also see better outcomes when attending open-enrollment charters instead of TPS. Students in poverty exhibit their best reading and math outcomes when enrolled in an open-enrollment charter as opposed to TPS. Students enrolled in Special Education achieve their best reading outcomes in campus charters, while ELL students are best served in TPS. The analyses of this report display the direct product of statistical methods used to estimate the charter effect on the academic growth of charter students in Texas. The study utilizes these growth effects to group charter schools by growth and achievement in order to create hypothetical scenarios for the closure of low-performing charters and replication of high performing charters. Using the closure scenarios, we hypothesized that Texas would realize the largest charter effect if it were to resort to the severe measure of closing charter schools performing significantly worse than TPS (growth of 0.15 standard deviations less than traditional public schools). These effects are in addition to the baseline charter effect illustrated at the beginning of the study. The study also used the results to hypothesize outcomes if Texas were to keep open only schools that fall into certain replication criteria. Using this analysis of replication scenarios, the study hypothesized that the extreme measure of keeping only those charter schools exhibiting growth of more than 0.2 standard deviations would allow Texas to realize the largest charter effect.

73
Implications A few implications emerge from these results. Overall performance trends of Texas charter schools over the years are positive. We also find an established pattern of improvement from the 2012-2013 to 2014-2015 school year, especially evident in the charter effect on reading growth. Consistent effort is necessary to ensure charter schools continue offering a high quality education to all of their students. Hispanic charter students experience the greatest benefit from the positive growth trends of Texas’ charter schools, especially those charters in urban areas. As the largest demographic subgroup, urban Hispanic charter student improvement tells a story about how the charter sector in Texas is positively altering the academic trajectory for so many of its students. Aggregating beyond single schools, some charter networks in Texas stand out as strong examples of high performance; these networks may offer important lessons to other operators. Further research could foster better understanding of the organizational factors that explain the performance we observed. The capacity for oversight, the number and/or types of schools overseen by a single network, and authorization processes may all impact the effectiveness of any network in achieving positive student growth. Networks can view the high performing networks to figure out what specific policies and practices work for their unique student populations. Other findings in the study leave cause for concern. Compared to CREDO’s 2015 study, fewer charter schools post growth and achievement levels below the state average in either reading or in math. While this positive trend signals improvement among charter schools, these low growth/low achievement schools still hamper their students’ academic trajectories. Meeting the needs of Special Education and ELL students remains a challenge for Texas charter school providers. For each group, the proportion of students served is similar, yet their gains are not as strong as their respective TPS peers. This suggests a trend toward weaker growth for charter students in each of these subgroups. The prevention of this pattern should motivate charter schools to examine their programs targeted toward these students. The effect of Senate Bill 2’s stricter school performance evaluation is realized in the positive growth trend within Texas’ charter sector. The closure or revocation of 23 charters between 2013 and 2014 has had a positive effect on academic outcomes for many charter students in the state. Texas’ agreement to close four more charters at the end of the 2014-15 school year should continue to strengthen the charter sector through the provision of higher quality charter options for their

74
students.35 This increased accountability and subsequent closure of underperforming charters is an integral tool in improving Texas students’ academic performance. Stakeholders can see that Texas charter schools demonstrate progress, given the overall charter school performance and the academic growth of their students. This study surfaces important positive trends as well as areas of crucial concern and avenues for further research. Those areas where the data show room for improvement may be addressed if the Texas Charter Schools Association, State Legislature, and Texas Education Agency can continue to emphasize changes that engender higher academic quality and improved growth.
35 Texas Observer. A Christmas Crackdown on Texas Charter Schools (2014) http://www.dallasnews.com/news/local-politics/2013/04/11/texas-senate-votes-to-slowly-increase-number-of-charter-schools

75
Technical Appendix The numbers in the table below represent the number of charter observations associated with the corresponding results in the report. An equal number of VCRs were included in each analysis. Appendix Table 1: Summary of Statistical Significance of Findings for Texas Charter School Students Benchmarked Against White TPS Students (unless otherwise specified)
Reading MathTexas Charter Students Positive Not SignificantCharters in 2012-2013 Not Significant Not SignificantCharters in 2013-2014 Positive Not SignificantCharters in 2014-2015 Positive PositiveUrban TPS Students (compared to White Suburban TPS Students) Negative NegativeRural TPS Students (compared to White Suburban TPS Students) Not Significant Not SignificantTown TPS Students (compared to White Suburban TPS Students) Negative NegativeUrban Charter Students Positive Not SignificantSuburban Charter Students Not Significant Not SignificantRural Charter Students Not Significant Not SignificantTown Charter Students Negative NegativeElementary School Charter Students Positive PositiveMiddle School Charter School Students Positive Not SignificantHigh School Charter School Students Not Significant Not SignificantMulti-level School Charter School Students Not Significant Not SignificantFirst Year Enrolled in Charter School Negative NegativeSecond Year Enrolled in Charter School Positive PositiveThird Year Enrolled in Charter School Positive PositiveBlack Charter School Students Negative NegativeHispanic Charter School Students Negative NegativeCharter School Students in Poverty Negative NegativeBlack Charter School Students in Poverty Negative NegativeHispanic Charter School Students in Poverty Negative NegativeSpecial Education Charter School Students Negative NegativeEnglish Language Learner Charter School Students Negative NegativeCharter CMO Positive Not SignificantCharter Non-CMO Not Significant Not SignificantCharter CMO Elementary Schools Positive PositiveCharter Non-CMO Elementary Schools Positive Not SignificantCharter CMO Middle Schools Positive PositiveCharter Non-CMO Middle Schools Not Significant Not SignificantCharter CMO High Schools Not Significant Not SignificantCharter Non-CMO High Schools Positive PositiveCharter CMO Multi-level Schools Not Significant Not SignificantCharter Non-CMO Multi-level Schools Not Significant NegativeCharter Alternative Not Significant Not SignificantCharter Non-Alternative Positive Not SignificantCharter Alternative (compared to Charter Non-Alternative) Not Significant Not SignificantCharter Online Schools Negative NegativeCharter Brick and Mortar Schools (Non-Online) Positive PositiveCharter Online Schools (compared to Charter Brick and Mortar) Negative Negative

76
Reading MathCampus Charter School Students Not Significant Not SignificantOpen-Enrollment Charter School Students Positive Not SignificantBlack Campus Charter School Students Negative Not SignificantBlack Open-Enrollment Charter School Students Negative NegativeBlack Campus Charter Students (compared to Black Open-Enroll. Charter) Positive PositiveBlack Campus Charter Students (compared to Black TPS Students) Positive PositiveBlack Open-Enrollment Charter School Students (compared to Black TPS Students) Not Significant Not SignificantHispanic Campus Charter School Students Not Significant Not SignificantHispanic Open-Enrollment Charter School Students Negative NegativeHispanic Campus Charter Students (compared to Hispanic Open-Enroll. Charter) Positive PositiveHispanic Campus Charter Students (compared to Hispanic TPS Students) Positive PositiveHispanic Open-Enrollment Charter Students (compared to Hispanic TPS Students) Positive PositiveCampus Charter School Students in Poverty Negative NegativeOpen-Enrollment Charter School Students in Poverty Negative NegativeCampus Charter Students in Poverty (compared to Open-Enroll. Charter in Poverty) Negative NegativeCampus Charter Students in Poverty (compared to TPS Students in Poverty) Not Significant NegativeOpen-Enroll. Charter Students in Poverty (compared to TPS Students in Poverty) Positive PositiveSpecial Education Campus Charter School Students Negative NegativeSp. Education Open-Enrollment Charter School Students Negative NegativeSp. Education Campus Charter (compared to Special Ed. in Open-Enroll. Ch.) Not Significant Not SignificantSp. Education Campus Charter (compared to TPS Students in Special Ed.) Not Significant Not SignificantSp. Education Open-Enrollment Charter (compared to TPS Students in Special Ed.) Negative NegativeEnglish Language Learner Campus Charter School Students Negative NegativeEnglish Language Learner Open-Enrollment Charter School Students Negative NegativeEnglish Language Learner Campus Charter (compared to ELL Open-Enroll. Charter) Negative NegativeEnglish Language Learner Campus Charter (compared to ELL TPS Students) Negative NegativeEnglish Language Learner Open-Enroll. Charter (compared to ELL TPS Students) Negative NegativeElementary School Campus Charter Students Not Significant Not SignificantMiddle School Campus Charter School Students Not Significant Not SignificantHigh School Campus Charter School Students Positive PositiveMulti-level School Campus Charter School Students Not Significant Not SignificantElementary School Open-Enrollment Charter Students Positive PositiveMiddle School Open-Enrollment Charter School Students Positive Not SignificantHigh School Open-Enrollment Charter School Students Negative NegativeMulti-level School Open-Enrollment Charter School Students Not Significant Not Significant

77
Appendix Table 2: Number of Observations for All Results
Student Group
Reading MathTexas Charter Students Tested & Matched 284,597 248,782 Students in Charters in 2012-2013 82,669 80,227 Students in Charters in 2013-2014 95,425 80,844 Students in Charters in 2014-2015 106,503 87,711 Students in Urban Charter Schools 204,067 178,603 Students in Suburban Charter Schools 56,128 48,587 Students in Rural Charter Schools 13,726 11,798 Students in Town Charter Schools 6,328 5,984 Students in Elementary Charter School 65,101 64,211 Students in Middle School Charter Schools 67,108 65,526 Students in High School Charter Schools 34,190 18,097 Students in Multi-level School Charter Schools 118,177 100,941 Students First Year Enrolled in Charter School 82,539 75,305 Students in Second Year Enrolled in Charter School 28,548 23,514 Students in Third Year Enrolled in Charter School 7,306 6,575 Black Charter School Students 47,328 28,232 Hispanic Charter School Students 181,215 97,141 White Charter School Students 41,808 24,075 Charter School Students in Poverty 196,428 107,950 Black Charter School Students in Poverty 33,591 31,171 Hispanic Charter School Students in Poverty 147,093 128,035 Special Education Charter School Students 7,880 8,952 English Language Learner Charter School Students 40,007 37,795 Grade Repeating Charter School Students 6,478 5,700
Matched Charter Student Records
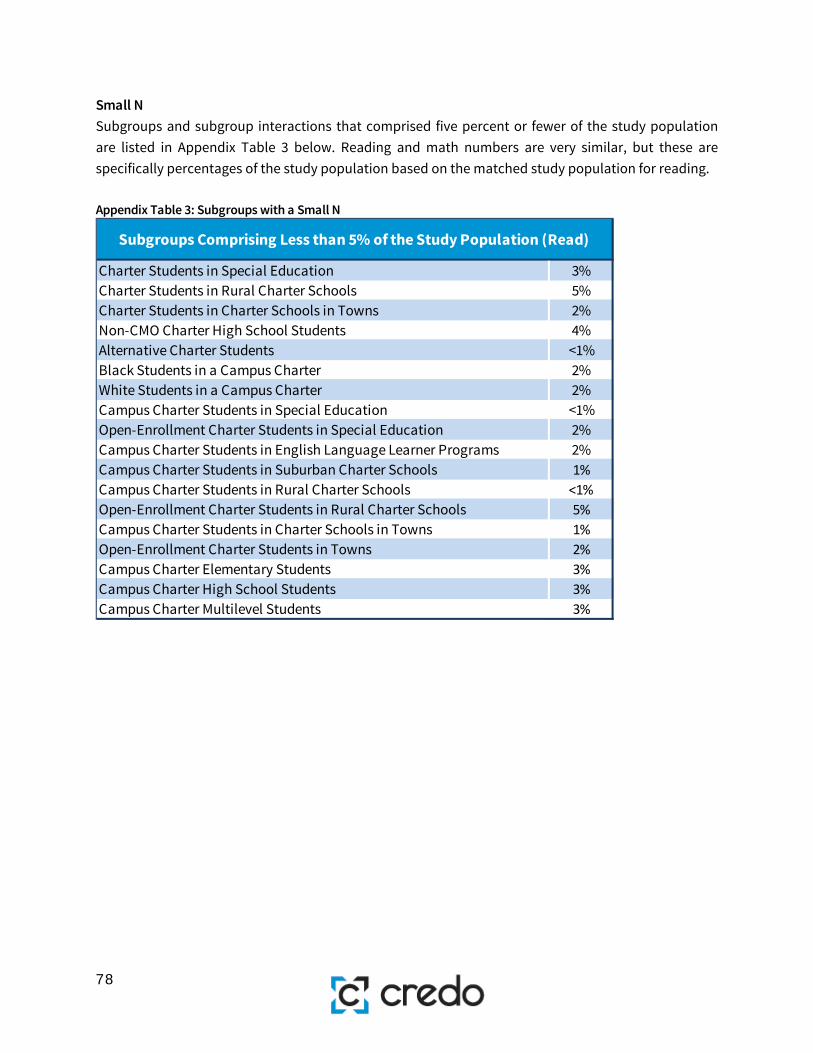
78
Small N Subgroups and subgroup interactions that comprised five percent or fewer of the study population are listed in Appendix Table 3 below. Reading and math numbers are very similar, but these are specifically percentages of the study population based on the matched study population for reading. Appendix Table 3: Subgroups with a Small N
Charter Students in Special Education 3%Charter Students in Rural Charter Schools 5%Charter Students in Charter Schools in Towns 2%Non-CMO Charter High School Students 4%Alternative Charter Students <1%Black Students in a Campus Charter 2%White Students in a Campus Charter 2%Campus Charter Students in Special Education <1%Open-Enrollment Charter Students in Special Education 2%Campus Charter Students in English Language Learner Programs 2%Campus Charter Students in Suburban Charter Schools 1%Campus Charter Students in Rural Charter Schools <1%Open-Enrollment Charter Students in Rural Charter Schools 5%Campus Charter Students in Charter Schools in Towns 1%Open-Enrollment Charter Students in Towns 2%Campus Charter Elementary Students 3%Campus Charter High School Students 3%Campus Charter Multilevel Students 3%
Subgroups Comprising Less than 5% of the Study Population (Read)
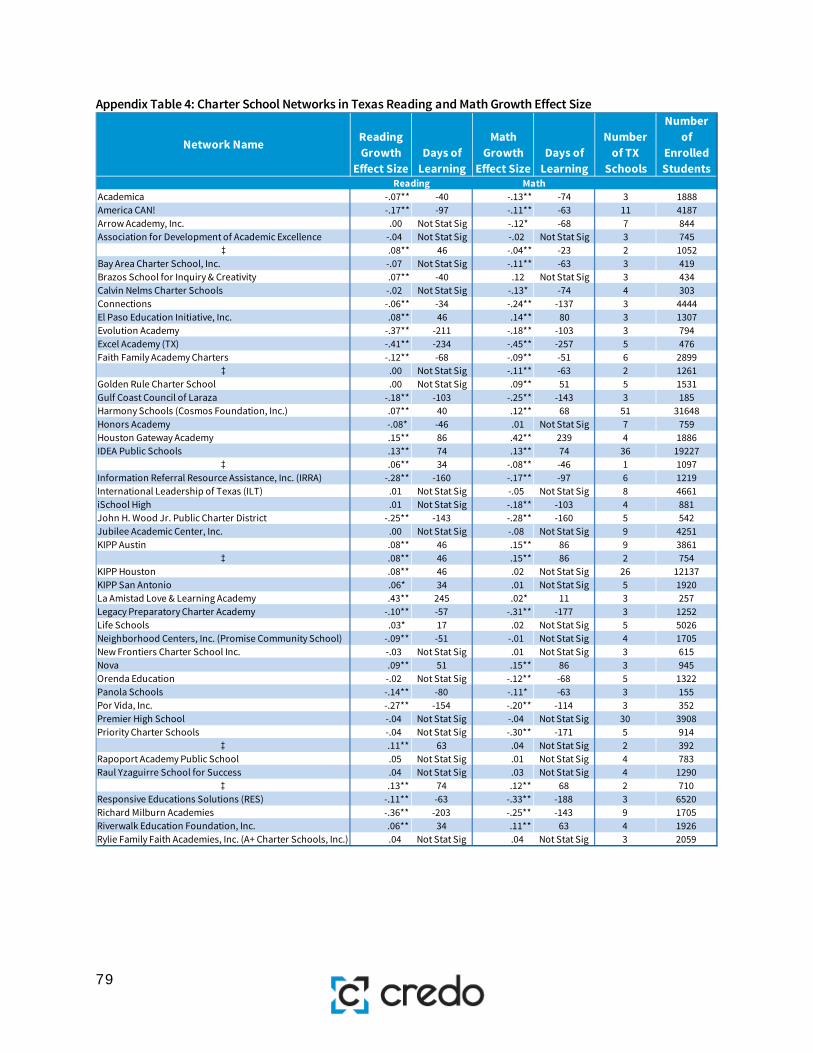
79
Appendix Table 4: Charter School Networks in Texas Reading and Math Growth Effect Size
Network Name Reading Growth
Effect SizeDays of
Learning
Math Growth
Effect Size Days of
Learning
Number of TX
Schools
Number of
Enrolled Students
Academica -.07** -40 -.13** -74 3 1888America CAN! -.17** -97 -.11** -63 11 4187Arrow Academy, Inc. .00 Not Stat Sig -.12* -68 7 844Association for Development of Academic Excellence -.04 Not Stat Sig -.02 Not Stat Sig 3 745
‡ .08** 46 -.04** -23 2 1052Bay Area Charter School, Inc. -.07 Not Stat Sig -.11** -63 3 419Brazos School for Inquiry & Creativity .07** -40 .12 Not Stat Sig 3 434Calvin Nelms Charter Schools -.02 Not Stat Sig -.13* -74 4 303Connections -.06** -34 -.24** -137 3 4444El Paso Education Initiative, Inc. .08** 46 .14** 80 3 1307Evolution Academy -.37** -211 -.18** -103 3 794Excel Academy (TX) -.41** -234 -.45** -257 5 476Faith Family Academy Charters -.12** -68 -.09** -51 6 2899
‡ .00 Not Stat Sig -.11** -63 2 1261Golden Rule Charter School .00 Not Stat Sig .09** 51 5 1531Gulf Coast Council of Laraza -.18** -103 -.25** -143 3 185Harmony Schools (Cosmos Foundation, Inc.) .07** 40 .12** 68 51 31648Honors Academy -.08* -46 .01 Not Stat Sig 7 759Houston Gateway Academy .15** 86 .42** 239 4 1886IDEA Public Schools .13** 74 .13** 74 36 19227
‡ .06** 34 -.08** -46 1 1097Information Referral Resource Assistance, Inc. (IRRA) -.28** -160 -.17** -97 6 1219International Leadership of Texas (ILT) .01 Not Stat Sig -.05 Not Stat Sig 8 4661iSchool High .01 Not Stat Sig -.18** -103 4 881John H. Wood Jr. Public Charter District -.25** -143 -.28** -160 5 542Jubilee Academic Center, Inc. .00 Not Stat Sig -.08 Not Stat Sig 9 4251KIPP Austin .08** 46 .15** 86 9 3861
‡ .08** 46 .15** 86 2 754KIPP Houston .08** 46 .02 Not Stat Sig 26 12137KIPP San Antonio .06* 34 .01 Not Stat Sig 5 1920La Amistad Love & Learning Academy .43** 245 .02* 11 3 257Legacy Preparatory Charter Academy -.10** -57 -.31** -177 3 1252Life Schools .03* 17 .02 Not Stat Sig 5 5026Neighborhood Centers, Inc. (Promise Community School) -.09** -51 -.01 Not Stat Sig 4 1705New Frontiers Charter School Inc. -.03 Not Stat Sig .01 Not Stat Sig 3 615Nova .09** 51 .15** 86 3 945Orenda Education -.02 Not Stat Sig -.12** -68 5 1322Panola Schools -.14** -80 -.11* -63 3 155Por Vida, Inc. -.27** -154 -.20** -114 3 352Premier High School -.04 Not Stat Sig -.04 Not Stat Sig 30 3908Priority Charter Schools -.04 Not Stat Sig -.30** -171 5 914
‡ .11** 63 .04 Not Stat Sig 2 392Rapoport Academy Public School .05 Not Stat Sig .01 Not Stat Sig 4 783Raul Yzaguirre School for Success .04 Not Stat Sig .03 Not Stat Sig 4 1290
‡ .13** 74 .12** 68 2 710Responsive Educations Solutions (RES) -.11** -63 -.33** -188 3 6520Richard Milburn Academies -.36** -203 -.25** -143 9 1705Riverwalk Education Foundation, Inc. .06** 34 .11** 63 4 1926Rylie Family Faith Academies, Inc. (A+ Charter Schools, Inc.) .04 Not Stat Sig .04 Not Stat Sig 3 2059
Reading Math

80
The value “Not Stat. Sig” indicates that the coefficient is not statistically significant and no reliable figure of days of learning can be calculated for this network.
Network Name Reading Growth
Effect SizeDays of
Learning
Math Growth
Effect Size Days of
Learning
Number of TX
Schools
Number of
Enrolled Students
School of Excellence in Education (SEE) -.05 Not Stat Sig -.15 Not Stat Sig 7 1115Ser-Ninos, Inc. .08** 46 .11** 63 3 1031Shekinah Learning Institute, Inc. -.09* -51 -.17* -97 12 1328Sky Partnership -.07 Not Stat Sig .01 Not Stat Sig 3 4297South Texas Education Technologies, Inc. -.06 Not Stat Sig -.03 Not Stat Sig 3 1125Southwest Schools (Educational Leadership Inc.) -.05 Not Stat Sig -.08 Not Stat Sig 7 3373Southwest Winners Foundation, Inc. -.24** -137 -.32** -182 5 898Student Alternatives Program Incorporated -.14** -80 -.08** -46 9 1179Tekoa Academy of Accelerated Studies .32** 182 .47** 268 4 426Texas Boys Choir .03 Not Stat Sig .00 Not Stat Sig 3 851Texas Education Centers (Salvaging Teens at Risk) -.07* -40 -.17* -97 4 480The University of Texas System (Tyler) -.08** -46 -.24** -137 3 545The Varnett School .08** 46 .07 Not Stat Sig 3 1614Trinity Charter Schools -.16 Not Stat Sig -.30** -171 3 291Two Dimensions Preparatory Charter .18** -103 .29** 165 3 533University of Texas - University Charter School -.20** -114 -.34** -194 15 743Uplift Education .09** 51 .03 Not Stat Sig 27 11158Vista Academies .05** 29 -.04 Not Stat Sig 22 4706Wayside Scools -.02 Not Stat Sig .00 Not Stat Sig 3 1368Winfree Academy Charter School -.27** -154 -.22** -125 6 1248YES Prep Public Schools .10** 57 .09** 51 12 9509
Reading Math