charter school growth and replication: volume icredo.stanford.edu/pdfs/cgar growth volume...
TRANSCRIPT

Volume I
1/30/2013
Charter School Growth and Replication: Volume I
Emily H. Peltason Margaret E. Raymond, Ph.D.
1/30/2013
Charter School Growth and Replication
Volume I

Charter School Growth and Replication
1/30/2013
Volume I
Emily H. Peltason Margaret E. Raymond, Ph.D.

iii
CREDO at Stanford University
434 Galvez Mall Stanford University Stanford, CA 94305-6010 CREDO, the Center for Research on Education Outcomes at Stanford University, was established to improve empirical evidence about education reform and student performance at the primary and secondary levels. CREDO at Stanford University supports education organizations and policymakers in using reliable research and program evaluation to assess the performance of education initiatives. CREDO’s valuable insight helps educators and policymakers strengthen their focus on the results from innovative programs, curricula, policies or accountability practices. http://credo.stanford.edu
Acknowledgements
This report, Charter School Growth and Replication: Volume I, is part of a larger set of studies on charter school effectiveness that CREDO is conducting. Throughout the past many months, several organizations and individuals have provided vital support for our efforts. We wish to thank them here. We are grateful for the collaboration from Robin Lake and the Center for Reinventing Public Education and Anna Nicotera with the National Alliance for Public Charter Schools. They were willing to share their listings of Charter Management Organizations with us to help ensure the widest possible sample of organization would be included in the study. We also appreciate the support from our partners in the 25 state education agencies. Our data access partnerships form the foundation of CREDO's work, without which studies like this would be impossible. We strive daily to justify the confidence you have placed on us. Primary funding of this study was provided by the Robertson Foundation. We are grateful for all of our funders’ generous support; however, we acknowledge that all results and opinions expressed in this report belong to CREDO.

iv
Executive Summary ....................................................................................... 1
Introduction ................................................................................................ 10
Charter School Maturation ............................................................................. 17
Genesis of Charter Management Organizations ................................................ 41
Appendix A: Sample Profile ........................................................................... 50
Appendix B: Sensitivity Tests on Growth Strategy ............................................ 52
List of References......................................................................................... 73
Table of Contents

v
Figure 1: Flagship Quality in Year Prior to Replication (Read) ............................. 41
Figure 2: Flagship Quality from Year Prior to Year of Replication (Math) .............. 42
Figure 3: Flagship Quality from Year Prior to Year of Replication (Read) .............. 43
Figure 4: Flagship Quality in Year Prior to Replication vs. Replication School Quality
in Year 1 (Math) ..................................................................................... 45
Figure 5: Flagship Quality in Year Prior to Replication vs. Replication School Quality
in Year 1 (Read) ..................................................................................... 46
Figure 6: Elementary Math ............................................................................ 62
Figure 7: Elementary Reading ........................................................................ 63
Figure 8: Middle School Math ......................................................................... 64
Figure 9: Middle School Reading .................................................................... 64
Figure 10: High School Math.......................................................................... 65
Figure 11: High School Reading ..................................................................... 66
Figure 12: Multilevel Math ............................................................................. 66
Figure 13: Multilevel Reading ........................................................................ 67
Figure 14: Elementary Math for Mixed Start Schools ......................................... 68
Figure 15: Elementary Reading for Mixed Start Schools .................................... 68
Figure 16: Middle School Math for Mixed Start Schools ..................................... 69
Figure 17: Middle Reading for Mixed Start Schools ........................................... 70
Figure 18: Multilevel Math for Mixed Start Schools ........................................... 70
Figure 19: Multilevel Reading for Mixed Start Schools ....................................... 71
Table of Figures

vi
Table 1: Mean Achievement by Age ................................................................ 19
Table 2: Observable Ages, by School Opening Year .......................................... 21
Table 3: Number of Growth Periods Observable, by Opening Year ...................... 21
Table 4: Effect Sizes by Quintile ..................................................................... 23
Table 5: First Year Starting Endowments in Math, by State ............................... 24
Table 6: First Year Starting Endowments in Reading, by State ........................... 25
Table 7: A Probability Framework, Part I ......................................................... 26
Table 8: A Probability Framework, Part II ........................................................ 27
Table 9: One-Year Conditional Probabilities in Math .......................................... 29
Table 10: One-Year Conditional Probabilities in Read ........................................ 30
Table 11: Two-Year Conditional Probabilities in Math ........................................ 31
Table 12: Two-Year Conditional Probabilities in Read ........................................ 32
Table 13: One-Year Conditional Probabilities in Elementary School Math ............. 33
Table 14: One-Year Conditional Probabilities in Elementary School Read ............. 34
Table 15: One-Year Conditional Probabilities in Middle School Math .................... 35
Table 16: One-Year Conditional Probabilities in Middle School Read .................... 35
Table 17: One-Year Conditional Probabilities in Multilevel School Math ................ 36
Table 18: One-Year Conditional Probabilities in Multilevel School Read ................ 36
Table 19: One-Year Conditional Probabilities in High School Math ....................... 37
Table 20: One-Year Conditional Probabilities in High School Read....................... 38
Table 21: Statistically Significant Differences between Quintile 1 and 5 Schools ... 39
Table 22: Years of Data Included by State ...................................................... 51
Table 23: Use of Growth Strategies by School Level ......................................... 54
Table 24: Use of Growth Strategies by School Level ......................................... 54
Table 25: Starting Scores of Students by Growth Strategy ................................ 56
Table of Tables

vii
Table 26: Elementary Schools and Students Served by Growth Strategy and
Opening Year ......................................................................................... 57
Table 27: Middle Schools and Students Served by Growth Strategy and Opening
Year ..................................................................................................... 58
Table 28: High Schools and Students Served by Growth Strategy and Opening Year
............................................................................................................ 58
Table 29: Multilevel Schools and Students Served by Growth Strategy and Opening
Year ..................................................................................................... 58

1
Executive Summary Introduction In meeting rooms across the United States, education leaders, policy makers and funders ask themselves the same question: "How can we expand the availability of high quality schools for America's children?" After decades of essentially flat performance, the challenges associated with designing, implementing and assessing education reform initiatives are apparent; most efforts to date have not been successful. Increasingly, the list of strategies includes identifying successful high-quality schools and encouraging their replication. In forty-three states, that approach focuses on charter schools -- public schools that are given a fixed-term contract with wider operating discretion than typical public schools and more definite performance review at the end of their term.
The notion of identifying successful schools and encouraging their expansion seems straightforward and logical. But in the charter school context, the desirable goal of better outcomes for students immediately encounters a set of three hurdles. There is a growing body of research, including prior work from CREDO, showing that the performance of charter schools varies widely, even after state policy differences are taken into account. The research shows that to date, high-performing charter schools are in the minority. Since these studies are typically a snap-shot of performance over a period of time, the question of how schools' quality changes over time is left unanswered. This is the first hurdle.
Putting aside the debate of how best to measure the performance of schools, there is an important question about when in a school's history to trust that the performance is sufficiently stable and reliable to serve as a fair gauge of the school's quality. The problem is acute in the charter sector, as charter school authorizers, charter school boards of directors and funders can attest. There is a commonly-held precept that "the first few years are rocky" but that schools eventually "grow out of it" into higher levels of performance. There arises a sort of indulgence for poor or volatile performance in a school's early years. Thus, the second hurdle is the choice of point where school performance is fair and dependable.
The third hurdle is the uncertainty of successful replication. While some of the elements of school start-up may be familiar, the skills and resources required to plan and launch a subsequent school while simultaneously keeping focus and

2
momentum in the flagship school are complex and challenging. Some operators have suggested that the level of complexity in managing multiple schools doesn't manifest until there are three schools, but the question of school performance -- both level of quality and consistency across the related schools -- applied regardless of the number of replications that are undertaken.
These three hurdles have real and immediate policy implications. A better understanding of each of them can support better planning by charter school operators and charter management organizations, more sensitive monitoring and review by charter school authorizers, and ultimately a healthier charter school sector. They form the basis for the study presented in this report.
Project Approach In this study, we test the idea that new charters hit their mark early in their operations and do not vary much after that. The notion originated from time spent in young charter schools studying their experience as new organizations and as agents of education reform. Interviews with school staff along with our own observations of school activities and operations have formed the impression that the “rules” of a school get set early on in the life of the school. By rules, we mean the adult and student cultures, the formal and informal procedures for identifying and addressing problems, and the school community's commitment to student learning as the primary focus of the school. These are obviously richly nuances facets of a school with myriad potential interactions among them, just as with any social organization. Yet, however they come about, we have observed that they are shaped quickly in new schools. Moreover, these norms and behaviors are sturdy and difficult (though not impossible) to change later on.
We conjectured that if our (admittedly limited) qualitatively-based hunch was true and more generally typical, it should be possible to observe the phenomenon quantitatively and test the hypothesis statistically. Using the broad range of data that CREDO has developed in partnership with 25 state education agencies, we follow student-level performance in schools from their opening through their fifth year. Their performance is used as the measure of school quality, and is computed for each charter school by year. Each charter school's performance is mapped against a static set of performance thresholds so that changes in performance over time can be discerned. The variation in performance confirms that historic methods of judging the impact of maturation on charter school quality are of limited value.
As schools mature, some of them elect to replicate; of those, many choose to build their own network of schools as charter management organizations (CMOs). We

3
define for the purposes of this study a CMO to consist of three or more schools. With the cooperation and guidance of the National Alliance of Public Charter Schools and the Center for Reinventing Public Education, we developed a directory of CMOs and their affiliated schools. While the available data does not extend into the past far enough to observe the birth of all CMOs, a limited number of CMO 'births" are evident in the data window at our disposal and it is possible to observe their flagship school's performance before and after replication.
The study then turns to an analysis of the performance of CMOs as an integral part of the charter sector. One hundred sixty-seven CMOs and 1372 of their schools are included in our evaluation of CMO performance. Using CREDO's Virtual Control Record (VCR) approach, we compare the performance of students in CMOs and independent charter schools to "virtual twins" that attend the same traditional public schools the charter school students would otherwise have attended. We probe a large number of questions about the performance of CMOs to try and determine the extent to which CMOs provide high-quality education outcomes for their students, both relative to independent charter school and to their counterpart traditional public schools. Related questions about their impacts on distinct student groups and their ability to influence the achievement gap are also investigated. In an effort to illustrate the wide range of performance across CMOs, we develop portfolio measures of academic impact and use these to test whether some a priori attributes of CMOs, things that might be available to authorizers or parents, associate with better academic success for their students.
For this study, we invent a new term -- super-networks -- to signify CMOs that have some of their member schools themselves develop into CMOs in their communities. Super-networks also have member schools who continue to operate as single schools, but we are interested in the overall results for super-networks because they are both a relatively new organizational form and are the organizations that are leading the sector in trying to take new models to scale.
We also analyze the impact on student learning in charter schools that have affiliated with Education Management Organizations (EMOs). A wide range of definitions exist for EMOs; we define an EMO as an organization that provides school operations to independent charter schools and CMOs under contract. They do not hold the charter and are engaged for a fixed term of service. Our examination of EMOs covers 38 different organizations with 410 schools included in the analysis. EMOs contract with charter school governing boards to handle the operations of the school under a contract. They may also provide contract operations to other traditional public schools, but in this study the focus is on the difference between EMOs and self-run schools, whether independent or CMO charter schools.

4
Findings
The analysis revealed thirteen major findings:
1. It is possible to organize a school to be excellent on Day One. New schools do not universally struggle in their early years; in fact, a surprising proportion in each gradespan produce strong academic progress from the start. Interestingly, the attributes of a school -- urban, high poverty or high minority -- have no relation to the performance of the school. Based on the evidence, there appears to be no structural "new school" phenomenon of wobbly performance for several years.
2. The initial signals of performance are predictive of later performance. We use the distribution of schools' value add for all schools in each of our included states, divided into quintiles, to map an individual charter school as being low performing (Quintile 1) or high performing (Quintile 5) or in-between. For middle and high schools, we can obtain an initial signal of performance at the end of the first year for a new school, since their enrolled students have prior test scores. The earliest we can measure an elementary school's quality is in the second year (since it takes two years to create a growth measure.)
Taking the first available performance measure and using it to predict one-year increments going forward, 80 percent of schools in the bottom quintiles of performance remain low performers through their fifth year. Additionally, 94 percent of schools that begin in the top quintile remain there over time.
If we wait until the third year to start the predictions (i.e. use two growth periods as the basis of setting the initial performance for the subsequent conditional probabilities), the patterns are even stronger: 89 percent of low performing schools remain low performing and 97 percent of all the high flyers persist at the top of the distribution.
Only the schools in the 2nd quintile show any substantial pattern of movement, with half of the schools moving to a higher quintile (mostly to the 3rd) and half remaining in the bottom two quintiles.
3. Substantial improvement over time is largely absent from middle schools, multi-level schools and high schools. Only elementary schools show an upward pattern of growth if they start out in the lower two quintiles. Elementary schools showed a greater tendency than other grade spans to be strong in one subject and weak in the other. In math, 80 percent of initially lowest-performing elementary schools showed enough improvement to move themselves out of the bottom of the distribution; from the 2nd quintile the share

5
was about 40 percent. In reading, the rise took longer to manifest, leaving about one-quarter of the schools in the lowest quintiles. About 40 percent of the 2nd quintile elementary schools improved into higher deciles. The elementary schools in the higher quintiles behaved similarly to other schools.
4. The process of morphing into CMOs can be successfully managed. For 21 new CMOs, we were able to observe as they moved from a single school to operating as a CMO. Most of the CMOs that are in operation today began before consistent accountability testing was adopted, but we are able to observe the "birth" of 21 CMOs during our study window. Due to small numbers, we are hesitant to place too much weight on the findings, but they present interesting patterns that merit discussion. Of these, 14 of the 21 have flagship schools with quality in the top two quintiles, with the notable counterpoint that 7 of the 21 flagships had performance that placed them in the bottom three quintiles. The math performance of the flagship school as the first replications occurred held steady or improved in the in 14 of 20 nascent CMOs for whom we have pre- and post-replication data. In reading, 11 of the 21 new CMOs held the flagship performance steady or posted improvements.
5. CMOs on average are pretty average. The growing focus and importance of CMOs in education reform discussions leads to questions about their contributions in the aggregate. To be included in our CMO impact analysis an operator needed to have at least three schools operating in our participating states during our study period. Across the 25 states in the study, a sample of 167 operating CMOs were identified for the years 2007 - 2011. CMOs on average are not dramatically better than non-CMO schools in terms of their contributions to student learning. The difference in learning compared to the Traditional Public school alternatives for CMOs is -.005 standard deviations in Math and .005 in reading; both these values are statistically significant, but obviously not materially different from the comparison.
6. CMOs post superior results with historically disadvantaged student subgroups. They produce stronger academic gains for students of color and student in poverty than those students would have realized either in traditional public schools (TPS) or in many categories what would have learned in independent charter schools.
7. The real story of CMOs is found in their range of quality. The measures of aggregate performance, however, mask considerable variation across CMOs in terms of their overall quality and impact. Across the 167 CMOs, 43 percent outpace the learning gains of their local TPS in reading; 37 percent of CMOs do so in math. These proportions are more positive than was seen for charter schools as a whole,

6
where 17 percent posted better results. However, about a third (37%) of CMOs have portfolio average learning gains that are significantly worse in reading, and half lag their TPS counterparts in math.
Interestingly, across the range of performance, the range of quality around the CMO's portfolio average is the same, regardless of the nominal value of the average. This finding holds regardless of the size or age of the portfolio.
8. CMO-affiliated new schools on average deliver larger learning gains than independent charter schools. However, both types of new charter schools still lag the learning gains in the average TPS. These effects were consistent for reading and math.
9. Two thirds of CMOs start new schools that are of the same or slightly better quality as the existing portfolio. This demonstrates the feasibility of replication, but also highlights that the resulting schools for the most part still mirror the overall distribution in CMO quality. The finding takes on more importance when considered in concert with the fact that the lowest third of CMOS replicate more rapidly than middling or high-performing CMOs. Of the 245 new schools that were started by CMOs over the course of this study, 121 (or 49 percent) were begun by Organizations whose average performance was in the bottom third of the range. Another 19 percent (47 schools) were started by CMOs in the middle third of the quality distribution. The final 77 new schools (31 percent) were opened by CMOs in the top third of the distribution. This finding highlights the need to be vigilant about which CMOs replicate; CMOs with high average learning gains remain high performers as they grow and CMOs with poor results remain inferior.
10. Few observable attributes of CMOs provide reliable signals of performance. We sought to identify attributes of CMOs that were associated with the overall quality of their portfolio. For the most part, most of the factors we examined had no value as external signals of CMO performance. Specifically, there is no evidence to suggest that maturity, size (by either number of schools or total enrollment) or the spatial proximity of the schools in the network have any significant relationship to the overall quality of the CMO portfolio. Operating in multiple states dampened a SMO's results on average. One bright signal was found in having a CMO be the recipient of a Charter School Growth Fund; those CMOs that were supported by the Charter School Growth Fund had significantly higher learning gains than other CMOs or independent charter schools.
11. CMOs that are driving to scale show that scale and quality are not mutually assured. Some CMO networks have grown to the point that some of their member schools have in turn replicated in their local communities; we refer to

7
these federated entities as super-networks. Performance as measured by student academic growth differs strikingly across the four super-networks we identified. Strong and positive learning gains were realized for students in the Uncommon Schools and KIPP super-networks. The other two, Responsive Education Solution (ResponsiveEd) and White Hat Management, had less favorable results.
12. Some CMOs get better over time. Besides replication, the alternate path to higher quality results is to improve all schools within the CMO portfolio. Tracking how the portfolio-wide average student learning gain in each CMO changes over time reveals the proportions of CMOs that have positive, negative or flat trajectories to their performance. Using statistical tests of differences, the trend analysis showed that about a third of CMOs has significant and positive growth in performance over time. In one quarter of CMOs, the average learning gain declines significantly over time. The rest of the CMOs remain stable. These findings illustrate that it is possible for CMOs to evolve their performance to higher levels. At the same time, the portfolio growth findings show that the largest share of CMOs do not change much from their initial levels of performance, which again returns to the underlying range in quality.
13. The average student in an Education Management Organizations (EMOs) posted significantly more positive learning gains than either CMOs, independent charter schools or the traditional public schools comparisons. Their results were also relatively more positive for black and Hispanic students and English Language Learners.
Implications The implications from the study are presented separately for each volume. Charter School Growth Implications 1. There is a great need for careful due diligence by authorizers during the approval process. The results also suggest that regular and uniform monitoring of charter school performance can lead to early identification of underperforming schools. While we worry that a shorter first term for charters would adversely affect the incentives to operators to open schools, the findings support the use of performance data at the end of the third year of operation to, if warranted, put schools on notice and to begin to document the case for action in the fourth or fifth year.

8
2. The lessons of this study also include the notion of authorizer triage. Most authorizers have limited resources, so deploying them where they have the highest impact is desirable. The temptation to focus on the lowest performing schools is not supported by this analysis, but attention to the schools in quintile two (or quintiles 1 and 2 for elementary schools) holds out more promising effects. At the other end of the spectrum, these findings begin to make the case for additional leeway to be granted to high-performing schools, especially after two years of such performance. These schools, with nearly incredible reliability, are likely to remain high performing in future years. Their early track record of success is highly predictive of future performance. 3. Poor first year performance simply cannot be overlooked or excused. For the majority of schools, poor first year performance will give way to poor second year performance. Once this has happened, the future is predictable and extremely bleak. For the students enrolled in these schools, this is a tragedy that must not be dismissed. 4. Permission to replicate should be based on absolute performance of the flagship school, not its performance relative to the existing stock of public schools. The evidence shows that authorizers allow charters in all but the lowest quintile of performance to grow into CMOs. We are cautious about pushing the limited analysis of schools evolving into CMOs beyond its limits, which are admittedly weakened by the small number of cases we can observe, but there is suggestive evidence that some authorizers are approving expansion applications on fragile grounds. CMO implications The findings about CMO development, replication and performance presented create a number of implications for funders, policy makers and authorizers going forward. 1. Addressing the information barrier that prevents regular assessment of CMO performance should be a priority for states. Many CMOs have different authorizers and schools in different states, so aggregating the data to see the overall performance of CMO s requires agreements across boundaries. 2. CMOs have shown dramatically better results with critical subpopulations; this wisdom should be captured and shared to provide even wider education opportunities for underserved students. CMOs with focused attention to underserved student groups have proven that strong outcomes

9
in both growth and achievement are possible. Those like KIPP and Uncommon Schools have shown that it is possible to be effective at scale. 3. Who is permitted to replicate matters enormously. Since improvement over time is not assured, great care is needed when considering requests for expansion. CMOs seeking to expand should be required to fully disclose the performance of all their schools in a consistent and comprehensible format. 4. Consistent replication of schools is possible, but not assured; one-third do not do it well. The findings show that when it comes to replication, “what you see is what you get”. A minor fraction of CMOs open schools that are better than their existing portfolio. Unless the CMO is high quality to begin with, there is only a small chance that better schools will be born. 5. Scale and quality are not synonyms. Today, less than 6 percent of schools are charter schools and CMOs comprise about one-fifth of the total. To get the leverage from CMOs into the larger education community, CMOs must proliferate in number and size. To get the high quality instruction for students via CMOs, it is important to focus support and attention on those CMOs that are proven providers. Such an approach places quality as a pre-requisite for quantity. 6. As for individual schools, what matters most for eventual CMO quality is to assure that the schools that are started have high performance early. The story that is revealed by the study of CMOs is analogous to that for individual charter schools: successive additions to a charter portfolio tend to hover around the existing average, regardless of the nominal level of performance. Early performance of the CMO is related to later performance, so attention in each and every school to a high quality launch is essential, not just for the students in each new school but for the history that is created for the remaining life of the CMO.

10
Introduction
In meeting rooms across the United States, education leaders, policy makers and funders ask themselves the same question: "How can we expand the availability of high quality schools for America's children?" After decades of essentially flat performance, the challenges associated with designing, implementing and assessing education reform initiatives are apparent; most efforts to date have not been successful. Increasingly, the list of strategies includes identifying successful high-quality schools and encouraging their replication. In forty-three states, that approach focuses on charter schools -- public schools that are given a fixed-term contract with wider operating discretion than typical public schools and more definite performance review at the end of their term.
The notion of identifying successful schools and encouraging their expansion seems straightforward and logical. But in the charter school context, the desirable goal of better outcomes for students immediately encounters a set of three hurdles. There is a growing body of research, including prior work from CREDO, showing that the performance of charter schools varies widely, even after state policy differences are taken into account. The research shows that to date, high-performing charter schools are in the minority. Since these studies are typically a snap-shot of performance over a period of time, the question of how schools' quality changes over time is left unanswered. This is the first hurdle.
Putting aside the debate of how best to measure the performance of schools, there is an important question about when in a school's history to trust that the performance is sufficiently stable and reliable to serve as a fair gauge of the school's quality. The problem is acute in the charter sector, as charter school authorizers, charter school boards of directors and funders can attest. There is a commonly-held precept that "the first few years are rocky" but that schools eventually "grow out of it" into higher levels of performance. There arises a sort of indulgence for poor or volatile performance in a school's early years. Thus, the second hurdle is the choice of point where school performance is fair and dependable.
The third hurdle is the uncertainty of successful replication. While some of the elements of school start-up may be familiar, the skills and resources required to plan and launch a subsequent school while simultaneously keeping focus and momentum in the flagship school are complex and challenging. Some operators have suggested that the level of complexity in managing multiple schools doesn't manifest until there are three schools, but the question of school performance --

11
both level of quality and consistency across the related schools -- applied regardless of the number of replications that are undertaken.
These three hurdles have real and immediate policy implications. A better understanding of each of them can support better planning by charter school operators and charter management organizations, more sensitive monitoring and review by charter school authorizers, and ultimately a healthier charter school sector. They form the basis for the study presented in this report.
About This Study
In this study, we test the idea that new charters hit their mark early in their operations and do not vary much after that. The notion originated from time spent in young charter schools studying their experience as new organizations and as agents of education reform. Interviews with school staff along with our own observations of school activities and operations have formed the impression that the “rules” of a school get set early on in the life of the school. By rules, we mean the adult and student cultures, the formal and informal procedures for identifying and addressing problems, and the school community's commitment to student learning as the primary focus of the school. These are obviously richly nuances facets of a school with myriad potential interactions among them, just as with any social organization. Yet, however they come about, we have observed that they are shaped quickly in new schools. Moreover, these norms and behaviors are sturdy and difficult (though not impossible) to change later on.
If our admittedly limited, qualitatively-based conjecture is true and more generally supported, we conjectured that it should be possible to observe the phenomenon quantitatively and test the hypothesis statistically. Using the broad range of data that CREDO has developed in partnership with 25 state education agencies, we follow student-level performance in schools from their opening through their fifth year. Their performance is mapped against a static set of performance thresholds so that changes in performance over time can be discerned. The variation in performance confirms that historic methods of judging the impact of maturation on charter school quality are of limited value.
As schools mature, some of them elect to replicate; of those, many choose to build their own network of schools as charter management organizations (CMOs). We define for the purposes of this study a CMO to consist of three or more schools. With the cooperation and guidance of the National Alliance of Public Charter Schools and the Center for Reinventing Public Education, we developed a directory of CMOs and their affiliated schools. While the available data does not extend into the past

12
far enough to observe the birth of all CMOs, a limited number of CMO 'births" are evident in the data window at our disposal and it is possible to observe their flagship school's performance before and after replication.
The study then turns to an analysis of the performance of CMOs as an integral part of the charter sector. One hundred sixty-seven CMOs and 1372 of their schools are included in our evaluation of CMO performance. We probe a large number of questions about the performance of CMOs to try and determine the extent to which CMOs provide high-quality education outcomes for their students, both relative to independent charter school and to their counterpart traditional public schools. Related questions about their impacts on distinct student groups and their ability to influence the achievement gap are also investigated. In an effort to illustrate the wide range of performance across CMOs, we develop portfolio measures of academic impact and use these to test whether some a priori attributes of CMOs, things that might be available to authorizers or parents, associate with better academic success for their students.
For this study, we invent a new term -- super-networks -- to signify CMOs that have some of their member schools themselves develop into CMOs in their communities. Super-networks also have member schools who continue to operate as single schools, but we are interested in the overall results for super-networks because they are both a relatively new organizational form and are the organizations that are leading the sector in trying to take new models to scale.
We also analyze the impact on student learning in charter schools that have affiliated with Education Management Organizations (EMOs). Our examination of EMOs covers 38 different organizations with 410 schools included in the analysis. EMOs contract with charter school governing boards to handle the operations of the school under a contract. They may also provide contract operations to other traditional public schools, but in this study the focus is on the difference between EMOs and self-run schools, whether independent or CMO charter schools.
Overview of the Findings
The analysis revealed thirteen major findings:
1. It is possible to organize a school to be excellent on Day One. New schools do not universally struggle in their early years; in fact, a surprising proportion in each gradespan produce strong academic progress from the start. Interestingly, the attributes of a school -- urban, high poverty or high minority --

13
have no relation to the performance of the school. Based on the evidence, there appears to be no structural "new school" phenomenon.
2. The initial signals of performance are predictive of later performance. We use the distribution of schools' value add for all schools in each of our included states, divided into quintiles, to map an individual charter school as being low performing (Quintile 1) or high performing (Quintile 5) or in-between. For middle and high schools, we can obtain an initial signal of performance at the end of the first year for a new school, since their enrolled students have prior test scores. The earliest we can measure an elementary school's quality is in the second year (since it takes two years to create a growth measure.)
Taking the first available performance measure and using it to predict one-year increments going forward, 80 percent of schools in the bottom quintiles of performance remain low performers through their fifth year. Additionally, 94 percent of schools that begin in the top quintile remain there over time.
If we wait until the third year to start the predictions (i.e. use two growth periods as the basis of setting the initial performance for the subsequent conditional probabilities), the patterns are even stronger: 89 percent of low performing schools remain low performing and 97 percent of all the high flyers persist at the top of the distribution.
Only the schools in the 2nd quintile show any substantial pattern of movement, with half of the schools moving to a higher quintile (mostly to the 3rd) and half remaining in the bottom two quintiles.
3. Substantial improvement over time is largely absent from the lowest- performing middle schools, multi-level schools and high schools. Only elementary schools show an upward pattern of growth if they start out in the lower two quintiles. Elementary schools showed a greater tendency than other grade spans to be strong in one subject and weak in the other. In math, 80 percent of initially lowest-performing elementary schools showed enough improvement to move themselves out of the bottom of the distribution; from the 2nd quintile the share was about 40 percent. In reading, the rise took longer to manifest, leaving about one-quarter of the schools in the lowest quintiles. About 40 percent of the 2nd quintile elementary schools improved into higher deciles. The elementary schools in the higher quintiles behaved similarly to other schools.
4. The process of morphing into CMOs can be successfully managed. For 21 new CMOs, we were able to observe as they moved from a single school to operating as a CMO. Most of the CMOs that are in operation today began before consistent accountability testing was adopted, but we are able to observe the

14
"birth" of 21 CMOs during our study window. Due to small numbers, we are hesitant to place too much weight on the findings, but they present interesting patterns that merit discussion. Of these, 14 of the 21 have flagship schools with quality in the top two quintiles, with the notable counterpoint that 7 of the 21 flagships had performance that placed them in the bottom three quintiles. The math performance of the flagship school as the first replications occurred held steady or improved in the in 14 of 20 nascent CMOs for whom we have pre- and post-replication data. In reading, 11 of the 21 new CMOs held the flagship performance steady or posted improvements.
5. CMOs on average are pretty average. The growing focus and importance of CMOs in education reform discussions leads to questions about their contributions in the aggregate. To be included in our CMO impact analysis an operator needed to have at least three schools operating in our participating states during our study period. Across the 25 states in the study, a sample of 167 operating CMOs were identified for the years 2007 - 2011. CMOs on average are not dramatically better than non-CMO schools in terms of their contributions to student learning. The difference in learning compared to the Traditional Public school alternatives for CMOs is -.005 standard deviations in Math and .005 in reading; both these values are statistically significant, but obviously not materially different from the comparison.
6. CMOs post superior results with historically disadvantaged student subgroups. They produce stronger academic gains for students of color and student in poverty than those students would have realized either in traditional public schools (TPS) or in many categories what would have learned in independent charter schools.
7. The real story of CMOs is found in their range of quality. The measures of aggregate performance, however, mask considerable variation across CMOs in terms of their overall quality and impact. Across the 167 CMOs, 43 percent outpace the learning gains of their local TPS in reading; 37 percent of CMOs do so in math. These proportions are more positive than was seen for charter schools as a whole, where 17 percent posted better results. However, about a third (37%) of CMOs have portfolio average learning gains that are significantly worse in reading, and half lag their TPS counterparts in math.
Interestingly, across the range of performance, the range of quality around the CMO's portfolio average is the same, regardless of the nominal value of the average. This finding holds regardless of the size or age of the portfolio.

15
8. CMO-affiliated new schools on average deliver larger learning gains than independent charter schools. However, both types of new charter schools still lag the learning gains in the average TPS. These effects were consistent for reading and math.
9. Two thirds of CMOs start new schools that are of the same or slightly better quality as the existing portfolio. This demonstrates the feasibility of replication, but also highlights that the resulting schools for the most part still mirror the overall distribution in CMO quality. This finding highlights the need to be vigilant about which CMOs replicate; CMOs with high average learning gains remain high performers as they grow and CMOs with poor results remain inferior.
10. Few observable attributes of CMOs provide reliable signals of performance. We sought to identify attributes of CMOs that were associated with the overall quality of their portfolio. For the most part, most of the factors we examined had no value as external signals of CMO performance. Specifically, there is no evidence to suggest that maturity, size (by either number of schools or total enrollment) or the spatial proximity of the schools in the network have any significant relationship to the overall quality of the CMO portfolio. Operating in multiple states dampened a SMO's results on average. One bright signal was found in having a CMO be the recipient of a Charter School Growth Fund; those CMOs that were supported by the Charter School Growth Fund had significantly higher learning gains than other CMOs or independent charter schools.
11. CMOs that are driving to scale show that scale and quality are not mutually assured. Some CMO networks have grown to the point that some of their member schools have in turn replicated in their local communities; we refer to these federated entities as super-networks. Performance as measured by student academic growth differs strikingly across the four super-networks we identified. Strong and positive learning gains were realized for students in the Uncommon Schools and KIPP super-networks. The other two, Responsive Education Solution (ResponsiveEd) and White Hat Management, had less favorable results.
12. Some CMOs get better over time. Besides replication, the alternate path to higher quality results is to improve all schools within the CMO portfolio. Tracking how the portfolio-wide average student learning gain in each CMO changes over time reveals the proportions of CMOs that have positive, negative or flat trajectories to their performance. Using statistical tests of differences, the trend analysis showed that about a third of CMOs has significant and positive growth in performance over time. In one quarter of CMOs, the average learning gain declines significantly over time. The rest of the CMOs remain stable. These findings

16
illustrate that it is possible for CMOs to evolve their performance to higher levels. At the same time, the portfolio growth findings show that the largest share of CMOs do not change much from their initial levels of performance, which again returns to the underlying range in quality.
13. The average student in an Education Management Organizations (EMOs) posted significantly more positive learning gains than either CMOs, independent charter schools or the traditional public schools comparisons. Their results were also relatively more positive for black and Hispanic students and English Language Learners.
About this Report
Given the large amount of analysis presented in this report, it is presented in two volumes. This choice is further supported by the fact that the two halves of the study -- Growth and Maturation and the impact analysis of CMOs use different research designs and analytic methods. In many ways they are distinct studies, but are drawn together here by the overarching story of "birth-growth-replication-network" phases of charter schools, and indeed the movement.
Following this Introduction, Volume I presents the analysis of Charter Growth and Maturation. Support materials for this study are included in Volume 1 for ease of access. Volume 2 contains the study of CMO and EMO performance. In parallel, all supporting materials are places in Appendices immediately following the report.
The Technical Appendix contains the deep details of the data, research design, dataset development and statistical modeling that went into each study as well as any sensitivity tests that were conducted over the course of the project.

17
Charter School Maturation An enduring and opposing tension arises frequently in discussions of charter school performance studies. When variation in the stock of charter schools is observed, there is a tendency to attribute this variation to the disproportionate immaturity of schools in the sample. Because young schools are thought to be lower-performing, and because they often comprise an outsized portion of the sample studied, it is assumed that much of the variation in student performance can be explained by variation in the life stages of the charter schools represented in the study. And yet, nearly all of the statistical analysis that has been done on charter schools makes the de facto assumption that all schools in the sample are of equivalent maturity. There is an inclination, then, to dismiss findings of poor performance due to the preponderance of young schools that make up the growing charter school population, and yet to avoid exploring or controlling for this factor directly. This tension is compounded by the complementary prevailing wisdom in the charter school movement: as they find their organizational footing in their first several years of operation, charter schools can be expected to improve their performance. Because of this widely accepted wisdom, poor performance in young schools, in particular, is routinely excused and overlooked. In fact, there is very little analysis that either confirms or debunks this assumption; it is perhaps so broadly accepted as to discourage further study. As interested citizens and analysts, then, we are left with the sense that developmental stage might partially explain variation in school performance, but without a sophisticated understanding of how this process might work, or how the performance trajectory of new schools develops over time. In this chapter, we attempt to correct this gap in knowledge. We are motivated to do this work not only by a suspicion that there is more to the story than typically understood, but also by the conviction that authorizers both desire and require more sensitive insight into charter school performance in order to execute their duties. Traditional efforts to study maturation, few as they are, have not provided authorizers or policymakers with information that can be efficiently used to plan, scale, or intervene in the charter sector. And to the extent that it relies on untested wisdom, the information currently in use may even be misleading. In this study, we begin from the assumption that variation in quality among charter schools will be observed at every life stage. From this initial assumption, we divide schools into performance quintiles and then estimate the probability that charter
18
schools will move from their original quintile of quality to higher or lower levels of performance as they age. Such odds may provide useful information for accountability and authorizing, as well as inform school reform efforts. Our findings suggest that, contrary to the conventional wisdom, charter school performance is remarkably stable at every stage of maturity. Initial performance is not merely a school’s opening swing, but is instead strongly related to later performance. This effect becomes further pronounced if conditional probabilities are viewed over a two-year time span. Consistency extends even to the middle quintiles of performance: in the lowest and top three highest quintiles, there is little volatility from one year to the next. The exceptions to this overarching trend are found among second quintile schools, which move up and remain stable the following year in about equal numbers, and among elementary schools, where volatility extends to the both the first and second quintiles of performance. Analytic Approach During school visits, CREDO researchers observed that many schools appeared to become entrenched in their overall performance patterns. Great schools excelled from the very beginning, and low-performing schools struggled from very early days. With few exceptions, we noticed, these performance patterns tended to endure with relative stability even as schools came into maturity. Our analytic approach has been framed to test this hypothesis. This observed pattern runs contrary to the conventional wisdom. It also contradicts, at least partially, the existing literature. Though rare, there have been some efforts to study the impact of charter school maturity on performance (primarily Zimmer et al., 2009; Hanushek, Kain, et al., 2007; Bifulco and Ladd, 2006; Sass, 2006; Booker, Gilpatric, et al., 2007). Typically, these efforts to study the ways in which school improve, or fail to improve, with maturity have looked at the question straightforwardly: Do older schools outperform younger schools? To answer this question, researchers have estimated the average school performance and then statistically compared that average by age to test whether charters improve with advancing maturity. Some researchers have also controlled for the effects of age in order to study other features of school performance. These researchers have primarily been interested in the impact of student persistence – that is, the effects of students’ continued enrollment over time, as distinct from school age – which has been shown to be associated with improved student performance (CREDO, 2009; Bifulco and Ladd, 2006; Booker, Gilpatric, et al., 2007). In most of these studies, findings suggest that schools do improve with
19
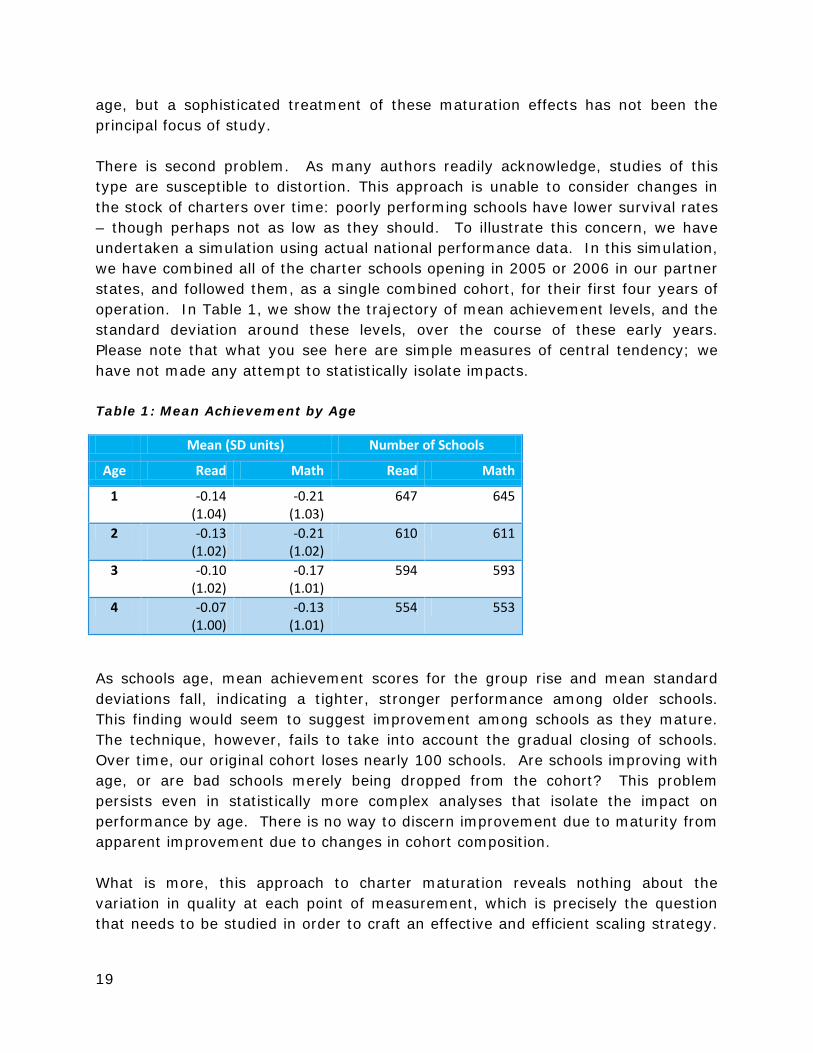
age, but a sophisticated treatment of these maturation effects has not been the principal focus of study. There is second problem. As many authors readily acknowledge, studies of this type are susceptible to distortion. This approach is unable to consider changes in the stock of charters over time: poorly performing schools have lower survival rates – though perhaps not as low as they should. To illustrate this concern, we have undertaken a simulation using actual national performance data. In this simulation, we have combined all of the charter schools opening in 2005 or 2006 in our partner states, and followed them, as a single combined cohort, for their first four years of operation. In Table 1, we show the trajectory of mean achievement levels, and the standard deviation around these levels, over the course of these early years. Please note that what you see here are simple measures of central tendency; we have not made any attempt to statistically isolate impacts. Table 1: Mean Achievement by Age
Mean (SD units) Number of Schools
Age Read Math Read Math
1 -0.14 (1.04)
-0.21 (1.03)
647 645
2 -0.13 (1.02)
-0.21 (1.02)
610 611
3 -0.10 (1.02)
-0.17 (1.01)
594 593
4 -0.07 (1.00)
-0.13 (1.01)
554 553
As schools age, mean achievement scores for the group rise and mean standard deviations fall, indicating a tighter, stronger performance among older schools. This finding would seem to suggest improvement among schools as they mature. The technique, however, fails to take into account the gradual closing of schools. Over time, our original cohort loses nearly 100 schools. Are schools improving with age, or are bad schools merely being dropped from the cohort? This problem persists even in statistically more complex analyses that isolate the impact on performance by age. There is no way to discern improvement due to maturity from apparent improvement due to changes in cohort composition. What is more, this approach to charter maturation reveals nothing about the variation in quality at each point of measurement, which is precisely the question that needs to be studied in order to craft an effective and efficient scaling strategy.

20
The trajectories of individual schools are masked. For example, two different cohorts might produce identical means and standard deviations, but in one case top and bottom schools change places, and in a second case, no school moves at all. Analyses of this type provide no information regarding the likelihood of these sorts of changes. Where might schools end up, conditioned on their starting scores? Which low-performing schools have the best chances for improvement? We contend that this information can bring invaluable and concrete insight to discussions of chartering policy. Building from this notion, the fundamental aim of this analysis is to examine variation in school performance during what typically comprises the first chartering period: the first five years of operation. Beginning from our national sample of student-level data, we have followed schools from their birthday for up to four ensuing growth periods. After establishing the quality levels of these young schools using objective and consistent criteria, we monitored their movement among these quality levels over time – remaining open to the possibility that these trajectories will differ according to schools’ starting signals. Finally, we assessed the likelihood that particular schools, given their initial quality signals, would alter their performance trajectory. Data Preparation This study includes data for charter schools1 from 23 partner states, New York City, and the District of Columbia, in consecutive school years from 2005-06 to 2009-10. For a complete list of student counts, states, and years included, please see Appendix A of this volume. It is important to note that our ability to include data from each charter school in our partner states is influenced by the number of available years of student data. We refer to this as the “data window.” Our data window begins in the 2005-06 school year and ends in 2009-10. Thus, for example, a school that opens in 2008-09 can only be followed through the age of two. And because we need two consecutive years of student scores in order to calculate average learning gains, a school that opens in 2004-05 can only be followed starting at age three.
1 All comparisons in Volume 1 are between charters only. This data does not contain TPS schools.

21
Table 2 illustrates the range of school ages that we can track throughout our data window. Note the sliding effect. Table 2: Observable Ages, by School Opening Year Ages of School Observed School’s First Academic Year 1 2 3 4 5 6 7 8 9 10
2000-01 x x x x 2001-02 x x x x 2002-03 x x x x 2003-04 x x x x 2004-05 x x x x 2005-06 x x x x 2006-07 x x x x 2007-08 x x x 2008-09 x x 2009-10 x
In addition, we are only able to observe a maximum of four growth periods for any individual school, depending on the calendar year in which the school opened its doors. Table 3: Number of Growth Periods Observable, by Opening Year School's First Academic Year Number of Growth Periods Tracked
2006-07 or Earlier
2007-08 2008-09 2009-10
1 x 2 x x 3 x x x 4 x x x x
The number of growth periods that we observe depends not only on the schools’ opening years, as indicated in the above tables, but also on the grade levels offered. If schools open one grade at a time, or “slow grow,” they may be excluded from our analysis during their initial year of operation due to insufficient numbers of tested students. If they open with Kindergarten and grow annually by one grade, for example, elementary schools may not have test data available for the first several years of operation. We were sufficiently concerned about the systematic

22
exclusion of certain schools to undertake a secondary exploration of charter schools’ differing approaches to growth and expansion. We found that the overall level and trajectory of performance in new charter schools was higher if charters opened and grew one grade at a time compared to opening with multiple grades or their full grade span enrolled. Further details on this corollary analysis are included in Appendix B. In each state, student scores in math and reading were uniformly standardized so that every student was placed relative to her peers in her own state. Standardization makes it possible to compare charter student performance across multiple states and through multiple years. Charter School Effect Sizes This study relies on the statistical estimation of the performance of every school for as many as four growth periods. We isolate that measure using a statistical regression that computes the average student learning gain, after controlling for individual student characteristics such as prior performance, race/ethnicity, gender, program participation, and peer effects, such as grade-level concentration of poverty and student mobility. Once these influential factors have been neutralized, the model uses state average annual growth over the period to estimate the school-by-year contribution to learning for each charter school in our sample in every year. This procedure is done separately for each state. The results for each school were compared to the state growth averages for all schools, meaning that each school’s learning gain – its effect size – for each year was computed relative to the statewide average effect size that includes all public schools, both charter and non-charter. Additional technical details of our modeling approach are available in the technical appendix. Please do note, however, that this study does not employ CREDO’s Virtual Control Record (VCR) methodology. Post Hoc Dataset Once each state’s school-by-year effect sizes were computed separately, we combined all of these effect sizes into a post hoc pooled dataset that spanned all calendar years, states, and ages available. The post hoc dataset contains 11,176 observations in reading and 11,105 observations in math. Each observation represents one school-by-age measure of performance. Individual schools will have anywhere from one to four unique observations, depending on the conditions described in the preceding section. It is this combined regression output that forms the basis of the descriptive analysis of the paths charter schools follow as they grow up. Quintiles of Quality In setting our objective and consistent levels of quality, we began by examining the distribution of quality among schools in their first year of operation. Consolidating all first year effect sizes across our data window, we

23
arrayed effect size values from most negative to most positive. This distribution shows considerable variation. In math, for example, first year effect sizes, which are in standard deviation units, range from -1.19 to +1.19. In reading, they range from -1.15 to +.75. Because the standard of comparison, or “zero line,” is the statewide average annual effect size across all schools, effect sizes above zero indicate growth larger than the statewide average, and effect sizes below zero indicate growth below the statewide average. Remarkably, across our national sample 43% of charter schools in reading, and 40% of charter schools in math, have first year effect sizes larger than the statewide average. Considering the concentration of these schools in dramatically underserved areas, the incidence of large proportions of schools that beat the statewide average is impressive. Moreover, it demonstrates that the assumption that schools will inevitably struggle during their first year of operation is more a comment about quality than it is about structural operations. In order to observe whether schools were improving over time, it was important to create a static set of benchmarks that could serve as signposts to stratify school performance. We have divided this initial distribution of effect sizes into quintiles based on the range of quality for first year charter schools. Quintile cut points distribute around the statewide mean effect size, though they do not – and need not – center precisely on zero. Quintile demarcations are displayed in Table 4. Table 4: Effect Sizes by Quintile Quintile 1 Quintile 2 Quintile 3 Quintile 4 Quintile 5
Read -1.15 to -.2 -.2 to -.07 -.07 to .02 .02 to .13 .13 to .75
Math -1.19 to -.3 -.3 to -.14 -.14 to .00 .00 to .14 .14 to 1.19
States do congregate differently in the pooled first year distribution. In Tables 5 and 6 below, the percentage of first year schools falling into each quintile, by state, is displayed.2 3 For a variety of reasons, including both sector quality and targeted
2 Note that “NX” refers to New York State, as distinct from New York City. For purposes of this study, greater New York and New York City were treated as distinct states. 3 Six states have fewer than 10 first year observations. For Massachusetts and upstate New York, this is because the preponderance of new schools during this period were “slow grow” schools, thus reducing the number of first year schools with available test data. In North Carolina, New Mexico, Tennessee, and Rhode Island, the number of first year school observations is affected by generally small numbers of new charter schools opening during

24
charter student population relative to the statewide average, certain states cluster at one end of the quintile spectrum or the other.4 Table 5: First Year Starting Endowments in Math, by State Quintile State 1 2 3 4 5 Total AR 23% 38% 23% 15% 0% 13 AZ 5% 21% 30% 19% 26% 43 CA 23% 19% 21% 17% 20% 238 CO 9% 12% 35% 32% 12% 34 DC 22% 33% 6% 17% 22% 18 FL 15% 32% 24% 24% 6% 85 GA 11% 17% 31% 28% 14% 36 IL (Chicago) 8% 25% 50% 17% 0% 12 IN 15% 25% 25% 20% 15% 20 LA 20% 37% 17% 20% 6% 35 MA 40% 20% 40% 0% 0% 5 MI 0% 5% 14% 27% 55% 22 MN 30% 20% 10% 20% 20% 10 MO 38% 25% 6% 6% 25% 16 NC 20% 0% 20% 40% 20% 5 NM 14% 43% 29% 14% 0% 7 NX 60% 0% 0% 0% 40% 5 NY 0% 24% 12% 18% 47% 17 OH 38% 33% 19% 5% 5% 21 OR 6% 35% 18% 35% 6% 17 PA 46% 23% 8% 23% 0% 13 TN 57% 0% 0% 14% 29% 7 TX 21% 10% 14% 20% 35% 184 UT 34% 17% 17% 23% 9% 35 Total 20% 20% 20% 20% 20% 898
this period. We have suppressed the first year distribution numbers from Rhode Island charter schools due to very small N sizes. 4 Recall that clustering may reflect restrictions on, or political decisions regarding, location preferences as much overall sector quality. For example, if a state’s charter schools locate predominantly in extremely high-need, urban areas, you might expect a clustering of effect sizes at the low end of the distribution relative to the statewide average. Thus differences in starting endowments can be accounted for by a variety of factors.

25
Table 6: First Year Starting Endowments in Reading, by State
Quintile State 1 2 3 4 5 Total AR 22% 22% 22% 11% 22% 9 AZ 5% 16% 36% 20% 23% 44 CA 12% 18% 18% 26% 25% 244 CO 3% 14% 20% 40% 23% 35 DC 11% 33% 17% 28% 11% 18 FL 30% 19% 23% 22% 6% 86 GA 11% 11% 47% 14% 17% 36 IL (Chicago) 0% 50% 17% 33% 0% 12 IN 15% 35% 15% 20% 15% 20 LA 46% 23% 9% 9% 14% 35 MA 40% 20% 20% 20% 0% 5 MI 0% 5% 14% 32% 50% 22 MN 11% 28% 22% 22% 17% 18 MO 50% 19% 6% 19% 6% 16 NC 0% 0% 60% 20% 20% 5 NM 14% 29% 43% 0% 14% 7 NX 25% 50% 0% 0% 25% 4 NY 13% 44% 31% 13% 0% 16 OH 48% 24% 14% 5% 10% 21 OR 18% 53% 6% 6% 18% 17 PA 46% 31% 8% 15% 0% 13 TN 43% 0% 14% 14% 29% 7 TX 27% 18% 15% 12% 28% 186 UT 22% 19% 28% 25% 6% 36 Total 20% 20% 20% 20% 20% 912 The cut scores reflected in this distribution were then permanently fixed. This was necessary to provide a consistent standard of comparison across the years as charter schools matured. This, in fact, became our guiding research question: How do schools move among these quintiles as they age? What patterns and trends can we discern? Results Interpreting the quintile movement of a single school is difficult, but across larger aggregations of schools trends emerge. Some volatility is surely expected, but if

26
consistent trends exist they can be revealed if the analysis is correctly structured. To aid the process, we developed a framework that sought to make sense of schools’ developing trajectories. An example that illustrates our approach is provided below. Imagine a cohort of 100 first year schools. By definition, when we divide these year 1 schools into initial quintiles, there will be twenty in each category. Table 7: A Probability Framework, Part I Age of School
N Starting Quintile
Quintile in Following Year 1 2 3 4 5
1 20 1 20 2 20 3 20 4 20 5 2 1 2 3 4 5
What happens to these hypothetical schools in year 2 of their operation? Presumably, their year 2 performance will be distributed across all five quintiles, as some schools improve, some worsen, and others maintain the same level of performance. In our imaginary example, we simulate this process by calculating the number and percentage of students in each year 1 quintile that fall into each year 2 quintile.
27
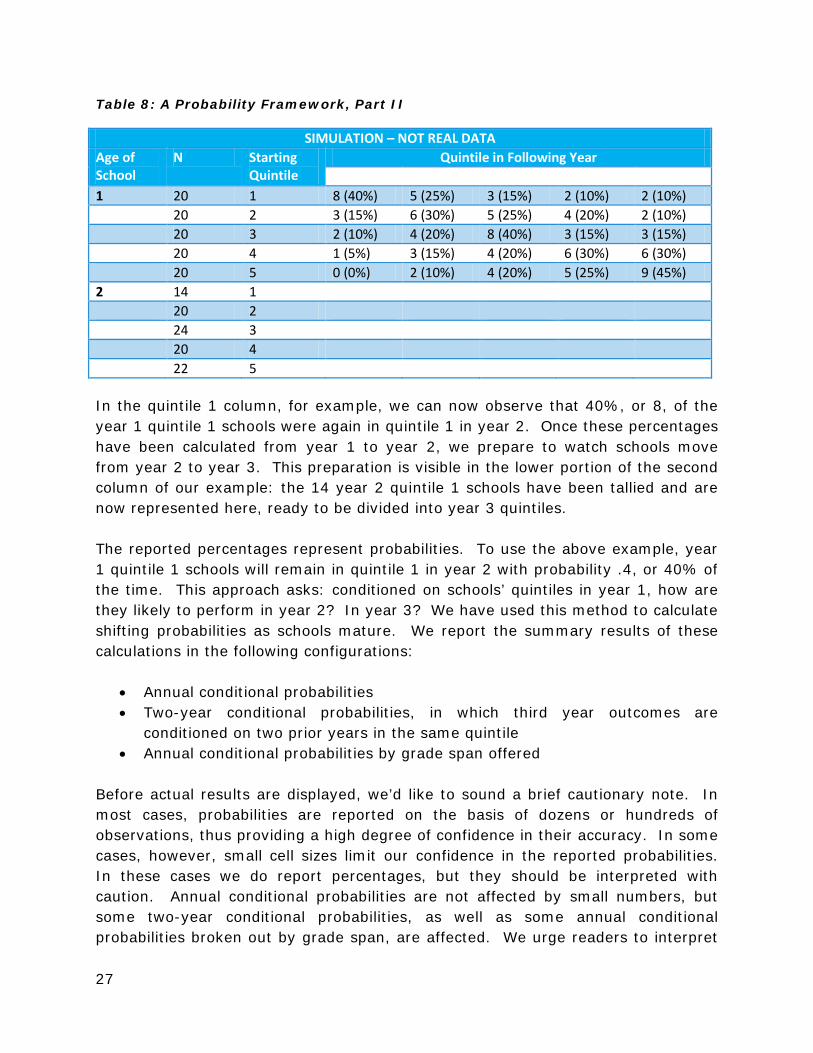
Table 8: A Probability Framework, Part II
SIMULATION – NOT REAL DATA Age of School
N Starting Quintile
Quintile in Following Year 1 2 3 4 5
1 20 1 8 (40%) 5 (25%) 3 (15%) 2 (10%) 2 (10%) 20 2 3 (15%) 6 (30%) 5 (25%) 4 (20%) 2 (10%) 20 3 2 (10%) 4 (20%) 8 (40%) 3 (15%) 3 (15%) 20 4 1 (5%) 3 (15%) 4 (20%) 6 (30%) 6 (30%) 20 5 0 (0%) 2 (10%) 4 (20%) 5 (25%) 9 (45%) 2 14 1 20 2 24 3 20 4 22 5 In the quintile 1 column, for example, we can now observe that 40%, or 8, of the year 1 quintile 1 schools were again in quintile 1 in year 2. Once these percentages have been calculated from year 1 to year 2, we prepare to watch schools move from year 2 to year 3. This preparation is visible in the lower portion of the second column of our example: the 14 year 2 quintile 1 schools have been tallied and are now represented here, ready to be divided into year 3 quintiles. The reported percentages represent probabilities. To use the above example, year 1 quintile 1 schools will remain in quintile 1 in year 2 with probability .4, or 40% of the time. This approach asks: conditioned on schools’ quintiles in year 1, how are they likely to perform in year 2? In year 3? We have used this method to calculate shifting probabilities as schools mature. We report the summary results of these calculations in the following configurations:
• Annual conditional probabilities • Two-year conditional probabilities, in which third year outcomes are
conditioned on two prior years in the same quintile • Annual conditional probabilities by grade span offered
Before actual results are displayed, we’d like to sound a brief cautionary note. In most cases, probabilities are reported on the basis of dozens or hundreds of observations, thus providing a high degree of confidence in their accuracy. In some cases, however, small cell sizes limit our confidence in the reported probabilities. In these cases we do report percentages, but they should be interpreted with caution. Annual conditional probabilities are not affected by small numbers, but some two-year conditional probabilities, as well as some annual conditional probabilities broken out by grade span, are affected. We urge readers to interpret

28
all probabilities in light of the larger pattern, and to avoid relying too heavily on a single reported number. The number of unique schools on which calculations are based are included in each table. The technical appendix contains counts of school observations by quintile for these tables. One-Year Conditional Probabilities In the following tables we present aggregated quintile-to-quintile conditional probabilities that were calculated using the framework introduced in the preceding section. The summary results display the probability that schools from each quintile in one year will appear in either quintiles 1-2 or quintiles 3-5 in the following year. We have chosen to divide our results into these two summary categories for a two primary reasons. First, while it is true that schools in quintile 3 do often post negative effect sizes, there is sufficient movement within quintiles that we can expect quintile 3 schools to hover frequently around the state mean. Thus, quintile 3 represents a dividing line of sorts. Second, and more to the point, analysis of the trajectories of the unequivocally low-performers is, we believe, more relevant in policy discussions. Quintile 3 may be ambiguous, but quintiles 1 and 2 are not.

29
Table 9: One-Year Conditional Probabilities in Math
Age of School
If the school’s starting quintile is:
Q1 Q2 Q3 Q4 Q5
In which quintiles does the school appear the following year?
1-2 3-5 1-2 3-5 1-2 3-5 1-2 3-5 1-2 3-5
1 0.66 0.33 0.41 0.60 0.22 0.78 0.13 0.87 0.08 0.92
2 0.72 0.29 0.46 0.54 0.27 0.74 0.14 0.87 0.05 0.95
3 0.77 0.23 0.50 0.51 0.22 0.79 0.09 0.91 0.05 0.95
4 0.74 0.26 0.59 0.40 0.27 0.73 0.15 0.86 0.04 0.95
5 0.80 0.19 0.51 0.49 0.23 0.77 0.09 0.91 0.06 0.94
No. of Schools 1688
Note: Probabilities may not sum to 1 due to rounding error. In this table and others, it is not necessarily the case that the total number of observations represented by the table is equivalent to 4 data periods multiplied by the number of unique schools. We do not have all possible years of data on all schools; for specific restrictions, please refer back to Tables 2 and 3. For the precise number of observations in each table, please see the technical appendix.
30
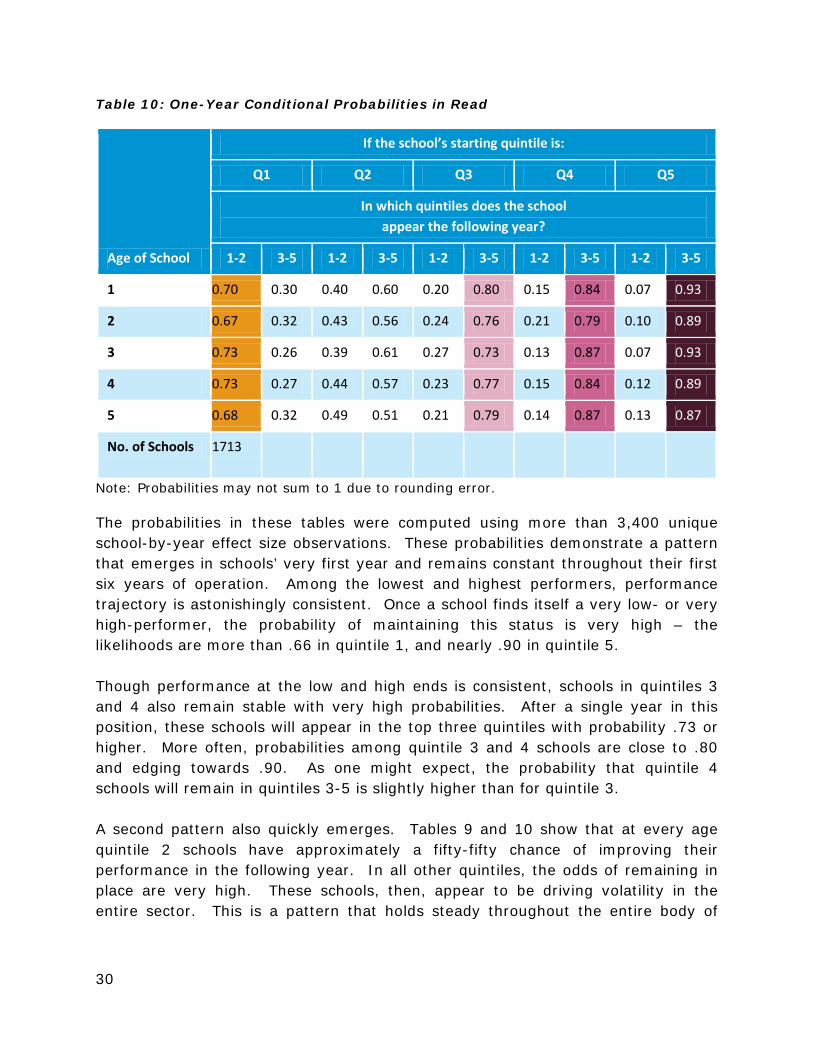
Table 10: One-Year Conditional Probabilities in Read
Age of School
If the school’s starting quintile is:
Q1 Q2 Q3 Q4 Q5
In which quintiles does the school appear the following year?
1-2 3-5 1-2 3-5 1-2 3-5 1-2 3-5 1-2 3-5
1 0.70 0.30 0.40 0.60 0.20 0.80 0.15 0.84 0.07 0.93
2 0.67 0.32 0.43 0.56 0.24 0.76 0.21 0.79 0.10 0.89
3 0.73 0.26 0.39 0.61 0.27 0.73 0.13 0.87 0.07 0.93
4 0.73 0.27 0.44 0.57 0.23 0.77 0.15 0.84 0.12 0.89
5 0.68 0.32 0.49 0.51 0.21 0.79 0.14 0.87 0.13 0.87
No. of Schools 1713
Note: Probabilities may not sum to 1 due to rounding error. The probabilities in these tables were computed using more than 3,400 unique school-by-year effect size observations. These probabilities demonstrate a pattern that emerges in schools’ very first year and remains constant throughout their first six years of operation. Among the lowest and highest performers, performance trajectory is astonishingly consistent. Once a school finds itself a very low- or very high-performer, the probability of maintaining this status is very high – the likelihoods are more than .66 in quintile 1, and nearly .90 in quintile 5. Though performance at the low and high ends is consistent, schools in quintiles 3 and 4 also remain stable with very high probabilities. After a single year in this position, these schools will appear in the top three quintiles with probability .73 or higher. More often, probabilities among quintile 3 and 4 schools are close to .80 and edging towards .90. As one might expect, the probability that quintile 4 schools will remain in quintiles 3-5 is slightly higher than for quintile 3. A second pattern also quickly emerges. Tables 9 and 10 show that at every age quintile 2 schools have approximately a fifty-fifty chance of improving their performance in the following year. In all other quintiles, the odds of remaining in place are very high. These schools, then, appear to be driving volatility in the entire sector. This is a pattern that holds steady throughout the entire body of

31
results, and it speaks to the unique position, and possible improvement opportunity, held by these schools. Two-Year Conditional Probabilities To test our hypothesis further, we next examined performance after two years of fixed quality (see Tables 11 & 12). What happens in year 3, if a school is in quintile 1 the two years prior? What if the school has remained in quintile 5 during years 1 and 2 of operation? Table 11: Two-Year Conditional Probabilities in Math
Age of School
If the school’s starting quintile is:
Q1 Q2 Q3 Q4 Q5
In which quintiles does the school appear the following year?
1-2 3-5 1-2 3-5 1-2 3-5 1-2 3-5 1-2 3-5
1 - 2 0.82 0.19 0.74 0.26 0.20 0.80 0.15 0.84 0.00 1.00
2 - 3 0.85 0.15 0.73 0.28 0.18 0.82 0.09 0.91 0.03 0.97
3 - 4 0.91 0.10 0.65 0.35 0.23 0.76 0.08 0.92 0.02 0.99
4 - 5 0.84 0.15 0.56 0.44 0.19 0.82 0.05 0.96 0.04 0.97
No. of Schools 577
Note: Probabilities may not sum to 1 due to rounding error.

32
Table 12: Two-Year Conditional Probabilities in Read
Age of School
If the school’s starting quintile is:
Q1 Q2 Q3 Q4 Q5
In which quintiles does the school appear the following year?
1-2 3-5 1-2 3-5 1-2 3-5 1-2 3-5 1-2 3-5
1 - 2 0.89 0.12 0.54 0.45 0.16 0.84 0.08 0.92 0.02 0.97
2 - 3 0.89 0.10 0.57 0.43 0.21 0.78 0.09 0.92 0.03 0.97
3 - 4 0.96 0.05 0.80 0.20 0.24 0.77 0.17 0.83 0.04 0.95
4 - 5 0.89 0.11 0.53 0.47 0.20 0.80 0.12 0.89 0.06 0.94
No. of Schools 501
Note: Probabilities may not sum to 1 due to rounding error. After two years performing at the same level, quality becomes even more fixed at both ends of the performance spectrum. Among schools that appear in quintile 1 for two consecutive years, the probability of remaining in the two lowest quintiles for a third year ranges from .82 to .91 in math (Table 11) and from .89 to .96 in reading (Table 12). Among schools that appear in quintile 3 or 4 for two years, the probability of remaining in quintiles 3-5 in the following year is more than .75 in all cases, and is often, particularly in quintile 4, above .90. Quintile 5 schools reappear in the top three quintiles with probability approaching 1. Static performance for two years – any two years – makes a third year in the same quintile highly likely. Quintile 2 schools remain the primary source of volatility in reading, but this is less true in math. In math, performance among quintile 2 schools after two years of consistently low quality is nearly as fixed in the third year as that of quintile 1 schools – two-thirds or higher in every case but one. In reading, however, there is still considerable volatility among the quintile 2 schools; the probability of remaining in the lower two quintiles for a third year hovers just above .5. Quintile 2 schools, then, continue to drive variation in the sector, but, after two years in the same place – whether low-performing or high-performing – variation of any kind is dramatically reduced. One Year Conditional Probabilities by Grade Span In an effort to tease out further nuances from the overarching pattern, we have tested whether these remarkably sturdy aggregate trends remain stable when broken out by grade span

33
offered. Observable differences among probabilities across grade spans may provide a more complete picture of school maturation to authorizers and policymakers. Given the relatively small number of observations underlying the following tables, we encourage readers to view results with an eye toward the overall patterns that continue to emerge, and not to any particular number. Elementary school, refers to any grade configuration that serves the primary school grades. Elementary schools most often serve grades K-6, but they may also serve grades K-5, or K-4. Middle school is used to refer to schools that serve the middle grades 5-8, 6-8, or 7-9. High school indicates schools that serve grades 9-12 or 10-12 only. Multilevel schools, which form the largest proportion of schools in this study, refer to any remaining grade configuration, such as grades K-8, or grades 6-12.5 Table 13: One-Year Conditional Probabilities in Elementary School Math
Age of School
If the school’s starting quintile is:
Q1 Q2 Q3 Q4 Q5
In which quintiles does the school appear the following year?
1-2 3-5 1-2 3-5 1-2 3-5 1-2 3-5 1-2 3-5
1 0.18 0.81 0.19 0.82 0.24 0.76 0.15 0.85 0.10 0.89
2 0.17 0.84 0.20 0.80 0.23 0.77 0.06 0.95 0.04 0.96
3 1.00 0.00 0.00 1.00 0.18 0.81 0.09 0.92 0.04 0.96
4 0.2 0.80 0.17 0.83 0.13 0.86 0.09 0.90 0.16 0.86
5 0.00 1.00 0.43 0.56 0.14 0.86 0.07 0.93 0.05 0.95
No. of Schools 294 Note: Probabilities may not sum to 1 due to rounding error.
5 Please note that this definition of multilevel schools, which includes schools that serve grades K-8, differs slightly from the definition used by the National Center for Education Statistics (NCES). NCES includes K-8 schools in its count of elementary schools. We have chosen to differentiate elementary schools from K-8 schools here due to their divergent results, but elsewhere in this report we use the NCES standard definition of elementary and multilevel schools.

34
Table 14: One-Year Conditional Probabilities in Elementary School Read
Age of School
If the school’s starting quintile is:
Q1 Q2 Q3 Q4 Q5
In which quintiles does the school appear the following year?
1-2 3-5 1-2 3-5 1-2 3-5 1-2 3-5 1-2 3-5
1 0.41 0.59 0.52 0.48 0.11 0.89 0.27 0.73 0.28 0.73
2 0.60 0.40 0.39 0.61 0.29 0.71 0.20 0.79 0.10 0.91
3 0.70 0.30 0.24 0.77 0.32 0.68 0.21 0.78 0.07 0.94
4 0.54 0.45 0.42 0.58 0.10 0.90 0.21 0.80 0.24 0.77
5 0.27 0.72 0.59 0.42 0.28 0.72 0.17 0.83 0.14 0.87
No. of Schools 295
Note: Probabilities may not sum to 1 due to rounding error. In the elementary grades, the distinctive overall pattern is only partially disrupted. In math (Table 13), low performance in one year does not appear to be predictive of low performance in the following year. With one exception, the probability that quintile 1 schools will remain in the two lowest quintiles in math for the following year is .20 or lower. In reading, however, low performance is not as stable as found in the aggregate numbers, but is still the likeliest outcome, ranging from .27 to .70 and more often than not above .50. In both subjects, performance in quintiles 3-5 in one year is highly predictive of continuing high performance in the next. Quintile 2 elementary performance mirrors these same mild disruptions. In math, quintile 2 schools improve in numbers roughly equivalent to quintile 1 elementary schools – that is, at rates higher than the expected value. In reading, quintile 2 schools are more likely to improve than to remain stable, but the probabilities of doing either begin to resemble quintile 2 probabilities in other groupings, ranging fairly evenly from .42 to .77. In the following four tables, we show the results for middle and multilevel schools. We have presented these two levels together, because among these two groupings annual trends generally parallel the aggregate findings.

35
Table 15: One-Year Conditional Probabilities in Middle School Math
Age of School
If the school’s starting quintile is:
Q1 Q2 Q3 Q4 Q5
In which quintiles does the school appear the following year?
1-2 3-5 1-2 3-5 1-2 3-5 1-2 3-5 1-2 3-5
1 0.69 0.30 0.35 0.65 0.26 0.74 0.12 0.87 0.06 0.95
2 0.91 0.09 0.28 0.73 0.33 0.67 0.24 0.76 0.08 0.92
3 0.44 0.55 0.12 0.89 0.33 0.67 0.09 0.92 0.00 1.00
4 0.50 0.50 0.43 0.57 0.17 0.82 0.08 0.92 0.00 1.00
5 1.00 0.00 0.25 0.75 0.07 0.93 0.04 0.96 0.06 0.95
No. of Schools 266 Note: Probabilities may not sum to 1 due to rounding error.
Table 16: One-Year Conditional Probabilities in Middle School Read
Age of School
If the school’s starting quintile is:
Q1 Q2 Q3 Q4 Q5
In which quintiles does the school appear the following year?
1-2 3-5 1-2 3-5 1-2 3-5 1-2 3-5 1-2 3-5
1 0.65 0.35 0.46 0.53 0.22 0.78 0.16 0.84 0.00 1.00
2 0.50 0.50 0.52 0.48 0.28 0.72 0.29 0.71 0.03 0.99
3 1.00 0.00 0.24 0.76 0.25 0.74 0.07 0.93 0.07 0.93
4 1.00 0.00 0.44 0.55 0.21 0.78 0.07 0.92 0.18 0.81
5 0.67 0.33 0.33 0.66 0.31 0.70 0.04 0.96 0.07 0.93
No. of Schools 266
Note: Probabilities may not sum to 1 due to rounding error.

36
Table 17: One-Year Conditional Probabilities in Multilevel School Math
Age of School
If the school’s starting quintile is:
Q1 Q2 Q3 Q4 Q5
In which quintiles does the school appear the following year?
1-2 3-5 1-2 3-5 1-2 3-5 1-2 3-5 1-2 3-5
1 0.66 0.33 0.41 0.59 0.12 0.89 0.11 0.89 0.08 0.93
2 0.73 0.27 0.52 0.48 0.24 0.76 0.12 0.89 0.05 0.96
3 0.73 0.27 0.57 0.43 0.20 0.80 0.07 0.93 0.04 0.95
4 0.65 0.35 0.58 0.41 0.32 0.68 0.16 0.84 0.02 0.99
5 0.78 0.21 0.54 0.46 0.26 0.74 0.12 0.88 0.04 0.95
No. of Schools 850
Note: Probabilities may not sum to 1 due to rounding error. Table 18: One-Year Conditional Probabilities in Multilevel School Read
Age of School
If the school’s starting quintile is:
Q1 Q2 Q3 Q4 Q5
In which quintiles does the school appear the following year?
1-2 3-5 1-2 3-5 1-2 3-5 1-2 3-5 1-2 3-5
1 0.72 0.28 0.31 0.69 0.19 0.82 0.08 0.92 0.06 0.94
2 0.66 0.34 0.40 0.59 0.20 0.81 0.18 0.82 0.16 0.84
3 0.66 0.36 0.51 0.49 0.27 0.73 0.12 0.88 0.07 0.93
4 0.64 0.36 0.46 0.54 0.26 0.75 0.18 0.82 0.07 0.92
5 0.62 0.39 0.48 0.52 0.20 0.80 0.16 0.85 0.16 0.85
No. of Schools 861
Note: Probabilities may not sum to 1 due to rounding error. Year over year performance of schools is relatively static. In quintile 3, schools’ performance is stable two-thirds of the time or higher. In quintiles 4 and 5, the probability of continuing high performance is, in every case but one, above .8. In the fifth quintile, it is above .9 almost without exception.

37
In quintile 1, school performance remains stable and low about two-thirds of the time, and is often even more consistent than that. There are three exceptions to this among middle schools in both subjects, but the general trend is in line with the consistency hypothesis. Indeed, there are several instances in which the rate of stability reaches 100%. Among multilevel quintile 1 schools, the rate of stability ranges from .62 to .78, providing a very strong echo of the aggregate pattern. Considering the plurality of multilevel schools in the sample, this is not surprising. Similarly, quintile 2 multilevel schools improve and remain stable in about equal numbers. In an interest twist, however, and one similar to the elementary school tendency, quintile 2 middle schools appear to improve in the following year more often than not. The trend is less pronounced, but still true, in reading. Because inclusion in quintile 2 is predicated on one year of low performance, then, and because movement upwards in the following year is a direct reflection of volatility, this amplified rate of improvement bolsters the case that quintile 2 schools – along with quintile 1 elementary schools – are the primary movers. Table 19: One-Year Conditional Probabilities in High School Math
Age of School
If the school’s starting quintile is:
Q1 Q2 Q3 Q4 Q5
In which quintiles does the school appear the following year?
1-2 3-5 1-2 3-5 1-2 3-5 1-2 3-5 1-2 3-5
1 0.85 0.16 0.58 0.41 0.45 0.54 0.21 0.79 0.11 0.90
2 0.74 0.26 0.65 0.35 0.30 0.69 0.33 0.67 0.00 1.00
3 0.92 0.08 0.70 0.31 0.21 0.79 0.26 0.76 0.20 0.81
4 0.92 0.08 0.78 0.22 0.33 0.67 0.36 0.65 0.00 1.00
5 0.87 0.14 0.59 0.41 0.28 0.72 0.22 0.77 0.50 0.50
No. of Schools 278
Note: Probabilities may not sum to 1 due to rounding error.

38
Table 20: One-Year Conditional Probabilities in High School Read
Age of School
If the school’s starting quintile is:
Q1 Q2 Q3 Q4 Q5
In which quintiles does the school appear the following year?
1-2 3-5 1-2 3-5 1-2 3-5 1-2 3-5 1-2 3-5
1 0.93 0.07 0.63 0.38 0.38 0.63 0.16 0.84 0.04 0.96
2 0.88 0.12 0.45 0.54 0.27 0.73 0.20 0.82 0.07 0.93
3 0.89 0.12 0.32 0.68 0.24 0.76 0.16 0.84 0.06 0.94
4 0.91 0.09 0.38 0.63 0.33 0.66 0.09 0.92 0.05 0.96
5 0.93 0.08 0.54 0.45 0.11 0.89 0.07 0.93 0.11 0.90
No. of Schools 291
Note: Probabilities may not sum to 1 due to rounding error. In high school, the trend observed among elementary schools is reversed. Here, performance trajectories are even more fixed, on the basis of annual conditional probabilities, than they are in the consolidated results. Quintile 1 schools, with likelihoods typically above .80 and even above .90, will remain low performing in the following year. Quintile 3 and 4 schools, at perhaps slightly lower rates than found in the overall numbers but still very high, are likely to remain high performing in the following year. Fifth quintile schools also have extremely high rates of stability, typically above .90. As we’ve consistently seen, quintile 2 performance is more volatile, weighted about equally between improvement and stability. Structural Differences Between Schools In this analysis, we have explored performance trajectories that emerge across large numbers of schools. Our approach does not generally permit us to move beyond description and into speculation. Nevertheless, it is possible to take a broad look at the structural differences between our highest and lowest performers. Once student-level influences have been controlled for in the model, what – if any – distinguishing characteristics remain? Do quintile 1 and quintile 5 schools look systematically different from each other? For each of the major demographic groups, we have compared the mean school-wide percentage of the group in question at schools in quintile 1 with schools in quintile 5 in their first year of operation. We have also

39
looked at urbanicity as a factor. Table 21 summarizes structural differences between quintile 1 and quintile 5 schools that are statistically significant. Table 21: Statistically Significant Differences between Quintile 1 and 5 Schools Structural Factor Math Reading Locale City Suburb Town Rural School-Wide Percentage White Black Hispanic/Latino Asian Native American Multiracial Special Education English Language Learner Despite the presence of several discernible factors that contribute to the likelihood of being in either quintile 1 or quintile 5, the overall pattern is murky. In math, schools located in urban areas are somewhat more likely to be in quintile 5 than in quintile 1, perhaps reflecting a mild human capital advantage found in large cities. When school-level demographic factors are considered, quintile 5 schools in math are more likely be comprised of higher school-wide concentrations of Hispanic/Latino and Asian students, and lower concentrations of white, multiracial, and special education students. In reading, quintile 5 schools are more likely to include higher concentrations of Asian and Hispanic/Latino students, and lower concentrations of black students and special education students. Even for these groups, however, the difference between the mean school-wide percentage of quintile 1 and quintile 5 schools is quite small in magnitude, and the standard deviation around each mean is universally larger – and typically very much larger – than the difference between the means. Still, a small but consistent advantage to schools enrolling higher percentages of Hispanic/Latino and Asian students, and a partial disadvantage to schools enrolling more white, black, multiracial, and special education students, can be observed. It seems that, even after controlling for demographic factors at the student-level and for peer effects in poverty, certain

40
types of organizational differences persist in unpredictable, if mild, ways.6 That these differences are extremely small, though, and are reflected in distributions that show far more overlap than disconnection even at the two tails of the performance spectrum, suggests that structural differences do not play a major role in determining first year school quality. There is no systematic first year school phenomenon.
6 Our model does control for the peer effects of poverty, meaning that structural differences in schools’ level of participation in the free/reduced lunch program have already been accounted for in quintile assignments. They are therefore omitted here.

41
Genesis of Charter Management Organizations
In the previous chapter, we demonstrated that schools generally establish enduring patterns of quality early in their life cycles. Given this finding, it makes sense to question whether the same pattern might apply in the case of new Charter Management Organizations, or CMOs. CMOs seek to deliver economies of scale in the charter sector. Are early signals of CMO quality also related to later performance, and if so, in what ways? To answer this question, we began by considering the array of quality among CMO flagship schools around the time of their very first replication. In theory, only high-performing schools should be granted the leeway to replicate. Using the quintiles of quality developed for our maturation analysis, we examined the range of quality among flagship schools in the year prior to their first replication. Please note that within the available years of data, twenty-one CMOs birthed their first replication school. For this reason, we present all results in this chapter cautiously. Figure 1: Flagship Quality in Year Prior to Replication (Read)
As displayed in Figure 1 above, we do find a clustering of flagship schools among the higher quintiles in the year immediately prior to replication. The results shown here are in reading, but the pattern holds in math. In both subjects, the highest concentration of flagship schools is found in quintile 4, suggesting that flagship
n=1
n=1
n=5
n=8
n=6
0 1 2 3 4 5

42
quality is related to the decision (and approval) to replicate. Still, a third of the nascent CMOs had levels of quality in the bottom tiers of performance.7 We have also investigated the related question of CMO flagship school quality in the year of first replication. A comparison of flagship quality in this year to quality in the year prior may be considered a proxy for the movement of resources within the budding CMO central organization. The results of this investigation in appear in Figures 2 and 3 below.8 The thickness of the line represents the number of schools moving along that path from pre- to post-replication. Figure 2: Flagship Quality from Year Prior to Year of Replication (Math)
7 Of the 5 organizations in quintile 3, 1 was below the mid-point of the range, placing it in the bottom half of the performance range. 8 Please note that data points are reported separately for reading and math and do not align. For example, CMO 1.1 in math and 1.1 in reading do not necessarily indicate the same organization.
1
2
3
4
5
Year Prior to Replication Year of Replication
Qui
ntile
CMO 1.1 CMO 1.1 CMO 2.1
CMO 2.1
CMO 3.1 CMO 3.2 CMO 3.3 CMO 3.4
CMO 3.2 CMO 3.3 CMO 4.2 CMO 4.3 CMO 4.4 CMO 4.5 CMO 4.6
CMO 3.4 CMO 5.6
CMO 4.1 CMO 4.2 CMO 4.3 CMO 4.4 CMO 4.5 CMO 4.6 CMO 4.7 CMO 4.8
CMO 3.1 CMO 4.1 CMO 5.1 CMO 5.2 CMO 5.3 CMO 5.4
CMO 4.7 CMO 4.8 CMO 5.5
CMO 5.1 CMO 5.2 CMO 5.3 CMO 5.4 CMO 5.5 CMO 5.6

43
We have flagship observations before and after replication from twenty new CMOs.9 In math, 10 of these flagships remain in the same quintile as the prior year, 6 flagships drop in quality, and 4 improve. Figure 3: Flagship Quality from Year Prior to Year of Replication (Read)
In reading, 7 flagship schools remain at the same level of quality following their first replication, 9 decrease in quality, and 4 rise. These preliminary descriptive findings suggest that, during the opening year of the first replication school, organizational resources are partially redirected away from
9 We do not have a year-of-replication flagship observation from the twenty-first CMO.
1
2
3
4
5
Year Prior to Replication Year of Replication
Qui
ntile
CMO 1.1 CMO 2.1 CMO 3.5 CMO 5.6
CMO 2.1
CMO 3.1 CMO 3.2 CMO 3.3 CMO 3.4 CMO 3.5
CMO 3.2 CMO 3.3 CMO 4.2 CMO 4.3 CMO 4.4 CMO 4.5 CMO 5.2 CMO 5.3 CMO 5.4
CMO 3.4 CMO 4.6 CMO 5.5
CMO 4.1 CMO 4.2 CMO 4.3 CMO 4.4 CMO 4.5 CMO 4.6 CMO 4.7
CMO 3.1 CMO 4.1 CMO 5.1
CMO 4.7
CMO 5.1 CMO 5.2 CMO 5.3 CMO 5.4 CMO 5.5 CMO 5.6
CMO 1.1

44
the original flagship school. Operating a successful school and maintaining the success of this school while replicating it may involve two very different skill sets. Despite the apparently enervating effects of replication, flagship schools do, in the aggregate, outperform their replication school counterparts. In math, the mean effect size of flagship schools, regardless of age, is .021 (in standard deviation units). In contrast, the mean effect size of replication schools is -.061. In reading, the advantage of flagship status persists, but it is less pronounced. Here, the average flagship school effect size across time is .007, while the average replication school effect size is -.045. Perhaps a more interesting question, however, is the relationship between flagship and replication quality within their own networks as organizations make the transition from single school to multi-school operators. In Figures 4 & 5, we track flagship quality in the year prior to replication in conjunction with the quality of the very first replication school or schools. Given the constraints of our data window, we were able to make this before and after comparison for nine networks in math and ten in reading. With such small numbers of observations, there is no chance for generalizing; we present these data with appropriate caution.

45
Figure 4: Flagship Quality in Year Prior to Replication vs. Replication School Quality in Year 1 (Math)
In our set of nine CMO observations in math, two opened two schools at the time of their first replication, giving us eleven replication school observations. Of these, 4 CMOs’ first replication schools were of lesser quality than their flagships, 4 were of the same quality, and 3 were actually improved.
1
2
3
4
5
Flagship in Year Prior to Replication First Replication School, Age 1
Qui
ntile
CMO 1.1
CMO 1.1 CMO 1.1 CMO 4.3
CMO 3.1 CMO 3.2 CMO 3.3
CMO 3.1 CMO 4.3
CMO 3.2 CMO 5.1
CMO 3.3 CMO 4.4
CMO 4.1 CMO 4.2 CMO 4.3 CMO 4.4
CMO 4.1 CMO 4.2 CMO 5.1

46
Figure 5: Flagship Quality in Year Prior to Replication vs. Replication School Quality in Year 1 (Read)
In reading, our ten newly minted CMOs gave birth to twelve replication schools. Of these, 4 CMOs opened replication schools of lower quality than their flagships, 6 CMOs opened replication schools that were of similar quality, and 2 opened schools that improved upon their own models. The quality of CMOs in both subjects tracks very closely together. These figures offer an interesting alternative to the overall finding that places the performance of replication schools slightly below that of flagship charters. In their very first attempt, many networks are able to reproduce the success of their flagship schools, and a small number are even able to improve upon their own performance. Even if this success arrives, at least in part, at the expense of flagship quality, it is nevertheless quite promising. In combination with the evidence regarding the average overall quality of flagship and replication schools, these hopeful results suggest a population of low-performing CMOs with large numbers of replications that lower the aggregate average effect size for all
1
2
3
4
5
Flagship in Year Prior to Replication First Replication School, Age 1
Qui
ntile
CMO 1.1
CMO 1.1 CMO 2.1 CMO 4.3
CMO 1.1 CMO 4.1 CMO 4.2 CMO 4.3
CMO 2.1
CMO 3.1 CMO 3.2 CMO 3.3
CMO 3.1 CMO 5.1
CMO 3.2 CMO 5.1
CMO 3.3
CMO 4.1 CMO 4.2 CMO 4.3
CMO 5.1 CMO 5.2

47
replication schools. Indeed, evidence from our CMO study presented in the second volume of this report largely substantiates this hypothesis. In Volume II of this report, we deepen our analysis of CMO performance using the CREDO national student-level data set to reveal patterns in quality among CMO charters, non-CMO charters, and traditional public schools (TPS) differentiated by a variety of factors, including race/ethnicity, special program participation, and organizational characteristics.
Summary of Findings and Implications Contrary to the conventional wisdom, improvement in school performance is neither straightforward nor steady with advancing age. Instead, charter school maturation reflects a prevailing pattern of consistent performance over time. Can't Ignore Early Metrics Our findings suggest that early signals of quality are strongly related to later performance. For middle, high, and multilevel schools, quality is a highly stable phenomenon. Among these schools, poor performance in early years is unlikely to be overcome and excellence is unlikely to be temporary. After two years of performance, this trajectory becomes even more emphatic. Schools that provide sub-par learning for students remain low in about 80 percent of the cases. The share of schools that start out with high gains for their students and subsequently remain strong performers is even higher, at 94 percent. In all cases, we argue without reservation that poor first year performance simply cannot be overlooked or excused. For the majority of schools, poor first year performance will give way to poor second year performance. Once this has happened, the future is predictable and extremely bleak. For the students enrolled in these schools, this is a tragedy that must not be dismissed. Limited Targets of Improvement Across other groupings and in the aggregated findings, volatility is concentrated primarily in the second quintile only. These quintile 2 schools typically sit on the precipice between improvement and stagnation – perhaps offering an opportunity for authorizers to intervene in school operations in order to prevent indefinitely poor performance. There are even odds that a quintile 2 school rises or remains in the lower two quintiles. There is only one exception to this pattern. For elementary schools in math and to a lesser extent in reading, early poor performance is not as strongly predictive of later poor performance, and schools are routinely able to improve their quality year

48
over year. The volatility that is noted in the aggregate analysis for quintile 2 is found in both of the bottom two quintiles in elementary schools. The prospect of improvement is greater, but remains far from certain. Given this, we might surmise that low-performing elementary schools are likely to be a fruitful source of return on investment from authorizers and other support organizations. For these schools, a single year of low performance is non-determinant. On the other hand, two years of low performance at the elementary level or one year of low performance among middle schools, multilevel schools, and especially high schools, predict a much less promising future trajectory: 89 percent of quintile 1 schools remain in that quintile after five years. And schools in the top thee quintiles remain there in the majority of cases. For quintile 5 schools, 97 percent will remain in the fifth quintile. Strong Authorizing is Vital There are clear implications from these findings. There is a great need for careful due diligence by authorizers during the approval process. The results also suggest that regular and uniform monitoring of charter school performance can lead to early identification of underperforming schools. While we worry that a shorter first term for charters would adversely affect the incentives to operators to open schools, the findings support the use of performance data at the end of the third year of operation to, if warranted, put schools on notice and to begin to document the case for action in the fourth or fifth year. Triage Scarce Resources The lessons of this study also include the notion of authorizer triage. Most authorizers and charter support organizations have limited resources, so deploying them where they have the highest impact is desirable. The temptation to focus on the lowest performing schools is not supported by this analysis, but attention to the schools in quintile two (or quintiles 1 and 2 for elementary schools) holds out more promising effects. Smart Bets At the other end of the spectrum, these findings begin to make the case for additional leeway to be granted to high-performing schools, especially after two years of such performance. These schools, with nearly incredible reliability, are likely to remain high performing in future years. Their early track record of success is highly predictive of future performance. Strengthening our overall findings is evidence, presented in Appendix B, that opening “slow grow,” or one grade at a time, was associated with superior performance at most ages and grade spans. Slow grow schools have a first year advantage, which can then be carried forward via the same pattern of stability demonstrated among all schools. This research partially fills the gap left by schools

49
that were excluded from the maturation analysis due a dearth of tested grades. Though these schools are underrepresented, especially in our elementary results, their performance trajectory is as consistent as that found in the overall sample of schools. Who is Allowed to Replicate Matters We are cautious about pushing the limited analysis of schools evolving into CMOs beyond its limits, which are admittedly weakened by the small number of cases we can observe. The cautionary insight that seems justified regardless of the analytic power is that permission to replicate should be based on absolute performance of the flagship school, not its performance relative to the existing stock of public schools. The modeling done in this analysis is intended to be descriptive. Our purpose was to reveal the macro trends present across large numbers of schools. Despite the observation of some structural differences between our highest and lowest performers, this design does not enable us to speculate on the mechanics underlying any of these performance trends – to understand, for example, what drives a quintile 2 school to either lose its forward momentum or to rise triumphantly, or what interventions inform the rare and inspiring exceptions to the gloomy destiny of two-year quintile 1 schools. The analysis can offer, however, a powerful lesson to open this important conversation: charter school quality trajectories are highly stable over time and from a very early age. The notion that schools will consistently improve as they mature is a dangerous myth that obscures the true drivers of quality – whatever these may be.

50
Appendix A: Sample Profile The following numbers summarize our student-level data set:
● School Years Represented: 2005-06 – 2009-10 ● States: 23 + NYC + DC
○ AR, AZ, CA, CO, DC, FL, GA, IL (Chicago only), IN, LA, MA, MI, MN, MO, NC, NM, NYC, NY (Upstate), OH, OR, PA, RI, TN, TX, UT
● 2,136,238 charter student observations in reading ● 2,074,780 charter student observations in math
Our post-estimation school-level data set contains:
● School Years: 2006-07 – 2009-10 ● Unique Schools: 3,616
○ Elementary: 665 ○ Middle: 475 ○ High: 542 ○ Multilevel: 193410
● 11,176 school-by-year observations in reading (including 912 observations of first year schools)
● 11,105 school-by-year observations in math (including 898 observations of first year schools)
In most states, student observations from every year within our data window were included, but there were a few exceptions. In Pennsylvania, a delay in the adoption of a Unique Student Identifier until 2006 makes earlier student data unusable. For New Mexico and Chicago, we were unable to secure data from the 2009-2010 school year in time to be included in the aggregated dataset.
10 Definition of multilevel includes K-8 schools.

51
Table 22: Years of Data Included by State Years of Data Included State 2005-06 2006-07 2007-08 2008-09 2009-10 AR x x x x x AZ x x x x x CA x x x x x CO x x x x x DC x x x x x FL x x x x x GA x x x x x IL (Chicago) x x x x IN x x x x x LA x x x x x MA x x x x x MI x x x x x MN x x x x x MO x x x x x NC x x x x x NM x x x x NY x x x x x OH x x x x x OR x x x x x PA x x x x RI x x x x x TN x x x x x TX x x x x x UT x x x x x

52
Appendix B: Sensitivity Tests on Growth Strategy
In the face of increased political scrutiny, charter schools are under pressure to identify and adopt proven practices to improve their academic results. Until now, the search has focused on internal operating characteristics. There have been numerous investigations into the sources of charter school performance, including governance, student mix, teacher and school leader profiles and a variety of operating practices. This sensitivity test expands the circle of inquiry by presenting an analysis of the growth strategies employed by new charter schools and the relationship of those approaches to overall school quality as measured by student academic progress. The question has important implications for a range of actors, including funders, charter school developers, and public policy makers seeking to build successful school improvement policies. For example, school operators in states where the charter term is relatively short face greater pressure, all else equal, to prove in with strong academic performance in their early years. Conversely, if the approach to growth is important, then authorizers may wish to expand the review criteria for charter applications. Charter support organizations could offer clearer guidance about operational practices that lead to successful student outcomes. And policy makers seeking ways to improve the overall quality of the schools under their purview might alter their plans if a sure-but-slower approach was demonstrated. Based on longitudinal student enrollment and performance data from five urban communities, we studied the early years of charter schools’ operations. By comparing which grades were enrolled in the opening and subsequent years of each charter school’s lifespan, we classified their approach to building out their school. This classification was then used to study whether there were significant differences in the academic performance of charter schools based on their chosen approach to growth. We show that the approach to growth does matter: across all school types, results are generally higher for schools that stagger their growth one grade at a time than seen with other growth plans. The academic results are also more consistent. Since the results also show that schools that start with some but not all the grades they ultimately enroll have results that fall between the “all” or “one at a time” options, we surmise that instilling a culture of high expectations and positive instructional practices is easier when their development is gradual.

53
The appendix proceeds with a description of the policy context and motivation for the study. The third section defines the various growth strategies and describes the patterns of growth evidenced in the five communities. The formal research question and analytic approach appear in the fourth section, followed by the results of the analysis. Conclusions and implications for policy and further work conclude the sensitivity study. Three Growth Strategies Charter schools are characterized by a time-limited contract that provides flexibility in how they operate in exchange for serious consequences based on performance over the period. The flexibility includes the latitude to choose which grades they will offer and to stage their opening and subsequent growth. Broadly speaking, there are three possible approaches to school growth:
Slow-Grow: Schools open with a single grade, or, in the case of some elementary schools, kindergarten and first grade, and in the following years grow to full enrollment one grade a time.11 Mixed Start: Schools open with multiple grades, though at less than the full intended grade span, and grow to capacity in the following years. For example, schools in this category might open with grades 5 and 6 and grow to grades 5-8, or with grades K-1 and 5, and grow to K-8. Full Start: From Day 1 of operations, schools open with their full and final grade span offerings.
Five communities are included in the present analysis: Boston, Detroit, Harlem, Albany, and Washington, DC. These five communities represent a cross-section of the urban charter school movement. Nationally, more than half of all charter schools operate in urban environments. [“Charter Schools by Geographic Region”, National Alliance for Public Charter Schools, February 27, 2012. http://www.publiccharters.org/data/files/Publication_docs/Geographic%20Location%20Details%20from%20the%20Dashboard%20Report_20120224T143955.pdf] In each chosen location, charter schools occupy a significant place in the landscape of local education reform, though with differing levels of regard and influence. They range in market share from a high of 39 percent in the District of Columbia to a low of 4 percent in New York City. [2011 Charter School Market 11 We have included elementary schools opening with K-1 in this category (“Slow-Grow”) rather than counting them as Mixed Start, because the pattern is distinct and appears to be an extension of the Slow-Grow choice.

54
Share Report, National Alliance for Public Charter Schools, October, 2011. http://www.publiccharters.org/data/files/Publication_docs/2011%20NAPCS%20Market%20Share%20Report_20111013T104601.pdf] These five urban communities are also home to substantial numbers of charter schools deploying all three approaches to opening and growth strategy, thus making them a rich field for analysis. Among new start-up schools in the study communities, there is no systematic preference among charter management organizations (CMOs) for a Slow-Grow or Mixed Start approach to school maturation. Among the most high-profile CMOs, however, the preference for a Slow-Grow Start is nearly universal. As shown in Table 23 below, for schools that opened between September 2005 and September 2010, there are examples of each approach at all levels of charter schooling in the five communities. Elementary, middle schools and multilevel schools show similar proportions of schools choosing each approach to growth. High schools show a stronger propensity to grow one grade at a time. Table 23: Use of Growth Strategies by School Level
When broken out further by community as in Table 24 below, however, it is clear that some cities favor certain approaches to growth. Our model controls for these geographic trends using community-specific fixed effects. Table 24: Use of Growth Strategies by School Level
We must, of course, consider the potential for endogeneity with respect to the opening strategies pursued by new charter school operators. If, for example, the decision to start Slow-Grow, Mixed Start, or Full Start were a choice motivated

55
primarily by academic strategy or mission, rather than random factors, we might expect it to be pre-determinant of later outcomes. Conversely, where communities enjoy generous per-pupil revenues, it may be possible to cover the fixed costs of start-up with a smaller number of grades. In practice, we believe that this prescriptive view belies numerous other possible motivations that likely drive schools’ opening strategy. Perhaps most conspicuously, the prohibitively high cost of facilities or other budget limitations may push operators to open at full enrollment in order to receive the maximum per-pupil reimbursement. In contrast, other operators may find that, without external sources of support, it is necessary to adjust facilities incrementally as grade expansion permits. Indeed, space constraints are as likely to exert pressure on operators to start small as to start at full enrollment. In some cities, the exigencies of co-location with traditional public schools may result in less start-up space for new charter schools, making a slow-grow start necessary. (See http://www.nytimes.com/2011/04/25/nyregion/charter-schools-face-hurdles-in-offer-of-free-space.html?pagewanted=all for examples of space constraints exerting pressure in both directions). We see little evidence of systematic differentiation in academic strategy across the three types of growth strategy. To the extent that the range of scores of incoming students in new schools serves as a proxy for the new schools’ target population -- and, to a certain degree, academic mission – there does not appear to be any pervasive pattern among new schools employing different growth strategies. The mean prior z-score, in math, of new students in middle schools’ first year of operation is shown in Table 25 below. Z-scores, or standard deviation units, are calculated based on each community’s respective statewide distribution of test scores. We have limited the table to middle schools, because prior test scores for these new students are consistently available. Though new schools in each category do appear to consistently seek out students from the lower end of the statewide distribution, they do not do so unevenly. This suggests that schools who have chosen all three strategies share similar academic missions. The distribution in starting score in reading looks similar across growth strategies.

56
Table 25: Starting Scores of Students by Growth Strategy
The market-specific policy environment in which new schools find themselves may also affect operators’ choice of opening or growth strategy. Some cities, states, and school districts provide special aid for charter school facilities, for example, while others make no such provision and, indeed, may erect roadblocks for new school start-ups seeking facilities. The vibrancy and interests of the local philanthropic community, as well, may broaden (or reduce) new schools’ options. This study relies on state achievement test results to provide equivalent measures of performance, but the fact that early grades are not tested introduces a wrinkle in our ability to assess how growth strategies affect performance. Because Grade 3 is the earliest tested grade, elementary schools that start as Slow-Growers will not have test results until year 3 or year 4 of their operations, when their grade span has expanded to include grade 3. Further, because two data points on each student are required to calculate effect size, relevant apples-to-apples comparisons between Slow-Grow and Full Starts cannot be made until year 4 or year 5 of operations, when both sets of schools have amassed sufficient performance data. Washington, DC and Massachusetts each test high schools students in tenth grade. For these students, we have calculated effect size using eighth-to-tenth grade growth, making the implicit assumption that 10th grade performance can be plausibly attributed to a 9th and 10th grade experience in the same school. New York high schools administer Regents Exams to students in math as early as eighth grade; as a result, year-to-year math scores are generally available for most New York high school students. The English/Language Arts Regent is administered only once, however, in 11th grade. Due to the increased chance of student mobility in this additional year, we have deemed a three-year growth effect to be too tenuous for inclusion in the analysis. Effect sizes in reading for Harlem and Albany students have therefore not been calculated. Similarly, Michigan high school students are tested only once in high school, in the 11th grade, and are therefore not included in our high school analysis. We identified schools’ approach to growth retrospectively using enrollment numbers compiled annually by the Department of Education for the federal Common Core of

57
Data12. Beginning with schools opening in the 2001-02 school year, we examined the pattern of enrollment displayed by each school. If a school opened with grades 5-8, for example, and then continued to appear with grades 5-8 in ensuing years, we were able to positively identify the school as a Full Start school. If, on the other hand, an elementary school opening in 2004 did not appear in our tested data set until the 2007-08 school year, and at that time with only a single tested grade, it was possible to deduce that the school started in the Slow Grow mode. By creating a series of cascading decision rules, we were able to identify 159 schools and 68,174 students as attending Slow-Grow, Mixed Start, or Full Start charter schools between the 2005-06 and 2010-11 school years. Tables 26 through 29 display the number of schools and students included in the analysis at each school level – that is, for elementary, middle, high, and multilevel schools. Table 26: Elementary Schools and Students Served by Growth Strategy and Opening Year
12 Core of Common Data, US Department of Education, Institute of Education Sciences, National Center for Ed4ucation Statistics. http://nces.ed.gov/ccd/

58
Table 27: Middle Schools and Students Served by Growth Strategy and Opening Year
Table 28: High Schools and Students Served by Growth Strategy and Opening Year
Table 29: Multilevel Schools and Students Served by Growth Strategy and Opening Year
59
Though cohorts are distributed somewhat unevenly across the years, there is generally a robust number of schools and students in each category. The exception to this can be found among the high schools in our sample, where in our communities -- and in the charter sector at large -- there are very small numbers. High school results should, accordingly, be interpreted with added caution. The panel character of the dataset makes it possible to associate students with the schools they enroll in and to identify the age of the charter school in any given year. This means that a single student might have multiple observations; similarly, the same school might be represented in our model at several different ages within our data window. Analytic Approach This sensitivity study addressed two questions:
1.) What is the average effect size for Slow Grow, Mixed Start, and Full Start charter schools as they mature?
To explore the questions, we ran a fixed effect model using dummies that were created from the interaction between growth strategy and age. This allowed us to parse differences in the outcomes of different growth strategies as schools mature.
2.) Are these effect sizes statistically different from one another?
We ran post-estimation tests to determine whether effects across years and growth strategies are statistically different from each other. This analysis of charter school growth strategy on overall school performance required three types of information: student-level data on students and their academic progress, information on the opening year of charter schools and information of their choice of approach to growth. Student-Level Data We use data on students for six years ( 2005-06 school year through the 2010-11 school year). Data on student characteristics, performance on state standardized achievement tests and eligibility for special programs such as Free or Reduced Price Lunch or Special Education were obtained from the State Education Agency in which each community is located. Student-level data from all traditional public and charter schools in operation in the five communities during the six-year time frame are included in the analysis, with a few important exceptions:

60
1.) Because reliable enrollment data from the US Department of Education is not available prior to 2001, we did not include charter schools that opened before 2001 in our model.
2.) At the time of the analysis, 2010-11 data from the state of Michigan was not available. As a result, data from Detroit in that year is not included.
Students’ test scores every year were standardized using each community’s state-wide distribution of test scores that year. All effect sizes are similarly reported in standardized units (i.e. z-scores.) Incorporating all the students in each community was needed to develop common comparison groups for each city to be used to benchmark the growth approach-by-year effects. By including all the students in traditional public schools in each city model, we are able to use the average academic gain in the traditional public school sector as the center point of comparison. School-Level Data We obtained data on the schools’ opening year from the Common Core of Data. We identified growth strategy using enrollment-by-grade patterns over time for each school, employing a decision rubric that accounted for the patterns that emerged. It was typically necessary to examine the enrollment patterns over multiple years to ascertain its growth pattern. Though it is certainly plausible in some cases to assign growth strategy from a single year of data alone, decisions based on two or more years of enrollment data – which makes it possible to observe changes in grade span offerings between a school’s first and second year – increases our confidence in the accuracy of our assignments. We estimated separate models for each school level. Our decision was driven in part by differences across grade spans of when the earliest performance data might be available. For example, it is always possible to estimate school effects after the first year for middle schools because students have prior test scores. However, for elementary the “first view” may be confounded with slow growth strategies. We also speculated that different mechanisms/theories of action might in play at different school levels with respect to opening strategies (e.g. creating a “model cohort” that looks different at different student ages.) Observations from all communities were consolidated into single pooled model, and the data set stacked across all years. Thus a student may have multiple observations (one for each growth period he is enrolled) as can schools (one observation for each year their operation is observed).

61
The estimation model included controls for calendar year, starting score, and several student-level demographic factors such as race, special program participation (IEP, English Learner, and Free/Reduced Lunch status), and a binary variable indicating whether or not a student is new that year. It also included community-specific controls to account for differential effect sizes across cities due to (a) overall differences in quality and (b) strong preferences in some communities for one particular growth strategy over another. A statistical model called an errors-in-variable regression was used to analyze the student-level data. This choice of model allows us to take into consideration their reliability of state tests. Where available, we calculated reliability estimates not from overall state numbers, but from standard errors of measurement associated with unique test scores for each state-year-grade-subject examination. This allowed us to refine our reliability estimates to the specific tested population. (This was available in all communities except Boston and Detroit; for both of these cities we used statewide reliability estimates specific to each year and test subject.) Results Presented below are a series of graphs that communicate two particularly pertinent pieces of information about estimated effect sizes across all school levels in math and reading:
(1) the magnitude of the estimated average effect; and (2) a measure of the precision of that estimate; i.e., the degree of variation.
We have captured this information in the graphs below by displaying, for each growth strategy/age fixed effect variable, the average effect size from the charter school fixed effect values as indicated by the round dot, and the 95% confidence interval around that average, as indicated by the bars extending from each average estimate. Another advantage offered by this set of graphs is that the reader can quickly discern statistical significance graphically: if the 95% confidence bar crosses the zero effect size line, then it is not statistically significantly different from zero at a p-value of .05; if the entire bar lies above or below the line, however, it is statistically significant. Similarly, if the Slow Grow bar and the Full Start bar for a given age comparison do not overlap, then they are statistically different from each other. For example, as shown in Figure 8 below, the Year 4 Slow Grow and Full Start results do not overlap each other, but the Year 8 results actually do, if only

62
ever so slightly. Thus, the Year 4 results are statistically different from each other, and the Year 8 results are not. In both years, the effect sizes are statistically significant overall. Elementary School Findings Figure 6: Elementary Math
For elementary schools, the Slow-Grow approach consistently and impressively outperforms Full with exception of Year 4. Recall that we do not have results for Slow Grow elementary schools until Year 4 or Year 5, because we cannot calculate effect size until they mature into having both a third and fourth grade class. Note that in Year 4, we have a smaller sample of Slow Grow schools, because it will be limited to those who began in Year 1 with kindergarten and first grade. It is also clear from the plot that the Slow Grow schools are more tightly clustered around their average, suggesting that their performance is more consistent. The size of the surrounding bar indicates that these schools are more likely overtime to maintain their levels of performance.

63
Figure 7: Elementary Reading
The findings for elementary reading show that the overall trend is more positive for the Slow Grow approach as schools mature – though this is notably not the case in the early years – but that the effect is not quite as pronounced. The distribution around the effect is wider than it is for math in the initial years of available performance, but tightens over time to be smaller than we observe in the Full Grow schools.

64
Middle School Findings Figure 8: Middle School Math
The performance of Slow Grow middle schools in math shows more positive performance in every period compared to the Full Grow schools. Moreover, the range of performance at each school age is more tightly distributed than it is for Full Start schools, which indicates that they are more likely to hold their higher levels of quality over time. Figure 9: Middle School Reading

65
In reading, Slow Grow charter schools’ performance mostly keeps pace or is slightly ahead of Full Start charter performance in the first five years, but then shows more positive performance in their later years. As with math, the performance range for these middle schools is typically much narrower among Slow Grow schools than among Full Start schools.
High School Findings
Figure 10: High School Math
Though we have a relatively small number of high schools in our population – and no new Full Start high schools at all – the same overall pattern is present. Despite a dip in Years 4-6, Slow Grow schools outperform their Full Start counterparts in math.

66
Figure 11: High School Reading
The same trend holds for reading; Slow Grow high schools take time to find their footing, but eventually produce better outcomes for students than Full Start schools. Multilevel Findings Figure 12: Multilevel Math

67
Figure 13: Multilevel Reading
Though, again, our numbers for multilevel schools are low relative to our elementary and middle school samples, the trend is clear: Slow Grow schools, particularly as they mature, outperform Full Start schools. Corollary Sensitivity Test for Mixed Start Schools The growth experience of the schools that start with multiple – but not all their ultimate – grades provided an additional opportunity to see if the original hypothesis about growth strategy was on target. Since Mixed Start schools fall between Slow and Full Start schools, if academic quality is a function of growth strategy, then we’d expect to see Mixed Start schools to display performance patterns that are between those of Full Starts and Slow Starts. We find this to be frequently, though not exclusively, the case. We have examples of Mixed Start schools at every school level apart from high school. Below, we have re-created the graphs from above, but we have added in (and emphasized) the Mixed Start effect sizes.

68
Figure 14: Elementary Math for Mixed Start Schools
Figure 15: Elementary Reading for Mixed Start Schools
Among elementary schools, Mixed Start schools appear initially to outperform even the Slow Grow schools. As schools mature, however, these effects drop off, and Mixed Start schools move to the middle or bottom of the performance distribution.

69
Figure 16: Middle School Math for Mixed Start Schools
The pattern in Reading for Middle Schools is more variable but still consistent with the general idea that the performance of Mixed Growth schools fall in between those of Full Start and Slow Grow. However, there are anomalies in the later years, which reflects the fact that we are only able to capture a very small number of schools (n=2) during the time frame of available data.

70
Figure 17: Middle Reading for Mixed Start Schools
As shown in Figure 17, the results for middles schools that growth with a Mixed Start approach post performance that falls between Slow Grow and Full Start results in the early years. We note, in this case, that the number of schools that have performance for more mature years is small, as was shown in Table 5.
Figure 18: Multilevel Math for Mixed Start Schools

71
Figure 19: Multilevel Reading for Mixed Start Schools
The pattern for multilevel – generally behaves as the theory would have predicted. Their average performance for most years of operation falls above Full Starts and below Slow Grow schools. Caution is advised, however, since this subset of schools consists of only 17 schools in total. Summary and Conclusions The preceding sensitivity test shows that schools that pursue a Slow Grow strategy to growth generally outperform schools that open with their full grade span enrolled. Fiscal considerations non-withstanding, staggered growth appears to be a preferable option from the standpoint of academic performance. We have several speculations about what makes the choice of slow growth produce superior gains for students. We have seen in many of our site visits that the entry grade of a Slow Grow school receives intensive focus and encouragement that they are the ”Model cohort” that will both be co-creators of the new school in their first year and serve as role models for successive cohorts as the school matures. This perhaps hints at why middle school students have the most pronounced effects; developmentally, these students are not as uniformly eager to please adults as younger students, but are able to emulate model behavior enthusiastically under the right conditions. High-profile CMOs generally cite a constant focus on school culture as a major source of their success; perhaps culture is easier to establish under a slow-grow start, rather than a full start.

72
These findings also lend support for the conditional probability analysis in the body of this report. The Slow Start vs. Full Start helps to explain to a degree what makes some schools' first signals of performance higher. Furthermore, the distributions of the two groups' later quality map generally with the spread seen in the full analysis. Thus, while growth strategy may help us predict a higher starting score for a Slow Grow school, after that, the typical patterns of strong versus weak performer prevail.

73
List of References Bifulco, Robert, and Helen F. Ladd, “The Impacts of Charter Schools on Student
Achievement: Evidence from North Carolina,” Education Finance and Policy, Vol. 1, No. 1, Winter 2006, pp. 50–90. As of December 14, 2012: http://www.mitpressjournals.org/doi/pdf/10.1162/edfp.2006.1.1.50
Booker, Kevin, Scott Gilpatric, Timothy Gronberg, and Dennis Jansen, “The Impact of Charter School Student Attendance on Student Performance,” Journal of Public Economics, Vol. 91, Nos. 5–6, June 2007, pp. 849–876.
CREDO. (2009). Multiple Choice: Charter School Performance in 16 States.
Available at: credo.stanford.edu/reports/MULTIPLE_CHOICE_CREDO.pdf. Hanushek, Eric A., John F. Kain, Steven G. Rivkin, and Gregory F. Branch, “Charter
School Quality and Parental Decision Making with School Choice.,” Journal of Public Economics, Vol. 91, Nos. 5-6, June 2007, pp. 823-848.
Sass, Tim R., “Charter Schools and Student Achievement in Florida,” Education
Finance and Policy, Vol. 1, No. 1, Winter 2006, pp. 91–122. As of December 14, 2012: http://www.mitpressjournals.org/doi/pdf/10.1162/edfp.2006.1.1.91
Zimmer, R., Brian Gill, Kevin Booker, Stephane Lavertu, Tim R. Sass, and John
Witte. (2009). Charter Schools in Eight States: Effects on Achievement, Attainment, Integration, and Competition. Santa Monica, CA, The Rand Corporation.