chart-in-chart indicator - en.swissquote.com · the chart-in-chart indicator shows the price action...
TRANSCRIPT
Chart-In-Chart Indicator
MetaTrader M
aster Edition
◚⯎
Table of contents
1. Overview 3
2. Using the Chart-in-Chart indicator 42.1 Adding the indicator to a chart 4
2.2 Choosing the symbol 4
2.3 Inverting prices 4
2.4 Drawing style and colours 5
2.5 Current price 5
2.6 Trade levels 5
2.7 Technical indicators 6
3© Swissquote Bank Ltd | MetaTrader Master Edition | Chart-In-Chart Indicator > Contents
1. Overview
The Chart-in-Chart indicator shows the price action for an additional symbol in a sub-window on the main chart, allowing bar-by-bar comparisons of price action on the main chart symbol against the subsidiary symbol.
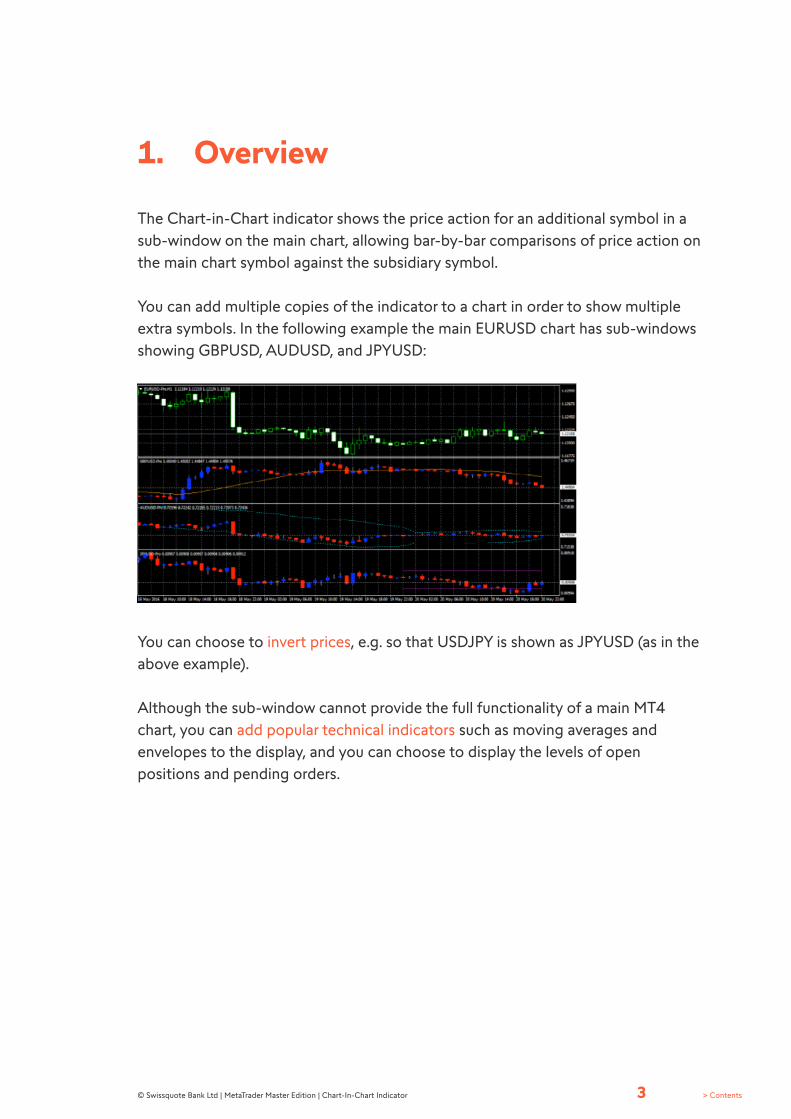
You can add multiple copies of the indicator to a chart in order to show multiple extra symbols. In the following example the main EURUSD chart has sub-windows showing GBPUSD, AUDUSD, and JPYUSD:
You can choose to invert prices, e.g. so that USDJPY is shown as JPYUSD (as in the above example).
Although the sub-window cannot provide the full functionality of a main MT4 chart, you can add popular technical indicators such as moving averages and envelopes to the display, and you can choose to display the levels of open positions and pending orders.
4© Swissquote Bank Ltd | MetaTrader Master Edition | Chart-In-Chart Indicator > Contents
2. Using the Chart-in-Chart indicator
2.1 Adding the indicator to a chartYou add the Chart-in-Chart indicator to a chart in the usual MT4 way, either by dragging it from the Navigator onto a chart, or by double-clicking on it in the Navigator. You can also use standard MT4 features such as adding the indicator to your list of Favorites, or assigning a Hotkey to it.
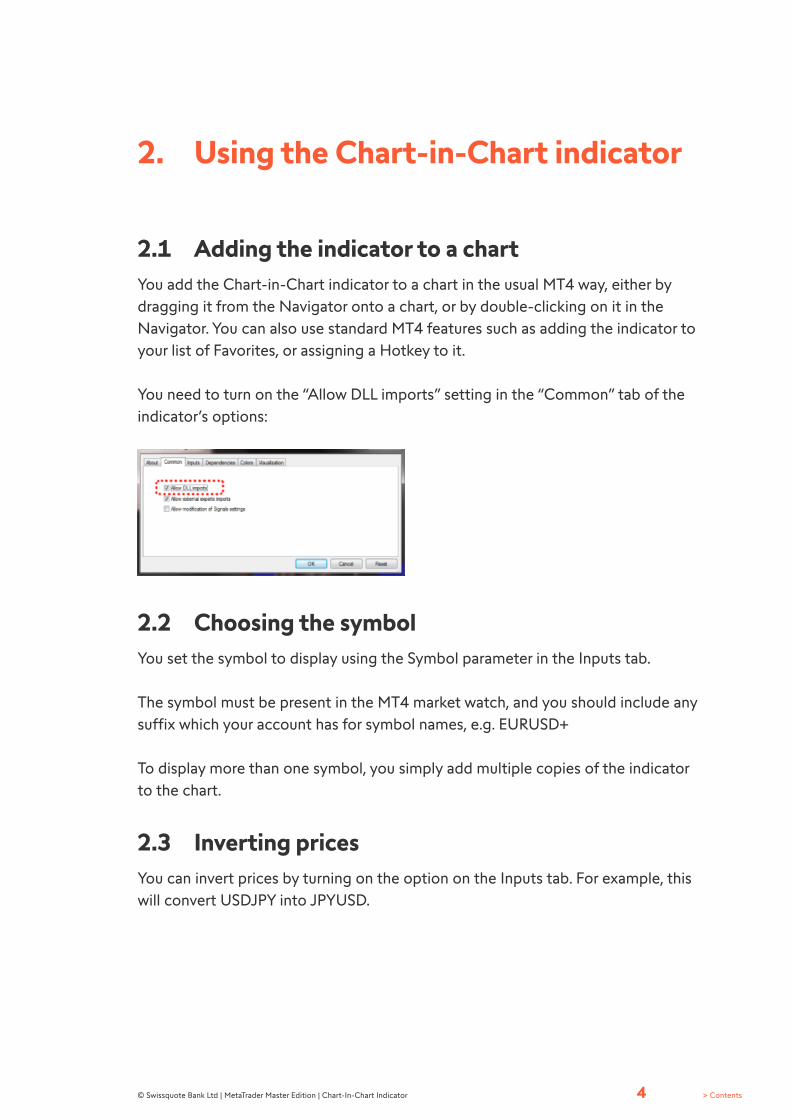
You need to turn on the “Allow DLL imports” setting in the “Common” tab of the indicator’s options:
2.2 Choosing the symbolYou set the symbol to display using the Symbol parameter in the Inputs tab.
The symbol must be present in the MT4 market watch, and you should include any suffix which your account has for symbol names, e.g. EURUSD+
To display more than one symbol, you simply add multiple copies of the indicator to the chart.
2.3 Inverting pricesYou can invert prices by turning on the option on the Inputs tab. For example, this will convert USDJPY into JPYUSD.
5© Swissquote Bank Ltd | MetaTrader Master Edition | Chart-In-Chart Indicator > Contents
2.4 Drawing style and coloursYou can use the Inputs tab to choose between different drawing styles:
• Price candles• Line showing close price only• Lines showing high and low prices
You can set the colour of the candle “wick”, or of the close or high and low lines, using the first of the colour parameters. For candles, you can also set different colours for up (“bull”) and down (“bear”) bars.
Hovering the mouse over a candle, or over the close or high and low lines, displays a pop-up tooltip giving the price values at that point in time.
2.5 Current priceBy default, the indicator will draw a horizontal line showing the current (bid) price. You can change the colour of this line using the setting on the Inputs tab. Changing the colour to “none” turns off the line.
2.6 Trade levelsYou can turn on the display of trade levels:
• Entry price for open positions• s/l and t/p of open positions• Entry price for pending orders
Each of these settings has a different colour parameter on the Inputs tab. Choosing a colour other than “None” turns on the display of this information. Hovering the mouse over one of these lines will then show information about the open position or pending order.
(If you invert prices, then the display of trade levels is also inverted. For example, a USDJPY buy will be shown as a JPYUSD sell, and a buy-limit will be shown as a sell-stop.)
6© Swissquote Bank Ltd | MetaTrader Master Edition | Chart-In-Chart Indicator > Contents
2.7 Technical indicatorsThe sub-window cannot provide the full functionality of a main MT4 chart – for example, you cannot drop an indicator from the Navigator onto the sub-window in order to add it to the price display for the extra symbol –but you can choose to include some popular technical indicators in the price display.
The Inputs tab contains 5 blocks of settings which you can use to define technical indicators. Each of these has a choice of indicator, a colour, a line-style, and parameters for the indicator.
The indicators which are available are as follows:
• SMA (simple moving average)• EMA (exponential moving average)• SMMA (smoothed moving average)• LWMA (linear-weighted moving average)• Bollinger band• Envelope based on SMA• Envelope based on EMA• Parabolic SAR• Yesterday’s daily (D1) close price• Yesterday’s daily (D1) high and low prices• Fixed price (equivalent to drawing a manual horizontal line on the chart)
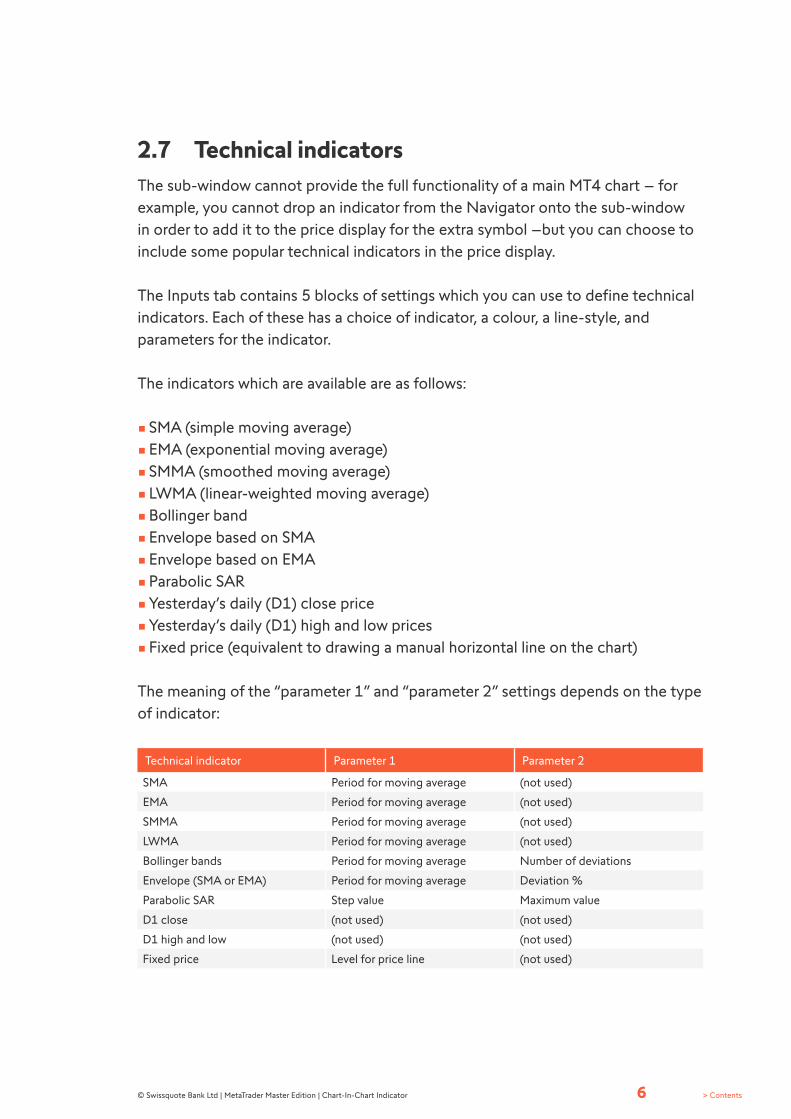
The meaning of the “parameter 1” and “parameter 2” settings depends on the type of indicator:
Technical indicator Parameter 1 Parameter 2
SMA Period for moving average (not used)
EMA Period for moving average (not used)
SMMA Period for moving average (not used)
LWMA Period for moving average (not used)
Bollinger bands Period for moving average Number of deviations
Envelope (SMA or EMA) Period for moving average Deviation %
Parabolic SAR Step value Maximum value
D1 close (not used) (not used)
D1 high and low (not used) (not used)
Fixed price Level for price line (not used)

7© Swissquote Bank Ltd | MetaTrader Master Edition | Chart-In-Chart Indicator > Contents
The content of this guide is purely informative and does not constitute an offer or a recommendation to trade a specific product and is not to be understood as a piece of advice of any sort, in particular regarding trading, tax and legal questions. The information or opinion regarding a product expressed in this guide do not take into consideration the investment objectives, the assets, the experience or the knowledge of a single investor. Swissquote Bank Ltd and its employees shall in no event be liable for damages or losses arising directly or indirectly from decisions made on the basis of the content of this guide. The content of this guide was produced by Swissquote Bank Ltd as per the current date and may be subject to change without prior notification. Although the content of this guide has been obtained from and is based upon sources that Swissquote Bank Ltd believes to be reliable, Swissquote Bank Ltd assumes no responsibility for the quality, correctness, timeliness or completeness of the content of this guide. This guide may not be reproduced in part or full without the written prior consent of Swissquote Bank Ltd. Forex transactions are highly speculative, involve an extreme degree of risk and are generally suitable only for persons who can assume and sustain a risk of loss in excess of their Forex margin. Forex transactions may, by their nature, generate losses that are in theory unlimited. In the absence of prior intervention, the loss could greatly exceed all the client’s assets deposited with the Swissquote Bank Ltd.

Geneva - Zurich - Bern - London - Dubai - Malta - Hong Kong
www.swissquote.com