charleston county school district financial …
TRANSCRIPT

CHARLESTON COUNTY SCHOOL DISTRICT
FINANCIAL STATEMENTS AND
SUPPLEMENTARY INFORMATION
YEAR ENDED JUNE 30, 2018

CHARLESTON COUNTY SCHOOL DISTRICT TABLE OF CONTENTS
YEAR ENDED JUNE 30, 2018
PRINCIPAL OFFICIALS i
FINANCIAL SECTION
INDEPENDENT AUDITORS’ REPORT 1
MANAGEMENT’S DISCUSSION AND ANALYSIS 4
BASIC FINANCIAL STATEMENTS
GOVERNMENT-WIDE FINANCIAL STATEMENTS
STATEMENT OF NET POSITION 16
STATEMENT OF ACTIVITIES 18
FUND FINANCIAL STATEMENTS
BALANCE SHEET – GOVERNMENTAL FUNDS 19
RECONCILIATION OF THE GOVERNMENTAL FUNDS BALANCE SHEET TO THE STATEMENT OF NET POSITION 21
STATEMENT OF REVENUES, EXPENDITURES, AND CHANGES IN FUND BALANCES – GOVERNMENTAL FUNDS 22
RECONCILIATION OF THE GOVERNMENTAL FUNDS STATEMENT OF REVENUES, EXPENDITURES, AND CHANGES IN FUND BALANCES TO THE STATEMENT OF ACTIVITIES 24
STATEMENT OF ASSETS AND LIABILITIES – FIDUCIARY FUNDS 25
STATEMENT OF CHANGES IN NET POSITION – FIDUCIARY FUNDS 26
NOTES TO FINANCIAL STATEMENTS 27
REQUIRED SUPPLEMENTARY INFORMATION
BUDGETARY COMPARISON SCHEDULES
SCHEDULE OF REVENUES, EXPENDITURES, AND CHANGES IN FUND BALANCE – BUDGETS AND ACTUAL – GENERAL FUND 74
SCHEDULE OF REVENUES, EXPENDITURES, AND CHANGES IN FUND BALANCE – BUDGETS AND ACTUAL – SPECIAL REVENUE FUND 75
SCHEDULE OF REVENUES, EXPENDITURES, AND CHANGES IN FUND BALANCE – BUDGETS AND ACTUAL – EDUCATION IMPROVEMENT ACT FUND 76
SCHEDULE OF REVENUES, EXPENDITURES, AND CHANGES IN FUND BALANCE – BUDGETS AND ACTUAL – FOOD SERVICE FUND 77

CHARLESTON COUNTY SCHOOL DISTRICT TABLE OF CONTENTS (CONTINUED)
YEAR ENDED JUNE 30, 2018
PENSION SCHEDULES
SCHEDULE OF CHARLESTON COUNTY SCHOOL DISTRICT’S PROPORTIONATE SHARE OF THE NET PENSION LIABILITY – SOUTH CAROLINA RETIREMENT SYSTEM 78
SCHEDULE OF CHARLESTON COUNTY SCHOOL DISTRICT’S CONTRIBUTIONS – SOUTH CAROLINA RETIREMENT SYSTEM 79
SCHEDULE OF CHARLESTON COUNTY SCHOOL DISTRICT’S PROPORTIONATE SHARE OF THE NET PENSION LIABILITY – POLICE OFFICERS’ RETIREMENT SYSTEM 80
SCHEDULE OF CHARLESTON COUNTY SCHOOL DISTRICT’S CONTRIBUTIONS – POLICE OFFICERS’ RETIREMENT SYSTEM 81
SUPPLEMENTARY INFORMATION
COMBINING AND INDIVIDUAL FUND SCHEDULES
GENERAL FUND
SCHEDULE OF REVENUES, EXPENDITURES, AND CHANGES IN FUND BALANCE – REVISED BUDGET AND ACTUAL 86
SPECIAL REVENUE FUND – SPECIAL PROJECTS FUND
SCHEDULE OF REVENUES, EXPENDITURES, AND CHANGES IN FUND BALANCES 97
SUMMARY SCHEDULE FOR OTHER DESIGNATED RESTRICTED STATE GRANTS 109
SUMMARY SCHEDULE BY PROGRAM 115
SPECIAL REVENUE FUND – OTHER SCHEDULES
DETAILED SCHEDULE OF DUE TO STATE DEPARTMENT OF EDUCATION/FEDERAL GOVERNMENT 116
FOOD SERVICE FUND
SCHEDULE OF REVENUES, EXPENDITURES, AND CHANGES IN FUND BALANCE 117
DEBT SERVICE FUNDS
SCHEDULE OF REVENUES, EXPENDITURES, AND CHANGES IN FUND BALANCE – DEBT SERVICE FUND – DISTRICT 119
SCHEDULE OF REVENUES, EXPENDITURES, AND CHANGES IN FUND BALANCE – DEBT SERVICE FUND – CEEF 120

CHARLESTON COUNTY SCHOOL DISTRICT TABLE OF CONTENTS (CONTINUED)
YEAR ENDED JUNE 30, 2018
CAPITAL PROJECTS FUNDS
SCHEDULE OF REVENUES, EXPENDITURES, AND CHANGES IN FUND BALANCE – CAPITAL PROJECTS FUND – DISTRICT 121
FIDUCIARY FUND
SCHEDULE OF RECEIPTS, DISBURSEMENTS, AND CHANGES IN DUE TO STUDENT ORGANIZATIONS – PUPIL ACTIVITY FUND 123
DISCRETELY PRESENTED COMPONENTS UNITS
COMBINING SCHEDULE OF NET POSITION – DISCRETELY PRESENTED COMPONENT UNITS 124
COMBINING SCHEDULE OF ACTIVITIES – DISCRETELY PRESENTED COMPONENT UNITS 125
LOCATION RECONCILIATION SCHEDULE 126

CHARLESTON COUNTY SCHOOL DISTRICT PRINCIPAL OFFICIALS
YEAR ENDED JUNE 30, 2018
(i)
Board of Trustees
Kate Darby, Board Chairperson
Eric Mack, Board Vice-Chairperson
Cindy Bohn Coats
Chris Collins
Todd Garrett
Kevin Hollinshead
Priscilla Jeffery
Michael Miller
Chris Staubes
Superintendent
Dr. Gerrita Postlewait

CliftonLarsonAllen LLPCLAconnect.com
(1)
INDEPENDENT AUDITORS’ REPORT Board of Trustees Charleston County School District Charleston, South Carolina Report on the Financial Statements
We have audited the accompanying financial statements of the governmental activities, the aggregate discretely presented component units, each major fund, and the aggregate remaining fund information of the Charleston County School District (the School District), as of and for the year ended June 30, 2018, and the related notes to the financial statements, which collectively comprise the School District’s basic financial statements as listed in the table of contents. Management’s Responsibility for the Financial Statements
Management is responsible for the preparation and fair presentation of these financial statements in accordance with accounting principles generally accepted in the United States of America; this includes the design, implementation, and maintenance of internal control relevant to the preparation and fair presentation of financial statements that are free from material misstatement, whether due to fraud or error. Auditors’ Responsibility
Our responsibility is to express opinions on these financial statements based on our audit. We did not audit the financial statements of James Island Charter High School, Charleston Development Academy, Inc., East Cooper Montessori Charter School, Orange Grove Elementary Charter School, Charleston Charter School for Math and Science, Pattison’s Academy of Comprehensive Education, Carolina Voyager Charter School, Greg Mathis Charter High School, Prestige Preparatory Academy, Allegro Music School, and Meeting Street Elementary at Brentwood, which represent 100% of the assets and deferred outflows of resources, net position, and revenues of the aggregate discretely presented component units. Those statements were audited by other auditors whose reports have been furnished to us, and our opinion, insofar as it relates to the other amounts included for the aggregate discretely presented component units, is based solely on the reports of the other auditors. We conducted our audit in accordance with auditing standards generally accepted in the United States of America and the standards applicable to financial audits contained in Government Auditing Standards, issued by the Comptroller General of the United States. Those standards require that we plan and perform the audit to obtain reasonable assurance about whether the financial statements are free from material misstatement.

Board of Trustees Charleston County School District
(2)
An audit involves performing procedures to obtain audit evidence about the amounts and disclosures in the financial statements. The procedures selected depend on the auditors’ judgment, including the assessment of the risks of material misstatement of the financial statements, whether due to fraud or error. In making those risk assessments, the auditor considers internal control relevant to the entity’s preparation and fair presentation of the financial statements in order to design audit procedures that are appropriate in the circumstances, but not for the purpose of expressing an opinion on the effectiveness of the entity’s internal control. Accordingly, we express no such opinion. An audit also includes evaluating the appropriateness of accounting policies used and the reasonableness of significant accounting estimates made by management, as well as evaluating the overall presentation of the financial statements. We believe that the audit evidence we have obtained is sufficient and appropriate to provide a basis for our audit opinion. Opinion
In our opinion, based on our audit and the reports of other auditors, the financial statements referred to above present fairly, in all material respects, the respective financial position of the governmental activities, the aggregate discretely presented component units, each major fund, and the aggregate remaining fund information of the School District as of June 30, 2018, and the respective changes in financial position for the year then ended in accordance with accounting principles generally accepted in the United States of America. Emphasis of Matter
During fiscal year ended June 30, 2018, the School District adopted GASB Statement No. 75, Accounting and Financial Reporting for Postemployment Benefits Other Than Pensions. As a result of the implementation of GASB Statement No. 75, the School District reported a restatement for the change in accounting principle (see Note 17). Our auditors’ opinion was not modified with respect to the restatement. Other Matters
Required Supplementary Information
Accounting principles generally accepted in the United States of America require that the management’s discussion and analysis, budgetary comparison schedules, and pension and OPEB schedules, as listed in the table of contents, be presented to supplement the basic financial statements. Such information, although not a part of the basic financial statements, is required by the Governmental Accounting Standards Board who considers it to be an essential part of financial reporting for placing the basic financial statements in an appropriate operational, economic, or historical context. We have applied certain limited procedures to the required supplementary information in accordance with auditing standards generally accepted in the United States of America, which consisted of inquiries of management about the methods of preparing the information and comparing the information for consistency with management’s responses to our inquiries, the basic financial statements, and other knowledge we obtained during our audit of the basic financial statements. We do not express an opinion or provide any assurance on the information because the limited procedures do not provide us with sufficient evidence to express an opinion or provide any assurance. Other Information
Our audit was conducted for the purpose of forming opinions on the financial statements that collectively comprise the School District’s basic financial statements. The supplementary information as listed in the table of contents is presented for purposes of additional analysis and is not a required part of the basic financial statements.

Board of Trustees Charleston County School District
(3)
The supplementary information is the responsibility of management and was derived from and relates directly to the underlying accounting and other records used to prepare the basic financial statements. Such information has been subjected to the auditing procedures applied in the audit of the basic financial statements and certain additional procedures, including comparing and reconciling such information directly to the underlying accounting and other records used to prepare the basic financial statements or to the basic financial statements themselves, and other additional procedures in accordance with auditing standards generally accepted in the United States of America. In our opinion, the supplementary information is fairly stated, in all material respects, in relation to the basic financial statements as a whole. Other Reporting Required by Government Auditing Standards
In accordance with Government Auditing Standards, we have also issued our report dated November 28, 2018, on our consideration of the School District’s internal control over financial reporting and on our tests of its compliance with certain provisions of laws, regulations, contracts, and grant agreements and other matters. The purpose of that report is solely to describe the scope of our testing of internal control over financial reporting and compliance and the result of that testing, and not to provide an opinion on the effectiveness of the School District’s internal control over financial reporting or on compliance. That report is an integral part of an audit performed in accordance with Government Auditing Standards in considering the School District’s internal control over financial reporting and compliance.
a CliftonLarsonAllen LLP
Columbia, South Carolina November 28, 2018

CHARLESTON COUNTY SCHOOL DISTRICT MANAGEMENT’S DISCUSSION AND ANALYSIS
JUNE 30, 2018
(4)
The Management’s Discussion and Analysis (MD&A) provides an objective analysis of the Charleston County School District’s (the School District or CCSD) financial condition based on facts known as of the date of the auditors’ report. While the accompanying financial statements are for the year ended June 30, 2018, the MD&A presents both a short-term and long-term analysis of the School District’s financial status. FINANCIAL HIGHLIGHTS
The General Operating Fund (“GOF”) total fund balance at June 30, 2018 was $70.2 million, an increase of $28.1 million from the balance at June 30, 2017. This was primarily due to a $7.5 million planned contribution to fund balance, revenues exceeding budget by $3 million and expenditures below budget by $17.4 million. The excess revenue is due to $3 million increase in state funding reimbursement for PEBA retirement and revenue in lieu of taxes exceeding budget projections. Expenditures below budget are primarily due to $19.1 million in salaries and benefits, netted with $1.9 million increase in purchased services costs (substitute teachers, transportation, workers compensation, additional costs associated with two storms during the year) and $2.6 million additional allocations to charter schools. Salaries and fringe benefits were below budget due to unfilled vacant positions and lapsed salaries.
Non-spendable GOF fund balance was $4.1 million or 1% of total General Fund expenditures for the year ended June 30, 2018. This includes inventory and prepaid items. Committed GOF fund balance was $36.9 million or 8.1% of total General Fund expenditures for the year ended June 30, 2018. This meets the one month operating expenditures requirement using fiscal year 2018 total operating budget of $458.2 million and fiscal year 2017 total operating budget of $422.5 million. Assigned GOF fund balance was $9.4 million or 2.1% of total General Fund expenditures for the year ended June 30, 2018. This includes $1,145,689 for Early College Program, $2,516,497 to increase starting teacher salaries, $3 million for academic growth, and $2.8 million in future years’ expenditures. Unassigned GOF fund balance was $19.7 million or 4.3% can be used for any purpose at the District’s discretion.
The School District’s revenues for governmental funds increased $74.6 million or 10.2% to
$802.5 million in fiscal year 2018. The major changes were a $50.3 million increase in local property taxes, a $13.2 million increase in state revenues, a $4.8 million increase in local one cent sales tax revenues, and a $2.9 million increase in federal revenues.
Property taxes and other local revenues (including the Local One Cent Sales Tax revenues)
accounted for 64.4% of the School District’s governmental funds’ revenue. The State revenue contribution was 26.9%; the Federal was 8.6% and other sources were less than one percent.
The amount of Education Finance Act (“EFA”) revenues sent to the School District increased
$3.2 million in fiscal year 2018 primarily due to changes in student categories and index of taxpaying ability. The School District remains the wealthiest in the State with regards to property value; however, Act 388 of 2008 revamped how school districts receive their funding for operating expenses which has severely limited growth in local tax millage.

CHARLESTON COUNTY SCHOOL DISTRICT MANAGEMENT’S DISCUSSION AND ANALYSIS
JUNE 30, 2018
(5)
FINANCIAL HIGHLIGHTS (CONTINUED)
The State formula starts with a target of 70% State funding and 30% local funding. The School District receives a much lower percentage from the State than most other districts. The table below outlines the last five years’ state support percentages for the School District.
FY2014 32 percent FY2015 32 percent FY2016 34 percent FY2017 31 percent FY2018 32 percent
This discussion and analysis focuses on the primary government; however, the District
sponsored ten charter schools in fiscal year 2018, which are reflected as discretely presented component units.
The 7-day enrollment decreased 527 students from 50,203 in fiscal year 2017 to 49,676 in fiscal year 2018. These figures include all students in classes for child development through grade 12 as well as charter school students. The decrease in 7-day enrollment represents a 1.1% decrease.
The Average Daily Membership (ADM) of students in the School District as of the 135th day
decreased from 46,468 in fiscal year 2017 to 46,140 in fiscal year 2018, a 0.7% decrease in the 135th day ADM. The 135th day ADM does not include child development enrollment, only students in kindergarten through grade 12. The 7-day enrollment and the 135th day average daily membership continue to fluctuate each year. The District did not maintain the number of students from the beginning of the year to the end of the year in FY18.
Total revenues and other financing sources for all governmental funds exceeded expenditures
and other financing uses by $44.8 million. This net change was due to changes in several funds as follows:
o $28.1 million increase in the General Fund as explained above o $1.2 million increase in the Special Revenue Fund due to the carryover of fund balance
in several funds and funds transfer from the General Fund to alleviate historical deficits o $41.6 million increase the Capital Projects – District Fund due to debt issuance in
advance of capital projects o $25.7 million decrease in Debt Service-District due to budgeted use of available sinking
fund balance. o $0.4 million decrease in Food Service Fund

CHARLESTON COUNTY SCHOOL DISTRICT MANAGEMENT’S DISCUSSION AND ANALYSIS
JUNE 30, 2018
(6)
FINANCIAL HIGHLIGHTS (CONTINUED)
Many capital projects were underway during the current fiscal year. The projects are indicated below.
o Completed construction on several sites including: Angel Oak Elementary School Pinehurst Elementary School Emergency Operations Center @ Bridge View District Wide Athletic Improvements NEW Carolina Park Elementary School District 2 Stadium St James-Santee Elementary School Trailer Purchases (Angel Oak Elementary School and District Wide Athletic
Improvements)
o Continued work on building sites including: Lowcountry Tech @ Burke High School District 3 Bus Lot District 4 Bus Lot Stono Park Elementary School Mary Ford Elementary School Northwoods Middle School C E Williams Academic Magnet West Ashley Middle School Dunston Elementary School Garrett Academy St Andrews Middle School Burns Elementary School C E Williams Middle School Center for Advanced Studies @ West Ashley High School NEW Lucy G Beckham High School NEW Camp Road Middle School (Ft Johnson) District 4 Stadium Dunston Elementary School Center for Advanced Studies @ North Charleston Moultrie Middle School Hursey Elementary School
o Continued Modernization projects that included:
1:1 student devices, wireless network upgrades and support equipment Computer replacement program (administration, general lab and CTE lab) Video distribution systems Classroom sound enhancement Technology software Media Center upgrades

CHARLESTON COUNTY SCHOOL DISTRICT MANAGEMENT’S DISCUSSION AND ANALYSIS
JUNE 30, 2018
(7)
FINANCIAL HIGHLIGHTS (CONTINUED)
o Continued Fixed Cost of Ownership projects that included: Mobile classroom relocation Roof replacement, repairs and restoration HVAC replacement and chill water piping system Playgrounds Security (Surveillance and access control) Emergency communication Furniture Arts Athletics CTE equipment furnishings Operational Planning Transportation
OVERVIEW OF THE FINANCIAL STATEMENTS
The School District’s financial statements are comprised of three components: 1) government-wide financial statements, 2) fund financial statements, and 3) notes to the financial statements. This report also contains supplementary information designed to enhance the readers’ understanding of the financial statements. The School District’s government-wide financial statements, which can be found as listed in the table of contents, include the statement of net position and the statement of activities. These two statements do not focus on the financial activities of the District’s individual subprograms, but rather report information about the overall financial condition of the District’s operation. As described in the notes to the financial statements, other entities’ activities are included in this report because of the relationship of these legally separate entities to the School District. Financial information of the Charleston Development Academy, Inc., James Island Charter High School, East Cooper Montessori Charter School, Orange Grove Charter Elementary, Charleston School for Math and Science Charter School, Gregg Mathis Charter High School, Pattison’s Academy for Comprehensive Education, Carolina Voyager Charter School, Allegro Music School, and Prestige Charter School, is included in the District’s financial statements. In addition to the traditional charter schools, the District maintains a public/private partnership with the Meeting Street Elementary Group, MSEG. The District funds the partnership at the same per pupil expenditure of three similar schools in the District. All schools are collectively referred to in the financial statements as those of the discretely-presented component units. The School District’s fund financial statements can be found as listed in the table of contents. Unlike the government-wide financial statements, which consolidate financial data, the purpose of the School District’s fund financial statements is to present detailed financial information about the District’s operations. Included in these statements are the District’s general operating fund, special revenue funds, education improvement act funds, debt service fund, capital projects fund, and the nonmajor permanent fund.

CHARLESTON COUNTY SCHOOL DISTRICT MANAGEMENT’S DISCUSSION AND ANALYSIS
JUNE 30, 2018
(8)
OVERVIEW OF THE FINANCIAL STATEMENTS (CONTINUED)
The notes to the financial statements provide additional information that may be necessary for understanding the data contained in both the government-wide and the fund financial statements. The notes to the financial statements can be found as listed in the table of contents of this report. ANALYSIS OF THE DISTRICT’S GOVERNMENT-WIDE STATEMENTS
Government-wide financial statements report transactions that are considered governmental type activities. Such activities are funded primarily through local property taxes and state and federal revenues. Governmental activities account for the School District’s basic services such as regular and special education, school bus transportation, school building maintenance, and administration. An important question that should be asked about the School District’s finances is, “Is the School District, as a whole, better off or worse off as a result of this year’s activities?” The Statement of Net Position and the Statement of Activities present consolidated financial information about the School District as a whole and that helps answer the question. These statements report the District’s financial data using the accrual basis of accounting, which is similar to the accounting method used by most private-sector companies. The Statement of Net Position includes all of the School District’s assets, deferred outflows of resources, liabilities, deferred inflows of resources, and net position (equity). All of the current year’s revenues and expenses are accounted for in the Statement of Activities regardless of when cash is received or paid. The two government-wide statements report the School District’s net position and how it has changed from one year to the next. Net position – which is the School District’s assets and deferred outflows of resources less the School District’s liabilities and deferred inflows of resource – are one way to measure the School District’s financial health or position. Over time, increases or decreases in the School District’s net position indicate whether its financial position is improving or deteriorating. To assess the School District’s overall health, additional economic factors, such as changes in the School District’s property tax base, the condition of school buildings and other facilities, and changes in state and federal revenue should be considered. These factors are addressed in this report. Our analysis below focuses on total net position (Figure A-1) and changes in net position (Figure A-2) of the School District’s governmental activities.

CHARLESTON COUNTY SCHOOL DISTRICT MANAGEMENT’S DISCUSSION AND ANALYSIS
JUNE 30, 2018
(9)
ANALYSIS OF THE DISTRICT’S GOVERNMENT-WIDE STATEMENTS (CONTINUED)
2017* 2018 DifferenceAssets
Current and Other Assets 317.4$ 413.4$ 96.0$ Capital Assets, Net 1,354.1 1,390.1 36.0
Total Assets 1,671.5 1,803.5 132.0
Deferred Outlfows of ResourcesDeferred Pension Charges 96.7 93.0 (3.7) Deferred OPEB Charges - 15.8 15.8 Advance Refunding Charges 47.7 43.0 (4.7)
Total Deferred Outflows of Resources 144.4 151.8 7.4
LiabilitiesLong-Term Liabilities 1,301.5 1,633.0 331.5 Other Liabilities 199.0 248.6 49.6
Total Liabilities 1,500.5 1,881.6 381.1
Deferred Inflows of ResourcesDeferred Pension Credits 4.6 49.9 45.3 Deferred OPEB Credits - 39.0 39.0
Total Deferred Inflows of Resources 4.6 88.9 84.3
Net PositionNet Investment in Capital Assets 683.9 763.6 79.7 Restricted 55.4 36.0 (19.4) Unrestricted (428.5) (814.7) (386.2)
Total Net Position 310.8$ (15.1)$ (325.9)$
* Does not include the effects of GASB 75, Accounting & Financial Reporting for Post Employment Benefits Other Than Pensions
Figure A - 1Condensed Statement of Net Position
Governmental Activities
(in Millions of Dollars)
The School District’s assets increased by $132 million, deferred outflows of resources increased by $7.4 million, liabilities increased by $380.4 million, and total deferred inflows of resources increased $84.3 million resulting in a $325.9 million decrease in net position. The overall increase in assets is due to a $36 million increase in capital assets and a $96 million increase in current and other assets. Net capital assets increased by $75.2 million and decreased by $39.2 million for depreciation expense and disposals. Current and other assets increased primarily due to a $79 million increase in cash and investments. Cash and investments increased due to proceeds of short-term bonds issued during the year partially offset by capital asset acquisitions. The primary reason for the increase in liabilities, deferred inflows of resources, deferred outflows of resources is primarily due to the School District implemented GASB 75, Accounting & Financial Reporting for Post-Employment Benefits Other Than Pensions during fiscal year 2018.

CHARLESTON COUNTY SCHOOL DISTRICT MANAGEMENT’S DISCUSSION AND ANALYSIS
JUNE 30, 2018
(10)
ANALYSIS OF THE SCHOOL DISTRICT’S GOVERNMENT-WIDE STATEMENTS (CONTINUED)
Revenues 2017* 2018Program Revenues:Charges for Services 4.7$ 5.0$ Operating Grants 184.8 201.4 General Revenue:Property Taxes 340.4 391.3 Local One Cent Sales Tax 100.8 105.6 Revenue in Lieu of Taxes 95.2 96.0 Other 11.2 4.6
Total Revenues 737.1 803.9
Program ExpensesInstruction 266.8 282.8 Support Services 264.4 299.1 Community Services 8.9 10.1 Payments to Component Units 38.8 44.7 Interest and Fiscal Charges 33.6 26.7 Depreciation Unallocated 38.0 39.2
Total Program Expenses 650.5 702.6
Change in Net Position 86.6 101.3 Net Position - Beginning of Year* 224.2 (116.4) Net Position - End of Year 310.8$ (15.1)$
* Does not include the effects of GASB 75, Accounting & Financial Reporting for Post Employment Benefits Other Than Pensions
Governmental Activities
Figure A - 2Changes in Net Position from Operating Results
(in Millions of Dollars)
Expense categories:
Instruction – face-to-face direct classroom expenditures
Support Services – those expenditures that support the classroom including media center, guidance, health services, professional development, food service, student transportation, maintenance, and administrative costs.
Community Services – those expenditures that are an extension of the regular school day to include Adult Education, Community Education, and After-School child care.
Payment to Component Units – those expenditures that reflect payments to the charter schools and alternative schools that the School District sponsors.
Interest and Fiscal Charges – those expenditures that reflect the interest due on short- and long-term borrowing to include debt service interest payments due under alternative financing.
Depreciation Unallocated – the depreciation on buildings and property not included in the instruction, support services or community services categories.

CHARLESTON COUNTY SCHOOL DISTRICT MANAGEMENT’S DISCUSSION AND ANALYSIS
JUNE 30, 2018
(11)
ANALYSIS OF THE SCHOOL DISTRICT’S GOVERNMENT-WIDE STATEMENTS (CONTINUED)
Revenues increased 9.1 percent, or $66.8 million primarily due to a $50.9 million increase in property taxes as a result of increased assessed values and an operating millage increase of 2.9 mills, a $16.6 million increase in grants and other contributions, a $4.8 million increase in local one cent sales tax revenues partially due to continued economic growth in the area, and a $.8 million increase in revenue in lieu of taxes. Expenses increased approximately 7.9 percent, or $51.5 million. Instruction expenses increased 6.0 percent, or $16.0 million, support expenses increased 13.1 percent, or $34.7 million, community services expenses increased 13.5 percent, or $1.2 million, and unallocated depreciation expense increased 3.2 percent, or $1.2 million. The increase in instructional and support expenses is primarily due to an increase in salaries and fringe from a step increase and 2% cost of living adjustment and increases in employer contribution rates for health insurance and retirement contributions. FINANCIAL ANALYSIS OF THE SCHOOL DISTRICT’S FUNDS
The fund financial statements, which can be found as listed in the table of contents, provide more detailed information about the School District’s funds, focusing on its significant funds – not the School District as a whole. Funds are accounting devices that the School District uses to keep track of specific sources of funding and spending on particular programs:
Some funds are required by state law and by bond covenants.
The School District establishes other funds to control and manage money for particular purposes (such as repaying its long-term debts) or to show that it is properly using certain revenues (such as federal grants).
The School District has two kinds of funds:
Governmental Funds: The School District’s basic services are included in governmental funds, which generally focus on (1) how cash and other financial assets that can readily be converted to cash flow in and out and (2) the balances left at year-end that are available for spending. Consequently, the governmental funds statements provide a detailed short-term view that helps you determine whether there are more or fewer financial resources that can be spent in the near future to finance the School District’s programs. Because this information does not encompass the additional long-term focus of the district-wide statements, additional information follows the governmental funds statements, in the form of a reconciliation, to explain the relationship (or differences) between them.
Fiduciary Funds: The School District is the trustee, or fiduciary, for assets that belong to others, such as the scholarships and the student activities funds. The School District is responsible for ensuring that the assets reported in these funds are used only for their intended purposes and by those to whom the assets belong. The School District excludes these activities from district-wide financial statements because it cannot use these assets to finance its operations.

CHARLESTON COUNTY SCHOOL DISTRICT MANAGEMENT’S DISCUSSION AND ANALYSIS
JUNE 30, 2018
(12)
FINANCIAL ANALYSIS OF THE SCHOOL DISTRICT’S FUNDS (CONTINUED)
Governmental Funds
For the year ended June 30, 2018, the School District’s governmental funds reported a combined fund balance of $158.4 million, as compared to $113.6 million for the prior year. This increase of $44.8 million was primarily due to changes in several funds as follows: $28.1 million increase in the General Fund, $1.2 million increase in the Special Revenue Fund, a $.4 million decrease in the Food Service Fund, a $41.6 million increase in the Capital Projects – District Fund, and a $25.7 decrease in the Debt Service-District Fund. At June 30, 2018, the School District’s non-spendable fund balance for all governmental funds was $4.5 million, which includes $3.9 million related to prepaid items, $0.3 million related to inventories in the General Fund, $0.3 million related to inventories in the Food Service Fund, and less than $0.1 million related to principal on endowments. The total restricted fund balance (all funds) was $136.4 million including restrictions for debt service of $.4 million, capital projects of $124.6 million, food services of $8.1 million, special revenue of $3.3 million and endowments and scholarships of $0.1 million. The total committed fund balance (all funds) was $36.9 million in the General Fund to meet the District’s policy and state statutes requiring one month operating expenditures using an average of the last two fiscal years’ total expenditures. The total assigned fund balance (all funds) was $9.4 million in the General Fund related to $2.7 million for future years’ expenditures and $6.6 million for instruction. The total unassigned fund balance (all funds) was a negative $28.9 million, which includes $19.7 million reported in the General Fund as well as a deficit of $48.5 million reported in the Debt Service – District Fund. This deficit was due to the timing of tax receipts for the Debt Service Fund. The General Fund is the chief operating fund of the School District. At the end of the current fiscal year, total fund balance of the General Fund was $70.2 million. The total non-spendable fund balance was $4.1 million for inventory and prepaid items. The total assigned fund balance was $9.4 million which includes $6.7 million for instructional purposes to support Early College Program at $1.1 million, increase starting teacher salaries at $2.5 million and support academic growth at $3 million and $2.8 million for future years’ expenditures. The total unassigned fund balance was $19.7 million. The School District’s fund balance policy requires the District to maintain at least one month of general fund operating expenditures of the previous two completed fiscal years in the General Fund operating budget as committed fund balance. The committed fund balance is $36.9 million as of June 30, 2018, and meets the one month operating expenditures requirement using fiscal year 2018 total operating budget of $458.2 million and fiscal year 2017 total operating budget of $422.5 million. The School District’s Governmental Funds include the General Fund, as described above, Special Revenue, Special Revenue – EIA, Food Service, Debt Service – District, Debt Service – CEEF, Capital Projects – District, Capital Projects – CEEF, and Medals and Awards Permanent Fund.

CHARLESTON COUNTY SCHOOL DISTRICT MANAGEMENT’S DISCUSSION AND ANALYSIS
JUNE 30, 2018
(13)
FINANCIAL ANALYSIS OF THE SCHOOL DISTRICT’S FUNDS (CONTINUED)
Governmental Funds (Continued)
The School District’s Special Revenue Funds and EIA are used to account for revenues derived from the State of South Carolina and the Federal Government and various other special revenue programs. The Special Revenue Fund reported an ending fund balance of $3.3 million, an increase of $1.2 million, as the revenues and other financing sources of $65.6 million exceeded expenditures and other financing uses of $64.4 million. The EIA fund reports no fund balance as any unspent allocations received from the State Department of Education as of year-end are considered to be unearned revenues. As a result, revenues and other financing sources of $30.8 million equaled expenditures and other financing uses of $30.8 million. The School District accounts for its United States Department of Agriculture’s approved school breakfast and lunch programs in a separate Food Service (special revenue) fund. The fund balance at the end of the fiscal year was $8.4 million, a decrease of $0.4 million from the prior year, due to expenditures exceeding revenues by this amount. Two Debt Service funds are shown in the accompanying financial statements of the School District, the regular School District Debt Service fund and the CEEF Debt Service Fund. Both funds are used to account for the accumulation of funds for debt retirement. The District Debt Service fund balance at the end of the current fiscal year was a deficit of $48.5 million, a decrease of $25.7 million from the prior year deficit fund balance of $22.8 million. The change in fund balance is primarily due to the District issuing short-term debt that is outstanding as of June 30, 2018, which is recorded as a liability as opposed to other financing source if it were long-term debt. This short term debt is issued in the spring of each year to fund fixed cost of ownership projects and make payments on the CEEF financing, and is retired in the fall. The CEEF Debt Service fund balance at the end of the current fiscal year of $0.4 million accounts for accumulated resources for payment on the CEEF Installment Purchase Revenue Bonds sold by the non-profit organization. The fund balance remained the same due to the use of a portion of accumulated debt service funds to retire CEEF debt. The Capital Projects – District Fund is used to account for the School District’s capital project expenditures. The fund balance in the Capital Projects – District Fund increased by $41.6 million to $124.6 million at June 30, 2018, due primarily to transfers from the District’s Debt Service Fund (representing proceeds from short-term borrowings to be used in construction projects) needed due to planned construction-related expenditures exceeding revenues from the one cent local sales tax as previously discussed.

CHARLESTON COUNTY SCHOOL DISTRICT MANAGEMENT’S DISCUSSION AND ANALYSIS
JUNE 30, 2018
(14)
FINANCIAL ANALYSIS OF THE SCHOOL DISTRICT’S FUNDS (CONTINUED)
General Fund Budgetary Highlights
The School District’s budgeted expenditures for the General Fund including other financing uses were approximately $458.2 million and the budget anticipated that revenues would exceed expenditures by $7.5 million. Revenues exceed expenditures by $28.1 million. This increase was $20.6 million more than the budgeted increase of $7.5 million. This was due to several areas as indicated below:
State retirement reimbursements were $3 million higher than expected for the allocated funding of the PEBA retirement increase.
Expenditures were below budget primarily due to $19.3 million in unexpended salaries and benefits associated with vacant positions. Purchased services expenditures were over budget by $1.2 million due to increased costs in substitute teachers, transportation, workers compensation and additional costs associated with two storms during the year.
Payments to component units were over budget by $2.6 million. Charter school payments are based on the previous year’s audited revenue and student counts.
CAPITAL ASSET AND DEBT ADMINISTRATION
Capital Assets
The School District has invested $1.844 billion in a broad range of capital assets including land, school buildings, athletic facilities, equipment, and administrative offices. Accumulated depreciation on these assets as of June 30, 2018, was $454.1 million.
Total depreciation expense for the year was $39.2 million while additions to capital assets amounted to $75.8 million.
2017 2018Land 43.4$ 55.4$ Construction in Progress 82.8 44.2 Building and Improvements 1,552.8 1,629.8 Improvements Other than Buildings 50.8 74.1 Furniture and Fixtures 36.7 38.2 Food Service Equipment 2.5 2.5 Less: Accumulated Depreciation (414.9) (454.1)
Totals 1,354.1$ 1,390.1$
Governmental Activities
Figure A - 3Capital Assets at Year-End
(Net of Depreciation, in Millions of Dollars)
Major additions primarily included construction projects, which were discussed in detail above.

CHARLESTON COUNTY SCHOOL DISTRICT MANAGEMENT’S DISCUSSION AND ANALYSIS
JUNE 30, 2018
(15)
CAPITAL ASSET AND DEBT ADMINISTRATION (CONTINUED)
Long-Term Debt
As of June 30, 2018, the School District had $619 million in general obligation bonds and other long-term obligations, a decrease of $32.4 million or 5.0% from June 30, 2017, as shown in Figure A-4. The District’s bond rating as of October 2018 was Aa1 (Enhanced)/Aa3 (Underlying) by Moody’s.
2017 2018
General Obligation Bonds 165.2$ 153.2$ Installment Revenue Bonds 486.2 465.8
Totals 651.4$ 619.0$
Governmental Activities
(in Millions of Dollars)Outstanding Debt at Year-End
Figure A - 4
In addition, the School District had $148.7 million in outstanding General Obligation Bond Anticipation Notes (“BAN”) at June 30, 2018. Subsequent to year end in August 2018, the School District issued a short-term Tax Anticipation Note (“TAN”) in the amount of $65.4 million to defray the operations and maintenance of the School District pending the collection of ad valorem taxes and State aid collections. Principal and interest on the TAN are due in full on March 30, 2019. The School District issued a General Obligation Bond (“GOB”) in November 2018 in the amount of $95.2 million to fund the installments of purchase price coming due under Facilities Agreements entered into with CEEF, to repay the outstanding Series 2018A BAN, to fund capital projects and to provide for the costs of issuance of the bonds. The principal is due March 1, 2019.
More detailed information on capital assets and long-term debt is provided in the accompanying notes to the financial statements. FACTORS BEARING ON THE SCHOOL DISTRICT’S FUTURE
At the time these financial statements were prepared, the School District was aware of existing circumstances that could significantly affect its financial health in the future:
The fiscal year 2019 budget was developed in a manner that was conservative in its revenue projections and frugal in its expenditure allocations. The budget continues to represent a focused effort to ensure that resources are directed to the most appropriate uses. The conservative budgeting process is in recognition of the revenue generating limitations imposed by South Carolina Legislative Act 388.
The fiscal year 2019 budget was approved by the School Board in May 2018 with a 3.96 millage increase to the operating budget.
CONTACTING THE SCHOOL DISTRICT’S FINANCIAL MANAGEMENT
This financial report is designed to provide the School District’s citizens, taxpayers, customers, and investors and creditors with a general overview of the School District’s finances and to demonstrate the School District’s accountability for the money it receives. If you have questions about this report or need additional financial information, contact the Financial Services Office, Charleston County School District, 3999 Bridge View Drive, Charleston, South Carolina 29406.

CHARLESTON COUNTY SCHOOL DISTRICT STATEMENT OF NET POSITION
JUNE 30, 2018
See accompanying Notes to Financial Statements. (16)
Primary
GovernmentGovernmental Charter Schools
Activities Component UnitsASSETS
CURRENT ASSETSCash and Cash Equivalents 116,426,845$ 13,429,591$ Investments - 5,686,422 Restricted Cash and Cash Equivalents 191,987,777 - Restricted Investments 5,241,297 - Accounts Receivable, Net 4,034,590 84,249 Property Taxes Receivable, Net 13,786,850 - Local Sales Tax Receivable, Net 29,205,872 - Due from Governmental Agencies 47,495,679 74,396 Due from Agency Fund 166,890 - Due from Primary Government - 56,772 Due from Others 575,395 - Other assets - 57,791 Inventory 591,075 - Prepaid Expenses 3,867,907 284,994
Total Current Assets 413,380,177 19,674,215
NONCURRENT ASSETSCapital Assets:
Capital Assets - Not Being Depreciated 99,585,287 1,718,224 Capital Assets - Net of Accumulated Depreciation 1,290,493,154 8,137,538
Total Noncurrent Assets 1,390,078,441 9,855,762
Total Assets 1,803,458,618 29,529,977
DEFERRED OUTFLOWS OF RESOURCESDeferred Pension Charges 93,009,798 7,840,591 Deferred OPEB Charges 15,857,099 1,091,745 Advance Refunding Charges 42,957,228 -
Total Deferred Outflows of Resources 151,824,125$ 8,932,336$

CHARLESTON COUNTY SCHOOL DISTRICT STATEMENT OF NET POSITION (CONTINUED)
JUNE 30, 2018
See accompanying Notes to Financial Statements. (17)
Primary
GovernmentGovernmental Charter Schools
Activities Component UnitsLIABILITIES
CURRENT LIABILITIESAccounts Payable 34,822,464$ 1,272,347$ Contracts Payable - Retainage 2,184,067 - Unearned Revenue 3,439,752 98,464 Due to Governmental Agencies 117,086 - Due to Primary Government - 2,598,464 Accrued Compensation and Related Benefits 46,710,812 39,263 Accrued Interest Payable 5,051,981 - Other Accrued Expenses 7,505,716 654,376 Bond Anticipation Expenses 148,720,000 -
Total Current Liabilities 248,551,878 4,662,914
NONCURRENT LIABILITIESNet Pension Liability 526,856,628 33,928,595 Net OPEB Liability 412,761,832 27,875,937 Long-Term Obligations, Due Within One Year 42,442,477 250,140 Long-Term Obligations, Due in More Than One Year 650,903,361 215,263
Total NonCurrent Liabilities 1,632,964,298 62,269,935
Total Liabilities 1,881,516,176 66,932,849
DEFERRED INFLOWS OF RESOURCESDeferred Pension Credits 49,878,686 4,403,315 Deferred OPEB Credits 39,024,014 2,635,493
Total Deferred Inflows of Resources 88,902,700$ 7,038,808$
NET POSITION (DEFICIT)Net Investment in Capital Assets 763,602,091 9,629,879 Restricted for:
Capital Projects 27,573,422 1,450,000 Food Service 8,393,615 -
Unrestricted (814,705,261) (46,589,223) Total Net Deficit (15,136,133)$ (35,509,344)$

CHARLESTON COUNTY SCHOOL DISTRICT STATEMENT OF ACTIVITIES YEAR ENDED JUNE 30, 2018
(18)
Functions/Programs PrimaryOperating Government
Charges for Grants and Governmental ComponentExpenses Services Contributions Activities Units
PRIMARY GOVERNMENT
Governmental Activities:Instruction 282,851,810$ -$ 107,179,446$ (175,672,364)$ -$ Support Services 299,075,207 5,043,786 38,767,039 (255,264,382) - Community Services 10,135,436 - 10,819,609 684,173 - Payments to Component Units 44,661,880 - 44,661,880 - - Interest and Other Charges 26,693,463 - - (26,693,463) - Depreciation - Unallocated 39,247,142 - - (39,247,142) -
Total Primary Government 702,664,938$ 5,043,786$ 201,427,974$ (496,193,178)$ -$
COMPONENT UNITSAlternative School 10,674,406$ -$ 7,087,830$ -$ (3,586,576)$ Charter Schools 47,010,457 734,615 44,780,902 - (1,494,940)
Total Component Units 57,684,863$ 734,615$ 51,868,732$ -$ (5,081,516)$
GENERAL REVENUESProperty Taxes Levied for:
General Purposes 294,414,755$ -$ Debt Service 96,848,165 -
Revenue in Lieu of Taxes 96,018,420 - Local One Cent Sales Tax 105,567,815 - Miscellaneous Revenue 535,847 2,892,030 Grants and Contributions Not Restricted to Specific Programs 998,622 4,521,895 Payments from Other Governmental Units 221,515 - Gain (Loss) on Disposal of Capital Assets (611,871) 2,563,702 Investment Income 3,469,156 6,708
Total General Revenue 597,462,424 9,984,335
CHANGE IN NET POSITION 101,269,246 4,902,819
Net Position - Beginning of Year - As Restated (116,405,379) (40,412,163)
NET POSITION - END OF YEAR (15,136,133)$ (35,509,344)$
Program Revenues Change in Net PositionNet Revenue (Expense) and

CHARLESTON COUNTY SCHOOL DISTRICT BALANCE SHEET
GOVERNMENTAL FUNDS YEAR ENDED JUNE 30, 2018
See accompanying Notes to Financial Statements. (19)
DebtSpecial Service-
General Revenue EIA Food Service DistrictASSETS
Cash and Cash Equivalents 116,370,619$ -$ -$ 56,226$ -$ Restricted Cash and Cash Equivalents - 764,526 - - 310 Restricted Investments - - - - 5,241,297 Accounts Receivable, Net 3,908,593 - 125,997 - - Property Taxes Receivable, Net 10,458,744 - - - 3,328,106 Local Sales Tax Receivable, Net - - - - - Due from Other Funds 9,454,155 - 4,561,564 9,248,617 113,741 Due from Agency Fund 166,418 472 - - - Due from County Treasurer 3,057,187 - - - 18,386,035 Due from State Department of Education 284,990 5,542 265,946 - - Due from Other Agencies 7,294,894 87,076 - - - Due from Federal Agencies - 17,801,957 - 312,052 - Due from Fiscal Agent 280,236 295,159 - - - Inventory 263,679 - - 327,396 - Prepaid Items 3,867,907 - - - -
Total Assets 155,407,422$ 18,954,732$ 4,953,507$ 9,944,291$ 27,069,489$
LIABILITIESAccounts Payable 13,598,710$ 2,299,998$ 290,288$ 103,414$ 2,001$ Contracts Payable - Retainage 794,251 - - - - Unearned Revenue - 111,066 3,098,316 230,270 - Due to Other Funds 14,781,835 9,454,155 - - - Due to State Department of Education - 32,499 75,003 - - Due to Other Governments - - 9,584 - - Accrued Compensation and Related Benefits 40,424,695 3,770,804 1,298,321 1,216,992 - Other Accrued Expenditures 5,742,389 32,058 181,995 - - Bond Anticipation Notes - - - - 72,520,000
Total Liabilities 75,341,880 15,700,580 4,953,507 1,550,676 72,522,001
DEFERRED INFLOWS OF RESOURCESUnavailable Revenue - Property Taxes 9,914,748 - - - 3,078,580
Total Liabilities and Deferred Inflows of Resources 85,256,628 15,700,580 4,953,507 1,550,676 75,600,581
FUND BALANCES (DEFICIT)Nonspendable:
Inventory 263,679 - - 327,396 - Prepaid Items 3,867,907 - - - - Principal on Endowments - - - - -
Restricted for:Food Service - - - 8,066,219 - Debt Service - - - - - Special Revenue Programs - 3,254,152 - - - Capital Projects - - - - - Endowments and Scholarships - - - - -
Committed 36,916,027 - - - - Assigned for:
Instruction Purposes 6,662,186 - - - - Future Years' Expenditures 2,761,442 - - - -
Unassigned 19,679,553 - - - (48,531,092) Total Fund Balances (Deficit) 70,150,794 3,254,152 - 8,393,615 (48,531,092)
Total Liabilities, Deferred Inflows of Resources, and Fund Balances (Deficit) 155,407,422$ 18,954,732$ 4,953,507$ 9,944,291$ 27,069,489$

CHARLESTON COUNTY SCHOOL DISTRICT BALANCE SHEET (CONTINUED)
GOVERNMENTAL FUNDS YEAR ENDED JUNE 30, 2018
See accompanying Notes to Financial Statements. (20)
ASSETSCash and Cash EquivalentsRestricted Cash and Cash EquivalentsRestricted InvestmentsAccounts Receivable, NetProperty Taxes Receivable, NetLocal Sales Tax Receivable, NetDue from Other FundsDue from Agency FundDue from County TreasurerDue from State Department of EducationDue from Other AgenciesDue from Federal AgenciesDue from Fiscal AgentInventoryPrepaid Items
Total Assets
LIABILITIESAccounts PayableContracts Payable - RetainageUnearned RevenueDue to Other FundsDue to State Department of EducationDue to Other GovernmentsAccrued Compensation and Related BenefitsOther Accrued ExpendituresBond Anticipation Notes
Total Liabilities
DEFERRED INFLOWS OF RESOURCESUnavailable Revenue - Property Taxes
Total Liabilities and Deferred Inflows of Resources
FUND BALANCES (DEFICIT)Nonspendable:
InventoryPrepaid ItemsPrincipal on Endowments
Restricted for:Food ServiceDebt ServiceSpecial Revenue ProgramsCapital ProjectsEndowments and Scholarships
CommittedAssigned for:
Instruction PurposesFuture Years' Expenditures
UnassignedTotal Fund Balances (Deficit)
Total Liabilities, Deferred Inflows of Resources, and Fund Balances (Deficit)
NonmajorCapital Medals and Total
Debt Projects- Awards GovernmentalService-CEEF District Permanent Fund Funds
-$ -$ -$ 116,426,845$ - 191,085,564 137,377 191,987,777 - - - 5,241,297 - - - 4,034,590 - - - 13,786,850 - 29,205,872 - 29,205,872
412,198 405,370 40,345 24,235,990 - - - 166,890 - - - 21,443,222 - - - 556,478 - - - 7,381,970 - - - 18,114,009 - - - 575,395 - - - 591,075 - - - 3,867,907
412,198$ 220,696,806$ 177,722$ 437,616,167$
-$ 18,528,053$ -$ 34,822,464$ - 1,389,816 - 2,184,067 - - 100 3,439,752 - - - 24,235,990 - - - 107,502 - - - 9,584 - - - 46,710,812 - - - 5,956,442 - 76,200,000 - 148,720,000 - 96,117,869 100 266,186,613
- - - 12,993,328
- 96,117,869 100 279,179,941
- - - 591,075 - - - 3,867,907 - - 27,947 27,947
- - - 8,066,219 412,198 - - 412,198
- - - 3,254,152 - 124,578,937 - 124,578,937 - - 149,675 149,675 - - - 36,916,027
- - - 6,662,186 - - - 2,761,442 - - - (28,851,539)
412,198 124,578,937 177,622 158,436,226
412,198$ 220,696,806$ 177,722$ 437,616,167$

CHARLESTON COUNTY SCHOOL DISTRICT RECONCILIATION OF THE GOVERNMENTAL FUNDS BALANCE
SHEET TO THE STATEMENT OF NET POSITION JUNE 30, 2018
See accompanying Notes to Financial Statements. (21)
Total Fund Balances - Governmental Funds 158,436,226$
Amounts reported for the governmental activities in the Statement of Net Position are different because:
Property taxes receivable will be collected but are not available soon enough to pay for the current period's expenditures and therefore are considered unavailable revenues in the funds. 12,993,328
Capital assets used in governmental activities are not financial resources and therefore are not reported as assets in governmental funds. The cost of the assets was $1,844,131,449and the accumulated depreciation was $454,053,008. 1,390,078,441
The School District's proportionate shares of the net pension liability, deferred outflows of resources, and deferred inflows of resources related to its participation in the State pension plans are not recorded in the governmental funds but are recorded in the statement of net position. (483,725,516)
The School District's proportionate shares of the net OPEBliability, deferred outflows of resources, and deferred inflows of resources related to its participation in the State OPEBplans are not recorded in the governmental funds but are recorded in the statement of net position. (435,928,747)
Advance refunding charges are amortized over the lives of the bonds; however, in governmental accounting, advance refunding charges are expenditures or other financing uses the year they are incurred. The advance refunding charges of $69,465,114 have been shown net of accumulated amortization expense of $26,507,886. 42,957,228
Accrued interest on outstanding long-term obligations in governmental accounting is not due and payable in the current period and therefore has not been reported as a liability in the funds. (5,051,981)
The long-term portion of workers compensation claims payable in governmental accounting is not due and payable in the current period and therefore has not been reported as a liability in the funds. (1,549,274)
Long-term obligations, including debt premiums and discounts, are not due and payable in the current period and therefore are not reported as liabilities in the funds. Long-term obligations consisted of:
Long-Term Debt (618,990,000)$ Premiums, Net of Accumulated Amortization (69,754,189) Compensated Absences (4,601,649) (693,345,838)
Total Net Deficit - Governmental Activities (15,136,133)$

CHARLESTON COUNTY SCHOOL DISTRICT STATEMENT OF REVENUES, EXPENDITURES, AND
CHANGES IN FUND BALANCES GOVERNMENTAL FUNDS
YEAR ENDED JUNE 30, 2018
See accompanying Notes to Financial Statements. (22)
Debt
Special Service-General Revenue EIA Food Service District
REVENUESLocal Property Taxes 293,305,834$ -$ -$ -$ 95,711,757$ Local One Cent Sales Tax - - - - - Other Local 2,256,074 13,157,047 - 5,043,786 (69,976)
Total Local 295,561,908 13,157,047 - 5,043,786 95,641,781
State 176,828,911 6,367,757 30,808,525 1,908 1,912,322 Federal 388,489 45,749,617 - 22,358,727 649,468 Intergovernmental 175,808 - - - -
Total Revenue All Sources 472,955,116 65,274,421 30,808,525 27,404,421 98,203,571
EXPENDITURESCurrent:
Instruction 227,624,303 28,829,772 9,756,085 - - Support Services 180,881,328 22,737,226 8,541,198 27,025,018 - Community Services 745,947 9,018,199 - - - Intergovernmental 6,075,545 564,840 - - - Payments to Component Units 40,996,431 1,547,871 2,117,578 - - Capital Outlay 363,794 5,517 172,577 150,972 -
Debt Service:Principal - - - - 12,020,000 Interest and Other Charges 427,566 - - - 7,450,865
Total Expenditures 457,114,914 62,703,425 20,587,438 27,175,990 19,470,865
EXCESS (DEFICIENCY) OF REVENUES OVER EXPENDITURES 15,840,202 2,570,996 10,221,087 228,431 78,732,706
OTHER FINANCING SOURCES (USES)Sale of Capital Assets - 16,938 - - - Premium on Bonds Sold - - - - - Proceeds from Bonds Sold - - - - - Payment to Refunded Debt Escrow Agent - - - - - Transfers In 13,311,447 331,309 - 825,000 - Transfers Out (1,060,000) (1,738,793) (10,221,087) (1,447,876) (104,456,552)
Total Other Financing Sources (Uses) 12,251,447 (1,390,546) (10,221,087) (622,876) (104,456,552)
NET CHANGE IN FUND BALANCES 28,091,649 1,180,450 - (394,445) (25,723,846)
Fund Balances - Beginning of Year 42,059,145 2,073,702 - 8,788,060 (22,807,246)
FUND BALANCES - END OF YEAR 70,150,794$ 3,254,152$ -$ 8,393,615$ (48,531,092)$
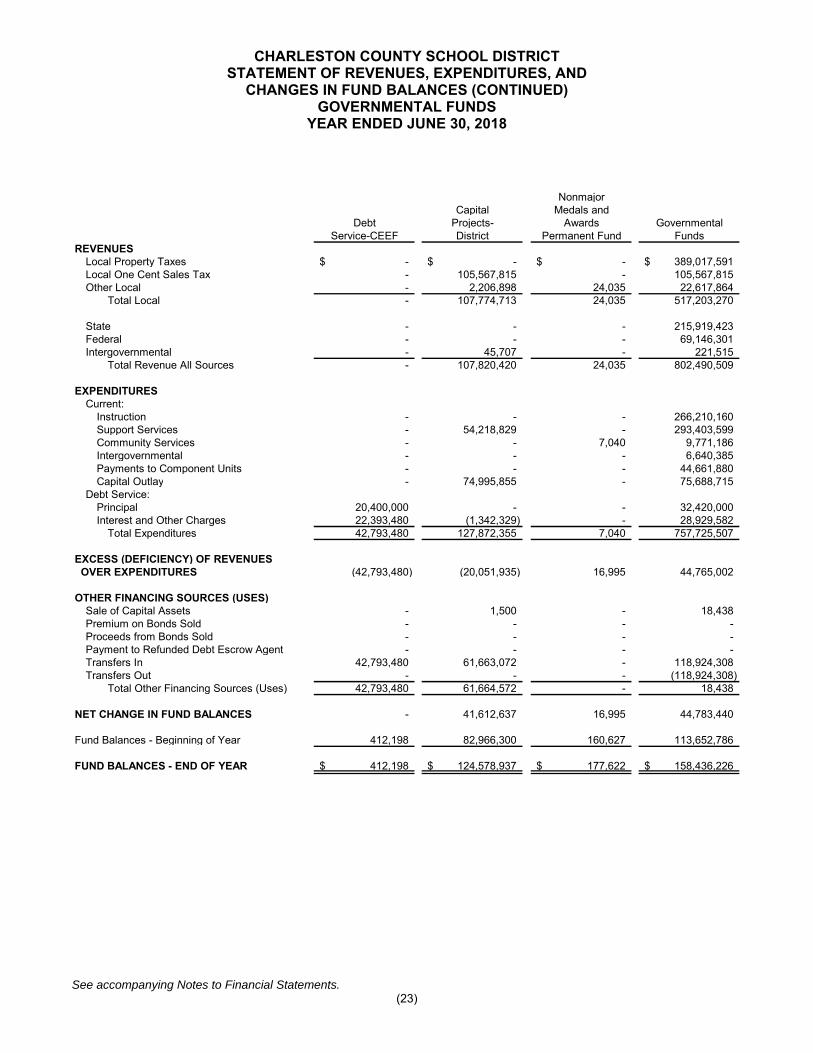
CHARLESTON COUNTY SCHOOL DISTRICT STATEMENT OF REVENUES, EXPENDITURES, AND
CHANGES IN FUND BALANCES (CONTINUED) GOVERNMENTAL FUNDS
YEAR ENDED JUNE 30, 2018
See accompanying Notes to Financial Statements. (23)
REVENUESLocal Property TaxesLocal One Cent Sales TaxOther Local
Total Local
StateFederalIntergovernmental
Total Revenue All Sources
EXPENDITURESCurrent:
Instruction Support ServicesCommunity ServicesIntergovernmentalPayments to Component UnitsCapital Outlay
Debt Service:Principal Interest and Other Charges
Total Expenditures
EXCESS (DEFICIENCY) OF REVENUES OVER EXPENDITURES
OTHER FINANCING SOURCES (USES)Sale of Capital AssetsPremium on Bonds SoldProceeds from Bonds SoldPayment to Refunded Debt Escrow AgentTransfers InTransfers Out
Total Other Financing Sources (Uses)
NET CHANGE IN FUND BALANCES
Fund Balances - Beginning of Year
FUND BALANCES - END OF YEAR
NonmajorCapital Medals and
Debt Projects- Awards GovernmentalService-CEEF District Permanent Fund Funds
-$ -$ -$ 389,017,591$ - 105,567,815 - 105,567,815 - 2,206,898 24,035 22,617,864 - 107,774,713 24,035 517,203,270
- - - 215,919,423 - - - 69,146,301 - 45,707 - 221,515 - 107,820,420 24,035 802,490,509
- - - 266,210,160 - 54,218,829 - 293,403,599 - - 7,040 9,771,186 - - - 6,640,385 - - - 44,661,880 - 74,995,855 - 75,688,715
20,400,000 - - 32,420,000 22,393,480 (1,342,329) - 28,929,582 42,793,480 127,872,355 7,040 757,725,507
(42,793,480) (20,051,935) 16,995 44,765,002
- 1,500 - 18,438 - - - - - - - - - - - -
42,793,480 61,663,072 - 118,924,308 - - - (118,924,308)
42,793,480 61,664,572 - 18,438
- 41,612,637 16,995 44,783,440
412,198 82,966,300 160,627 113,652,786
412,198$ 124,578,937$ 177,622$ 158,436,226$

CHARLESTON COUNTY SCHOOL DISTRICT RECONCILIATION OF THE GOVERNMENTAL FUNDS STATEMENT
OF REVENUES, EXPENDITURES, AND CHANGES IN FUND BALANCES TO THE STATEMENT OF ACTIVITIES
YEAR ENDED JUNE 30, 2018
See accompanying Notes to Financial Statements. (24)
Total Net Change in Fund Balances - Governmental Funds 44,783,440$
Amounts reported for governmental activities in the statement of activities are different because:
Revenues in the statement of activities that do not provide current financial resourcesare not reported as revenues in the funds. This amount represents the change inunavailable revenues for the year. 2,245,329
Repayment of bond principal is an expenditure in the governmental funds, but the repayment reduces long-term liabilities in the statement of net position. 32,420,000
Interest on long-term debt in the statement of activities differs from the amount reported inthe governmental funds because interest is recognized as an expenditure in the funds when it is due, and thus requires the use of current financial resources. In the statementof activities, however, interest expense is recognized as the interest accrues, regardless of when it is due. This amount represents the net change in accrued interest for the year. (414,991)
Advance refunding charges are expenditures or other financing uses the year they are incurred in governmental funds, but are amortized over the lives of the bonds in the statement of activities. This amount represents the current year amortization expense for advance refunding charges. (4,787,523)
Bond premiums are revenues the year they are received in governmental funds but are amortized over the lives of the bonds in the statement of activities. This amount represents the current year amortization expense on premiums, net of premiums received in the current year. 7,438,633
Changes in the School District's proportionate share of the net pension liability, deferred outflows of resources, and deferred inflows of resources for the current year are not reported in the governmental funds but are reported in the statement of activities. (7,027,825)
Changes in the School District's proportionate share of the net OPEB liability, deferred outflows of resources, and deferred inflows of resources for the current year are not reported in the governmental funds but are reported in the statement of activities. (8,674,340)
Some expenses reported in the statement of activities do not require the use of current financial resources and therefore are not reported as expenditures in the governmental funds. This amount represents the change in compensated absences for the year. (520,544)
Some expenses reported in the statement of activities do not require the use of current financial resources and therefore are not reported as expenditures in the governmental funds. This amount represents the change in long term claims liabilities for the year. (174,344)
In the statement of activities the loss on the sale of capital assets is reported, whereas in the governmental funds, proceeds from the disposal of capital assets increase financial resources. Thus, the change in net position differs from the change in fund balance by the net book value of the assets disposed. (611,871)
Governmental funds report asset additions as expenditures. However, in the statement of activities, the cost of those assets is allocated over their estimated useful lives as depreciation expense. This is the amount by which capital asset additions of $75,840,424exceeded depreciation expense of $39,247,142 in the current year. 36,593,282
Change in Net Position of Governmental Activities 101,269,246$

CHARLESTON COUNTY SCHOOL DISTRICT STATEMENT OF ASSETS AND LIABILITIES
FIDUCIARY FUNDS JUNE 30, 2018
See accompanying Notes to Financial Statements. (25)
Private -PurposeTrusts Agency Funds
ASSETSCash and Cash Equivalents -$ 4,430,145$ Restricted Cash and Cash Equivalents 259,246 -
Total Assets 259,246$ 4,430,145$
LIABILITIESAccounts Payable -$ 94,412$ Accrued Compensation and Related Benefits - 24,175 Due to Other Funds - 166,890 Due to Student Organizations - 4,144,668
Total Liabilities - 4,430,145$
NET POSITIONHeld in Trust for Other Purposes 259,246$
Total Net Position 259,246$

CHARLESTON COUNTY SCHOOL DISTRICT STATEMENT OF CHANGES IN NET POSITION
FIDUCIARY FUNDS YEAR ENDED JUNE 30, 2018
See accompanying Notes to Financial Statements. (26)
Private -Purpose
TrustADDITIONS
Interest 3,826$ Total Additions 3,826
CHANGES IN NET POSITION 3,826
Net Position - Beginning of Year 255,420
NET POSITION - END OF YEAR 259,246$

CHARLESTON COUNTY SCHOOL DISTRICT NOTES TO FINANCIAL STATEMENTS
JUNE 30, 2018
(27)
NOTE 1 SUMMARY OF SIGNIFICANT ACCOUNTING POLICIES
The Reporting Entity
Charleston County School District (the School District) was created in July, 1968 through the merger of eight former school districts (which became constituent districts) to form a single county-wide district. The School District operates 48 elementary schools (grades K-5), 13 middle schools (grades 6-8), 11 high schools (grades 9-12), 4 Montessori schools, 7 multi-level combination schools, 8 special programs, 10 charter schools, and 1 public/private partnership school.
The financial statements of the School District have been prepared in conformity with accounting principles generally accepted in the United States of America (GAAP), as applied to governmental units. The Governmental Accounting Standards Board (GASB) is the accepted standard-setting body for establishing governmental accounting and financial reporting principles. The more significant of the School District’s accounting policies are described below.
The School District is the government which has responsibility for and control over all activities related to public school education in Charleston County, South Carolina. The School District receives funding from local, state, and federal government sources and must comply with the related requirements of these funding source entities. The School District is governed by a nine member Board of Trustees (the Board). The Board determines the operating policies of the School District and such policies are implemented by the School District Superintendent.
As required by GAAP, the financial statements must present the School District’s financial information with any of its component units. The primary criterion for determining inclusion or exclusion of a legally separate entity (component unit) is financial accountability, which is presumed to exist if the School District both appoints a voting majority of the entity’s governing body, and either 1) the School District is able to impose its will on the entity or, 2) there is a potential for the entity to provide specific financial benefits to, or impose specific financial burdens on the School District. If either or both of the foregoing conditions are not met, the entity could still be considered a component unit if it is fiscally dependent on the School District and there is a potential that the entity could either provide specific financial benefits to, or to impose specific financial burdens on the School District.
In order to be considered fiscally independent, an entity must have the authority to do all of the following: (a) determine its budget without the School District having the authority to approve or modify that budget; (b) levy taxes or set rates or charges without approval by the School District; and (c) issue bonded debt without approval by the School District. An entity has a financial benefit or burden relationship with the School District if, for example, any one of the following conditions exists: (a) the School District is legally entitled to or can otherwise access the entity’s resources, (b) the School District is legally obligated or has otherwise assumed the obligation to finance the deficits, or provide financial support to the entity, or (c) the School District is obligated in some manner for the debt of the entity. Finally, an entity could be a component unit even if it met all the conditions described above if excluding it would cause the School District’s financial statements to be misleading.

CHARLESTON COUNTY SCHOOL DISTRICT NOTES TO FINANCIAL STATEMENTS
JUNE 30, 2018
(28)
NOTE 1 SUMMARY OF SIGNIFICANT ACCOUNTING POLICIES (CONTINUED)
The Reporting Entity (Continued)
Blended component units, although legally separate entities, are in substance, part of the government’s operations and data from these units are combined with data of the primary government in the fund financial statements. Discretely presented component units, on the other hand, are reported in a separate column in the government-wide financial statements to emphasize they are legally separate from the School District. Based on the criteria above, the School District has two blended component units and several discretely presented component units as discussed below. Blended Component Units. The Charleston County School District Development Corporation (the Corporation) and the Charleston Educational Excellence Financing Corporation (CEEF), nonprofit organizations, were formed to acquire, construct, and lease facilities to be used by the School District. A voting majority of the Corporation’s and CEEF’s Board of Directors are appointed by the School District, and the School District has the ability to modify or approve the Corporation’s and CEEF’s budgets. The Corporation is reported as a nonmajor governmental fund, but has been inactive for the last several years. The School District has a financial burden to the CEEF in that it is obligated for lease payments equaling the amount of debt to be relieved and associated interest payments. Activities of CEEF are reported as major capital projects and debt service funds. The CEEF’s capital project fund met all obligations in 2016 was not active during 2018 and reported no assets, liabilities or fund balance at June 30, 2018. As such, no activity is reported in the financial statements. Separate financial statements for CEEF are not issued. Discretely Presented Component Units. A charter school is considered a public school, and these schools are a part of the School District for the purposes of state law and state constitution. Because the charter schools are fiscally dependent on the School District and because the nature and significance of the relationship between the School District and the charter schools is such that exclusion of the charter schools would cause the School District’s financial statements to be incomplete, the financial statements of the charter schools are included in those of the School District.

CHARLESTON COUNTY SCHOOL DISTRICT NOTES TO FINANCIAL STATEMENTS
JUNE 30, 2018
(29)
NOTE 1 SUMMARY OF SIGNIFICANT ACCOUNTING POLICIES (CONTINUED)
The Reporting Entity (Continued)
The following charter schools were established under the South Carolina Charter Schools Act by a charter granted by the School District: Charleston Development Academy, Inc. (CDA) East Cooper Montessori Charter School (ECMCS)233 Line Street, P. O. Box 20518 188 Civitas StreetCharleston, SC 29413 Mt. Pleasant, SC 29464
James Island Charter High School (JICHS) Orange Grove Elementary Charter (OGEC) 1000 Fort Johnson Road 1225 Orange Branch RoadCharleston, SC 29412 Charleston, SC 29407
Greg Mathis Charter High School (GMCHS) Pattison’s Academy for Comprehensive Education 7555 N. Spartan Boulevard (PACE)North Charleston, SC 29420 2383 Highway 41
Mt. Pleasant, SC 29466
Charleston Charter School for Math and Science Carolina Voyager Charter School (CVCS) (CCSMS) 30 Race Street1002 King Street Charleston, SC 29403Charleston, SC 29403
Prestige Preparatory Academy Allegro Charter School of Music (ACSM)2415 Avenue F 120 Broad StreetNorth Charleston, SC 29405 Charleston, SC 29401
Meeting Street Elementary at Brentwood (MSEB) is an alternative school choice for the residents of the School District. Because MSEB is fiscally dependent on the School District and because the nature and significance of the relationship between the School District and MSEB is such that exclusion of the school would cause the School District’s financial statements to be incomplete, the financial statements of MSEB are included in those of the School District. MSEB is located at 2685 Leeds Avenue, North Charleston, South Carolina 29405. Complete financial statements for each of the discretely presented component units may be obtained at the respective school’s administrative offices. The School District paid a total of $44,402,865 to the component units during the year ended June 30, 2018. These expenditures are included in payments to component units in the statement of revenues, expenditures, and changes in fund balances. Combining schedules for the discretely presented component units have been provided as Schedule F series in the supplementary information to assist in providing information to the South Carolina Department of Education (SDE). The information in these schedules was provided to the School District by the individual schools.

CHARLESTON COUNTY SCHOOL DISTRICT NOTES TO FINANCIAL STATEMENTS
JUNE 30, 2018
(30)
NOTE 1 SUMMARY OF SIGNIFICANT ACCOUNTING POLICIES (CONTINUED)
Measurement Focus, Basis of Accounting, and Basis of Presentation
The government-wide financial statements (i.e., the statement of net position and the statement of activities) report information on all of the nonfiduciary activities of the School District (the primary government) and its component units. The effect of interfund activity has been removed from these statements. Governmental activities, which normally are supported by taxes and intergovernmental revenues, are reported separately from business-type activities, which rely to a significant extent on fees and charges for support. The School District does not have any business-type activities. Likewise, the primary government (the School District) is reported separately from certain legally separate component units which are fiscally dependent on the School District. The statement of activities demonstrates the degree to which the direct expenses of a given function or segment are offset by program revenues. Direct expenses are those that are clearly identifiable with a specific function or segment. Program revenues include 1) charges to customers or applicants who purchase, use, or directly benefit from goods, services, or privileges provided by a given function or segment and 2) grants and contributions that are restricted to meeting the operational or capital requirements of a particular function or segment. Taxes and other items not properly included among program revenues are reported instead as general revenues. The comparison of direct expenses with program revenues identifies the extent to which each business segment or governmental function is self-financing or draws from the general revenues of the School District. Government-wide financial statements (which exclude fiduciary activities) are reported using the economic resources measurement focus and the accrual basis of accounting, as are the Fiduciary Fund financial statements. Revenues are recognized and recorded when earned and expenses are recorded when a liability is incurred, regardless of the timing of related cash flows. Property taxes are recognized as revenues in the year for which they are levied. Grants and similar items are recognized as revenue as soon as all eligibility requirements imposed by the provider have been met. The government-wide financial statements are prepared using a different measurement focus from the manner in which governmental fund financial statements are prepared (see further detail below). Governmental fund financial statements, therefore, include reconciliations with brief explanations to better identify the relationship between the government-wide statements and the statements for governmental funds.

CHARLESTON COUNTY SCHOOL DISTRICT NOTES TO FINANCIAL STATEMENTS
JUNE 30, 2018
(31)
NOTE 1 SUMMARY OF SIGNIFICANT ACCOUNTING POLICIES (CONTINUED)
Measurement Focus, Basis of Accounting, and Basis of Presentation (Continued)
Governmental fund financial statements are reported using the current financial resources measurement focus and the modified accrual basis of accounting. Revenues are recognized as soon as they are both measurable and available. Revenues are considered to be available when they are collectible within the current period or soon enough thereafter to pay liabilities of the current period. For this purpose, the government considers revenues with the exception of grants to be available if they are collected within 60 days of the end of the current fiscal period. Grant related revenues are considered to be available if they are collected within one year of the end of the current fiscal period. Expenditures generally are recorded when a liability is incurred, as under accrual accounting. However, debt service expenditures, as well as expenditures related to compensated absences and claims and judgments, are recorded only when payment is due. Property taxes, federal and state grant programs, and interest associated with the current fiscal period are all considered to be susceptible to accrual and so have been recognized as revenues of the current fiscal period. All other revenue items are considered to be measurable and available only when cash is received by the government. Fund financial statements report detailed information about the School District. The focus of governmental fund financial statements is on major funds rather than reporting funds by type. Each major fund is presented in a separate column. Fiduciary funds are reported by fund type. The School District generally uses restricted amounts first when both restricted and unrestricted (committed, assigned, and unassigned) fund balance is available unless there are legal documents, contracts, or agreements that prohibit doing such. Additionally, the School District generally would first use committed, then assigned, and lastly unassigned amounts of unrestricted fund balance when expenditures are made. The accounts of the government are organized and operated on the basis of funds. A fund is an independent fiscal and accounting entity with a self-balancing set of accounts. Fund accounting segregates funds according to their intended purpose and is used to aid management in demonstrating compliance with finance-related legal and contractual provisions. There are a minimum number of funds maintained to keep the accounts consistent with legal and managerial requirements. The following major funds and fund types are used by the School District: Governmental fund types are those through which most governmental functions of the School District are financed. The School District’s expendable financial resources and related assets and liabilities are accounted for through governmental funds. Governmental funds are accounted for using a current financial resources measurement focus and the modified accrual basis of accounting. The following are the School District’s major and nonmajor governmental fund types:

CHARLESTON COUNTY SCHOOL DISTRICT NOTES TO FINANCIAL STATEMENTS
JUNE 30, 2018
(32)
NOTE 1 SUMMARY OF SIGNIFICANT ACCOUNTING POLICIES (CONTINUED)
Measurement Focus, Basis of Accounting, and Basis of Presentation (Continued)
The General Fund, a major fund and a budgeted fund, is the general operating fund of the School District and accounts for all revenues and expenditures of the School District except those required to be accounted for in other funds. All general tax revenues and other receipts that are not allocated by law or contractual agreement to other funds are accounted for in the General Fund. All general tax revenues and other receipts that (a) are not allocated by law or contractual agreement to other funds or (b) that have not been restricted, committed, or assigned to other funds are accounted for in the General Fund. General operating expenditures and the capital improvement costs that are not paid through other funds are paid from the General Fund. Special Revenue Funds are used to account for and report the proceeds of specific revenue sources (that are expected to continue to comprise a substantial portion of the inflows of the fund) that are restricted or committed to expenditures for specified purposes other than debt service or capital projects. The School District has three Special Revenue Funds:
1. The Special Revenue Fund, a major fund and a budgeted fund, is used to account for and report the financial resources provided by federal, state, and local projects and grants that are restricted, committed, or assigned for specific educational programs.
2. The Education Improvement Act (EIA) Fund, a major fund and a budgeted fund, is used to account for and report the revenue from the South Carolina Education Improvement Act of 1984 (which is legally required by the state to be accounted for as a specific revenue source), which are restricted for specific programs authorized or mandated by EIA.
3. The Food Service Fund, a major fund and a budgeted fund, is used to account for and report the financial resources received that are restricted for the operation and improvement of the food service program. These revenues primarily consist of resources received (a) from breakfast, lunch, and other food sales and (b) from the United States Department of Agriculture’s (USDA) approved school breakfast and lunch programs.
The Debt Service Fund-District, a major fund and a budgeted fund, is used to account for and report the accumulation of financial resources that are restricted, committed, or assigned for the payment of all long-term debt principal, interest, and related costs for the School District except those accounted for in the CEEF Debt Service Fund. The Debt Service Fund-CEEF, a major fund and a budgeted fund, is used to account for and report the accumulation of financial resources that are restricted, committed, or assigned for the payment of all long-term debt principal, interest, and related costs for CEEF.

CHARLESTON COUNTY SCHOOL DISTRICT NOTES TO FINANCIAL STATEMENTS
JUNE 30, 2018
(33)
NOTE 1 SUMMARY OF SIGNIFICANT ACCOUNTING POLICIES (CONTINUED)
Measurement Focus, Basis of Accounting, and Basis of Presentation (Continued)
The Capital Projects Fund-District, a major fund and a budgeted fund, is used to account for and report financial resources that are restricted, committed, or assigned for expenditures of capital outlay related to equipment, site acquisitions, construction, renovation of capital facilities, and other capital assets of the School District except for those accounted for by the CEEF Capital Projects Fund. The Permanent Fund, a nonmajor fund and an unbudgeted fund, is used to account for financial resources endowed to the School District in trust, for which only the interest earnings may be used by the School District for various restricted purposes as specified by the private donors. The School District reports the following permanent fund:
The Medals and Awards Fund accounts for amounts contributed to the School District for the purpose of providing monies from which medals and awards may be purchased. Initial contributions to this fund are recorded as principal and may not be expended. Earnings from investments are recorded as income and are available for the stated fund purposes. Since it is the only nonmajor governmental fund, it is shown in a separate column in the fund financial statements.
Fiduciary Fund types are used to account for expendable assets held by the School District in a trustee capacity or as an agent for individuals, private organizations, other governmental units and/or other funds and include agency funds and private-purpose trust funds. Fiduciary Fund types include the following funds:
The Agency Funds account for the receipt and disbursement of monies to and from student activity organizations. These funds have no equity (assets are equal to liabilities) and do not include revenues and expenditures for general operation of the School District. This accounting reflects the agency relationship of the School District with the student activity organizations. Agency funds do not have a measurement focus.
The Private Purpose Trust Funds are used to account for assets held in trust for other purposes. The School District reports the following private-purpose trust funds:
The William C. Bradley Fund accounts for monies given to the School District to fund engineering scholarships to students graduating from Wando High School. The fund principal balance may not be expended. Earnings from investments are recorded as income and are available for the stated fund purpose.
The Heidel L. Lentz Memorial Trust provides awards to the James Island Charter High School science fair winners. Both the principal and interest may be spent.

CHARLESTON COUNTY SCHOOL DISTRICT NOTES TO FINANCIAL STATEMENTS
JUNE 30, 2018
(34)
NOTE 1 SUMMARY OF SIGNIFICANT ACCOUNTING POLICIES (CONTINUED)
Measurement Focus, Basis of Accounting, and Basis of Presentation (Continued)
Cash and Cash Equivalents
The School District considers all highly liquid investments (including restricted assets) with original maturities of three months or less when purchased and investments in the South Carolina Pooled Investment Fund to be cash equivalents. Securities with an initial maturity of more than three months (when initially purchased) that are not purchased from the South Carolina Pooled Investment Fund are reported as investments. Assets, Liabilities, Deferred Outflows/Inflows of Resources, and Equity
Investments
The School District’s investment policy is designed to operate within existing statutes (which are identical for all funds, fund types, and component units within the state of South Carolina) that authorize the School District to invest in the following:
1. Obligations of the United States and its agencies, the principal and interest of which is fully guaranteed by the United States.
2. Obligations issued by the Federal Financing Bank, Federal Farm Credit Bank, the Bank of Cooperatives, the Federal Intermediate Credit Bank, the Federal Land Banks, the Federal Home Loan Banks, the Federal Home Loan Mortgage Corporation, the Federal National Mortgage Association, the Government National Mortgage Association, the Federal Housing Administration, and the Farmers Home Administration, if, at the time of investment, the obligor has a long-term, unenhanced, unsecured debt rating in one of the top two ratings categories, without regard to a refinement or gradation of rating category by numerical modifier or otherwise, issued by at least two nationally recognized credit rating organizations.
3. (i) General obligations of the state of South Carolina or any of its political units; or (ii) revenue obligations of the state of South Carolina or its political units, if at the time of investment, the obligor has a long-term, unenhanced, unsecured debt rating in one of the top two ratings categories, without regard to a refinement or gradation of rating category by numerical modifier or otherwise, issued by at least two nationally recognized credit rating organizations.

CHARLESTON COUNTY SCHOOL DISTRICT NOTES TO FINANCIAL STATEMENTS
JUNE 30, 2018
(35)
NOTE 1 SUMMARY OF SIGNIFICANT ACCOUNTING POLICIES (CONTINUED)
Assets, Liabilities, Deferred Outflows/Inflows of Resources, and Equity (Continued)
Investments (Continued)
4. Savings and Loan Associations to the extent that the same are insured by an agency
of the federal government.
5. Certificates of deposit where the certificates are collaterally secured by securities of the type described in (a) and (b) above held by a third party as escrow agent or custodian, of a market value not less than the amount of the certificates of deposit so secured, including interest; provided however, such collateral shall not be required to the extent the same are insured by an agency of the federal government.
6. Repurchase agreements when collateralized by securities as set forth in this section.
7. No load open-end or closed-end management type investment companies or investment trusts registered under the Investment Company Act of 1940, as amended, where the investment is made by a bank or trust company or savings and loan association or other financial institution when acting as trustee or agent for a bond or other debt issue of that local government unit, political subdivision, or county treasurer if the particular portfolio of the investment company or investment trust in which the investment is made (i) is limited to obligations described in items (a), (b), (c), and (f) of this subsection, and (ii) has among its objectives the attempt to maintain a constant net asset value of $1 a share and to that end, value its assets by the amortized cost method.
The School District’s investment objectives are preservation of capital, liquidity, and yield. The School District reports its investments at fair value.

CHARLESTON COUNTY SCHOOL DISTRICT NOTES TO FINANCIAL STATEMENTS
JUNE 30, 2018
(36)
NOTE 1 SUMMARY OF SIGNIFICANT ACCOUNTING POLICIES (CONTINUED)
Assets, Liabilities, Deferred Outflows/Inflows of Resources, and Equity (Continued)
Investments (Continued)
The School District has used the following investments in the past year:
Open-end mutual funds, primarily money market funds which invest in short-term obligations of the United States and related agencies.
Obligations of the United States and its agencies as described in (a) above.
Obligations of agencies described in (b) above.
South Carolina Pooled Investment Fund (SC Pool) investments are invested with the South Carolina State Treasurer’s Office, which established the South Carolina Pool pursuant to Section 6-6-10 of the South Carolina Code. The Pool is an investment trust fund, in which public monies in excess of current needs, which are under the custody of any city treasurer or any governing body of a political subdivision of the State, may be deposited. The Pool is a 2a 7-like pool which is not registered with the Securities and Exchange Commission (SEC) as an investment company, but has a policy that it will operate in a manner consistent with the SEC’s Rule 2a 7 of the Investment Company Act of 1940.
Overnight repurchase agreements primarily investing in obligations of agencies described in (b) above.
Receivables and Payables
Transactions between funds that are representative of reimbursement arrangements outstanding at the end of the fiscal year are referred to as “due to/from other funds.” These amounts are eliminated in the governmental activities column of the statement of net position.
All trade and property taxes receivable are shown net of an allowance for uncollectible amounts, if any, based on historical collection data.
Under the system of accounting for inventories, materials and supplies are carried in an inventory account at cost, determined using the first-in, first-out method, and are subsequently charged to expenditures/expenses when consumed rather than when purchased. Inventories in the General Fund include operating and instructional supplies. The Food Service Special Revenue Fund inventory includes an amount for commodities/ fresh fruits and vegetables received from the USDA that are recorded at fair market value at the time of receipt but have not been consumed as of the end of the fiscal year.
Prepaid Items
Certain payments to vendors reflect costs applicable to future accounting periods and are recorded as prepaid items using the consumption method. A current asset for the prepaid amount is recorded at the time of the purchase and an expenditure/expense is reported in the year in which services are consumed.

CHARLESTON COUNTY SCHOOL DISTRICT NOTES TO FINANCIAL STATEMENTS
JUNE 30, 2018
(37)
NOTE 1 SUMMARY OF SIGNIFICANT ACCOUNTING POLICIES (CONTINUED)
Assets, Liabilities, Deferred Outflows/Inflows of Resources, and Equity (Continued)
Restricted Assets
The School District established certain accounts for assets restricted for specific purposes, typically by outside parties or legal agreements. Certain bond indentures and related agreements require the establishment of (i) maximum annual principal and interest payments, unless a surety bond was provided; (ii) the next succeeding principal and accrued interest payment; (iii) bond proceeds to be used for construction purposes as required in the bond agreement; and (iv) sinking fund accounts for the accumulation of funds for future debt service payments. Also, the accumulated appreciation on assets of the Permanent and Private-Purpose Trust funds are classified as restricted assets because their use is restricted by donors. Capital Assets
General capital assets, which include land, buildings, furniture, equipment and improvements to land and buildings, generally result from expenditures in the governmental funds. These assets are reported in the governmental activities column of the government-wide statement of net position but are not reported in the fund financial statements. All capital assets are recorded at cost (or estimated historical cost) and updated for additions and retirements during the year. Donated capital assets are recorded at their fair market values as of the date received. The School District maintains a capitalization threshold of $5,000. The School District’s infrastructure assets are immaterial and have been reported with the buildings and improvements. The costs of normal maintenance and repairs that do not add to the value of the asset or materially extend an asset’s life are not capitalized. Interest incurred during the construction of capital assets is not capitalized. All reported capital assets except land and construction in progress are depreciated. Construction projects are depreciated once they are complete, at which time the complete costs of the project are transferred to the appropriate capital asset category. Improvements are depreciated over the remaining useful lives of the related capital assets. Depreciation is computed using the straight-line method over the following useful lives: Assets YearsBuildings 40Furniture and Fixtures 5-17Print Shop Equipment 15Food Service Equipment 12Improvement Other than Buildings 10-20Leasehold Improvements Over the Term
of the Lease

CHARLESTON COUNTY SCHOOL DISTRICT NOTES TO FINANCIAL STATEMENTS
JUNE 30, 2018
(38)
NOTE 1 SUMMARY OF SIGNIFICANT ACCOUNTING POLICIES (CONTINUED)
Assets, Liabilities, Deferred Outflows/Inflows of Resources, and Equity (Continued)
Compensated Absences
School District employees are granted vacation and sick leave in varying amounts. Upon termination of employment, an employee is reimbursed for accumulated vacation days; unused sick leave is not reimbursed. The entire compensated absences liability and expense is reported on the governmental-wide financial statements. The School District’s policy on compensated absences is as follows: Employees are entitled to vacation if employed on a 12-month basis. Vacation allowance shall not be cumulative. Vacation days are earned during the fiscal year and shall be used by the end of the succeeding year. A 60-day grace period is automatically allowed. Employees are allowed to accumulate up to 45 days of vacation in the last five years prior to retirement. Accrued Liabilities and Long-Term Obligations
All payables, accrued liabilities, and long-term obligations are reported in the government-wide financial statements. In general, payables and accrued liabilities that will be paid from governmental funds are reported on the governmental fund financial statements regardless of whether they will be liquidated with current resources. However, claims and judgments, contractually required pension contributions and special termination benefits that will be paid from governmental funds are reported as a liability in the fund financial statements only to the extent that they will be paid with current, expendable, available financial resources. In general, payments made within 60 days after year-end are considered to have been made with current available financial resources. Bonds and other long-term obligations that will be paid from governmental funds are not recognized as a liability in the fund financial statements until due. Salaries and employee benefits of teachers and certain other instructional employees are based on elections by those employees, paid over a 12-month period from August to July, but are earned by those employees over the school year of August through May. Salaries and certain related employee benefits earned but not paid because of such employee elections have been accrued and recorded in the financial statements as Accrued Compensation and Related Benefits. In the government-wide financial statements, long-term debt and other long-term obligations are reported as liabilities on the statement of net position. If material, bond premiums and discounts are deferred and amortized over the life of the bonds using the straight-line method, which approximates the effective interest method. Amortization of premiums, discounts, and advance refunding charges are included in interest expense. Bonds payable are reported net of the applicable bond premiums and discounts. Issuance costs, whether or not withheld from the actual debt proceeds received, are reported as expenses in the period incurred. If applicable, estimated arbitrage payable is also reflected in long-term obligations.

CHARLESTON COUNTY SCHOOL DISTRICT NOTES TO FINANCIAL STATEMENTS
JUNE 30, 2018
(39)
NOTE 1 SUMMARY OF SIGNIFICANT ACCOUNTING POLICIES (CONTINUED)
Assets, Liabilities, Deferred Outflows/Inflows of Resources, and Equity (Continued)
Accrued Liabilities and Long-Term Obligations (Continued)
In the fund financial statements, governmental fund types recognize bond premiums and discounts, as well as bond issuance costs, during the period received or incurred. The face amount of debt issued is reported as other financing sources. Premiums received on debt issuances are reported as other financing sources while discounts on debt issuances are reported as other financing uses. Deferred Outflows and Inflows of Resources
A deferred outflow of resources represents a consumption of net position that applies to a future period and so will not be recognized as an outflow of resources (expenditure) until the future period. The School District recognized two types of deferred outflows of resources: (1) The School District reports advance refunding charges in its government-wide statement of net position. Advance refunding charges, which are the differences between the reacquisition prices and the net carrying amount of the defeased debt, are deferred and amortized over the life of the old debt or the new debt, whichever is shorter. Amortization of advanced refunding charges is included in interest expense in the statement of activities. (2) The School District also reports deferred pension charges in its statement of net position in connection with its participation in the South Carolina Retirement System and the South Carolina Police Officers Retirement System. These deferred pension charges are either (a) recognized in the subsequent period as a reduction of the net pension liability (which includes pension contributions made after the measurement date) or (b) amortized in a systematic and rational method as pension expense in future periods in accordance with GAAP. (3) The School District also reports deferred OPEB charges in its statement of net position in connection with its participation in the South Carolina Retiree Health Insurance Trust Fund. These deferred OPEB charges are either (a) recognized in the subsequent period as a reduction of the net OPEB liability (which includes OPEB contributions made after the measurement date) or (b) amortized in a systematic and rational method as OPEB expense in future periods in accordance with GAAP. A deferred inflows of resources represents an acquisition of net position that applies to a future period and so will not be recognized as an inflow of resources (revenue) until the future period. The School District recognized two types of deferred inflows of resources: (1) The School District reports unavailable revenue – property taxes only in the governmental funds balance sheet; it is deferred and recognized as an inflow of resources (property tax revenues) in the period the amounts become available. (2) The School District also reports deferred pension credits in its statement of net position in connection with its participation in the South Carolina Retirement System and the South Carolina Police Officers Retirement System. These deferred pension credits are amortized in a systematic and rational method and recognized as a reduction of pension expense in future periods in accordance with GAAP. (3) The School District also reports deferred OPEB credits in its statement of net position in connection with its participation in the South Carolina Retiree Health Insurance Trust Fund. These deferred OPEB credits are amortized in a systematic and rational method and recognized as a reduction of OPEB expense in future periods in accordance with GAAP.

CHARLESTON COUNTY SCHOOL DISTRICT NOTES TO FINANCIAL STATEMENTS
JUNE 30, 2018
(40)
NOTE 1 SUMMARY OF SIGNIFICANT ACCOUNTING POLICIES (CONTINUED)
Assets, Liabilities, Deferred Outflows/Inflows of Resources, and Equity (Continued)
Fund Balance
In accordance with GASB Statement No. 54, Fund Balance Reporting and Governmental Fund Type Definitions (GASB 54), which established new fund balance classifications for governmental fund types and clarifies the definitions of the governmental fund types the School District classifies governmental fund balances as follows:
Nonspendable – Includes amounts that inherently cannot be spent either because they are not in spendable form (i.e. prepaids, inventories, etc.) or because of legal or contractual requirements (i.e. principal on an endowment, etc.). Restricted – Includes amounts that are constrained by specific purposes which are externally imposed by (a) other governments through laws and regulations, (b) grantors or contributions through agreements, (c) creditors through debt covenants or other contracts, or (d) imposed by law through constitutional provisions or enabling legislation. Committed – Includes amounts that are constrained for specific purposes that are internally imposed by the government through formal action made by the highest level of decision making authority before the end of the reporting period. Those committed amounts cannot be used for any other purpose unless the government removes or changes the specified use by taking the same type of action it employed to previously commit those amounts. Committed amounts for the School District consist of amounts approved by a majority vote of the Board of Trustees.
Assigned – Includes amounts that are intended to be used for specific purposes that are neither considered restricted or committed and that such assignments are made before the report issuance date. The Board of Trustees allows the Superintendent and the Chief Financial Officer the right to make assignments of fund balance for the School District.
Unassigned – Includes amounts that do not qualify to be accounted for and reported in any of the other fund balance categories. This classification represents the amount of fund balance that has not been assigned to other funds and that has not been restricted, committed, or assigned to specific purposes within the General Fund. The General Fund is the only fund that reports a positive unassigned fund balance amount. In other governmental funds, if expenditures incurred for specific purposes exceeded the amounts of restricted, committed, or assigned to those purposes, it may be necessary to report a negative unassigned fund balance.

CHARLESTON COUNTY SCHOOL DISTRICT NOTES TO FINANCIAL STATEMENTS
JUNE 30, 2018
(41)
NOTE 1 SUMMARY OF SIGNIFICANT ACCOUNTING POLICIES (CONTINUED)
Assets, Liabilities, Deferred Outflows/Inflows of Resources, and Equity (Continued)
Net Position
The government-wide financial statements utilize a net position presentation. Net position is categorized as net investment in capital assets, restricted, and unrestricted.
Net Investment in Capital Assets – This category groups all capital assets including infrastructure into one component of net position. Accumulated depreciation and the outstanding balances of debt that are attributed to the acquisition, construction, or improvement of these assets reduce the balance in this category. Restricted Net Position – This category presents net position with external restrictions imposed by creditors, grantors, or laws and regulations of other governments. Unrestricted Net Position – This category presents the net position of the School District, not restricted for any purpose.
Pensions
For purposes of measuring the net pension liability, deferred outflows of resources and deferred inflows of resources related to pensions, and pension expense, information about fiduciary net position of the South Carolina Retirement System and Police Officer’s Retirement System (Systems) and additions to/deductions from the Systems’ fiduciary net position have been determined on the same basis as they are reported by the Systems. For this purpose, benefit payments (including refunds of employee contributions) are recognized when due and payable in accordance with the benefit terms. Investments are reported at fair value. Postemployment Benefits Other Than Pensions (OPEB)
For purposes of measuring the net OPEB liability, deferred outflows of resources and deferred inflows of resources related to pensions, and pension expense, information about fiduciary net position of the South Carolina Retiree Health Insurance Trust (the Trust) and additions to/deductions from the Trust’s fiduciary net position have been determined on the same basis as they are reported by the Trust. For this purpose, benefit payments (including refunds of employee contributions) are recognized when due and payable in accordance with the benefit terms. Investments are reported at fair value. Accounting Estimates
The preparation of financial statements in conformity with GAAP requires management to make estimates and assumptions. Those estimates and assumptions affect the reported amounts of assets and deferred outflows of resources and liabilities and deferred inflows of resources and disclosure of these balances as of the date of the financial statements. In addition, they affect the reported amounts of revenues and expenditures/expenses during the reporting period. Actual results could differ from those estimates and assumptions.

CHARLESTON COUNTY SCHOOL DISTRICT NOTES TO FINANCIAL STATEMENTS
JUNE 30, 2018
(42)
NOTE 2 STEWARDSHIP, COMPLIANCE, AND ACCOUNTABILITY
Budgetary Information
Budgetary Practices – Budgets are presented as required supplementary information for the General Fund, Special Revenue Fund, Education Improvement Act Fund, and the Food Service Fund. Each budget is presented on the modified accrual basis of accounting, which is consistent with GAAP. The School District’s policies allow funds to be transferred between functions. The legal level of control is at the fund level. During the year, the School District revised the budget. The following procedures are followed in establishing the budgetary data reflected in the financial statements:
1. In the fall of the preceding year, the School District begins its budget process for the next succeeding fiscal year beginning on July 1.
2. After the School District’s budget committee reviews all requests and allocation requirements and related revenue, it presents a tentative proposed budget to the Superintendent for her review and adjustment.
3. The Superintendent then presents a proposed budget to the Board of Trustees, which reviews the proposed budget, in a series of workshops, and makes any additions or deletions as deemed necessary.
4. Prior to July 1, the Board legally enacts the budget through passage of a resolution. The administration has discretionary authority to make transfers between appropriation accounts. The revised budget amounts are as amended by the administration. All annual appropriations lapse at fiscal year-end. Encumbrance accounting is employed in governmental funds. Encumbrances outstanding at year-end do not constitute expenditures or liabilities because the commitments will be re-appropriated and honored during the subsequent year.
NOTE 3 DEPOSITS AND INVESTMENTS
Deposits
Custodial Credit Risk for Deposits – Custodial credit risk for deposits is the risk that, in the event of a bank failure, the School District’s deposits might not be recovered. The School District does not have a deposit policy for custodial credit risk but follows the investment policy statutes of the state of South Carolina. As of June 30, 2018, none of the School District’s bank balances of $31,934,428, which had a carrying amount of $24,217,050, were exposed to custodial credit risk.

CHARLESTON COUNTY SCHOOL DISTRICT NOTES TO FINANCIAL STATEMENTS
JUNE 30, 2018
(43)
NOTE 3 DEPOSITS AND INVESTMENTS (CONTINUED)
Investments
As of June 30, 2018, the School District had the following investments:
Weighted
Average
Investment Type Fair Value S&P Moody's MaturitySC Local Government Investment Pool 288,886,963$ Unrated Unrated <1 YearResolution Funding Corporation Coupon Strips 1,822,852 Unrated Unrated >5 YearsUnited States Treasury Note 3,418,445 Unrated Unrated >5 Years
Total 294,128,260$
Credit Ratings
At June 30, 2018, the School District had investments totaling $288,886,963 in the South Carolina Local Government Investment Pool, which is under the administration of the State Treasurer. The South Carolina Local Government Investment Pool is a 2a7 like pool, which is not registered with the Securities and Exchange Commission, but generally operates in a manner consistent with the SEC’s Rule 2a7 of the Investment Company Act of 1940 (Rule 2a7). Unit value is computed using the amortized cost method and maintains a $1 per share value. The School District’s investments are reported at fair value. The School District categorizes its fair value measurements within the fair value hierarchy established by accounting principles generally accepted in the United States of America, as follows:
Level 1 – Inputs to the valuation methodology are unadjusted quoted prices for identical assets or liabilities in active markets that the School District has the ability to access. Level 2 – Inputs to the valuation methodology include: quoted prices for similar assets or liabilities in active markets; quoted prices for identical or similar assets or liabilities in inactive markets; inputs other than quoted prices that are observable for the asset or liability; inputs that are derived principally from or corroborated by observable market data by correlation of other means. If the asset or liability has a specified (contractual) term, the Level 2 input must be observable for substantially the full term of the asset or liability. Level 3 – Inputs to the valuation methodology are unobservable and significant to the fair value measurement.

CHARLESTON COUNTY SCHOOL DISTRICT NOTES TO FINANCIAL STATEMENTS
JUNE 30, 2018
(44)
NOTE 3 DEPOSITS AND INVESTMENTS (CONTINUED)
The School District has the following recurring fair value measurements as of June 30, 2018:
Quoted Pricesin Active SignificantMarkets Other Significant
for Identical Observable UnobservableAssets Inputs Inputs
Investment Type (Level 1) (Level 2) (Level 3) TotalSC Local Government Investment Pool -$ -$ -$ -$ Resolution Funding Corporation Coupon Strips - 1,822,852 - 1,822,852 United States Treasury Note - 3,418,445 - 3,418,445
Total -$ 5,241,297$ -$ 5,241,297$
Debt securities and repurchase agreements classified in Level 2 of the fair value hierarchy are valued using a matrix pricing technique. Matrix pricing is used to value securities based on the securities’ relationship to benchmark quoted prices. Interest Rate Risk – Fair value fluctuates with interest rates, and increasing rates could cause fair value to decline below original cost. The School District does not have a formal policy limiting investment maturities that would help manage its exposure to fair value losses from increasing interest rates. Credit Risk for Investments – Credit risk for investments is the risk that an issuer or other counterparty to an investment will not fulfill its obligations. The School District does not have an investment policy for credit risk, but follows the investment policy statutes of the state of South Carolina. Custodial Credit Risk for Investments – Custodial credit risk for investments is the risk that, in the event of a bank failure, the government will not be able to recover the value of its investments or collateral securities that are in the possession of an outside party. The School District does not have an investment policy for custodial credit risk but follows the investment policy statutes of the state of South Carolina. At June 30, 2018, none of the School District’s investments were exposed to custodial credit risk. Concentration of Credit Risk for Investments – The School District places no limit on the amount it may invest in any one issuer. Investments issued or explicitly guaranteed by the U.S. government and investments in mutual funds and external investment pools are excluded from this disclosure requirement.

CHARLESTON COUNTY SCHOOL DISTRICT NOTES TO FINANCIAL STATEMENTS
JUNE 30, 2018
(45)
NOTE 3 DEPOSITS AND INVESTMENTS (CONTINUED)
A reconciliation of cash and investments as shown in the financial statements for all fund types follows: Financial Statement TotalsBalance Sheet - Governmental Funds:
Cash and Cash Equivalents 116,426,845$ Carrying AmountRestricted Cash and Cash Equivalents 191,987,777 of Deposits 24,217,050$ Restricted Investments 5,241,297
Total Balance Sheet - Governmental Funds 313,655,919 Fair Value of Investments 294,128,260
Statement of Assets and Liabilities - Fiduciary Funds:Cash and Cash Equivalents 4,430,145 Restricted Cash and Cash Equivalents 259,246
Total Statement of Assets and Liabilities - Fiduciary Funds 4,689,391
Total 318,345,310$ Total 318,345,310$
Footnotes
NOTE 4 PROPERTY TAXES AND OTHER RECEIVABLES
Charleston County, South Carolina (the County) is responsible for levying and collecting sufficient property taxes to meet funding obligations for the School District. The property taxes are considered both measurable and available for purposes of recognizing revenue and a receivable from the County at the time they are collected by the County. Property taxes are levied and billed by the County on real and personal properties (excluding vehicles, merchants inventory and TIF District properties) on October 1 based on an assessed value of approximately $3,520,000,000 at rates of 119.2 mills and 26.0 mills for the General Fund and Debt Service Fund, respectively. These taxes are due without penalty through January 15. Penalties are added to taxes depending on the date paid as follows: January 16 Through February 1 3% of TaxFebruary 2 Through March 16 10% of TaxAfter March 16 15% of Tax
Current year real and personal property taxes become delinquent on March 17. The levy date for motor vehicles is the first day of the month in which the motor vehicle license expires. These taxes are due by the last day of the same month. Taxes receivable include an allowance for uncollectible amounts of $5,151,321 for the General Fund and $411,339 for the Debt Service – District Fund and at June 30, 2018. Significant allowances for uncollectible amounts were not necessary for the other receivable accounts, which are expected to be collected within the availability period.

CHARLESTON COUNTY SCHOOL DISTRICT NOTES TO FINANCIAL STATEMENTS
JUNE 30, 2018
(46)
NOTE 4 PROPERTY TAXES AND OTHER RECEIVABLES (CONTINUED)
Unearned Revenues and Deferred Inflows of Resources
Governmental funds report deferred inflows of resources and unearned revenue in connection with receivables for revenues that are not considered to be available to liquidate liabilities of the current period. Also, both the government-wide financial statements and governmental funds do not recognize revenue in connection with resources that have been received, but not yet earned. At June 30, 2018, the various components of deferred inflows and unearned revenue were as follows: Deferred Inflows:
Delinquent Property Taxes Receivable (General Fund) 9,914,748$ Delinquent Property Taxes Receivable (Debt Service - District Fund) 3,078,580
Total Deferred Inflows for Governmental Funds 12,993,328$
Unearned Revenues:Revenue Collected, but Unearned (Special Revenue Fund) 111,066$ Revenue Collected, but Unearned (Special Revenue - EIA Fund) 3,098,316 Revenue Collected, but Unearned (Special Revenue - Food Service Fund) 230,270 Revenue Collected, but Unearned (Medals and Awards Permanent Fund) 100
Total Unearned Revenues for Both Government-Wide Financial Statements and Governmental Funds 3,439,752$

CHARLESTON COUNTY SCHOOL DISTRICT NOTES TO FINANCIAL STATEMENTS
JUNE 30, 2018
(47)
NOTE 5 CAPITAL ASSETS
Capital asset activity for the School District’s Primary Government for the year ended June 30, 2018 is as follows: Beginning Ending
Balance Increases Decreases Transfers Balance
Governmental ActivitiesCapital Assets, Not Being Depreciated:
Land 43,427,231$ 11,994,314$ -$ -$ 55,421,545$
Construction in Progress 82,838,964 60,928,362 - (99,603,584) 44,163,742
Total Capital Asset, Not Being
Depreciated 126,266,195 72,922,676 - (99,603,584) 99,585,287
Capital Assets, Being Depreciated:Buildings and Improvements 1,552,748,202 - - 77,065,606 1,629,813,808 Improvements Other than Buildings 50,789,030 868,391 (89,246) 22,537,978 74,106,153 Furniture and Fixtures 36,678,491 2,049,357 (586,808) - 38,141,040
Food Service Equipment 2,491,061 - (5,900) - 2,485,161
Total Capital Assets Being
Depreciated 1,642,706,784 2,917,748 (681,954) 99,603,584 1,744,546,162
Less: Accumulated Depreciation for:Buildings (346,858,998) (35,952,875) - - (382,811,873) Improvements Other than Buildings (38,603,741) (1,470,893) - - (40,074,634) Furniture and Fixtures (27,146,292) (1,823,374) 48,683 - (28,920,983)
Food Service Equipment (2,248,480) - 2,962 - (2,245,518)
Total Accumulated Depreciation (414,857,511) (39,247,142) 51,645 - (454,053,008)
Total Capital Assets, Being
Depreciated, Net 1,227,849,273 (36,329,394) (630,309) 99,603,584 1,290,493,154
Total Governmental Activities
Capital Assets, Net 1,354,115,468$ 36,593,282$ (630,309)$ -$ 1,390,078,441$
One Percent Educational Capital Improvement Sales and Use Tax
In August 2010, the School District’s Board approved a motion to place a 1% Educational Capital Improvement Sales and Use Tax on the November 2, 2010 Ballot for Consideration, with the proceeds to be used for rebuilding and renovating a number of schools. In November 2010, the voters of Charleston County approved this referendum, and the new tax became effective March 1, 2011. A six-year extension of this program was approved by the voters of Charleston County on November 4, 2014. A list of the projects was included on the ballot and a Citizen’s Advisory Committee was established to work with the School District on prioritization, design and community engagement into the program. The South Carolina Department of Revenue collects the tax and disburses it to Charleston County, who disburses it to the School District. The School District recognized $105,567,815 in revenues from this funding source in the year ended June 30, 2018.

CHARLESTON COUNTY SCHOOL DISTRICT NOTES TO FINANCIAL STATEMENTS
JUNE 30, 2018
(48)
NOTE 6 INTERFUND RECEIVABLES AND PAYABLES
Interfund balances at June 30, 2018 (all of which are expected to be paid or received within one year), consisted of the following individual fund receivables and payables for the primary government: Fund Receivables PayablesGeneral Fund 9,454,155$ 14,781,835$ Special Revenue Funds:
Special Revenue - 9,454,155 EIA 4,561,564 - Food Service 9,248,617 -
Debt Service Fund - District 113,741 - Debt Service Fund - CEEF 412,198 - Capital Projects Fund - District 405,370 - Nonmajor Medals and Awards Permanent Fund 40,345 -
Totals 24,235,990$ 24,235,990$
The General Fund receivable is the result of amounts due from the Special Revenue Fund. The General Fund pays the expenditures of other funds throughout the year and is reimbursed when claims or other deposits are received. The General Fund payable is the result of amounts due to the Special Revenue – EIA Fund, the Special Revenue – Food Service Fund, the Debt Service Fund – District, and the Debt Service Fund – CEEF, Capital Projects Fund – District, and Non-Major Fund. Deposits are generally made into the General Fund central depository account, which reflects the amounts as due to other funds. These due to balances are reduced as expenditures are processed for the other funds. The net payables in the Special Revenue Fund are a result of expenditures paid by the General Fund, with the cash transferred to the General Fund subsequent to year-end when claims or other deposits were received. The Special Revenue – EIA Fund, Special Revenue – Food Service Fund, Debt Service Fund – District, and Debt Service Fund – CEEF, Capital Projects Fund – District, and Non-Major Fund net receivables are primarily a result of revenues received and recorded as cash in the General Fund.

CHARLESTON COUNTY SCHOOL DISTRICT NOTES TO FINANCIAL STATEMENTS
JUNE 30, 2018
(49)
NOTE 6 INTERFUND RECEIVABLES AND PAYABLES (CONTINUED)
Transfers From and To Other Funds
Transfers from and to other funds for the year ended June 30, 2018 consisted of the following:
Special Revenue -$ Special Revenue 235,000$ EIA 10,124,778 Food Service 825,000 Special Revenue - Indirect Costs 1,738,793 - Food Service - Indirect Costs 1,447,876 -
Total 13,311,447$ Total 1,060,000$
General Fund 235,000$ General Fund - Indirect Co 1,738,793$ EIA 96,309 -
Total 331,309$ Total 1,738,793$
None -$ General Fund 10,124,778$ - Special Revenue 96,309
Total -$ Total 10,221,087$
General Fund 825,000$ General Fund - Indirect Co 1,447,876$
Debt Service - District 61,663,072$ None -$
None -$ Debt Service - CEEF 42,793,480$ - Capital Projects - District 61,663,072
Total -$ Total 104,456,552$
Debt Service - District 42,793,480$ None -$
Total 118,924,308$ Total 118,924,308$
Capital Projects - District
Debt Service - District
Debt Service - CEEF
Transfers From Transfers ToGeneral Fund
Special Revenue Fund
EIA Fund
Food Service
General Fund
Transfers from: Funds were transferred to the General Fund from other funds to cover EIA raises for teachers and the corresponding fringe benefits increase related to the EIA raise for teachers, transfers of e-rate funding from the Special Revenue Funds, and indirect costs for federal programs and food services. Transfers to: Funds were transferred from the General Fund into other funds to cover funding shortfalls in Special Revenue programs and for the Food Service benefit shortfall.

CHARLESTON COUNTY SCHOOL DISTRICT NOTES TO FINANCIAL STATEMENTS
JUNE 30, 2018
(50)
NOTE 6 INTERFUND RECEIVABLES AND PAYABLES (CONTINUED)
Transfers From and To Other Funds (Continued)
Special Revenue/EIA Funds
Transfers from: Funds were transferred from the General Fund to cover funding shortfalls. Transfers to: Funds were transferred from Special Revenue and EIA funds to other funds to cover indirect costs on federal programs, the EIA raise for teachers, EIA school employer contributions, and to provide e-rate funding for use in the General Fund as budgeted. Food Service Fund
Transfer from: Funds were transferred from the General Fund for the fringe benefit shortfall. Transfer to: Funds were transferred to the General Fund for indirect costs. Capital Projects Funds
Transfers from: Funds were transferred from the Debt Service – District Fund to the Capital Projects – District Fund to partially fund the capital projects program. Debt Service Funds
Transfers from: Funds were transferred from the Debt Service – District Fund to the Debt Service – CEEF Fund to make the base lease payments as defined in the acquisition agreement. Funds were transferred from Debt Service – District Fund to the Debt Service – CEEF Fund to fund the principal and interest payment on the long-term debt. Transfers to: Funds were transferred from the Debt Service – District Fund to the Capital Projects – District Fund to partially fund the capital projects program and to the Debt Service – CEEF Fund to make the base lease payments as defined in the acquisition agreement.
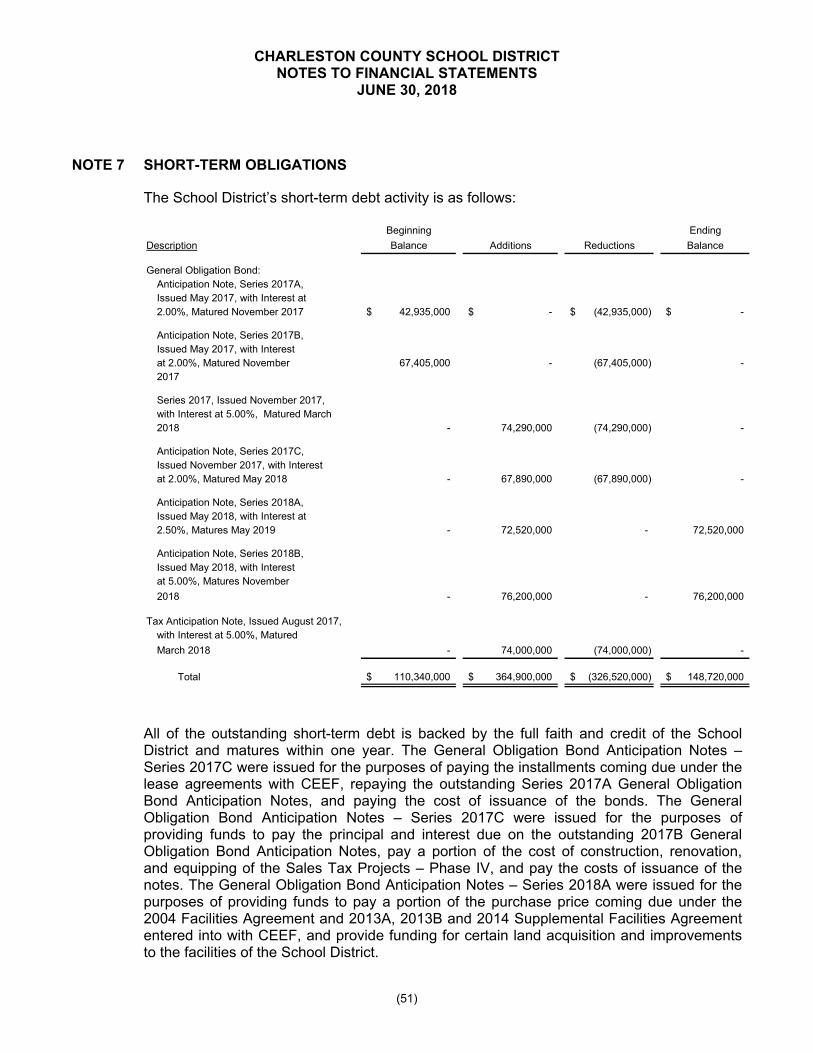
CHARLESTON COUNTY SCHOOL DISTRICT NOTES TO FINANCIAL STATEMENTS
JUNE 30, 2018
(51)
NOTE 7 SHORT-TERM OBLIGATIONS
The School District’s short-term debt activity is as follows:
Beginning Ending
Description Balance Additions Reductions Balance
General Obligation Bond:Anticipation Note, Series 2017A, Issued May 2017, with Interest at 2.00%, Matured November 2017 42,935,000$ -$ (42,935,000)$ -$
Anticipation Note, Series 2017B, Issued May 2017, with Interest at 2.00%, Matured November 67,405,000 - (67,405,000) - 2017
Series 2017, Issued November 2017,with Interest at 5.00%, Matured March 2018 - 74,290,000 (74,290,000) -
Anticipation Note, Series 2017C, Issued November 2017, with Interest at 2.00%, Matured May 2018 - 67,890,000 (67,890,000) -
Anticipation Note, Series 2018A, Issued May 2018, with Interest at 2.50%, Matures May 2019 - 72,520,000 - 72,520,000
Anticipation Note, Series 2018B, Issued May 2018, with Interest at 5.00%, Matures November
2018 - 76,200,000 - 76,200,000
Tax Anticipation Note, Issued August 2017,with Interest at 5.00%, Matured
March 2018 - 74,000,000 (74,000,000) -
Total 110,340,000$ 364,900,000$ (326,520,000)$ 148,720,000$
All of the outstanding short-term debt is backed by the full faith and credit of the School District and matures within one year. The General Obligation Bond Anticipation Notes – Series 2017C were issued for the purposes of paying the installments coming due under the lease agreements with CEEF, repaying the outstanding Series 2017A General Obligation Bond Anticipation Notes, and paying the cost of issuance of the bonds. The General Obligation Bond Anticipation Notes – Series 2017C were issued for the purposes of providing funds to pay the principal and interest due on the outstanding 2017B General Obligation Bond Anticipation Notes, pay a portion of the cost of construction, renovation, and equipping of the Sales Tax Projects – Phase IV, and pay the costs of issuance of the notes. The General Obligation Bond Anticipation Notes – Series 2018A were issued for the purposes of providing funds to pay a portion of the purchase price coming due under the 2004 Facilities Agreement and 2013A, 2013B and 2014 Supplemental Facilities Agreement entered into with CEEF, and provide funding for certain land acquisition and improvements to the facilities of the School District.

CHARLESTON COUNTY SCHOOL DISTRICT NOTES TO FINANCIAL STATEMENTS
JUNE 30, 2018
(52)
NOTE 7 SHORT-TERM OBLIGATIONS (CONTINUED)
The General Obligation Bond Anticipation Notes – Series 2018B were issued for the purposes of providing funds to pay the principal and interest due on the outstanding 2017C General Obligation Bond Anticipation Notes, pay a portion of the cost of construction, renovation, and equipping of the Sales Tax Projects – Phase IV, and pay the costs of issuance of the notes. The Tax Anticipation Notes were issued for the purpose of providing funds to pay the operational expenses of the District pending collection of ad valorem taxes and the receipt of certain State funds. The General Obligation Bond Anticipation Notes – Series 2018A and 2018B are due in November 2018 and May 2019, respectively, and were outstanding as of June 30, 2018. The balance of short-term obligations outstanding has appropriately been reflected as a liability on the governmental funds balance sheet.
NOTE 8 LONG-TERM OBLIGATIONS
The following is a summary of changes in School District long-term obligations for the year ended June 30, 2018:
Beginning Ending Due Within
Balance Additions Reductions Balance One YearGeneral Obligation Bonds:Series 2009B QSCB - Subject to 8% 11,265,000$ (1,125,000)$ 10,140,000$ 1,125,000$ Series 2010A Refunding GO Bonds - (Voter Referendum) 38,575,000 (5,100,000) 33,475,000 5,305,000 Series 2010B QSCB - Subject to 8% 14,510,000 - 14,510,000 - Series 2011A Refunding GO Bonds - (Voter Referendum) 64,025,000 - 64,025,000 9,970,000 Series 2012A Refunding GO Bonds - (Voter Referendum) 29,100,000 (5,795,000) 23,305,000 6,025,000
Series 2016 GO Bonds - Subject to 8% 7,700,000 - 7,700,000 3,755,000
Total General Obligation Bonds 165,175,000 - (12,020,000) 153,155,000 26,180,000
Installment Revenue BondsSeries 2013A Refunding Bonds 31,250,000 - (20,400,000) 10,850,000 10,850,000 Series 2013B Refunding Bonds 343,420,000 - - 343,420,000 2,000,000
Series 2014C Refunding Bonds 111,565,000 - - 111,565,000 -
Total Installment Sale
Revenue Bonds 486,235,000 - (20,400,000) 465,835,000 12,850,000
Total Premiums, Net 77,192,822 (7,438,633) 69,754,189 -
Compensated Absences 4,081,105 3,557,144 (3,036,600) 4,601,649 3,412,477
Total Long-Term Obligations 732,683,927$ 3,557,144$ (42,895,233)$ 693,345,838$ 42,442,477$
General Fund resources typically have been used in prior years to liquidate compensated absences payable. The Debt Service Funds have been used to liquidate all other long-term obligations.

CHARLESTON COUNTY SCHOOL DISTRICT NOTES TO FINANCIAL STATEMENTS
JUNE 30, 2018
(53)
NOTE 8 LONG-TERM OBLIGATIONS (CONTINUED)
Interest paid on the debt issued by the School District is exempt from federal income tax. The School District sometimes temporarily reinvests the proceeds of such tax-exempt debt in materially higher-yielding taxable securities, especially during construction projects. The federal tax code refers to this practice as arbitrage. Excess earnings (the difference between the interest on the debt and the investment earnings received) resulting from arbitrage must be rebated to the federal government on the fifth anniversary of the issuance of the tax-exempt debt and every five years thereafter until the debt has been repaid, in accordance with the arbitrage regulations. The School District does not have positive arbitrage on any of its indebtedness as of June 30, 2018. The CEEF bonds were issued pursuant to a School Facilities Purchase and Occupancy Agreement (the Facilities Agreement) and evidence proportionate interests of the owners in certain rental payments to be made by the School District under the terms of a Base Lease Agreement between the School District and CEEF dated March 15, 2002. The School District will purchase the Capital Projects from CEEF pursuant to the Facilities Agreement, which will obligate the School District to make semiannual installment payments to CEEF in amounts calculated to be sufficient to enable CEEF to pay the principal and interest on the outstanding bonds. The School District’s obligations under the Facilities Agreement are from year to year only and do not constitute a mandatory payment obligation of the School District in any fiscal year in which funds are not appropriated by the School District to pay the installment payments of purchase price due in such fiscal year. However, the School District would forfeit possession of the Facilities for the remainder of the term of the Lease. It is anticipated that the payments will be funded by the School District by the future issuance of short-term general obligation bonds. Upon the termination/completion of the School Facilities Purchase and Occupancy Agreements, the School District will own all of the capital assets financed by the Installment Sale Revenue Bonds. The CEEF bonds are not a debt of the School District; however, as CEEF is blended with the operations of the School District, the debt of CEEF is included with the School District’s other obligations as required by GAAP.

CHARLESTON COUNTY SCHOOL DISTRICT NOTES TO FINANCIAL STATEMENTS
JUNE 30, 2018
(54)
NOTE 8 LONG-TERM OBLIGATIONS (CONTINUED)
Details for each debt issue outstanding as of June 30, 2018 are as follows: General Obligation Bonds$13,515,000 Series 2009B (QSCB), with Interest at 1.05%, Maturing through September 2026 10,140,000$ $62,655,000 Series 2010A Refunding, with Interest from 2.0% to 5.0%, Maturing through February 2025 33,475,000 $15,075,000 Series 2010B (QSCB), with Interest at 4.8%, Maturing through August 2027 14,510,000 $64,200,000 Series 2011A Refunding, with Interest from 2.0% to 5.0%, Maturing through February 1, 2023 64,025,000 $44,965,000 Series 2012A Refunding, with Interest of 4.0%, Maturing through February 2024 23,305,000 $73,960,000 Series 2016, with Interest of 5.0% to 2.0%, Maturing through March 2020 7,700,000
Total General Obligation Bonds 153,155,000$
Installment Revenue Bonds$76,000,000 Series 2013A Refunding, with Interest at 1.16%, Maturing through December 2018 10,850,000$ $343,420,000 Series 2013B Refunding, with Interest from 2.0% to 5.0%, Maturing through December 2018 343,420,000 $111,565,000 Series 2014C Refunding, with Interest at 5.0%, Maturing through December 2031 111,565,000
Total Installment Revenue Bonds 465,835,000$
2010 Qualified School Construction Bonds
In October 2010, the School District issued its Series 2010B General Obligation Bonds (Taxable Qualified School Construction Bonds) with a par amount of $15,075,000 to provide funds to pay for improvements to School District facilities and to pay for the costs of issuance of the bonds. Interest payments are due semi-annually beginning on February 1, 2011 at a coupon rate of approximately 4.80% with $5,000 in principal due on August 1, 2015 and the remaining $15,070,000 due on August 1, 2027. The Federal Government is subsidizing 100% of the interest payments. The School District entered into a Paying Agent and Registrar Agreement with Wells Fargo Bank in October 2010 for the purpose of

CHARLESTON COUNTY SCHOOL DISTRICT NOTES TO FINANCIAL STATEMENTS
JUNE 30, 2018
(55)
NOTE 8 LONG-TERM OBLIGATIONS (CONTINUED)
2010 Qualified School Construction Bonds (Continued)
establishing a sinking fund to accumulate assets to be used for the retirement of this debt at maturity. In accordance with the terms of this agreement, the District directed and will direct the U. S. Department of the Treasury to send the interest subsidy to Wells Fargo Bank to be held by them in a sinking fund until maturity. The District anticipates that amounts on deposit plus the expected yield (investment earnings) of these funds on deposit will produce an amount equal to the required principal payment due in August 2027 of $15,070,000. The balance in the escrow sinking fund account at June 30, 2018 was approximately $5,241,000 and is included in the restricted investments in the financial statements. Annual Debt Service Requirements
Annual debt service requirements to maturity for all long-term debt as of June 30, 2018 are as follows:
Year Ending June 30, Principal Interest Totals2019 39,030,000$ 28,671,232$ 67,701,232$ 2020 39,805,000 26,996,664 66,801,664 2021 37,405,000 25,151,952 62,556,952 2022 38,905,000 23,424,365 62,329,365 2023 40,530,000 21,574,416 62,104,416
2024 - 2028 244,150,000 74,847,089 318,997,089 2029 - 2032 179,165,000 14,524,150 193,689,150
Total 618,990,000$ 215,189,868$ 834,179,868$
The School District is subject to a statutory millage limit on the amount of ad valorem taxes it may annually levy to fund operations and does not presently have sufficient unused capacity under its operating millage limit to levy additional ad valorem taxes to fund the installment payments of purchase price due under the Facilities Agreement. The School District is, however, authorized to levy an unlimited ad valorem tax to pay its general obligation debt and has covenanted and agreed in the Facilities Agreement to exercise its best efforts to issue its general obligation debt from time to time to provide funds to make installment payments of purchase price due under the Facilities Agreement as well as base payments to CEEF. The School District has continuous authority to issue general obligation bonds each calendar year, subject to a constitutional debt limit equal to 8% of the assessed valuation of property subject to levy by the School District, applicable to debt issued subsequent to November 30, 1982. As of November 30, 1982, the constitutional debt limit was decreased from 20% to 8% of the assessed valuation under the provisions of Section 15, Article X of the South Carolina Constitution. Of the outstanding general obligation debt at June 30, 2018, $120,805,000 was approved through voter referendum. Therefore, $181,070,000 including the $148,720,000 in short-term General Obligation Bond Anticipation Notes

CHARLESTON COUNTY SCHOOL DISTRICT NOTES TO FINANCIAL STATEMENTS
JUNE 30, 2018
(56)
NOTE 8 LONG-TERM OBLIGATIONS (CONTINUED)
Annual Debt Service Requirements (Continued)
outstanding at June 30, 2018, is subject to the 8% limitation. Based on an assessed value of approximately $3,520,000,000 at June 30, 2018 (which includes merchant’s inventory and TIF District amounts), the School District had available capacity to issue approximately $100,530,000 of additional general obligation debt. However, subsequent to year-end, the School District issued $95,165,000 of short-term general obligation bonds, decreasing the available capacity to approximately $5,365,000 at the time of financial statement issuance.
NOTE 9 DEFICIT NET POSITION AND FUND BALANCE
As of June 30, 2018, the Governmental Activities of the School District had a deficit net position of $15,136,133. The deficit is primarily a result of the District’s long-term debt, including net pension and net OPEB liabilities, exceeding the assets of School District. The net pension liability and net OPEB liability are the School District’s proportionate share of state-wide plans, and will fluctuate year to year as a result of changes in the valuation, investment results, and funding status of the plan.
As of June 30, 2018, the Debt Service-District Fund had a deficit fund balance of $48,531,092. The deficit in the Debt Service-District Fund is a result of the District’s short-term debt issuances, the related payment of outstanding debt, payment on the CEEF financing, and transfers to fund capital projects being in excess of the proceeds from new bond issuances and the levy of local property taxes by the fund. This short-term debt is issued in the spring of each year to fund fixed cost of ownership projects and make payments on the CEEF financing and is retired in the fall using proceeds of additional debt.
NOTE 10 RETIREMENT PLANS
State Retirement Plans
The School District participates in the state of South Carolina’s retirement plans, which are administered by the South Carolina Public Employee Benefit Authority (PEBA), which was created on July 1, 2012 and administers the various retirement systems and retirement programs managed by its Retirement Division. PEBA has an 11-member Board of Directors, appointed by the Governor and General Assembly leadership, which serves as co-trustee and co-fiduciary of the systems and the trust funds. By law, the Budget and Control Board, which consists of five elected officials, also reviews certain PEBA Board decisions regarding the funding of the Systems and serves as a co-trustee of the Systems in conducting that review. PEBA issues a Comprehensive Annual Financial Report (CAFR) containing financial statements and required supplementary information for the South Carolina Retirement Systems’ Pension Trust Funds. The CAFR is publicly available on the Retirement Benefits’ link on PEBA’s website at www.peba.sc.gov, or a copy may be obtained by submitting a request to PEBA, PO Box 11960, Columbia, South Carolina 29211-1960. PEBA is considered a division of the primary government of the state of South Carolina and therefore, retirement trust fund financial information is also included in the comprehensive annual financial report of the State.

CHARLESTON COUNTY SCHOOL DISTRICT NOTES TO FINANCIAL STATEMENTS
JUNE 30, 2018
(57)
NOTE 10 RETIREMENT PLANS (CONTINUED)
Plan Description
The South Carolina Retirement System (SCRS), a cost-sharing multiple-employer defined benefit pension plan, was established effective July 1, 1945, pursuant to the provisions of Section 9-1-20 of the South Carolina Code of Laws for the purpose of providing retirement allowances and other benefits for employees of the state, its public school districts, and political subdivisions.
The State Optional Retirement Program (ORP) is a defined contribution plan that is offered as an alternative to certain newly hired state, public school, and higher education employees. State ORP participants direct the investment of their funds into a plan administered by one of four investment providers.
The South Carolina Police Officers Retirement System (PORS), a cost-sharing multiple-employer defined benefit pension plan, was established effective July 1, 1962, pursuant to the provisions of Section 9-11-20 of the South Carolina Code of Laws for the purpose of providing retirement allowances and other benefits for police officers and firemen of the state and its political subdivisions.
Plan Membership
Membership requirements are prescribed in Title 9 of the South Carolina Code of Laws. A brief summary of the requirements under each system is presented below.
SCRS – Generally, all employees of covered employers are required to participate in and contribute to the system as a condition of employment. This plan covers general employees and teachers and individuals newly elected to the South Carolina General Assembly beginning with the November 2012 general election. An employee member of the system with an effective date of membership prior to July 1, 2012, is a Class Two member. An employee member of the system with an effective date of membership on or after July 1, 2012 is a Class Three member.
State ORP – As an alternative to membership in SCRS, newly hired state, public school, and higher education employees and individuals newly elected to the S.C. General Assembly beginning with the November 2012 general election have the option to participate in the State ORP, which is a defined contribution plan. State ORP participants direct the investment of their funds into a plan administered by one of four investment providers. PEBA assumes no liability for State ORP benefits. Rather, the benefits are the liability of the investment providers. For this reason, State ORP programs are not considered part of the retirement systems for financial statement purposes. Employee and Employer contributions to the State ORP are at the same rates as SCRS. A direct remittance is required from the employers to the member’s account with investment providers for the employee contribution (8.16%) and a portion of the employer contribution (5%). A direct remittance is also required to SCRS for the remaining portion of the employer contribution (5.91%) and an incidental death benefit contribution (.15%), if applicable, which is retained by SCRS.

CHARLESTON COUNTY SCHOOL DISTRICT NOTES TO FINANCIAL STATEMENTS
JUNE 30, 2018
(58)
NOTE 10 RETIREMENT PLANS (CONTINUED)
Plan Membership (Continued)
PORS – To be eligible for PORS membership, an employee must be required by the terms of his employment, by election or appointment, to preserve public order, protect life and property, and detect crimes in the state; to prevent and control property destruction by fire; or to serve as a peace officer employed by the Department of Corrections, the Department of Juvenile Justice, or the Department of Mental Health. Probate judges and coroners may elect membership in PORS. Magistrates are required to participate in PORS for service as a magistrate. PORS members, other than magistrates and probate judges, must also earn at least $2,000 per year and devote at least 1,600 hours per year to this work, unless exempted by statute. An employee member of the system with an effective date of membership prior to July 1, 2012, is a Class Two member. An employee member of the system with an effective date of membership on or after July 1, 2012 is a Class Three member.
Plan Benefits
Benefit terms are prescribed in Title 9 of the South Carolina Code of Laws. PEBA does not have the authority to establish or amend benefit terms without a legislative change in the code of laws. Key elements of the benefit calculation include the benefit multiplier, years of service, and average final compensation. A brief summary of benefit terms for each system is presented below.
SCRS – A Class Two member who has separated from service with at least five or more years of earned service is eligible for a monthly pension at age 65 or with 28 years credited service regardless of age. A member may elect early retirement with reduced pension benefits payable at age 55 with 25 years of service credit. A Class Three member who has separated from service with at least eight or more years of earned service is eligible for a monthly pension upon satisfying the Rule of 90 requirement that the total of the member’s age and the member’s creditable service equals at least 90 years. Both Class Two and Class Three members are eligible to receive a reduced deferred annuity at age 60 if they satisfy the five- or eight-year earned service requirement, respectively. An incidental death benefit is also available to beneficiaries of active and retired members of employers who participate in the death benefit program. The annual retirement allowance of eligible retirees or their surviving annuitants is increased by the lesser of 1% or $500 every July 1. Only those annuitants in receipt of a benefit on July 1 of the preceding year are eligible to receive the increase. Members who retire under the early retirement provisions at age 55 with 25 years of service are not eligible for the benefit adjustment until the second July 1 after reaching age 60 or the second July 1 after the date they would have had 28 years of service credit had they not retired.

CHARLESTON COUNTY SCHOOL DISTRICT NOTES TO FINANCIAL STATEMENTS
JUNE 30, 2018
(59)
NOTE 10 RETIREMENT PLANS (CONTINUED)
Plan Benefits (Continued)
PORS – A Class Two member who has separated from service with at least five or more years of earned service is eligible for a monthly pension at age 55 or with 25 years of service regardless of age. A Class Three member who has separated from service with at least eight or more years of earned service is eligible for a monthly pension at age 55 or with 27 years of service regardless of age. Both Class Two and Class Three members are eligible to receive a deferred annuity at age 55 with five or eight years of earned service, respectively. An incidental death benefit is also available to beneficiaries of active and retired members of employers who participate in the death benefit program. Accidental death benefits are also provided upon the death of an active member working for a covered employer whose death was a natural and proximate result of an injury incurred while in the performance of duty.
The retirement allowance of eligible retirees or their surviving annuitants is increased by the lesser of 1% or $500 every July 1. Only those annuitants in receipt of a benefit on July 1 of the preceding year are eligible to receive the increase.
Plan Contributions
Contributions are prescribed in Title 9 of the South Carolina Code of Laws. The Board may increase the SCRS and PORS employer and employee contribution rates on the basis of the actuarial valuations, but any such increase may not result in a differential between the employee and employer contribution rate that exceeds 2.9% of earnable compensation for the SCRS and 5% for the PORS. An increase in the contribution rates adopted by the Board may not provide for an increase of more than one-half of one percent in any one year. If the scheduled employee and employer contributions provided in statute or the rates last adopted by the Board are insufficient to maintain a thirty year amortization schedule of the unfunded liabilities of the plans, the Board shall increase the contribution rates in equal percentage amounts for the employer and employee as necessary to maintain the 30-year amortization period; and, this increase is not limited to one half of one percent per year. The Retirement System Funding and Administration Act increases employer contribution rates to 13.56 percent for SCRS and 16.24 percent for PORS, effective July 1, 2017. It also removes the 2.9 percent and 5 percent differential and increases and establishes a ceiling on employee contribution rates at 9 percent and 9.75 percent for SCRS and PORS respectively. The employer contribution rates will continue to increase annually by 1 percent through July 1, 2022. The legislation’s ultimate scheduled employer rate is 18.56 percent for SCRS and 21.24 percent for PORS. The amortization period is scheduled to be reduced one year for each of the next 10 years to a twenty year amortization schedule. The recent pension reform legislation also changes the long term funded ratio requirement from ninety to eighty-five.

CHARLESTON COUNTY SCHOOL DISTRICT NOTES TO FINANCIAL STATEMENTS
JUNE 30, 2018
(60)
NOTE 10 RETIREMENT PLANS (CONTINUED)
Plan Contributions (Continued)
As noted above, both employees and the School District are required to contribute to the Plans at rates established and as amended by the PEBA. The School District’s contributions are actuarially determined but are communicated to and paid by the School District as a percentage of the employees’ annual eligible compensation as follows for the past three years:
2016 2017 2018 2016 2017 2018Employer Rate:
Retirement* 10.91 % 11.41 % 13.41 % 13.34 % 13.84 % 15.84 %Incidental Death Benefit 0.15 0.15 0.15 0.20 0.20 0.20Accidental Death
Contributions - - - 0.20 0.20 0.20
Total 11.06 % 11.56 % 13.56 % 13.74 % 14.24 % 16.24 %
Employee Rate 8.16 % 8.66 % 9.00 % 8.74 % 9.24 % 9.75 %
vendor to be allocated to the member's account with the remitted to the SCRS.
SCRS and State ORP Rates PORS Rates
* Of the rate for the State ORP Plan 5% of earnable compensation must be remitted by the employer directly to the ORP
The required contributions and percentages of amounts contributed by the School District to the Plans for the past three years were as follows:
Year Ended June 30, Required Contributed Required Contributed Required Contributed 2018 31,012,284$ 100 % 4,723,282$ 100 % 22,653$ 100 %2017 24,581,408 100 3,170,095 100 16,884 1002016 25,704,328 100 3,273,810 100 26,425 100
SCRS Contributions State ORP Contributions PORS Contributions
Eligible payrolls of the School District covered under the Plans for the past three years were as follows:
State ORP
Year Ended June 30, SCRS Payroll Payroll PORS Payroll Total Payroll
2018 228,704,166$ 55,808,529$ 139,489$ 284,652,184$ 2017 215,437,406 49,455,451 121,989 265,014,846 2016 235,603,367 55,394,430 198,086 291,195,883
Pension Liabilities, Pension Expense, and Deferred Outflows/Inflows of Resources Related to Pensions
The most recent annual actuarial valuation reports adopted by the PEBA Board and Budget and Control Board are as of July 1, 2016. The net pension liability of each defined benefit pension plan was therefore determined based on the July 1, 2016 actuarial valuations, using membership data as of July 1, 2016, projected forward to the end of the fiscal year, and financial information of the pension trust funds as of June 30, 2017, using generally accepted actuarial procedures. Information included in the following schedules is based on the certification provided by PEBA’s consulting actuary, Gabriel, Roeder, Smith and Company.

CHARLESTON COUNTY SCHOOL DISTRICT NOTES TO FINANCIAL STATEMENTS
JUNE 30, 2018
(61)
NOTE 10 RETIREMENT PLANS (CONTINUED)
Pension Liabilities, Pension Expense, and Deferred Outflows/Inflows of Resources Related to Pensions (Continued)
For purposes of measuring the net pension liability, deferred outflows of resources and deferred inflows of resources related to pensions, and pension expense, information about fiduciary net position of the SCRS and PORS and additions to/deductions from the SCRS’s and PORS’s fiduciary net position have been determined on the same basis as they are reported by SCRS and PORS. The net pension liability (NPL) is calculated separately for each system and represents that particular system’s total pension liability determined in accordance with GASB Statement No. 67 less that System’s fiduciary net position. For the year ended June 30, 2017, NPL amounts and the change in NPL amounts for SCRS and PORS are as follows:
Plan FiduciaryNet Position as a
Total Employers' Percentage of thePension Plan Fiduciary Net Pension Total Pension
System Liability Net Position Liability (Asset) LiabilitySCRS 48,244,437,494$ 25,732,829,268$ 22,511,608,226$ 53.3 %PORS 7,013,684,001 4,274,123,178 2,739,560,823 60.9
At June 30, 2018, the School District reported liabilities of approximately $526,608,000 and $248,000 for its proportionate shares of the net pension liabilities for the SCRS and PORS (Plans), respectively. The net pension liabilities were measured as of June 30, 2017, and the total pension liabilities for the Plans used to calculate the net pension liabilities were determined based on the most recent actuarial valuation report as of July 1, 2016 that was projected forward to the measurement date. The School District’s proportion of the net pension liabilities were based on a projection of the School District’s long-term share of contributions to the Plans relative to the projected contributions of all participating South Carolina state and local governmental employers, actuarially determined. At June 30, 2017, the School District’s SCRS proportion was 2.339%, representing an decrease of .322% from the School District’s proportion of 2.661% at June 30, 2016. At June 30, 2017, the School District’s PORS proportion was .009%, representing a decrease of .005% from the School District’s proportion of .016% at June 30, 2016.

CHARLESTON COUNTY SCHOOL DISTRICT NOTES TO FINANCIAL STATEMENTS
JUNE 30, 2018
(62)
NOTE 10 RETIREMENT PLANS (CONTINUED)
Pension Liabilities, Pension Expense, and Deferred Outflows/Inflows of Resources Related to Pensions (Continued)
For the year ended June 30, 2018, the School District recognized pension expense of approximately $54,007,000 and $30,600 for the SCRS and PORS, respectively. At June 30, 2018, the School District reported deferred outflows of resources and deferred inflows of resources related to pensions from the following sources:
DeferredOutflows of Deferred Inflows
Description Resources of ResourcesSCRSDifferences Between Expected and Actual Experience 2,347,619$ 291,881$ Differences Between Actual and Proportionate Share of Employer Contributions 10,274,302 49,405,725 Net Difference Between Projected and Actual Earnings on Pension Plan Investments 14,700,435 - Assumption Changes 30,827,271 - School District's Contributions Subsequent to the Measurement Date 34,795,356 -
Total SCRS 92,944,983 49,697,606
PORSDifferences Between Expected and Actual Experience 2,213 - Differences Between Actual and Proportionate Share of Employer Contributions 7,547 181,080 Net Difference Between Projected and Actual Earnings on Pension Plan Investments 8,845 - Assumption Changes 23,557 - School District's Contributions Subsequent to the Measurement Date 22,653 -
Total PORS 64,815 181,080
Total SCRS and PORS 93,009,798$ 49,878,686$
Approximately $34,795,000 and $23,000 that were reported as deferred outflows of resources related to the School District’s contributions subsequent to the measurement date to the SCRS and PORS, respectively, will be recognized as a reduction of the net pension liability in the year ended June 30, 2018. Other amounts reported as deferred outflows of resources and deferred inflows of resources related to the SCRS and PORS will be recognized in pension expense as follows:
Year Ending June 30, SCRS PORS Totals2019 2,062,805$ (43,099)$ 2,019,706$ 2020 11,440,877 (39,993) 11,400,884 2021 140,878 (39,111) 101,767 2022 (5,192,539) (16,715) (5,209,254) Total 8,452,021$ (138,918)$ 8,313,103$

CHARLESTON COUNTY SCHOOL DISTRICT NOTES TO FINANCIAL STATEMENTS
JUNE 30, 2018
(63)
NOTE 10 RETIREMENT PLANS (CONTINUED)
Actuarial Assumptions and Methods
Actuarial valuations involve estimates of the reported amounts and assumptions about the probability of occurrence of events far into the future. Examples include assumptions about future employment, mortality, and future salary increases. Amounts determined during the valuation process are subject to continual revision as actual results are compared with past expectations and new estimates are made about the future. South Carolina state statute requires that an actuarial experience study be completed at least once in each five-year period. The last experience study was performed as of July 1, 2015.
The following table provides a summary of the actuarial cost method and assumptions used in the July 1, 2015, valuations for SCRS and PORS.
Description SCRS PORSActuarial Cost Method Entry Age Entry AgeActuarial Assumptions:Investment Rate of Return 7.25% 7.25%Salary Increases 3.0% to 12.5% 3.5% to 9.5%Includes Inflation at 2.25% 2.25%Benefit Adjustments Lesser of 1% Lesser of 1%
or $500 or $500
The postretiree mortality assumption is dependent upon the member’s job category and gender. This assumption includes base rates which are automatically adjusted for future improvement in mortality using published Scale AA projected from the year 2000.
Former Job Class Males FemalesEducators and Judges 2016 PRSC Males 2016 PRSC Females
Multiplied by 92% Multiplied by 98%
General Employees and 2016 PRSC Males 2016 PRSC Females Members of the General Multiplied by 100% Multiplied by 111%
Public Safety and Firefighters 2016 PRSC Males 2016 PRSC Females Multiplied by 125% Multiplied by 111%
The long-term expected rate of return on pension plan investments is based upon 30 year capital market assumptions. The long-term expected rate of returns represent assumptions developed using an arithmetic building block approach primarily based on consensus expectations and market based inputs. Expected returns are net of investment fees.

CHARLESTON COUNTY SCHOOL DISTRICT NOTES TO FINANCIAL STATEMENTS
JUNE 30, 2018
(64)
NOTE 10 RETIREMENT PLANS (CONTINUED)
Actuarial Assumptions and Methods (Continued)
The expected returns, along with the expected inflation rate, form the basis for the target asset allocation adopted at the beginning of the 2017 fiscal year. The long-term expected rate of return is produced by weighting the expected future real rates of return by the target allocation percentage and adding expected inflation and is summarized in the table on the following page. For actuarial purposes, the 7.25 percent assumed annual investment rate of return used in the calculation of the TPL includes a 5.00 percent real rate of return and a 2.25 percent inflation component.
Long-TermExpected Expected
Arithmetic Real Portfolio Real
Asset Class Target Allocation Rate of Return Rate of Return
Global EquityGlobal Private Equity 31.0 % 6.72% 2.08 %Private Equity 9.0 9.60% 0.86Equity Options Strategies 5.0 5.91% 0.30
Real AssetsReal Estate (Private) 5.0 4.32% 0.22Real Estate (REITs) 2.0 6.33% 0.13Infastructure 1.0 6.26% 0.06
OpportunisticGTAA/Risk Parity 10.0 4.16% 0.42Hedge Funds (non-PA) 4.0 3.82% 0.15Other Oppurtunistic Strategies 3.0 4.16% 0.12
Diversified CreditMixed Credit 6.0 3.92% 0.24Emerging Markets Debt 5.0 5.01% 0.25Private Debt 7.0 4.37% 0.31
Conservative Fixed IncomeCore Fixed Income 10.0 1.60% 0.16Cash and Short Duration (Net) 2.0 0.92% 0.02
Total Expected Real Return 100 % 5.32
Inflation for Actuarial Purposes 2.25Total Expected Nominal Return 7.57 %
Discount Rate
The discount rate used to measure the total pension liability was 7.25%. The projection of cash flows used to determine the discount rate assumed that contributions from participating employers in SCRS and PORS will be made based on the actuarially determined rates based on provisions in the South Carolina State Code of Laws. Based on those assumptions, each System’s fiduciary net position was projected to be available to make all projected future benefit payments of current plan members. Therefore, the long-term expected rate of return on pension plan investments was applied to all periods of projected benefit payments to determine the total pension liability.
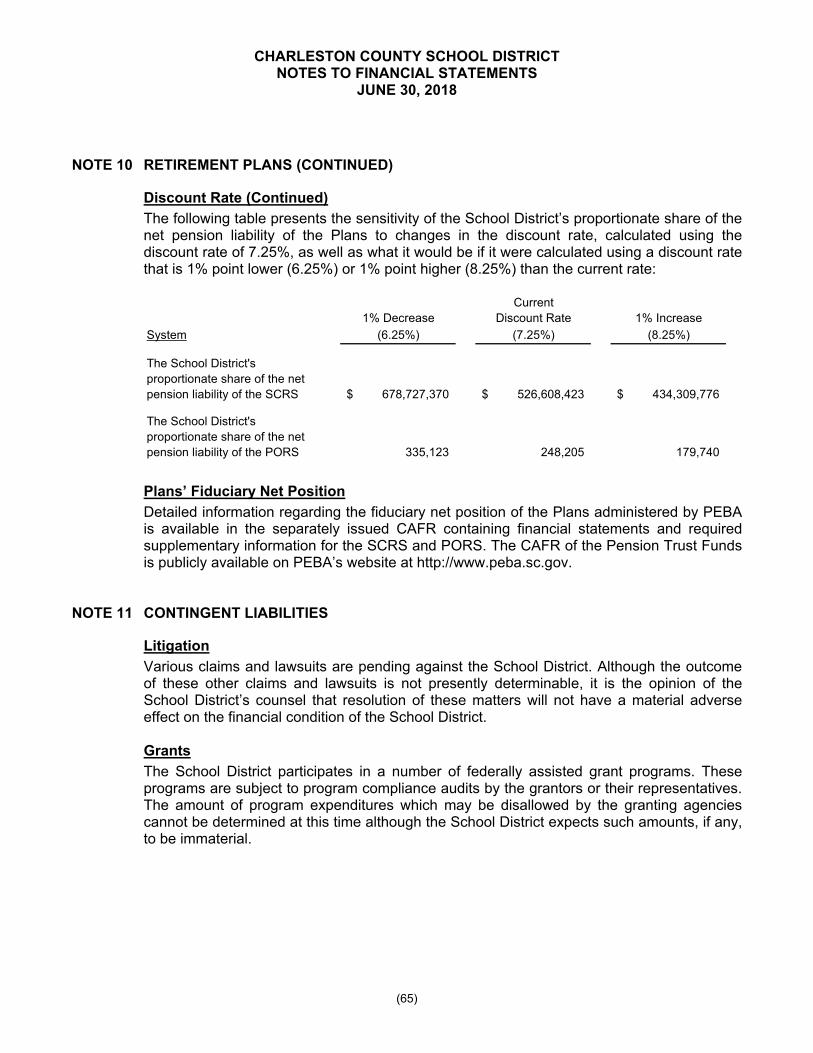
CHARLESTON COUNTY SCHOOL DISTRICT NOTES TO FINANCIAL STATEMENTS
JUNE 30, 2018
(65)
NOTE 10 RETIREMENT PLANS (CONTINUED)
Discount Rate (Continued)
The following table presents the sensitivity of the School District’s proportionate share of the net pension liability of the Plans to changes in the discount rate, calculated using the discount rate of 7.25%, as well as what it would be if it were calculated using a discount rate that is 1% point lower (6.25%) or 1% point higher (8.25%) than the current rate:
Current1% Decrease Discount Rate 1% Increase
System (6.25%) (7.25%) (8.25%)
The School District's proportionate share of the netpension liability of the SCRS 678,727,370$ 526,608,423$ 434,309,776$
The School District's proportionate share of the net pension liability of the PORS 335,123 248,205 179,740
Plans’ Fiduciary Net Position
Detailed information regarding the fiduciary net position of the Plans administered by PEBA is available in the separately issued CAFR containing financial statements and required supplementary information for the SCRS and PORS. The CAFR of the Pension Trust Funds is publicly available on PEBA’s website at http://www.peba.sc.gov.
NOTE 11 CONTINGENT LIABILITIES
Litigation
Various claims and lawsuits are pending against the School District. Although the outcome of these other claims and lawsuits is not presently determinable, it is the opinion of the School District’s counsel that resolution of these matters will not have a material adverse effect on the financial condition of the School District. Grants
The School District participates in a number of federally assisted grant programs. These programs are subject to program compliance audits by the grantors or their representatives. The amount of program expenditures which may be disallowed by the granting agencies cannot be determined at this time although the School District expects such amounts, if any, to be immaterial.

CHARLESTON COUNTY SCHOOL DISTRICT NOTES TO FINANCIAL STATEMENTS
JUNE 30, 2018
(66)
NOTE 12 RISK MANAGEMENT
The School District is exposed to various risks of loss related to torts; theft of, damage to and destruction of assets; errors and omissions; injuries to employees’ and natural disasters. The School District continues to carry commercial insurance for employee health and dental coverage and is partially self-insured for workers’ compensation and general liability, auto, and property and casualty. Because of the high cost of insurance, the School District has partnered with the South Carolina School Boards Insurance Trust (SCSBIT) in order to obtain property and casualty insurance at the best rate. The School District is insured through SCSBIT for property and casualty insurance and has a service agreement with SCBIT for risk management services; however, the School District does not participate in SCSBIT’s property and casualty insurance pool but contracts independently with Willis, the same broker for SCSBIT, for brokerage services. As a result, the School District is not liable for any shortages related to SCSBIT’s property and casualty pool. Settled claims resulting from these risks have not exceeded commercial insurance coverage in any of the past three years and there has been no significant reduction in insurance coverage.
As noted above, the School District is self-insured related to risks associated with workers’ compensation. The School District has a $750,000 per claim deductible with the insurance provider paying claims that are in excess of $750,000 per claim. The School District has recorded an estimated liability of $3,633,230 for incurred but unpaid claims at June 30, 2018, which is based on GASB Statement No. 10 which requires that a liability for claims be recorded if information prior to the issuance of the financial statements indicate that it is probable that a liability has been incurred at the date of the financial statements and the amount of the loss can be reasonably estimated. This amount is included in Other Accrued Expenses in the statement of net position.
Changes in the balances of estimated unpaid claims for workers’ compensation during the two years ended June 30 are as follows:
Current-YearUnpaid Claims Claims and Unpaid Claimsat Beginning of Changes in Claim at End of
Year Ending June 30, Fiscal Year Estimates Payments Fiscal Year2017 5,079,423$ 4,693,037$ (5,504,764)$ 4,267,696$ 2018 4,267,696 3,599,353 (2,684,545) 5,182,504
The School District is also self-insured related to risks associated with general liability, auto, and property and casualty. For general liability and auto coverage, the School District has a $75,000 per claim deductible with the insurance provider paying claims that are in excess of $75,000 per claim; for property and casualty coverage, the School District has a $100,000 per claim deductible with the insurance provider paying claims that are in excess of $100,000 per claim. In the event of a wind storm (hurricane), the District will incur the greater of a deductible of 2% of the total loss or $100,000. The School District has recorded an estimated liability of $2,109,158 for incurred but not reported claims at June 30, 2018, which is based on GASB Statement No. 10 which requires that a liability for claims be recorded if information prior to the issuance of the basic financial statements indicate that it is probable that a liability has been incurred at the date of the financial statements and the amount of the loss can be reasonably estimated. This amount is included in Other Accrued Expenses in the statement of net position.

CHARLESTON COUNTY SCHOOL DISTRICT NOTES TO FINANCIAL STATEMENTS
JUNE 30, 2018
(67)
NOTE 12 RISK MANAGEMENT (CONTINUED)
Changes in the balances of estimated unpaid claims for property damage, auto, and general liability claims during the two years ended June 30, 2018 are as follows:
Current-YearUnpaid Claims Claims and Unpaid Claimsat Beginning of Changes in Claim at End of
Year Ending June 30, Fiscal Year Estimates Payments Fiscal Year
2017 2,177,322$ (14,594)$ (430,531)$ 1,732,197$ 2018 1,732,197 2,109,158 (1,732,197) 2,109,158
NOTE 13 SERVICE CONTRACTS AND OPERATING LEASES
The School District is party to the following contracts for services which are funded by the General, Special Revenue, EIA Funds, and Capital Projects Funds. In June 2008, the School District contracted for student transportation services with Durham Services. The original contract period was from July 2008 through June 2012. The School District extended the contract with Durham Services during fiscal year 2012 for an additional two-year period with the second year based on Durham meeting certain goals to get the extension. In fiscal year 2014, the School District extended the contract with Durham Services for one year through the end of fiscal year 2015. In July 2015, the School District extended the contract through June 2020. The School District pays a base payment which is calculated per bus per day based on bus routes. In April 2017, the School District contracted with Cummings/SMG for Program Management Services for the 2017-2022 Capital Program. The contract period runs through August 2022 and the total fee associated with this contract is $28,588,741. This Capital Program is funded by the penny sales tax approved in November 2010. In July 2016, the School District entered into a five-year contract with Ricoh USA, Inc. (Ricoh) for managed document services, equipment repair and maintenance, supplies, and software support related to copiers and printers throughout the School District. Future required annual payments under the contracts for services are as follows:
Cummings/Fiscal Year SMG Durham Ricoh Total
2019 6,519,948$ 13,791,521$ 788,136$ 21,099,605$ 2020 5,891,252 14,066,451 788,136 20,745,839 2021 4,750,608 - 788,136 5,538,744 2022 3,560,668 - - 3,560,668 2023 1,281,792 - - 1,281,792
Total 22,004,268$ 27,857,972$ 2,364,408$ 52,226,648$

CHARLESTON COUNTY SCHOOL DISTRICT NOTES TO FINANCIAL STATEMENTS
JUNE 30, 2018
(68)
NOTE 14 OTHER POSTEMPLOYMENT BENEFITS
Plan Description
In accordance with the South Carolina Code of Laws and the annual Appropriations Act, the state of South Carolina (State) provides health and dental benefits to retired State and school district employees and their covered dependents through the South Carolina Retiree Health Insurance Trust Fund (SCRHITF), referred to as the OPEB plan. The OPEB plan has been determined to be a cost-sharing multiple-employer defined benefit plans and is administered by the South Carolina Public Employee Benefit Authority (PEBA). Article 5 of the State Code of Laws defines the plan and authorizes PEBA to at any time adjust the plan, including its benefits and contributions, as necessary to ensure the fiscal stability of the plans. Generally, retirees are eligible for the health and dental benefits if they have established at least ten years of retirement service credit. For new hires on May 2, 2008 and after, retirees are eligible for benefits if they have established twenty-five years of service for 100% employer funding and fifteen through twenty-four years of service for 50% employer funding. Benefits become effective when the former employee retires under a State retirement system. Funding Policy
Sections 1-11-705 through 1-11-710 of the South Carolina Code of Laws of 1976, as amended, requires these postemployment healthcare benefits be funded through annual appropriations by the General Assembly for active employees and participating retirees except the portion funded through the pension surcharge and provided from other applicable sources for active employees who are not funded by State appropriations.
Employers participating in the healthcare plan are mandated by State statute to contribute at a rate assessed each year by the Office of the Executive Budget, 5.50% of annual covered payroll for fiscal year 2018. PEBA sets the employer contribution rate based on a pay-as-you-go basis. The School District paid $15,621,220 applicable to the surcharge included with the employer contribution for retirement benefits for the fiscal year ended June 30, 2018.
OPEB Liability, Expense, and Deferred Outflows of Resources and Deferred Inflows of Resources
At June 30, 2018, the School District reported a liability of $412,761,832 for its proportionate share of the net SCRHITF OPEB. The net OPEB liabilities were determined using a valuation date of June 30, 2016 and projected forward to a measurement date of June 30, 2017. At June 30, 2017, the School District’s proportion of the SCRHITF net OPEB liability was 3.047%.

CHARLESTON COUNTY SCHOOL DISTRICT NOTES TO FINANCIAL STATEMENTS
JUNE 30, 2018
(69)
NOTE 14 OTHER POSTEMPLOYMENT BENEFITS (CONTINUED)
OPEB Liability, Expense, and Deferred Outflows of Resources and Deferred Inflows of Resources (Continued)
For the year ended June 30, 2018, the School District recognized OPEB expense of approximately $25,907,000. At June 30, 2018, the School District reported deferred outflows of resources and deferred inflows of resources related to pensions from the following sources:
DeferredOutflows of Deferred Inflows
Description Resources of ResourcesDifferences Between Expected and Actual Experience -$ 179,143$ Differences Between Actual and Proportionate Share of Employer Contributions - 5,903 Net Difference Between Projected and Actual Earnings on Pension Plan Investments 709,241 - Assumption Changes - 38,838,968 School District's Contributions Subsequent to the Measurement Date 15,147,858 -
Total 15,857,099 39,024,014
$15,147,858 that is reported as deferred outflows of resources related to the School District’s contributions subsequent to the measurement date will be recognized as a reduction of the net pension OPEB in the year ended June 30, 2019. Other amounts reported as deferred outflows of resources and deferred inflows of resources related to the SCRS and PORS will be recognized in pension expense as follows:
Year Ending June 30,2019 (6,070,530)$ 2020 (6,070,530) 2021 (6,070,530) 2022 (6,064,987)
Thereafter (14,038,196) Total (38,314,773)$
Actuarial Assumptions and Methods
The total OPEB liability in the June 30, 2016 valuation were determined using the following actuarial assumptions, applied to all periods included in the measurement, unless otherwise specified:
Actuarial Cost Method: Entry Age Normal Inflation: 2.25% Investment Rate of Return: 4.00, net of OPEB Plan investment expense; including inflation Single Discount Rate: 3.56% as of June 30, 2017 Demographic Assumptions: Based on the experience study performed for the South
Carolina Retirement Systems for the 5-year period ending June 30, 2015

CHARLESTON COUNTY SCHOOL DISTRICT NOTES TO FINANCIAL STATEMENTS
JUNE 30, 2018
(70)
NOTE 14 OTHER POSTEMPLOYMENT BENEFITS (CONTINUED)
Actuarial Assumptions and Methods (Continued)
Mortality: For healthy retirees, the 2016 Public Retirees of South Carolina Mortality Table for Males and the 2016 Public Retirees of South Carolina Mortality Table for Females are used with fully generational mortality projections based on Scale AA from the year 2016. Multipliers are applied to the base tables based on gender and employment type. Health Care Trend Rate: Initial trend starting at 7.00% and gradually decreasing to an ultimate trend rate of 4.15% over a period of 15 years Aging Factors: Based on plan specific experience Retiree Participation: 79% for retirees who are eligible for funded premiums
The long-term expected rate of returns represent assumptions developed using an arithmetic building block approach primarily based on consensus expectations and market based inputs. The expected returns, along with the expected inflation rate, form the basis for the target asset allocation adopted at the beginning of the 2017 fiscal year. The long-term expected rate of return is produced by weighting the expected future real rates of return by the target allocation percentage and adding expected inflation. This information is summarized in the following table:
Allocation-Long-Term Weighted Long-
Expected Real Term Expected Real
Asset Class Target Allocation Rate of Return Rate of Return
U.S. Domestic Fixed Income 80.00% 2.09% 1.67%Cash 20.00% 0.84% 0.17%
Total 100.00% 1.84%
Expected Inflation 2.25%
Total Return 4.09% Discount Rate
The Single Discount Rate of 3.56% was used to measure the total OPEB liability for the SCRHITF. The SCRHITF’s accounting policy for this plan is to set the Single Discount Rate equal to the prevailing municipal bond rate. The Fidelity “20-Year Municipal GO AA Index” for fixed-income municipal bonds with 20 years to maturity that include only federal tax-exempt municipal bonds was used for reporting as of June 30, 2017. Due to the plan’s investment and funding policies, the difference between a blended discount rate and the municipal bond rate would be less than several basis points (several hundredths of one percent).

CHARLESTON COUNTY SCHOOL DISTRICT NOTES TO FINANCIAL STATEMENTS
JUNE 30, 2018
(71)
NOTE 14 OTHER POSTEMPLOYMENT BENEFITS (CONTINUED)
Sensitivity Analysis
The following table presents the School District’s proportionate share of SCRHITF’s net OPEB liability calculated using a Single Discount Rate of 3.56%, as well as what the plan’s net OPEB liability would be if it were calculated using a Single Discount Rate that is one percent lower or one percent higher:
Current1% Decrease Discount Rate 1% Increase
(2.56%) (3.56%) (4.56%)
The School District's proportionate share of the netOPEB liability of the SCRHITF 486,120,902$ 412,761,832$ 353,622,798$
In addition, the following table presents the School District’s proportionate share of SCRHITF’s net OPEB liability calculated using the assumed healthcare cost trend rates, as well as what the plan’s net OPEB liability would be if it were calculated using a healthcare cost trend rate that is one percent lower or one percent higher:
Current1% Decrease Healthcare Cost 1% Increase
Trend Rate
The School District's proportionate share of the netOPEB liability of the SCRHITF 338,484,682$ 412,761,832$ 508,940,935$ Plans’ Fiduciary Net Position
Detailed information regarding the fiduciary net position of the SCRHITF administered by PEBA is available in the separately issued financial statements and required supplementary information for the SCRS and PORS. The CAFR of the Pension Trust Funds is publicly available on PEBA’s website at http://www.peba.sc.gov.
NOTE 15 TAX ABATEMENTS
As of June 30, 2018, the School District is impacted by tax abatements provided by Charleston County through Fee In Lieu of Taxes (FILOT) Programs and Special Source Revenue Credits (SSRC).
The County has entered into negotiated FILOT agreements pursuant to the authority granted by Title 12/Chapter 44, Title 4/Chapter 29, and/or Title 4/Chapter 12 of the Code of Laws of South Carolina, 1976, as amended. Property subject to a FILOT agreement is exempt from ad valorem property tax and is instead subject to an amount equal to the product of the appraised value of the property times the assessment ratio (generally no lower than 6%, but may be as low as 4% for extraordinary projects that satisfy the statutory definition of an “enhanced investment”), times the millage rate. The millage rate is either fixed for the life of the agreement or is adjusted every five years based on the trailing five-year average.

CHARLESTON COUNTY SCHOOL DISTRICT NOTES TO FINANCIAL STATEMENTS
JUNE 30, 2018
(72)
NOTE 15 TAX ABATEMENTS (CONTINUED)
The County provides special source revenue credits (SSRC), generally in conjunction with FILOT agreements, pursuant to the authority granted by Sections 4-29-68 and 4-1-170 of the Code of Laws of South Carolina, 1976, as amended. SSRC, often referred to as “Infrastructure Credits,” are reductions to a taxpayer’s payments in lieu of taxes. Property that receives SSRC is added to the “Multi-County-Industrial-Park” (MCIP) pursuant to Sections 4-1-170 through 4-1-175 of the Code of Laws of South Carolina, 1976, as amended. Most MCIP agreements allocate a set percentage of property tax (or fee in lieu of tax) revenue to a partner county. As a result of the County programs having a direct effect on the total tax levy of the School District, the School District incurred tax abatements under the FILOT and SSRC programs in the amount of $30,297,939.
NOTE 16 SUBSEQUENT EVENTS
In August 2018, the School District issued a short-term Tax Anticipation Note (TAN) with a par amount of $65,350,000 at a coupon rate of 5.00% and received a premium of $1,210,936. Principal and interest are due in full on March 29, 2019 and will be paid using operating tax collections. The TAN was issued for the purpose of providing funds to pay the operational expenditures of the School District during fiscal year 2019 until tax revenues are received. In October 2018, the School District issued a Series 2018 General Obligation Bonds with a par amount of $95,165,000 at a coupon rate of 5% and received a premium of $2,398,169. Principal and interest are due through March 1, 2023 and will be paid using debt service tax collections. The Bonds were issued for the purpose of paying the installments coming due under the lease agreements with CEEF, repaying the outstanding Series 2018A GO BAN, and paying the cost of issuance of the bonds.

CHARLESTON COUNTY SCHOOL DISTRICT NOTES TO FINANCIAL STATEMENTS
JUNE 30, 2018
(73)
NOTE 17 RESTATEMENT
The School District adopted GASB Statement No. 75, Accounting and Financial Reporting for Postemployment Benefits Other Than Pensions, which improves accounting and financial reporting by state and local government employers whose employees are provided benefits through pensions. The School District is now required to record a liability for future other postemployment benefits in excess of accumulated plan contributions. This pronouncement requires the restatement of the June 30, 2017 net position of the governmental activities and the aggregate discretely presented component units.
Governmental Activities
Aggregate Discretely Presented
Component Units Net Position, June 30, 2017, as previously stated 310,849,028$ (11,482,049)$ Cumulative Affect of Application of GASB 75 (427,254,407) (28,930,114)
Net Position, June 30, 2017, Restated (116,405,379)$ (40,412,163)$
NOTE 18 GOING CONCERN – COMPONENT UNITS
For the year ended June 30, 2018, the financial statements of Prestige Preparatory Academy (Prestige), a discretely presented component unit of the School District, have been prepared assuming that Prestige will continue as a going concern. Prestige has responded by analyzing its existing staffing and overhead to determine the most efficient means to deliver its services. Prestige is also working to ensure the surrounding community becomes more aware of its mission and the educational opportunities it affords. Prestige has undertaken a number of enrollment initiatives. Management remains confident in the School’s ability to increase its enrollment so as to more clearly match revenues with expenses. The School District conducted a heard of charter revocation in March 2018, representing that Prestige was in violation of provisions of the charter contract relating to finances and to academic performance. Following the hearing, the School District did not revoke the charter, but did establish specific conditions for Prestige to remain open. Prestige has complied with these conditions to date. Due to these issues, substantial doubt remains regarding the ability of Prestige to continue as a going concern.

CHARLESTON COUNTY SCHOOL DISTRICT SCHEDULE OF REVENUES, EXPENDITURES, AND CHANGES IN FUND BALANCE
BUDGETS AND ACTUAL GENERAL FUND
YEAR ENDED JUNE 30, 2018
(74)
Variance withFinal Budget-
PositiveOriginal Final Actual (Negative)
REVENUESLocal Property Taxes 293,599,973$ 293,744,061$ 293,305,834$ (438,227)$ Other Local 670,000 1,355,000 2,256,074 901,074
Total Local 294,269,973 295,099,061 295,561,908 462,847
State 174,491,073 174,586,221 176,828,911 2,242,690 Federal 106,861 234,536 388,489 153,953 Intergovernmental 9,000 135,000 175,808 40,808
Total Revenues 468,876,907 470,054,818 472,955,116 2,900,298
EXPENDITURESCurrent:
Instruction 236,437,705 239,750,350 227,624,303 12,126,047 Support Services 184,463,937 188,545,117 180,881,328 7,663,789 Community Services 1,021,028 1,214,390 745,947 468,443 Intergovernmental 6,015,315 5,013,200 6,075,545 (1,062,345) Payments to Component Units 39,144,257 39,437,723 40,996,431 (1,558,708)
Capital Outlay 175,816 317,929 363,794 (45,865) Debt Service:
Interest and Other Fiscal Charges 100,000 100,000 427,566 (327,566) Total Expenditures 467,358,058 474,378,709 457,114,914 17,263,795
EXCESS (DEFICIENCY) OF REVENUES OVER EXPENDITURES 1,518,849 (4,323,891) 15,840,202 20,164,093
OTHER FINANCING SOURCES (USES)Transfers In 11,691,152 12,883,906 13,311,447 427,541 Transfers Out (1,060,000) (1,060,000) (1,060,000) -
Total Other Financing Sources 10,631,152 11,823,906 12,251,447 427,541
NET CHANGES IN FUND BALANCES 12,150,001 7,500,015 28,091,649 20,591,634
Fund Balance - Beginning of Year 42,059,145 42,059,145 42,059,145 -
FUND BALANCE - END OF YEAR 54,209,146$ 49,559,160$ 70,150,794$ 20,591,634$
Budgeted Amounts

CHARLESTON COUNTY SCHOOL DISTRICT SCHEDULE OF REVENUES, EXPENDITURES, AND CHANGES IN FUND BALANCE
BUDGETS AND ACTUAL SPECIAL REVENUE FUND
YEAR ENDED JUNE 30, 2018
(75)
Variance withFinal Budget-
PositiveOriginal Final Actual (Negative)
REVENUESOther Local 11,460,750$ 15,236,975$ 13,157,047$ (2,079,928)$ State 5,647,164 6,430,853 6,367,757 (63,096) Federal 40,842,824 54,790,667 45,749,617 (9,041,050)
Total Revenues 57,950,738 76,458,495 65,274,421 (11,184,074)
EXPENDITURESCurrent:
Instruction 22,931,445 33,469,414 28,829,772 4,639,642 Support Services 22,182,109 29,343,680 22,737,226 6,606,454 Community Services 10,325,196 10,588,836 9,018,199 1,570,637 Intergovernmental 422,599 422,599 564,840 (142,241) Payments to Component Units 1,002,887 1,538,732 1,547,871 (9,139)
Capital Outlay 7,340 76,263 5,517 70,746 Total Expenditures 56,871,576 75,439,524 62,703,425 12,736,099
EXCESS OF REVENUES OVER EXPENDITURES 1,079,162 1,018,971 2,570,996 1,552,025
OTHER FINANCING SOURCES (USES)Use of Fund Balance 507,927 820,313 - (820,313) Sale of Capital Assets - 16,938 16,938 - Transfers In 235,000 235,000 455,424 220,424 Transfers Out (1,822,089) (2,121,221) (1,862,908) 258,313
Total Other Financing Sources (Uses) (1,079,162) (1,048,970) (1,390,546) 478,737
NET CHANGES IN FUND BALANCES - (29,999) 1,180,450 2,030,762
Fund Balance - Beginning of Year 2,073,702 2,073,702 2,073,702 -
FUND BALANCE - END OF YEAR 2,073,702$ 2,043,703$ 3,254,152$ 2,030,762$
Budgeted Amounts

CHARLESTON COUNTY SCHOOL DISTRICT SCHEDULE OF REVENUES, EXPENDITURES, AND CHANGES IN FUND BALANCE
BUDGETS AND ACTUAL EDUCATION IMPROVEMENT ACT FUND
YEAR ENDED JUNE 30, 2018
(76)
Variance withFinal Budget-
PositiveOriginal Final Actual (Negative)
REVENUESState 26,304,422$ 33,519,376$ 30,808,525$ (2,710,851)$
EXPENDITURESCurrent:
Instruction 8,868,089 10,991,449 9,756,085 1,235,364 Support Services 5,686,932 10,019,823 8,541,198 1,478,625 Payments to Component Units 1,707,662 2,104,064 2,117,578 (13,514)
Capital Outlay 49,659 182,815 172,577 10,238 Total Expenditures 16,312,342 23,298,151 20,587,438 2,710,713
EXCESS OF REVENUES OVER EXPENDITURES 9,992,080 10,221,225 10,221,087 138
OTHER FINANCING SOURCES (USES)Transfers Out (9,992,080) (10,221,225) (10,221,087) (138)
NET CHANGES IN FUND BALANCES - - - -
Fund Balance - Beginning of Year - - - - -
FUND BALANCE - END OF YEAR -$ -$ -$ -$
Budgeted Amounts

CHARLESTON COUNTY SCHOOL DISTRICT SCHEDULE OF REVENUES, EXPENDITURES, AND CHANGES IN FUND BALANCE
BUDGETS AND ACTUAL FOOD SERVICE FUND
YEAR ENDED JUNE 30, 2018
(77)
Variance withFinal Budget-
PositiveOriginal Final Actual (Negative)
REVENUESOther Local 4,790,874$ 4,790,874$ 5,043,786$ 252,912$ State - - 1,908 1,908 Federal 23,192,327 23,192,327 22,358,727 (833,600)
Total Revenues 27,983,201 27,983,201 27,404,421 (578,780)
EXPENDITURESCurrent:Support Services 27,184,440 27,165,940 27,025,018 140,922 Capital Outlay 141,500 160,000 150,972 9,028
Total Expenditures 27,325,940 27,325,940 27,175,990 149,950
EXCESS OF REVENUES OVER EXPENDITURES 657,261 657,261 228,431 428,830
OTHER FINANCING SOURCES (USES)Transfers In 825,000 825,000 825,000 - Transfers Out (1,482,261) (1,482,261) (1,447,876) 34,385
Total Other Financing Sources (Uses) (657,261) (657,261) (622,876) 34,385
NET CHANGES IN FUND BALANCES - - (394,445) (394,445)
Fund Balance - Beginning of Year 8,788,060 8,788,060 8,788,060 -
FUND BALANCE - END OF YEAR 8,788,060$ 8,788,060$ 8,393,615$ (394,445)$
Budgeted Amounts

CHARLESTON COUNTY SCHOOL DISTRICT SCHEDULE OF CHARLESTON COUNTY SCHOOL DISTRICT’S PROPORTIONATE
SHARE OF NET PENSION LIABILITY SOUTH CAROLINA RETIREMENT SYSTEM
(78)
2018 2017 2016 2015 2014
Proportion of the Net Pension Liability 2.339 % 2.661 % 2.540 % 2.595 % 2.595 %
Proportionate Share of the Net Pension Liability 526,608,423$ 568,364,147$ 481,685,824$ 446,724,975$ 465,400,428$
Covered Payroll 284,512,695$ 264,892,857$ 290,997,797$ 211,165,412$ 212,227,347$
Proportionate Share of the Net Pension Liability as a Percentage of its Covered Payroll 185.09 % 214.56 % 165.53 % 211.55 % 219.29 %
Plan Fiduciary Net Position as a Percentage of the Total Pension Liability 53.3% 52.9% 57.0% 59.9% 56.4%
Note to Schedule:
The amounts for each fiscal year were determined as of June 30th of the preceding year. Only five years of data were available;thus, only five years were presented.

CHARLESTON COUNTY SCHOOL DISTRICT SCHEDULE OF CHARLESTON COUNTY SCHOOL DISTRICT’S CONTRIBUTIONS
SOUTH CAROLINA RETIREMENT SYSTEM LAST TEN FISCAL YEARS
(79)
2018 2017 2016 2015 2014
Contractually Required Contribution 35,735,566$ 27,751,503$ 28,978,138$ 28,617,697$ 22,496,099$
Contributions in Relation to the Contractually Required Contributions 35,735,566 27,751,503 28,978,138 28,617,697 22,496,099
Contribution Deficiency (Excess) -$ -$ -$ -$ -$
Charleston County School District's Covered Payroll 284,512,695$ 264,892,857$ 290,997,797$ 262,544,956$ 212,227,347$
Contributions as a Percentage of Covered Payroll 12.56 % 10.48 % 9.96 % 10.90 % 10.60 %
Note to Schedule:Only four years of data were available; thus, only five years were presented.

CHARLESTON COUNTY SCHOOL DISTRICT SCHEDULE OF CHARLESTON COUNTY SCHOOL DISTRICT’S PROPORTIONATE
SHARE OF NET PENSION LIABILITY POLICE OFFICERS’ RETIREMENT SYSTEM
(80)
2018 2017 2016 2015 2014
Proportion of the Net Pension Liability 0.010 % 0.016 % 0.021 % 0.020 % 0.020 %
Proportionate Share of the Net Pension Liability 248,177$ 394,168$ 463,731$ 388,763$ 420,959$
Covered Payroll 139,489$ 121,989$ 198,086$ 263,586$ 244,244$
Proportionate Share of the Net Pension Liability as a Percentage of its Covered Payroll 177.92 % 323.12 % 234.11 % 147.49 % 172.35 %
Plan Fiduciary Net Position as a Percentage of the Total Pension Liability 60.9 % 60.4 % 64.6 % 67.6 % 63.0 %
Note to Schedule:
The amounts for each fiscal year were determined as of June 30th of the preceding year. Only five years of data were available; thus, only five years were presented.

CHARLESTON COUNTY SCHOOL DISTRICT SCHEDULE OF CHARLESTON COUNTY SCHOOL DISTRICT’S CONTRIBUTIONS
POLICE OFFICERS’ RETIREMENT SYSTEM LAST TEN FISCAL YEARS
(81)
2018 2017 2016 2015 2014
Contractually Required Contribution 22,653$ 16,884$ 26,425$ 35,347$ 31,361$
Contributions in Relation to the Contractually Required Contributions 22,653 16,884 26,425 35,347 31,361
Contribution Deficiency (Excess) -$ -$ -$ -$ -$
Charleston County School District's Covered Payroll 139,489$ 121,989$ 198,086$ 263,586$ 244,244$
Contributions as a Percentage of Covered Payroll 16.24% 13.84% 13.34% 13.41% 12.84%
Note to Schedule:Only five years of data were available; thus, only five years were presented.

CHARLESTON COUNTY SCHOOL DISTRICT NOTES TO REQUIRED SUPPLEMENTARY INFORMATION
SOUTH CAROLINA RETIREMENT SYSTEM AND POLICE OFFICERS’ RETIREMENT SYSTEM JUNE 30, 2018
(82)
NOTE 1 CHANGES IN BENEFIT TERMS There were no benefit changes during the year.
NOTE 2 CHANGES IN ASSUMPTIONS
The discount rate changed from 7.50% as of June 30, 2016 to 7.25% as of June 30, 2017

CHARLESTON COUNTY SCHOOL DISTRICT SCHEDULE OF CHARLESTON COUNTY SCHOOL DISTRICT’S PROPORTIONATE
SHARE OF NET OPEB LIABILITY SOUTH CAROLINA RETIREE HEALTH INSURANCE TRUST FUND
(83)
2018
Proportion of the Net OPEB Liability 3.047 %
Proportionate Share of the Net OPEB Liability 412,761,832$
Covered Payroll 265,014,846$
Proportionate Share of the Net OPEB Liability as a Percentage of its Covered Payroll 155.75 %
Plan Fiduciary Net Position as a Percentage of the Total OPEB Liability 7.6 %
Note to Schedule:
The amounts for each fiscal year were determined as of June 30th of the preceding year. Only one year of data wasavailable; thus, only one year were presented.

CHARLESTON COUNTY SCHOOL DISTRICT SCHEDULE OF CHARLESTON COUNTY SCHOOL DISTRICT’S CONTRIBUTIONS
SOUTH CAROLINA RETIREE HEALTH INSURANCE TRUST FUND LAST TEN FISCAL YEARS
(84)
2018 2017
Contractually Required Contribution 15,147,858$ 14,125,292$
Contributions in Relation to the Contractually Required Contributions 15,147,858 14,125,292
Contribution Deficiency (Excess) -$ -$
Charleston County School District's Covered Payroll 284,652,184$ 265,014,846$
Contributions as a Percentage of Covered Payroll 5.32% 5.33%
Note to Schedule:Only two years of data were available; thus, only two years were presented.

CHARLESTON COUNTY SCHOOL DISTRICT NOTES TO REQUIRED SUPPLEMENTARY INFORMATION
SOUTH CAROLINA RETIREE HEALTH INSURANCE TRUST FUND JUNE 30, 2018
(85)
NOTE 1 CHANGES IN BENEFIT TERMS There were no benefit changes during the year.
NOTE 2 CHANGES IN ASSUMPTIONS
The discount rate changed from 2.92% as of June 30, 2016 to 3.56% as of June 30, 2017

CHARLESTON COUNTY SCHOOL DISTRICT SCHEDULE OF REVENUES, EXPENDITURES, AND CHANGES IN FUND BALANCE
REVISED BUDGET AND ACTUAL GENERAL FUND
YEAR ENDED JUNE 30, 2018
(86)
RevisedBudget Actual Variance
REVENUES 1000 Revenue from Local Sources:
1100 Taxes:1110 Ad Valorem Taxes-Including Delinquent (Independent) 278,441,873$ 276,027,989$ (2,413,884)$ 1140 Penalties and Interest on Taxes (Independent) 7,860,000 8,240,153 380,153
1200 Revenue from Local Governmental Units Other than LEA's:
1280 Revenue in Lieu of Taxes (Independent and Dependent) 7,442,188 9,037,692 1,595,504
1300 Tuition:1310 Tuition from Patrons for Regular Day School 150,000 262,040 112,040
1500 Earnings on Investments:1510 Interest on Investments 500,000 1,268,606 768,606
1900 Other Revenue from Local Sources:1910 Rentals 350,000 530,747 180,747 1912 Repayment of Payroll Overpayment - 3,777 3,777 1950 Refund of Prior Year's Expenditures 50,000 45,173 (4,827) 1993 Receipt of Insurance Proceeds 50,000 37,106 (12,894) 1999 Revenue from Other Local Sources 255,000 108,625 (146,375)
Total Revenue from Local Sources 295,099,061 295,561,908 462,847
2000 Intergovernmental Revenue:2100 Payments from Other Governmental Units 75,000 122,211 47,211 2200 Payments from Public Charter School 60,000 53,597 (6,403)
Total Intergovernmental Revenue 135,000 175,808 40,808
3000 Revenue from State Sources:3100 Restricted State Funding:
3130 Special Programs:3131 Handicapped Transportation - Bus Driver Aides 15,000 8,480 (6,520) 3132 Home Schooling (No Carryover Position) - 4,850 4,850
3160 School Bus Driver's Salary (Includes Hazardous Condition Transportation): 1,979,210 2,405,543 426,333
3161 EAA Bus Driver Salary and Fringe 10,000 8,356 (1,644) 3162 Transportation Workers' Compensation 150,000 144,665 (5,335)
3180 Fringe Benefits Employer Contributions (No Carryover Provision): 20,133,481 20,303,566 170,085
3181 Retiree Insurance (No Carryover Provision) 9,931,467 9,427,147 (504,320)
3300 Education Finance Act:3310 Full-Time Programs:
3311 Kindergarten 2,822,481 2,751,446 (71,035) 3312 Primary 8,747,201 8,227,770 (519,431) 3313 Elementary 12,809,050 12,662,542 (146,508) 3314 High School 4,846,813 4,938,722 91,909 3315 Trainable Mentally Handicapped 221,802 186,096 (35,706) 3316 Speech Handicapped (Part-Time Program) 923,209 921,375 (1,834)

CHARLESTON COUNTY SCHOOL DISTRICT SCHEDULE OF REVENUES, EXPENDITURES, AND CHANGES IN FUND BALANCE (CONTINUED)
REVISED BUDGET AND ACTUAL GENERAL FUND
YEAR ENDED JUNE 30, 2018
(87)
RevisedBudget Actual Variance
REVENUES (CONTINUED)3317 Homebound 62,445$ 56,301$ (6,144)$
3320 Part-Time Programs:3321 Emotionally Handicapped 208,434 182,587 (25,847) 3322 Educable Mentally Handicapped 258,393 262,224 3,831 3323 Learning Disabilities 2,982,009 2,689,586 (292,423) 3324 Hearing Handicapped 108,588 93,206 (15,382) 3325 Visually Handicapped 48,270 80,812 32,542 3326 Orthopedically Handicapped 63,838 65,401 1,563 3327 Vocational 5,320,764 5,065,215 (255,549)
3330 Other EFA Programs:3331 Autism 930,553 938,245 7,692 3332 High Achieving Students 1,269,704 1,397,892 128,188 3334 Limited English Proficiency 473,397 482,630 9,233 3350 Residential Treatment Facilities - 77,123 77,123 3351 Academic Assistance 1,470,685 1,602,126 131,441 3352 Pupils in Poverty 4,587,530 4,462,012 (125,518) 3353 Dual 245,662 120,024 (125,638)
3392 NBSC Excess - 182,743 182,743
3800 State Revenue in Lieu of Taxes: 3810 Reimbursement for Local Residential Property Tax Relief 16,955,781 16,955,782 1
3820 Homestead Exemption 3,557,362 3,557,262 (100) 3825 Reimbursement for Property Tax Relief (Tier 3) 70,764,755 70,825,778 61,023 3830 Merchant's Inventory Tax 1,948,337 1,948,337 - 3840 Manufacturers Depreciation Reimbursement 740,000 818,939 78,939
Total Revenue from State Sources 174,586,221 173,854,783 (731,438)
3900 Other State Revenue:3993 PEBA - 2,967,628 2,967,628 3999 Revenue from Other State Sources - 6,500 6,500
Total Revenue from Other State Sources - 2,974,128 2,974,128
4000 Revenue from Federal Sources:4100 Federally Impacted Areas:
4110 Maintenance and Operations (P.L. 874) 95,536 100,629 5,093 4900 Revenue From Other Fed Sources
4999 Revenue From Other Fed Sources 139,000 287,860 148,860 Total Revenue from Federal Sources 234,536 388,489 153,953
Total Revenue All Sources 470,054,818 472,955,116 2,900,298
EXPENDITURES100 Instruction:
110 General Instruction:111 Kindergarten Programs:
100 Salaries 12,254,123 11,641,401 612,722 200 Employee Benefits 5,102,967 4,909,876 193,091 300 Purchased Services 500 340 160 400 Supplies and Materials 93,921 92,464 1,457
112 Primary Programs:100 Salaries 29,214,694 27,410,733 1,803,961 200 Employee Benefits 11,408,266 10,903,660 504,606 300 Purchased Services 1,728,845 3,707,950 (1,979,105) 400 Supplies and Materials 362,036 346,021 16,015

CHARLESTON COUNTY SCHOOL DISTRICT SCHEDULE OF REVENUES, EXPENDITURES, AND CHANGES IN FUND BALANCE (CONTINUED)
REVISED BUDGET AND ACTUAL GENERAL FUND
YEAR ENDED JUNE 30, 2018
(88)
RevisedBudget Actual Variance
EXPENDITURES (CONTINUED)113 Elementary Programs:
100 Salaries 48,273,613$ 45,933,370$ 2,340,243$ 140 Terminal Leave 750,000 - 750,000 200 Employee Benefits 18,884,018 18,418,127 465,891 300 Purchased Services 2,477,734 1,340,237 1,137,497 400 Supplies and Materials 819,245 825,723 (6,478) 600 Other Objects 1,720 827 893
114 High School Programs:100 Salaries 28,240,007 27,343,168 896,839 140 Terminal Leave - 34,419 (34,419) 200 Employee Benefits 10,932,477 11,069,452 (136,975) 300 Purchased Services 1,443,201 2,058,376 (615,175) 400 Supplies and Materials 343,045 304,568 38,477 600 Other Objects 481,427 1,042 480,385
115 Vocational Programs:100 Salaries 7,073,654 6,524,713 548,941 200 Employee Benefits 2,739,691 2,606,523 133,168 300 Purchased Services 94,760 82,374 12,386 400 Supplies and Materials 272,485 221,353 51,132 600 Other Objects 235,231 90 235,141
118 Montessori Programs:100 Salaries 4,274,212 4,123,697 150,515 200 Employee Benefits 1,731,421 1,710,355 21,066 300 Purchased Services 28,987 45,010 (16,023) 400 Supplies and Materials 38,225 36,151 2,074 600 Other Objects 109,072 - 109,072
120 Exceptional Programs:121 Educable Mentally-Handicapped:
100 Salaries 5,329,923 4,804,896 525,027 200 Employee Benefits 2,336,481 2,055,072 281,409
122 Trainable Mentally Handicapped:100 Salaries 1,011,913 1,012,789 (876) 200 Employee Benefits 382,649 402,748 (20,099) 400 Supplies and Materials - 1,047 (1,047)
123 Orthopedically Handicapped:100 Salaries 69,434 80,744 (11,310) 200 Employee Benefits 23,855 27,017 (3,162)
124 Visually Handicapped:100 Salaries 123,514 142,462 (18,948) 200 Employee Benefits 47,204 47,756 (552) 300 Purchased Services 17,500 2,605 14,895

CHARLESTON COUNTY SCHOOL DISTRICT SCHEDULE OF REVENUES, EXPENDITURES, AND CHANGES IN FUND BALANCE (CONTINUED)
REVISED BUDGET AND ACTUAL GENERAL FUND
YEAR ENDED JUNE 30, 2018
(89)
RevisedBudget Actual Variance
EXPENDITURES (CONTINUED)125 Hearing Handicapped:
100 Salaries 590,858$ 612,975$ (22,117)$ 200 Employee Benefits 269,642 272,733 (3,091)
126 Speech Handicapped:100 Salaries 2,556,120 2,472,721 83,399 200 Employee Benefits 1,012,543 971,895 40,648
127 Learning Disabilities:100 Salaries 8,684,136 7,633,982 1,050,154 200 Employee Benefits 3,267,214 3,006,794 260,420 400 Supplies and Materials 500 618 (118)
128 Emotionally Handicapped: 100 Salaries 1,471,590 1,112,974 358,616 200 Employee Benefits 520,539 420,224 100,315 300 Purchased Services - 20,933 (20,933)
130 Pre-School Programs:132 Pre-School Handicapped Itinerant (5-Yr. Olds):
100 Salaries 1,488,270 1,508,354 (20,084) 200 Employee Benefits 627,534 620,357 7,177 400 Supplies and Materials 250 132 118
137 Pre-School Handicapped Self-Contained (3 & 4- Yr. Olds):
100 Salaries 288,413 248,948 39,465 200 Employee Benefits 124,944 114,312 10,632 400 Supplies and Materials - 9,948 (9,948)
139 Early Childhood Programs:100 Salaries 5,339,989 5,378,081 (38,092) 200 Employee Benefits 2,325,019 2,333,149 (8,130) 300 Purchased Services 1,765 1,050 715 400 Supplies and Materials 66,203 19,358 46,845
140 Special Programs:141 Gifted and Talented - Academic:
100 Salaries 2,820,003 2,757,606 62,397 200 Employee Benefits 1,082,472 1,078,529 3,943 300 Purchased Services 50,000 34,433 15,567
145 Homebound:100 Salaries 457,399 288,857 168,542 200 Employee Benefits 125,325 73,973 51,352 300 Purchased Services 50,000 23,795 26,205
148 Gifted and Talented - Artistic:100 Salaries - 120 (120) 200 Employee Benefits - 34 (34) 300 Purchased Services 98,775 74,834 23,941 400 Supplies and Materials 193,311 110,845 82,466 600 Other Objects 21,366 - 21,366
149 Other Special Programs:100 Salaries - 735 (735) 200 Employee Benefits - 206 (206)

CHARLESTON COUNTY SCHOOL DISTRICT SCHEDULE OF REVENUES, EXPENDITURES, AND CHANGES IN FUND BALANCE (CONTINUED)
REVISED BUDGET AND ACTUAL GENERAL FUND
YEAR ENDED JUNE 30, 2018
(90)
RevisedBudget Actual Variance
EXPENDITURES (CONTINUED)160 Other Exceptional Programs:
161 Autism:100 Salaries 944,284$ 734,937$ 209,347$ 200 Employee Benefits 410,336 314,581 95,755
162 Limited English Proficiency:100 Salaries 2,701,856 2,782,395 (80,539) 200 Employee Benefits 1,012,627 1,070,712 (58,085) 300 Purchased Services 29,000 8,283 20,717
170 Summer School Programs:172 Elementary Summer School:
100 Salaries 48,421 7,613 40,808 200 Employee Benefits 13,146 2,150 10,996 300 Purchased Services 1,600 1,590 10 400 Supplies and Materials 17,043 4,503 12,540
173 High School Summer School:100 Salaries 56,045 65,452 (9,407) 200 Employee Benefits 14,904 18,363 (3,459)
174 Gifted and Talented Summer School:100 Salaries 93,706 30,197 63,509 200 Employee Benefits 26,294 7,610 18,684
175 Instructional Programs Beyond Regular School Day:
100 Salaries 1,000 3,410 (2,410) 200 Employee Benefits 281 896 (615)
180 Adult/Continuing Educational Programs:181 Adult Basic Education Programs:
100 Salaries 31,935 32,004 (69) 200 Employee Benefits 8,528 9,051 (523) 300 Purchased Services 1,000 14,428 (13,428)
188 Parenting/Family Literacy:100 Salaries 30,148 27,247 2,901 200 Employee Benefits 15,323 11,699 3,624
190 Instructional Pupil Activity:100 Salaries 1,587,525 783,648 803,877 200 Employee Benefits 419,118 220,873 198,245
Total Instruction 239,750,350 227,624,303 12,126,047

CHARLESTON COUNTY SCHOOL DISTRICT SCHEDULE OF REVENUES, EXPENDITURES, AND CHANGES IN FUND BALANCE (CONTINUED)
REVISED BUDGET AND ACTUAL GENERAL FUND
YEAR ENDED JUNE 30, 2018
(91)
RevisedBudget Actual Variance
EXPENDITURES (CONTINUED)200 Support Services:
210 Pupil Services:211 Attendance and Social Work Services:
100 Salaries 198,916$ 195,138$ 3,778$ 140 Terminal Leave - 28,033 (28,033) 200 Employee Benefits 68,129 75,212 (7,083) 300 Purchased Services 168,845 149,002 19,843 400 Supplies and Materials 3,298 2,173 1,125
212 Guidance Services:100 Salaries 8,199,339 7,760,130 439,209 140 Terminal Leave - 27,875 (27,875) 200 Employee Benefits 3,134,953 3,064,987 69,966 300 Purchased Services 79,517 65,559 13,958 400 Supplies and Materials 4,350 10 4,340
213 Health Services:100 Salaries 3,490,075 3,433,623 56,452 140 Terminal Leave - 21,887 (21,887) 200 Employee Benefits 1,251,663 1,273,731 (22,068) 300 Purchased Services 164,010 72,175 91,835 400 Supplies and Materials 87,660 71,811 15,849 600 Other Objects 1,700 1,665 35
214 Psychological Services:100 Salaries 948,855 1,911,819 (962,964) 200 Employee Benefits 358,484 747,951 (389,467) 300 Purchased Services 69,600 152,708 (83,108) 400 Supplies and Materials 3,808 3,329 479
215 Exceptional Program Services: 100 Salaries 722,663 329,982 392,681 200 Employee Benefits 268,597 130,159 138,438 300 Purchased Services 41,500 8,553 32,947 400 Supplies and Materials 49,500 5,973 43,527
220 Instructional Staff Services:221 Improvement of Instruction-Curriculum Development:
100 Salaries 8,897,622 6,891,039 2,006,583 140 Terminal Leave - 146,988 (146,988) 180 Head of Organizational Unit Salaries - 188,713 (188,713) 200 Employee Benefits 3,197,633 2,508,426 689,207 280 Head of Organizational Unit Employee Benefits - 51,852 (51,852) 300 Purchased Services 2,006,522 1,361,115 645,407 400 Supplies and Materials 934,708 778,447 156,261 600 Other Objects 118,208 98,155 20,053
222 Library and Media Services:100 Salaries 4,510,101 4,351,339 158,762 200 Employee Benefits 1,716,899 1,629,147 87,752 300 Purchased Services - 89,639 (89,639) 400 Supplies and Materials 140,723 133,547 7,176 600 Other Objects 30,965 - 30,965

CHARLESTON COUNTY SCHOOL DISTRICT SCHEDULE OF REVENUES, EXPENDITURES, AND CHANGES IN FUND BALANCE (CONTINUED)
REVISED BUDGET AND ACTUAL GENERAL FUND
YEAR ENDED JUNE 30, 2018
(92)
RevisedBudget Actual Variance
EXPENDITURES (CONTINUED)223 Supervision of Special Programs:
100 Salaries 1,785,769$ 1,355,256$ 430,513$ 140 Terminal Leave - 67,307 (67,307) 200 Employee Benefits 693,094 524,608 168,486 300 Purchased Services 203,347 155,805 47,542 400 Supplies and Materials 56,716 52,534 4,182 600 Other Objects 1,833 1,368 465
224 Improvement of Instruction-Inservice and Staff Training:100 Salaries 54,556 598,569 (544,013) 140 Terminal Leave - 28,600 (28,600) 200 Employee Benefits 19,300 243,606 (224,306) 300 Purchased Services 27,186 6,749 20,437 400 Supplies and Materials 3,500 1,861 1,639 600 Other Objects 1,880 1,880 -
230 General Administrative Services:231 Board of Education:
100 Salaries 298,515 174,418 124,097 140 Terminal Leave - 39,451 (39,451) 180 Head of Organizational Unit Salaries - 148,578 (148,578) 200 Employee Benefits 104,456 74,395 30,061 280 Head of Organizational Unit Employee Benefits - 51,252 (51,252) 300 Purchased Services 627,462 426,549 200,913 318 Audit Services - 97,690 (97,690) 400 Supplies and Materials 31,646 22,962 8,684 600 Other Objects 53,476 48,660 4,816
232 Office of Superintendent:100 Salaries 376,697 387,367 (10,670) 140 Terminal Leave - 1,414 (1,414) 200 Employee Benefits 141,734 106,684 35,050 300 Purchased Services 39,684 35,604 4,080 400 Supplies and Materials 20,246 12,092 8,154 600 Other Objects 12,684 3,403 9,281
233 School Administration:100 Salaries 25,285,856 24,157,440 1,128,416 140 Terminal Leave - 257,179 (257,179) 200 Employee Benefits 9,263,274 9,216,884 46,390 300 Purchased Services 1,222,869 1,276,675 (53,806) 400 Supplies and Materials 436,604 412,949 23,655 600 Other Objects 36,339 29,655 6,684
250 Finance and Operations Services: 251 Student Transportation (Federal/District Mandated):
100 Salaries 50,000 - 50,000 200 Employee Benefits 12,575 - 12,575

CHARLESTON COUNTY SCHOOL DISTRICT SCHEDULE OF REVENUES, EXPENDITURES, AND CHANGES IN FUND BALANCE (CONTINUED)
REVISED BUDGET AND ACTUAL GENERAL FUND
YEAR ENDED JUNE 30, 2018
(93)
RevisedBudget Actual Variance
EXPENDITURES (CONTINUED)252 Fiscal Services:
100 Salaries 2,578,569$ 2,371,622$ 206,947$ 140 Terminal Leave - 59,864 (59,864) 180 Head of Organizational Unit Salaries 159,511 25,845 133,666 200 Employee Benefits 964,045 861,896 102,149 280 Head of Organizational Employee Benefits - 7,819 (7,819) 300 Purchased Services 275,905 137,323 138,582 380 Head of Organizational Unit Travel 3,600 561 3,039 400 Supplies and Materials 64,492 63,483 1,009 600 Other Objects 62,447 7,022 55,425
253 Facilities Acquisition and Construction:100 Salaries 46,503 10,259 36,244 180 Head of Organizational Unit Salaries - 37,661 (37,661) 200 Employee Benefits 13,487 4,014 9,473 280 Head of Organizational Employee Benefits - 10,122 (10,122) 300 Purchased Services 48,376 48,065 311 400 Supplies and Materials 1,200 1,433 (233) 600 Other Objects 351 351 -
254 Operation and Maintenance of Plant:100 Salaries 6,298,092 5,606,024 692,068 140 Terminal Leave - 63,753 (63,753) 200 Employee Benefits 2,429,136 2,240,003 189,133 300 Purchased Services 26,557,663 27,872,280 (1,314,617) 321 Public Utilities (Excludes Gas, Oil, Elec. And Other Heating Fuels) 1,992,900 1,733,873 259,027 400 Supplies and Materials 2,788,779 2,827,520 (38,741) 470 Energy (Includes Gas, Oil, Elec. and Other Heating Fuels) 13,814,650 13,509,870 304,780 500 Capital Outlay 189,039 222,884 (33,845) 600 Other Objects 347,772 344,439 3,333
255 Student Transportation (State Mandated):100 Salaries 515,175 554,662 (39,487) 140 Terminal Leave - 6,739 (6,739) 200 Employee Benefits 182,706 195,333 (12,627) 300 Purchased Services 19,762,606 20,214,859 (452,253) 400 Supplies and Materials 180,000 258,468 (78,468)
257 Internal Services:100 Salaries 1,002,173 918,424 83,749 140 Terminal Leave - 7,370 (7,370) 200 Employee Benefits 403,095 356,949 46,146 300 Purchased Services 1,799,410 2,187,954 (388,544) 400 Supplies and Materials 94,447 86,758 7,689 600 Other Objects 4,336 3,514 822
258 Security:100 Salaries 583,408 559,925 23,483 200 Employee Benefits 215,088 215,221 (133) 300 Purchased Services 1,503,672 1,453,040 50,632 400 Supplies and Materials 92,566 83,997 8,569 600 Other Objects 176 176 -

CHARLESTON COUNTY SCHOOL DISTRICT SCHEDULE OF REVENUES, EXPENDITURES, AND CHANGES IN FUND BALANCE (CONTINUED)
REVISED BUDGET AND ACTUAL GENERAL FUND
YEAR ENDED JUNE 30, 2018
(94)
RevisedBudget Actual Variance
EXPENDITURES (CONTINUED)259 Internal Auditing Services:
100 Salaries 440,875$ 392,848$ 48,027$ 140 Terminal Leave - 4,282 (4,282) 200 Employee Benefits 143,741 143,306 435 300 Purchased Services 268,490 32,067 236,423 380 Head of Organizational Unit Travel 2,600 1,424 1,176 400 Supplies and Materials 5,534 2,289 3,245 480 Head of Organizational Unit Supplies 11 11 600 Other Objects 1,050 735 315
260 Central Support Services: 262 Planning, Research, Development, and Evaluation:
100 Salaries 1,440,180 1,150,936 289,244 140 Terminal Leave - 12,384 (12,384) 180 Head of Organizational Unit Salaries 140,000 51,470 88,530 200 Employee Benefits 536,963 417,690 119,273 280 Head of Organizational Employee Benefits - 15,766 (15,766) 300 Purchased Services 400,372 162,845 237,527 400 Supplies and Materials 25,044 39,619 (14,575) 500 Capital Outlay - 24,037 (24,037) 600 Other Objects 1,800 2,156 (356)
263 Information Services: 100 Salaries 604,686 528,684 76,002 140 Terminal Leave - 14,160 (14,160) 180 Head of Organizational Unit Salaries 130,588 131,808 (1,220) 200 Employee Benefits 231,251 210,355 20,896 280 Head of Organizational Employee Benefits 29,692 37,059 (7,367) 300 Purchased Services 878,660 802,225 76,435 400 Supplies and Materials 122,283 145,433 (23,150) 600 Other Objects 5,528 4,433 1,095
264 Staff Services: 100 Salaries 3,650,391 3,154,510 495,881 140 Terminal Leave - 57,452 (57,452) 180 Head of Organizational Unit Salaries 151,644 150,643 1,001 200 Employee Benefits 2,330,535 1,664,986 665,549 280 Head of Organizational Employee Benefits - 45,984 (45,984) 300 Purchased Services 650,848 436,472 214,376 380 Head of Organizational Unit Travel 10,000 8,075 1,925 400 Supplies and Materials 96,304 50,302 46,002 480 Head of Organizational Unit Supplies 2,000 1,243 757 500 Capital Outlay 1,152 - 1,152 600 Other Objects 1,234,233 1,061,949 172,284
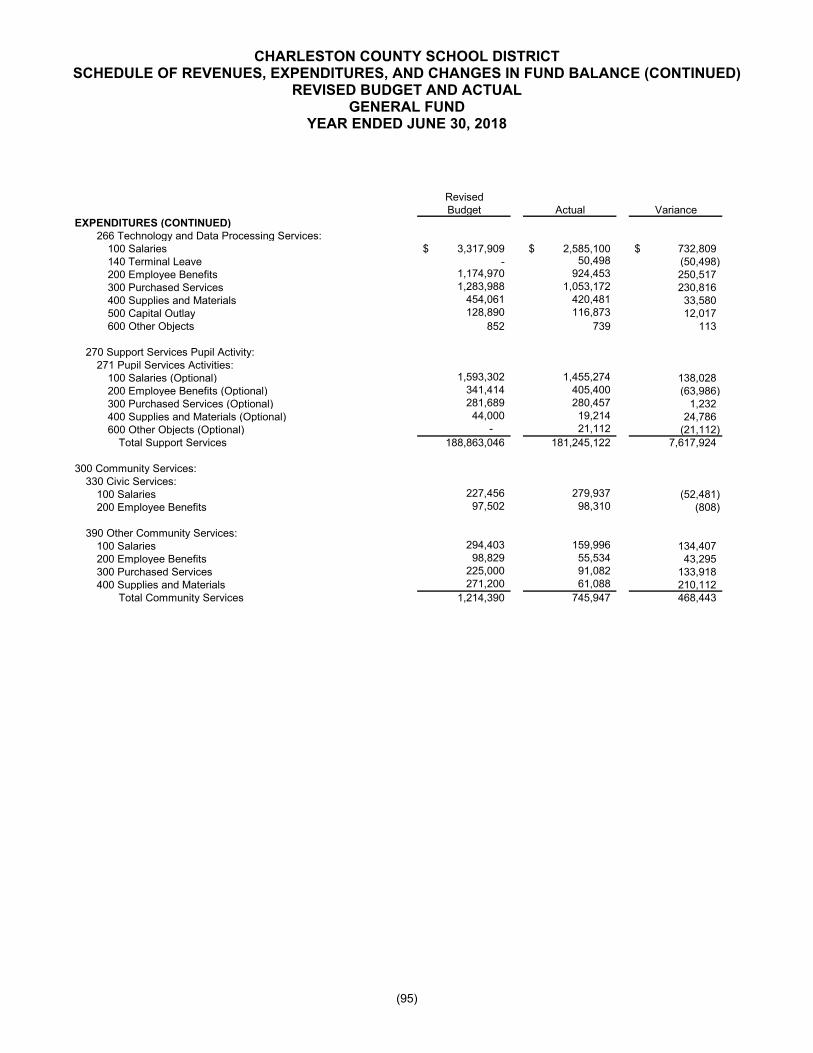
CHARLESTON COUNTY SCHOOL DISTRICT SCHEDULE OF REVENUES, EXPENDITURES, AND CHANGES IN FUND BALANCE (CONTINUED)
REVISED BUDGET AND ACTUAL GENERAL FUND
YEAR ENDED JUNE 30, 2018
(95)
RevisedBudget Actual Variance
EXPENDITURES (CONTINUED)266 Technology and Data Processing Services:
100 Salaries 3,317,909$ 2,585,100$ 732,809$ 140 Terminal Leave - 50,498 (50,498) 200 Employee Benefits 1,174,970 924,453 250,517 300 Purchased Services 1,283,988 1,053,172 230,816 400 Supplies and Materials 454,061 420,481 33,580 500 Capital Outlay 128,890 116,873 12,017 600 Other Objects 852 739 113
270 Support Services Pupil Activity:271 Pupil Services Activities:
100 Salaries (Optional) 1,593,302 1,455,274 138,028 200 Employee Benefits (Optional) 341,414 405,400 (63,986) 300 Purchased Services (Optional) 281,689 280,457 1,232 400 Supplies and Materials (Optional) 44,000 19,214 24,786 600 Other Objects (Optional) - 21,112 (21,112)
Total Support Services 188,863,046 181,245,122 7,617,924
300 Community Services: 330 Civic Services:
100 Salaries 227,456 279,937 (52,481) 200 Employee Benefits 97,502 98,310 (808)
390 Other Community Services:100 Salaries 294,403 159,996 134,407 200 Employee Benefits 98,829 55,534 43,295 300 Purchased Services 225,000 91,082 133,918 400 Supplies and Materials 271,200 61,088 210,112
Total Community Services 1,214,390 745,947 468,443

CHARLESTON COUNTY SCHOOL DISTRICT SCHEDULE OF REVENUES, EXPENDITURES, AND CHANGES IN FUND BALANCE (CONTINUED)
REVISED BUDGET AND ACTUAL GENERAL FUND
YEAR ENDED JUNE 30, 2018
(96)
RevisedBudget Actual Variance
EXPENDITURES (CONTINUED)400 Other Charges:
410 Intergovernmental Expenditures:412 Payments to Other Governmental Units:
720 Transits 313,200$ 179,733$ 133,467$ 416 Payments to Public Charter Schools:
720 Transits 39,437,723 40,996,431 (1,558,708) 417 Payments to Nonprofit Entities (Other Than for First Steps):
720 Transits 4,700,000 5,895,812 (1,195,812) Total Intergovernmental Expenditures 44,450,923 47,071,976 (2,621,053)
500 Debt Service:620 Interest 100,000 427,566 (327,566)
Total Expenditures 474,378,709 457,114,914 17,263,795
OTHER FINANCING SOURCES (USES)Interfund Transfers from (to) Other Funds:
5230 Transfer from Special Revenue EIA Fund 9,878,785 10,124,778 245,993 5280 Transfer from Other Funds Indirect Costs 3,005,121 3,186,669 181,548 421-710 Transfer to Special Revenue Fund (235,000) (235,000) - 425-710 Transfer to Food Service Fund (825,000) (825,000) -
Total Other Financing Sources 11,823,906 12,251,447 427,541
EXCESS OF REVENUES AND EXPENDITURES 7,500,015 28,091,649 20,591,634
Fund Balance - Beginning of Year 42,059,145 42,059,145 -
FUND BALANCE - END OF YEAR 49,559,160$ 70,150,794$ 20,591,634$

CHARLESTON COUNTY SCHOOL DISTRICT SCHEDULE OF REVENUES, EXPENDITURES, AND CHANGES IN FUND BALANCE
SPECIAL REVENUE FUND YEAR ENDED JUNE 30, 2018
(97)
Other Other
Preschool Designated SpecialTitle I IDEA Handicapped CATE Adult Restricted Revenue
(BA Projects) (CA Projects) (CG Projections) (VA Projects) Education State Grants Programs(201/202) (203/204) (205/206) (207/208) (EA Projects) (900s) (200s/800s) Totals
REVENUES1000 Revenue from Local Sources:
1300 Tuition:1310 Tuition from Patrons for Regular Day School -$ -$ -$ -$ -$ 25,220$ -$ 25,220$
1900 Other Revenue from Local Sources:1910 Rentals - - - - - - 5,100 5,100 1920 Contributions and Donations Private Sources - - - - - - 976,614 976,614 1930 Medicaid - - - - - - 2,337,851 2,337,851 1990 Miscellaneous Local Revenue:
1999 Revenue from Other Local Sources - - - - - - 9,812,262 9,812,262 Total Revenue from Local Sources - - - - - 25,220 13,131,827 13,157,047
3000 Revenue from State Sources:3100 Restricted State Funding:
3110 Occupational Education:3118 EEDA Career Specialist - - - - - 2,357,650 - 2,357,650 3120 General Education:
3127 Student Health and Fitness - PE - - - - - 478,741 - 478,741 Teachers
3136 Student Health and Fitness - Nurses - - - - - 1,468,339 - 1,468,339 3156 Adult Education - - - - - 53,239 53,239 3177 Summer Reading Camps - - - - - 395,972 - 395,972 3190 Miscellaneous Restricted State Grants:
3193 Education License Plates - - - - - 4,977 - 4,977 3199 Other Restricted State Grants - - - - - - 19,531 19,531
3630 K-12 Technology Initiative - - - - - 1,518,239 - 1,518,239 3900 Other State Revenue:
3999 Revenue from Other State Sources - - - - - - 71,069 71,069 Total Revenue from State Sources - - - - - 6,277,157 90,600 6,367,757

CHARLESTON COUNTY SCHOOL DISTRICT SCHEDULE OF REVENUES, EXPENDITURES, AND CHANGES IN FUND BALANCE (CONTINUED)
SPECIAL REVENUE FUND YEAR ENDED JUNE 30, 2018
(98)
Other Other
Preschool Designated SpecialTitle I IDEA Handicapped CATE Adult Restricted Revenue
(BA Projects) (CA Projects) (CG Projections) (VA Projects) Education State Grants Programs(201/202) (203/204) (205/206) (207/208) (EA Projects) (900s) (200s/800s) Totals
REVENUES (CONTINUED)4000 Revenue from Federal Sources:
4200 Occupational Education:4210 Perkins Aid, Title I -$ -$ -$ 846,839$ -$ -$ -$ 846,839$
4300 Elementary and Secondary Education Act of 1965 (ESEA):
4310 Title I, Basic State Grant Programs 16,195,197 - - - - - 1,173,163 17,368,360 (Carryover Provision)4314 School Improvement Grant - - - - - - 2,753,043 2,753,043 4341 Language Instruction for Limited English - - - - - - 231,064 231,064 Proficient and Immigrant Students, Title III (Carryover Provision)4343 McKinney-Vento - - - - - - 69,316 69,316 4351 Improving Teacher Quality (Carryover - - - - - - 2,566,664 2,566,664 Provision)
4400 Adult Education:4410 Basic Adult Education - - - - 212,488 - - 212,488 4430 State Literacy Resource - - - - 7,051 - - 7,051
4500 Programs for Children with Disabilities:4510 Individuals with Disabilities Education - 8,828,541 - - - - - 8,828,541 Act (IDEA) (Carryover Provision)4520 Preschool Grants (IDEA) (Carryover - - 226,539 - - - - 226,539 Provision)4560 IDEA - SSIP - - - - - - 213,923 213,923
4900 Other Federal Sources:4924 21st Century Community Learning Center - - - - - - 845,577 845,577 Program (Title IV, 21st Century Schools)4999 Revenue from Other Federal Sources - - - - - - 11,580,212 11,580,212
Total Revenue from Federal Sources 16,195,197 8,828,541 226,539 846,839 219,539 - 19,432,962 45,749,617
Total Revenue All Sources 16,195,197 8,828,541 226,539 846,839 219,539 6,302,377 32,655,389 65,274,421

CHARLESTON COUNTY SCHOOL DISTRICT SCHEDULE OF REVENUES, EXPENDITURES, AND CHANGES IN FUND BALANCE (CONTINUED)
SPECIAL REVENUE FUND YEAR ENDED JUNE 30, 2018
(99)
Other Other
Preschool Designated SpecialTitle I IDEA Handicapped CATE Adult Restricted Revenue
(BA Projects) (CA Projects) (CG Projections) (VA Projects) Education State Grants Programs(201/202) (203/204) (205/206) (207/208) (EA Projects) (900s) (200s/800s) Totals
EXPENDITURES100 Instruction:
110 General Instruction:111 Kindergarten Program:
100 Salaries 21,349$ -$ -$ -$ -$ -$ -$ 21,349$ 200 Employee Benefits 6,137 - - - - - - 6,137 400 Supplies and Materials - - - - - 298 - 298
112 Primary Programs:100 Salaries 822,759 - - - - - 659,662 1,482,421 200 Employee Benefits 350,651 - - - - - 230,808 581,459 300 Purchased Services 700 - - - - - 30,035 30,735 400 Supplies and Materials 13,826 - - - - 875 185,217 199,918 500 Capital Outlay - - - - - - 60 60
113 Elementary Programs:100 Salaries 2,542,731 - - - - 323,063 873,265 3,739,059 200 Employee Benefits 1,005,953 - - - - 126,307 328,231 1,460,491 300 Purchased Services 271,318 - - - - - 510,782 782,100 400 Supplies and Materials 832,643 - - - - 2,908 859,068 1,694,619 500 Capital Outlay - - - - - - 5,457 5,457
114 High School Programs:100 Salaries 825,447 - - - - - 927,015 1,752,462 200 Employee Benefits 270,354 - - - - - 28,381 298,735 300 Purchased Services 43,228 - - - - - 70,086 113,314 400 Supplies and Materials 92,556 - - - - 896 135,280 228,732
115 Vocational Programs:100 Salaries - 14,585 - 8,934 - - 15,559 39,078 200 Employee Benefits - 9,628 - 2,507 - - 4,333 16,468 300 Purchased Services - - - 18,304 - - 9,396 27,700 400 Supplies and Materials - - - 439,627 - - 27,647 467,274
118 Montessori Programs:400 Supplies and Materials - - - - - - 425 425
120 Exceptional Programs:121 Educable Mentally Handicapped:
100 Salaries - 649,219 - - - - 12,152 661,371 200 Employee Benefits - 251,559 - - - - 3,402 254,961 400 Supplies and Materials - 4,511 - - - - - 4,511

CHARLESTON COUNTY SCHOOL DISTRICT SCHEDULE OF REVENUES, EXPENDITURES, AND CHANGES IN FUND BALANCE (CONTINUED)
SPECIAL REVENUE FUND YEAR ENDED JUNE 30, 2018
(100)
Other Other Preschool Designated Special
Title I IDEA Handicapped CATE Adult Restricted Revenue(BA Projects) (CA Projects) (CG Projections) (VA Projects) Education State Grants Programs
(201/202) (203/204) (205/206) (207/208) (EA Projects) (900s) (200s/800s) TotalsEXPENDITURES (CONTINUED)
122 Trainable Mentally Handicapped:100 Salaries -$ 252,387$ -$ -$ -$ -$ 3,930$ 256,317$ 200 Employee Benefits - 120,320 - - - - 1,102 121,422 300 Purchased Services - 3,030 - - - - - 3,030 400 Supplies and Materials - 6,721 - - - - - 6,721
123 Orthopedically Handicapped:100 Salaries - 30,047 - - - - 30,047 200 Employee Benefits - 10,812 - - - - - 10,812
124 Visually Handicapped:300 Purchased Services - 2,202 - - - - - 2,202
125 Hearing Handicapped:300 Purchased Services - 5,679 - - - - - 5,679 400 Supplies and Materials - - - - - - 332 332
126 Speech Handicapped:100 Salaries - 131,865 - - - - 655 132,520 200 Employee Benefits - 52,993 - - - - 268 53,261 300 Purchased Services - 3,116 - - - - - 3,116 400 Supplies and Materials - 6,294 - - - - 6,294
127 Learning Disabilities:100 Salaries - 1,674,738 - - - - 26,748 1,701,486 200 Employee Benefits - 638,982 - - - - 7,445 646,427 300 Purchased Services - 74,371 - - - - - 74,371 400 Supplies and Materials - 81,937 - - - - 404 82,341
129 Coordinated Early Intervening Services (CEIS):100 Salaries - - - - - - 45,022 45,022 200 Employee Benefits - - - - - - 17,134 17,134 300 Purchased Services - - - - - - 4,926 4,926 400 Supplies and Materials - - - - - - 66,012 66,012
130 Pre-School Programs:132 Pre-School Handicapped Itinerant (5-Yr. Olds):
100 Salaries - 129,270 79,883 - - - - 209,153 200 Employee Benefits - 60,889 33,426 - - - - 94,315 300 Purchased Services - 1,763 - - - - - 1,763 400 Supplies and Materials - - 33,527 - - - - 33,527
136 Preschool Handicapped Itinerant (3- and 4- Yr.-Olds:300 Purchased Services - - 6,380 - - - - 6,380 400 Supplies and Materials - - 9,930 - - - - 9,930
139 Early Childhood Programs:100 Salaries 99,249 - - - - 19,645 2,590,150 2,709,044 200 Employee Benefits 16,986 - - - - 5,512 1,104,044 1,126,542 300 Purchased Services - - - - - 63 43,234 43,297 400 Supplies and Materials 7,648 - - - - - 93,206 100,854 600 Other Objects - - - - - - 28 28

CHARLESTON COUNTY SCHOOL DISTRICT SCHEDULE OF REVENUES, EXPENDITURES, AND CHANGES IN FUND BALANCE (CONTINUED)
SPECIAL REVENUE FUND YEAR ENDED JUNE 30, 2018
(101)
Other Other
Preschool Designated SpecialTitle I IDEA Handicapped CATE Adult Restricted Revenue
(BA Projects) (CA Projects) (CG Projections) (VA Projects) Education State Grants Programs(201/202) (203/204) (205/206) (207/208) (EA Projects) (900s) (200s/800s) Totals
EXPENDITURES (CONTINUED)140 Special Programs:
141 Gifted and Talented Academic:100 Salaries -$ -$ -$ -$ -$ -$ 4,536$ 4,536$ 200 Employee Benefits - - - - - - 1,272 1,272
149 Other Special Programs:400 Supplies and Materials - 753 958 - - - - 1,711
160 Other Exceptional Programs:161 Autism:
100 Salaries - 149,812 - - - - 472 150,284 200 Employee Benefits - 70,483 - - - - 132 70,615 300 Purchased Services - 12,634 - - - - - 12,634
162 Limited English Proficiency:100 Salaries - - - - - - 62,491 62,491 200 Employee Benefits - - - - - - 30,607 30,607 400 Supplies and Materials - - - - - - 5,825 5,825
170 Summer School Programs:171 Primary Summer School:
100 Salaries 56,033 - - - - 224,893 15,855 296,781 200 Employee Benefits 14,964 - - - - 63,080 3,712 81,756 300 Purchased Services 1,438,430 - - - - 70,930 30,766 1,540,126 400 Supplies and Materials 2,438 - - - - 16,482 1,819 20,739
172 Elementary Summer School:100 Salaries 28,990 - - - - 13,145 188,958 231,093 200 Employee Benefits 7,821 - - - - 3,528 52,583 63,932 300 Purchased Services - - - - - - 83,289 83,289 400 Supplies and Materials - - - - - - 5,078 5,078
173 High School Summer School:100 Salaries 79,474 - - - - - 78,506 157,980 200 Employee Benefits 18,554 - - - - - 22,028 40,582
174 Gifted and Talented Summer School:100 Salaries - - - - - - 92,551 92,551 200 Employee Benefits - - - - - - 24,034 24,034 300 Purchased Services - - - - - - 42,727 42,727 400 Supplies and Materials - - - - - - 28,577 28,577

CHARLESTON COUNTY SCHOOL DISTRICT SCHEDULE OF REVENUES, EXPENDITURES, AND CHANGES IN FUND BALANCE (CONTINUED)
SPECIAL REVENUE FUND YEAR ENDED JUNE 30, 2018
(102)
Other Other
Preschool Designated SpecialTitle I IDEA Handicapped CATE Adult Restricted Revenue
(BA Projects) (CA Projects) (CG Projections) (VA Projects) Education State Grants Programs(201/202) (203/204) (205/206) (207/208) (EA Projects) (900s) (200s/800s) Totals
EXPENDITURES (CONTINUED)170 Summer School Programs (Continued):
175 Instructional Programs Beyond Regular School Day: 100 Salaries
100 Salaries 180,884$ -$ -$ -$ -$ -$ 721,282$ 902,166$ 200 Employee Benefits 50,630 - - - - - 188,347 238,977 300 Purchased Services - - - - - - 323,936 323,936 400 Supplies and Materials - - - - - - 34,001 34,001
180 Adult/Continuing Educational Programs:181 Adult Basic Education Programs:
100 Salaries - - - - 106,101 - 47,701 153,802 200 Employee Benefits - - - - 40,352 - 13,023 53,375
182 Adult Secondary Education Programs:100 Salaries - - - - - 13,275 93,779 107,054 200 Employee Benefits - - - - - 3,725 27,443 31,168 300 Purchased Services - - - - - - 4,604 4,604 400 Supplies and Materials - - - - - - 13,436 13,436
183 Adult English Literacy (ESL):100 Salaries - - - - 45,000 - 7,276 52,276 200 Employee Benefits - - - - 12,627 - 1 12,628 300 Purchased Services - - - - 1,701 - - 1,701 400 Supplies and Materials - - - - 5,071 - 274 5,345
188 Parenting/Family Literacy:100 Salaries 1,278,342 - - - - - 154,832 1,433,174 200 Employee Benefits 517,765 - - - - - 50,284 568,049 300 Purchased Services 86,302 - - - - - 112,237 198,539 400 Supplies and Materials 136,210 7,489 143,699 600 Other Objects 34,700 - - - - - - 34,700 Total Instruction 11,155,072 4,450,600 164,104 469,372 210,852 888,625 11,496,664 28,835,289

CHARLESTON COUNTY SCHOOL DISTRICT SCHEDULE OF REVENUES, EXPENDITURES, AND CHANGES IN FUND BALANCE (CONTINUED)
SPECIAL REVENUE FUND YEAR ENDED JUNE 30, 2018
(103)
Other Other
Preschool Designated SpecialTitle I IDEA Handicapped CATE Adult Restricted Revenue
(BA Projects) (CA Projects) (CG Projections) (VA Projects) Education State Grants Programs(201/202) (203/204) (205/206) (207/208) (EA Projects) (900s) (200s/800s) Totals
EXPENDITURES (CONTINUED)200 Support Services:
210 Pupil Services:211 Attendance and Social Work Services:
100 Salaries -$ -$ -$ -$ -$ -$ 629,064$ 629,064$ 200 Employee Benefits - - - - - - 248,757 248,757 300 Purchased Services - - - - - - 33,247 33,247 400 Supplies and Materials - - - - - - 13,606 13,606
212 Guidance Services:100 Salaries - - - 81,965 - 1,605,894 279,487 1,967,346 200 Employee Benefits - - - 33,643 - 610,297 111,887 755,827 300 Purchased Services - - - 6,683 - - 136,289 142,972 400 Supplies and Materials - - - 1,717 - - 32,567 34,284 600 Other Objects - - - - - - 285 285
213 Health Services:100 Salaries 5,525 - - - - 996,302 617,004 1,618,831 200 Employee Benefits 1,651 - - - - 396,545 240,746 638,942 300 Purchased Services 13,734 - - - - - 49,539 63,273 400 Supplies and Materials - - - - - - 11,478 11,478
214 Psychological Services:100 Salaries 977 36,889 - - - - 90,125 127,991 200 Employee Benefits 274 13,063 - - - - 36,077 49,414 300 Purchased Services 288,673 5,199 - - - - 19,011 312,883 400 Supplies and Materials - 28,321 - - - - - 28,321
215 Exceptional Program Services:100 Salaries - 1,266,592 - - - - - 1,266,592 200 Employee Benefits - 482,486 - - - - - 482,486 300 Purchased Services - 76,618 - - - - 60,574 137,192 400 Supplies and Materials - 146,455 - - - - - 146,455

CHARLESTON COUNTY SCHOOL DISTRICT SCHEDULE OF REVENUES, EXPENDITURES, AND CHANGES IN FUND BALANCE (CONTINUED)
SPECIAL REVENUE FUND YEAR ENDED JUNE 30, 2018
(104)
Other Other
Preschool Designated SpecialTitle I IDEA Handicapped CATE Adult Restricted Revenue
(BA Projects) (CA Projects) (CG Projections) (VA Projects) Education State Grants Programs(201/202) (203/204) (205/206) (207/208) (EA Projects) (900s) (200s/800s) Totals
EXPENDITURES (CONTINUED)220 Instructional Staff Services:
221 Improvement of Instruction - Curriculum Development:
100 Salaries 1,206,015$ 61,168$ -$ 15,049$ -$ 2,000$ 472,275$ 1,756,507$ 140 Terminal Leave - - - - - - 5,041 5,041 200 Employee Benefits 425,926 20,009 - 4,186 - 558 159,415 610,094 300 Purchased Services 665,756 7,852 - 180,974 - - 371,154 1,225,736 400 Supplies and Materials 19,124 50,922 - - - - 99,923 169,969 600 Other Objects - - - - - - 2,661 2,661
222 Library and Media:400 Supplies and Materials - - - - - - 2,740 2,740
223 Supervision of Special Programs:100 Salaries 494,392 791,362 33,048 - - 28,298 838,741 2,185,841 200 Employee Benefits 184,615 305,445 20,029 - - 7,941 280,097 798,127 300 Purchased Services 94,528 68,888 - - - - 107,207 270,623 400 Supplies and Materials 384,035 6,121 - - - - 34,889 425,045
224 Improvement of Instruction - Inservice and Staff Training:
100 Salaries - - - - - 1,320 1,190,179 1,191,499 200 Employee Benefits - - - - - 365 302,785 303,150 300 Purchased Services - - - - - 92,317 1,276,343 1,368,660 400 Supplies and Materials - - - - - 1,520,540 85,310 1,605,850 600 Other Objects - - - - - - 300 300
232 Office of the Superintendent:400 Supplies and Materials - - - - - - 73 73 600 Other Objects - - - - - - 12,979 12,979

CHARLESTON COUNTY SCHOOL DISTRICT SCHEDULE OF REVENUES, EXPENDITURES, AND CHANGES IN FUND BALANCE (CONTINUED)
SPECIAL REVENUE FUND YEAR ENDED JUNE 30, 2018
(105)
Other Other
Preschool Designated SpecialTitle I IDEA Handicapped CATE Adult Restricted Revenue
(BA Projects) (CA Projects) (CG Projections) (VA Projects) Education State Grants Programs(201/202) (203/204) (205/206) (207/208) (EA Projects) (900s) (200s/800s) Totals
EXPENDITURES (CONTINUED)230 General Administration Services:
233 School Administration:100 Salaries -$ -$ -$ -$ -$ -$ 109,328$ 109,328$ 200 Employee Benefits - - - - - - 30,669 30,669 300 Purchased Services - - - - - - 26,548 26,548 400 Supplies and Materials - - - - - - 17,383 17,383 600 Other Objects - - - - - - 255 255
250 Finance and Operations Services:251 Student Transportation (Federal/District Mandated):
100 Salaries - - - - - - 14,940 14,940 200 Employee Benefits - - - - - - 4,108 4,108 300 Purchased Services 111,442 - - - - - 151,158 262,600 400 Supplies and Materials - - - - - - 1,093 1,093
252 Fiscal Services:100 Salaries - - - - - - 75,225 75,225 200 Employee Benefits - - - - - - 27,844 27,844 300 Purchased Services - - - - - - 22,000 22,000
253 Facilities Acquisition and Construction:300 Purchased Services - - - - - - 32,314 32,314 400 Supplies and Materials - - - - - - 114,575 114,575
254 Operation and Maintenance of Plant:300 Purchased Services - - - - - - 344,440 344,440
321 Public Utilities (Exclude Gas, Oil, Electric a - - - - - - 4,418 4,418 400 Supplies and Materials - - - - - - 73,572 73,572 470 Energy (Electric, Gas, and Other) - - - - - - 15,689 15,689
255 Student Transportation (State Mandated):300 Purchased Services - 35,653 - - - - 43,645 79,298

CHARLESTON COUNTY SCHOOL DISTRICT SCHEDULE OF REVENUES, EXPENDITURES, AND CHANGES IN FUND BALANCE (CONTINUED)
SPECIAL REVENUE FUND YEAR ENDED JUNE 30, 2018
(106)
Other Other
Preschool Designated SpecialTitle I IDEA Handicapped CATE Adult Restricted Revenue
(BA Projects) (CA Projects) (CG Projections) (VA Projects) Education State Grants Programs(201/202) (203/204) (205/206) (207/208) (EA Projects) (900s) (200s/800s) Totals
EXPENDITURES (CONTINUED)257 Internal Services:
100 Salaries -$ -$ -$ -$ -$ -$ 216$ 216$ 200 Employee Benefits - - - - - - 61 61
258 Security:300 Purchased Services - - - - - - 6,720 6,720
260 Central Support Services:262 Planning:
300 Purchased Services - - - - - - 810 810 400 Supplies and Materials - - - - - - 255 255
263 Information Services:100 Salaries - - - - - - 58,925 58,925 200 Employee Benefits - - - - - - 21,124 21,124
264 Staff Services:100 Salaries - - - - - - 193,946 193,946 200 Employee Benefits - - - - - - 71,616 71,616 300 Purchased Services - - - - - - 11,230 11,230 400 Supplies and Materials - - - - - - 1,321 1,321
266 Technology and Data Processing Services:100 Salaries - - - - - - 208,158 208,158 140 Terminal Leave - - - - - - 5,955 5,955 200 Employee Benefits - - - - - - 80,819 80,819 300 Purchased Services - - - - - - 9,932 9,932 400 Supplies and Materials - - - - - - 729 729 600 Other Objects - - - - - - 24,334 24,334
270 Support Services - Pupil Activity: 271 Pupil Services Activities:
300 Purchased Services 62,731 - - 3,909 - - 73,625 140,265 400 Supplies and Materials 316 - - - - - 54 370
Total Support Services 3,959,714 3,403,043 53,077 328,126 - 5,262,377 9,730,889 22,737,226

CHARLESTON COUNTY SCHOOL DISTRICT SCHEDULE OF REVENUES, EXPENDITURES, AND CHANGES IN FUND BALANCE (CONTINUED)
SPECIAL REVENUE FUND YEAR ENDED JUNE 30, 2018
(107)
Other Other
Preschool Designated SpecialTitle I IDEA Handicapped CATE Adult Restricted Revenue
(BA Projects) (CA Projects) (CG Projections) (VA Projects) Education State Grants Programs(201/202) (203/204) (205/206) (207/208) (EA Projects) (900s) (200s/800s) Totals
EXPENDITURES (CONTINUED)300 Community Services:
350 Custody and Care of Children:100 Salaries -$ -$ -$ -$ -$ -$ 5,917,455$ 5,917,455$ 200 Employee Benefits - - - - - - 1,615,716 1,615,716 300 Purchased Services - - - - - - 858,755 858,755 400 Supplies and Materials - - - - - - 598,744 598,744 600 Other Objects - - - - - - 1,120 1,120
370 Non Public School Services:300 Purchased Services - - - - - - 25,499 25,499
390 Other Community Services:100 Salaries - - - - - - 183 183 200 Employee Benefits - - - - - - 41 41 300 Purchased Services - - - - - - 443 443 400 Supplies and Materials - - - - - - 243 243
Total Community Services - - - - - - 9,018,199 9,018,199
410 Intergovernmental Expenditures: 411 Payments to SDE
720 Transits - - - - - - 564,840 564,840 416 Payments to Public Charter Schools
720 Transits 198,667 650,001 - 18,380 - 333,982 87,826 1,288,856 417 Payments to Nonprofit Entities (Other Than for First Steps)
720 Transits 259,015 - - - - - - 259,015 Total Intergovernmental Expenditures 457,682 650,001 - 18,380 - 333,982 652,666 2,112,711
Total Expenditures 15,572,468 8,503,644 217,181 815,878 210,852 6,484,984 30,898,418 62,703,425

CHARLESTON COUNTY SCHOOL DISTRICT SCHEDULE OF REVENUES, EXPENDITURES, AND CHANGES IN FUND BALANCE (CONTINUED)
SPECIAL REVENUE FUND YEAR ENDED JUNE 30, 2018
(108)
Other Other
Preschool Designated SpecialTitle I IDEA Handicapped CATE Adult Restricted Revenue
(BA Projects) (CA Projects) (CG Projections) (VA Projects) Education State Grants Programs(201/202) (203/204) (205/206) (207/208) (EA Projects) (900s) (200s/800s) Totals
OTHER FINANCING SOURCES (USES)5300 Sale of Fixed Assets -$ -$ -$ -$ -$ -$ 16,938$ 16,938$
Interfund Transfers, from (to) Other Funds:5210 Transfer from General Fund (Exclude Indirect Costs) - - - - - - 235,000 235,000 5220 Transfer from Special Revenue Fund (Exclude Indirect Costs) - - - - - 182,607 37,817 220,424 421-710 Transfer to Special Revenue Fund - - - - - - (124,115) (124,115) 431-791 Special Revenue Fund Indirect Costs (Use Only for Transfer of Indirect Costs to General Fund) (622,729) (324,897) (9,358) (30,961) (8,687) - (742,161) (1,738,793)
Total Other Financing Sources (Uses) (622,729) (324,897) (9,358) (30,961) (8,687) 182,607 (576,521) (1,390,546)
EXCESS OF REVENUES AND EXPENDITURES - - - - - - 1,180,450 1,180,450
Fund Balance - Beginning of Year - - - - - - 2,073,702 2,073,702
FUND BALANCE - END OF YEAR -$ -$ -$ -$ -$ -$ 3,254,152$ 3,254,152$

CHARLESTON COUNTY SCHOOL DISTRICT SUMMARY SCHEDULE FOR OTHER DESIGNATED RESTRICTED STATE GRANTS
SPECIAL REVENUE FUND YEAR ENDED JUNE 30, 2018
(109)
Special
Interfund Other Fund Revenue FundTransfers Transfers Unearned
Subfund Revenue Programs Revenues Expenditures In (Out) In (Out) Revenue
918 3198 Technology Professional Development -$ 96,310$ -$ 96,310$ -$ 919 3193 Education License Plates 4,977 4,977 - - - 926 3177 Summer Reading Camps 395,972 395,972 - - - 928 3118 EEDA Career Specialists 2,357,650 2,357,650 - - - 936 3136 Student Health and Fitness - Nurses 1,468,339 1,554,636 86,297 - - 937 3127 Student Health and Fitness - PE Teachers 478,741 478,741 - - - 956 3156 Adult Education 53,239 53,239 - - - 963 3630 K-12 Technology Initiative 1,518,239 1,518,239 - - - 980 1310 Early Childhood 25,220 25,220 - - -
Total 6,302,377$ 6,484,984$ 86,297$ 96,310$ -$
Special Revenue

CHARLESTON COUNTY SCHOOL DISTRICT COMBINING SCHEDULE OF REVENUES, EXPENDITURES, AND
CHANGES IN FUND BALANCE – ALL PROGRAMS SPECIAL REVENUE FUND – EDUCATION IMPROVEMENT ACT
YEAR ENDED JUNE 30, 2018
(110)
ActualREVENUES3000 Revenue from State Sources:
3500 Education Improvement Act:3502 Assisting, Developing, and Evaluating Professional Teaching (ADEPT) 61,804$ 3507 Aid to Districts – Technology 137,622 3509 Arts in Education 18,813 3511 Professional Development 404,723 3512 Technology Professional Development 96,310 3518 Adoption List of Formative Assessment 27,183 3519 Grade 10 Assessments 190,236 3525 Career and Technology Education Equipment 86,398 3526 Refurbishment of K-8 Science Kits 135,971 3528 Industry Certifications/Credentials 69,089 3529 Career and Technology Education 906,036 3532 National Board Certification (NBC) Salary Supplement (No Carryover Provision) 2,706,367 3533 Teacher of the Year Awards (No Carryover Provision) 1,077 3535 Reading Coaches 2,818,228 3538 Students at Risk of School Failure 4,638,484 3540 Early Childhood Program (4K Programs Serving Four-Year-Old Children) 1,693,449 3550 Teacher Salary Increase (No Carryover Provision) 9,669,058 3555 School Employer Contributions (No Carryover Provision) 1,565,862 3556 Adult Education 434,938 3557 Summer Reading Program 50,038 3558 Reading 116,768 3571 Palmetto Priority Technical Assistance 1,040,240 3577 Teacher Supplies (No Carryover Provision) 977,350 3578 High Schools That Work/Making Middle Grades Work 1,558,206 3592 Work-Based Learning 723 3594 EEDA Supplemental Programs 149,501 3595 EEDA Supplies and Materials 121,911 3597 Aid to Districts 849,607 3599 Other EIA 282,533
Total Revenue All Sources 30,808,525
EXPENDITURES100 Instruction:
110 General Instruction:111 Kindergarten Programs:
100 Salaries 140,313 200 Employee Benefits 39,257 400 Supplies and Materials 12,277
112 Primary Programs:100 Salaries 379,650 200 Employee Benefits 108,945 300 Purchased Services 5,458 400 Supplies and Materials 525,414

CHARLESTON COUNTY SCHOOL DISTRICT COMBINING SCHEDULE OF REVENUES, EXPENDITURES, AND CHANGES IN FUND BALANCE – ALL PROGRAMS (CONTINUED) SPECIAL REVENUE FUND – EDUCATION IMPROVEMENT ACT
YEAR ENDED JUNE 30, 2018
(111)
Actual
EXPENDITURES (CONTINUED)113 Elementary Programs:
100 Salaries 869,193$ 200 Employee Benefits 296,959 300 Purchased Services 352,981 400 Supplies and Materials 670,504 600 Other Objects 396
114 High School Programs:100 Salaries 683,864 200 Employee Benefits 206,133 300 Purchased Services 28,532 400 Supplies and Materials 531,149 600 Other Objects 800
115 Vocation Programs:100 Salaries 42,187 200 Employee Benefits 11,774 300 Purchased Services 32,252 400 Supplies and Materials 728,158 500 Capital Outlay 172,577 600 Other Objects 13,000
118 Montessori Programs100 Salaries 15,000 200 Employee Benefits 4,200
120 Exceptional Programs:121 Educable Mentally Handicapped:
400 Supplies and Materials 15,875 122 Trainable Mentally Handicapped:
100 Salaries 4,079 200 Employee Benefits 1,144
125 Hearing Handicapped:100 Salaries 15,069 200 Employee Benefits 4,210
126 Speech Handicapped:100 Salaries 35,000 200 Employee Benefits 9,757 300 Purchased Services 44 400 Supplies and Materials 550
127 Learning Disabilities:100 Salaries 150,936 200 Employee Benefits 49,023 300 Purchased Services 2,371 400 Supplies and Materials 199,267
128 Emotionally Handicapped:100 Salaries 8,690 200 Employee Benefits 2,267 400 Supplies and Materials 6,482

CHARLESTON COUNTY SCHOOL DISTRICT COMBINING SCHEDULE OF REVENUES, EXPENDITURES, AND CHANGES IN FUND BALANCE – ALL PROGRAMS (CONTINUED) SPECIAL REVENUE FUND – EDUCATION IMPROVEMENT ACT
YEAR ENDED JUNE 30, 2018
(112)
ActualEXPENDITURES (CONTINUED)
130 Pre-School Programs:132 Preschool Handicapped Itinerant (5-Yr. Olds):
100 Salaries 8,671$ 200 Employee Benefits 2,428
139 Early Childhood Programs:100 Salaries 2,108,066 200 Employee Benefits 859,062
140 Special Programs:141 Gifted and Talented Academic:
100 Salaries 55,750 200 Employee Benefits 15,555
160 Other Exceptional Programs:162 Limited English Proficiency:
100 Salaries 13,000 200 Employee Benefits 3,642
170 Summer School Programs:171 Primary Summer School:
300 Purchased Services 50,038 172 Elementary Summer School:
100 Salaries 25,273 200 Employee Benefits 6,394
173 High School Summer School:100 Salaries 55,344 200 Employee Benefits 15,228 300 Purchased Services 5,988 400 Supplies and Materials 23,790
175 Instructional Programs Beyond Regular School Day:100 Salaries 109,460 200 Employee Benefits 29,418 600 Other Objects 200
180 Adult/Continuing Educational Programs: 181 Adult Basic Education Programs:
100 Salaries 87,043 200 Employee Benefits 29,213 400 Supplies and Materials 1,000
182 Adult Secondary Education Programs:100 Salaries 22,485 200 Employee Benefits 6,309 300 Purchased Services 2,000 400 Supplies and Materials 1,000
188 Parenting/Family Literacy:100 Salaries 3,291 200 Employee Benefits 1,255
190 Instructional Pupil Activity:100 Salaries 9,388 200 Employee Benefits 2,634
Total Instruction 9,928,662

CHARLESTON COUNTY SCHOOL DISTRICT COMBINING SCHEDULE OF REVENUES, EXPENDITURES, AND CHANGES IN FUND BALANCE – ALL PROGRAMS (CONTINUED) SPECIAL REVENUE FUND – EDUCATION IMPROVEMENT ACT
YEAR ENDED JUNE 30, 2018
(113)
Actual
EXPENDITURES (CONTINUED)200 Support Services:
210 Pupil Services:212 Guidance Services:
100 Salaries 166,450$ 200 Employee Benefits 58,115 300 Purchased Services 69,108 400 Supplies and Materials 54,774 600 Other Objects 438
215 Exceptional Program Services:300 Purchased Services 1,803 400 Supplies and Materials 106,820
220 Instructional Staff Services:221 Improvement of Instruction-Curriculum Development:
100 Salaries 3,296,379 140 Terminal Leave 31,963 200 Employee Benefits 1,258,103 300 Purchased Services 371,756 400 Supplies and Materials 645,391 600 Other Objects 3,880
222 Library and Media:100 Salaries 34,989 200 Employee Benefits 9,683 400 Supplies and Materials 1,383
223 Supervision of Special Programs:100 Salaries 223,606 200 Employee Benefits 99,338 300 Purchased Services 243,000 400 Supplies and Materials 1,000
224 Improvement of Instruction - Inservice and Staff Training:100 Salaries 155,416 200 Employee Benefits 43,632 300 Purchased Services 1,045,563 400 Supplies and Materials 55,979 600 Other Objects 54
230 General Administration Services:233 School Administration:
100 Salaries 103,930 200 Employee Benefits 39,974

CHARLESTON COUNTY SCHOOL DISTRICT COMBINING SCHEDULE OF REVENUES, EXPENDITURES, AND CHANGES IN FUND BALANCE – ALL PROGRAMS (CONTINUED) SPECIAL REVENUE FUND – EDUCATION IMPROVEMENT ACT
YEAR ENDED JUNE 30, 2018
(114)
Actual
EXPENDITURES (CONTINUED)266 Technology and Data Processing Services:
300 Purchased Services 218,669$ 400 Supplies and Materials 128,065
270 Support Services - Pupil Activity:271 Pupil Services Activities:
300 Purchased Services 71,937 Total Support Services 8,541,198
410 Intergovernmental Expenditures:416 Payments to Public Charter Schools:
720 Transits 2,117,578
Total Expenditures 20,587,438
OTHER FINANCING SOURCES (USES)Interfund Transfers, from (to) Other Funds:
420-710 Transfer to General Fund (Exclude Indirect Costs) (10,124,778) 421-710 Transfer to Special Revenue Fund (96,309)
Total Other Financing Uses (10,221,087)
EXCESS OF REVENUES AND EXPENDITURES -
Fund Balance - Beginning of Year -
FUND BALANCE - END OF YEAR -$

CHARLESTON COUNTY SCHOOL DISTRICT SUMMARY SCHEDULE BY PROGRAM
SPECIAL REVENUE FUND – EDUCATION IMPROVEMENT ACT YEAR ENDED JUNE 30, 2018
(115)
EIA Interfund Other Fund EIA Fund
Transfers Transfers UnearnedProgram Revenues Expenditures In (Out) In (Out) Revenue
3500 Education Improvement Act:3502 Assisting, Developing, and Evaluating
Professional Teaching (ADEPT) 61,804$ 61,804$ -$ -$ 10,298$ 3507 Aid to Districts – Technology 137,622 137,622 - - 476,437 3509 Arts in Education 18,813 18,813 - - - 3511 Professional Development 404,723 404,723 - - 290,237 3512 Technology Professional Development 96,310 1 - (96,309) - 3518 Adoption List of Formative Assessment 27,183 27,183 - - 222,153 3519 Grade 10 Assessments 190,236 190,236 - - - 3525 Career and Technology Education Equipment 86,398 86,398 - - - 3526 Refurbishment of K-8 Science Kits 135,971 135,971 - - 10,048 3528 Industry Certifications/Credentials 69,089 69,089 - - 82,342 3529 Career and Technology Education 906,036 906,036 - - 144,838 3532 National Board Certification (NBC)
Salary Supplement (No Carryover Provision) 2,706,367 2,706,367 - - - 3533 Teacher of the Year Awards (No
Carryover Provision) 1,077 1,077 - - - 3535 Reading Coaches 2,818,228 2,818,228 - - 20,833 3538 Students at Risk of School Failure 4,638,484 4,638,484 - - 221,049 3540 Early Childhood Program (4K Programs
Serving Four-Year-Old Children) 1,693,449 1,693,449 - - - 3550 Teacher Salary Increase (No Carryover Provision) 9,669,058 876,129 - (8,792,929) - 3555 School Employer Contributions (No
Carryover Provision) 1,565,862 234,013 - (1,331,849) - 3556 Adult Education 434,938 434,938 - - - 3557 Summer Reading Program 50,038 50,038 - - 392,323 3558 Reading 116,768 116,768 - - 206,461 3571 Palmetto Priority Technical Assistance 1,040,240 1,040,240 - - 463,425 3577 Teacher Supplies (No Carryover Provision) 977,350 977,350 - - - 3578 High Schools That Work/Making
Middle Grades Work 20,298 20,298 - - - 3587 IDEA MOE Settlement 1,537,908 1,537,908 - - - 3592 Work-Based Learning 723 723 - - - 3594 EEDA Supplemental Programs 149,501 149,501 - - - 3595 EEDA Supplies and Materials 121,911 121,911 - - 88,043 3597 Aid to Districts 849,607 849,607 - - 332,084 3599 Other EIA 282,533 282,533 - - 137,745
Total 30,808,525$ 20,587,438$ -$ (10,221,087)$ 3,098,316$

CHARLESTON COUNTY SCHOOL DISTRICT DETAILED SCHEDULE OF DUE TO STATE DEPARTMENT
OF EDUCATION/FEDERAL GOVERNMENT YEAR ENDED JUNE 30, 2018
(116)
Amount Due
to StateDepartmentof Education
Project/Grant Revenue and or Federal Status of AmountProgram Number Subfund Code Description Government Due to Grantors
Medicaid NA 803/4230 Medicaid Match 17,839$ Cornerstone Medicaid Nurses NA 881/4230 Medicaid Match 14,660 Teacher Supplies NA 377/3577 Unexpended Funds 37,950 High Schools That Work/Making Middle Grades Work NA 378/3578 Unexpended Funds 37,053
Total 107,502$

CHARLESTON COUNTY SCHOOL DISTRICT SCHEDULE OF REVENUES, EXPENDITURES, AND CHANGES IN FUND BALANCE
FOOD SERVICE FUND YEAR ENDED JUNE 30, 2018
(117)
Actual
REVENUES1000 Revenue from Local Sources:
1500 Earnings on Investments:1510 Interest on Investments 92,600$
1600 Food Service:1610 Lunch Sales to Pupils 2,431,132 1620 Breakfast Sales to Pupils 120,870 1630 Special Sales to Pupils 1,683,332 1640 Lunch Sales to Adults 187,297 1650 Breakfast Sales to Adults 10,687 1660 Special Sales to Adults 103,176
1900 Other Revenue from Local Sources: 1992 Canteen Operations 173,326 1999 Revenue from Other Local Sources 241,366
Total Revenue from Local Sources 5,043,786
3000 Revenue from State Sources: 3100 Restricted State Funding:
3140 School Lunch:3142 Program Aid 1,908
4000 Revenue from Federal Sources:4800 USDA Reimbursement:
4810 School Lunch and After School Snacks Program 13,405,372 4830 School Breakfast Program 5,446,304 4860 Fresh Fruit and Vegetable Program (FFVP) (Carryover Provision) 416,658
4900 Other Federal Sources:4991 USDA Commodities (Food Distribution Program) (Carryover Provision) 1,608,892 4999 Revenue from Other Federal Sources 1,481,501
Total Revenue from Federal Sources 22,358,727
Total Revenue All Sources 27,404,421

CHARLESTON COUNTY SCHOOL DISTRICT SCHEDULE OF REVENUES, EXPENDITURES, AND CHANGES IN FUND BALANCE (CONTINUED)
FOOD SERVICE FUND YEAR ENDED JUNE 30, 2018
(118)
Actual
EXPENDITURES200 Support Services:
256 Food Service:100 Salaries 8,381,889$ 200 Employee Benefits 3,652,284 300 Purchased Services (Exclude Gas, Oil, Electricity, Other Heating Fuels, and Direct Purchased Services) 2,194,246 400 Supplies and Materials (Include Gas, Oil, Electricity and Other Heating Fuels) 12,770,304 500 Capital Outlay 150,972 600 Other Objects 26,295
Total Food Services Expenditures 27,175,990
Total Expenditures 27,175,990
OTHER FINANCING SOURCES (USES)Interfund Transfers, from (to) Other Funds:
5210 Transfer from General Fund (Excludes Indirect Costs) 825,000 432-791 Food Service Fund Indirect Costs (1,447,876)
Total Other Financing Uses (622,876)
DEFICIENCY OF REVENUES AND EXPENDITURES (394,445)
Fund Balance - Beginning of Year 8,788,060
FUND BALANCE - END OF YEAR 8,393,615$

CHARLESTON COUNTY SCHOOL DISTRICT SCHEDULE OF REVENUES, EXPENDITURES, AND CHANGES IN FUND BALANCE
DEBT SERVICE FUND YEAR ENDED JUNE 30, 2018
(119)
Actual
REVENUES1000 Revenue from Local Sources:
1100 Taxes:1110 Ad Valorem Taxes-Including Delinquent (Fiscally Independent LEA)(Independent) 90,873,588$ 1140 Penalties and Interest on Taxes 2,805,747
1200 Revenue from Local Government Units Other than LEAs:1280 Revenue In Lieu of Taxes (Independent and Dependent) 2,032,422
1500 Earnings on Investments:1530 Gain or Loss on Sale of Investments (69,976)
Total Revenue from Local Sources 95,641,781
3000 Revenue from State Sources:3800 State Revenue in Lieu of Taxes:
3820 Homestead Exemption 1,224,305 3830 Merchant's Inventory Tax 445,953 3840 Manufacturers Depreciation Reimbursement 198,956 3890 Other State Property Tax Revenues (Includes Motor Carrier Vehicle Tax) 43,108
Total Revenue from State Sources 1,912,322
4000 Revenue from Federal Sources:4900 Other Federal Sources:
4999 Revenue from Other Federal Sources 649,468 Total Revenue from Federal Sources 649,468
Total Revenue All Sources 98,203,571
EXPENDITURES500 Debt Service:
315 Management Services 73,786 319 Legal Services 43,676 610 Redemption of Principal 12,020,000 620 Interest 7,333,403
Total Debt Service 19,470,865
Total Expenditures 19,470,865
OTHER FINANCING SOURCES (USES) Interfund Transfers, from (to) Other Funds:
423-710 Transfer to Debt Service Fund - CEEF (61,663,072) 424-710 Transfer to Capital Projects Fund - District (42,793,480)
Total Other Financing Uses (104,456,552)
DEFICIENCY OF REVENUES AND EXPENDITURES (25,723,846)
Fund Balance - Beginning of Year (22,807,246)
FUND BALANCE - END OF YEAR (48,531,092)$

CHARLESTON COUNTY SCHOOL DISTRICT SCHEDULE OF REVENUES, EXPENDITURES, AND CHANGES IN FUND BALANCE
DEBT SERVICE FUND – CEEF YEAR ENDED JUNE 30, 2018
(120)
Actual
REVENUES
Total Revenue All Sources -$
EXPENDITURES500 Debt Service:
610 Redemption of Principal 20,400,000 620 Interest 22,393,480
Total Debt Service 42,793,480
OTHER FINANCING SOURCES (USES)Interfund Transfers, from (to) Other Funds:
5240 Transfer from Debt Service Fund - District 42,793,480
EXCESS OF REVENUES AND EXPENDITURES -
Fund Balance - Beginning of Year 412,198
FUND BALANCE - END OF YEAR 412,198$

CHARLESTON COUNTY SCHOOL DISTRICT SCHEDULE OF REVENUES, EXPENDITURES, AND CHANGES IN FUND BALANCE
CAPITAL PROJECTS – DISTRICT YEAR ENDED JUNE 30, 2018
(121)
Actual
REVENUES1000 Revenue from Local Sources:
1100 Taxes:1190 Other Taxes (Independent) 105,567,815$
1500 Earnings on Investments:1510 Interest on Investments 2,175,898
1900 Miscellaneous Local Revenue:1999 Revenue from Other Local Sources 31,000
Total Revenue from Local Sources 107,774,713
2000 Intergovernmental Revenue:2200 Payments from Public Charter Schools 45,707
Total Revenue All Sources 107,820,420
EXPENDITURES250 Finance and Operations:
253 Facilities Acquisition, and Construction:100 Salaries: 1,832,030
180 Head of Organizational Unit Salaries 123,827 200 Employee Benefits 631,416
280 Head of Organizational Unit Employee Benefits 31,341 300 Purchased Services 24,607,102
380 Head of Organizational Unit Travel 1,203 400 Supplies and Materials 26,990,281 500 Capital Outlay:
510 Land 11,925,044 520 Construction Services 38,844,690 530 Improvements Other Than Buildings 831,267 540 Equipment 2,863,587 545 Technology, Equipment, and Software 3,174,462 550 Vehicles 478,313 580 Mobile Classrooms 2,223,950 590 Other Capital Outlay 14,654,542
600 Other Objects:640 Organization Membership Dues and Fees (Professional) 1,279
254 Operation and Maintenance of Plant:300 Purchased Services 350
Total Support Services 129,214,684
500 Debt Service:620 Interest (1,342,329)
Total Expenditures 127,872,355

CHARLESTON COUNTY SCHOOL DISTRICT SCHEDULE OF REVENUES, EXPENDITURES, AND CHANGES IN FUND BALANCE (CONTINUED)
CAPITAL PROJECTS – DISTRICT YEAR ENDED JUNE 30, 2018
(122)
Actual
OTHER FINANCING SOURCES (USES)5300 Sale of Fixed Assets 1,500$
Interfund Transfers, from (to) Other Funds:5240 Transfer from Debt Service Fund - District 61,663,072
Total Other Financing Sources 61,664,572
EXCESS OF REVENUES AND EXPENDITURES 41,612,637
Fund Balance - Beginning of Year 82,966,300
FUND BALANCE - END OF YEAR 124,578,937$

CHARLESTON COUNTY SCHOOL DISTRICT SCHEDULE OF RECEIPTS, DISBURSEMENTS, AND CHANGES
IN DUE TO STUDENT ORGANIZATIONS PUPIL ACTIVITY FUND
YEAR ENDED JUNE 30, 2018
(123)
Actual
REVENUES1000 Revenue from Local Sources:
1500 Earnings on Investments:1510 Interest on Investments 12,942$
1700 Pupil Activities:1710 Admissions 2,682,117 1720 Bookstore Sales 233,633 1730 Pupil Organization Membership Dues and Fees 80,649 1740 Student Fees 1,816,013 1790 Other 3,242,981
1900 Other Revenue from Local Sources:1999 Revenue from Other Local Sources 626,356
Total Receipts from Local Sources 8,694,691
DISBURSEMENTS190 Instructional Pupil Activity:
660 Pupil Activity 3,707,864
270 Support Services Pupil Activity:271 Pupil Service Activities:
100 Salaries (Optional) 389,427 200 Employee Benefits (Optional) 108,062 300 Purchased Services (Optional) 744,896 400 Supplies and Materials (Optional) 1,221,600 500 Capital Outlay 19,231 600 Other Objects 25,679 660 Pupil Activity (1,839,570)
272 Enterprise Activities:660 Pupil Activity 3,250,387
273 Trust and Agency Activities:660 Enterprise Activity 1,048,570
Total Pupil Activity Expenditures 8,676,146
EXCESS OF RECEIPTS AND DISBURSEMENTS 18,545
Due to Student Organizations - Beginning of Year 4,411,600
DUE TO STUDENT ORGANIZATIONS - END OF YEAR 4,430,145$

CHARLESTON COUNTY SCHOOL DISTRICT COMBINING SCHEDULE OF NET POSITION
DISCRETELY PRESENTED COMPONENT UNITS JUNE 30, 2018
(124)
Charleston Pattison's Carolina
James Island Charleston East Cooper Orange Grove Charter School Academy of Voyager Greg Mathis Prestige Meeting StreetCharter High Development Montessori Elementary for Math and Comprehensive Charter Charter High Prepatory Allegro Music Elementary at
School Academy, Inc. Charter School Charter School Science Education School School Academy School Brentwood TotalsASSETS
Cash and Cash Equivalents 2,613,937$ 526,109$ 999,524$ 4,776,104$ 1,006,775$ 180$ 2,360,215$ 32,841$ 24,591$ 500,785$ 588,530$ 13,429,591$ Investments 3,633,203 - 743,567 1,309,652 - - - - - - - 5,686,422 Accounts Receivable 59,870 10,161 812 - 3,820 - 6,738 - 2,848 - - 84,249 Due from Governmental Agencies 31,482 - 17,692 6,680 - 492 - 16,692 498 860 - 74,396 Due from Primary Government - - - - - - - - - - 56,772 56,772 Prepaid Expenses 41,058 22,090 24,512 510 66,876 1,000 - 10,747 9,616 33,616 74,969 284,994 Other Assets - 4,570 - - - - 53,221 - - - - 57,791 Capital Assets, Net of Accumulated Depreciation 2,372,522 472,138 15,040 1,927,093 332,010 - 140,327 1,884 - 325,949 4,268,799 9,855,762
Total Assets 8,752,072 1,035,068 1,801,147 8,020,039 1,409,481 1,672 2,560,501 62,164 37,553 861,210 4,989,070 29,529,977
DEFERRED OUTFLOWS OF RESOURCES
Deferred Pension Charges 3,626,937 - 948,118 2,123,983 1,141,553 - - - - - - 7,840,591 Deferred OPEB Charges 495,536 - 114,525 317,396 164,288 - - - - - - 1,091,745
Total Deferred Outflows of Resources 4,122,473 - 1,062,643 2,441,379 1,305,841 - - - - - - 8,932,336
LIABILITIESAccounts Payable and Accrued Liabilities 298,405 104,897 373,388 283,173 258,958 13,494 14,391 52,717 73,785 35,364 418,151 1,926,723 Unearned Revenue 16,424 17,076 6,175 - - - - 9,786 49,003 - - 98,464 Accrued Compensation and Related Benefits 31,657 - - - - - - 7,606 - - - 39,263 Due to Primary Government 2,073,166 - - - - 1,375 29,404 - - - 494,519 2,598,464 Long-Term Liabilities: - - -
Net Pension Liability 16,464,540 - 3,265,309 8,454,009 5,744,737 - - - - - - 33,928,595 Net OPEB Liability 12,905,099 - 2,860,263 7,660,553 4,450,022 - - - - - - 27,875,937 Due Within One Year 32,513 72,058 - - 34,505 20,000 - - 39,575 - - 198,651 Due in More than One Year - 153,825 - - 36,633 26,369 - 49,925 - - - 266,752
Total Liabilities 31,821,804 347,856 6,505,135 16,397,735 10,524,855 61,238 43,795 120,034 162,363 35,364 912,670 66,932,849
DEFERRED INFLOWS OF RESOURCES
Deferred Pension Credits 2,422,472 - 174,087 1,803,572 3,184 - - - - - - 4,403,315 Deferred OPEB Credits 1,220,095 - 270,420 724,256 420,722 - - - - - - 2,635,493
Total Deferred Inflows of Resources 3,642,567 - 444,507 2,527,828 423,906 - - - - - - 7,038,808
NET POSITIONNet Investment in Capital Assets 2,372,522 246,255 15,040 1,927,093 332,010 - 140,327 1,884 - 325,949 4,268,799 9,629,879 Restricted - - - - - - 1,450,000 - - - - 1,450,000 Unrestricted (24,962,348) 440,957 (4,100,892) (10,391,238) (8,565,449) (59,566) 926,379 (59,754) (124,810) 499,897 (192,399) (46,589,223)
Total Net Position (22,589,826)$ 687,212$ (4,085,852)$ (8,464,145)$ (8,233,439)$ (59,566)$ 2,516,706$ (57,870)$ (124,810)$ 825,846$ 4,076,400$ (35,509,344)$

CHARLESTON COUNTY SCHOOL DISTRICT COMBINING SCHEDULE OF ACTIVITIES
DISCRETELY PRESENTED COMPONENT UNITS YEAR ENDED JUNE 30, 2018
(125)
Charleston Pattison's Carolina
James Island Charleston East Cooper Orange Grove Charter School Academy of Voyager Greg Mathis Prestige Meeting StreetCharter High Development Montessori Elementary for Math and Comprehensive Charter Charter High Prepatory Allegro Music Elementary at
School Academy, Inc. Charter School Charter School Science Education School School Academy School Brentwood TotalsFUNCTIONS/PROGRAMS
Governmental Activities:Instruction :
Expenses (9,932,283)$ (1,046,440)$ (2,749,002)$ (6,934,482)$ (3,520,507)$ (726,649)$ (1,251,554)$ (587,828)$ (487,953)$ (968,231)$ (6,627,156)$ (34,832,085)$ Revenues Charges for Services - - - 610,212 97,634 - 26,769 - - - - 734,615 Operating Grants and Contributions 16,510,445 1,768,946 3,249,028 10,304,260 5,866,734 1,004,629 2,216,779 1,164,928 460,716 1,756,787 7,087,830 51,391,082
Support Services Expenses (6,156,937) (882,976) (3,511,225) (2,389,752) (2,751,833) (420,149) (645,649) (564,459) (503,579) (934,101) (3,975,925) (22,736,585) Revenues Operating Grants and Contributions - - - - - - - - 475,468 - - 475,468
Community Services Expenses - - (15,207) - - - - - - - (71,325) (86,532)
Interest Expense and Other Charges (2,260) (9,702) (3,670) - (6,392) (5,326) - - (2,311) - - (29,661) Total Governmental 418,965 (170,172) (3,030,076) 1,590,238 (314,364) (147,495) 346,345 12,641 (57,659) (145,545) (3,586,576) (5,083,698)
GENERAL REVENUESMiscellaneous Revenue 312,265 55,060 2,989,152 249,494 59,780 129,523 1,509,620 30,165 26,314 350,829 4,265,425 9,977,627 Investment Earnings - 3,466 - - 1,289 - 1,953 - 2,182 - - 8,890
Total General Revenues 312,265 58,526 2,989,152 249,494 61,069 129,523 1,511,573 30,165 28,496 350,829 4,265,425 9,986,517
CHANGE IN NET POSITION 731,230 (111,646) (40,924) 1,839,732 (253,295) (17,972) 1,857,918 42,806 (29,163) 205,284 678,849 4,902,819
Net Position - Beginning of Year - As Reported (9,927,929) 798,858 (1,076,498) (2,353,627) (3,361,837) (41,594) 658,788 (100,676) (95,647) 620,562 3,397,551 (11,482,049)
Restatement - See Note 17 (13,393,127) - (2,968,430) (7,950,250) (4,618,307) - - - - - - (28,930,114)
Net Position, Beginning of Year - As Restated (23,321,056) 798,858 (4,044,928) (10,303,877) (7,980,144) (41,594) 658,788 (100,676) (95,647) 620,562 3,397,551 (40,412,163)
NET POSITION - END OF YEAR (22,589,826)$ 687,212$ (4,085,852)$ (8,464,145)$ (8,233,439)$ (59,566)$ 2,516,706$ (57,870)$ (124,810)$ 825,846$ 4,076,400$ (35,509,344)$

CHARLESTON COUNTY SCHOOL DISTRICT LOCATION RECONCILIATION SCHEDULE
YEAR ENDED JUNE 30, 2018
(126)
Location Total
ID Location Description Education Level Cost Type Expenditures
0000 Debt Service Nonschool Central 61,349,582$ 0100 Board of Trustees Nonschool Central 334,376 0101 Superintendent's Office Nonschool Central 585,127 0102 Middle School Learning Collaborative Nonschool Central - 0103 Facilities and Asset Management Nonschool Central 699,035 0104 Chief Academic Office Nonschool Central 2,752,074 0105 Payroll Office Nonschool Central 642,592 0106 Accounting Office Nonschool Central 894,161 0107 Expanded Learning Nonschool Central 1,128,711 0108 Employee Relations Nonschool Central 460,607 0109 Bus Lots Nonschool Central 706,280 0111 Maintenance Department Nonschool Central 5,015,273 0112 School Food Services Nonschool Central 5,558,031 0113 Capital Improvement Nonschool Central 5,235,579 0115 Communications Nonschool Central 2,252,155 0116 Construction Procurement Nonschool Central 223,001 0117 Office of General Counsel Nonschool Central 596,288 0118 Gifted & Talented Office Nonschool Central 705,919 0119 Plant Operations Nonschool Central 522,117 0120 Federal Programs Office Nonschool Central 4,490,257 0121 Fine Arts Office Nonschool Central 221,817 0122 English As A Second Language Nonschool Central 222,884 0123 Adult Education Nonschool Central 1,406,424 0124 Office of Teacher Effectiveness Nonschool Central 1,592,631 0125 Curriculum and Instruction Nonschool Central 2,241,991 0126 Operational Planning Nonschool Central 1,054,262 0127 Various Schools Other Schools School 33,091,218 0128 Professional Development Nonschool Central 2,225,666 0130 Human Capital Dev Office Nonschool Central 234 0132 Community Outreach Nonschool Central 13,052 0133 Alternative Programs Nonschool Central 2,701,064 0134 Nurse Services Office Nonschool Central 1,284,796 0135 Career & Technology Education Nonschool Central 1,599,230 0136 Pupil Accounting Office Nonschool Central 207,081 0137 Business Intelligence Nonschool Central 1,148,684 0138 Copy Center Nonschool Central 2,635 0139 Archives & Records Office Nonschool Central 271,018 0140 Public Safety Office Nonschool Central 988,498 0141 Internal Audit Nonschool Central 693,771 0142 Social Studies Office Nonschool Central 114,757 0143 Science Office Nonschool Central 338,474 0144 Procurement Services Nonschool Central 643,179 0145 English/Language Arts Office Nonschool Central 96,728 0146 Math Office Nonschool Central 259,124 0147 Capital Projects Nonschool Central 305,800 0148 Foreign Language Nonschool Central 39,950 0149 Department of School Support Nonschool Central 162,790 0150 Child Development Office Nonschool Central 468,309 0151 Headstart/Ehs/Preschool Nonschool Central 2,968,509 0152 Technology & Information Systems Nonschool Central 2,007,137 0153 IT Network Operations Nonschool Central 5,299,001 0154 Student Transportation Nonschool Central 546,505 0155 Innovation & Learning Nonschool Central 7,688,781

CHARLESTON COUNTY SCHOOL DISTRICT LOCATION RECONCILIATION SCHEDULE (CONTINUED)
YEAR ENDED JUNE 30, 2018
(127)
Location Total
ID Location Description Education Level Cost Type Expenditures
0156 IT Customer Support Nonschool Central 2,462,231$ 0157 Human Resources Nonschool Central 4,702,281 0158 Budgeting Office Nonschool Central 891,884 0159 Bridge View Drive Nonschool Central 2,615,758 0160 HVAC Shop Nonschool Central 2,351,189 0161 Energy Services Nonschool Central 473,046 0162 Plumbing Shop Nonschool Central 2,141,209 0164 Carpentry Shop Nonschool Central 2,116,706 0165 Central Media Services Nonschool Central 583,801 0166 Risk Management Nonschool Central 228,282 0167 Guidance & Counseling Nonschool Central 1,374,567 0169 Special Education Department Nonschool Central 7,980,587 0170 Assessment & Evaluation Nonschool Central 1,413,560 0171 Contracts/Procurement Srvs Nonschool Central 215,159 0172 Electrical Shop Nonschool Central 1,476,907 0173 Chief Information Office Nonschool Central 310,768 0180 Chief Financial Office Nonschool Central 153,901 0181 Title I District Wide Nonschool Central 1,051,926 0182 Video Services Nonschool Central 3,082 0183 Jenkins Orphanage Nonschool Central 10,003 0193 General Services Nonschool Central 1,214,840 0194 Carolina Youth Development Nonschool Central 61,815 0195 Financial Services Nonschool Central 1,516,883 0196 Admin Building (75 Calhoun St.) Nonschool Central 580,042 0199 Buffer Nonschool Central 71,275 0200 Elementary Learning Comm Nonschool Central 822,826 0202 Mt Pleasant Academy Elementary School 5,191,396 0203 Mamie P Whitesides Elementary Elementary School 6,359,411 0204 Sullivan's Island Elementary Elementary School 468,895 0205 Belle Hall Elementary Elementary School 6,489,644 0207 Jennie Moore Elementary Elementary School 8,586,720 0208 Charles Pinckney Elementary Elementary School 6,357,316 0209 Laurel Hill Primary Other Schools School 6,265,395 0210 Gov James B Edwards Elementary Elementary School 7,376,647 0212 Old Whitesides Site Elementary School 25,770 0213 Carolina Park Elementary Elementary School 13,046,297 0239 Montessori Mt Pleasant Charter Other Schools School 3,413,402 0242 Laing Middle Middle School School 8,516,979 0245 Moultrie Middle Middle School School 7,351,884 0247 Cario Middle Middle School School 9,066,960 0252 Old Wando High School Site Nonschool Central 13,774 0253 New District 2 High School High School School 5,686,770 0257 Wando High School High School School 33,901,571 0258 Wando Community School Other Schools School 102,046 0268 Windwood Farms Program Nonschool Central 385,477 0300 Old District 3 Learn Comm Nonschool Central 13,043 0303 Riverland Terrace Shop Nonschool Central 8,715 0304 Harbor View Elementary Elementary School 5,047,146

CHARLESTON COUNTY SCHOOL DISTRICT LOCATION RECONCILIATION SCHEDULE (CONTINUED)
YEAR ENDED JUNE 30, 2018
(128)
Location Total
ID Location Description Education Level Cost Type Expenditures
0305 Stiles Point Elementary Elementary School 5,775,646 0309 Murray-Lasaine Elementary Elementary School 3,713,802 0310 James Island Elementary Elementary School 5,500,243 0342 James Island Middle Middle School School 417,956 0343 Fort Johnson Middle Middle School School 1,074,053 0344 Camp Road Middle School Middle School School 8,088,449 0350 James Island Charter High Other Schools School 17,163,377 0351 James Is Hi Community School Other Schools School 72,602 0359 Septima P Clark Academy High School School 1,939,603 0384 Student Intervention Services Nonschool Central 268,004 0400 District 4 Constituent Office Nonschool Central 62,381 0410 McNair Building Nonschool Central 202,411 0411 Child & Family Development Ctr Nonschool Central 1,038,391 0412 Chicora Elementary Elementary School 5,550,572 0413 E A Burns Elementary Elementary School 8,718,444 0414 Lambs Elementary Elementary School 4,527,346 0415 Ladson Elementary Elementary School 7,123,766 0416 Pinehurst Elementary Elementary School 9,399,946 0418 North Charleston Elementary Elementary School 6,722,627 0419 North Chas Creative Arts Elem Elementary School 5,086,244 0420 Malcolm C Hursey Elementary Elementary School 4,378,137 0421 W B Goodwin Elementary Elementary School 5,770,793 0422 Matilda F Dunston Elementary Elementary School 6,794,044 0424 Hunley Park Elementary Elementary School 4,750,711 0425 A C Corcoran Elementary Elementary School 6,252,568 0426 Midland Park Primary School Other Schools School 5,388,851 0428 Deer Park Middle Elementary School 5,641,497 0435 Mary Ford Elementary Elementary School 4,911,308 0436 Pepperhill Elementary Elementary School 5,305,366 0437 Prestige Charter Other Schools School 680,155 0439 Meeting Street @ Brentwood Middle School School 9,550,038 0441 Northwoods Middel School Middle School School 8,210,465 0442 Brentwood Middle High School School 5,828 0444 Morningside Middle Other Schools School 6,380,326 0445 Military Magnet Academy High School School 8,114,085 0446 Zucker Middle School High School School 5,507,635 0450 Charleston County School of the Arts High School School 10,634,180 0451 Garrett Academy of Technology High School School 7,531,050 0452 North Charleston High Other Schools School 8,852,006 0453 Garrett Community Ed Other Schools School 31,118 0454 RB Stall High Middle School School 14,439,123 0455 Stall Community Ed Nonschool Central 63 0458 Academic Magnet High School High School School 6,480,318 0460 Charlestowne Academy Other Schools School 18,834 0461 Greg Mathis Charter Other Schools School 1,033,952

CHARLESTON COUNTY SCHOOL DISTRICT LOCATION RECONCILIATION SCHEDULE (CONTINUED)
YEAR ENDED JUNE 30, 2018
(129)
Location Total
ID Location Description Education Level Cost Type Expenditures
0463 Daniel Jenkins Academy Middle School School 3,719,645 0464 Juvenile Detention Ctr Twin Ri Nonschool Central 282,336 0465 Summit Program Nonschool Central (196) 0466 Charleston Place Nonschool Central 5,638 0467 Department of Juvenile Justice Other Schools School 2,025 0468 Liberty Hill Academy Nonschool Central 3,493,140 0491 Hyde Avenue Nonschool Central 573 0504 St James-Santee Elementary Other Schools School 7,142,505 0541 Mcclellanville Middle Middle School School 75,765 0542 New Lincoln Middle Middle School School 32 0554 Lincoln High High School School 296,610 0600 District 10 Constituent Office Nonschool Central 19,576 0601 Plant Operations/Quality Assurance Nonschool Central 109,153 0603 St. Andrew's Elementary Elementary School 6,341,710 0605 Stono Park Elementary Elementary School 5,665,666 0606 Oakland Elementary Elementary School 5,531,897 0607 Orange Grove Charter Elmentary Elementary School 10,797,682 0608 Ashley River Elementary Elementary School 6,673,700 0611 Springfield Elementary Elementary School 5,948,116 0612 Montessori Community Schl Chas Other Schools School 2,593,753 0616 Drayton Hall Elementary Elementary School 7,139,304 0642 C E Williams Academic Magnet Middle School School 8,484,188 0646 West Ashley Middle Middle School School 175,665 0647 Advanced Studies West Ashley Middle School School 6,799,761 0648 St. Andrew's Middle Middle School School 1,141,791 0653 West Ashley High School High School School 16,603,718 0655 WA Head Start Nonschool Central 1,113,630 0661 Pattison's Academy Charter Other Schools School 1,091,706 0681 Materials Resource Center Nonschool Central 2,466 0700 High School Learning Community High School School 808,207 0701 Plant Operations Nonschool Central 1,348,839 0705 Charleston Progressive School Elementary School 3,918,013 0706 Memminger Elementary Elementary School 4,438,079 0707 James Simons Elementary Elementary School 4,294,108 0708 Archer Building Elementary School 50,006 0709 Buist Academy Elementary Elementary School 4,696,585 0710 W J Fraser Elementary Elementary School 95,846 0712 Julian Mitchell Elementary Elementary School 4,081,689 0714 Sanders-Clyde Elementary Elementary School 6,318,451 0739 Charleston Development Academy Other Schools School 1,770,844 0743 Low County Tech Nonschool Central 277,422 0744 Simmons-Pinckney Middle Middle School School 3,119,985 0749 Carolina Voyager Charter Alternative School School 2,218,355 0750 Florence Crittenton Nonschool Central 22,157 0752 Thomas Myers II Nonschool Central 122,360 0755 Burke High High School School 7,954,357 0756 Burke Community Ed Nonschool Central 21,381

CHARLESTON COUNTY SCHOOL DISTRICT LOCATION RECONCILIATION SCHEDULE (CONTINUED)
YEAR ENDED JUNE 30, 2018
(130)
Location Total
ID Location Description Education Level Cost Type Expenditures
0760 Early College High School High School School 1,138,720 0761 Chas Math & Science Charter Other Schools School 5,950,333 0762 Allegro Charter School Other Schools School 1,759,676 0777 Chs County Human Services Nonschool Central 125 0784 Child Find Nonschool Central 118,745 0800 Middle School Learning Community Nonschool Central 210,778 0808 C C Blaney Elementary Elementary School 593,906 0809 Jane Edwards Elementary Elementary School 1,907,388 0810 E B Ellington Elementary Elementary School 4,215,848 0811 Minnie Hughes Elementary Elementary School 3,755,960 0843 R D Schroder Middle Middle School School 163,170 0851 Baptist Hill High High School School 8,619,052 0902 Angel Oak Elementary Elementary School 10,203,249 0906 Mt Zion Elementary Elementary School 3,378,518 0907 Edith Frierson Elementary Elementary School 1,967,344 0944 Haut Gap Middle Middle School School 4,643,653 0951 St John's High High School School 5,301,684 0952 St Johns Comm Ed Other Schools School - 0999 School-Wide Accounts Nonschool Central -
Total Expenditures/Disbursements for All Funds 766,401,653$
457,114,914$ 62,703,425 20,587,438 27,175,990 19,470,865 42,793,480
127,872,355 7,040
8,676,146 766,401,653$
Debt Service - District Fund (Subfunds 401 and 418)
The above expenditures are reconciled to the School District's financial statements as follows:
General FundSpecial Revenue Fund (Subfunds 200s, 800s, 900s)Special Revenue EIA Fund (Subfunds 300s)Special Revenue Food Service Fund (Subfund 600)
Debt Service - CEEF Fund (Subfunds 415, 416, 417)Capital Projects - District Fund (Subfunds 500s) Medals and Awards Permanent Fund (Subfund 702 and 705)Agency Fund (Pupil Activity) (Subfunds 706 and 709)
Total Expenditures/Disbursements For All Funds