charles j. milligan, jd, mph deputy secretary for health care financing july 25, 2013 the...
TRANSCRIPT

Charles J. Milligan, JD, MPHDeputy Secretary for Health Care Financing
July 25, 2013
The Transformation of Insurance Coverage

Preview
1. Brief History of Insurance
2. Insurance Coverage Patterns in the Last Ten (or so) Years
3. Insurance Coverage Patterns in the Next Seven Years

1. Brief History of Insurance
-4-
Brief history
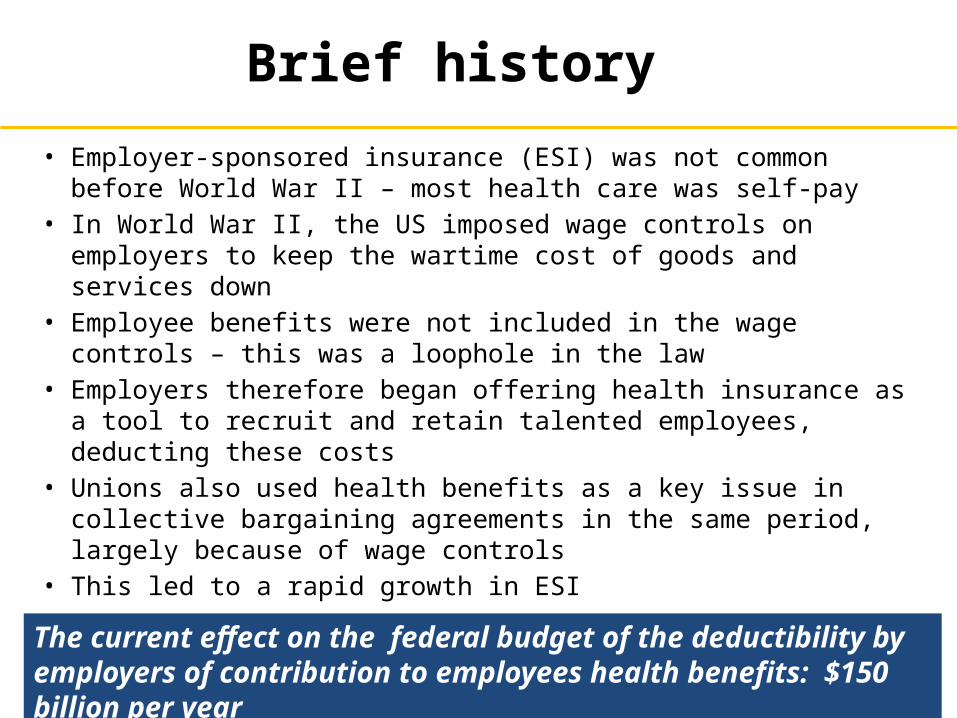
• Employer-sponsored insurance (ESI) was not common before World War II – most health care was self-pay
• In World War II, the US imposed wage controls on employers to keep the wartime cost of goods and services down
• Employee benefits were not included in the wage controls – this was a loophole in the law
• Employers therefore began offering health insurance as a tool to recruit and retain talented employees, deducting these costs
• Unions also used health benefits as a key issue in collective bargaining agreements in the same period, largely because of wage controls
• This led to a rapid growth in ESIThe current effect on the federal budget of the deductibility by employers of contribution to employees health benefits: $150 billion per year

-5-
Medicare and Medicaid
• Both were enacted in 1965, well after ESI was the prevailing insurance paradigm in the US
• Both were enacted to address gaps in coverage because some people didn’t have a connection to insurance through their employment
• Medicare was targeted at people who once had a connection to work but no longer did:– Retired– Below retirement age but became permanently disabled from work– The benefit package therefore was similar to ESI: an acute care and
rehabilitative model• Medicaid was targeted at the poor (non-workers), and
disabled who didn’t necessarily have a work history

-6-
Medicaid• Prior to the ACA, Medicaid generally was targeted at the
“blameless” poor, especially children.• Prior to the ACA, Medicaid covered:
– welfare households, primarily to insure the children and the parent-caregiver who has home with the children and not working.
– people with disabilities, many of whom never had a connection to the workforce.
– many pregnant women, to provide prenatal care and improve birth outcomes.
• Medicaid also wraps around Medicare for poor seniors who can’t afford Medicare’s premiums and cost sharing
Before the ACA, absent an 1115 waiver, Medicaid law did not permit coverage of poor adults (unless they had a permanent disability or lived in a welfare households). Under the paradigm of Medicaid pre-ACA, these people were “supposed” to be working, and covered by their employers.
-7-
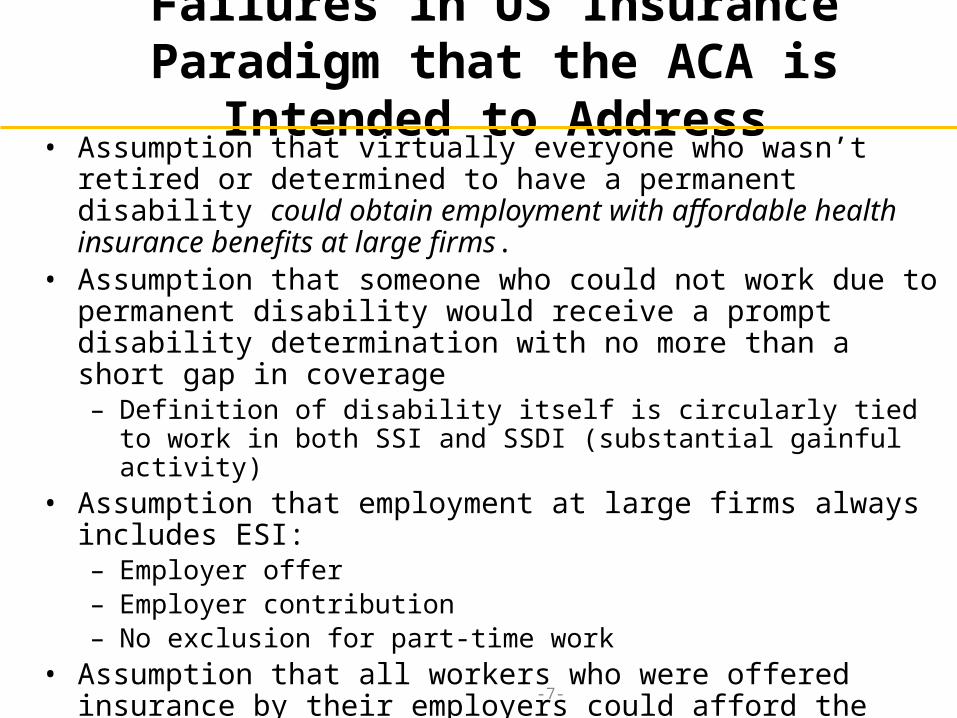
Failures in US Insurance Paradigm that the ACA is Intended to Address
• Assumption that virtually everyone who wasn’t retired or determined to have a permanent disability could obtain employment with affordable health insurance benefits at large firms.
• Assumption that someone who could not work due to permanent disability would receive a prompt disability determination with no more than a short gap in coverage– Definition of disability itself is circularly tied to work in both SSI and SSDI
(substantial gainful activity)• Assumption that employment at large firms always includes ESI:
– Employer offer– Employer contribution– No exclusion for part-time work
• Assumption that all workers who were offered insurance by their employers could afford the employee share of premiums.
• Assumption that people who are self-employed or at employers without an insurance could obtain insurance at reasonable rates in the private individual and small group markets.

2. Insurance Coverage Patterns in the Last Ten Years
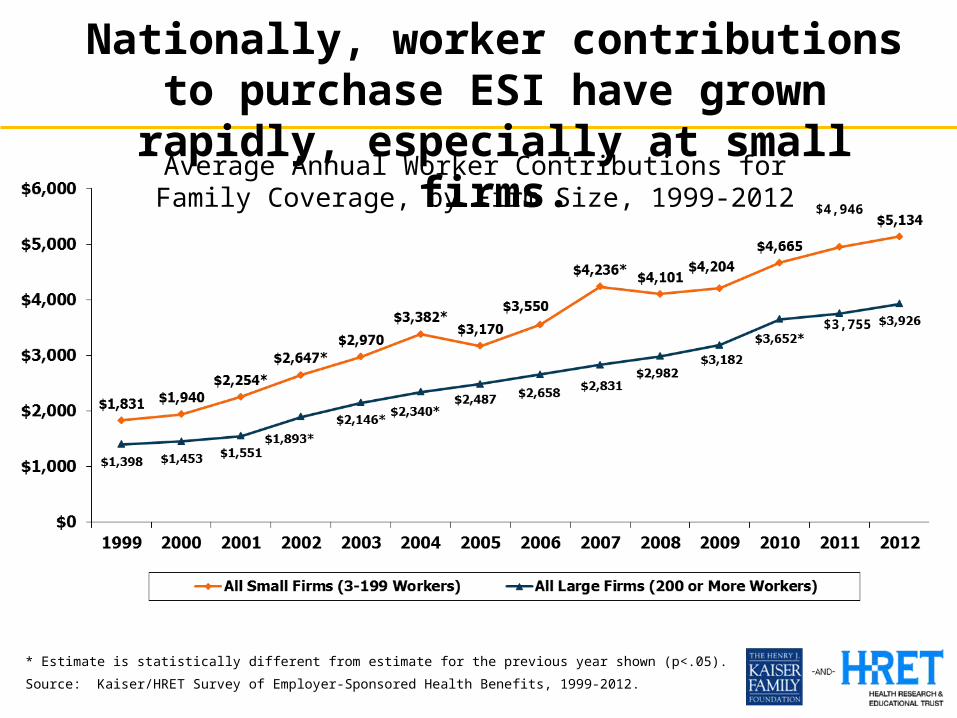
Average Annual Worker Contributions for Family
Coverage, by Firm Size, 1999-2012
* Estimate is statistically different from estimate for the previous year shown (p<.05).
Source: Kaiser/HRET Survey of Employer-Sponsored Health Benefits, 1999-2012.
$4,946
$3,755
Nationally, worker contributions to purchase ESI have grown rapidly, especially at small firms.

10
In Maryland, in the past decade, overall family premiums in ESI more than doubled, and the worker’s premium
contribution grew at an even faster rate.
1999/2000 2010/2011$0
$2,000
$4,000
$6,000
$8,000
$10,000
$12,000
$14,000
$16,000
$1,659$4,038
$5,310
$10,596
Employee Contribution Employer Contribution
$6,969
$14,634
210%
200%
243%
Source: State-Level Trends in Employer-Sponsored Health Insurance, A State-by-State Analysis. SHADAC. April 2013.
Average Annual Worker and Employer Contributions toPurchase Family Coverage in Maryland
11
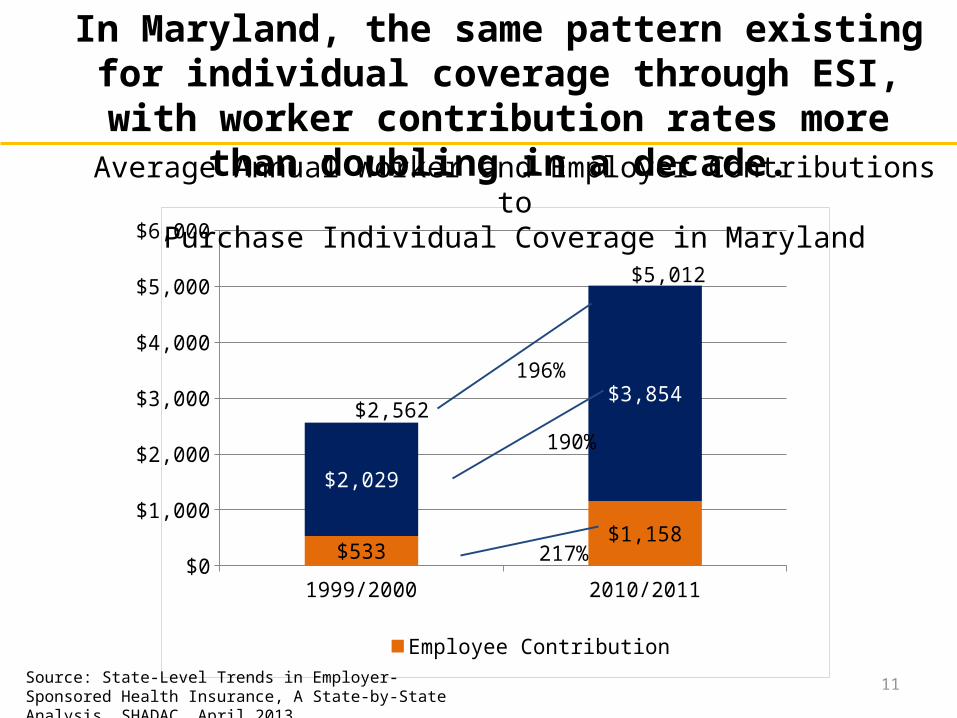
1999/2000 2010/2011$0
$1,000
$2,000
$3,000
$4,000
$5,000
$6,000
$533$1,158
$2,029
$3,854
Employee Contribution Employer Contribution
$2,562
190%
217%
196%
$5,012
Source: State-Level Trends in Employer-Sponsored Health Insurance, A State-by-State Analysis. SHADAC. April 2013.
In Maryland, the same pattern existing for individual coverage through ESI, with worker contribution rates
more than doubling in a decade.Average Annual Worker and Employer Contributions to
Purchase Individual Coverage in Maryland

12
1999/2000
2001/2002
2003/2004
2005/2006
2006/2007
2008/2009
2010/2011
0%
10%
20%
30%
40%
50%
60%
70%
80%
Dependent Policy Holder
727378727168
Percent of Nonelderly (Ages 0-64) with ESI in Maryland
Source: State-Level Trends in Employer-Sponsored Health Insurance, A State-by-State Analysis. SHADAC. April 2013.
In Maryland, the percent of nonelderly (under age 65) covered through ESI fell from 80% to 68% in the last decade.
80

13
1999/2000
2001/2002
2003/2004
2005/2006
2006/2007
2008/2009
2010/2011
0%10%20%30%40%50%60%70%80%90%
100%
Below 200% FPL200 to 399% FPL400 FPL
Source: State-Level Trends in Employer-Sponsored Health Insurance, A State-by-State Analysis. SHADAC. April 2013.
Percent of Nonelderly (Ages 0-64) with ESI in Maryland
This fall in coverage through ESI was sharpest among the nonelderly (under 65) in lower income cohorts.

14
Nationally, the same pattern existed: a significant drop in ESI coverage among the nonelderly, especially among the
lower income cohorts.
Below 200% FPL 200 to 399% FPL 400% and above FPL
All Incomes0%
10%
20%
30%
40%
50%
60%
70%
80%
90%
100%
39.3%
79.0%
90.7%
69.7%
29.2%
70.6%
88.0%
59.5%
1999/2000 2010/2011Source: State-Level Trends in Employer-Sponsored Health Insurance, A State-by-State Analysis. SHADAC. April 2013.
Nonelderly coverage through ESI

15
Compared to the nation, ESI coverage in Maryland among the nonelderly fell more sharply below 400% FPL, and less
sharply at 400% FPL and above.
Source: State-Level Trends in Employer-Sponsored Health Insurance, A State-by-State Analysis. SHADAC. April 2013.
US Maryland US Maryland US Maryland US Maryland
-20%
0%
20%
40%
60%
80%
100%
-10%
-16%
-8%-11%
-3% -1%-10%
-12%
1999/2000 2010/2011 Change
Below 200% FPL 200-399% FPL 400% and Above FPL All Incomes
Nonelderly coverage through ESI

16
Overall among the nonelderly, ESI coverage in Maryland fell more than the national average, but the rate of ESI
coverage remains above the national average.
Source: State-Level Trends in Employer-Sponsored Health Insurance, A State-by-State Analysis. SHADAC. April 2013.
US Maryland US Maryland US Maryland US Maryland0%
10%
20%
30%
40%
50%
60%
70%
80%
90%
34% 39%32% 36% 32% 35% 29% 33%
35%40%
34%38%
33%37%
31%35%
70%
80%
66%
73%
64% 72% 60% 68%
Policyholder Dependent Total 16
1990/2000 2003/2004 2006/2007 2010/2011
Source: State-Level Trends in Employer-Sponsored Health Insurance, A State-by-State Analysis. SHADAC. April 2013.

17
Change in Employer-Sponsored Insurance, 1999/2000 to 2010/2011 (population under age 65)
Source: State-Level Trends in Employer-Sponsored Health Insurance, A State-by-State Analysis. SHADAC. April 2013.
Among largest drops in country

Over roughly the same time period, national enrollment among children in Medicaid and
CHIP grew rapidly (1998-2007)
SOURCE: Kaiser Commission on Medicaid and the Uninsured and Urban Institute analysis of HCFA-2082, MSIS, and SEDS data, 2010.
Millions of Children

National enrollment in Medicaid also grew rapidly in the Recession, adding more than 7 million to
Medicaid between June 2007 and June 2010.
SOURCE: Analysis for KCMU by Health Management Associates, using compiled state Medicaid enrollment reports
42.3 42.7 43.6 44.846.9 48.7 50.3
J un-07 Dec-07 J un-08 Dec-08 J un-09 Dec-09 J un-10
Monthly Enrollment in Millions

The patterns held true in Maryland, where Maryland and CHIP enrollment more than doubled in the past decade.
Jan-99 Jan-00 Jan-01 Jan-02 Jan-03 Jan-04 Jan-05 Jan-06 Jan-07 Jan-08 Jan-09 Jan-10 Jan-11 Jan-12 Jan-130
200,000
400,000
600,000
800,000
1,000,000
1,200,000
513,441
1,066,478
Total Enrollment
Source: Decision Support System (DSS): May 2013. The Hilltop Institute.

21
2000 2009
Due to all these dynamics, the last decade saw a huge shift from ESI to Medicaid and CHIP among the nonelderly in Maryland
Any Public Payer: 5% Any Public Payer: 13%*Other Public includes Medicare and military-related coverage.
Source: Maryland Health Care Commission.
Other Private5%
Uninsured12%
Medicaid4%
Other Pub-lic*1%
Employer78%
Other Private5%
Uninsured15%
Medicaid11%
Other Public*
2%
Employer67%
22
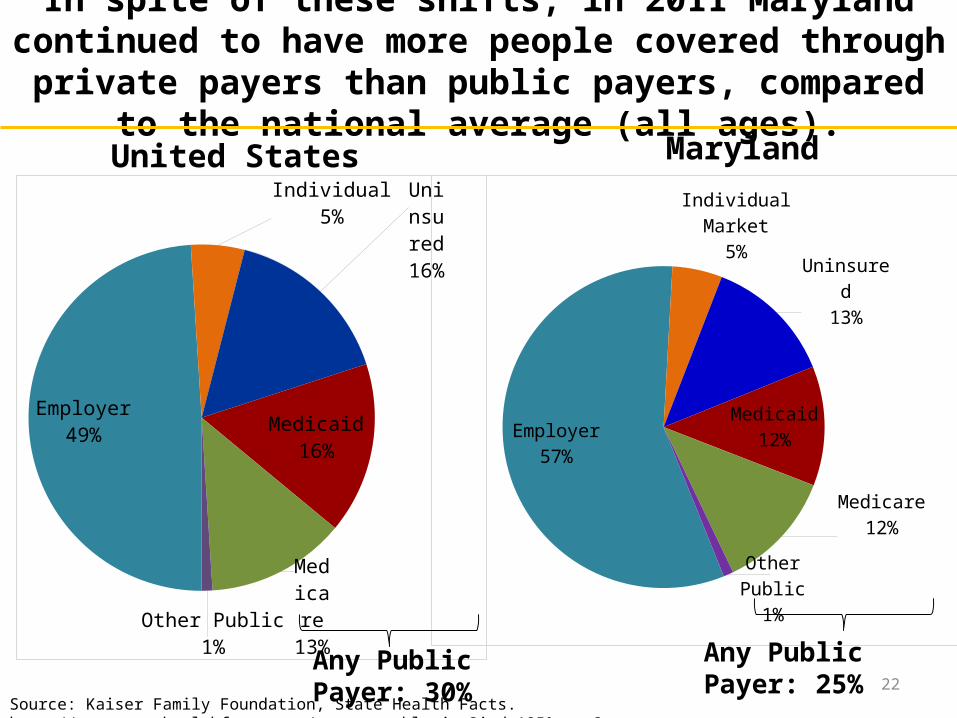
Employer57%
Individual Market5%
Uninsured13%
Medicaid12%
Medicare12%
Other Public
1%
In spite of these shifts, in 2011 Maryland continued to have more people covered through private payers than public payers,
compared to the national average (all ages).United States
Employer49%
Individual5%
Uninsured16%
Medicaid16%
Medicare13%
Other Public1%
Maryland
Source: Kaiser Family Foundation, State Health Facts. http://www.statehealthfacts.org/comparetable.jsp?ind=125&cat=3.
Any Public Payer: 25%Any Public Payer: 30%

The percent distribution of National Health Expenditures continues to dramatically shift to
public payers
Notes: Starting with the 2009 NHE data, CMS expanded their focus on spending by Type of Sponsor, which provides estimates of the individual, business, or tax source that is behind each Source of Funds category and is responsible for financing or sponsoring the payments. “Federal” and “State & Local” includes government contributions to private health insurance premiums and to the Medicare Hospital Insurance Trust Fund through payroll taxes, Medicaid program expenditures including buy-in premiums for Medicare, and other state & local government programs. “Private Business” includes employer contributions to private health insurance, the Medicare Hospital Insurance Trust Fund through payroll taxes, workers’ compensation insurance, temporary disability insurance, worksite health care. “Household” includes contributions to health insurance premiums for private health insurance, Medicare Part A or Part B, out-of-pocket costs. “Other Private Revenues” includes philanthropy, structure & equipment, non-patient revenues.
Source: Centers for Medicare and Medicaid Services, Office of the Actuary, National Health Statistics Group at https://www.cms.gov/NationalHealthExpendData/ (see Historical; NHE Web tables, Table 5).
Government Private1987 (Total = $519.1 billion)
Government Private
Government Private2000 (Total = $1,377.2
billion)
31.8%
68.2%
35.5%
64.5%
44.9%
55.1%
Federal Private Business State & Local Household Other Private Revenues
2010 (Total = $2,593.6 billion)
3. Insurance Coverage Patterns in the Next Seven Years

139% FPL+
<139% FPL
(Medicaid)
When the ACA passed in 2010, the uninsured almost equally split above and below the new Medicaid eligibility threshold of 138% FPL
Total Uninsured Adults Under Age 65 = 41.2 Million
Adults includes all individuals aged 19-64. The federal poverty level for a family of three in 2010 was $18,210. Percentages may not sum to 100 due to rounding. SOURCE: KCMU/Urban Institute analysis of March 2011 Current Population Survey, Annual Social and Economic Supplement.
48%, or 19.6 million people
52%, or 21.6 million people
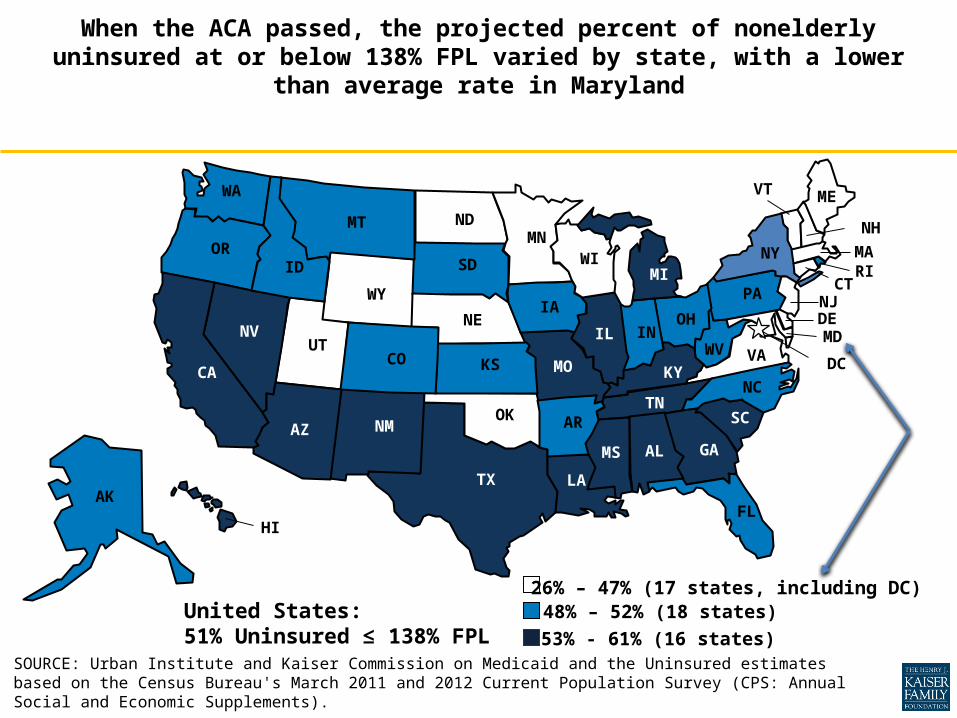
SOURCE: Urban Institute and Kaiser Commission on Medicaid and the Uninsured estimates based on the Census Bureau's March 2011 and 2012 Current Population Survey (CPS: Annual Social and Economic Supplements).
When the ACA passed, the projected percent of nonelderly uninsured at or below 138% FPL varied by state, with a lower
than average rate in Maryland
48% – 52% (18 states)26% – 47% (17 states, including DC)
53% - 61% (16 states)
WA
OR
WY
UT
TX
SD
OK
ND
NM
NV NE
MT
LA
KS
ID
HI
CO CA
ARAZ
AK
WI
WV VA
TN SC
OH
NCMO
MS
MN
MI
KY
IA
IN IL
GA
FL
AL
VT
PA
NY
NJ
NH
MA
ME
DC
CT
DE
RI
MD
United States: 51% Uninsured ≤ 138% FPL

27
Between now and 2020, Medicaid will grow with the expansion, Medicare will grow as boomers age into Medicare, and the Exchange enrollment will grow
Population Insurance Coverage Status 2014 2015 2016 2017 2018 2019 2020
Medicaid1,088,032 1,128,677 1,156,494 1,185,380 1,207,779 1,227,410 1,243,952
Medicare832,755 859,944 892,748 925,551 958,355 991,158 1,023,962
Other Public188,188 187,247 186,311 185,379 184,453 183,530 182,613
Commercial Insurance3,247,574 3,279,889 3,282,342 3,282,888 3,285,083 3,284,280 3,284,853
Maryland Exchange147,233 169,836 184,323 208,145 234,721 257,870 283,743
Uninsured599,003 514,388 488,539 472,749 439,614 415,441 390,352
Total Population 5,924,320 5,962,013 6,012,841 6,063,669 6,114,498 6,165,326 6,216,155
Source: Maryland Health Care Reform Simulation Model: July 2012. The Hilltop Institute.

28
2011 2014
Across all ages in Maryland, the shift toward public payers will continue in the first year of health reform.
Any Public Payer: 25% Any Public Payer: 35%
Individual Market; 5%
Uninsured, 13%
Medicaid; 12%
Medicare; 12%
Other Pub-lic; 1%
Employer; 57%
Exchange; 2% Unin-sured; 10%
Medicaid; 18%
Medicare; 14%
Other Public; 3%
Com-mercial Insur-ance
and Ex-change;
55%
Source: Maryland Health Care Reform Simulation Model: July 2012. The Hilltop Institute.

By 2020, across all ages, only 51% of the state’s population will be covered by ESI, with 38% covered by public payers -- 43% including individuals covered through the public MHBE.
Uninsured10%
Medicaid18%
Medicare14%
Other Public
3%
Commer-cial In-
surance and Ex-change
55%
Exchange2%
2014
29
Uninsured6%
Medicaid19%
Medicare16%
Other Public
3%
Com-mercial Insur-ance51%
Exchange4%
2020
Any Public Payer: 35% Any Public Payer: 38%Source: Maryland Health Care Reform Simulation Model: July 2012. The Hilltop Institute.
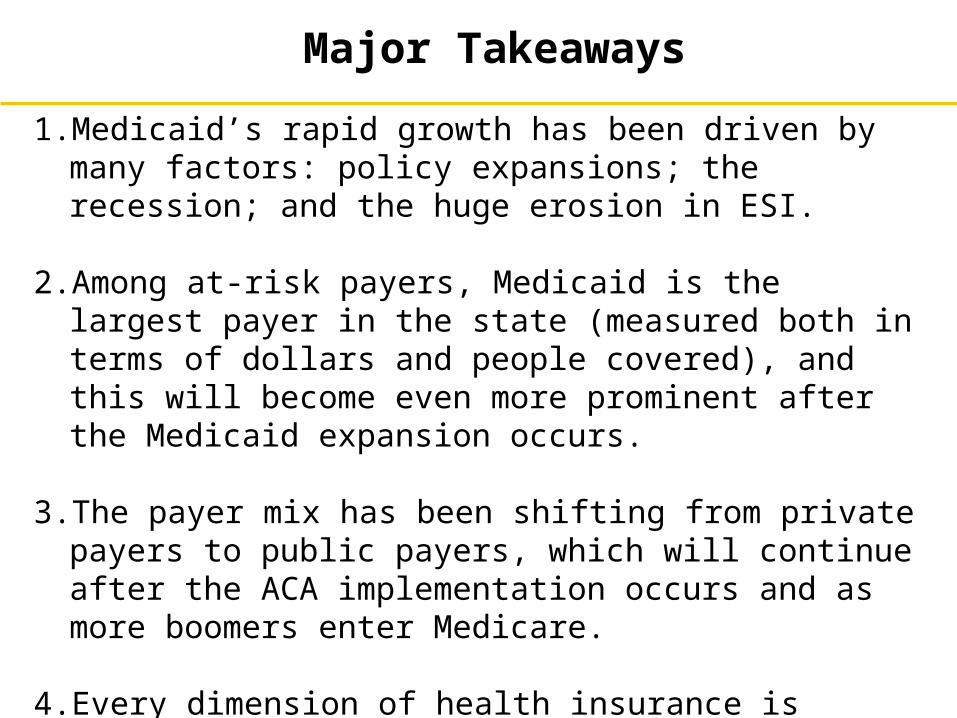
Major Takeaways
1. Medicaid’s rapid growth has been driven by many factors: policy expansions; the recession; and the huge erosion in ESI.
2. Among at-risk payers, Medicaid is the largest payer in the state (measured both in terms of dollars and people covered), and this will become even more prominent after the Medicaid expansion occurs.
3. The payer mix has been shifting from private payers to public payers, which will continue after the ACA implementation occurs and as more boomers enter Medicare.
4. Every dimension of health insurance is dependent on federal fiscal policy: spending in Medicaid, Medicare, and APTCs; exempting employer contributions from taxation in ESI.

Charles J. Milligan, JD, MPHDeputy Secretary, Health Care Financing